Embed Size (px)
DESCRIPTION
Effects of Crop Insurance and Government Payments on Annual Financial Risk. Bruce A. Babcock Center for Agricultural and Rural Development www.card.iastate.edu Pr esented March 8, 2005. Talk Outline. How are option premiums determined? Effects of hedges, puts, and insurance on risk - PowerPoint PPT Presentation
Citation preview

Effects of Crop Insurance and Government Payments on
Annual Financial Risk
Bruce A. BabcockCenter for Agricultural and Rural Development
www.card.iastate.edu
Presented March 8, 2005

Talk Outline
• How are option premiums determined?
• Effects of hedges, puts, and insurance on risk
• How do commodity programs affect risk?
• How much risk is left over to reward management?
• Discussion

Per-Bushel Cost of a Call Option on December Corn Futures (Futures price = 234.75)
0
5
10
15
20
25
220 230 240 250 260 270 280 290 300
cents/bu
ce
nts
/bu

Distribution of December Futures Prices as of March 7, 2005
0.00
0.01
0.02
0.03
0.04
0.05
0.06
0.07
0.08
0.09
0.10
cents/bu
pro
bab
ilit
y

$2.30 What is the probability of a particular price outcome?
What is the option payoff if that price occurs?
Multiply the probability by the payoff at that price.
What is the strike price?
5.2% chance that price is between $1.70 and $1.80
$0.55
.045 x .55 = $0.023
Repeat for all outcomes
Determining a Put Option Premium
0.00
0.02
0.04
0.06
0.08
0.10
0.12
cents/bu
pro
bab
ilit
y
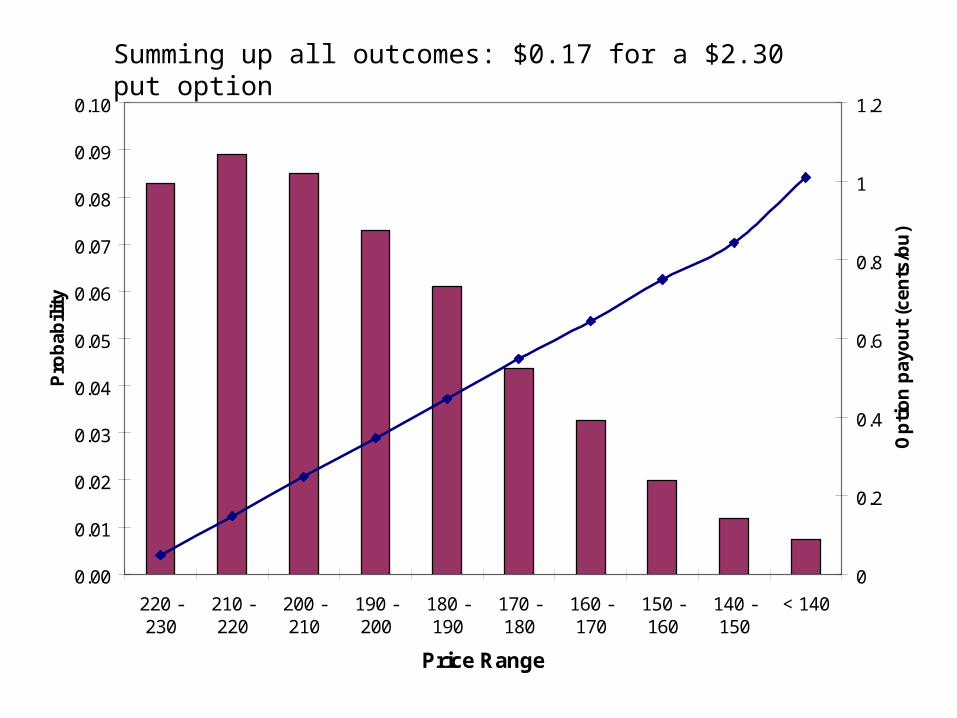
Summing up all outcomes: $0.17 for a $2.30 put option
0.00
0.01
0.02
0.03
0.04
0.05
0.06
0.07
0.08
0.09
0.10
220 -230
210 -220
200 -210
190 -200
180 -190
170 -180
160 -170
150 -160
140 -150
< 140
Price Range
Pro
ba
bil
ity
0
0.2
0.4
0.6
0.8
1
1.2
Op
tio
n p
ayo
ut
(cen
ts/b
u)
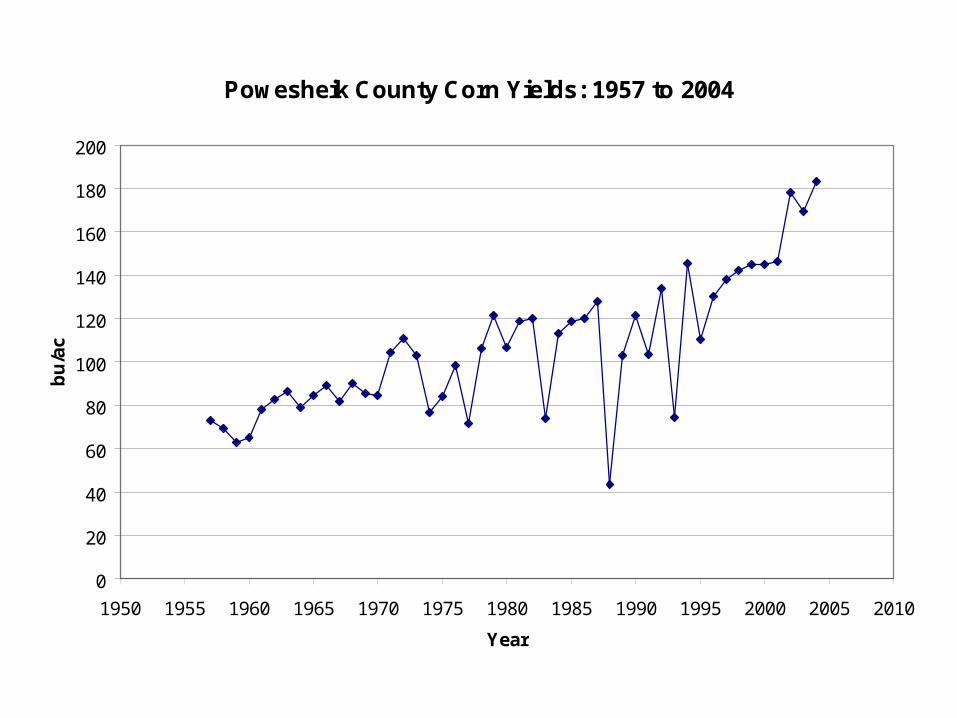
Powesheik County Corn Yields: 1957 to 2004
0
20
40
60
80
100
120
140
160
180
200
1950 1955 1960 1965 1970 1975 1980 1985 1990 1995 2000 2005 2010
Year
bu
/ac
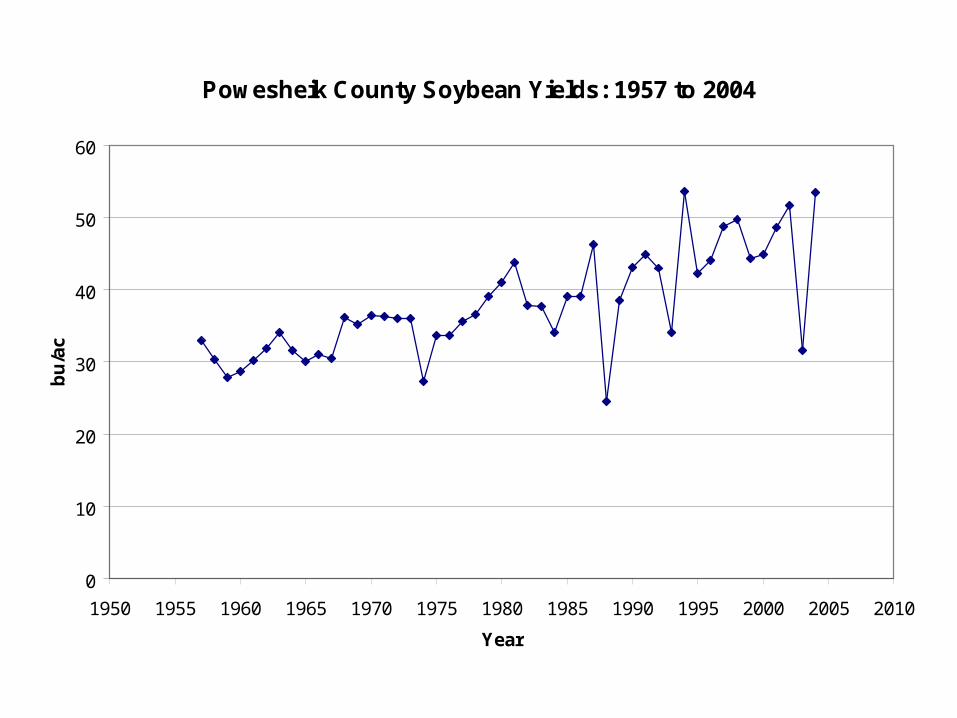
Powesheik County Soybean Yields: 1957 to 2004
0
10
20
30
40
50
60
1950 1955 1960 1965 1970 1975 1980 1985 1990 1995 2000 2005 2010
Year
bu
/ac

Distribution of Farm (not field) Yields for an Average Powesheik County Farmer
0
0.01
0.02
0.03
0.04
0.05
0.06
0.07
0.08
bu/ac
pro
bab
ilit
y
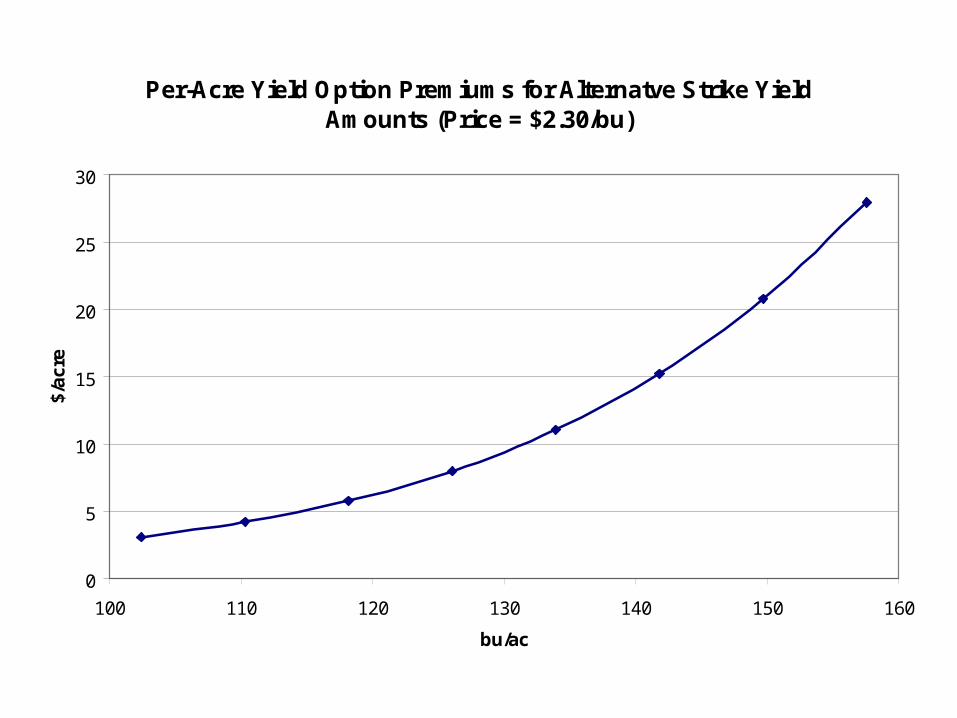
Per-Acre Yield Option Premiums for Alternatve Strike Yield Amounts (Price = $2.30/bu)
0
5
10
15
20
25
30
100 110 120 130 140 150 160
bu/ac
$/ac
re

Crop Insurance Premiums for Different Coverage Levels (Price = $2.30/bu)
0
5
10
15
20
25
30
60% 65% 70% 75% 80% 85% 90% 95% 100%
Coverage level
$/ac
re

Unsubsidized Crop Insurance Premiums for Different Coverage Levels (Price = $2.30/bu)
0
5
10
15
20
25
60% 65% 70% 75% 80% 85% 90%
Coverage level
$/ac
re
"Best" Estimate atEnterprise Unit
Basic Units
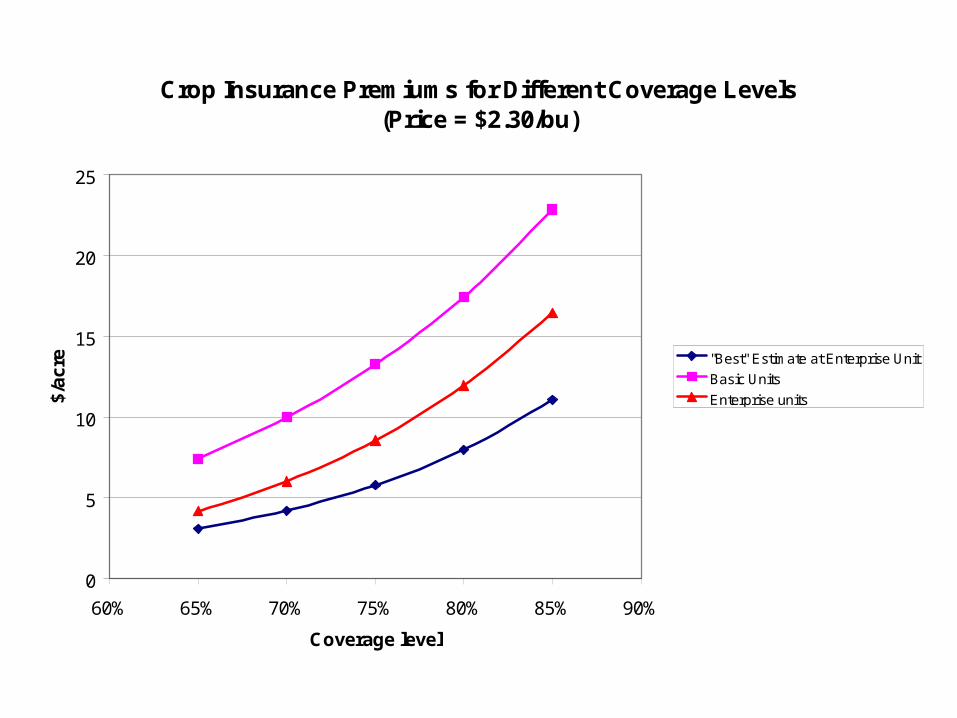
Crop Insurance Premiums for Different Coverage Levels (Price = $2.30/bu)
0
5
10
15
20
25
60% 65% 70% 75% 80% 85% 90%
Coverage level
$/ac
re "Best" Estimate at Enterprise Unit
Basic Units
Enterprise units

Crop Insurance Premiums for Different Coverage Levels (Price = $2.30/bu)
0
2
4
6
8
10
12
14
16
60% 65% 70% 75% 80% 85% 90%
Coverage level
$/ac
re "Best" Estimate at Enterprise Unit
Producer-Paid basic unit
Producer paid enterprise unit

Distribution of Corn Harvest Revenue Less $180 Variable Cost
0.00
0.02
0.04
0.06
0.08
0.10
0.12
$/acre
pro
ba
bil
ity
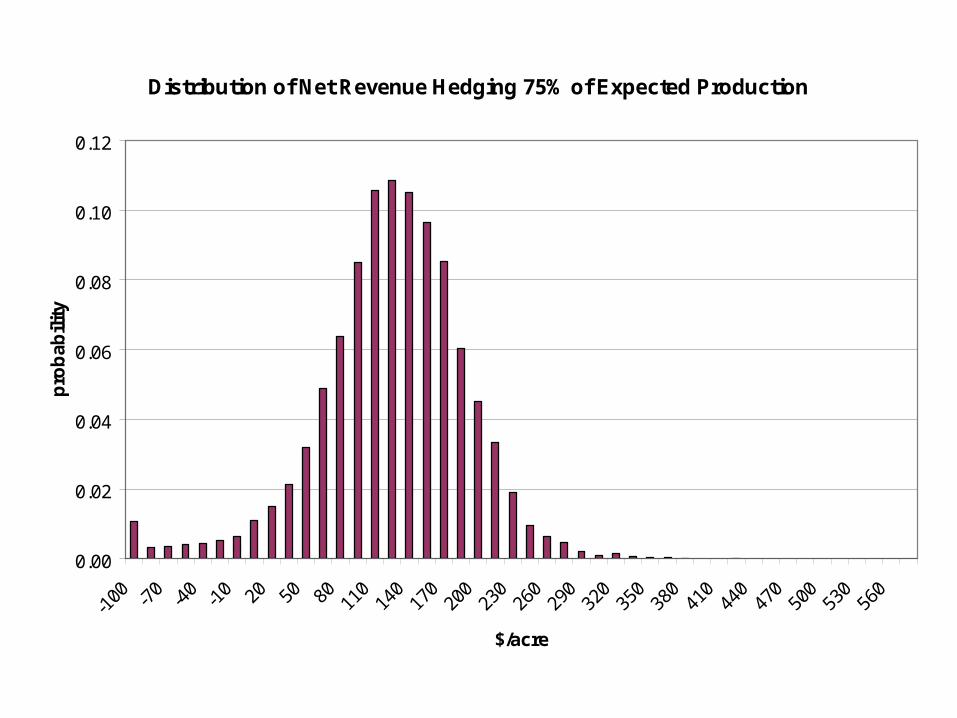
Distribution of Net Revenue Hedging 75% of Expected Production
0.00
0.02
0.04
0.06
0.08
0.10
0.12
$/acre
pro
bab
ilit
y
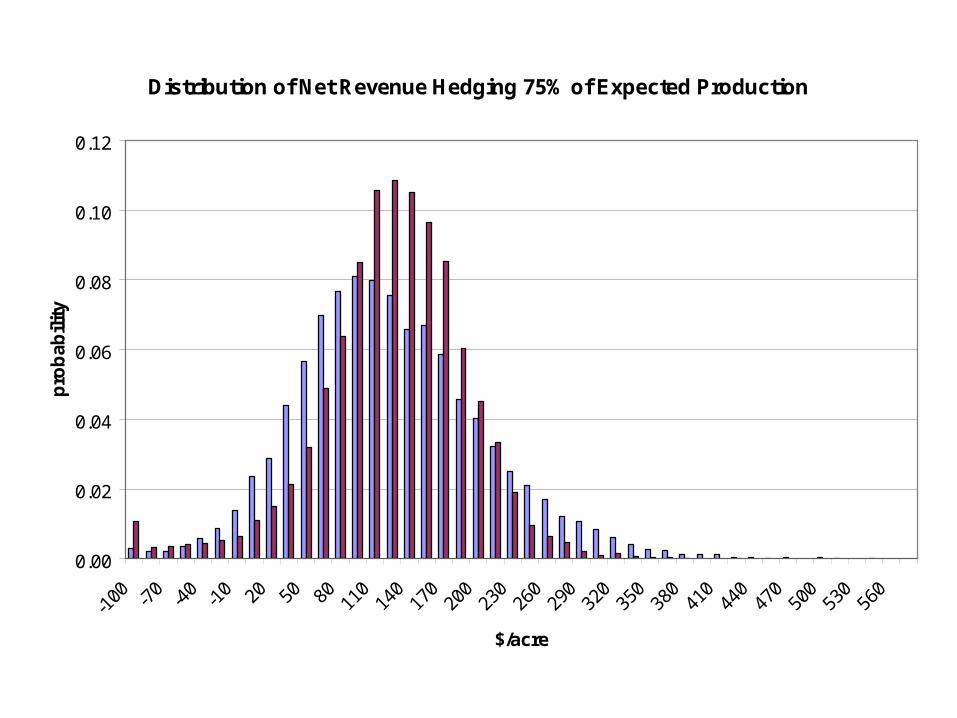
Distribution of Net Revenue Hedging 75% of Expected Production
0.00
0.02
0.04
0.06
0.08
0.10
0.12
$/acre
pro
bab
ilit
y

Distribution Hedging 75% of Expected Production with Put options
0.00
0.02
0.04
0.06
0.08
0.10
0.12
$/acre
pro
bab
ilit
y
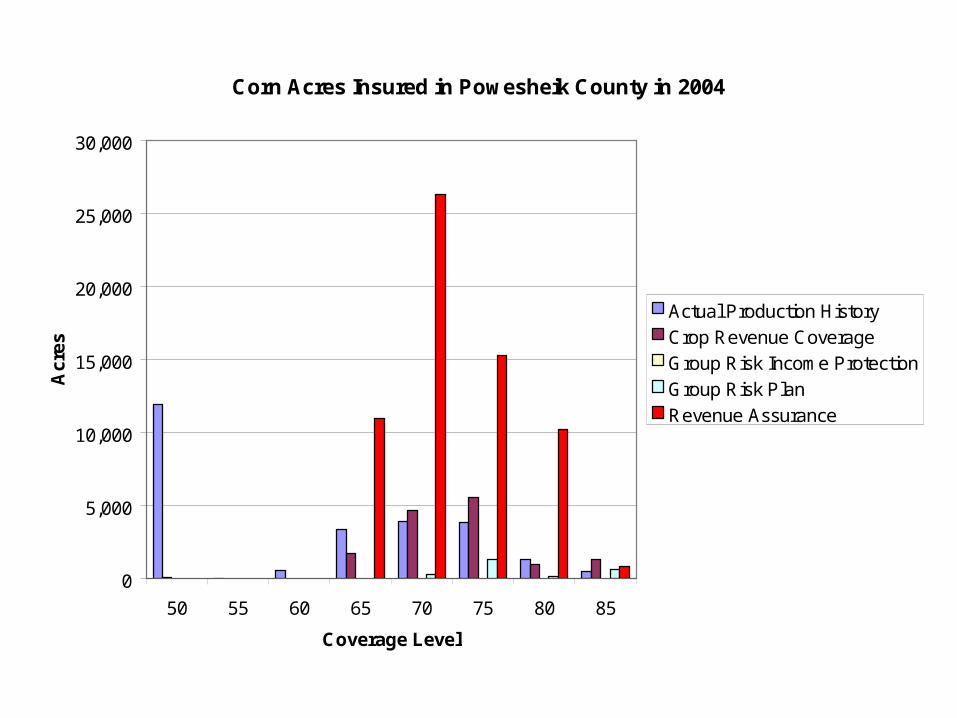
Corn Acres Insured in Powesheik County in 2004
0
5,000
10,000
15,000
20,000
25,000
30,000
50 55 60 65 70 75 80 85
Coverage Level
Acr
es
Actual Production History
Crop Revenue Coverage
Group Risk Income Protection
Group Risk Plan
Revenue Assurance
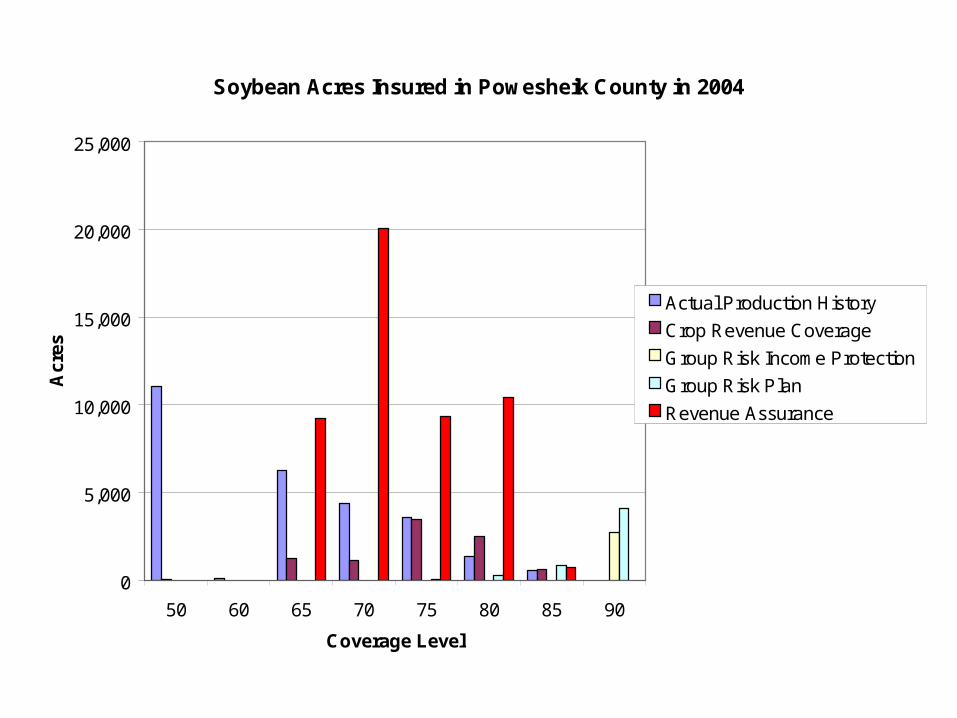
Soybean Acres Insured in Powesheik County in 2004
0
5,000
10,000
15,000
20,000
25,000
50 60 65 70 75 80 85 90
Coverage Level
Acr
es
Actual Production History
Crop Revenue Coverage
Group Risk Income Protection
Group Risk Plan
Revenue Assurance
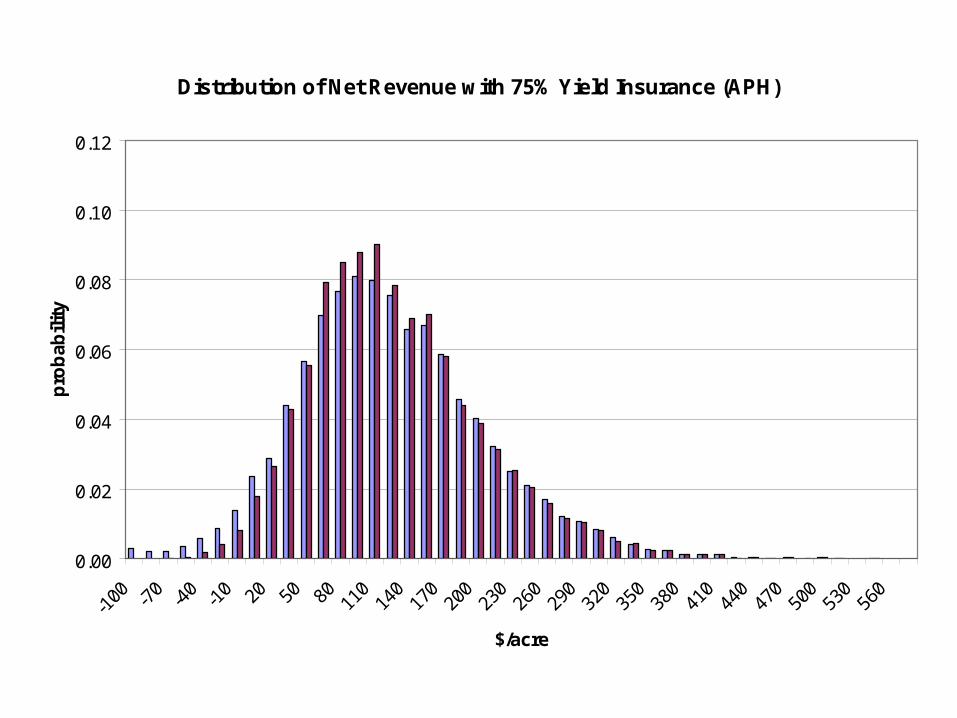
Distribution of Net Revenue with 75% Yield Insurance (APH)
0.00
0.02
0.04
0.06
0.08
0.10
0.12
$/acre
pro
bab
ilit
y

Distribution with Yield Insurance and 75% Hedge
0.00
0.02
0.04
0.06
0.08
0.10
0.12
$/acre
pro
bab
ilit
y

Distribution Using Yield Insurance and Put Options
0.00
0.02
0.04
0.06
0.08
0.10
0.12
$/acre
pro
bab
ilit
y

Distribution of Net Revenue with 75% RA
0.00
0.02
0.04
0.06
0.08
0.10
0.12
$/acre
pro
bab
ilit
y

Distribution with 75% RA-HPO
0.00
0.02
0.04
0.06
0.08
0.10
0.12
$/acre
pro
bab
ilit
y

Distribution with 75% RA and Hedge
0.00
0.02
0.04
0.06
0.08
0.10
0.12
0.14
$/acre
pro
bab
ilit
y

Distribution with 75% RA-HPO and Hedge
0.00
0.02
0.04
0.06
0.08
0.10
0.12
0.14
$/acre
pro
bab
ilit
y
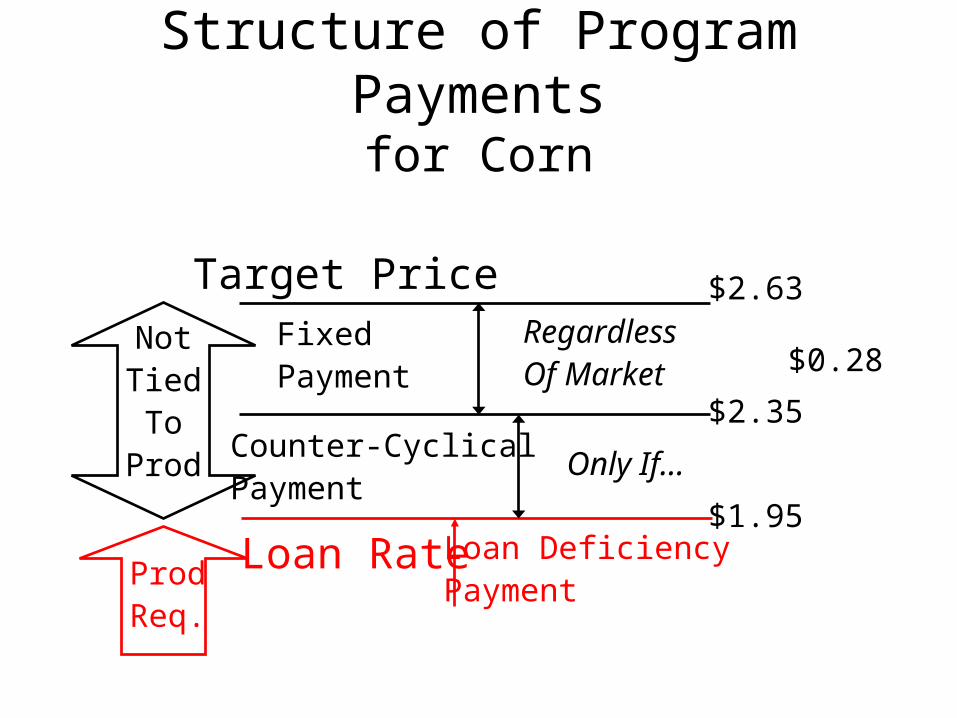
Structure of Program Paymentsfor Corn
Target PriceFixed Payment
Loan Rate
Counter-CyclicalPayment
Loan DeficiencyPayment
NotTiedTo
Prod
ProdReq.
$2.63
$0.28
$2.35
$1.95
RegardlessOf Market
Only If…

Distribution of Net Revenue Plus Direct Payments
0.00
0.02
0.04
0.06
0.08
0.10
0.12
$/acre
pro
bab
ilit
y

Distribution of Net Revenue Plus LDPs
0.00
0.02
0.04
0.06
0.08
0.10
0.12
$/acre
pro
bab
ilit
y
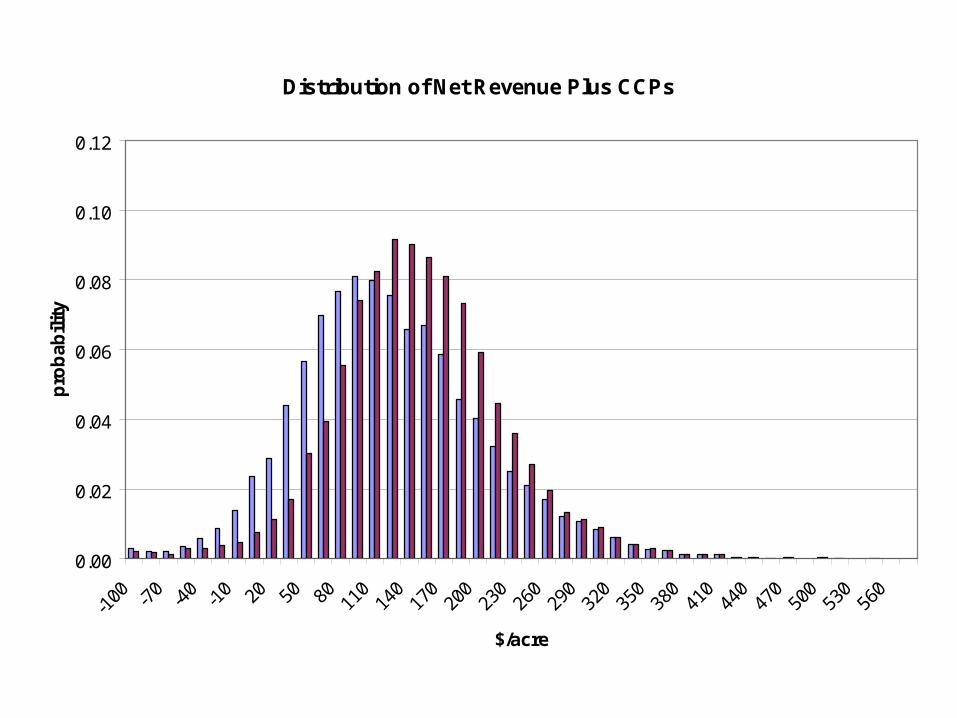
Distribution of Net Revenue Plus CCPs
0.00
0.02
0.04
0.06
0.08
0.10
0.12
$/acre
pro
bab
ilit
y

Distribution with DP, LDP, CCP
0.00
0.02
0.04
0.06
0.08
0.10
0.12
$/acre
pro
bab
ilit
y
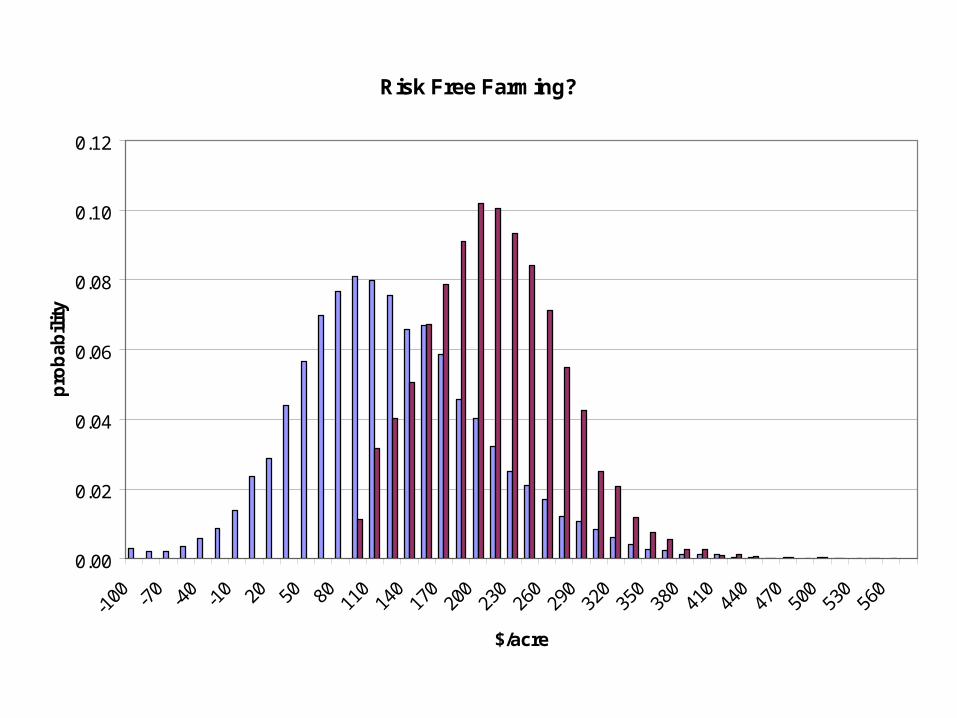
Risk Free Farming?
0.00
0.02
0.04
0.06
0.08
0.10
0.12
$/acre
pro
bab
ilit
y
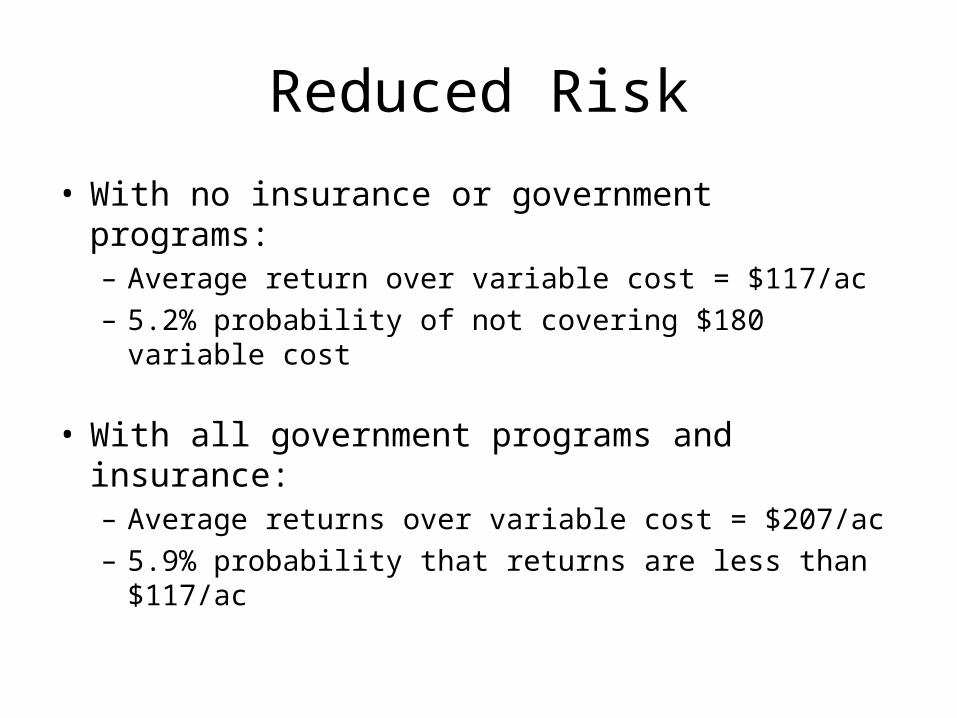
Reduced Risk
• With no insurance or government programs:– Average return over variable cost = $117/ac– 5.2% probability of not covering $180 variable cost
• With all government programs and insurance:– Average returns over variable cost = $207/ac– 5.9% probability that returns are less than $117/ac

Costs of Benefits of Crop Insurance Decisions
• What product to buy?– APH, RA, RA-HPO, CRC, GRP, GRIP, GRIP-HRO
• What coverage level to buy?– CAT, 65%, 70%, 75%, 80%, 85%
• What unit structure to use? – (optional, basic, enterprise, whole-farm)

Effects of Coverage and Unit Structure on Premium
Coverage Level 65% 75% 85%
Total Premium Optional 6,749 16,594 32,478 Enterprise 4,545 12,425 24,610 Whole-Farm 2,440 10,270 21,870 Producer Premium Optional 2,767 7,452 20,136 Enterprise 1,863 5,591 15,258 Whole-Farm 1,000 4,621 13,559

Change in Expected Indemnity
65% to 75% 75% to 85%
Optional 9,845 15,884
Enterprise 7,880 12,185
Whole-Farm 7,830 11,600
Change in Producer Premium
Optional 4,685 12,684
Enterprise 3,728 9,667
Whole-Farm 3,621 8,938
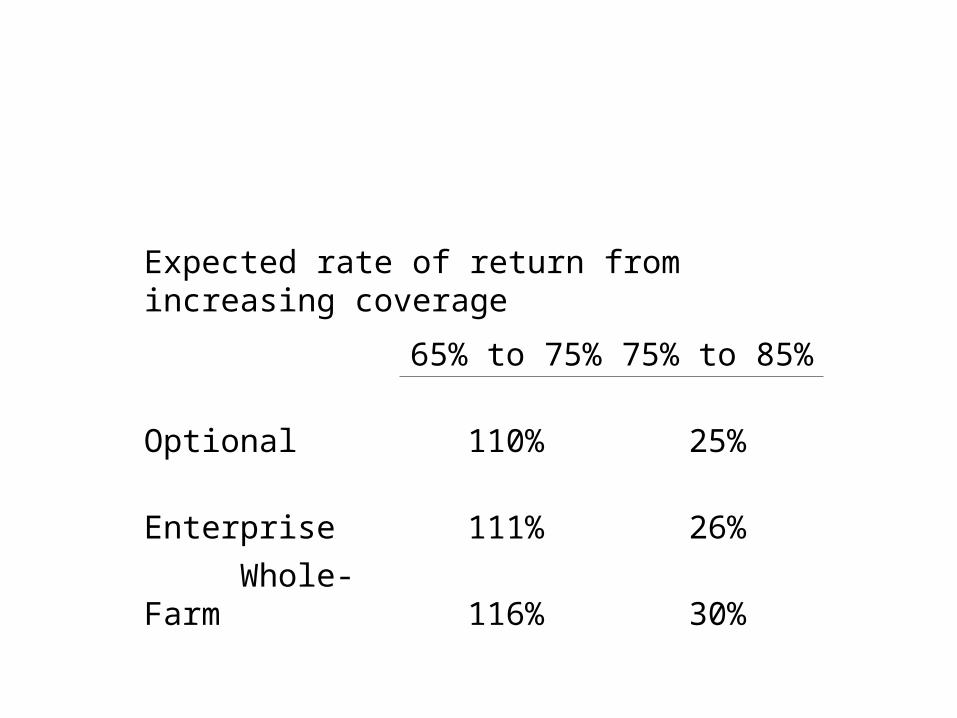
Expected rate of return from increasing coverage
65% to 75% 75% to 85%
Optional 110% 25%
Enterprise 111% 26%
Whole-Farm 116% 30%
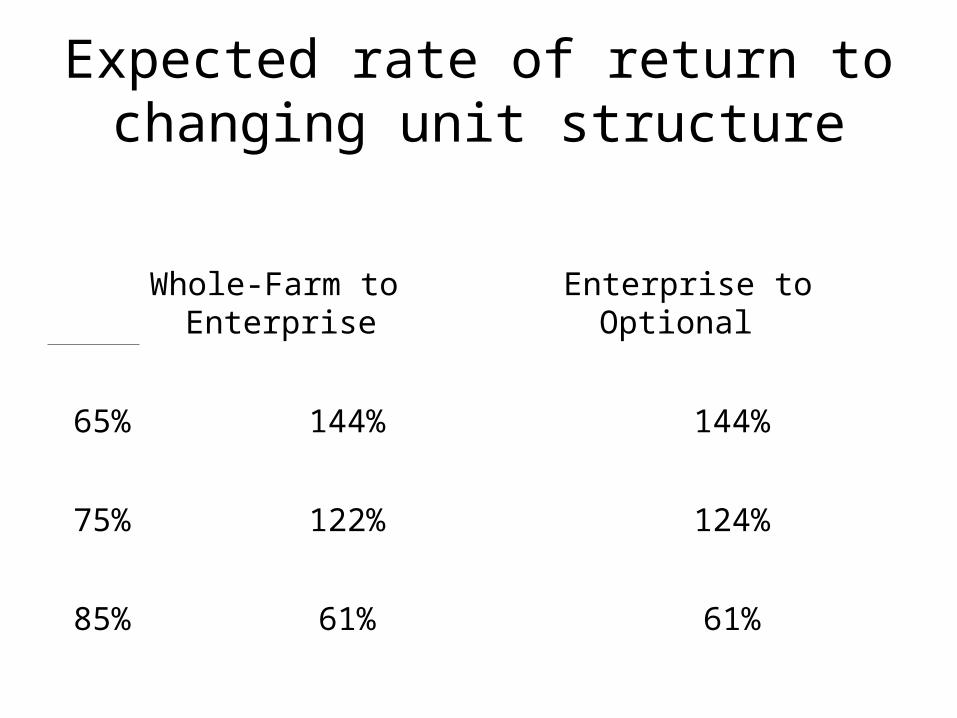
Expected rate of return to changing unit structure
Whole-Farm to Enterprise Enterprise to Optional
65% 144% 144%
75% 122% 124%
85% 61% 61%

Distribution of Returns by Unit Structure

GRIP and GRIP-HRO
• GRIP guarantee = Factor*CBOT Springtime Price*Expected
County Yield
• GRIP-HRO guarantee = Factor*CBOT Fall or Spring Price*Expected
County Yield
Factor lies between 0.6 and 1.5.

Who Should Buy GRIP?
• Farmers who do not have a representative APH yield
• Farmers who are lower risk than that assumed in APH program
• Farmers with yields that are highly correlated with county yields

GRIP and GRIP-HRO in Poweshiek County
(Expected Yield = 154.9 bu/ac)
Maximum Coverage Total Producer Per Acre Premium Premium ($/acre) ($/acre) ($/acre)
GRIP $553 $32.30 $14.53 HRO $553 $47.28 $21.28

Historical Indemnities that Would Have Been Paid Out Under GRIP and GRIP-HRO in Powesheik County
0
50
100
150
200
250
$/ac
re GRIP
HRO
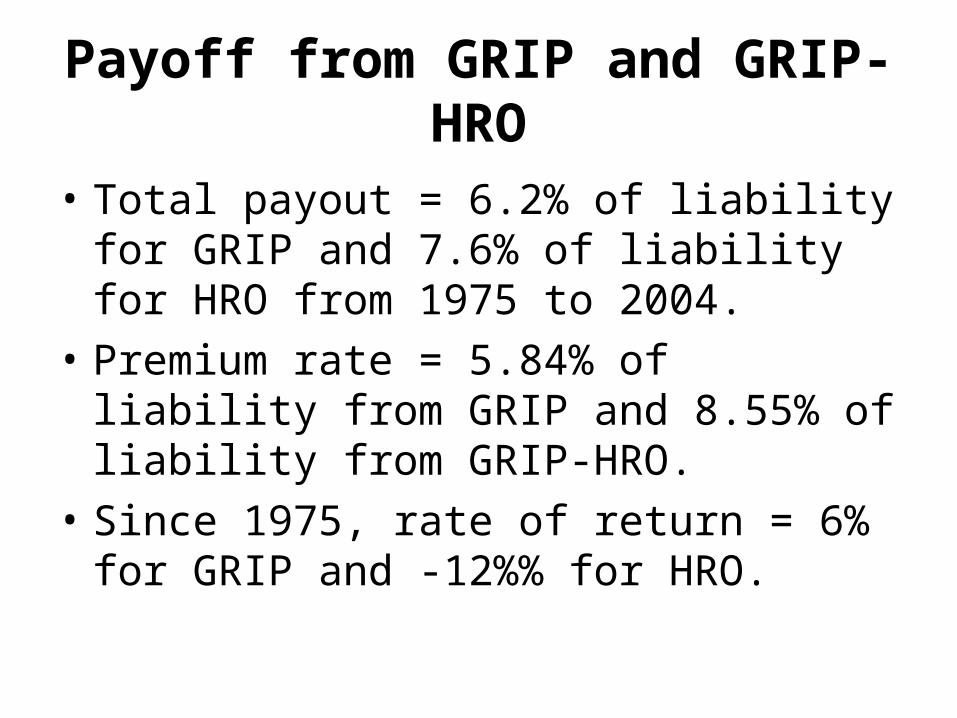
Payoff from GRIP and GRIP-HRO
• Total payout = 6.2% of liability for GRIP and 7.6% of liability for HRO from 1975 to 2004.
• Premium rate = 5.84% of liability from GRIP and 8.55% of liability from GRIP-HRO.
• Since 1975, rate of return = 6% for GRIP and -12%% for HRO.

Subsidized rate of return for GRIP and GRIP-HRO
• 2005 Premium = $14/acre for GRIP and $21 for GRIP-HRO
• Expected Payout from 1975 to 2004: $34 for GRIP and $42 for HRO
• Expected Payout from 1957 to 2004: $27 and $39.
• Expected return = $20 or $13 per acre for GRIP, $21 or $18 per acre for HRO.
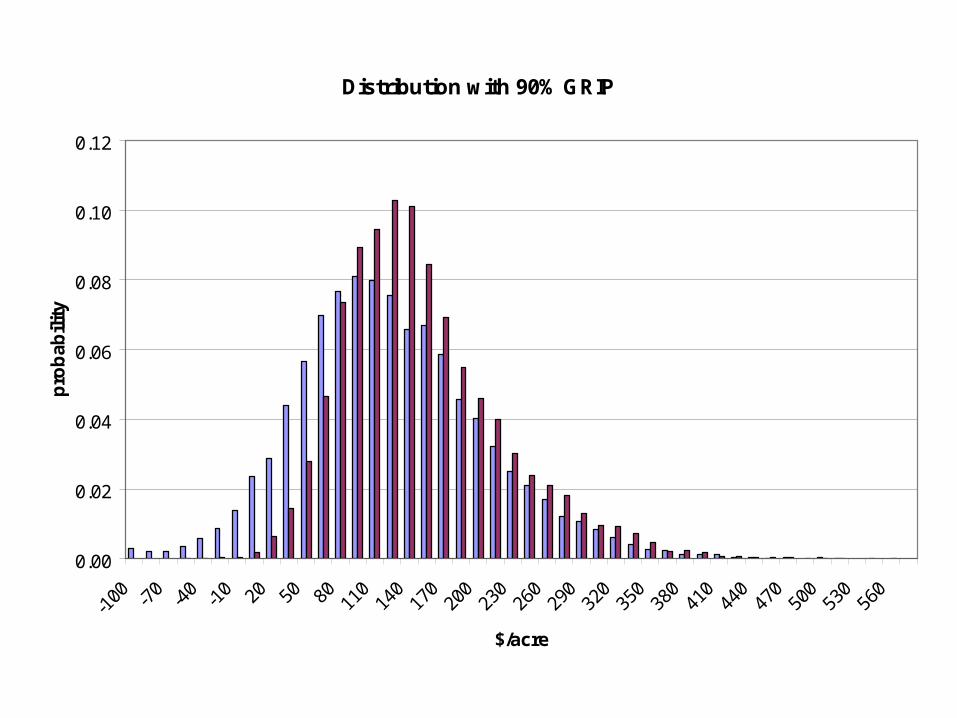
Distribution with 90% GRIP
0.00
0.02
0.04
0.06
0.08
0.10
0.12
$/acre
pro
bab
ilit
y

Distribution with 90% GRIP-HRO
0.00
0.02
0.04
0.06
0.08
0.10
0.12
$/acre
pro
bab
ilit
y

How Does GRIP-HRO Perform Relative to the Gold Standard?
0.00
0.02
0.04
0.06
0.08
0.10
0.12
$/acre
pro
bab
ilit
y
RA + DP, LDP, CCP
GRIP + DP, LDP, CCP

www.card.iastate.edu
• Discussion