Embed Size (px)
Citation preview
ISWS/CIR-132/78
Circular 132 STATE OF ILLINOIS
DEPARTMENT OF REGISTRATION AND EDUCATION
Effects of Channel Dams on Dissolved Oxygen Concentrations
in Northeastern Illinois Streams by THOMAS A. BUTTS and RALPH L. EVANS
ILLINOIS STATE WATER SURVEY URBANA
1978

This report was prepared by the Illinois State Water Survey for the Northeastern Illinois Planning Commission. The study was carried out with funds from the U.S. Environmental Protection Agency under Section 208 of Public Law 92-500. The findings do not necessarily reflect the positions of that Agency.
CONTENTS
PAGE Introduction 1
Effects of channel dams 1 Study area 2 Report format 3 Acknowledgments 3
Dam aeration theory 3 Methods and procedures 6
Data collection 6 Data reduction 8
Results 9 Discussion 12
General 12 Individual structures 19
Future considerations 31 Research suggestions 31 Implications 32
References 35 Appendix. Observed data, sketches, physical descriptions,
and photographs of dams 36
LIST OF TABLES
TABLE 1 Name and location of study area dams 10 2 Summary of dam aeration computations 13 3 Dam characteristics 14 4 Best estimates of dam aeration coefficients (b) for
generalized dam types 15 5 Computed aeration coefficients (b) according to dam types 15 6 Best estimates of dam aeration coefficients (b) for specific dams . . . 16
LIST OF FIGURES
FIGURE
1 Dam site locations 4 2 Surveying reference schematic 7 3 Small weir on Spring Brook at Prospect Avenue 11 4 Remnants of dam on Salt Creek below Wolf Road 11 5 Head loss structural classifications for NIPC 208 study
area streams 15 6 DO curves for St. Charles Dam, July 28, 1976 18
EFFECTS OF CHANNEL DAMS ON DISSOLVED OXYGEN CONCENTRATIONS
IN NORTHEASTERN ILLINOIS STREAMS
by Thomas A. Butts and Ralph L. Evans
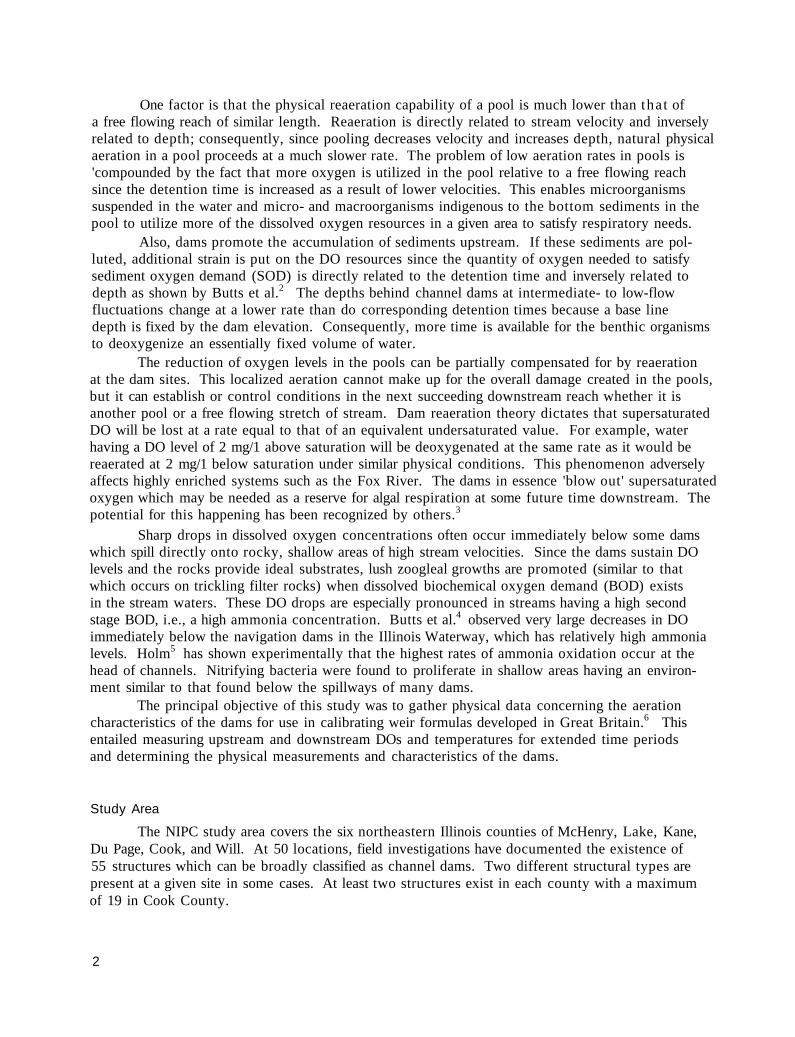
This study was performed for the Northeastern Illinois Planning Commission (NIPC) to provide data for input into a comprehensive water quality model being developed for NIPC in conjunction with their Areawide Waste Treatment Management Study. Their study is being conducted under the guidelines in Section 208 of the Federal Water Pollution Control Act Amendments of 1972. The State Water Survey participated in this study by collecting field data relative to 1) sediment oxygen demand (SOD)1 and 2) the effects of channel dams on dissolved oxygen. The channel dam phase of the work was secondary to that of the SOD study and was performed at a rate dependent upon the availability of personnel. Neither time, money, nor personnel were available to develop and employ a thorough in-depth study. However, the study was designed to produce a maximum amount of data of sufficient quality to be utilized with confidence in a general water quality model.
INTRODUCTION
Effects of Channel Dams
For purposes of this report, a channel dam is defined as any low head dam, weir, or spillway structure which completely transects a stream channel for the sole purpose of creating an upstream head during low to intermediate flows. Generally, these structures are designed without any functional purpose except to retard flow to create a pooled area in a shallow free flowing stream. A few of the dams existing today are vestiges of old grist mills which existed along many Midwest streams a century or more ago.
Many of the dams do not have positive controls to regulate discharges across or through the structures. However, some installations are equipped with either sluice gates, gate valves, or flash boards to regulate pool levels to a limited degree. An indirect means of controlling the pool stage is provided in the design of some dams by establishing fixed weirs at various heights along the spillway; as the flow through a weir section reaches a maximum, it spreads and starts to spill over the next weir or crest. An accurate estimate of the effects of these structures on water quality can only be determined over a wide range of flows.
The influence of a channel dam on water quality can often be dramatic, as the results of this study will demonstrate. The weirs and dams create pools which have dissolved oxygen (DO) levels inherently below or above those normally expected in a free flowing stream of similar water quality. If the water is nutrient rich but not grossly polluted, excessive algal growths can be expected to occur in the pools resulting in supersaturated DO levels. However, in the absence of sustained photosynthetic oxygen production, DO concentrations may often fall below desired levels since the waste assimilative capacities of the pools are often much lower than those of free flowing reaches of the same stream. Several factors account for this.
1
One factor is that the physical reaeration capability of a pool is much lower than that of a free flowing reach of similar length. Reaeration is directly related to stream velocity and inversely related to depth; consequently, since pooling decreases velocity and increases depth, natural physical aeration in a pool proceeds at a much slower rate. The problem of low aeration rates in pools is 'compounded by the fact that more oxygen is utilized in the pool relative to a free flowing reach since the detention time is increased as a result of lower velocities. This enables microorganisms suspended in the water and micro- and macroorganisms indigenous to the bottom sediments in the pool to utilize more of the dissolved oxygen resources in a given area to satisfy respiratory needs.
Also, dams promote the accumulation of sediments upstream. If these sediments are polluted, additional strain is put on the DO resources since the quantity of oxygen needed to satisfy sediment oxygen demand (SOD) is directly related to the detention time and inversely related to depth as shown by Butts et al.2 The depths behind channel dams at intermediate- to low-flow fluctuations change at a lower rate than do corresponding detention times because a base line depth is fixed by the dam elevation. Consequently, more time is available for the benthic organisms to deoxygenize an essentially fixed volume of water.
The reduction of oxygen levels in the pools can be partially compensated for by reaeration at the dam sites. This localized aeration cannot make up for the overall damage created in the pools, but it can establish or control conditions in the next succeeding downstream reach whether it is another pool or a free flowing stretch of stream. Dam reaeration theory dictates that supersaturated DO will be lost at a rate equal to that of an equivalent undersaturated value. For example, water having a DO level of 2 mg/1 above saturation will be deoxygenated at the same rate as it would be reaerated at 2 mg/1 below saturation under similar physical conditions. This phenomenon adversely affects highly enriched systems such as the Fox River. The dams in essence 'blow out' supersaturated oxygen which may be needed as a reserve for algal respiration at some future time downstream. The potential for this happening has been recognized by others.3
Sharp drops in dissolved oxygen concentrations often occur immediately below some dams which spill directly onto rocky, shallow areas of high stream velocities. Since the dams sustain DO levels and the rocks provide ideal substrates, lush zoogleal growths are promoted (similar to that which occurs on trickling filter rocks) when dissolved biochemical oxygen demand (BOD) exists in the stream waters. These DO drops are especially pronounced in streams having a high second stage BOD, i.e., a high ammonia concentration. Butts et al.4 observed very large decreases in DO immediately below the navigation dams in the Illinois Waterway, which has relatively high ammonia levels. Holm5 has shown experimentally that the highest rates of ammonia oxidation occur at the head of channels. Nitrifying bacteria were found to proliferate in shallow areas having an environment similar to that found below the spillways of many dams.
The principal objective of this study was to gather physical data concerning the aeration characteristics of the dams for use in calibrating weir formulas developed in Great Britain.6 This entailed measuring upstream and downstream DOs and temperatures for extended time periods and determining the physical measurements and characteristics of the dams.
Study Area
The NIPC study area covers the six northeastern Illinois counties of McHenry, Lake, Kane, Du Page, Cook, and Will. At 50 locations, field investigations have documented the existence of 55 structures which can be broadly classified as channel dams. Two different structural types are present at a given site in some cases. At least two structures exist in each county with a maximum of 19 in Cook County.
2
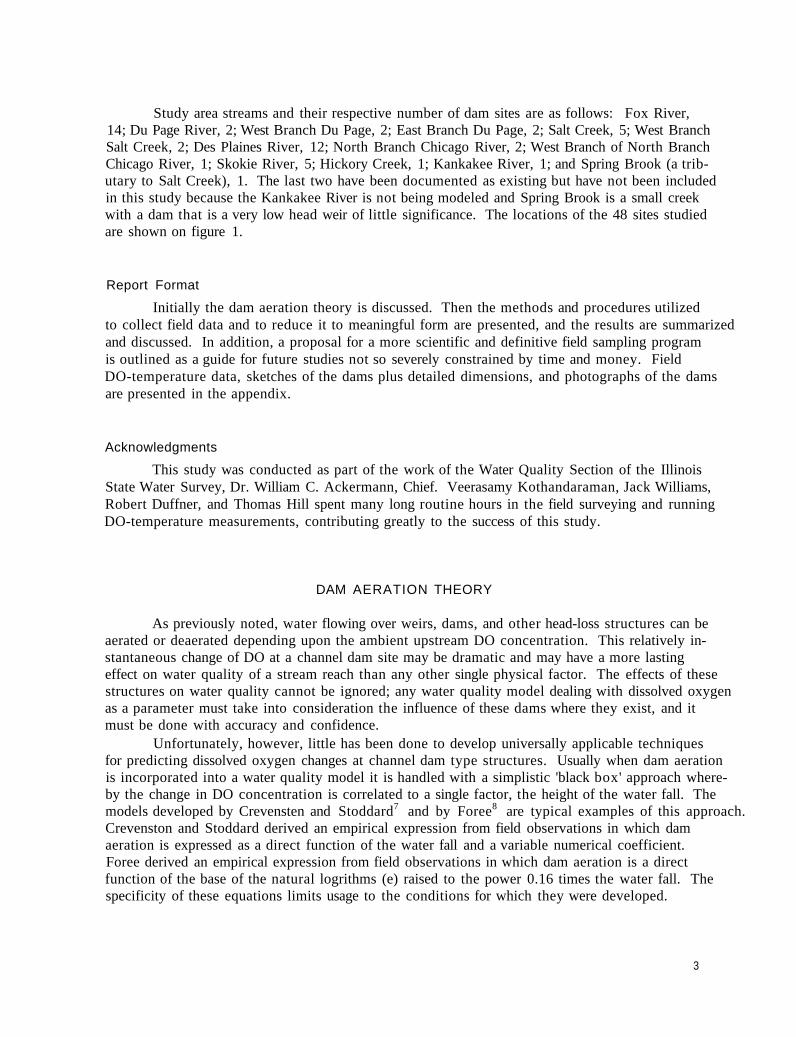
Study area streams and their respective number of dam sites are as follows: Fox River, 14; Du Page River, 2; West Branch Du Page, 2; East Branch Du Page, 2; Salt Creek, 5; West Branch Salt Creek, 2; Des Plaines River, 12; North Branch Chicago River, 2; West Branch of North Branch Chicago River, 1; Skokie River, 5; Hickory Creek, 1; Kankakee River, 1; and Spring Brook (a tributary to Salt Creek), 1. The last two have been documented as existing but have not been included in this study because the Kankakee River is not being modeled and Spring Brook is a small creek with a dam that is a very low head weir of little significance. The locations of the 48 sites studied are shown on figure 1.
Report Format
Initially the dam aeration theory is discussed. Then the methods and procedures utilized to collect field data and to reduce it to meaningful form are presented, and the results are summarized and discussed. In addition, a proposal for a more scientific and definitive field sampling program is outlined as a guide for future studies not so severely constrained by time and money. Field DO-temperature data, sketches of the dams plus detailed dimensions, and photographs of the dams are presented in the appendix.
Acknowledgments
This study was conducted as part of the work of the Water Quality Section of the Illinois State Water Survey, Dr. William C. Ackermann, Chief. Veerasamy Kothandaraman, Jack Williams, Robert Duffner, and Thomas Hill spent many long routine hours in the field surveying and running DO-temperature measurements, contributing greatly to the success of this study.
DAM AERATION THEORY
As previously noted, water flowing over weirs, dams, and other head-loss structures can be aerated or deaerated depending upon the ambient upstream DO concentration. This relatively instantaneous change of DO at a channel dam site may be dramatic and may have a more lasting effect on water quality of a stream reach than any other single physical factor. The effects of these structures on water quality cannot be ignored; any water quality model dealing with dissolved oxygen as a parameter must take into consideration the influence of these dams where they exist, and it must be done with accuracy and confidence.
Unfortunately, however, little has been done to develop universally applicable techniques for predicting dissolved oxygen changes at channel dam type structures. Usually when dam aeration is incorporated into a water quality model it is handled with a simplistic 'black box' approach whereby the change in DO concentration is correlated to a single factor, the height of the water fall. The models developed by Crevensten and Stoddard7 and by Foree8 are typical examples of this approach. Crevenston and Stoddard derived an empirical expression from field observations in which dam aeration is expressed as a direct function of the water fall and a variable numerical coefficient. Foree derived an empirical expression from field observations in which dam aeration is a direct function of the base of the natural logrithms (e) raised to the power 0.16 times the water fall. The specificity of these equations limits usage to the conditions for which they were developed.
3
Figure 1. Dam site locations
4
In addition to differential water levels, other factors such as air and water temperatures, water depth at the foot of the dam, dam height, depth of water on the spillway, water quality, structural design or configuration, and flow rate all influence aeration (or deaeration) to some degree.
Gameson6 has shown experimentally that the largest percentage of dissolved oxygen changes occurs at the foot or on the aprons of spillways; consequently, the physical design of a structure is as important as the distance water falls. Water spilling onto a concrete apron or a rocky escarp and water forming a hydraulic jump at the base of the dam have a greater potential of picking up oxygen from the air than does water falling into a deep, quiet pool.
Velz9 and many others have shown experimentally that aeration is a direct function of water temperature, i:e., warm water reaerates at a faster rate than cold water. This fact should be accounted for in a dam aeration formula.
Another criterion which should be directly considered in an aeration formulation is water quality. Kothandaraman10 in his review of the literature on the effects of contaminants on re-aeration rates reports that most contaminants retard aeration although a few have been found to enhance it. Aeration rates have been reduced up to 60 percent by adding large portions of sewage to tap water, whereas suspended sediments, depending on the type, can either increase or decrease aeration rates to a slight degree.
The British, probably spurred on by the fact that their homeland streams are heavily endowed with channel dams, have extensively studied the aeration effects of these structures. Gameson6 in some original work on the problem proposed the use of an equation involving both theoretical and rational concepts relating differential water levels, water temperature, and water quality to dam aeration. These factors are equated to a concept referred to as the deficit ratio which is defined as:
r = ( C s - C A ) / ( C s - C B ) (1) where r is the deficit ratio, Cs is the DO saturation concentration at a given temperature, and CA and CB are the DO concentrations above and below the dam, respectively. Although equation 1 is very simple it serves to illustrate two principles important to the dam aeration concepts. First it shows that the upstream DO concentration dictates the rate of oxygen change at a given dam. Second, for a given set of water and temperature conditions, higher ratios indicate higher aeration efficiencies. Relative to the first concept, Gameson6 and Gameson et al.11 found in laboratory experiments that the ratio is independent of the above dam DO concentrations of C ±10 mg/1. However, data collected by Barrett et al.12 indicate that this independence may be reduced to C ± 4 mg/1 for full size field structures. The latter figure may be of significance in this study because many stream DOs in the study area fall well outside the C ± 4 range.
Gameson's original formula3 relating temperature, water quality, dam design, and differential water levels to the deficit ratio has been modified and refined and now appears in the form:
r = l + 0 . 3 8 a b h (1 - 0.11 h) (1 + 0.046 T) (2) where a is the water quality factor; b is the weir, dam, or spillway coefficient; h is the static head loss at the dam (i.e., the difference between the upstream and downstream water surface elevations in meters); and T is the water temperature in °C.
The two unknowns in this equation are the water quality factor and the weir coefficient. The direct measurement of 'a' is very difficult and represents a research endeavor or project within itself. A proposal for setting up a methodology for doing this will be presented later. Generalized estimates3 are recommended for use in this study. The values summarized here are based upon a minimal amount of field and laboratory data and are refinements of those originally published by Gameson.6
5
Polluted state a Gross 0.65 Moderate 1.0 Slight 1.6 Clean 1.8
Basically, the object of this study was to determine the 'b' factor (the weir or dam coefficient) under a given set of conditions. By physically measuring h, T, CA , and CB , and estimating 'a,' the weir coefficient could be computed. In essence, this amounted to calibrating the dams.
METHODS AND PROCEDURES
Data Collection The physical dimensions of many dams had to be determined from field measurements.
Plan and cross-sectional information for a number of structures were readily available from engineering drawings. Drawings were available for the Montgomery, North Aurora, and McHenry dams (Fox River); the three Busse Woods dams (Salt Creek); the Hammel Woods and McDowell Grove dams (Du Page River); and the Dempster St., Touhy Ave., Devon Ave., Armitage Ave., and Hoffman dams (Des Plaines River). DO and temperature data were collected in situ for a selected number of structures.
Physical surveys were made by use of engineering surveying techniques. Horizontal measurements were made by steel tape, or stadia readings, or a combination of both. Vertical measurements were made on the level or by stadia. Vertical readings were always taken with stadia when the rod could not be viewed on the level. Only enough coordinates were taken to provide adequate information for plotting the general configuration of the structure. Many of the dams had fish ladders and provisions for rolling boats or canoes up and over them. Such minor appurtenances were not documented.
The technique used is demonstrated by the sketch of a hypothetical dam shown in figure 2. The transit is established at a location where all pertinent points of the dam can be seen without resetting the instrument (point A). A base line is established by zeroing the horizontal vernier and locking it onto an appropriate point on the dam. Usually this is a point, such as C, which- . makes all or most of the succeeding horizontal angles positive. A typical cross section of the dam is taken being sure to catch the upstream and downstream bottom elevations and all major abrupt changes in the dam shape. If the longitudinal shape of the dam is bowed or curved in some fashion, intermediate coordinates such as K, C, and L are taken to sufficiently define the shape. For a straight structure only, end points (J and M in this example) need to be located.
Upstream and downstream water surface elevations should be taken where convenient. The upstream point is selected at a sufficient distance above so as to be out of the range of the dam nappe as shown on figure 2. The downstream water surface is taken as close to the dam as possible but out of the way of any turbulence. Quiet, stilling-like basins are created below some dams which provide excellent locations for making downstream water level readings.
DO-temperature readings were taken every 15 minutes over a minimum time interval of 6 hours. Two model 54 YSI DO-temperature meters with probes were used. Each was calibrated simultaneously in the same spot in the stream by the standard Winkler method. After calibration, one probe was placed upstream of the dam and the other below the dam. The upstream probe was
6

ELEVATION
Figure 2. Surveying reference schematic
7
placed in a representative location where a velocity of 1 foot per second (fps) could be maintained across the face of the probe for proper operation. Often the best location was at the crest of the dam. Below the dam, care had to be taken so that accurate DO values were recorded; extremely turbulent, whitewater, and eddy locations should be avoided.
Initially water surface elevations were measured at the beginning and the ending of each DO-temperature measurement run. However, the water stage was found to fluctuate very little at the low stable flows for which most runs were made and the end stage measurement was normally discontinued. In a few cases, run were made during periods of intense rainfall necessitating taking a beginning and ending stage reading. The dam aeration coefficient was then computed with the average of the two.
Almost 50 percent of the DO-temperature observations were made on 2 days. Usually 3 days per week were allotted to the study (part of the first and last days were needed for traveling). Consequently, a given dam was completely surveyed and partially sampled the first day. A second dam was completely surveyed and sampled the second day. The sampling for the dam monitored during the first day was completed during the morning of the third day, and in these cases, water levels had to be remeasured. The dams for which sampling was extended over 2-day periods are noted in the appendix.
Data Reduction
Horizontal distances for surveyed dams between the transit and points on the dam and relative elevations were computed by use of standard surveying techniques and stadia formulas as presented in any good book on land surveying. Horizontal distances on the dam such as CD and EF (shown on figure 2) were computed by the law of cosines. More accurate and more detailed information was possible on the sketches of dams for which construction drawings were available (see appendix).
The basic procedure for estimating the dam aeration coefficient (b) involves calculating the deficit ratio (r) with observed upstream and downstream DO concentrations and temperatures, setting r equal to the right side of equation 2, estimating the water quality factor, and solving equation 2 for the b-values. Differential water levels (h) in equation 2 can be expressed in either feet or meters, with the calculated b-values being proportionally different. Since the British used meters in their original and subsequent work, meters have been used in the data reduction and evaluation in this study (however, dam dimensions and characteristics are given in feet). For a water quality model using depths in terms of feet as input, the b-values presented in this report should be divided by 3.28.
Two methods of data input into equations 1 and 2 were used. One involved computing b on the basis of integrated DO and temperature averages, and the other on the basis of computing each quarter hourly b-value and averaging these. Because of anomalies and mistakes in the raw DO and temperature observations, certain rigid constraints were placed on the acceptance of the input data. The acceptance or rejection of data was based upon computational procedures utilized by the second method. A computer program was written to control input via three criteria checks: 1) the appearance of negative values for the expression (r — 1), 2) excessively high r-values, and 3) observations too close to DO saturation levels.
The appearance of negative r-values indicates a probable mistake in the field observed DO and/or temperature data. Negative values for (r — 1) occur in the computational procedures when the field data fit one of the following criteria (C = DO saturation concentration):
8

1) CAand C B < C ; C B < C A
2 ) C A< C S ; C B
> C S
3) CA and CB > C s ; C B > C A
4) CA > CS ; CR < CS
Theoretically, these four conditions cannot occur. However, they do for a number of practical reasons, some of which are: inaccurate DO meters and/or probes, poor placement of the probe (mainly the downstream one), observation errors relative to either DO or temperature readings, stream DO conditions too near saturation, and impurities and excessive particulate matter in the water.
Excessively high deficit ratios for this study have been defined an values exceeding 4.0. Values greater than 4.0 may not indicate procedural errors but generally they do. Consequently, since procedural errors cannot be readily separated from unbiased fact, any values not meeting this criterion have been rejected.
Also, unrealistically high b-values can result when observed DOs approach saturation as a limit. To reduce the influence on the overall results of this occurrence, all sets of DO observations having values within the range of Cs ± 1.0 mg/1 have been rejected. A simple example will illustrate the significance of this. Saturation values used in this study were derived with the American Society of Engineers' formula13:
CS = 14.652 - 0.41022T + 0.0079910T2 - 0.000077774T3 (3) Assume at midmorning, a stream at 20.1°C had DOs upstream and downstream of a dam of 7.85 and 7.95 mg/1, respectively. From equation 3, Cs equals 9.00 mg/1, which for the given conditions yields a deficit ratio of 1.1. Later in the afternoon the water warms to 21.5°C (C = 8.75 mg/1) and upstream and downstream DOs increase to 8.60 mg/1 and 8.70 mg/1, respectively, as a result of photo synthetic oxygen production. Under this new set of conditions where CA and CB are within the range of C ±1.0 mg/1, the deficit ratio is 3, which would produce an unrealistic b-value many times greater than that calculated for early morning conditions. Unfortunately, a considerable amount of data was collected when CA or CB approached saturation; a good example is that collected for the Busse Woods (South) Dam (No. 29). All observations fell within 1.0 mg/1 of Cs causing total rejection of all observation sets. Without rejection, an inflated dam coefficient greater than 3 would have resulted. The dam coefficient computed for 3:30 p.m. conditions (see appendix) for this structure is 5.2, an unusable value. If the upstream and downstream DO differential had been only 0.15 mg/1 instead of 0.30 mg/1, a coefficient of only 1.5 would have resulted, clearly a high but usable value.
RESULTS
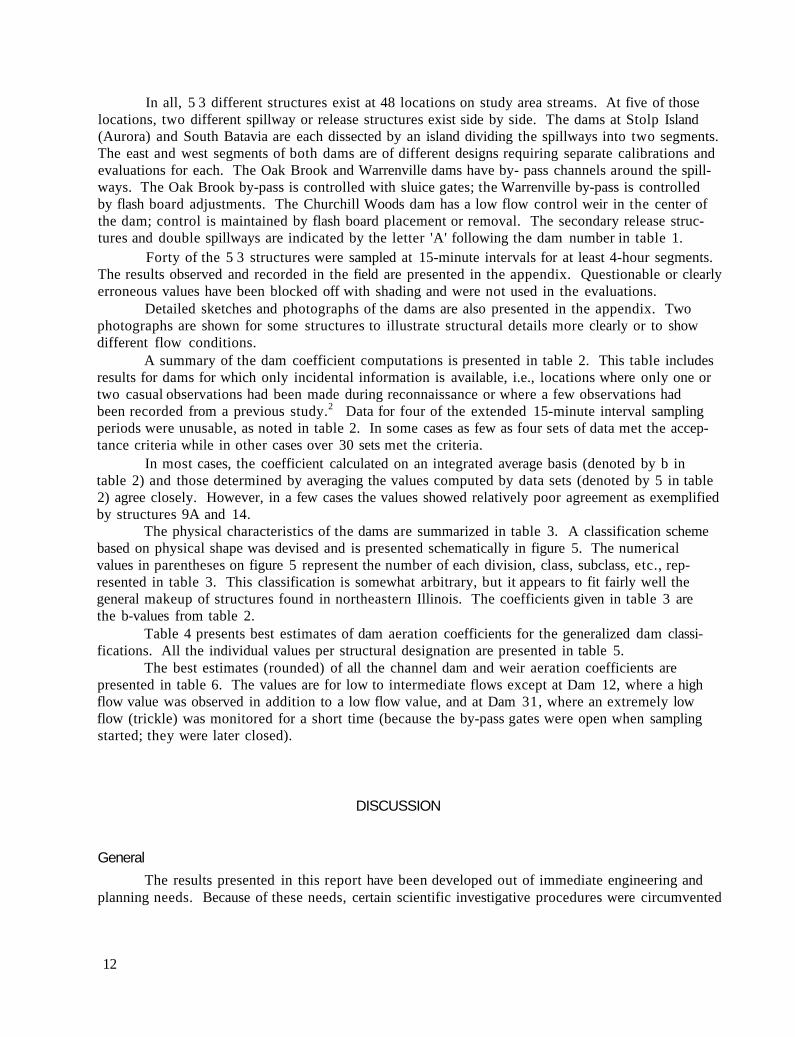
Considerable time was spent in reconnaissance for probable dam sites. The object was to identify and accurately locate all structures which could be classified as channel dams or weirs. Those which were found and appeared to be significant were identified as to name and location (table 1). The dam on the Kankakee River below Wilmington, a small weir on Spring Brook at Prospect Avenue (mile point 0.35), and remnants of an old dam on Salt Creek below Wolf Road (mile point 8.5) are not included in this table but are shown in figures 3 and 4. The head on the
9
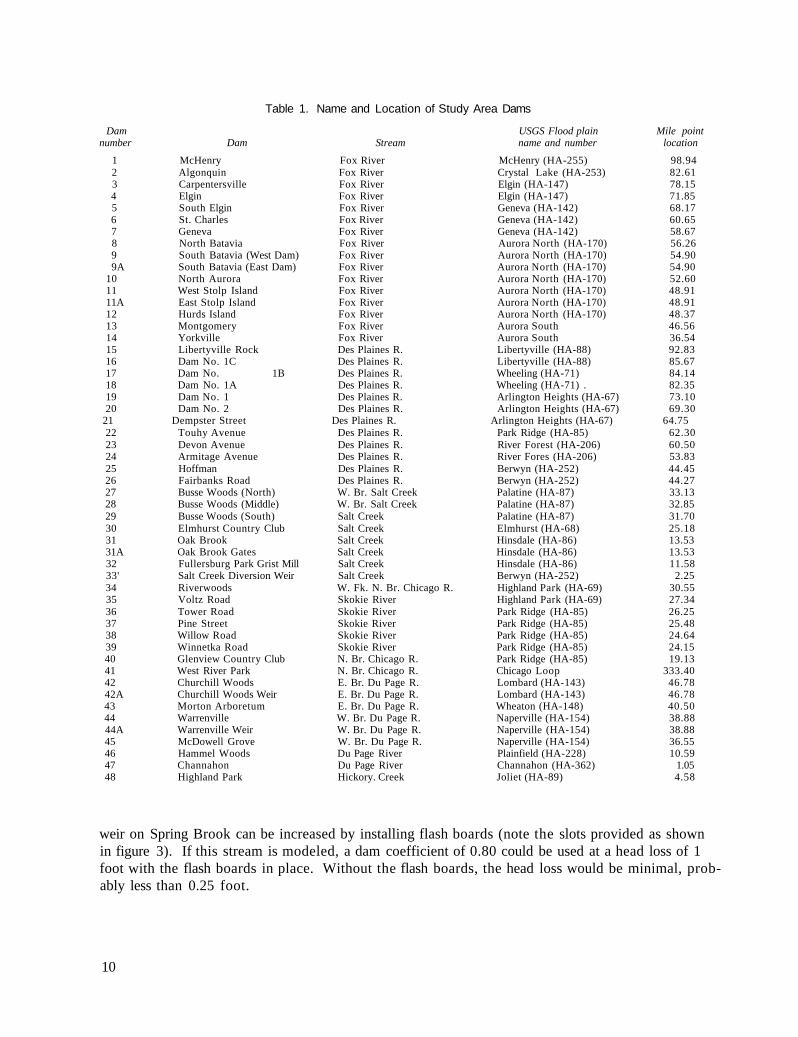
Table 1. Name and Location of Study Area Dams
Dam USGS Flood plain Mile point number Dam Stream name and number location
1 McHenry Fox River McHenry (HA-255) 98.94 2 Algonquin Fox River Crystal Lake (HA-253) 82.61 3 Carpentersville Fox River Elgin (HA-147) 78.15 4 Elgin Fox River Elgin (HA-147) 71.85 5 South Elgin Fox River Geneva (HA-142) 68.17 6 St. Charles Fox River Geneva (HA-142) 60.65 7 Geneva Fox River Geneva (HA-142) 58.67 8 North Batavia Fox River Aurora North (HA-170) 56.26 9 South Batavia (West Dam) Fox River Aurora North (HA-170) 54.90 9A South Batavia (East Dam) Fox River Aurora North (HA-170) 54.90
10 North Aurora Fox River Aurora North (HA-170) 52.60 11 West Stolp Island Fox River Aurora North (HA-170) 48.91 11A East Stolp Island Fox River Aurora North (HA-170) 48.91 12 Hurds Island Fox River Aurora North (HA-170) 48.37 13 Montgomery Fox River Aurora South 46.56 14 Yorkville Fox River Aurora South 36.54 15 Libertyville Rock Des Plaines R. Libertyville (HA-88) 92.83 16 Dam No. 1C Des Plaines R. Libertyville (HA-88) 85.67 17 Dam No. 1B Des Plaines R. Wheeling (HA-71) 84.14 18 Dam No. 1A Des Plaines R. Wheeling (HA-71) . 82.35 19 Dam No. 1 Des Plaines R. Arlington Heights (HA-67) 73.10 20 Dam No. 2 Des Plaines R. Arlington Heights (HA-67) 69.30
21 Dempster Street Des Plaines R. Arlington Heights (HA-67) 64.75 22 Touhy Avenue Des Plaines R. Park Ridge (HA-85) 62.30 23 Devon Avenue Des Plaines R. River Forest (HA-206) 60.50 24 Armitage Avenue Des Plaines R. River Fores (HA-206) 53.83 25 Hoffman Des Plaines R. Berwyn (HA-252) 44.45 26 Fairbanks Road Des Plaines R. Berwyn (HA-252) 44.27 27 Busse Woods (North) W. Br. Salt Creek Palatine (HA-87) 33.13 28 Busse Woods (Middle) W. Br. Salt Creek Palatine (HA-87) 32.85 29 Busse Woods (South) Salt Creek Palatine (HA-87) 31.70 30 Elmhurst Country Club Salt Creek Elmhurst (HA-68) 25.18 31 Oak Brook Salt Creek Hinsdale (HA-86) 13.53 31A Oak Brook Gates Salt Creek Hinsdale (HA-86) 13.53 32 Fullersburg Park Grist Mill Salt Creek Hinsdale (HA-86) 11.58 33' Salt Creek Diversion Weir Salt Creek Berwyn (HA-252) 2.25 34 Riverwoods W. Fk. N. Br. Chicago R. Highland Park (HA-69) 30.55 35 Voltz Road Skokie River Highland Park (HA-69) 27.34 36 Tower Road Skokie River Park Ridge (HA-85) 26.25 37 Pine Street Skokie River Park Ridge (HA-85) 25.48 38 Willow Road Skokie River Park Ridge (HA-85) 24.64 39 Winnetka Road Skokie River Park Ridge (HA-85) 24.15 40 Glenview Country Club N. Br. Chicago R. Park Ridge (HA-85) 19.13 41 West River Park N. Br. Chicago R. Chicago Loop 333.40 42 Churchill Woods E. Br. Du Page R. Lombard (HA-143) 46.78 42A Churchill Woods Weir E. Br. Du Page R. Lombard (HA-143) 46.78 43 Morton Arboretum E. Br. Du Page R. Wheaton (HA-148) 40.50 44 Warrenville W. Br. Du Page R. Naperville (HA-154) 38.88 44A Warrenville Weir W. Br. Du Page R. Naperville (HA-154) 38.88 45 McDowell Grove W. Br. Du Page R. Naperville (HA-154) 36.55 46 Hammel Woods Du Page River Plainfield (HA-228) 10.59 47 Channahon Du Page River Channahon (HA-362) 1.05 48 Highland Park Hickory. Creek Joliet (HA-89) 4.58
weir on Spring Brook can be increased by installing flash boards (note the slots provided as shown in figure 3). If this stream is modeled, a dam coefficient of 0.80 could be used at a head loss of 1 foot with the flash boards in place. Without the flash boards, the head loss would be minimal, probably less than 0.25 foot.
10
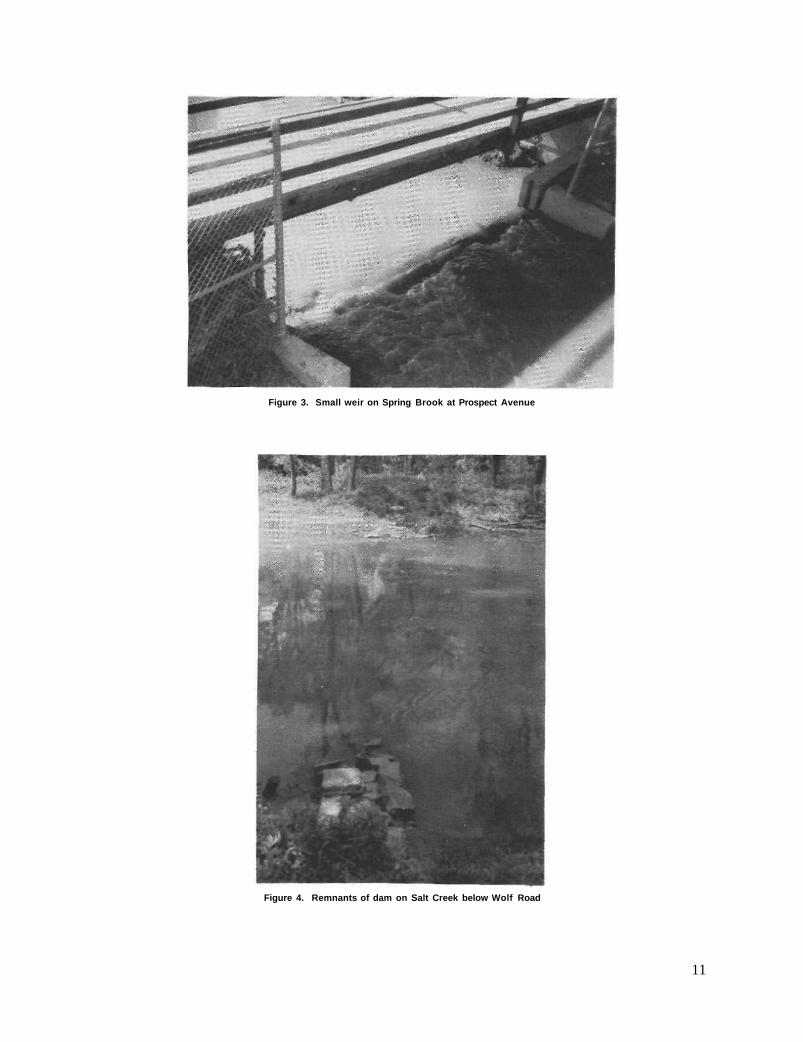
Figure 3. Small weir on Spring Brook at Prospect Avenue
Figure 4. Remnants of dam on Salt Creek below Wolf Road
11
In all, 5 3 different structures exist at 48 locations on study area streams. At five of those locations, two different spillway or release structures exist side by side. The dams at Stolp Island (Aurora) and South Batavia are each dissected by an island dividing the spillways into two segments. The east and west segments of both dams are of different designs requiring separate calibrations and evaluations for each. The Oak Brook and Warrenville dams have by- pass channels around the spillways. The Oak Brook by-pass is controlled with sluice gates; the Warrenville by-pass is controlled by flash board adjustments. The Churchill Woods dam has a low flow control weir in the center of the dam; control is maintained by flash board placement or removal. The secondary release structures and double spillways are indicated by the letter 'A' following the dam number in table 1.
Forty of the 5 3 structures were sampled at 15-minute intervals for at least 4-hour segments. The results observed and recorded in the field are presented in the appendix. Questionable or clearly erroneous values have been blocked off with shading and were not used in the evaluations.
Detailed sketches and photographs of the dams are also presented in the appendix. Two photographs are shown for some structures to illustrate structural details more clearly or to show different flow conditions.
A summary of the dam coefficient computations is presented in table 2. This table includes results for dams for which only incidental information is available, i.e., locations where only one or two casual observations had been made during reconnaissance or where a few observations had been recorded from a previous study.2 Data for four of the extended 15-minute interval sampling periods were unusable, as noted in table 2. In some cases as few as four sets of data met the acceptance criteria while in other cases over 30 sets met the criteria.
In most cases, the coefficient calculated on an integrated average basis (denoted by b in table 2) and those determined by averaging the values computed by data sets (denoted by 5 in table 2) agree closely. However, in a few cases the values showed relatively poor agreement as exemplified by structures 9A and 14.
The physical characteristics of the dams are summarized in table 3. A classification scheme based on physical shape was devised and is presented schematically in figure 5. The numerical values in parentheses on figure 5 represent the number of each division, class, subclass, etc., represented in table 3. This classification is somewhat arbitrary, but it appears to fit fairly well the general makeup of structures found in northeastern Illinois. The coefficients given in table 3 are the b-values from table 2.
Table 4 presents best estimates of dam aeration coefficients for the generalized dam classifications. All the individual values per structural designation are presented in table 5.
The best estimates (rounded) of all the channel dam and weir aeration coefficients are presented in table 6. The values are for low to intermediate flows except at Dam 12, where a high flow value was observed in addition to a low flow value, and at Dam 31, where an extremely low flow (trickle) was monitored for a short time (because the by-pass gates were open when sampling started; they were later closed).
DISCUSSION
General The results presented in this report have been developed out of immediate engineering and
planning needs. Because of these needs, certain scientific investigative procedures were circumvented
12

Table 2. Summary of Dam Aeration Computations
Obser- Dam aeration Dam vations AvgTemp.(°C) Avg DO (mg/l) coefficients* Summary of bvalues
number accepted Above Below Above Below b b Min Max SD**
1 25 7.57 7.46 18.80 16.11 1.11 1.14 0.49 2.18 0.42 2 Sampled (data unusable) 3 9 24.01 24.12 7.50 7.81 0.50 0.54 0.19 0.78 0.15 4 23 25.50 24.89 15.67 10.49 1.50 1.19 0.18 1.89 0.49 5 16 22.27 21.82 12.39 10.01 1.53 1.31 0.13 2.63 0.96 6 13 27.48 26.89 18.87 10.46 1.39 1.42 1.12 1.96 0.26 7 2 21.80 21.50 7.10 7.90 0.77 0.77 0.77 0.78 8 11 21.31 21.33 6.82 7.52 0.40 0.40 0.08 0.92 0.30 9 15 23.92 23.90 12.97 10.31 2.18 2.20 1.43 2.70 0.30 9A 20 25.86 25.79 12.55 10.81 0.83 1.08 0.65 2.75 0.57
10 4 22.18 22.02 5.86 7.00 0.63 0.65 0.30 0.96 0.23 11 16 24.06 23.64 5.72 6.99 0.59 0.56 0.17 0.78 0.17 11A 11 23.23 22.98 6.89 7.84 1.05 1.14 0.76 1.75 .0.28 12 14 24.09 24.01 6.71 7.50 1.60 1.66 0.64 2.75 0.60 12t 15 23.01 22.95 5.52 5.92 0.58 0.94 0.20 2.75 0.80 13 8 24.64 24.32 5.72 6.85 0.76 0.72 0.11 1.07 0.35 14 19 20.98 21.47 8.08 8.51 2.07 1.01 0.34 1.73 0.36 15 1 4.20 4.20 9.25 9.28 0.25 0.15 16 1 4.00 4.00 10.00 10.20 0.73 0.73 17 1 4.40 4.70 11.40 11.60 1.17 1.17 18 1 3.80 3.20 10.30 11.50 0.77 0.77 19 31 12.31 12.16 6.14 7.29 0.56 0.56 0.47 0.64 0.04 20 27 12.66 12.68 6.16 7.89 1.01 0.99 0.51 1.31 0.23 21 25 20.44 20.49 2.92 3.62 0.40 0.41 0.15 0.64 0.16 22 13 18.80 18.80 3.42 4.53 0.58 0.58 0.40 0.78 0.09 23 11 18.99 18.79 5.00 5.94 0.45 0.46 0.08 0.76 0.19 24 15 18.13 18.50 0.83 2.01 0.44 0.44 0.34 0.49 0.04 25 29 24.62 24.14 4.15 6.20 0.66 0.64 0.10 1.64 0.35 26 22 24.54 24.09 5.46 6.08 0.51 0.48 0.01 1.24 0.38 27 Not sampled 28 30 7.01 7.10 8.88 10.16 2.54 2.55 0.51 3.22 0.53 29 Sampled (data unusable) 30 24 16.91 17.02 6.16 6.45 0.32 0.32 0.19 0.70 0.10 31 4 16.32 16.36 3.80 4.28 0.29 0.33 0.01 0.97 0.33 31t 20 17.13 17.00 4.32 6.09 1.11 1.13 0.81 2.05 0.25 31A 17 19.15 18.82 3.36 3.59 0.05 0.05 0.01 0.12 0.03 32 32 20.05 20.05 3.04 5.29 0.56 0.58 0.19 0.87 0.19 33t 19 17.02 16.92 5.12 5.40 0.24 0.24 0.05 0.72 0.16 34 Sampled (data unusable) 35 Not sampled 36 16 16.87 16.79 11.94 11.76 0.99 1.05 0.01 2.59 0.76 37 Not sampled 38 12 19.30 18.83 16.23 13.18 1.16 1.16 1.05 1.37 0.09 39 14 15.09 15.06 18.45 17.74 0.54 0.55 0.01 1.20 0.30 40 7 16.71 16.77 19.09 17.51 1.29 1.30 0.82 1.81 0.29 41 Sampled (data unusable) 42 2 22.25 22.00 10.38 9.33 2.91 0.83 0.52 1.15 0.31 42A 1 0.20 0.20 21.20 21.00 0.19 0.19 43 2 19.25 19.35 2.85 3.33 2.06 2.07 1.99 2.14 0.74 44 3 22.00 22.00 3.70 5.87 0.72 0.82 0.37 1.30 0.33 44A 1 22.00 22.00 3.00 5.10 0.82 0.82 45 2 10.20 10.20 7.45 8.78 0.77 0.51 0.21 0.81 0.30 46 5 13.38 13.36 10.35 10.37 0.78 0.50 0.11 1.06 0.32 47 26 14.96 15.36 7.69 8.25 0.31 0.32 0.06 0.55 0.12 48 18 17.75 18.35 6.38 8.24 0.70 0.72 0.52 0.91 0.11
* £ = calculated on integrated average DO and T values; b = average of 15-minute b-values * * SD = standard deviation Note. All low flows except 3 medium to high flows denoted with daggers (f)
The 'a' values are 0.65 for Dam 33, 1.8 for Dam 48, and 1.0 for all others
13
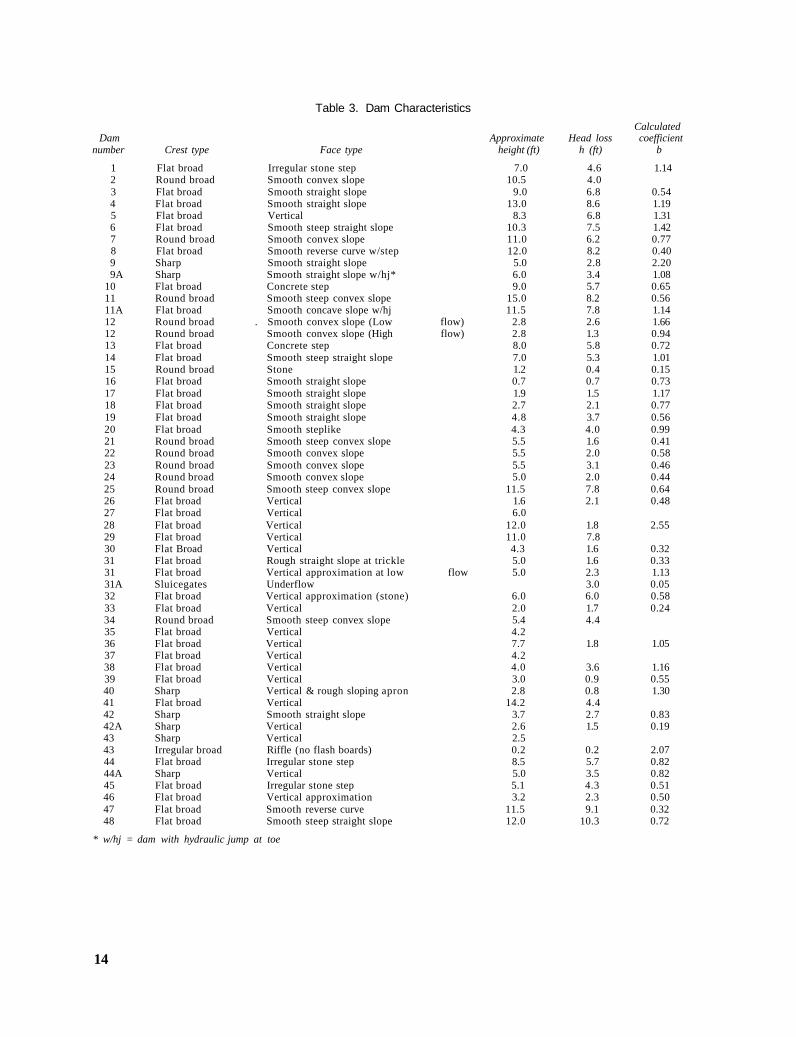
Table 3. Dam Characteristics Calculated
Dam Approximate Head loss coefficient number Crest type Face type height (ft) h (ft) b
1 Flat broad Irregular stone step 7.0 4.6 1.14 2 Round broad Smooth convex slope 10.5 4.0 3 Flat broad Smooth straight slope 9.0 6.8 0.54 4 Flat broad Smooth straight slope 13.0 8.6 1.19 5 Flat broad Vertical 8.3 6.8 1.31 6 Flat broad Smooth steep straight slope 10.3 7.5 1.42 7 Round broad Smooth convex slope 11.0 6.2 0.77 8 Flat broad Smooth reverse curve w/step 12.0 8.2 0.40 9 Sharp Smooth straight slope 5.0 2.8 2.20 9A Sharp Smooth straight slope w/hj* 6.0 3.4 1.08
10 Flat broad Concrete step 9.0 5.7 0.65 11 Round broad Smooth steep convex slope 15.0 8.2 0.56 11A Flat broad Smooth concave slope w/hj 11.5 7.8 1.14 12 Round broad . Smooth convex slope (Low flow) 2.8 2.6 1.66 12 Round broad Smooth convex slope (High flow) 2.8 1.3 0.94 13 Flat broad Concrete step 8.0 5.8 0.72 14 Flat broad Smooth steep straight slope 7.0 5.3 1.01 15 Round broad Stone 1.2 0.4 0.15 16 Flat broad Smooth straight slope 0.7 0.7 0.73 17 Flat broad Smooth straight slope 1.9 1.5 1.17 18 Flat broad Smooth straight slope 2.7 2.1 0.77 19 Flat broad Smooth straight slope 4.8 3.7 0.56 20 Flat broad Smooth steplike 4.3 4.0 0.99 21 Round broad Smooth steep convex slope 5.5 1.6 0.41 22 Round broad Smooth convex slope 5.5 2.0 0.58 23 Round broad Smooth convex slope 5.5 3.1 0.46 24 Round broad Smooth convex slope 5.0 2.0 0.44 25 Round broad Smooth steep convex slope 11.5 7.8 0.64 26 Flat broad Vertical 1.6 2.1 0.48 27 Flat broad Vertical 6.0 28 Flat broad Vertical 12.0 1.8 2.55 29 Flat broad Vertical 11.0 7.8 30 Flat Broad Vertical 4.3 1.6 0.32 31 Flat broad Rough straight slope at trickle 5.0 1.6 0.33 31 Flat broad Vertical approximation at low flow 5.0 2.3 1.13 31A Sluicegates Underflow 3.0 0.05 32 Flat broad Vertical approximation (stone) 6.0 6.0 0.58 33 Flat broad Vertical 2.0 1.7 0.24 34 Round broad Smooth steep convex slope 5.4 4.4 35 Flat broad Vertical 4.2 36 Flat broad Vertical 7.7 1.8 1.05 37 Flat broad Vertical 4.2 38 Flat broad Vertical 4.0 3.6 1.16 39 Flat broad Vertical 3.0 0.9 0.55 40 Sharp Vertical & rough sloping apron 2.8 0.8 1.30 41 Flat broad Vertical 14.2 4.4 42 Sharp Smooth straight slope 3.7 2.7 0.83 42A Sharp Vertical 2.6 1.5 0.19 43 Sharp Vertical 2.5 43 Irregular broad Riffle (no flash boards) 0.2 0.2 2.07 44 Flat broad Irregular stone step 8.5 5.7 0.82 44A Sharp Vertical 5.0 3.5 0.82 45 Flat broad Irregular stone step 5.1 4.3 0.51 46 Flat broad Vertical approximation 3.2 2.3 0.50 47 Flat broad Smooth reverse curve 11.5 9.1 0.32 48 Flat broad Smooth steep straight slope 12.0 10.3 0.72
* w/hj = dam with hydraulic jump at toe
14
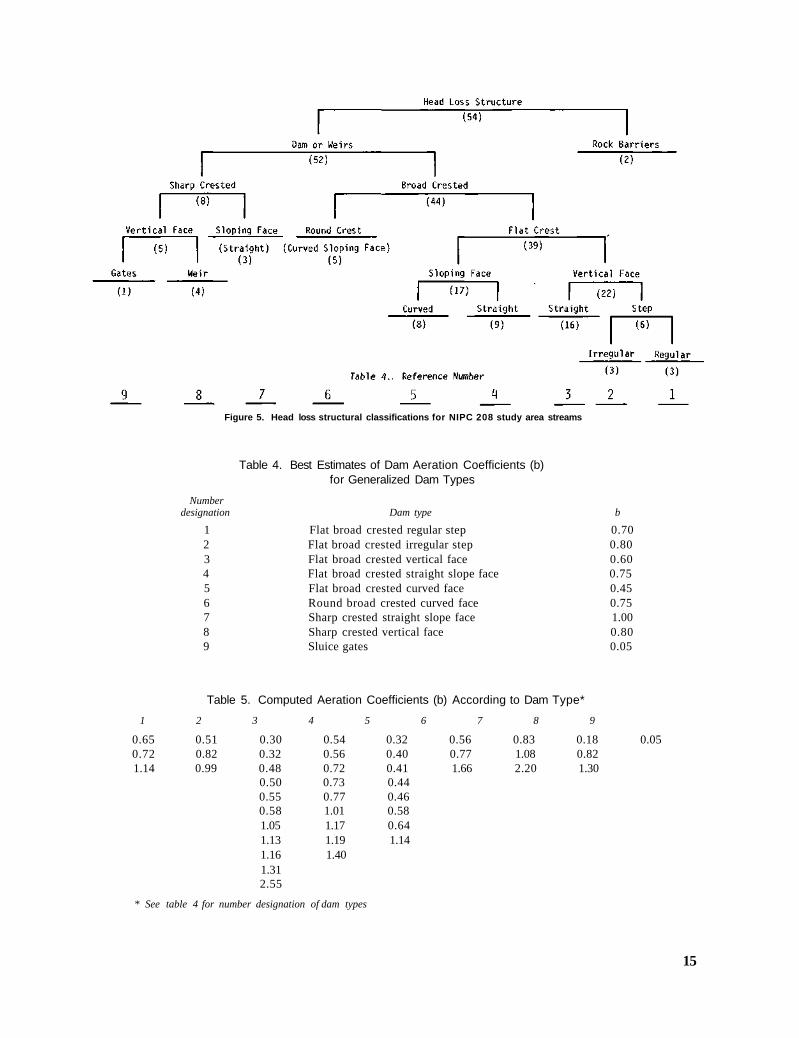
Table 4. Best Estimates of Dam Aeration Coefficients (b) for Generalized Dam Types
Number designation Dam type b
1 Flat broad crested regular step 0.70 2 Flat broad crested irregular step 0.80 3 Flat broad crested vertical face 0.60 4 Flat broad crested straight slope face 0.75 5 Flat broad crested curved face 0.45 6 Round broad crested curved face 0.75 7 Sharp crested straight slope face 1.00 8 Sharp crested vertical face 0.80 9 Sluice gates 0.05
Table 5. Computed Aeration Coefficients (b) According to Dam Type*
1 2 3 4 5 6 7 8 9
0.65 0.51 0.30 0.54 0.32 0.56 0.83 0.18 0.05 0.72 0.82 0.32 0.56 0.40 0.77 1.08 0.82 1.14 0.99 0.48 0.72 0.41 1.66 2.20 1.30
0.50 0.73 0.44 0.55 0.77 0.46 0.58 1.01 0.58 1.05 1.17 0.64 1.13 1.19 1.14 1.16 1.40 1.31 2.55
* See table 4 for number designation of dam types
15
Figure 5. Head loss structural classifications for NIPC 208 study area streams
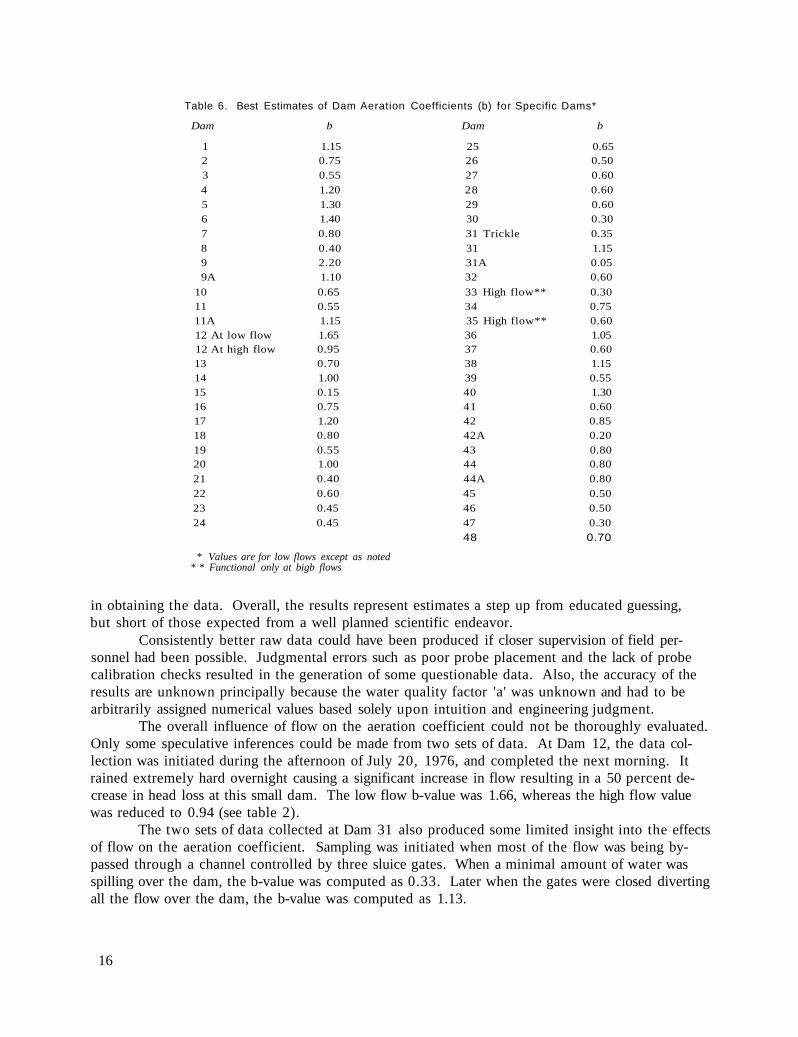
Table 6. Best Estimates of Dam Aeration Coefficients (b) for Specific Dams*
Dam b Dam b
1 1.15 25 0.65 2 0.75 26 0.50 3 0.55 27 0.60 4 1.20 28 0.60 5 1.30 29 0.60 6 1.40 30 0.30 7 0.80 31 Trickle 0.35 8 0.40 31 1.15 9 2.20 31A 0.05 9A 1.10 32 0.60
10 0.65 33 High flow** 0.30 11 0.55 34 0.75 11A 1.15 35 High flow** 0.60 12 At low flow 1.65 36 1.05 12 At high flow 0.95 37 0.60 13 0.70 38 1.15 14 1.00 39 0.55 15 0.15 40 1.30 16 0.75 41 0.60 17 1.20 42 0.85 18 0.80 42A 0.20 19 0.55 43 0.80 20 1.00 44 0.80 21 0.40 44A 0.80 22 0.60 45 0.50 23 0.45 46 0.50 24 0.45 47 0.30
48 0.70
* Values are for low flows except as noted * * Functional only at bigb flows
in obtaining the data. Overall, the results represent estimates a step up from educated guessing, but short of those expected from a well planned scientific endeavor.
Consistently better raw data could have been produced if closer supervision of field personnel had been possible. Judgmental errors such as poor probe placement and the lack of probe calibration checks resulted in the generation of some questionable data. Also, the accuracy of the results are unknown principally because the water quality factor 'a' was unknown and had to be arbitrarily assigned numerical values based solely upon intuition and engineering judgment.
The overall influence of flow on the aeration coefficient could not be thoroughly evaluated. Only some speculative inferences could be made from two sets of data. At Dam 12, the data collection was initiated during the afternoon of July 20, 1976, and completed the next morning. It rained extremely hard overnight causing a significant increase in flow resulting in a 50 percent decrease in head loss at this small dam. The low flow b-value was 1.66, whereas the high flow value was reduced to 0.94 (see table 2).
The two sets of data collected at Dam 31 also produced some limited insight into the effects of flow on the aeration coefficient. Sampling was initiated when most of the flow was being bypassed through a channel controlled by three sluice gates. When a minimal amount of water was spilling over the dam, the b-value was computed as 0.33. Later when the gates were closed diverting all the flow over the dam, the b-value was computed as 1.13.
16
On the basis of these two sets of observations, one could speculate that the aeration capability of a channel dam is very sensitive to flow. One could further speculate that each dam reaches maximum aeration efficiency somewhere toward the high end of the low flow range with efficiencies dropping off slowly but gradually at flows below and above the optimum. As a dam becomes inundated, the aeration coefficient would approach zero and would be zero when totally flooded. The data for Dam 31 indicate that as flow increases the aeration efficiency may be reduced in proportion to the loss in head. A 50 percent loss in head at Dam 12 resulted in a 43 percent loss in aeration efficiency (see table 3). This was weakly supported by Gameson et al.11 with a statement that 'b' may depend on 'h.'
The b-values derived from data collected for this study show a wide variance within structural classification and some discontinuity between structural classifications. Step weirs have been shown to be theoretically the most efficient aerator. In this study, however, the maximum step weir b-value of 1.14 was essentially equaled or exceeded by values for 11 other structures. For the two true step weirs, one at North Aurora (No. 10) and the other at Montgomery (No. 13), the coefficients were only 0.65 and 0.72, respectively, values significantly below 1.3, the representative average reported by Gameson6 and other researchers.3 The McHenry Dam, a hybrid structure between a true step and a cascade (irregular step), had a b-value of 1.14 which approaches the average value as reported by the British.
The biggest anomaly appears to be the high values found for sloping faced structures. Five such dams had b-values above 1.0, with the highest being 1.66. The data used in these computations were carefully examined but no cause for rejection was evident. The values observed for British structures of this type generally fell below 0.40 with typical values being closer to 0.20. Most of the 20 sloping faced dams studied had reasonable values of 'b' with five values falling below 0.50. The wide variability in the overall results of sloping channel structures can partially be explained by the subtle difference in physical conditions and designs. Some, like the East Stolp Island and the South Batavia (East) structures (Nos. 11A and 9A), have hydraulic jumps designed into the toe. Others like Carpentersville and Elgin (Nos. 3 and 4) have irregular slopes where large segments have settled because of foundation problems or concrete deterioration.
The water quality factor, although estimated, is actually an unknown. It possibly could be much more variable than assumed from stream to stream or even within stream reaches. All stream locations were assigned a moderately polluted value of 1.0 except for Hickory Creek (No. 48) and Salt Creek at the diversion structure (No. 33). Hickory Creek appeared clean (a = 1.8) and Salt Creek at the time the diversion structure was operating appeared polluted (a = 0.65). Because the dam aeration coefficient is related to 'a,' if some of the streams were only slightly polluted the results of those computed on the basis of moderate pollution would be reduced by 37.5 percent; true 'clean' streams would be reduced by 44.5 percent. However, except for Hickory Creek, the possibility of any stream being clean appears remote. On the other hand, the possibility of any stream actually needing a grossly polluted classification is also remote. In a water quality model, consideration should be given to adjusting 'a' relative to what was used in this report. If significant cleanup is envisioned, 'a' should be commensurately adjusted. If further degradation is predicted, 'a' should be reduced.
A number of dams were sampled during periods of accelerated algal activity. Two structures in particular, the Elgin and St. Charles dams (Nos. 4 and 6), had results which were noticeably affected by supersaturated dissolved oxygen levels. In both cases, the above dam DOs (C. ) were in excess of 200 percent saturation for significant.periods of time. A close look at the field data (see appendix) for the St. Charles Dam reveals that, although CA increased from 13.9 mg/1 (175 percent saturation) to well over 20 mg/1 (250 percent saturation), the downstream DO concentration
17

(CB) remained relatively constant ranging from 9.5 to 10.8 mg/1. This indicates that the 'effective' upstream dissolved oxygen concentration at a dam remains relatively constant after reaching some supersaturated level. From aeration-deaeration theory this level would probably be at 200 percent saturation since the theory dictates that deaeration occurs at the same rate at 200 percent saturation as occurs at 0 percent saturation. What appears to happen is that, when CA increases beyond 200 percent saturation (2 C ), an immediate release of the DO above 2 Cs occurs at the first hydraulic disturbance encountered at the dam crest. Thereafter, the water is probably deaerated according to theory based upon CA = 2 Cs. This means that, when DOs in excess of 200 percent saturation are predicted above a dam, the excess above 2 C should be subtracted out immediately and dam aeration coefficients should be used with CA set equal to 2 Cs. The upstream and downstream observations relative to 2 C for the St. Charles Dam are presented in figure 6.
Particulate algal cells themselves may have an influence on deaeration at dams. Conceivably, the cells could foster the sudden release of DO upon physical disturbances of the water. Very thick blankets of algal cells could act as a physical barrier to the release of supersaturated dissolved oxygen. Algal blankets with entrapped air bubbles were widely observed during several excursions on the St. Charles pool.
18

Individual Structures A brief description of conditions observed at each dam or weir during the period of study
is presented here. The quality of the collected data and the quality of the results specific to each structure are discussed. The b-value results are classified as excellent, good, fair, or poor. To be classified as excellent, the average values had to 1) fall numerically within the range of values reported in the literature as being representative of certain structural types, 2) consist of at least 20 observations, and 3) be associated with a standard deviation of less than 0.15.
Values in the good category can deviate significantly from typical literature values but must be reasonable (an unreasonable value would be 1.6 for a sloping face dam); at least 10 observations are needed; and the standard deviation should be 0.20 or less. Fair values numerically approximate the good values, but the averages are computed on the basis of 10 or less observations having standard deviations exceeding 0.25. Poor values deviate several fold from the expected average, and standard deviations are high (two standard deviations usually exceed the average). Situations having only one observation are usually classified as poor, but if the single value closely approximates the ideal it is rated fair. The evaluation data are given in table 2. The observed data, sketches, and pictures of each dam are presented in the appendix.
1. McHenry This picturesque dam is the only one studied that is equipped with navigation locks and
large control gates. The dam coefficient represents only the spillway and is not a composite of the three segments of the structure. During low to intermediate flows, however, most of the flow appears to be diverted over the spillway.
All of the 25 observations fit the acceptance criteria, i.e., none were rejected during data reduction. However, the average value could only be classified as fair to good. The average coefficient (b = 1.14) closely approximates the ideal but the range of values was great.
The data were collected during early spring when water temperatures ranged from only 6 to 8°C. The DOs, however, were very high, 17.1 to 19.8 mg/1 above and 15.4 to 16.3 mg/1 below the dam. The above values are high but are only approximately 160 percent saturation. Consequently, unlike the St. Charles Dam situation, a large blow-off of oxygen did not occur at the
. dam crest though CA values at the two dams were comparable in terms of concentration. The maximum upstream-downstream DO differential for this dam was 3.7 mg/1 versus > 10 mg/1 for the St. Charles observations.
2. Algonquin
This dam creates a navigable pool of sufficient depth to handle large pleasure craft in the Fox River below the McHenry Lock and Dam.
The DO-temperature data were collected at the same time as that for the McHenry Dam; consequently, water temperatures were less than 9°C and DOs were supersaturated. The data, however, are not usable because downstream DOs are greater than those upstream. The downstream value was checked by the Winkler method of DO analysis when the downstream concentration exceeded 20 mg/1, the upper meter limit. The check showed the DO to be 21.1 mg/1. This indicates that the downstream readings were probably correct for the location for which they were taken. Either the upstream readings were wrong as a result of meter malfunction or probe misplacement, or the downstream values were not compatible with upstream ones because of probe misplacement. Consequently, 'b' had to be assigned to this structure on the basis of the criteria listed in table 4 for dam type 6 (b = 0.75).
19

3. Carpentersville
This is an old power dam; the raceway entrance along the west end has been filled with earth and gravel. The spillway is an unusual structure. It appears that provision may have been available in the past to increase the head on the dam temporarily.
The estimate of 'b ' (b = 0.54) is fair to good. Only 9 of the 33 observations met the acceptance criteria. The 9-value average was good, however, and the standard deviation was relatively low. Most data rejections resulted because of the close proximity of either C. or C to C .
4. Elgin
This is a high massive dam compared with most along the Fox River. Structurally, it appears to be in poor condition; some breakup of the sloping face appears to be occurring. This could possibly influence the dam aeration coefficient significantly. The crest is unusually broad and flat.
The results of the data analysis are only fair. Twenty-three of the 38 observations made on 2 days were usable. The b-value was much higher than expected (b = 1.19) and the range of values greater. The average coefficient value was considerably higher than expected for the structural classification. However, the photograph in the appendix shows the face is engulfed in white-water, indicating that the high b-value may, in fact, be realistic. Some CA values exceeded 2 Cs, and therefore, those that did were automatically set equal to 2 Cs in the calculating program.
5. South Elgin
This old dam was rebuilt by the state in 1960. On the Fox River, it is the only structure which could be classified as a vertical faced weir (type 3 in table 4). The face has a slight slope but the momentum of the flow carries it past the face and directly onto the apron (see photograph in the appendix).
Sixteen of 3 3 observations were acceptable and resulted in a fair estimate of the aeration coefficient (b = 1.31). All upstream values were above saturation with one being slightly over 200 percent saturation. No consistency existed in the individual quarterly hourly results, and the standard deviation was fairly high.
6. St. Charles
This structure has a relatively narrow flat crest, a steep sloping face, and is classified by the state of Illinois as an Ogee section. It creates the longest and possibly the most placid pool on the Fox River. In addition to this condition, the pool is fed with blue-green algae 'seed' from the Fox Chain of Lakes which together result in a state of eutrophication as advanced as any that could be expected in a lake. DO and temperature measurements were taken over a 2-day period. Fourteen of 18 CA observations on the afternoon of July 28, 1976, were above 2 Cs. Those taken during the morning of July 30 waivered between values slightly below saturation to ones just short of 2 C . All July 30 observations were considered erroneous and were rejected. The DO meter can register values up to 20 mg/1, but Winkler checks indicated values in excess of 21 mg/1.
The estimate of 'b' is fair to poor based on the acceptance of 13 of the 18 July 28 observations. CA values were automatically adjusted to equal 2 Cs when CA exceeded this value. The resulting b-value is 1.42; as a comparison, 'b' equaled 2.30 without adjusting CA to equal 2 Cs when CA exceeded 2 Cs. The 2.30 value is artificially high and could probably be used with confidence when CA exceeded 2 Cs.
20
7. Geneva
This dam, classified by the state as a modified Ogee section, was built in 1960 to replace an older structure.
Twenty-nine observations were made but only two were usable. All of the other sets of observations resulted in negative b-values as a result of either CB < CA < Cs or CA > Cs >CB . This anomaly is not clearly explainable; a possibility exists that it may be the result of poor downstream probe placement. The estimate of 'b ' is reasonable (b = 0.77) although its derivation falls into the poor category.
8. North Batavia
This is an old Ogee spillway in an advanced state of deterioration. The east end has been breached and repaired in a make-shift manner with rip-rap. The west end is in an initial stage of being breached with a cascade having formed overland around an abutment which has failed.
Eleven of the 19 observations met the acceptance criteria resulting in a good average of 'b' (b = 0.40). However, deviations from the average were great making the overall results fair to good.
9. South Batavia (West Dam)
The continuity of both east and west spillways is broken by piers which once supported a walkway. The walkway was removed by the state because it had become a potential hazard to users. The west spillway has a sloping face and is in relatively good condition.
Fifteen of 28 observations met acceptance criteria. Those that did not resulted primarily from the condition where CA and/or CB were within 1.0 mg/1 of Cs. The b-value is much higher than expected (b = 2.20), and is, in fact, the highest for any structure investigated on the Fox River. [This was slightly less than the b-value of 2.55 at the Busse Woods (Middle) Dam (No. 28) on the West Branch Salt Creek, which was the highest average for this study.]
9A. South Batavia (East Dam)
The east spillway is separated from the west spillway by a small island. The east end has failed and is partially breached. The overall condition of the structure is poor. This spillway differs somewhat from the west one in that a hydraulic jump has been designed into the toe. The dam was originally constructed to produce hydroelectricity. An abandoned penstock tunnel discharges along the east bank.
The average dam coefficient (b = 1.08) is approximately half of that computed for the west section. Twenty of the 28 observations met acceptance criteria resulting in a rating of fair. Individual values deviated significantly from the average.
10. North Aurora
This is a new reinforced concrete structure completed during 1976. It is a step structure designed specifically to enhance aeration. Whether it does is problematical.
Only 4 of the 35 sets of observations fit the acceptance criteria. The average of the four sets of data (b = 0.65) was only half of that expected for such a structure. Much of the data was rejected because of CB < CA with CA < CS. The four usable values occurred when CA was less than saturation during early morning hours. As CA rose and exceeded Cs, super-deaeration appeared to occur when CA became reduced to values equal to or less than C . Theoretically pure water cannot be deaerated below Cs; however, the large amount of particulate algae or some other impurity in the water may make this possible. One can speculate that some impurities can retard aeration or
21
lessen the ability of the water to hold oxygen. Consequently, DO may become unstable at some point less than saturation. Therefore, deaeration may actually still occur when CA is somewhat less than C . The estimate of V is considered poor.
11. West Stolp Island
The Stolp Island Dam is located in the downtown business area of Aurora and consists of two spillways separated by Stolp Island. The spillway structural designs are significantly different.
The west spillway is a rounded broad crest weir with a straight sloping face. Sampling was conducted over a 2-day period. Afternoon samples were collected on July 22, 1976, and CA and CB were nearly equal to Cs. As would be expected all these observations were rejected in the computational procedure. Sixteen of the 20 observations made the next morning met the acceptance criteria. Most CA values were well below saturation resulting in a good average b-value classification (b = 0.56).
11A. East Stolp Island
This spillway differs principally from the west spillway in that a hydraulic jump has been designed into the toe. It also has a relatively broad flat crest and the face is a convex slope.
Sixteen DO-temperature measurements were made during the afternoon of July 21, 1976, and 15 were made the next morning. None of those collected during the afternoon period met the acceptance criteria, but 11 of the morning observations did. The resultant b-value is somewhat higher than expected (b = 1.14) and can be classified as fair to good. The coefficient for the east structure is almost twice as large as that for the west. The hydraulic jump may account for much of this difference. However, the opposite was true for the companion spillways of South Batavia, where the value for the structure with the hydraulic jump was only half that for the one without. Interestingly, both spillways with hydraulic jumps had aeration coefficients essentially equal in magnitude. Both were slightly greater than 1.0. Most of the data collected in the afternoon were rejected because values were too near Cs and/or the incremental difference between CA and CB was small.
12. Hurds Island
This low head channel dam is the smallest such structure on the Fox River. Interesting results were achieved here, however, because of a chance occurrence. Fourteen observations were made on the afternoon of July 20, 1976, during which the flow was low. During the night, heavy rains occurred causing a sudden significant rise in the river and reducing the head at the dam by approximately 1.5 feet within a few hours. Fifteen observations were made after the flow increase. All values met acceptance criteria. The low flow b-value was found to be significantly greater than the high value (1.66 and 0.94, respectively). During high flow, the water was heavily laden with brown silt and the dam lost some of its structural identity and integrity as it became partially inundated.
The East Stolp Island Dam (11A) was also sampled after a rain (afternoon of July 20). After the rain, DOs increased to near saturation, and as noted in the discussion of the east spillway data, the results were inconclusive. However, results did tend to support the findings of the Hurds Island Dam that a significant reduction in 'b' can be expected as high flows are approached.
The Hurds Island Dam coefficients for both flow conditions can only be classified as fair because the averages resulted from a wide range of values.
22
13. Montgomery
The Montgomery structure is a reinforced concrete step weir similar to the North Aurora Dam (10). It was built in the early 1960s.
Twelve sets of observations were made on the afternoon of July 8, 1976, and 15 on the next morning. All of the afternoon values were rejected because CB < CS< CA , and only 8 of the morning observations were acceptable. This, along with the fact that the b-value is relatively low for a step weir (b = 0.72), places the results in the poor class. The coefficient is comparable to that obtained for the North Aurora step weir (No. 10).
14. Yorkville
This dam is characterized by a very strong, dangerous undertow. A number of boaters have gone over the crest and have drowned in the undertow although the head differential at the dam is only about 5 feet and the water below is relatively shallow.
Nineteen of 23 sets of observations met acceptance criteria resulting in a fair to good estimate of 'b'. The estimate is somewhat high for the structural type (b = 1.01) but it may be the result of the extreme turbulence and undertow at the base of the structure.
15. Libertyville Rock
This structure consists of very large, field run native boulders placed loosely across the Des Plaines River creating a damming effect. A small head loss of 0.5 foot or less occurs. Little aeration occurs because most of the flow goes between, under, and around the rocks and not over the top. One set of observations was made. A small fractional change in DO occurred resulting in a very low aeration coefficient (b = 0.15). The value is probably a fair to good estimate of overall conditions. This structure is a detriment to water quality because it creates a pool lowering the waste assimilative capacity while producing little aeration compensation at the dam itself.
16. Dam No. 1C
The nondescript name of this dam and those designated 1A and 1B results from an arbitrary decision made during this study. These dams on the Des Plaines River are obscure structures and are not located near noteworthy landmarks. As a consequence, they are not commonly referred to by a specific name. The first dam on the upper Des Plaines River with an official name is Dam Number 1 (No. 19 in our listing), although three dams, excluding the Libertyville Rock Dam, are upstream of it. The first dam downstream of Dam No. 1, logically, was designated officially as Dam No. 2 (No. 20). To put the location of the three unnamed structures in perspective they were designated 1A, 1B, and 1C with the alphabetical sequence being referenced to Dam 1 in an upstream direction. Access to all three structures can be gained only through private property. Dam 1C access is through the Alfred MacArthur estate off State Highway 21 above the EJ & E Railroad bridge. Dams 1C through 2 have been built with the same basic cross-sectional design, and each is a dam and ford combination. Differences exist basically in relative size, with increases occurring gradually in a downstream direction. (Field data for the single observations of DO and temperature for Dams 1C, 1B, and 1A are shown in table 2 but are not included in the appendix.)
The dam part of structure 1C has a low head, and at flows other than low, it would be completely inundated. One set of DO observations was made during the time the structure was surveyed. The water temperature at this time was low, the DOs high, but a small difference was discernable between CA and CB. The one data set evaluation of 'b' (0.73) appears to give a fair estimate.
23

17. Dam No. IB
This structure is accessible by a private lane off Highway 21 located about midway between State Highway 60 and the EJ & E Railroad. The dam and ford sections are still in very good condition. A small increase in DO occurred at the dam at the time it was surveyed resulting in a fair estimate of 'b'. The b-value is somewhat higher than expected (b = 1.17).
18. Dam No. 1A
This structure is accessible from an abandoned road separating Percy Wilson's Riverview Acres from Robert Bartlett's Woodland Trails along Highway 21, below Highway 60. The dam is exhibiting considerable deterioration. The dam coefficient (b = 6.77), derived from the one set of samples collected while surveying, appears to be a good, reasonable estimate.
19. Dam No. 1
This is the first officially named structure along the upper Des Plaines River. It is readily accessible off U.S. Highway 45 through the public lands of the Cook County Forest Preserve. Thirty-one sets of observations were made and all were acceptable resulting in an excellent estimate of 'b'. The average b-value (0.56) is equal to the ideal, the individual values show little variance, and all observations were made for CA values at approximately 60 percent saturation (an ideal situation).
20. Dam No. 2
This dam is located below Euclid Avenue and is readily accessible through Cook County Forest Preserve property. Twenty-seven sets of observations were made, all of which were acceptable. However, the results can only be categorized as good since the average 'b' is somewhat higher than expected (b = 0.99) and the individual values more variable than desirable. The higher than expected value could be partially attributed to the fact that the downstream face of the ford drops steeply to form an irregular step weir which is shown in the second photo in the appendix taken at low flow. This is in contrast to the single short drops or gradual sloping drops which occur at the other dam and ford combination structures.
21. Dempster Street
This is the first of a series of five round, broad-crested weirs located along the middle reaches of the Des Plaines River. The Dempster Street Dam is a small low-head structure located immediately below Dempster Street in Des Plaines. Twenty-five sets of observations were made. All met acceptance criteria resulting in good to excellent results. The average 'b ' (0.41) approximates the expected and the individual values show a modest amount of variability.
22. Touhy Avenue
This dam is located 0.3 mile above Touhy Avenue. Sampling was conducted at this site over a 2-day period. Thirteen sets of observations were made both on the afternoon of September 15 and on the morning of September 17, 1976. All of the afternoon data were rejected principally because CA was close to saturation, and, as a consequence, significant increases in CB did not occur. The morning observations were all well below saturation resulting in total acceptance. The resultant average b-value (0.58) was within the expected range and the standard deviation of the individual values was low. Overall the estimate can be classified as good to excellent.
24
23. Devon Avenue
This dam is located 0.2 mile below Devon Avenue. Twenty-eight sets of observations were made but only 11 morning sets met acceptance criteria. Rejections occurred as photosynthetic oxygen production increased and approached saturation. Some rejections also resulted because CB < CA < Cs. The resultant estimate of the average 'b' of (0.46) was good.
24. Armitage Avenue
This structure is located midway between the First Avenue and North Avenue (State Highway 64) bridges and can be reached by vehicle only via a bridle path outlet at North Avenue. Sampling was conducted during two days and consisted of 15 sets of observations on the afternoon of September 8, and 15 during the morning of September 10, 1976. All afternoon DO observations were above saturation, and the relationship between CA and CBwas inconsistent. At time CB was slightly less than CA while, at other times, CB was greater than CA . All afternoon data were considered erroneous and were rejected. The morning observations were consistent with theory and all were usable. The upstream DOs were the lowest observed at any time during the study. Early morning values were as low as 0.3 mg/1. This condition resulted in a good to excellent estimate of 'b'. The individual coefficient values showed little variation, and the average b-value (0.44) approximated those computed for the three preceding upstream structures.
25. Hoffman
This is the largest dam on the Des Plaines River and is located at Riverside-Lyons immediately upstream of the bridge connecting the two communities. Observations were made on 2 days. Seventeen sets of observations were made on the afternoon of August 25, 1976, and 13 on the morning of August 27. Twenty-nine of the 30 met acceptance criteria. The resultant average 'b' (0.64) fell well within the desirable range, but individual values were somewhat variable, placing the overall results in the fair to good category.
26. Fairbanks Road
This is a small structure with a rectangular section design, located 0.25 mile below Hoffman Dam. The official name of this dam is not known so the dam is arbitrarily identified by the nearest street. Thirty-three sets of observations were made with 22 meeting acceptance criteria. The average b-value (0.48) agreed closely with the other values computed for structural dams along the Des Plaines River. Significant variations occurred between individual values resulting in a fair to good evaluation.
27. Busse Woods (North)
This is a new dam which was completed early in 1977. Presently, the pool behind the dam is still filling, and the spillway is not functioning. The structure is a small version of the two other Busse Woods Dams located below it except it has no energy dissipators running across the downstream apron. A b-value representative of a flat broad crested weir with a vertical face (type 3 dam, b-value = 0.60, from table 4) was assigned to this structure. Because the West Branch of Salt Creek is an ephemeral stream, discharges at the spillway will be minimal or nonexistent during much of the year. Although the spillway is 6 feet high, the head loss will probably be less than 2 feet because of the backwater effects of the Busse Woods (Middle) Dam.
25

28. Busse Woods (Middle)
This is also a new structure completed during the summer of 1976. It is a flat broad crested weir having energy dissipators across the downstream apron. Overflow did not commence until late in the winter of 1976-1977. Thirty sets of observations were made early in the spring of 1977, all of which met acceptance criteria. Head loss at the dam was less than 2 feet although the potential free fall over the weir to the downstream apron is 12 feet. The apron is flooded as a result of being positioned in the tailwaters of the pool created by Busse Woods (South) Dam. The average dam coefficient was extremely high (b = 2.55, the highest of any structure examined), and individual values exhibited a wide degree of variance. Consequently, the estimate, at best, can be classified as fair to poor. An anomaly results because the head differential at the time of sampling was only 1.83 feet, while DO increases of 1.0 to .1.5 mg/1 occurred even when the resultant CB approached within 2.0 mg/1 of CS. The use of this coefficient with a significantly higher head differential is questionable.
29. Busse Woods (South)
This dam is similar to but larger than the Busse Woods (Middle) Dam. Construction was completed during the summer of 1976. Twenty-five sets of observations were made, and all were rejected because CA < Cs < CB . Why this occurred is not readily explainable. An aeration coefficient (0.60, table 6) had to be arbitrarily assigned to this structure because of the anomalous data.
30. Elmhurst Country Club
This is a small but complex structure located off Addison Avenue between I-90 and Lake Street (State Highway 20). The upstream head can be controlled by diverting flow through various partitions, by installing flash boards, and by routing part of it through a 36-inch tile equipped with a gate valve control. The appendix shows two photographs of this structure, one with flash boards in place and the other with them removed and the gate valve fully open. At low to medium flows, the head differential across the dam ranges from 1 to 2 feet without the flash boards, while with them, it is somewhat greater than 2 feet. Sampling was conducted without the boards at a head differential of 1.6 feet. Twenty-five sets of observations were made, of which 24 met acceptance criteria. The resultant average aeration coefficient (b = 0.32) could be classified as excellent since the value fell into the acceptable range and the individual values exhibited little variance. With the boards in place, the coefficient will probably change little, but total aeration will increase in direct proportion to the increase in height.
31-31 A. Oak Brook
This structure is located about 0.25 mile below Oak Brook Avenue. The official name of this dam is not known, so it was arbitrarily assigned the above name because of its proximity to Oak Brook Avenue. Access can be gained only off Oak Brook Avenue through private property, a large riding stable. The dam consists of a spillway and two underflow sluice gates (identified as 31A in tables and appendix) separated from the spillway by a small island. Data were collected for three different conditions. The spillway was sampled during a period of very low flow and during a period of low flow; the very low flow head differential was 1.6 feet and the low flow head differential was 2.3 feet. Also, the flow through the control gates was sampled. The very low flow over the spillway was created by opening the gates to capacity. This structure could provide an ideal arrangement for a planned scientific study on the effects of flow variability on the dam aeration coefficient since flow release over the spillway can be controlled.
26

Four of five observations collected during very low flow conditions met acceptance criteria resulting in a fair to good estimate of V equal to 0.33. After the gates were closed diverting all the flow over the spillway, 20 observation sets were made, all of which met acceptance criteria in terms of DO. This resulted in an approximate 3-fold increase in 'b' equal to 1.13. The effect of a large flow increase at this structure is quite evident.
Thirty-three sets of observations were made of the DO changes when all the flow was released under the sluice gates. Seventeen met acceptance criteria resulting in a fair to good estimate of 'b ' of 0.05. Upstream DOs ranged from 2.40 to 5.40 mg/1 but downstream values showed DO increases of less than 0.5 mg/1. Some data sets were rejected because Cs > CA < CB. From a water quality management point of view, the flow should not be released under the gates when C. < C , however, when CA > Cs it should be, so that downstream DO reserves can be maintained to satisfy nighttime algal respiratory needs. Any water quality model incorporating this reach of stream should be programmed accordingly.
32. Fullersburg Park Grist Mill
This is a picturesque structure built of stone slabs which create a cascading effect at the toe. The dam is a vestige of an old grist milling operation. The restored mill house is used as a museum. Seventeen sets of observations were made on the afternoon of September 1, and 15 on the morning of September 3, 1976, all of which met acceptance criteria. The average coefficient estimate is classified as good to excellent although it is somewhat lower than expected (b = 0.58).
33. Salt Creek Diversion Weir
This structure regulates excessive flows in the lower reaches of Salt Creek by acting as a spillway to a large underground conduit linking the creek with the Des Plaines River. Samples were taken during an overflow period in the spring of 1977. Salt Creek DOs were relatively low, and 19 of the 25 sets of observations fit acceptance criteria. The average coefficient (b = 0.24) is considered a good estimate although the individually computed values were relatively variable. The coefficient was the only one computed on the basis of the water being grossly polluted (a = 0.65). At the time of sampling, the creek was high and appeared to be receiving significant pollution from sewer overflows.
34. Riverwoods
This is a relatively new structure which appears to have been built to create a small recreational lake for a housing development. Only a thin layer of water was discharging over the spillway at the time of sampling. Twenty-five sets of observations were made, and all were considered erroneous and rejected because CA > Cs > CB . Consequently, this structure was assigned a coefficient value based on the criterion set forth in table 4 (b = 0.75). Poor downstream DO probe placement appears to be the probable cause of the anomalous results.
35. Voltz Road
This structure, also known as Glencoe Dam, was not sampled. It is one of four dams which help form the Skokie Lagoons, although it appears to be functionally unimportant. Overflow occurs only during periods of high runoff, and during low flows the water elevations above and below the dam appear to be nearly equal. The assigned value given in table 6 (b = 0.60) should be applied only when the dam is functioning as a spillway.
27
36. Tower Road
This Skokie Lagoon dam is below the Voltz Road Dam, and it appears to regulate low flow heads in the upper lagoons, including the area above the Voltz Road Dam. Although the dam is 6 feet high, the low flow head differential at the dam is small, generally less than 2 feet. The downstream water elevation is influenced principally by flow releases at the Willow Road Dam.
Thirty sets of observations were made with only 16 meeting acceptance criteria. Many rejections resulted from the fact that CA and/or CB fell within 1.0 mg/1 of C . Supersaturated DOs were the rule and the dam appears to be an effective deaerator as evidenced by the high coefficient (b = 1.05). This could be detrimental to water quality in that important oxygen reserves needed to support nightly downstream algal respiration become prematurely depleted. Little physical reaeration in the lagoons can be expected because of the sluggish, pooled nature of the water.
37. Pine Street
This dam functions as a spillway only during low flows. The structure is 4.25 feet high, but the upstream-downstream head differential appears to be less than 1 foot even during very low water conditions. The significance of this structure is that it functions as a deaerator in a eutrophic environment. DO observations were not made; consequently the coefficient was assigned according to the criterion presented in table 4. Conceiveably, however, this estimate (b = 0.60) is low relative to the one computed for its sister structure at Tower Road.
38. Willow Road
This is the main controlling structure for the Skokie Lagoon system. It is a somewhat ornately designed concrete structure used as both a dam and a foot bridge. At low flows water is released through either one or a combination of three 36-inch conduits, the inverts of which are located 4 feet above the downstream apron. Low flow releases are regulated by adjusting control gates located at the upstream end of each conduit. Although this design is unique, it can be placed broadly in class 3 of table 4. At very high flows the upstream head builds up to where the water spills through ten 17.67-foot and one 16.5-foot wide openings between abutments. This broad crested spillway is located 11 feet above the downstream apron. The weir coefficient probably approximates that observed for the low flow tile discharge.
Sampling was done during low flows over a 2-day period. Fifteen sets of observations were made during the afternoon of September 22, and 11 were made during the morning of September 24, 1976. Twelve of the 15 afternoon observation sets met acceptance criteria but none of the morning sets did. All of the afternoon upstream DOs were in excess of 150 percent saturation, whereas all of the morning upstream and/or downstream observations fell within 1.0 mg/1 of C . This resulted in only a fair to good estimate of the dam coefficient. The average value (b = 1.16) was relatively high, but the variance of the individual values was very low.
39. Winnetka Road This is a small spillway type structure located immediately downstream of the Skokie
Lagoons. It receives highly eutrophic lagoon water; consequently, the daytime upstream DOs consistently exceed 150 percent saturation and often exceed 200 percent saturation. Twenty-four sets of DO and temperature observations were made of which 14 met acceptance criteria (8 were considered erroneous). Most of those rejected were unusable because CA exceeded 20 mg/1, the upper limit for which the DO meter can be read. Only a fair estimate of the coefficient was achieved; the average value (b = 0.55) fell well within the expected range but individual values showed considerable variance.
28

40. Glen view Country Club
This is a small private dam used to create a water hazard on a golf course. This is the only dam in the study area which can be permanently classified as a sharp crested weir with a vertical face. The apron is made up of rock rubble forming a small riffle or cascade. Sampling was conducted on 2 days. Fifteen sets of observations were made during the morning and noon hour of April 13, 1977, and 13 during the morning and early afternoon of April 21. Only seven of the first set of observations met acceptance criteria while none of the second did. Rejections resulted because CB > CA > Cs during the first sampling period and because CB< CA < Cs during the second sampling period. The seven good observations gave a higher than expected average coefficient (b = 1.30) with a relatively large standard deviation.
41. West River Park
This structure is located on the North Branch of the Chicago River immediately above its junction with the North Shore Channel. The dam is unusual in that it is composed of five broad crested weirs, and four of the weirs are at different elevations evidently to minimize upstream water level variations over a wide range of flows. The appendix shows two photographs of this structure. One is for a very low flow condition for which only the lowest weir is discharging, and the other is for a somewhat higher flow at which the second lowest weir is beginning to overflow.
Twenty-five sets of observations were made during the spring of 1977, but all were erroneous. They were rejected because CA > Cs > CB which is a physical impossibility. The reason for this apparent anomaly is quite evident, however. For convenience of making the downstream measurements, the sampling crew placed the probe too far below the dam and the readings were influenced by the low DO water coming from the North Shore Channel. Consequently, the dam had to be assigned a coefficient according to the table 4 classifications. This value (b = 0.60) can be reasonably applied to all weir elevations since all are essentially broad crested weirs with vertical faces.
42-42A. Churchill Woods
This dam is located underneath the Crescent Street bridge on the downstream side. Structurally it is in poor shape. The structure is made up of a concrete spillway extending across the channel bed and a low flow release weir in the center of the spillway. Low flow is controlled by flash board placement Or removal within the weir section. Trash collection around the weir and along the spillway during low flows and an unlevel spillway may cause the aeration coefficient to change significantly with small changes in flow.
No concentrated effort was made to sample this dam. However, incidental to surveying the structure two sets of data were collected for the spillway part and one set for the weir. The estimates of the dam coefficients are those presented in table 2. The spillway value (b = 0.83) appears to be a reasonable estimate, but the weir value (b = 0.19) appears low. The weir value, however, was computed for unusual conditions, i.e., near freezing water temperature, supersaturated DO, and extremely low flow.
43. Morton Arboretum
This structure becomes a dam only when flash boards are lowered in place. The facilities are in disrepair and appear to be little used as a dam. No extended sampling was conducted. The data listed in table 2 are for two sets of observations made without the flash boards in place. Head loss and turbulence occurs across the open piers which induces a small but significant increase in
29
dissolved oxygen. The aeration coefficient for in-place flash boards was chosen according to the criterion in table 4 and is 0.80 (see table 6).
44-44A. Warrenville
This is a picturesque structure composed of stone slabs (creating an irregular step structure) and a bypass rectangular weir. No extended sampling was conducted and the dam's physical characteristics were obtained from a previous study.2 Three sets of casual observations for the dam proper produced the results presented in table 2. Only one usable set of observations was available to estimate the weir aeration coefficient and, by chance, it equaled that computed for the dam itself (b = 0.82).
45. McDowell Grove
This structure is also composed of stone slabs forming an irregular step section. However, planimetrically it is bow shaped instead of serpentine like Warrenville. The physical characteristics were also obtained from a previous study.2 No extended sampling was conducted. Two casual sets of observations produced an aeration coefficient value somewhat less than that for the Warrenville structure (b = 0.51).
46. Hammel Woods
This is a low head dam built of stone forming an irregular discharge crest. Twenty-eight sets of observations were made but only five produced usable data. Rejects resulted principally because CA and CB were too close to C ; some resulted because CB < C. < C . The usable data produced a fair estimate of the coefficient.(b = 0.50).
47. Channation
Compared with most of the previously discussed structures, the spillway section of this dam is relatively massive. The section has a very broad flat crest and a gentle concave slope, conditions not conducive to good reaeration. Twenty-six sets of observations were made and all met acceptance criteria. The average coefficient value is low (b = 0.32) but reasonable for this type of structure. Individual values show little variance, and the results of this analysis can be classified as excellent.
48. Highland Park
This very attractive dam is located in a Joliet city park on Hickory Creek. By channel dam standards it is beautiful. Laterally it is bow shaped with a shallow weir section in the middle designed to handle low flows. The dam section has a very broad, relatively flat crest, and the face exhibits steep, slightly concave lines. A 17-in high energy dissipator runs continuously 3 feet from the toe of the dam.
Sampling was conducted on 2 days; 13 sets of observations were made on the afternoon of June 2, and 18 during the morning and early afternoon of June 3, 1976. The afternoon data were inconclusive, and most were rejected because the downstream DOs were only a fractional part per million greater than the upstream values. This may have been the result of low deficit upstream DOs and poor downstream probe placement. Lower CA values and a relocation of the probe the next morning produced excellent results. All 18 sets of observations were usable giving an average reaeration coefficient (b = 0.72) that fell in the expected range; individual values showed a minimal amount of variance. The measurements were made during a low flow period in which all of the dis-
30

charge was occurring in the center weir section. However, the aeration coefficient could probably be applied for somewhat higher flows when the discharge becomes continuous across the entire spillway crest.
FUTURE CONSIDERATIONS
Research Suggestions
The overall outcome of this study has revealed that the 'short cut' procedures and methodologies employed have produced inconsistent, ambiguous, and at times questionable results. To enhance the credibility of future studies, consideration should be given to the inclusion of two variables essentially neglected in the collection of these data. The two variables are flow and water quality.
Only limited reference is made in the literature about the effect of flow variation on weir aeration. What data are available appear to be somewhat ambiguous, and the results are unclearly delineated. In Gameson's6 original field studies, he found that for one particular step weir the deficit ratio remained unchanged at approximately 2 over an estimated 3.5-fold change in discharge. However, he does not indicate what the actual flows were. A review of Gameson's data indicates that the observed flows fall into what has been generally referred to in this paper as low to low-medium. Very low to high-medium values were not encountered.
In controlled laboratory aeration studies, Tebbutt14 generated data for step weirs supporting Gameson's field observations showing minimal changes in aeration over a range of relatively low flows. Flows were never increased to the point where the step flow pattern started to lose its integrity. Straight sloping dam faces, however, were shown to be highly dependent upon flow. Only low flows, providing a thin film of water on the sloping face, exhibited significant aeration capabilities. Approximately a 4-fold increase in flow reduced the oxygen uptake by approximately 50 percent. Dutch researchers11 are noted to have shown that some reduction in aeration at free-falling weirs occurs over a flow range of 3-fold. In addition, several casual observations made during this study indicate the aeration coefficient varies significantly for flows ranging from low to low-medium.
Future studies should be designed to include sampling during at least low, low-to-medium, and medium flow periods. This would give three coefficient values over a wide enough flow range to provide some inferences as to the effects of flow. As a minimum, water levels should be referenced to some established bench mark in the area of the dam. Preferably flow measurements should be made during the time of sampling. Permanent, recording USGS flow gaging stations are available near many dams since they provide good control. For example, gaging stations above dams are found at the Warrenville, Hammel Woods, and Dam No. 2 locations (Nos. 44, 46, 20).
An organized effort should be made to gain some insight on the true numerical range of the water quality factor in future studies. This has never been done even by the early British researchers. Arbitrary values were originally assigned2'11'12 and later restated and revised.3 This clearly is not an acceptable scientific approach as evidenced by some of the ambiguous results produced during this study.
Procedures should be employed at the time a dam is calibrated to measure the water quality factor. An indirect procedure using a collection box equipped with a weir appears to be the simplest and most manageable approach. The equipment required includes a small pump, hose,
31

surge box equipped with a weir, and a collection box equipped with a weir. The best type of weir to use in conjunction with the surge box is a V-notch with a free fall. Free-falling weirs by definition3'11'12 have a weir or dam aeration coefficient of unity (b = 1.0). The V-notch design has the advantage of providing good hydraulic characteristics at low flows, and it permits free admission of air between the weir face and the overfall at the low discharges expected to be used for the experimental procedure.
Basic operating procedure would consist of pumping stream water to the surge box and catching the overflow in the collection box. DO and temperature readings would be taken in the surge box above the weir arid in the collection box below the weir, and the difference in water elevations would be measured. These factors can be used to solve for 'r,' the deficit ratio (see equation 1), and 'a,' the water quality factor (see equation 2). With b = 1.0, solving equation 2 for 'a' yields:
a= [(2.63) ( r - 1)] / [(h - 0.11 h2) (1.046T)] (4) Equation 4 could be simplified further to yield equation 5 if the water surface elevations could be maintained at a head differential of 1 meter.
a= [2.957 ( r - 1)] / (1 + 0.046T) (5) Maintenance of a 1-foot head differential probably is not practical in the field which would preclude the use of equation 5 in most instances. In addition, a number of readings at varying head differences seem desirable to reduce possible experimental error. As a consequence the collection box would have to be designed with an adjustable overflow weir to control both the height of fall and the depth of receiving water. The British3 have found that when 'h' exceeds 0.5 m the idealized free-falling weir retains a b-value of unity only when the receiving water depth is at least 0.1 h + 0.06 m. In other words, a free-falling weir having a head differential of 1 meter must spill into receiving water at least 0.16 m deep to have 'b ' equal to 1.0. Optimum receiving depth for water level differences less than 0.5 m are somewhat greater than the above factor. Field trials should be run for at least three settings of 'h', say 0.5 m, 0.75 m and 1.0 m, with separate values of 'a' being computed and averaged.
Consideration should be given to incorporating some simple but subtle design features into the experimental setup to provide flexibility and ease of operation. The pump discharge inlet to the surge tank should be baffled along with intermediate points to minimize surge and wind effects on the weir. Methods for leveling the surge and collection tanks should be provided; adjustable footscews for use in conjunction with horizontal leveling bubbles would be desirable. An accurate method of measuring water levels, such as the use of a hook gage, is needed. Tanks should be sized for ease in setting-up (or taking-down), draining, and transporting.
The above are the prime factors to be considered and are presented as a guide. The methods and procedures have never been used before, and changes and refinements will undoubtedly be needed in the system before estimates of the water quality factor can be reliably produced.
Implications
As pointed out and demonstrated in this report, the net water quality effect of channel dams is usually deleterious. In most instances, little can be done in the way of management or operating procedures to lessen these effects. Where some flexibility exists in controlling the flow over or around a structure, it should be employed to maximize downstream DO levels. Also, the environmental impacts of any new dam should be thoroughly investigated. New structures on highly enriched streams like the Fox and Du Page Rivers would probably best be designed to minimize
32
deaeration since these streams produce supersaturated DOs during the day with the surplus being needed for night algal respiration.
The ideal new design would consist of underflow release structures which could be utilized during the day and closed during the night, forcing the flow over a weir or spillway. Several existing structures in the study area lend themselves to this type of operation or management. The most notable of these is the McHenry Dam (No. 1) on the Fox River. The DO levels in the Fox River above the dam are consistently above saturation during daylight hours as a consequence of the eutrophic condition of the Fox Chain of Lakes. Four large sluice gates are available (see sketches and photos in the appendix) for underflow flow release; the release of daytime low flows through the gates appears to be practical. Because of lockage needs, personnel are permanently available at the dam to perform the needed operational adjustments.
The aeration coefficient for the McHenry Dam spillway was estimated to be 1.15, whereas, for the underflow sluice, it probably does not exceed 0.05. The Oak Brook Dam sluice (No. 31 A) studied during this project had a 'b ' equal to 0.05 although Gameson6 reported a value of only 0.04. A numerical example shows the advantages of diurnal control of the flow at the McHenry dam. Assume the following:
CA =22.3 mg/1 (day), 4 mg/1 (night) T = 28°C Cs = 7.72 mg/1 a = 1 b = 1.15 (spillway), 0.05 (sluice gates) h = 4.9 ft= 1.5 m
To determine CB for the spillway: From equation 2 r = 1 + (0.38) (1) (1.15) (1.5) [1 - (.11) (1.5)] [1 + (0.046) (28)] r = 2.25 From equation 1 day 2.25 = [7.72 - (2) (7.72)] / (7.72 - CB) CB = 11.15 mg/1 (Note: since CA> 2 Cs, CA was set equal to 2 Cs in equation 2) night 2.25 = ( 7 . 7 2 - 4 ) / ( 7 . 7 2 - C B ) C B =6.1
To determine CB for the gate: From equation 2 r = 1.05 From equation 1 CB =21.6 day
4.2 night The results clearly demonstrate the advantage of releasing all the flow through the gates during the day and shutting them down at night. Some question exists as to whether the oxygen in excess of 2 C will be retained even when released under a sluice gate. Most of the DO will probably be retained in a fully submerged outlet; however, if some expulsion does occur it will not be of the magnitude expected to occur at the spillway. A downstream gate outlet discharge onto a shallow
33
riffle area may cause an immediate reduction of CA to 2 Cs. If this happens at the McHenry gates, CB in the above example would be reduced to 15.1 mg/1, a value considerably below 21.6 mg/1, but still significantly greater than the comparable spillway value. Routing the flow over the spillway at night provides an increase of more than 50 percent in downstream DO. However, a continuous release of low flows under the gates during supersaturated conditions appears to have more overall benefits than continuous use of the spillway only.
The Oak Brook, Elmhurst Country Club, Warrenville, and the three Busse Woods Dams all have means of routing all or portions of low flows either under or around the spillway segment of the dam. At the Oak Brook structure (Dam 31) flow can be and is frequently routed completely around the spillway via two sluice gates. This is unfortunate since the upstream DOs in this reach of Salt Creek frequently fall below 2.5 mg/1 even during early afternoon hours. A photograph of this dam in the appendix shows no flow over the spillway. Initially during the April 20, 1977, sampling period at this dam, all the flow was being routed through the sluice gates; the average upstream and downstream DOs measured for an hour were 3.8 and 4.2 mg/1, respectively. At the end of an hour, the gates were closed and the spillway was flooded. Use of the spillway for 5 hours increased the average downstream DO to 6.1 mg/1, although the upstream value increased only slightly to 4.3 mg/1. The additional 2 mg/1 of oxygen is sorely needed because immediately downstream are the tailwaters of the Fullersburg Park Dam (No. 32) pool which exhibit severe oxygen depletion.
A bypass channel (see appendix) is available for routing some flows around the Warrenville Dam (No. 44) spillway, and from a water quality point of view this may be desirable since algal blooms have been observed in the area. However, the U.S. Geological Survey would probably object strongly since the head created by the structure provides control for their gaging station located immediately above the dam.
In conclusion, it can be said that most channel dams and weirs studied significantly affect water quality in almost all major study area streams. These effects should be incorporated into any mathematical model dealing with dissolved oxygen. This report has been prepared for use as a preliminary guide for doing this.
34

REFERENCES
1. Butts, T. A., and R. L. Evans. 1978. Sediment oxygen demand studies of selected Northeastern Illinois streams. Illinois State Water Survey Circular 129, Urbana.
2. Butts, T. A., R. L. Evans, and J. B. Stall. 1974. A waste allocation study of selected streams in Illinois. Illinois State Water Survey, Urbana, Contract report prepared for the Illinois EPA.
3. Notes on Water Pollution. 1973. Aeration at weirs. Department of the Environment. Water Research Laboratory, Elder Way, Stevenage, Herts, England, June, No. 61.
4. Butts, T. A., R. L. Evans, and S. Lin. 1975. Water quality features of the upper Illinois waterway. Illinois State Water Survey Report of Investigation 79, Urbana.
5. Holm, H.W. 1977. Colonization of nitrifiers. USEPA Environmental Research Laboratory Quarterly Research Highlights, July-September, Athens, Georgia.
6. Gameson, A. L. H. 1957. Weirs and the aeration of rivers. Journal of the Institution of Water Engineers (British), v. 6(11):477.
7. Crevensten, D., and A. Stoddard. 1974. Water quality model of the lower Fox River, Wisconsin. Proceedings, Seventeenth Conference on Great Lakes Research. International Association for Great Lakes Research, Hamilton, Ontario, Canada.
8. Foree, E. G. 1976. Reaeration and velocity prediction for small streams. American Society of Civil Engineers Journal of the Environmental Engineering Division EE5(102):937.
9. Velz, C. J. 1947. Factors influencing self-purification and their relation to pollution abatement. Sewage Works Journal v. 7(19):629.
10. Kothandaraman, V. 1971. Effects of contaminants on reaeration rates in river water. Journal Water Pollution Control Federation v. 5(43):806.
11. Gameson, A. L. H., K. G. Vandyke, and C. G. Ogden. 1958. The effect of temperature on aeration at weirs. Water and Water Engineering (British) v. 753(62):489.
12. Barrett, M. J., A. L. H. Gameson, and C. G. Ogden. 1960. Aeration studies at four weir systems. Water and Water Engineering v. 775(64):407, September.
13. Committee on Sanitary Engineering Research. 1960. Solubility of atmospheric oxygen in water. American Society of Civil Engineers Journal of the Sanitary Engineering Division, SE7(86):41.
14. Tebbutt, T. H. Y. 1972. Some studies on reaeration in cascades. Water Research (British) 6:297.
35

APPENDIX
OBSERVED DATA, SKETCHES, PHYSICAL DESCRIPTIONS, AND PHOTOGRAPHS OF DAMS
Note. Shaded blocks in the observed data indicate erroneous values.
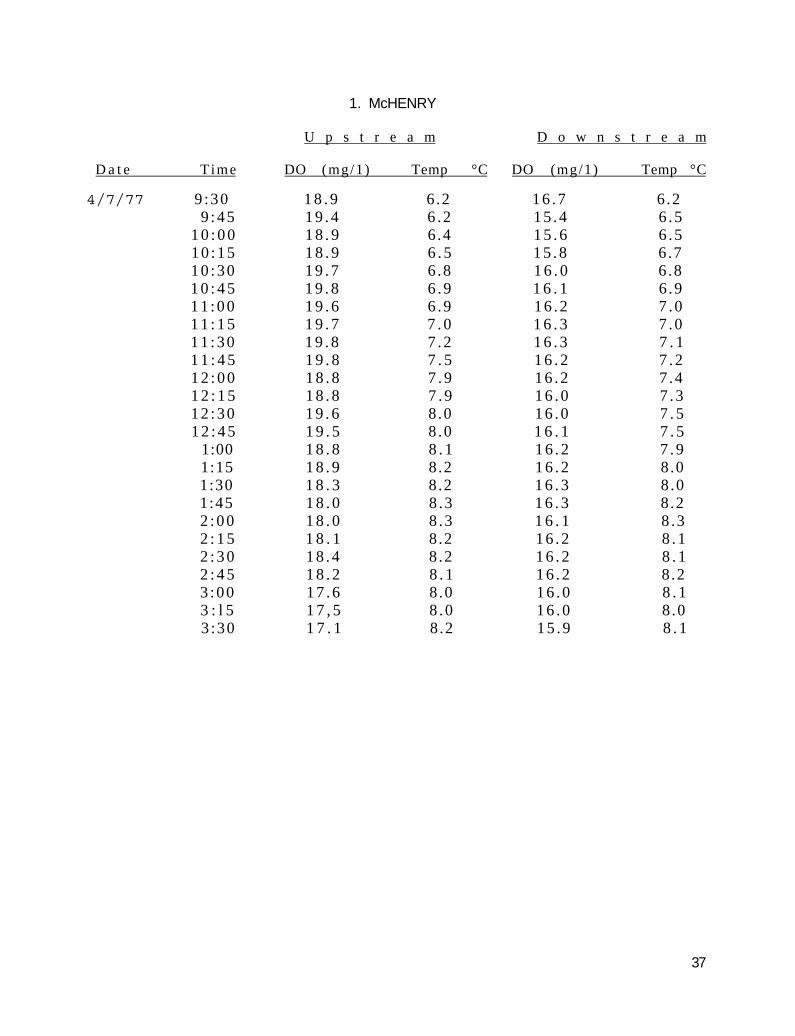
1. McHENRY
U p s t r e a m D o w n s t r e a m
D a t e T ime DO (mg/1) Temp °C DO (mg/1) Temp °C
4/7/77 9 :30 1 8 . 9 6 .2 16 .7 6 .2 9 :45 1 9 . 4 6 .2 15 .4 6 .5
1 0 : 0 0 1 8 . 9 6 .4 1 5 . 6 6 .5 10 :15 1 8 . 9 6 . 5 1 5 . 8 6 .7 10 :30 1 9 . 7 6 .8 1 6 . 0 6 .8 1 0 : 4 5 1 9 . 8 6 .9 1 6 . 1 6 .9 1 1 : 0 0 1 9 . 6 6 .9 16 .2 7 .0 1 1 : 1 5 1 9 . 7 7 . 0 1 6 . 3 7 .0 1 1 : 3 0 1 9 . 8 7 .2 1 6 . 3 7 . 1 1 1 : 4 5 1 9 . 8 7 . 5 1 6 . 2 7 .2 1 2 : 0 0 1 8 . 8 7 . 9 16 .2 7 .4 1 2 : 1 5 1 8 . 8 7 . 9 1 6 . 0 7 .3 12 :30 1 9 . 6 8 .0 1 6 . 0 7 . 5 1 2 : 4 5 1 9 . 5 8 .0 1 6 . 1 7 . 5
1:00 1 8 . 8 8 . 1 1 6 . 2 7 .9 1:15 1 8 . 9 8 .2 1 6 . 2 8 .0 1:30 1 8 . 3 8 .2 1 6 . 3 8 .0 1:45 1 8 . 0 8 .3 1 6 . 3 8 .2 2 : 0 0 1 8 . 0 8 .3 1 6 . 1 8 .3 2 : 1 5 1 8 . 1 8 .2 16 .2 8 . 1 2 : 3 0 1 8 . 4 8 .2 1 6 . 2 8 . 1 2 : 4 5 1 8 . 2 8 . 1 1 6 . 2 8 .2 3 :00 1 7 . 6 8 .0 1 6 . 0 8 . 1 3 : l 5 1 7 , 5 8 .0 1 6 . 0 8 .0 3 :30 1 7 . 1 8 .2 15 .9 8 . 1
37

1. MCHENRY
Stream: Fox River Location: Below McHenry; Mile 98.94 Type: Broad Crested Step Material: Stone Slab Face-Reinforced Concrete Condition: Good Shape: Bowed (Circular) Length: 282' on curve Comments: Picturesque structure. Layout includes five steel gates,
small boat locks, and spillway. Discharge at normal flows or less occurs primarily over the spillway with some through the gates.
38
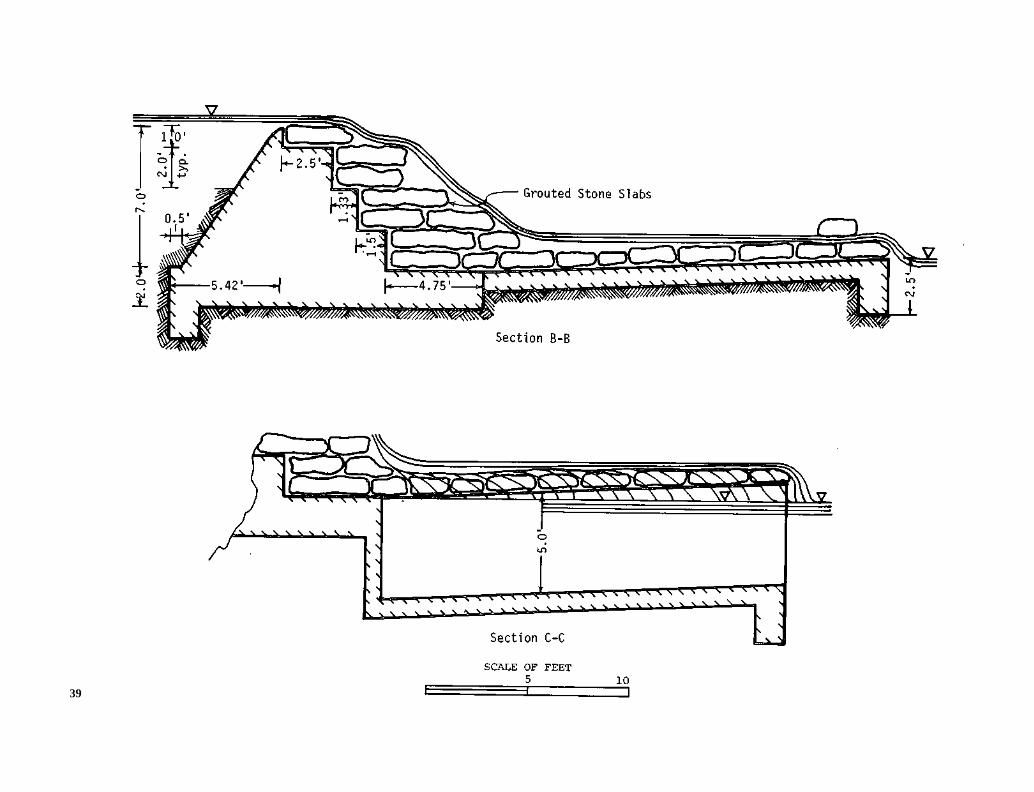
39
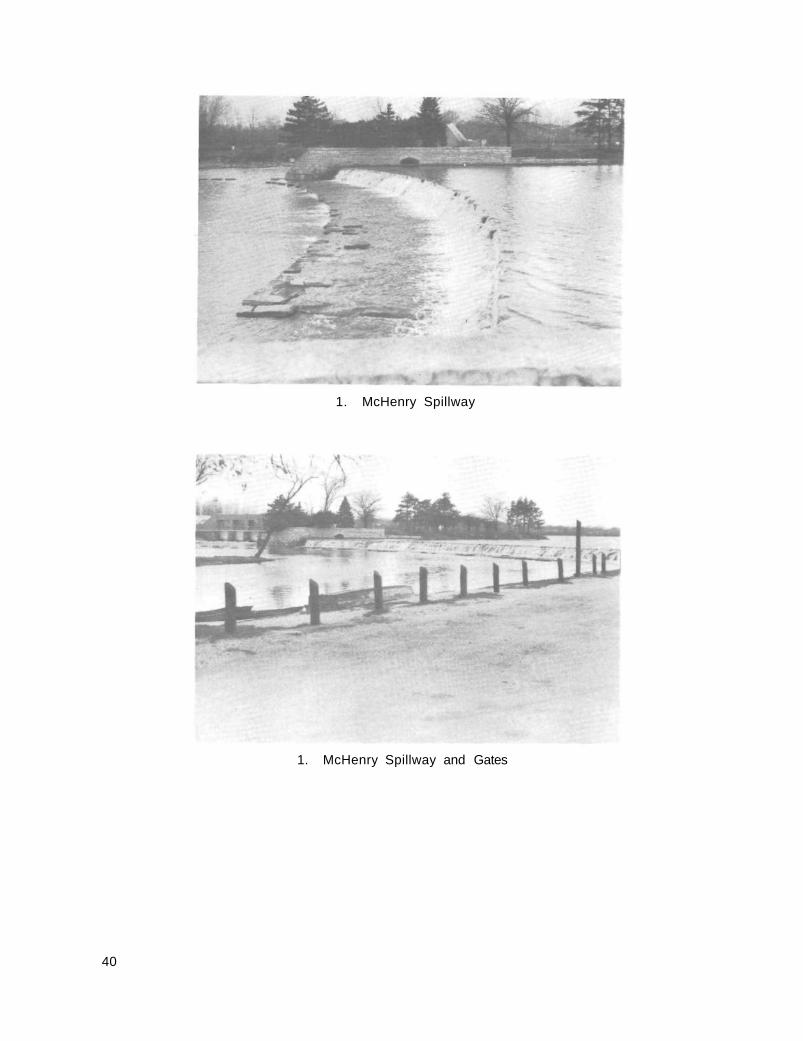
1. McHenry Spillway
1. McHenry Spillway and Gates
40

2. ALGONQUIN
U p s t r e a m D o w n s t r e a m
Date Time DO (mg/1) Temp °C DO (mg/1) Temp °C
4 / 7 / 7 7 9 :00 1 8 . 1 7 . 0 1 8 . 2 6.2 9 : 1 5 1 6 . 5 7 . 0 1 7 . 4 6 .3 9 :30 1 5 . 6 7 . 0 1 7 . 6 6 .3 9 :45 1 4 . 8 . 7 . 1 17 .4 6.4
1 0 : 0 0 1 4 . 5 7 .2 1 7 . 5 6 .6 1 0 : 1 5 1 4 . 5 7 . 2 17 .7 6 .6 1 0 : 3 0 1 4 . 6 7 .4 1 7 . 9 6 .8 1 0 : 4 5 1 4 . 8 7 . 5 1 8 . 2 6.. 9 1 1 : 0 0 1 2 . 1 7 . 5 1 7 . 9 6 .9 1 1 : 1 5 1 2 . 0 7 .7 1 8 . 4 6 .9 1 1 : 3 0 1 1 . 9 7 . 8 1 8 . 5 7 . 0 1 1 : 4 5 1 2 . 3 7 . 9 1 8 . 6 7 . 1 1 2 : 0 0 1 2 . 9 8 .0 1 9 . 2 7.1 1 2 : 1 5 1 3 . 4 8 . 1 1 9 . 5 7 . 1 1 2 : 3 0 1 3 . 8 8 . 1 1 9 . 8 7 .4 1 2 : 4 5 1 4 . 0 8 .2 2 0 . 0 7 . 5
1:00 1 4 . 7 8 .3 2 0 . 0 7 .7 1:15 1 5 . 3 8 . 3 2 0 . 0 7 .8 1:30 1 5 . 6 8 .5 2 0 . 0 7 .8 1 :45 1 5 . 6 8 . 5 2 0 . 0 7 .8 2 : 0 0 1 5 . 8 8 . 5 2 0 . 0 7 . 9 2 : 1 5 1 5 . 9 8 .5 2 0 . 0 7 .9 2 :30 1 7 . 2 8 .5 2 0 . 0 7 . 9 2 : 4 5 1 8 . 0 8 .8 2 0 . 0 7 .9 3 :00 1 9 . 2 8 .9 2 0 . 0 8 .0
41
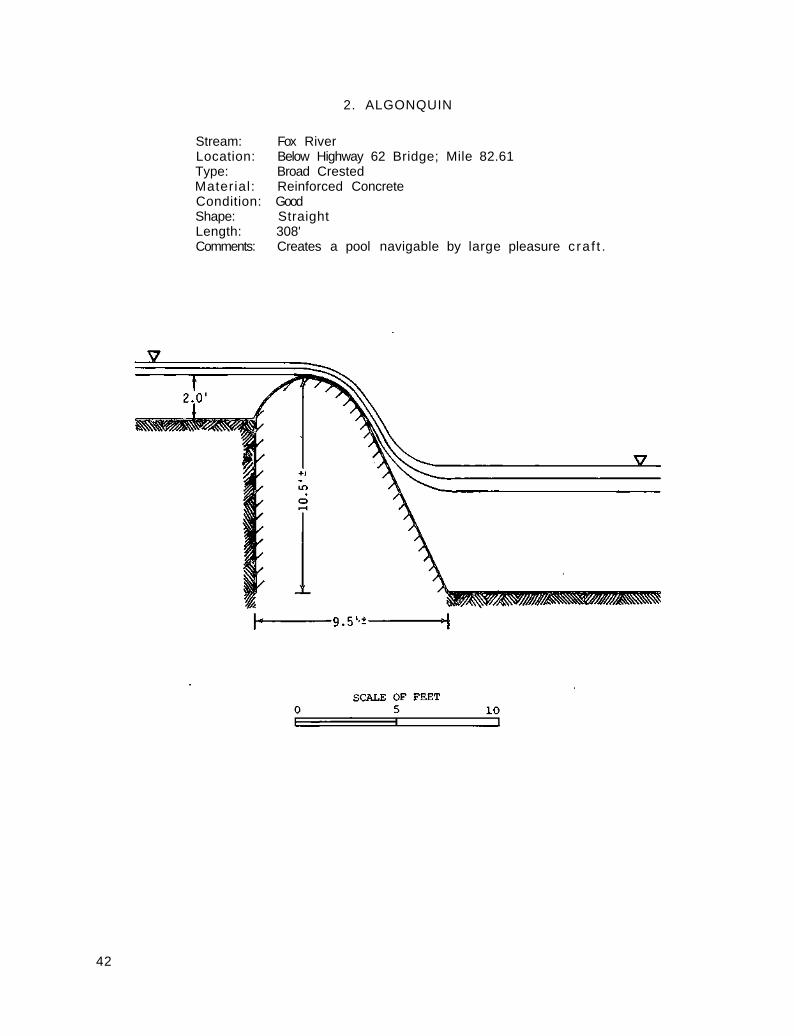
2. ALGONQUIN
Stream: Fox River Location: Below Highway 62 Bridge; Mile 82.61 Type: Broad Crested Material: Reinforced Concrete Condition: Good Shape: Straight Length: 308' Comments: Creates a pool navigable by large pleasure c ra f t .
42

2. Algonquin
3. Carpentersville
43
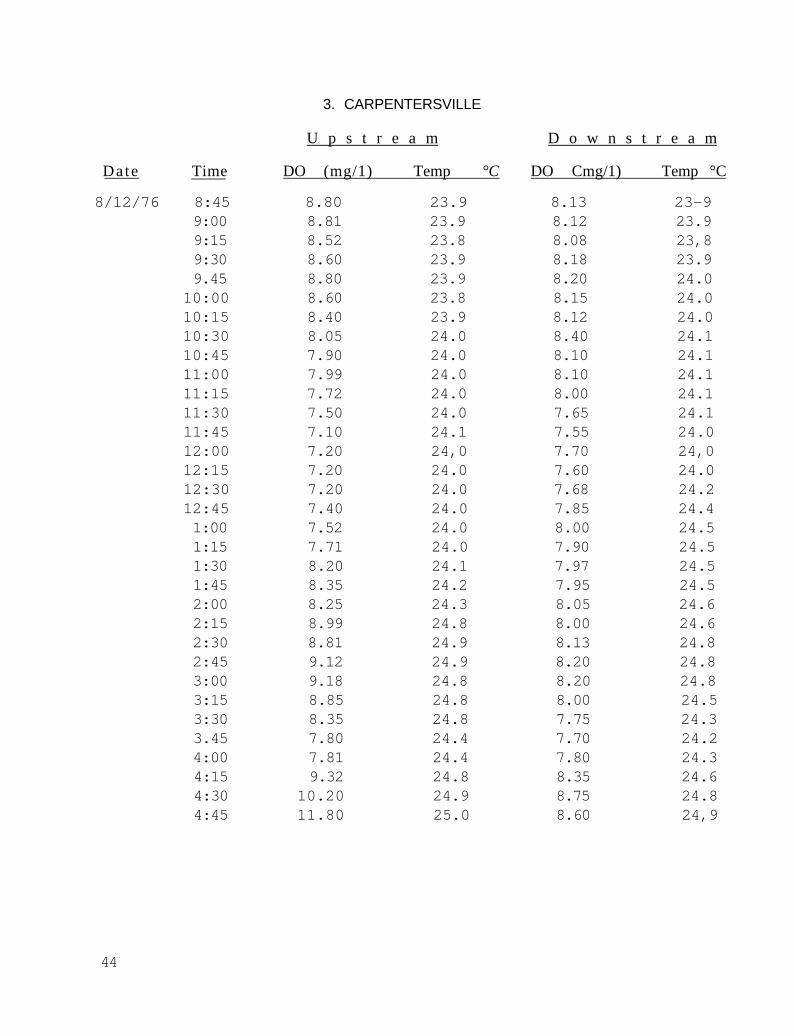
3. CARPENTERSVILLE
U p s t r e a m D o w n s t r e a m
Date Time DO (mg/1) Temp °C DO Cmg/1) Temp °C
8/12/76 8:45 8.80 23.9 8.13 23-9 9:00 8.81 23.9 8.12 23.9 9:15 8.52 23.8 8.08 23,8 9:30 8.60 23.9 8.18 23.9 9.45 8.80 23.9 8.20 24.0
10:00 8.60 23.8 8.15 24.0 10:15 8.40 23.9 8.12 24.0 10:30 8.05 24.0 8.40 24.1 10:45 7.90 24.0 8.10 24.1 11:00 7.99 24.0 8.10 24.1 11:15 7.72 24.0 8.00 24.1 11:30 7.50 24.0 7.65 24.1 11:45 7.10 24.1 7.55 24.0 12:00 7.20 24,0 7.70 24,0 12:15 7.20 24.0 7.60 24.0 12:30 7.20 24.0 7.68 24.2 12:45 7.40 24.0 7.85 24.4 1:00 7.52 24.0 8.00 24.5 1:15 7.71 24.0 7.90 24.5 1:30 8.20 24.1 7.97 24.5 1:45 8.35 24.2 7.95 24.5 2:00 8.25 24.3 8.05 24.6 2:15 8.99 24.8 8.00 24.6 2:30 8.81 24.9 8.13 24.8 2:45 9.12 24.9 8.20 24.8 3:00 9.18 24.8 8.20 24.8 3:15 8.85 24.8 8.00 24.5 3:30 8.35 24.8 7.75 24.3 3.45 7.80 24.4 7.70 24.2 4:00 7.81 24.4 7.80 24.3 4:15 9.32 24.8 8.35 24.6 4:30 10.20 24.9 8.75 24.8 4:45 11.80 25.0 8.60 24,9
44
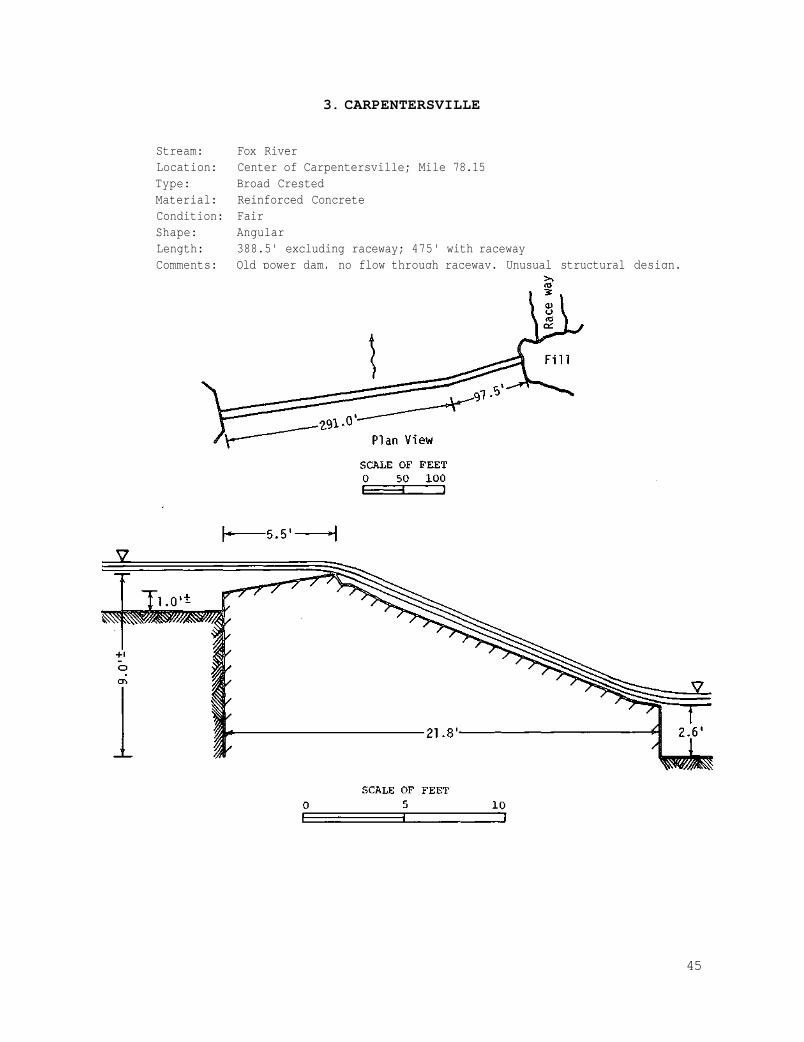
3. CARPENTERSVILLE
Stream: Fox River Location: Center of Carpentersville; Mile 78.15 Type: Broad Crested Material: Reinforced Concrete Condition: Fair Shape: Angular Length: 388.5' excluding raceway; 475' with raceway Comments: Old power dam, no flow through raceway. Unusual structural design.
45
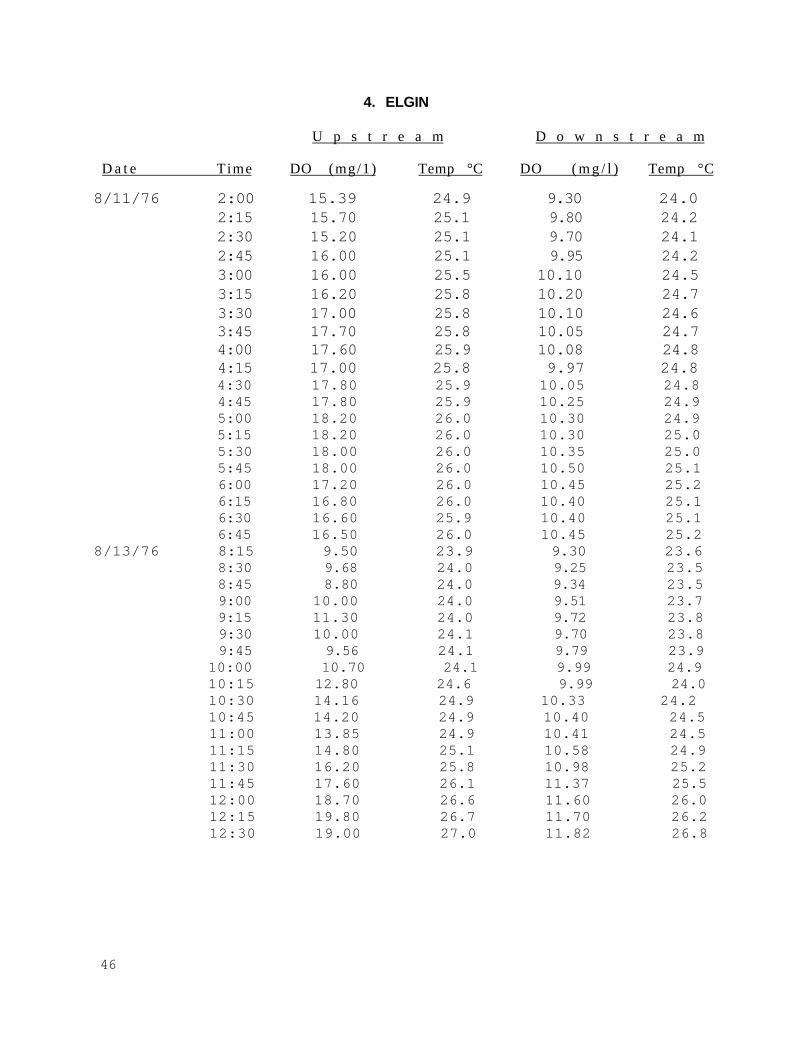
4. ELGIN
U p s t r e a m D o w n s t r e a m
D a t e Time DO (mg/1) Temp °C DO ( m g / l ) Temp °C
8/11/76 2:00 15.39 24.9 9.30 24.0 2:15 15.70 25.1 9.80 24.2 2:30 15.20 25.1 9.70 24.1 2:45 16.00 25.1 9.95 24.2 3:00 16.00 25.5 10.10 24.5 3:15 16.20 25.8 10.20 24.7 3:30 17.00 25.8 10.10 24.6 3:45 17.70 25.8 10.05 24.7 4:00 17.60 25.9 10.08 24.8 4:15 17.00 25.8 9.97 24.8 4:30 17.80 25.9 10.05 24.8 4:45 17.80 25.9 10.25 24.9 5:00 18.20 26.0 10.30 24.9 5:15 18.20 26.0 10.30 25.0 5:30 18.00 26.0 10.35 25.0 5:45 18.00 26.0 10.50 25.1 6:00 17.20 26.0 10.45 25.2 6:15 16.80 26.0 10.40 25.1 6:30 16.60 25.9 10.40 25.1 6:45 16.50 26.0 10.45 25.2
8/13/76 8:15 9.50 23.9 9.30 23.6 8:30 9.68 24.0 9.25 23.5 8:45 8.80 24.0 9.34 23.5 9:00 10.00 24.0 9.51 23.7 9:15 11.30 24.0 9.72 23.8 9:30 10.00 24.1 9.70 23.8 9:45 9.56 24.1 9.79 23.9
10:00 10.70 24.1 9.99 24.910:15 12.80 24.6 9.99 24.010:30 14.16 24.9 10.33 24.2 10:45 14.20 24.9 10.40 24.5 11:00 13.85 24.9 10.41 24.5 11:15 14.80 25.1 10.58 24.9 11:30 16.20 25.8 10.98 25.2 11:45 17.60 26.1 11.37 25.5 12:00 18.70 26.6 11.60 26.0 12:15 19.80 26.7 11.70 26.2 12:30 19.00 27.0 11.82 26.8
46
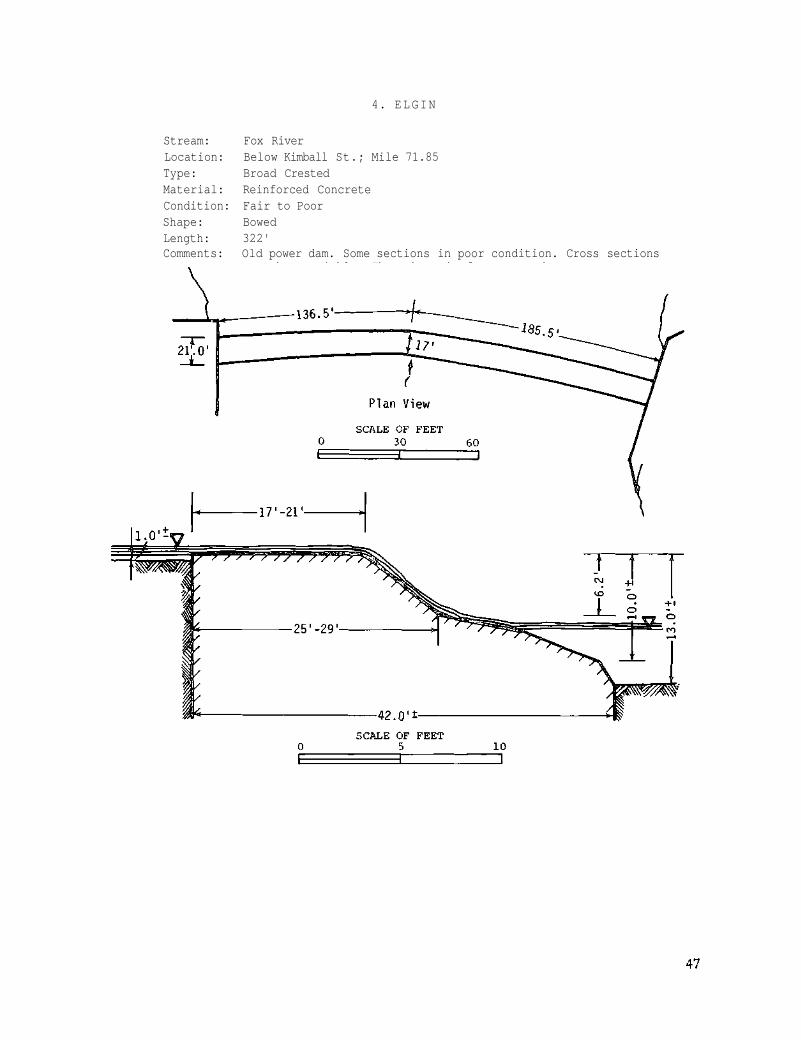
4. ELGIN
Stream: Fox River Location: Below Kimball St.; Mile 71.85 Type: Broad Crested Material: Reinforced Concrete Condition: Fair to Poor Shape: Bowed Length: 322' Comments: Old power dam. Some sections in poor condition. Cross sections
somewhat variable. That shown is for east end.

4. Elgin
5. South Elgin
48

5. SOUTH ELGIN
U p s t r e a m D o w n s t r e a m
Date Time DO (mg/1) Temp °C DO (mg/1) Temp °C
8 /17 /76 8:00 9 .80 2 0 . 8 9 .30 2 0 . 5 8:15 1 0 . 1 5 2 0 . 8 9 .30 2 0 . 5 8:30 1 0 . 1 0 2 0 . 8 9 .30 2 0 . 5 8:45 1 0 . 6 0 2 0 . 9 9 .30 2 0 . 5 9:00 1 0 . 5 0 2 1 . 0 9 .70 20 .8 9:15 1 0 . 2 0 2 1 . 0 9 .80 2 1 . 0 9:30 1 0 . 1 0 2 1 . 0 9 .80 2 1 . 0 9 :45 1 0 . 3 0 2 1 . 1 9 .90 2 1 . 2
10 :00 9 .50 2 1 . 0 9 .90 2 1 . 2 1 0 : 1 5 9 .80 2 1 . 0 9 .90 2 1 . 2 10 :30 9 .60 2 1 . 0 9 .75 2 1 . 3 1 0 : 4 5 1 0 . 0 0 2 1 . 1 9 .80 2 1 . 3 11 :00 9 .80 2 1 . 0 9 . 7 5 21 .2 1 1 : 1 5 9 .60 2 1 . 0 9 .70 2 1 . 2 11 :30 9 .60 2 1 . 1 9 .70 2 1 . 2 11 :45 1 0 . 1 0 2 1 . 3 9 .70 2 1 . 2 12 :00 1 0 . 0 0 2 1 . 3 9 .70 2 1 . 2 1 2 : 1 5 1 1 . 4 0 2 1 . 9 9 .60 2 1 . 2 12 :30 1 1 . 6 0 2 2 . 0 9 .70 2 1 . 2 1 2 : 4 5 1 1 . 8 0 2 2 . 0 9 .50 21 .2
1:00 1 2 . 4 0 2 2 . 4 9 .62 2 1 . 5 1:15 1 2 . 2 0 22 .4 9 .70 2 1 . 6 1:30 1 2 . 6 0 2 2 . 6 9 .65 21 .6 1:45 1 2 . 8 0 2 2 . 8 9 .60 2 1 . 6 2 :00 1 2 . 6 0 2 2 . 3 9 .79 2 1 . 9 2 :15 1 2 . 2 0 2 2 . 5 9 .75 21 .6 2 :30 1 3 . 4 0 2 2 . 6 9 . 9 1 2 1 . 9 2 :45 1 3 . 8 0 2 3 . 0 1 0 . 2 0 22 .4 3:00 1 4 . 0 0 2 2 . 8 1 0 . 4 5 2 2 . 5 3 :15 1 5 . 1 0 2 3 . 4 1 0 . 6 0 2 2 . 6 3:30 1 6 . 8 0 2 4 . 1 1 0 . 7 5 22 .9 3 :45 1 5 . 6 0 2 4 . 0 1 0 . 2 5 22 .6 4 :00 1 4 . 2 0 2 3 . 8 9 .95 22 .6
49
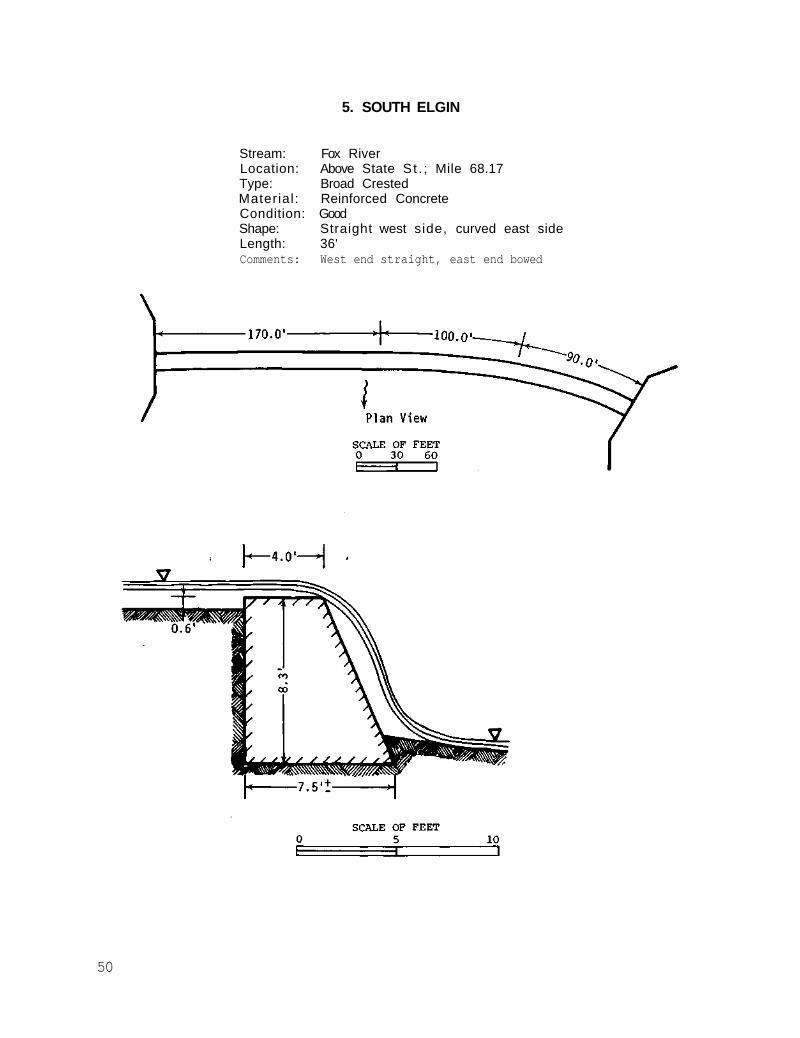
5. SOUTH ELGIN
Stream: Fox River Location: Above State St . ; Mile 68.17 Type: Broad Crested Material: Reinforced Concrete Condition: Good Shape: Straight west side, curved east side Length: 36' Comments: West end straight, east end bowed
50
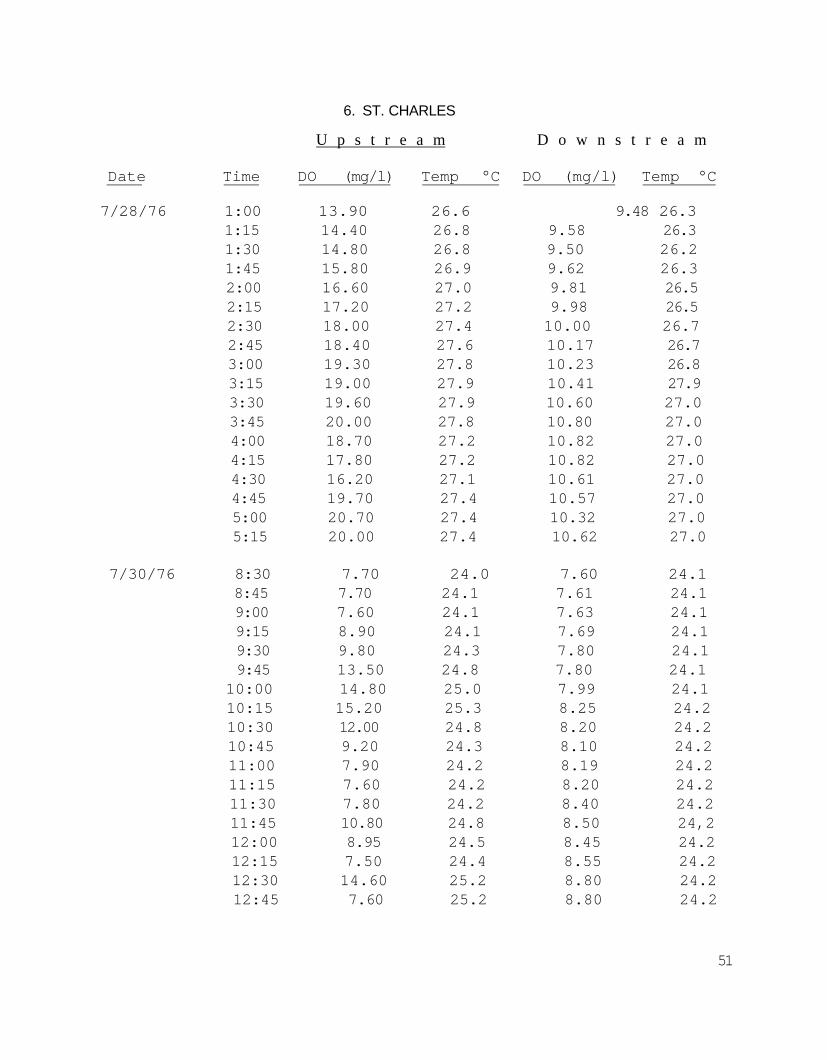
6. ST. CHARLES
U p s t r e a m D o w n s t r e a m
Date Time DO (mg/l) Temp °C DO (mg/l) Temp °C
7/28/76 1:00 13.90 26.6 9.48 26.3 1:15 14.40 26.8 9.58 26.3 1:30 14.80 26.8 9.50 26.2 1:45 15.80 26.9 9.62 26.3 2:00 16.60 27.0 9.81 26.5 2:15 17.20 27.2 9.98 26.5 2:30 18.00 27.4 10.00 26.7 2:45 18.40 27.6 10.17 26.7 3:00 19.30 27.8 10.23 26.8 3:15 19.00 27.9 10.41 27.9 3:30 19.60 27.9 10.60 27.0 3:45 20.00 27.8 10.80 27.0 4:00 18.70 27.2 10.82 27.0 4:15 17.80 27.2 10.82 27.0 4:30 16.20 27.1 10.61 27.0 4:45 19.70 27.4 10.57 27.0 5:00 20.70 27.4 10.32 27.0 5:15 20.00 27.4 10.62 27.0
7/30/76 8:30 7.70 24.0 7.60 24.1 8:45 7.70 24.1 7.61 24.1 9:00 7.60 24.1 7.63 24.1 9:15 8.90 24.1 7.69 24.1 9:30 9.80 24.3 7.80 24.1 9:45 13.50 24.8 7.80 24.1
10:00 14.80 25.0 7.99 24.1 10:15 15.20 25.3 8.25 24.2 10:30 12.00 24.8 8.20 24.2 10:45 9.20 24.3 8.10 24.2 11:00 7.90 24.2 8.19 24.2 11:15 7.60 24.2 8.20 24.2 11:30 7.80 24.2 8.40 24.2 11:45 10.80 24.8 8.50 24,2 12:00 8.95 24.5 8.45 24.2 12:15 7.50 24.4 8.55 24.2 12:30 14.60 25.2 8.80 24.2 12:45 7.60 25.2 8.80 24.2
51

6. ST. CHARLES
Stream: Fox River Location: Above Highway 64 Bridge; Mile 60.65 Type: Ogee Material: Reinforced Concrete Condition: Good Shape: Straight Length: 293.5' Comments: Surveying of cross section d i f f i c u l t . Sketch constitutes a
good approximation. Large f i sh ladder at east end.
52

6. St. Charles
7. Geneva
53
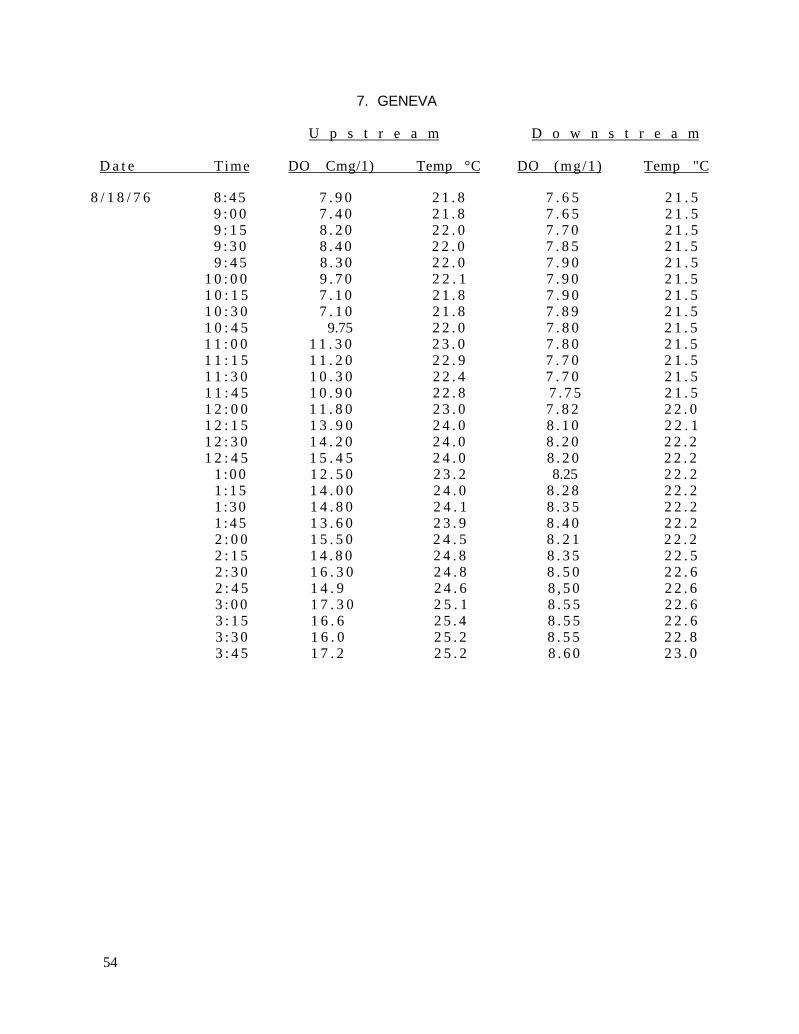
7. GENEVA
U p s t r e a m D o w n s t r e a m
D a t e Time DO Cmg/1) Temp °C DO (mg/1) Temp "C
8 / 1 8 / 7 6 8 : 4 5 7 . 9 0 2 1 . 8 7 . 6 5 2 1 . 5 9 : 0 0 7 . 4 0 2 1 . 8 7 . 6 5 2 1 . 5 9 : 1 5 8 . 2 0 2 2 . 0 7 . 7 0 2 1 . 5 9 : 3 0 8 . 4 0 2 2 . 0 7 . 8 5 2 1 . 5 9 : 4 5 8 . 3 0 2 2 . 0 7 . 9 0 2 1 . 5
1 0 : 0 0 9 . 7 0 2 2 . 1 7 . 9 0 2 1 . 5 1 0 : 1 5 7 . 1 0 2 1 . 8 7 . 9 0 2 1 . 5 1 0 : 3 0 7 . 1 0 2 1 . 8 7 . 8 9 2 1 . 5 1 0 : 4 5 9.75 2 2 . 0 7 . 8 0 2 1 . 5 1 1 : 0 0 1 1 . 3 0 2 3 . 0 7 . 8 0 2 1 . 5 1 1 : 1 5 1 1 . 2 0 2 2 . 9 7 . 7 0 2 1 . 5 1 1 : 3 0 1 0 . 3 0 2 2 . 4 7 . 7 0 2 1 . 5 1 1 : 4 5 1 0 . 9 0 2 2 . 8 7 . 7 5 2 1 . 5 1 2 : 0 0 1 1 . 8 0 2 3 . 0 7 . 8 2 2 2 . 0 1 2 : 1 5 1 3 . 9 0 2 4 . 0 8 . 1 0 2 2 . 1 1 2 : 3 0 1 4 . 2 0 2 4 . 0 8 . 2 0 2 2 . 2 1 2 : 4 5 1 5 . 4 5 2 4 . 0 8 . 2 0 2 2 . 2
1 : 0 0 1 2 . 5 0 2 3 . 2 8.25 2 2 . 2 1 : 1 5 1 4 . 0 0 2 4 . 0 8 . 2 8 2 2 . 2 1 : 3 0 1 4 . 8 0 2 4 . 1 8 . 3 5 2 2 . 2 1 : 4 5 1 3 . 6 0 2 3 . 9 8 . 4 0 2 2 . 2 2 : 0 0 1 5 . 5 0 2 4 . 5 8 . 2 1 2 2 . 2 2 : 1 5 1 4 . 8 0 2 4 . 8 8 . 3 5 2 2 . 5 2 : 3 0 1 6 . 3 0 2 4 . 8 8 . 5 0 2 2 . 6 2 : 4 5 1 4 . 9 2 4 . 6 8 , 5 0 2 2 . 6 3 : 0 0 1 7 . 3 0 2 5 . 1 8 . 5 5 2 2 . 6 3 : 1 5 1 6 . 6 2 5 . 4 8 . 5 5 2 2 . 6 3 : 3 0 1 6 . 0 2 5 . 2 8 . 5 5 2 2 . 8 3 : 4 5 1 7 . 2 2 5 . 2 8 . 6 0 2 3 . 0
54
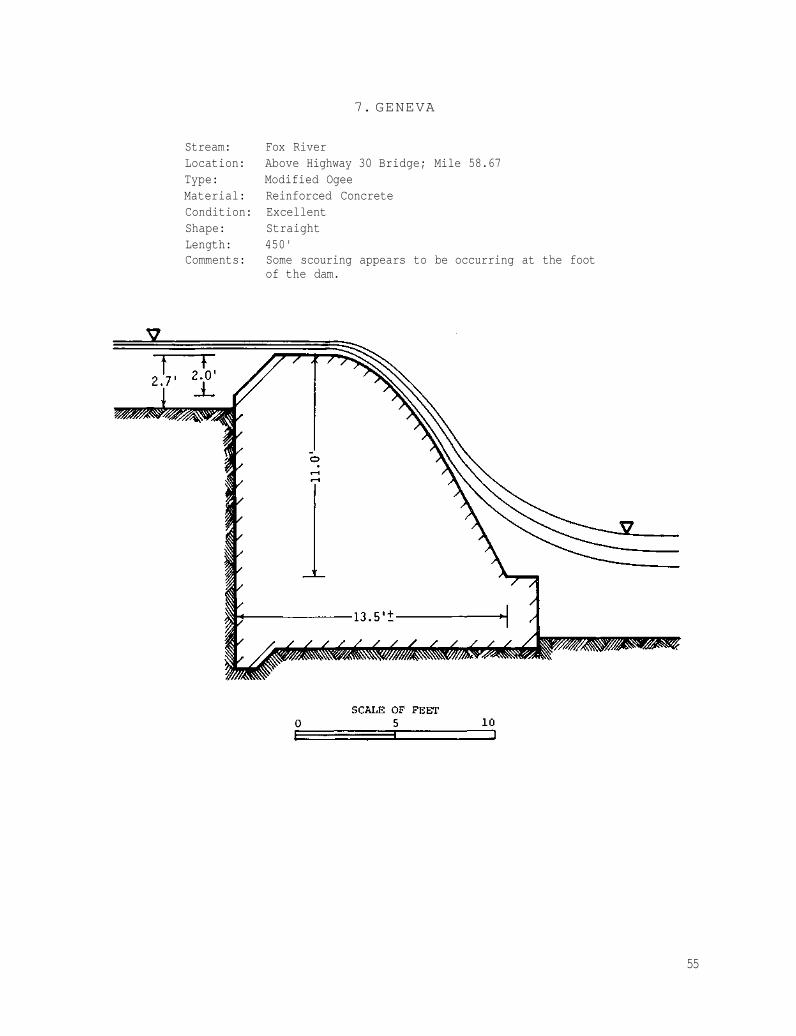
7. GENEVA
Stream: Fox River Location: Above Highway 30 Bridge; Mile 58.67 Type: Modified Ogee Material: Reinforced Concrete Condition: Excellent Shape: Straight Length: 450' Comments: Some scouring appears to be occurring at the foot
of the dam.
55
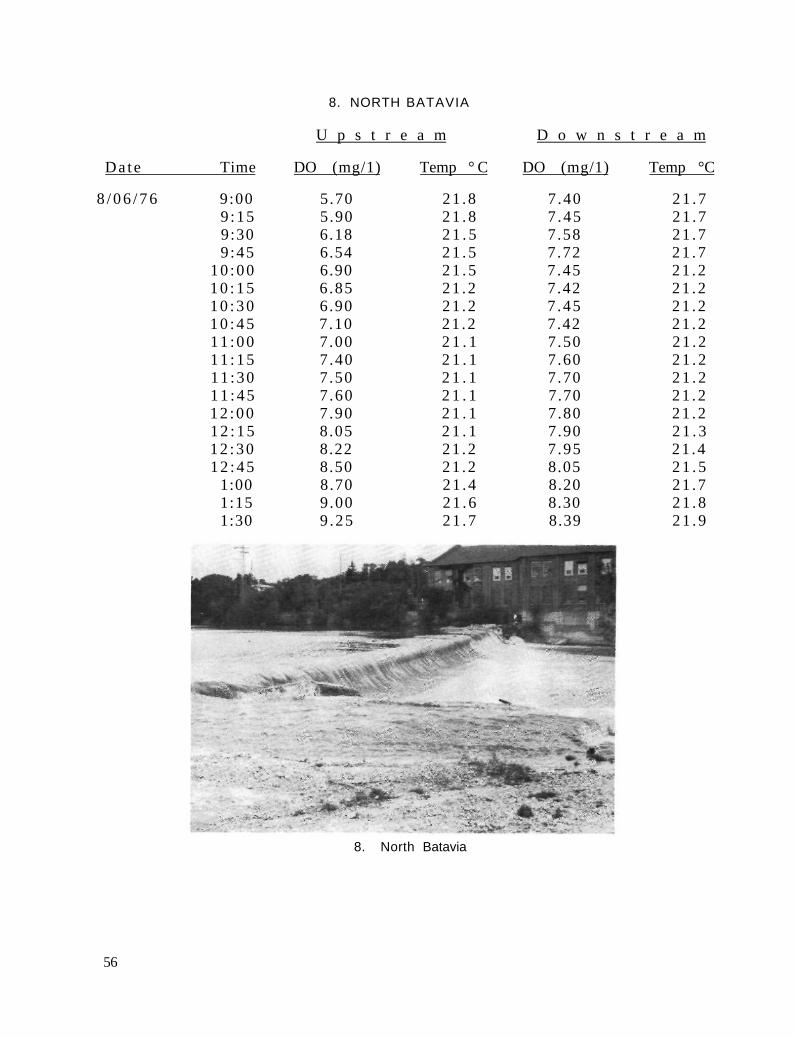
8. NORTH BATAVIA
U p s t r e a m D o w n s t r e a m
D a t e Time DO (mg/1) Temp ° C DO (mg/1) Temp °C
8 / 0 6 / 7 6 9:00 5.70 21 .8 7 .40 2 1 . 7 9 :15 5.90 2 1 . 8 7 .45 2 1 . 7 9:30 6.18 2 1 . 5 7 .58 21 .7 9 :45 6.54 2 1 . 5 7 .72 2 1 . 7
10 :00 6.90 2 1 . 5 7 .45 2 1 . 2 1 0 : 1 5 6 .85 21 .2 7 .42 2 1 . 2 1 0 : 3 0 6.90 21 .2 7 .45 2 1 . 2 1 0 : 4 5 7 .10 21 .2 7.42 2 1 . 2 11 :00 7 .00 2 1 . 1 7 .50 2 1 . 2 1 1 : 1 5 7 .40 2 1 . 1 7 .60 2 1 . 2 11 :30 7 .50 2 1 . 1 7 .70 2 1 . 2 1 1 : 4 5 7 .60 2 1 . 1 7.70 2 1 . 2 12 :00 7 .90 2 1 . 1 7.80 2 1 . 2 1 2 : 1 5 8.05 2 1 . 1 7.90 2 1 . 3 12 :30 8.22 21 .2 7 .95 21 .4 1 2 : 4 5 8.50 21 .2 8.05 2 1 . 5
1:00 8.70 21 .4 8.20 21 .7 1:15 9.00 2 1 . 6 8.30 2 1 . 8 1:30 9 .25 21 .7 8.39 2 1 . 9
8. North Batavia
56
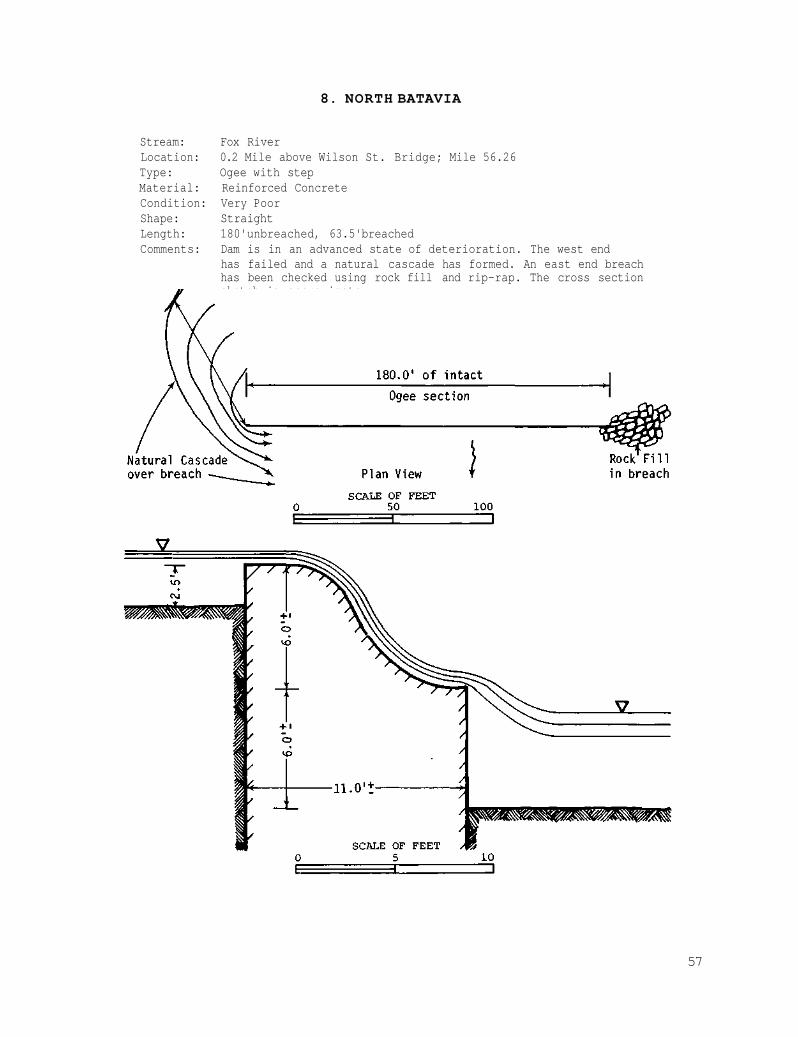
8. NORTH BATAVIA
Stream: Fox River Location: 0.2 Mile above Wilson St. Bridge; Mile 56.26 Type: Ogee with step Material: Reinforced Concrete Condition: Very Poor Shape: Straight Length: 180'unbreached, 63.5'breached Comments: Dam is in an advanced state of deterioration. The west end
has failed and a natural cascade has formed. An east end breach has been checked using rock fill and rip-rap. The cross section sketch is approximate.
57
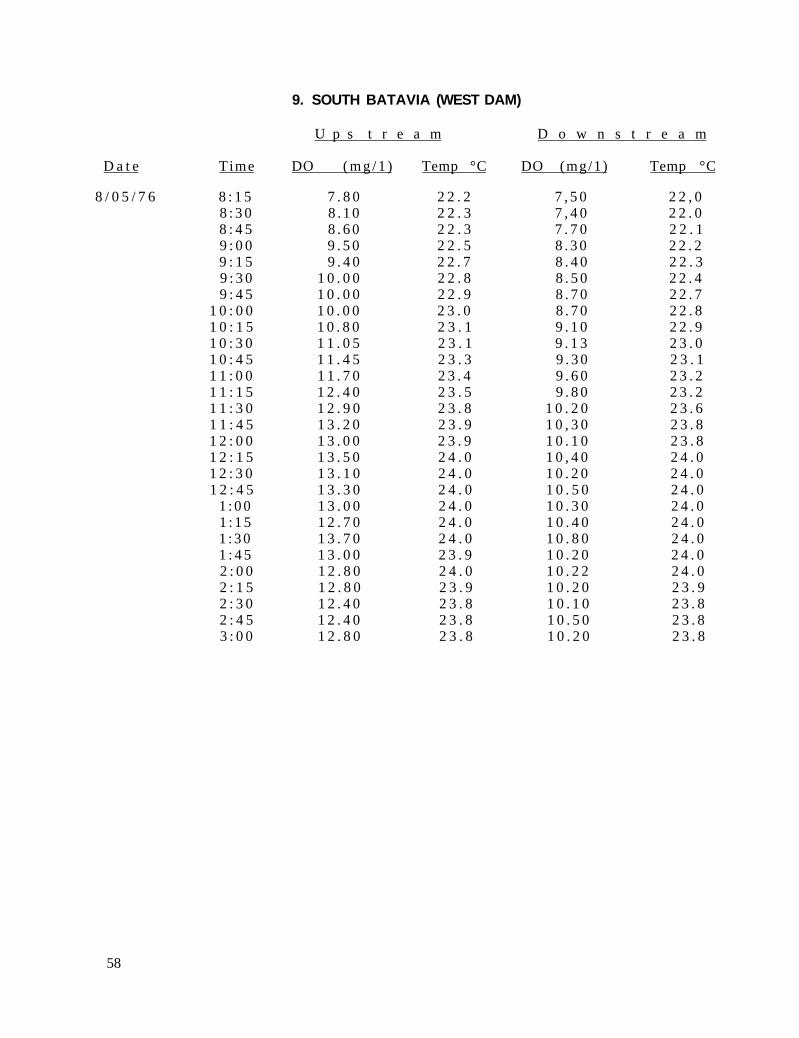
9. SOUTH BATAVIA (WEST DAM)
U p s t r e a m D o w n s t r e a m
D a t e Time DO ( m g / 1 ) Temp °C DO (mg/1) Temp °C
8 / 0 5 / 7 6 8 : 1 5 7 . 8 0 2 2 . 2 7 , 5 0 2 2 , 0 8 : 3 0 8 . 1 0 2 2 . 3 7 , 4 0 2 2 . 0 8 : 4 5 8 . 6 0 2 2 . 3 7 . 7 0 2 2 . 1 9 : 0 0 9 . 5 0 2 2 . 5 8 . 3 0 2 2 . 2 9 : 1 5 9 . 4 0 2 2 . 7 8 . 4 0 2 2 . 3 9 : 3 0 1 0 . 0 0 2 2 . 8 8 . 5 0 2 2 . 4 9 : 4 5 1 0 . 0 0 2 2 . 9 8 . 7 0 2 2 . 7
1 0 : 0 0 1 0 . 0 0 2 3 . 0 8 . 7 0 2 2 . 8 1 0 : 1 5 1 0 . 8 0 2 3 . 1 9 . 1 0 2 2 . 9 1 0 : 3 0 1 1 . 0 5 2 3 . 1 9 . 1 3 2 3 . 0 1 0 : 4 5 1 1 . 4 5 2 3 . 3 9 . 3 0 2 3 . 1 1 1 : 0 0 1 1 . 7 0 2 3 . 4 9 . 6 0 2 3 . 2 1 1 : 1 5 1 2 . 4 0 2 3 . 5 9 . 8 0 2 3 . 2 1 1 : 3 0 1 2 . 9 0 2 3 . 8 1 0 . 2 0 2 3 . 6 1 1 : 4 5 1 3 . 2 0 2 3 . 9 1 0 , 3 0 2 3 . 8 1 2 : 0 0 1 3 . 0 0 2 3 . 9 1 0 . 1 0 2 3 . 8 1 2 : 1 5 1 3 . 5 0 2 4 . 0 1 0 , 4 0 2 4 . 0 1 2 : 3 0 1 3 . 1 0 2 4 . 0 1 0 . 2 0 2 4 . 0 1 2 : 4 5 1 3 . 3 0 2 4 . 0 1 0 . 5 0 2 4 . 0
1 : 0 0 1 3 . 0 0 2 4 . 0 1 0 . 3 0 2 4 . 0 1 : 1 5 1 2 . 7 0 2 4 . 0 1 0 . 4 0 2 4 . 0 1 : 3 0 1 3 . 7 0 2 4 . 0 1 0 . 8 0 2 4 . 0 1 : 4 5 1 3 . 0 0 2 3 . 9 1 0 . 2 0 2 4 . 0 2 : 0 0 1 2 . 8 0 2 4 . 0 1 0 . 2 2 2 4 . 0 2 : 1 5 1 2 . 8 0 2 3 . 9 1 0 . 2 0 2 3 . 9 2 : 3 0 1 2 . 4 0 2 3 . 8 1 0 . 1 0 2 3 . 8 2 : 4 5 1 2 . 4 0 2 3 . 8 1 0 . 5 0 2 3 . 8 3 : 0 0 1 2 . 8 0 2 3 . 8 1 0 . 2 0 2 3 . 8
58
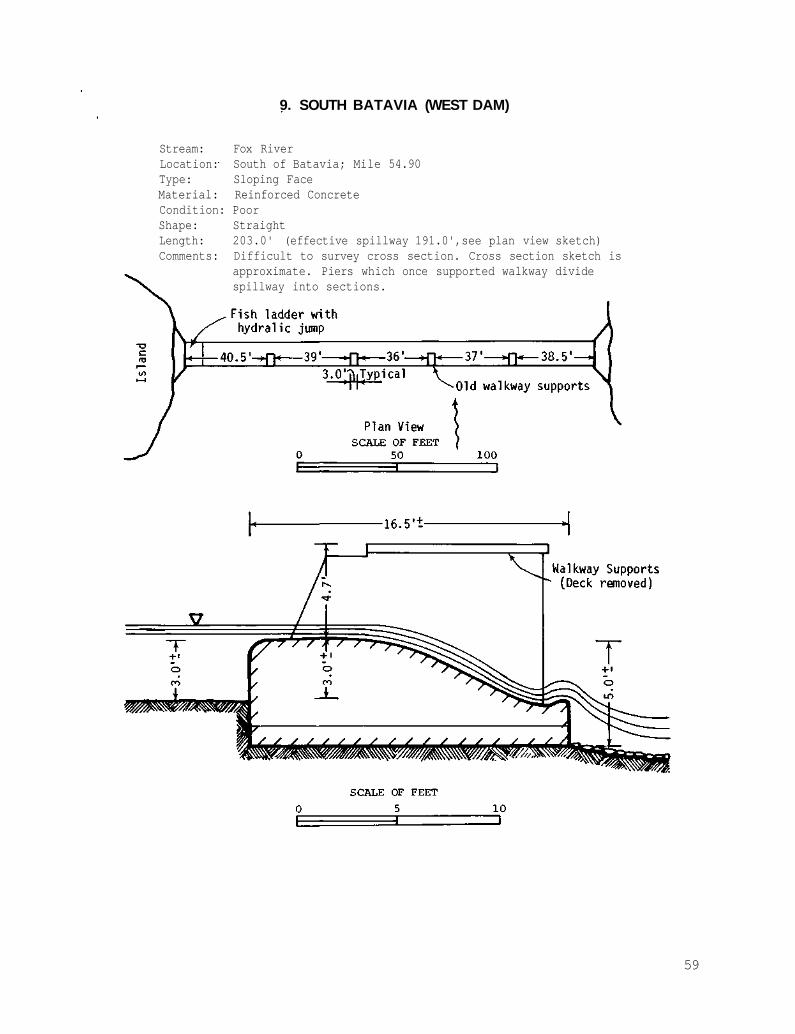
9. SOUTH BATAVIA (WEST DAM)
Stream: Fox River Location: South of Batavia; Mile 54.90 Type: Sloping Face Material: Reinforced Concrete Condition: Poor Shape: Straight Length: 203.0' (effective spillway 191.0',see plan view sketch) Comments: Difficult to survey cross section. Cross section sketch is
approximate. Piers which once supported walkway divide spillway into sections.
59

9. South Batavia (West Dam)
9A. South Batavia (East Dam)
60
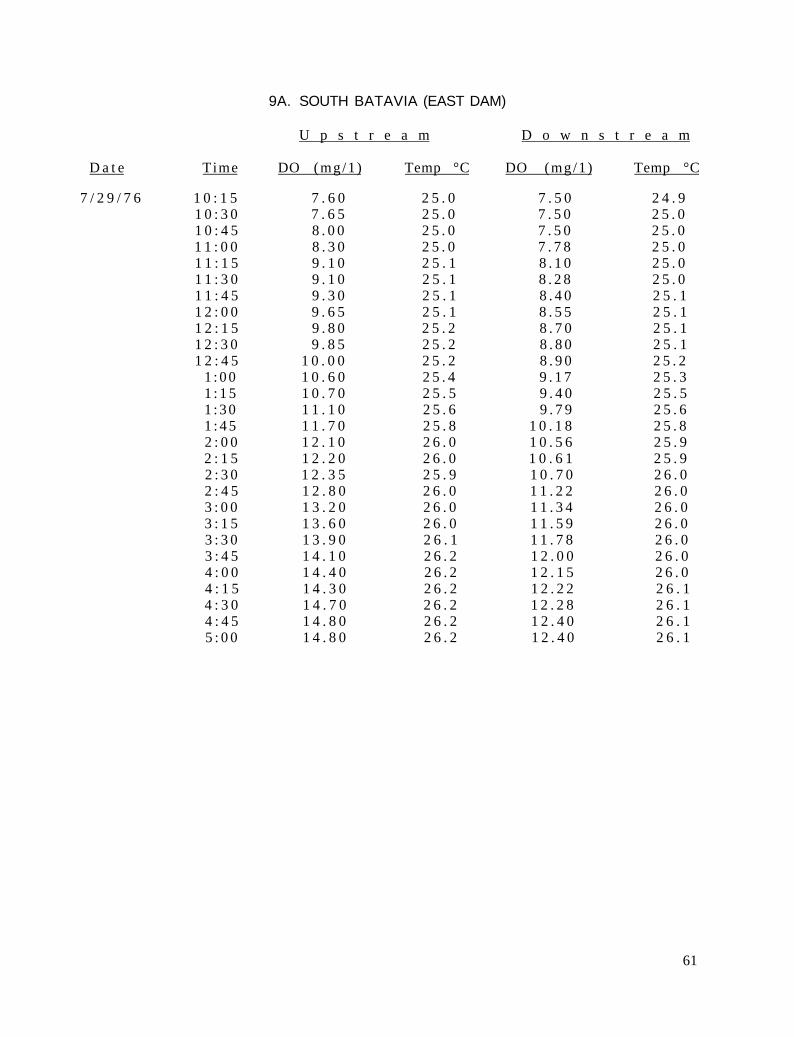
9A. SOUTH BATAVIA (EAST DAM)
U p s t r e a m D o w n s t r e a m
D a t e Time DO (mg/1) Temp °C DO (mg/1) Temp °C
7 / 2 9 / 7 6 1 0 : 1 5 7 . 6 0 2 5 . 0 7 . 5 0 2 4 . 9 1 0 : 3 0 7 . 6 5 2 5 . 0 7 . 5 0 2 5 . 0 1 0 : 4 5 8 . 0 0 2 5 . 0 7 . 5 0 2 5 . 0 1 1 : 0 0 8 . 3 0 2 5 . 0 7 . 7 8 2 5 . 0 1 1 : 1 5 9 . 1 0 2 5 . 1 8 . 1 0 2 5 . 0 1 1 : 3 0 9 . 1 0 2 5 . 1 8 . 2 8 2 5 . 0 1 1 : 4 5 9 . 3 0 2 5 . 1 8 . 4 0 2 5 . 1 1 2 : 0 0 9 . 6 5 2 5 . 1 8 . 5 5 2 5 . 1 1 2 : 1 5 9 . 8 0 2 5 . 2 8 . 7 0 2 5 . 1 1 2 : 3 0 9 . 8 5 2 5 . 2 8 . 8 0 2 5 . 1 1 2 : 4 5 1 0 . 0 0 2 5 . 2 8 . 9 0 2 5 . 2
1 : 0 0 1 0 . 6 0 2 5 . 4 9 . 1 7 2 5 . 3 1 : 1 5 1 0 . 7 0 2 5 . 5 9 . 4 0 2 5 . 5 1 : 3 0 1 1 . 1 0 2 5 . 6 9 . 7 9 2 5 . 6 1 : 4 5 1 1 . 7 0 2 5 . 8 1 0 . 1 8 2 5 . 8 2 : 0 0 1 2 . 1 0 2 6 . 0 1 0 . 5 6 2 5 . 9 2 : 1 5 1 2 . 2 0 2 6 . 0 1 0 . 6 1 2 5 . 9 2 : 3 0 1 2 . 3 5 2 5 . 9 1 0 . 7 0 2 6 . 0 2 : 4 5 1 2 . 8 0 2 6 . 0 1 1 . 2 2 2 6 . 0 3 : 0 0 1 3 . 2 0 2 6 . 0 1 1 . 3 4 2 6 . 0 3 : 1 5 1 3 . 6 0 2 6 . 0 1 1 . 5 9 2 6 . 0 3 : 3 0 1 3 . 9 0 2 6 . 1 1 1 . 7 8 2 6 . 0 3 : 4 5 1 4 . 1 0 2 6 . 2 1 2 . 0 0 2 6 . 0 4 : 0 0 1 4 . 4 0 2 6 . 2 1 2 . 1 5 2 6 . 0 4 : 1 5 1 4 . 3 0 2 6 . 2 1 2 . 2 2 2 6 . 1 4 : 3 0 1 4 . 7 0 2 6 . 2 1 2 . 2 8 2 6 . 1 4 : 4 5 1 4 . 8 0 2 6 . 2 1 2 . 4 0 2 6 . 1 5 : 0 0 1 4 . 8 0 2 6 . 2 1 2 . 4 0 2 6 . 1
61

9A. SOUTH BATAVIA (EAST DAM)
Stream: Fox River Location: South of Batavia; Mile 54.90 Type: Sloping Face Material: Reinforced Concrete Condition: Very Poor Shape: Curvilinear east end, straight west end Length: 143' (effective spillway 128.5', see plan view sketch) Comments: Difficult to survey cross section. Cross section sketch is
approximate. Piers which once supported walkway divide spillway into sections. East end is breached.
62
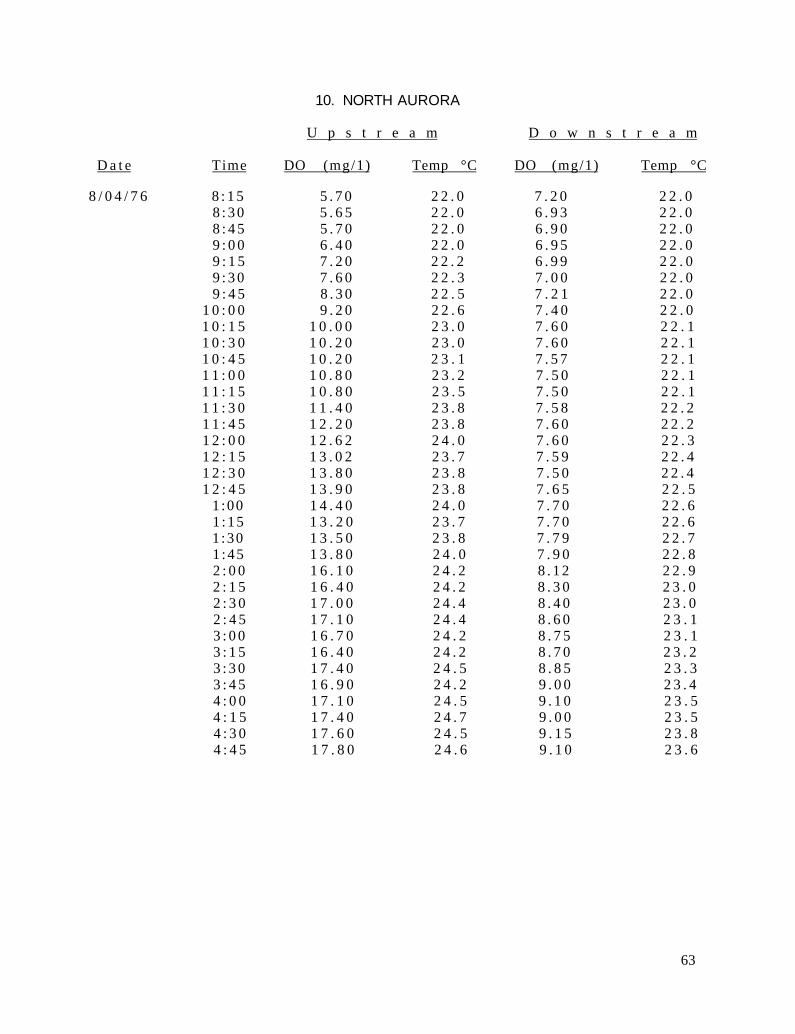
10. NORTH AURORA
U p s t r e a m D o w n s t r e a m
D a t e Time DO (mg/1) Temp °C DO (mg/1) Temp °C
8 / 0 4 / 7 6 8 : 1 5 5 . 7 0 2 2 . 0 7 . 2 0 2 2 . 0 8 : 3 0 5 . 6 5 2 2 . 0 6 . 9 3 2 2 . 0 8 : 4 5 5 . 7 0 2 2 . 0 6 . 9 0 2 2 . 0 9 : 0 0 6 . 4 0 2 2 . 0 6 . 9 5 2 2 . 0 9 : 1 5 7 . 2 0 2 2 . 2 6 . 9 9 2 2 . 0 9 : 3 0 7 . 6 0 2 2 . 3 7 . 0 0 2 2 . 0 9 : 4 5 8 . 3 0 2 2 . 5 7 . 2 1 2 2 . 0
1 0 : 0 0 9 . 2 0 2 2 . 6 7 . 4 0 2 2 . 0 1 0 : 1 5 1 0 . 0 0 2 3 . 0 7 . 6 0 2 2 . 1 1 0 : 3 0 1 0 . 2 0 2 3 . 0 7 . 6 0 2 2 . 1 1 0 : 4 5 1 0 . 2 0 2 3 . 1 7 . 5 7 2 2 . 1 1 1 : 0 0 1 0 . 8 0 2 3 . 2 7 . 5 0 2 2 . 1 1 1 : 1 5 1 0 . 8 0 2 3 . 5 7 . 5 0 2 2 . 1 1 1 : 3 0 1 1 . 4 0 2 3 . 8 7 . 5 8 2 2 . 2 1 1 : 4 5 1 2 . 2 0 2 3 . 8 7 . 6 0 2 2 . 2 1 2 : 0 0 1 2 . 6 2 2 4 . 0 7 . 6 0 2 2 . 3 1 2 : 1 5 1 3 . 0 2 2 3 . 7 7 . 5 9 2 2 . 4 1 2 : 3 0 1 3 . 8 0 2 3 . 8 7 . 5 0 2 2 . 4 1 2 : 4 5 1 3 . 9 0 2 3 . 8 7 . 6 5 2 2 . 5
1 :00 1 4 . 4 0 2 4 . 0 7 . 7 0 2 2 . 6 1 :15 1 3 . 2 0 2 3 . 7 7 . 7 0 2 2 . 6 1 :30 1 3 . 5 0 2 3 . 8 7 . 7 9 2 2 . 7 1 :45 1 3 . 8 0 2 4 . 0 7 . 9 0 2 2 . 8 2 : 0 0 1 6 . 1 0 2 4 . 2 8 . 1 2 2 2 . 9 2 : 1 5 1 6 . 4 0 2 4 . 2 8 . 3 0 2 3 . 0 2 : 3 0 1 7 . 0 0 2 4 . 4 8 . 4 0 2 3 . 0 2 : 4 5 1 7 . 1 0 2 4 . 4 8 . 6 0 2 3 . 1 3 : 0 0 1 6 . 7 0 2 4 . 2 8 . 7 5 2 3 . 1 3 : 1 5 1 6 . 4 0 2 4 . 2 8 . 7 0 2 3 . 2 3 : 3 0 1 7 . 4 0 2 4 . 5 8 . 8 5 2 3 . 3 3 : 4 5 1 6 . 9 0 2 4 . 2 9 . 0 0 2 3 . 4 4 : 0 0 1 7 . 1 0 2 4 . 5 9 . 1 0 2 3 . 5 4 : 1 5 1 7 . 4 0 2 4 . 7 9 . 0 0 2 3 . 5 4 : 3 0 1 7 . 6 0 2 4 . 5 9 . 1 5 2 3 . 8 4 : 4 5 1 7 . 8 0 2 4 . 6 9 . 1 0 2 3 . 6
63
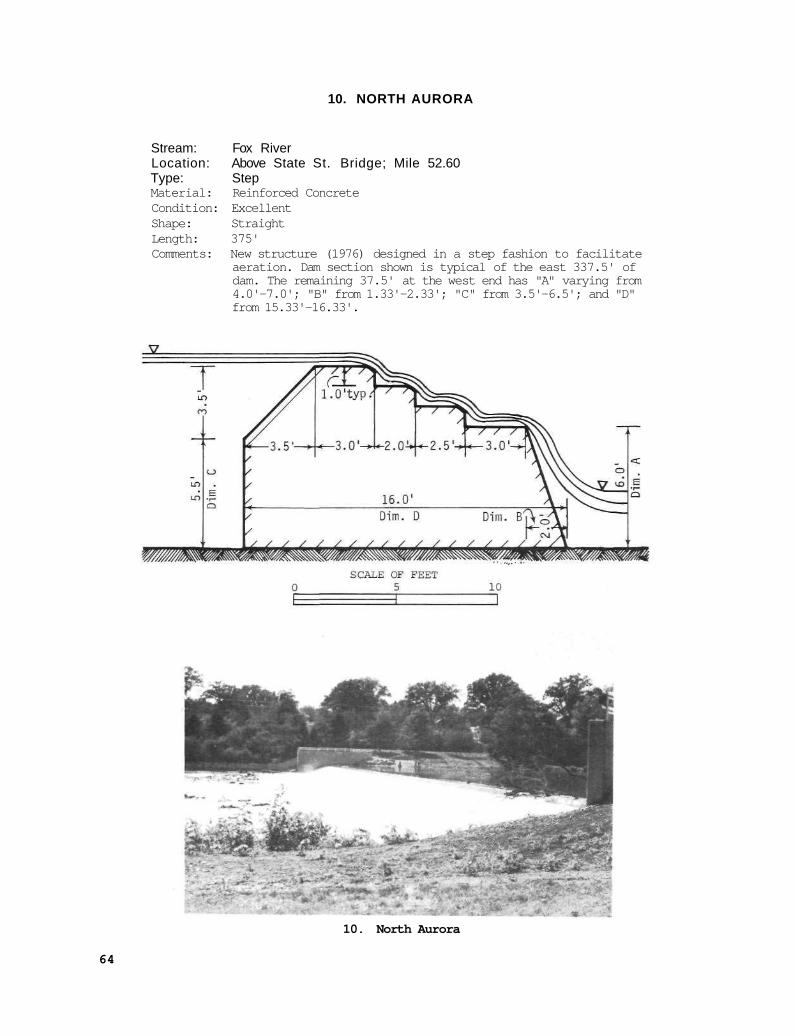
10. NORTH AURORA
Stream: Fox River Location: Above State St. Bridge; Mile 52.60 Type: Step Material: Reinforced Concrete Condition: Excellent Shape: Straight Length: 375' Comments: New structure (1976) designed in a step fashion to facilitate
aeration. Dam section shown is typical of the east 337.5' of dam. The remaining 37.5' at the west end has "A" varying from 4.0'-7.0'; "B" from 1.33'-2.33'; "C" from 3.5'-6.5'; and "D" from 15.33'-16.33'.
10. North Aurora
64
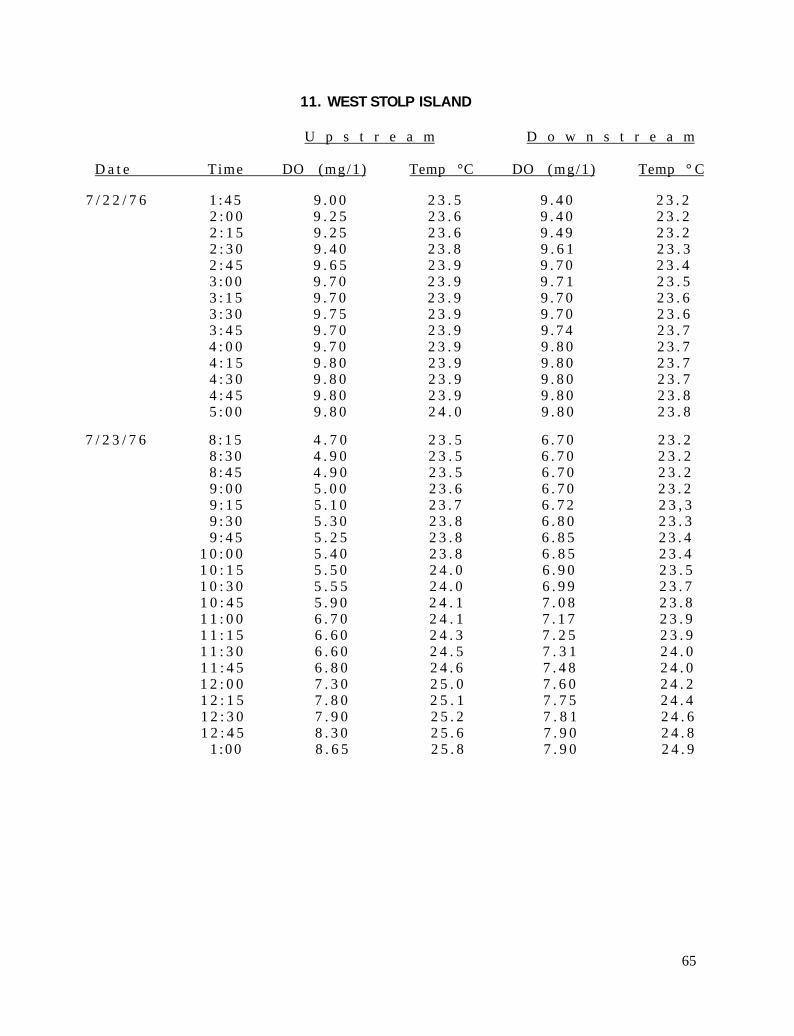
11. WEST STOLP ISLAND
U p s t r e a m D o w n s t r e a m
D a t e Time DO (mg/1) Temp °C DO (mg/1) Temp ° C
7 / 2 2 / 7 6 1 : 4 5 9 . 0 0 2 3 . 5 9 . 4 0 2 3 . 2 2 : 0 0 9 . 2 5 2 3 . 6 9 . 4 0 2 3 . 2 2 : 1 5 9 . 2 5 2 3 . 6 9 . 4 9 2 3 . 2 2 : 3 0 9 . 4 0 2 3 . 8 9 . 6 1 2 3 . 3 2 : 4 5 9 . 6 5 2 3 . 9 9 . 7 0 2 3 . 4 3 : 0 0 9 . 7 0 2 3 . 9 9 . 7 1 2 3 . 5 3 : 1 5 9 . 7 0 2 3 . 9 9 . 7 0 2 3 . 6 3 : 3 0 9 . 7 5 2 3 . 9 9 . 7 0 2 3 . 6 3 : 4 5 9 . 7 0 2 3 . 9 9 . 7 4 2 3 . 7 4 : 0 0 9 . 7 0 2 3 . 9 9 . 8 0 2 3 . 7 4 : 1 5 9 . 8 0 2 3 . 9 9 . 8 0 2 3 . 7 4 : 3 0 9 . 8 0 2 3 . 9 9 . 8 0 2 3 . 7 4 : 4 5 9 . 8 0 2 3 . 9 9 . 8 0 2 3 . 8 5 : 0 0 9 . 8 0 2 4 . 0 9 . 8 0 2 3 . 8
7 / 2 3 / 7 6 8 : 1 5 4 . 7 0 2 3 . 5 6 . 7 0 2 3 . 2 8 : 3 0 4 . 9 0 2 3 . 5 6 . 7 0 2 3 . 2 8 : 4 5 4 . 9 0 2 3 . 5 6 . 7 0 2 3 . 2 9 : 0 0 5 . 0 0 2 3 . 6 6 . 7 0 2 3 . 2 9 : 1 5 5 . 1 0 2 3 . 7 6 . 7 2 2 3 , 3 9 : 3 0 5 . 3 0 2 3 . 8 6 . 8 0 2 3 . 3 9 : 4 5 5 . 2 5 2 3 . 8 6 . 8 5 2 3 . 4
1 0 : 0 0 5 . 4 0 2 3 . 8 6 . 8 5 2 3 . 4 1 0 : 1 5 5 . 5 0 2 4 . 0 6 . 9 0 2 3 . 5 1 0 : 3 0 5 . 5 5 2 4 . 0 6 . 9 9 2 3 . 7 1 0 : 4 5 5 . 9 0 2 4 . 1 7 . 0 8 2 3 . 8 1 1 : 0 0 6 . 7 0 2 4 . 1 7 . 1 7 2 3 . 9 1 1 : 1 5 6 . 6 0 2 4 . 3 7 . 2 5 2 3 . 9 1 1 : 3 0 6 . 6 0 2 4 . 5 7 . 3 1 2 4 . 0 1 1 : 4 5 6 . 8 0 2 4 . 6 7 . 4 8 2 4 . 0 1 2 : 0 0 7 . 3 0 2 5 . 0 7 . 6 0 2 4 . 2 1 2 : 1 5 7 . 8 0 2 5 . 1 7 . 7 5 2 4 . 4 1 2 : 3 0 7 . 9 0 2 5 . 2 7 . 8 1 2 4 . 6 1 2 : 4 5 8 . 3 0 2 5 . 6 7 . 9 0 2 4 . 8
1 : 0 0 8 . 6 5 2 5 . 8 7 . 9 0 2 4 . 9
65

11. WEST STOLP ISLAND
Stream: Fox River Location: Above Galena Blvd. Bridge; Mile 48.91 Type: Steep Sloping Face (Gravity Overflow) Material: Reinforced Concrete with top steel plate Condition: Fair Shape: Straight Length: 170' Comments: Concrete around steel plate somewhat deteriorated. Very
deep at foot of dam, shallow above.
66
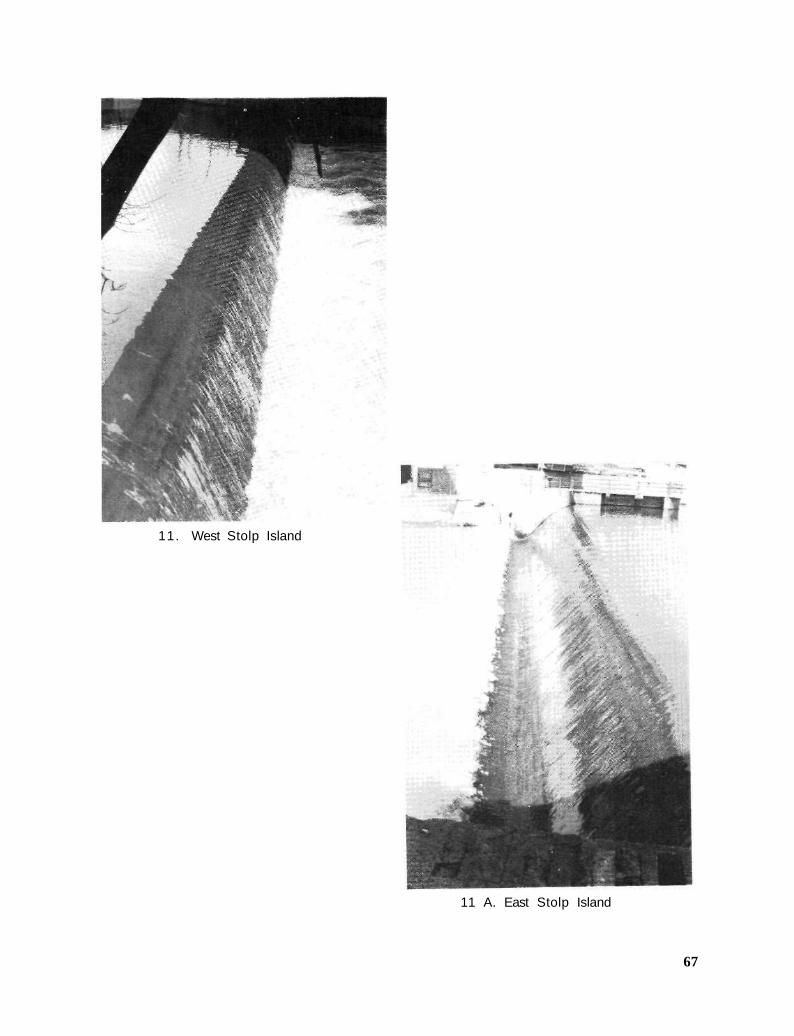
11. West Stolp Island
11 A. East Stolp Island
67
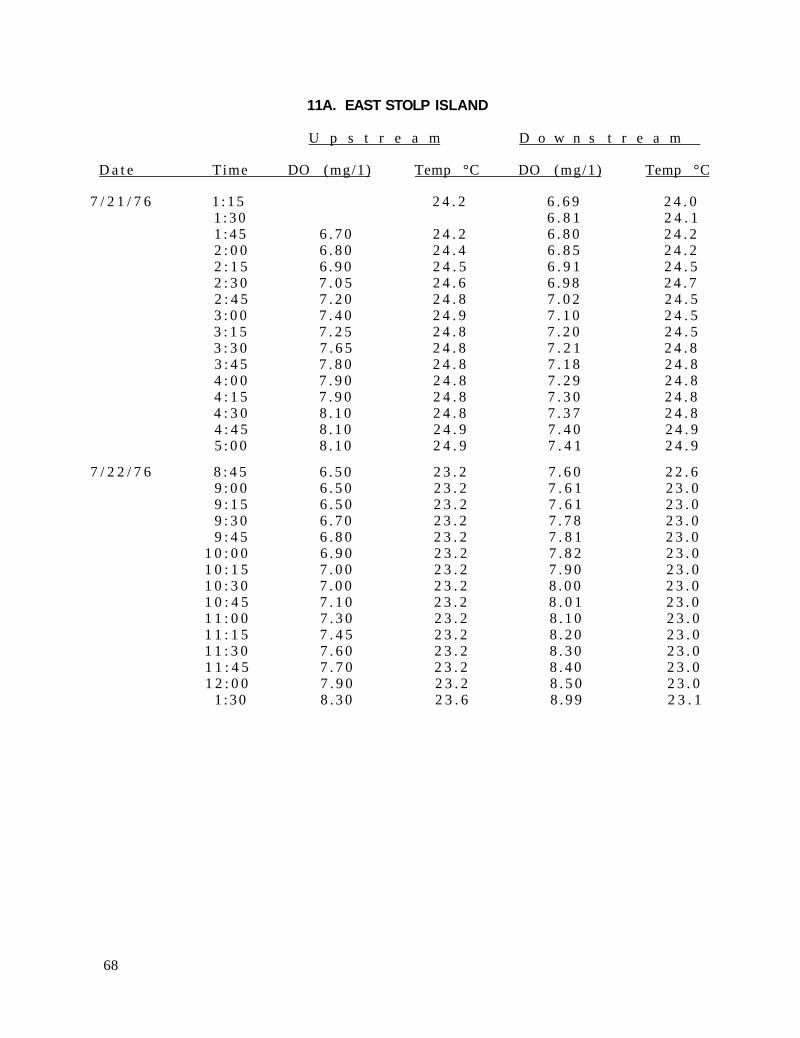
11A. EAST STOLP ISLAND
U p s t r e a m D o w n s t r e a m
D a t e Time DO (mg/1) Temp °C DO (mg/1) Temp °C
7 / 2 1 / 7 6 1 : 1 5 2 4 . 2 6 . 6 9 2 4 . 0 1 : 3 0 6 . 8 1 2 4 . 1 1 : 4 5 6 . 7 0 2 4 . 2 6 . 8 0 2 4 . 2 2 : 0 0 6 . 8 0 2 4 . 4 6 . 8 5 2 4 . 2 2 : 1 5 6 . 9 0 2 4 . 5 6 . 9 1 2 4 . 5 2 : 3 0 7 . 0 5 2 4 . 6 6 . 9 8 2 4 . 7 2 : 4 5 7 . 2 0 2 4 . 8 7 . 0 2 2 4 . 5 3 : 0 0 7 . 4 0 2 4 . 9 7 . 1 0 2 4 . 5 3 : 1 5 7 . 2 5 2 4 . 8 7 . 2 0 2 4 . 5 3 : 3 0 7 . 6 5 2 4 . 8 7 . 2 1 2 4 . 8 3 : 4 5 7 . 8 0 2 4 . 8 7 . 1 8 2 4 . 8 4 : 0 0 7 . 9 0 2 4 . 8 7 . 2 9 2 4 . 8 4 : 1 5 7 . 9 0 2 4 . 8 7 . 3 0 2 4 . 8 4 : 3 0 8 . 1 0 2 4 . 8 7 . 3 7 2 4 . 8 4 : 4 5 8 . 1 0 2 4 . 9 7 . 4 0 2 4 . 9 5 : 0 0 8 . 1 0 2 4 . 9 7 . 4 1 2 4 . 9
7 / 2 2 / 7 6 8 : 4 5 6 . 5 0 2 3 . 2 7 . 6 0 2 2 . 6 9 : 0 0 6 . 5 0 2 3 . 2 7 . 6 1 2 3 . 0 9 : 1 5 6 . 5 0 2 3 . 2 7 . 6 1 2 3 . 0 9 : 3 0 6 . 7 0 2 3 . 2 7 . 7 8 2 3 . 0 9 : 4 5 6 . 8 0 2 3 . 2 7 . 8 1 2 3 . 0
1 0 : 0 0 6 . 9 0 2 3 . 2 7 . 8 2 2 3 . 0 1 0 : 1 5 7 . 0 0 2 3 . 2 7 . 9 0 2 3 . 0 1 0 : 3 0 7 . 0 0 2 3 . 2 8 . 0 0 2 3 . 0 1 0 : 4 5 7 . 1 0 2 3 . 2 8 . 0 1 2 3 . 0 1 1 : 0 0 7 . 3 0 2 3 . 2 8 . 1 0 2 3 . 0 1 1 : 1 5 7 . 4 5 2 3 . 2 8 . 2 0 2 3 . 0 1 1 : 3 0 7 . 6 0 2 3 . 2 8 . 3 0 2 3 . 0 1 1 : 4 5 7 . 7 0 2 3 . 2 8 . 4 0 2 3 . 0 1 2 : 0 0 7 . 9 0 2 3 . 2 8 . 5 0 2 3 . 0
1 : 3 0 8 . 3 0 2 3 . 6 8 . 9 9 2 3 . 1
68
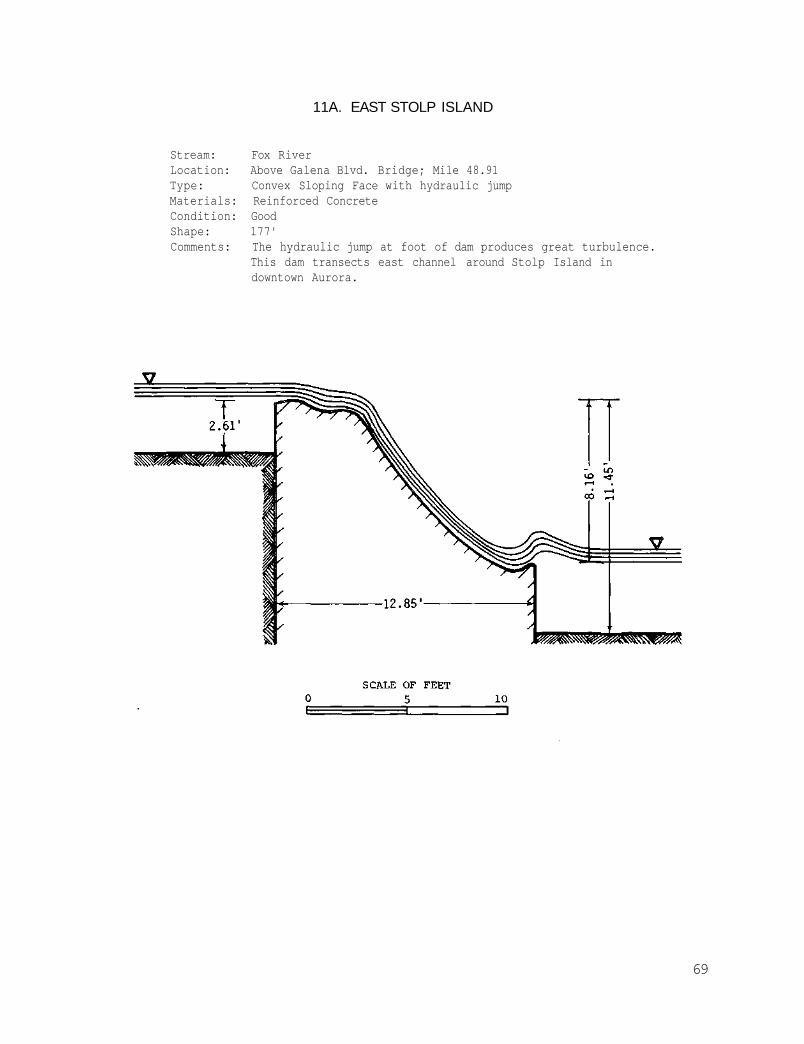
11A. EAST STOLP ISLAND
Stream: Fox River Location: Above Galena Blvd. Bridge; Mile 48.91 Type: Convex Sloping Face with hydraulic jump Materials: Reinforced Concrete Condition: Good Shape: 177' Comments: The hydraulic jump at foot of dam produces great turbulence.
This dam transects east channel around Stolp Island in downtown Aurora.
69
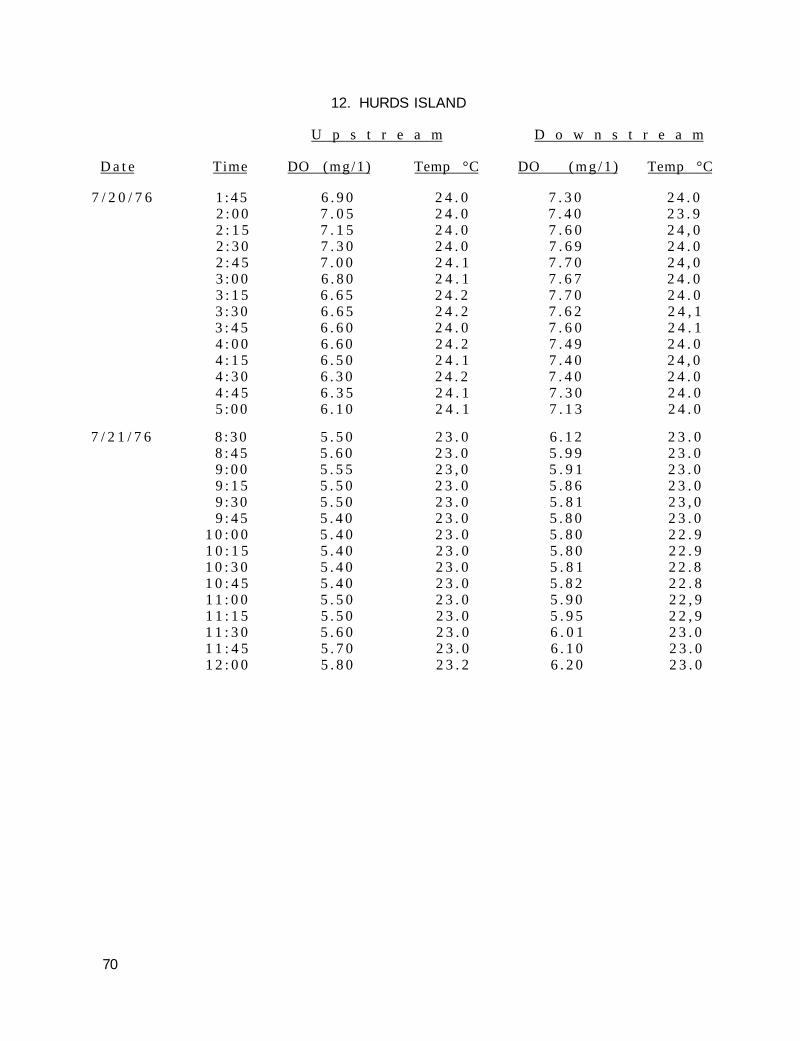
12. HURDS ISLAND
U p s t r e a m D o w n s t r e a m
D a t e Time DO (mg/1) Temp °C DO ( m g / 1 ) Temp °C
7 / 2 0 / 7 6 1 : 4 5 6 . 9 0 2 4 . 0 7 . 3 0 2 4 . 0 2 : 0 0 7 . 0 5 2 4 . 0 7 . 4 0 2 3 . 9 2 : 1 5 7 . 1 5 2 4 . 0 7 . 6 0 2 4 , 0 2 : 3 0 7 . 3 0 2 4 . 0 7 . 6 9 2 4 . 0 2 : 4 5 7 . 0 0 2 4 . 1 7 . 7 0 2 4 , 0 3 : 0 0 6 . 8 0 2 4 . 1 7 . 6 7 2 4 . 0 3 : 1 5 6 . 6 5 2 4 . 2 7 . 7 0 2 4 . 0 3 : 3 0 6 . 6 5 2 4 . 2 7 . 6 2 2 4 , 1 3 : 4 5 6 . 6 0 2 4 . 0 7 . 6 0 2 4 . 1 4 : 0 0 6 . 6 0 2 4 . 2 7 . 4 9 2 4 . 0 4 : 1 5 6 . 5 0 2 4 . 1 7 . 4 0 2 4 , 0 4 : 3 0 6 . 3 0 2 4 . 2 7 . 4 0 2 4 . 0 4 : 4 5 6 . 3 5 2 4 . 1 7 . 3 0 2 4 . 0 5 : 0 0 6 . 1 0 2 4 . 1 7 . 1 3 2 4 . 0
7 / 2 1 / 7 6 8 : 3 0 5 . 5 0 2 3 . 0 6 . 1 2 2 3 . 0 8 : 4 5 5 . 6 0 2 3 . 0 5 . 9 9 2 3 . 0 9 : 0 0 5 . 5 5 2 3 , 0 5 . 9 1 2 3 . 0 9 : 1 5 5 . 5 0 2 3 . 0 5 . 8 6 2 3 . 0 9 : 3 0 5 . 5 0 2 3 . 0 5 . 8 1 2 3 , 0 9 : 4 5 5 . 4 0 2 3 . 0 5 . 8 0 2 3 . 0
1 0 : 0 0 5 . 4 0 2 3 . 0 5 . 8 0 2 2 . 9 1 0 : 1 5 5 . 4 0 2 3 . 0 5 . 8 0 2 2 . 9 1 0 : 3 0 5 . 4 0 2 3 . 0 5 . 8 1 2 2 . 8 1 0 : 4 5 5 . 4 0 2 3 . 0 5 . 8 2 2 2 . 8 1 1 : 0 0 5 . 5 0 2 3 . 0 5 . 9 0 2 2 , 9 1 1 : 1 5 5 . 5 0 2 3 . 0 5 . 9 5 2 2 , 9 1 1 : 3 0 5 . 6 0 2 3 . 0 6 . 0 1 2 3 . 0 1 1 : 4 5 5 . 7 0 2 3 . 0 6 . 1 0 2 3 . 0 1 2 : 0 0 5 . 8 0 2 3 . 2 6 . 2 0 2 3 . 0
70
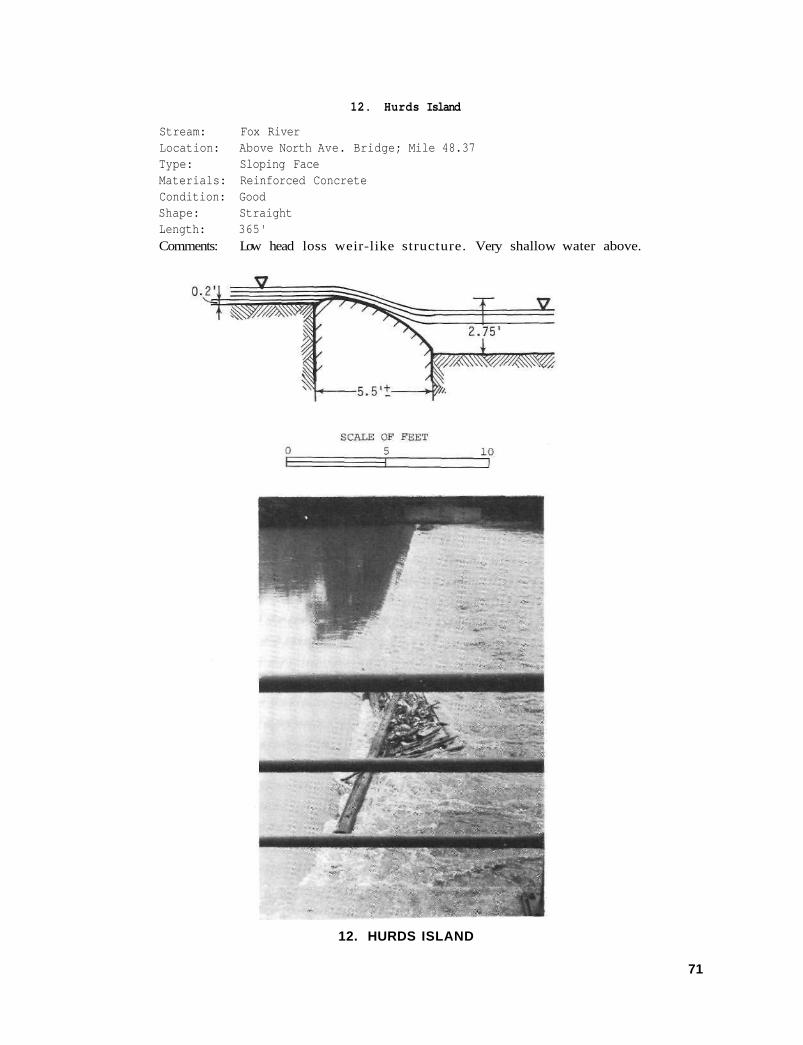
12. Hurds Island Stream: Fox River Location: Above North Ave. Bridge; Mile 48.37 Type: Sloping Face Materials: Reinforced Concrete Condition: Good Shape: Straight Length: 365' Comments: Low head loss weir-like structure. Very shallow water above.
12. HURDS ISLAND
71
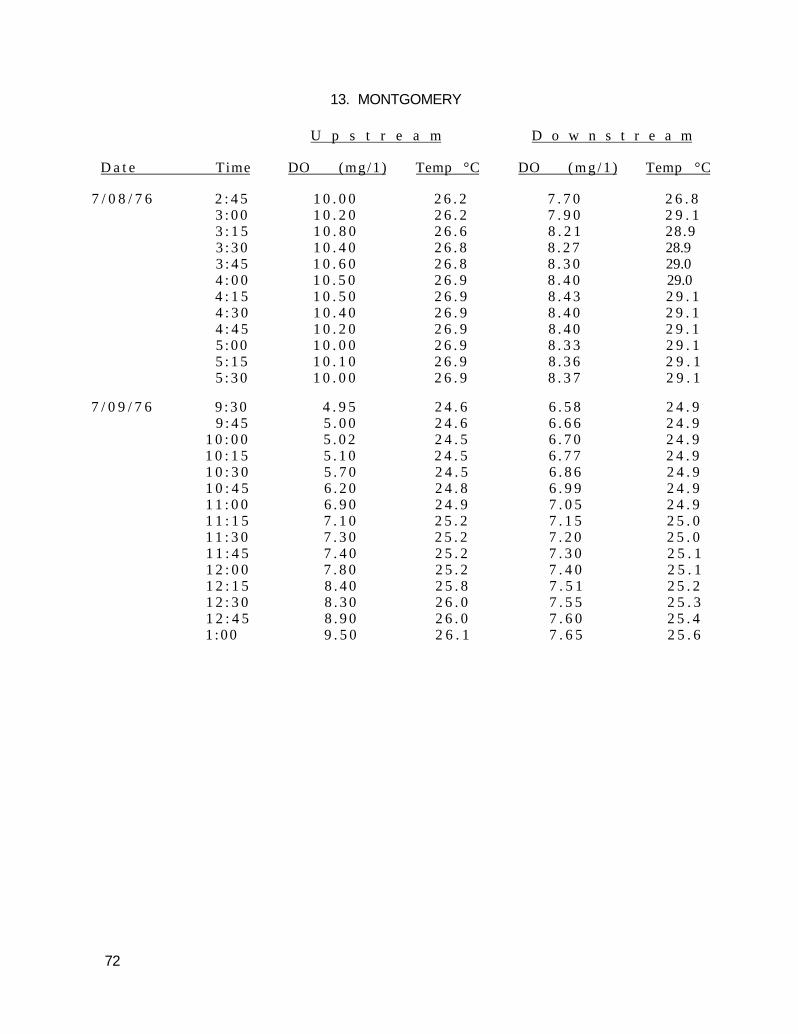
13. MONTGOMERY
U p s t r e a m D o w n s t r e a m
D a t e Time DO (mg/1) Temp °C DO ( m g / 1 ) Temp °C
7 / 0 8 / 7 6 2 : 4 5 1 0 . 0 0 2 6 . 2 7 . 7 0 2 6 . 8 3 : 0 0 1 0 . 2 0 2 6 . 2 7 . 9 0 2 9 . 1 3 : 1 5 1 0 . 8 0 2 6 . 6 8 . 2 1 28.9 3 : 3 0 1 0 . 4 0 2 6 . 8 8 . 2 7 28.9 3 : 4 5 1 0 . 6 0 2 6 . 8 8 . 3 0 29.0 4 : 0 0 1 0 . 5 0 2 6 . 9 8 . 4 0 29.0 4 : 1 5 1 0 . 5 0 2 6 . 9 8 . 4 3 2 9 . 1 4 : 3 0 1 0 . 4 0 2 6 . 9 8 . 4 0 2 9 . 1 4 : 4 5 1 0 . 2 0 2 6 . 9 8 . 4 0 2 9 . 1 5 : 0 0 1 0 . 0 0 2 6 . 9 8 . 3 3 2 9 . 1 5 : 1 5 1 0 . 1 0 2 6 . 9 8 . 3 6 2 9 . 1 5 : 3 0 1 0 . 0 0 2 6 . 9 8 . 3 7 2 9 . 1
7 / 0 9 / 7 6 9 : 3 0 4 . 9 5 2 4 . 6 6 . 5 8 2 4 . 9 9 : 4 5 5 . 0 0 2 4 . 6 6 . 6 6 2 4 . 9
1 0 : 0 0 5 . 0 2 2 4 . 5 6 . 7 0 2 4 . 9 1 0 : 1 5 5 . 1 0 2 4 . 5 6 . 7 7 2 4 . 9 1 0 : 3 0 5 . 7 0 2 4 . 5 6 . 8 6 2 4 . 9 1 0 : 4 5 6 . 2 0 2 4 . 8 6 . 9 9 2 4 . 9 1 1 : 0 0 6 . 9 0 2 4 . 9 7 . 0 5 2 4 . 9 1 1 : 1 5 7 . 1 0 2 5 . 2 7 . 1 5 2 5 . 0 1 1 : 3 0 7 . 3 0 2 5 . 2 7 . 2 0 2 5 . 0 1 1 : 4 5 7 . 4 0 2 5 . 2 7 . 3 0 2 5 . 1 1 2 : 0 0 7 . 8 0 2 5 . 2 7 . 4 0 2 5 . 1 1 2 : 1 5 8 . 4 0 2 5 . 8 7 . 5 1 2 5 . 2 1 2 : 3 0 8 . 3 0 2 6 . 0 7 . 5 5 2 5 . 3 1 2 : 4 5 8 . 9 0 2 6 . 0 7 . 6 0 2 5 . 4 1 : 0 0 9 . 5 0 2 6 . 1 7 . 6 5 2 5 . 6
72
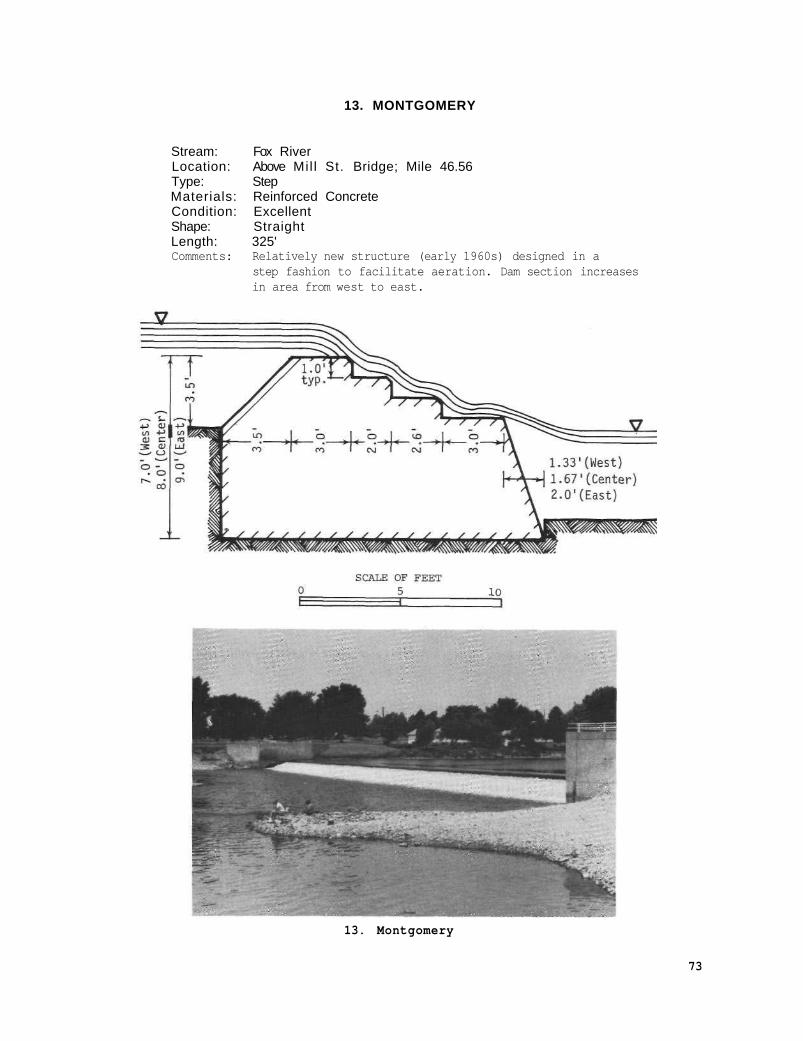
13. MONTGOMERY
Stream: Fox River Location: Above Mil l St. Bridge; Mile 46.56 Type: Step Materials: Reinforced Concrete Condition: Excellent Shape: Straight Length: 325' Comments: Relatively new structure (early 1960s) designed in a
step fashion to facilitate aeration. Dam section increases in area from west to east.
13. Montgomery
73

14. YORKVILLE
U p s t r e a m D o w n s t r e a m
D a t e Time DO (mg/1) Temp °C DO (mg/1) Temp °C
6 / 2 5 / 7 6 8 : 4 5 5 . 0 0 2 0 . 0 7 . 5 0 2 0 . 1 9 : 0 0 5 . 1 8 2 0 . 2 7 . 2 0 2 0 . 1 9 : 1 5 5 . 5 0 2 0 . 0 7 . 2 0 2 0 . 5 9 : 3 0 5 . 6 2 2 0 . 0 7 . 3 0 2 0 . 6 9 : 4 5 6 . 0 0 2 0 . 0 7 . 5 0 2 0 . 7
1 0 : 0 0 6 . 2 5 2 0 . 0 7 . 6 0 2 0 . 9 1 0 : 1 5 6 . 6 8 2 0 . 1 7 . 7 0 2 0 . 9 1 0 : 3 0 6 . 8 5 2 0 . 4 7 . 9 0 2 1 . 1 1 0 : 4 5 7 . 6 0 2 0 . 5 8 . 1 1 2 1 . 1 1 1 : 0 0 7 . 6 0 2 0 . 5 8 . 2 1 2 1 . 1 1 1 : 1 5 7 . 5 5 2 0 . 6 8 . 3 0 2 1 . 2 1 1 : 3 0 7 . 9 5 2 0 . 8 8 . 4 3 2 1 . 2 1 1 : 4 5 8 . 1 0 2 0 . 5 8 . 7 0 2 1 . 5 1 2 : 0 0 8 . 4 0 2 1 . 0 8 . 9 0 2 1 . 0 1 2 : 1 5 9 . 3 0 2 1 . 2 8 . 9 5 2 1 . 9 1 2 : 3 0 9 . 4 0 2 1 . 3 9 . 1 1 2 2 . 0 1 2 : 4 5 9 . 3 0 2 1 . 5 9 . 3 0 2 2 . 1
1 :00 1 0 . 2 0 2 1 . 8 9 . 5 0 2 1 . 7 1 :15 1 0 . 3 0 2 1 . 8 9 . 6 5 2 1 . 8 1 :30 1 0 . 5 0 2 2 . 2 9 . 9 0 2 2 . 9 1 :45 1 1 . 0 0 2 2 . 5 1 0 . 0 0 2 3 . 0 2 : 0 0 1 1 . 0 5 2 2 . 5 1 0 . 0 1 2 3 . 1 2 : 1 5 1 2 . 0 0 2 3 . 0 1 0 . 0 5 2 3 . 2
74
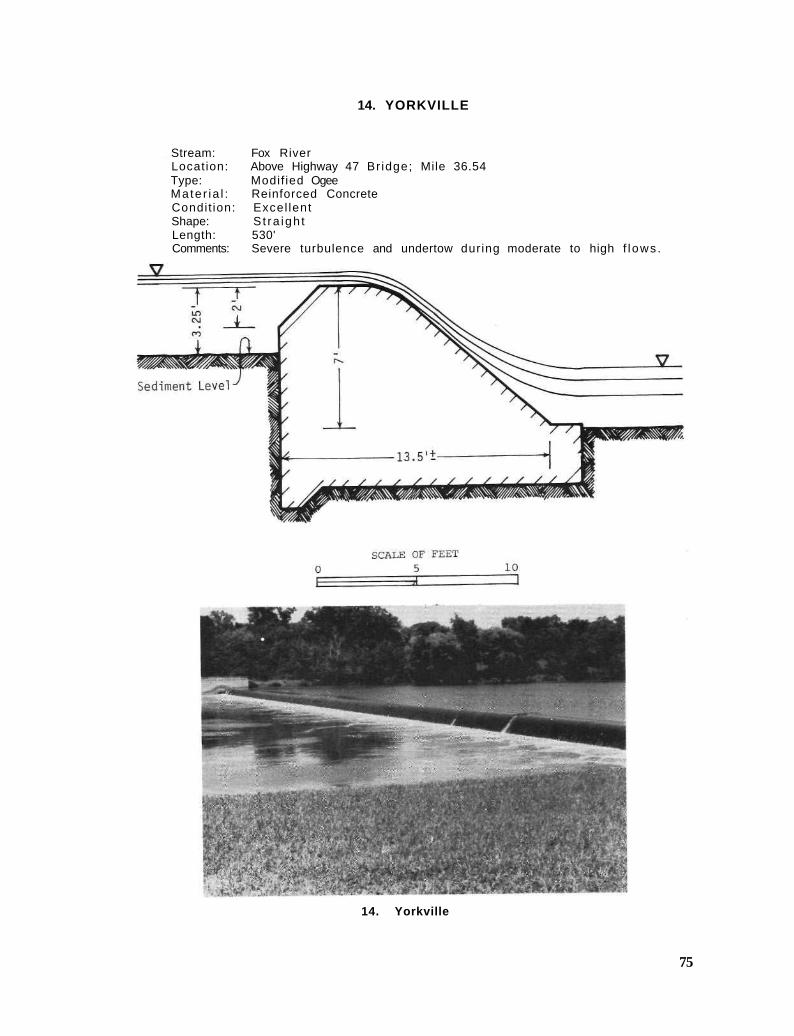
14. YORKVILLE
Stream: Fox River Location: Above Highway 47 Br idge; Mile 36.54 Type: Modif ied Ogee Mate r ia l : Reinforced Concrete Condit ion: Excel lent Shape: S t ra igh t Length: 530' Comments: Severe turbulence and undertow during moderate to high f l ows .
14. Yorkville
75
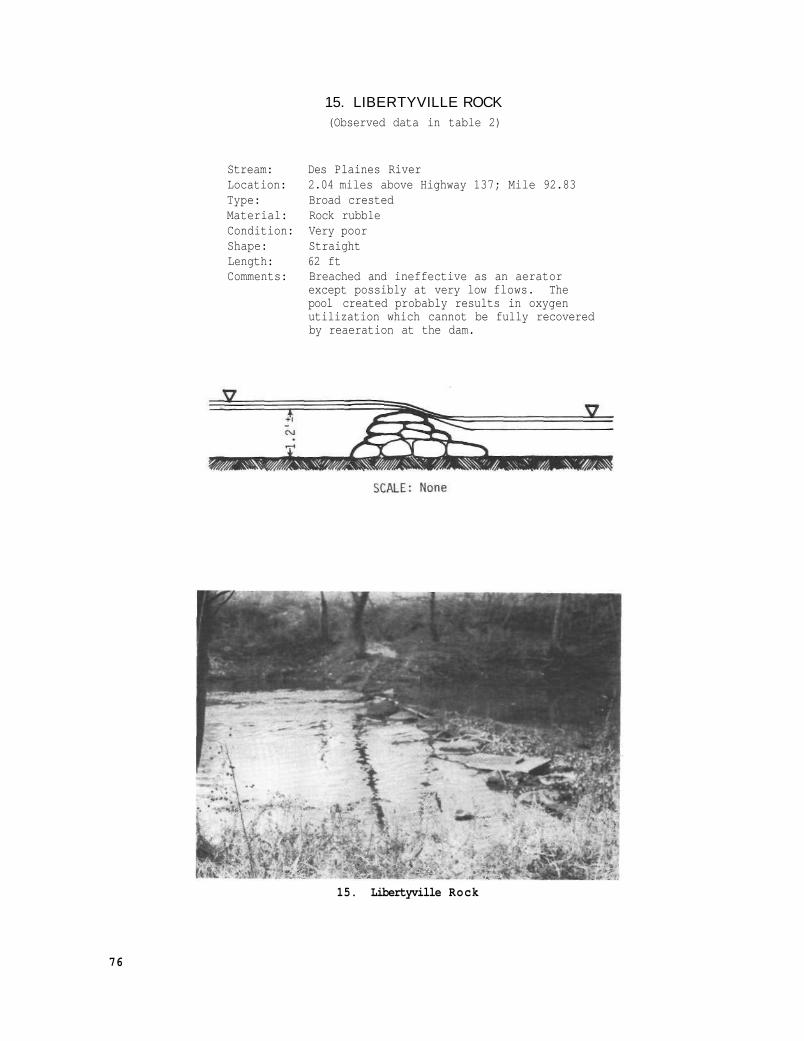
15. LIBERTYVILLE ROCK (Observed data in table 2)
Stream: Des Plaines River Location: 2.04 miles above Highway 137; Mile 92.83 Type: Broad crested Material: Rock rubble Condition: Very poor Shape: Straight Length: 62 ft Comments: Breached and ineffective as an aerator
except possibly at very low flows. The pool created probably results in oxygen utilization which cannot be fully recovered by reaeration at the dam.
15. Libertyville Rock
76
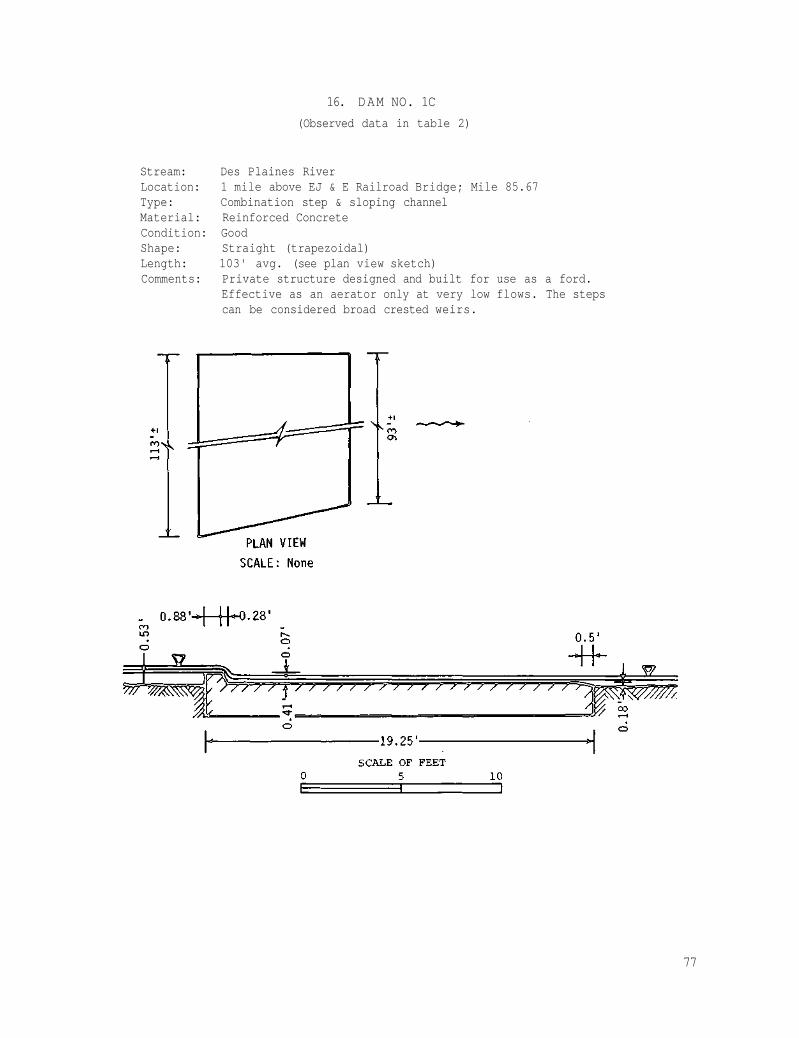
16. DAM NO. 1C (Observed data in table 2)
Stream: Des Plaines River Location: 1 mile above EJ & E Railroad Bridge; Mile 85.67 Type: Combination step & sloping channel Material: Reinforced Concrete Condition: Good Shape: Straight (trapezoidal) Length: 103' avg. (see plan view sketch) Comments: Private structure designed and built for use as a ford.
Effective as an aerator only at very low flows. The steps can be considered broad crested weirs.
77
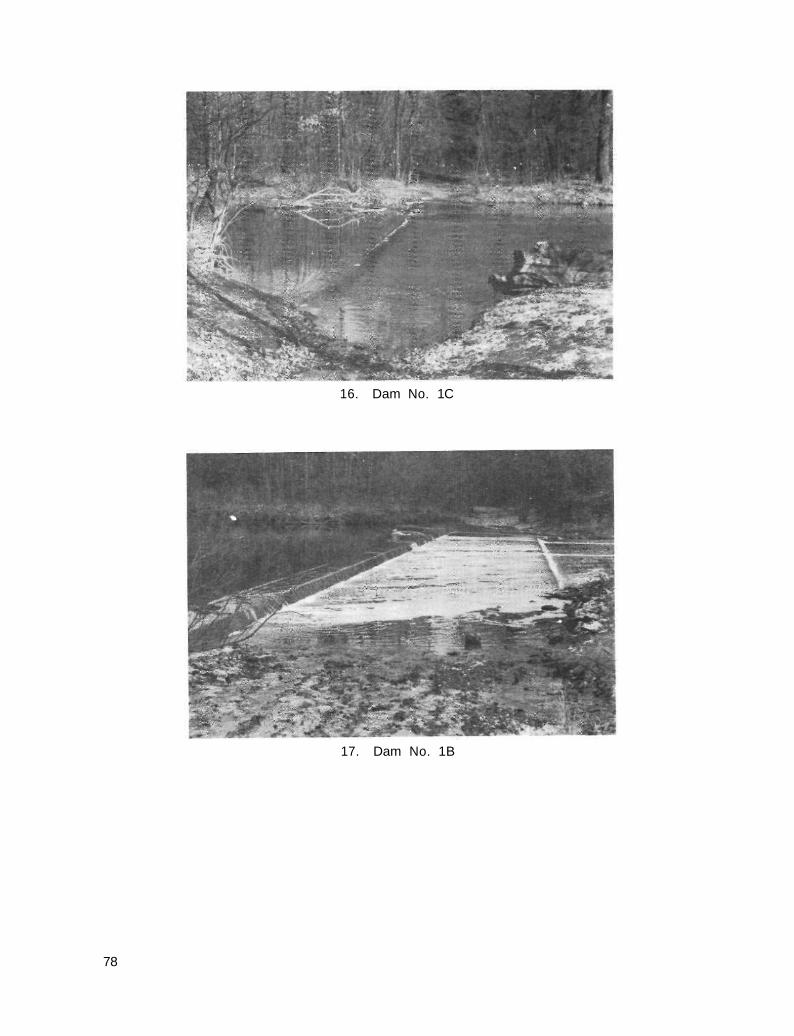
16. Dam No. 1C
17. Dam No. 1B
78
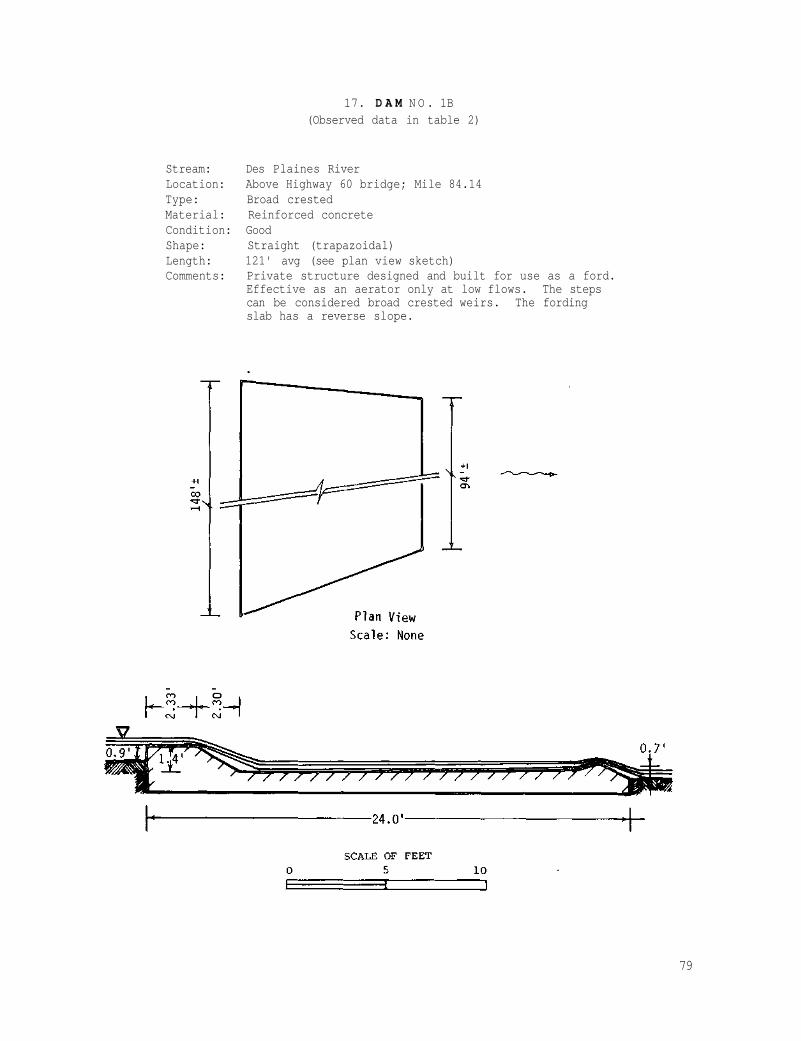
17. D A M N O . 1B (Observed data in table 2)
Stream: Des Plaines River Location: Above Highway 60 bridge; Mile 84.14 Type: Broad crested Material: Reinforced concrete Condition: Good Shape: Straight (trapazoidal) Length: 121' avg (see plan view sketch) Comments: Private structure designed and built for use as a ford.
Effective as an aerator only at low flows. The steps can be considered broad crested weirs. The fording slab has a reverse slope.
79

18. D A M NO. 1A
(Observed data in tab le 2)
Stream: Des Plaines River Locat ion: Below Highway 60 br idge; Mile 82.35 Type: Broad crested - s loping channel Ma te r i a l : Reinforced concrete Condi t ion: Poor Shape: S t ra igh t Length: 140' ( e f f ec t i ve ) Comments: Pr ivate s t ruc ture designed and b u i l t f o r use as a fo rd
but no longer used as such. Trash tends to co l l ec t on f l a t surfaces which probably a f fec ts the aerat ion coe f f i c i en t during low f lows. A 5- foot wide boat t rans fe r weir ex is ts 105' from r i g h t bank.

18. Dam No. 1A
19. Dam No. 1
81
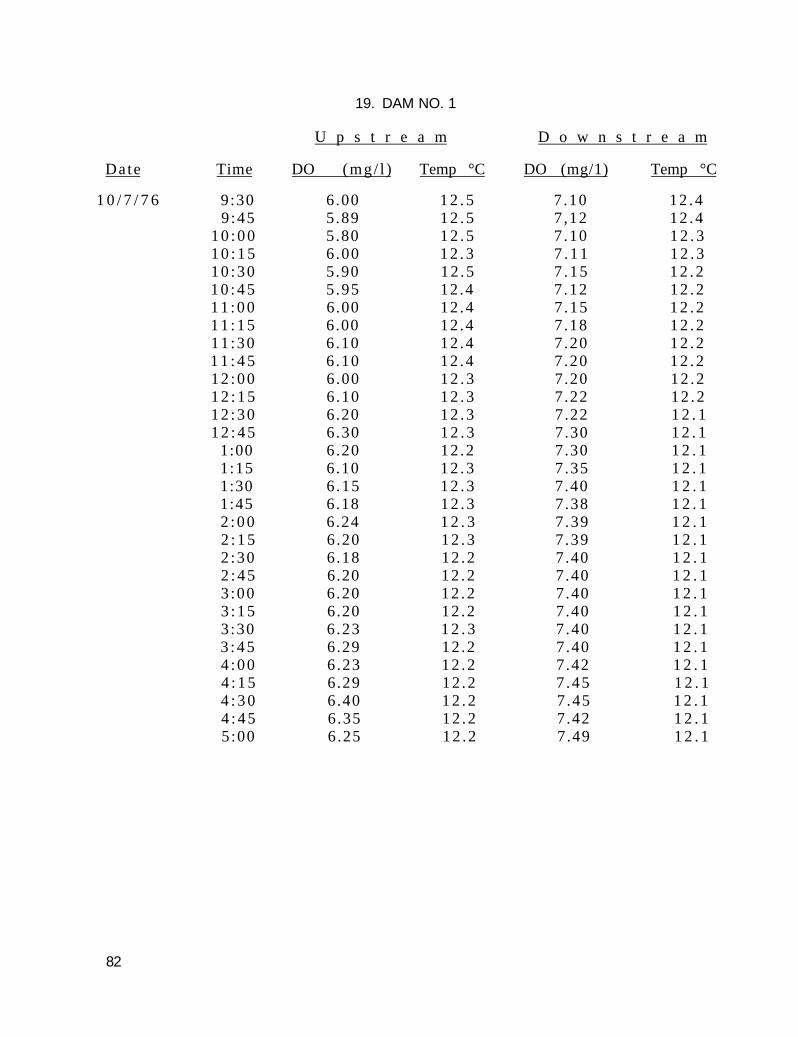
19. DAM NO. 1
U p s t r e a m D o w n s t r e a m
Date Time DO (mg/ l ) Temp °C DO (mg/1) Temp °C
1 0 / 7 / 7 6 9:30 6.00 1 2 . 5 7 .10 12 .4 9 :45 5.89 1 2 . 5 7 ,12 12 .4
1 0 : 0 0 5.80 1 2 . 5 7 .10 1 2 . 3 1 0 : 1 5 6 .00 1 2 . 3 7 . 1 1 1 2 . 3 10 :30 5.90 12 .5 7 .15 1 2 . 2 1 0 : 4 5 5 .95 12 .4 7 .12 1 2 . 2 1 1 : 0 0 6.00 12 .4 7 .15 1 2 . 2 1 1 : 1 5 6.00 12 .4 7 .18 1 2 . 2 11 :30 6.10 12 .4 7 .20 1 2 . 2 1 1 : 4 5 6 .10 12 .4 7 .20 1 2 . 2 12 :00 6.00 1 2 . 3 7 .20 12 .2 1 2 : 1 5 6.10 1 2 . 3 7 .22 12 .2 12 :30 6.20 1 2 . 3 7.22 1 2 . 1 1 2 : 4 5 6.30 1 2 . 3 7 .30 1 2 . 1
1:00 6.20 12 .2 7 .30 1 2 . 1 1:15 6.10 1 2 . 3 7 .35 1 2 . 1 1:30 6 .15 1 2 . 3 7 .40 1 2 . 1 1:45 6.18 1 2 . 3 7 .38 1 2 . 1 2 : 0 0 6.24 1 2 . 3 7 .39 1 2 . 1 2 : 1 5 6.20 12 .3 7 .39 1 2 . 1 2 :30 6.18 12 .2 7 .40 1 2 . 1 2 : 4 5 6.20 12 .2 7 .40 1 2 . 1 3 :00 6.20 12 .2 7 .40 1 2 . 1 3 : 1 5 6.20 12 .2 7 .40 1 2 . 1 3 :30 6 .23 1 2 . 3 7 .40 1 2 . 1 3 : 4 5 6.29 12 .2 7 .40 1 2 . 1 4 :00 6 .23 12 .2 7.42 1 2 . 1 4 : 1 5 6.29 12 .2 7 .45 1 2 . 1 4 : 3 0 6.40 1 2 . 2 7 .45 1 2 . 1 4 : 4 5 6 .35 12 .2 7.42 1 2 . 1 5 :00 6 .25 12 .2 7.49 1 2 . 1
82
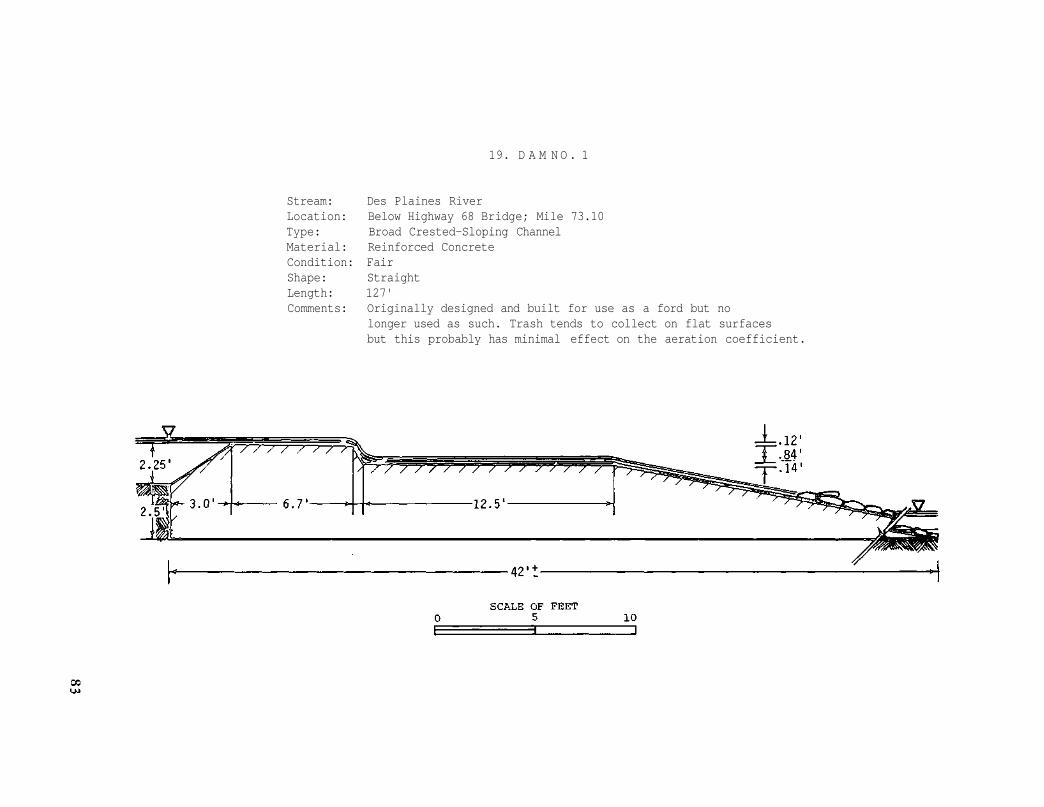
19. D A M N O . 1
Stream: Des Plaines River Location: Below Highway 68 Bridge; Mile 73.10 Type: Broad Crested-Sloping Channel Material: Reinforced Concrete Condition: Fair Shape: Straight Length: 127' Comments: Originally designed and built for use as a ford but no
longer used as such. Trash tends to collect on flat surfaces but this probably has minimal effect on the aeration coefficient.

20. DAM NO. 2
U p s t r e a m D o w n s t r e a m
D a t e Time DO (mg/1 ) Temp °C DO Cmg/1) Temp ° C
1 0 / 6 / 7 6 1 : 3 0 6 . 6 0 1 4 . 0 8 , 2 4 1 4 . 0 1 : 4 5 6 . 8 5 1 4 . 1 7 . 9 0 1 4 . 1 2 : 0 0 7 . 0 6 1 4 . 1 7 . 9 2 1 4 . 1 2 : 1 5 6 . 2 5 1 4 . 1 8 . 1 0 1 4 . 1 2 : 3 0 7 . 0 0 1 4 . 1 8 . 0 0 1 4 . 1 2 : 4 5 7 . 1 0 1 4 . 1 8 . 1 0 1 4 . 2 3 : 0 0 6 . 4 8 1 4 . 2 8 . 1 2 1 4 . 4 3 : 1 5 7 . 2 2 1 4 . 3 8 . 1 8 1 4 . 5 3 : 3 0 7 . 1 0 1 4 . 3 8 . 2 5 1 4 . 4 3 : 4 5 7 . 5 0 1 4 . 2 8 . 3 0 1 4 . 3 4 : 0 0 7 . 0 5 1 4 . 2 8 . 3 0 1 4 . 3 4 : 1 5 7 . 2 0 1 4 . 1 8 . 3 0 1 4 . 2 4 : 3 0 7 . 2 5 1 4 . 1 8 . 2 5 1 4 . 2 4 : 4 5 7 . 6 0 1 4 . 1 8 . 2 5 1 4 . 2
1 0 / 8 / 7 6 8 : 4 5 5 . 1 0 1 1 . 1 7 . 4 1 1 1 . 0 9 : 0 0 5 . 0 0 1 1 . 1 7 . 4 1 1 1 . 0 9 : 1 5 5 . 1 1 1 1 . 0 7 . 4 3 1 1 . 0 9 : 3 0 5 . 1 0 1 1 . 0 7 . 4 5 1 1 . 0 9 : 4 5 5 . 1 0 1 1 . 0 7 . 4 9 1 1 . 0
1 0 : 0 0 5 . 1 4 1 1 . 0 7 . 5 0 1 1 . 0 . 1 0 : 1 5 5 . 2 0 1 1 . 0 7 . 5 0 1 1 . 0 1 0 : 3 0 5 . 3 0 1 1 . 0 7 . 5 9 1 1 . 0 1 0 : 4 5 5 . 3 0 1 1 . 1 7 . 6 0 1 1 . 0 1 1 : 0 0 5 . 3 2 1 1 . 1 7 . 8 0 1 1 . 0 1 1 : 1 5 5 . 3 2 1 1 . 1 7 . 8 0 1 1 . 0 1 1 : 3 0 5 . 4 0 1 1 . 1 7 . 8 8 1 1 . 1 1 1 : 4 5 5 . 6 0 1 1 . 2 7 . 9 5 1 1 . 2
84
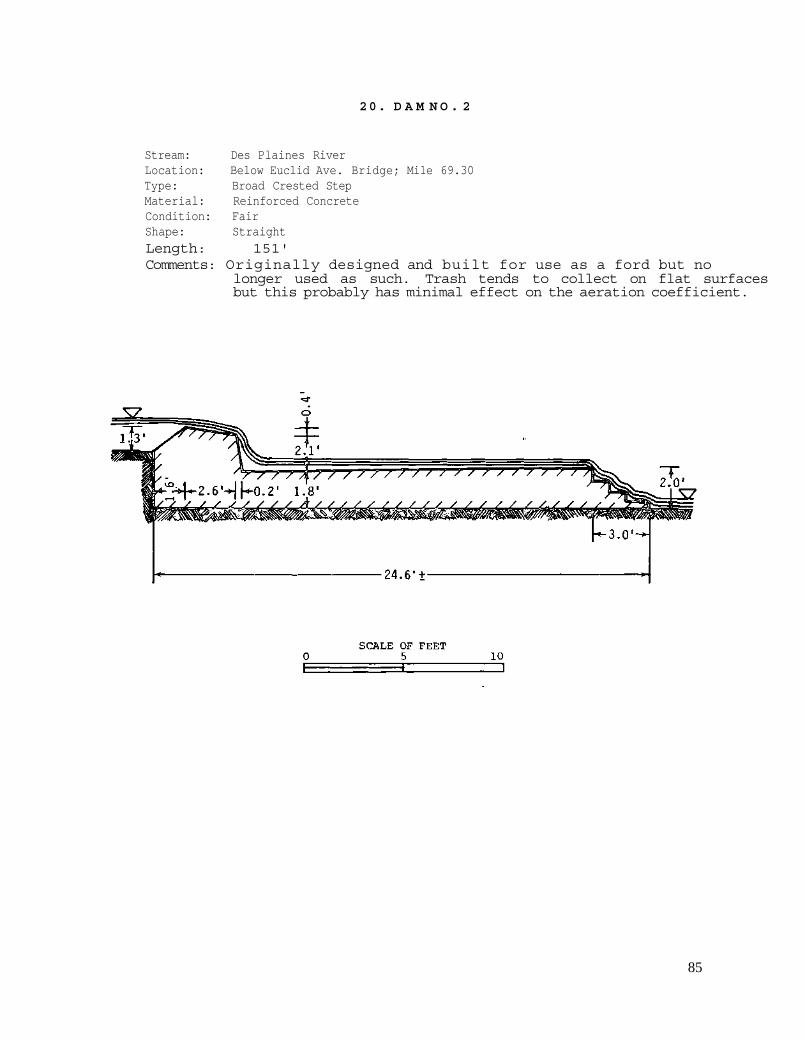
20. D A M N O . 2
Stream: Des Plaines River Location: Below Euclid Ave. Bridge; Mile 69.30 Type: Broad Crested Step Material: Reinforced Concrete Condition: Fair Shape: Straight Length: 151' Comments: Originally designed and built for use as a ford but no
longer used as such. Trash tends to collect on flat surfaces but this probably has minimal effect on the aeration coefficient.
85
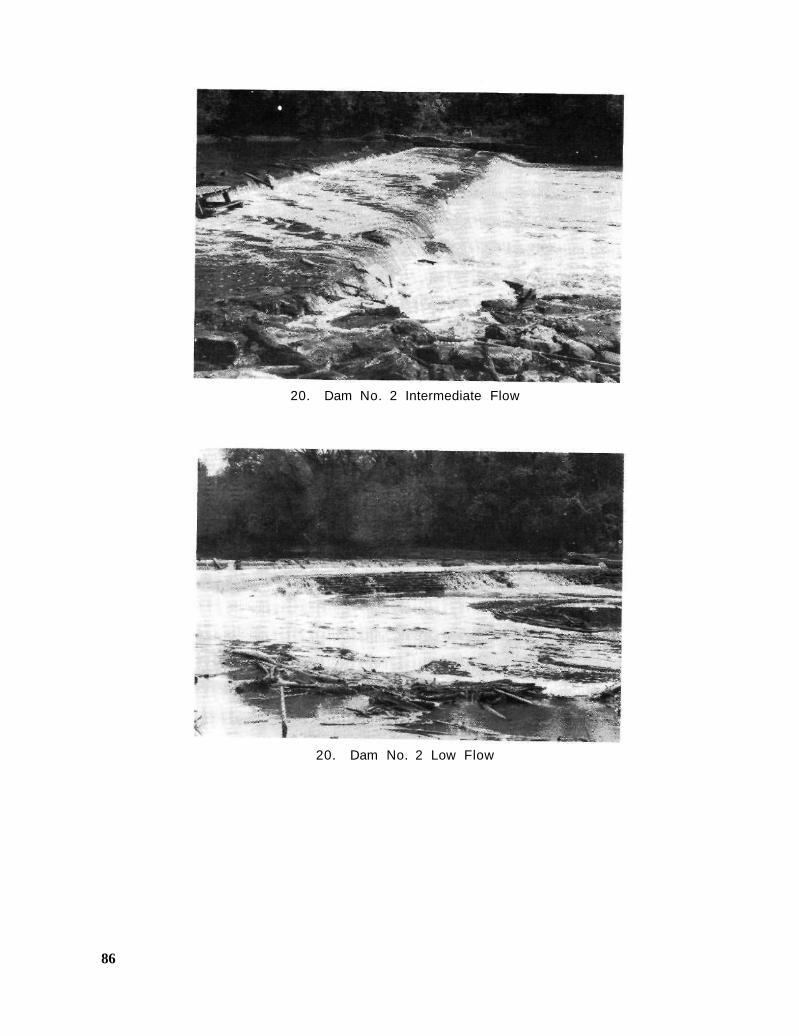
20. Dam No. 2 Intermediate Flow
20. Dam No. 2 Low Flow
86

21. DEMPSTER STREET
U p s t r e a m D o w n s t r e a m
D a t e T ime DO (mg/1) Temp °C DO (ntg/1) Temp °C
9 / 0 9 / 7 6 1 0 : 3 0 3 . 9 0 2C.8 4 . 2 0 2 0 . 6 1 0 : 4 5 3 . 6 0 2 0 . 6 3 . 9 0 2 0 . 6 1 1 : 0 0 2 . 9 5 2 0 . 2 3 . 5 5 2 0 . 2 1 1 : 1 5 2 . 8 0 2 0 . 1 3 . 6 0 2 0 . 1 1 1 : 3 0 2 . 1 5 2 0 . 1 3 . 2 0 2 0 . 1 1 1 : 4 5 2 . 5 5 2 0 . 1 3 . 1 2 2 0 . 1 1 2 : 0 0 2 . 5 0 2 0 . 1 3 . 0 8 2 0 . 1 1 2 : 1 5 2 . 4 0 2 0 . 1 3 . 0 0 2 0 . 1 1 2 : 3 0 2 . 4 0 2 0 . 2 3 . 0 0 2 0 . 1 1 2 : 4 5 2 . 4 0 2 0 . 1 3 . 0 0 2 0 . 2
1 : 0 0 2 . 4 0 2 0 . 1 3 . 2 0 2 0 . 3 1 : 1 5 3 . 0 2 2 0 . 1 3 . 3 0 2 0 . 2 1 : 3 0 2 . 7 5 2 0 . 2 3 . 5 0 2 0 . 4 1 : 4 5 2 . 9 8 2 0 . 3 3 . 7 5 2 0 . 5 2 : 0 0 3 . 0 0 2 0 . 2 3 . 7 8 2 0 . 5 2 : 1 5 3 . 1 0 2 0 . 4 3 . 9 6 2 0 . 6 2 : 3 0 3 . 1 0 2 0 . 6 4 . 0 0 2 0 . 7 2 : 4 5 3 . 0 5 2 0 . 6 3 . 8 5 2 0 . 7 3 : 0 0 2 . 9 5 2 0 . 5 3 . 8 0 2 0 . 5 3 : 1 5 2 . 9 0 2 0 . 8 3 . 9 5 2 0 . 9 3 : 3 0 3 . 0 8 2 0 . 9 4 . 0 0 2 1 . 0 3 : 4 5 3 . 0 1 2 0 . 9 3 . 8 0 2 0 . 9 4 : 0 0 3 . 1 5 2 1 . 0 3 . 7 8 2 0 . 9 4 : 1 5 3 . 2 5 2 1 . 0 4 . 0 2 2 0 . 9 4 : 3 0 3 . 5 0 2 1 . 0 4 . 2 5 2 1 . 0
87
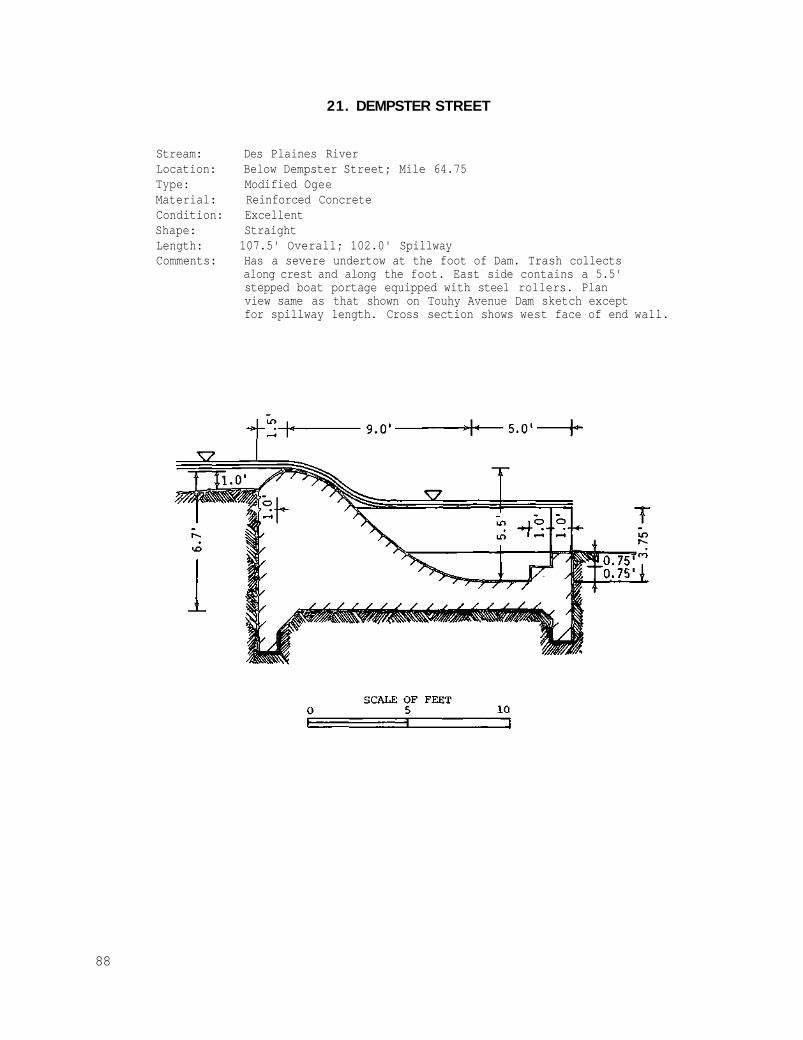
21. DEMPSTER STREET
Stream: Des Plaines River Location: Below Dempster Street; Mile 64.75 Type: Modified Ogee Material: Reinforced Concrete Condition: Excellent Shape: Straight Length: 107.5' Overall; 102.0' Spillway Comments: Has a severe undertow at the foot of Dam. Trash collects
along crest and along the foot. East side contains a 5.5' stepped boat portage equipped with steel rollers. Plan view same as that shown on Touhy Avenue Dam sketch except for spillway length. Cross section shows west face of end wall.
88
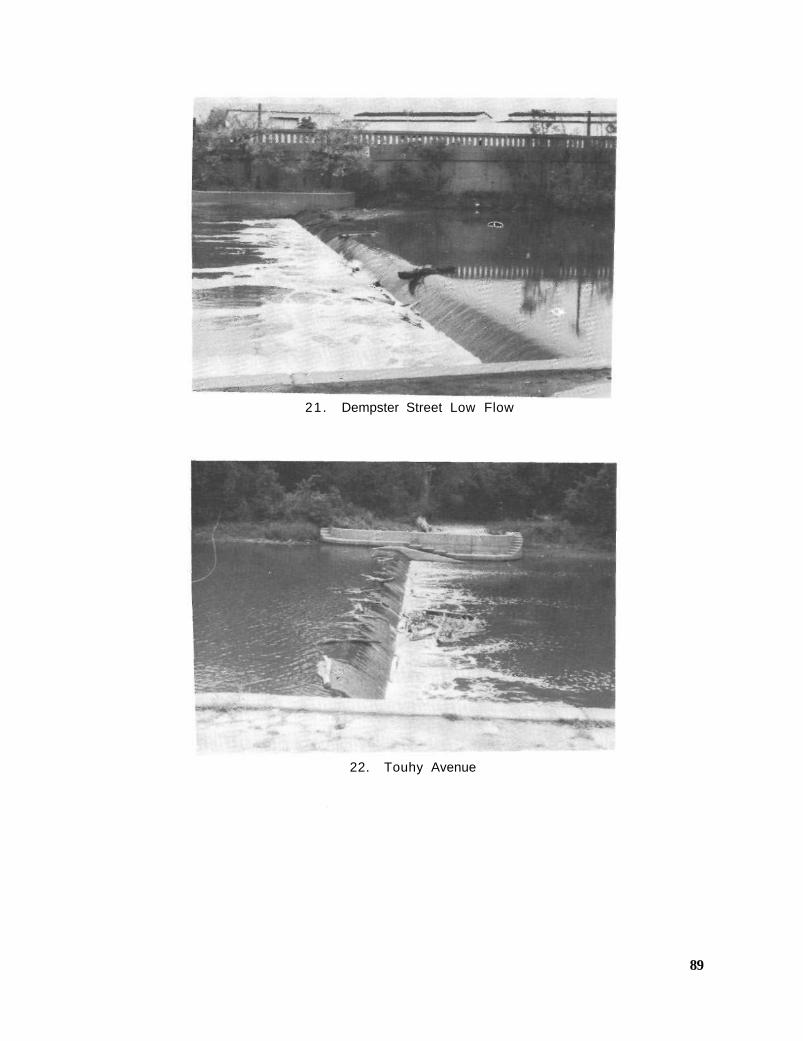
21. Dempster Street Low Flow
22. Touhy Avenue
89

22. TOUHY AVENUE
U p s t r e a m D o w n s t r e a m Date Time DO Cmg/1) Temp °C DO (mg/1) Temp °C 9/15/76 3:00 8.10 21.0 7.90 21.0
3:15 9.30 21.5 8.40 21.0 3:30 9.25 21.3 8.65 21.0 3:45 8.60 21.0 8.15 21.0 4:00 8.45 21.0 8.20 20.9 4:15 8.10 20.9 8.05 20.6 4:30 8.10 20.9 8.05 20.6 4:45 8.25 20.9 8.25 20.8 5:00 7.90 20.8 7.95 20.5 5:15 7.90 20.8 7.85 20.5 5:30 7.80 20.6 7,80 20.5 5:45 7.60 20.6 7.65 20.5 6:00 7.40 20.5 7.55 20.3
9/17/76 8:45 3.20 18.7 4.40 18.8 9:00 3.10 18.7 4.25 18.8 9:15 3.30 18.8 4.15 18.7 9:30 3.38 18.8 4.40 18.8 9:45 3.38 18.8 4.50 18.8
10:00 3.30 18.8 4.30 18.6 10:15 3.30 18.8 4.50 18.6 10:30 3.52 18.8 4.60 18.6 10:45 3.40 18.8 4.65 18.9 11:00 3.50 18.8 4.55 18.9 11:15 3.40 18.8 4.80 18.9 11:30 3.70 18.9 4.90 19.0 11:45 3.90 18.9 4.80 19.0
90
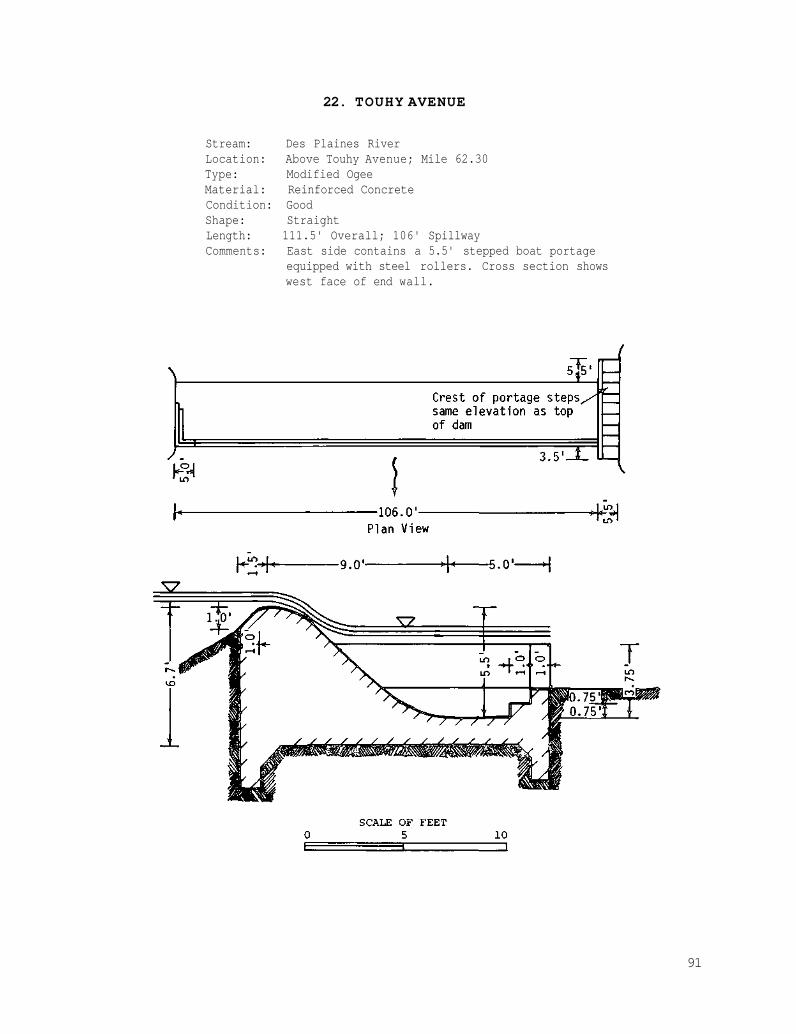
22. TOUHY AVENUE
Stream: Des Plaines River Location: Above Touhy Avenue; Mile 62.30 Type: Modified Ogee Material: Reinforced Concrete Condition: Good Shape: Straight Length: 111.5' Overall; 106' Spillway Comments: East side contains a 5.5' stepped boat portage
equipped with steel rollers. Cross section shows west face of end wall.
91

23. DEVON AVENUE
U p s t r e a m D o w n s t r e a m
Date Time DO (mg/1) Temp °C DO (mg/1) Temp °C
9 / 1 6 / 7 6 8:30 5 .38 1 8 . 8 5.30 1 8 . 5 8:45 5 .25 1 8 . 9 5 .28 1 8 . 5 9:00 5 . 2 5 1 8 . 9 5 .50 1 8 . 5 9 :15 5 .15 1 8 . 9 5 .70 1 8 . 5 9:30 4 .90 1 8 . 9 5 .80 1 8 . 5 9:45 5 .00 1 9 . 0 5.90 1 8 . 8
10 :00 5.20 1 9 . 0 6 .00 1 8 . 8 1 0 : 1 5 4 . 8 0 1 9 . 0 6.00 1 8 . 8 10 :30 4 . 9 0 1 9 . 0 5.90 1 8 . 8 1 0 : 4 5 4 . 9 0 1 9 . 0 5 .80 1 8 . 8 11 :00 4 .70 1 9 . 2 5.99 1 9 . 0 1 1 : 1 5 4 . 7 8 1 9 . 0 6.10 19 .2 1 1 : 3 0 5 .40 1 9 . 0 6 .60 1 9 . 0
9 / 1 6 / 7 6 1:00 8 .70 1 9 . 0 6.80 1 9 . 0 1:15 8 .10 1 9 . 1 7 .00 1 9 . 1 1:30 8 .55 1 9 . 1 7 .40 1 9 . 2 1:45 8 .60 1 9 . 1 8 .20 1 9 . 5 2 :00 7 .90 1 9 . 0 7 .50 1 9 . 5 2 :15 8 .10 1 9 . 0 7 .15 1 9 . 2 2 :30 8 .40 1 9 . 1 7 .60 1 9 . 2 2 :45 1 0 . 5 0 1 9 . 2 7 .80 1 9 . 2 3 :00 1 2 . 6 0 1 9 . 5 7 .80 1 9 . 2 3 :15 1 2 . 4 0 1 9 . 6 7 .80 1 9 . 2 3:30 1 0 . 3 0 1 9 . 2 7 .60 1 9 . 2 3 :45 1 1 . 4 0 1 9 . 3 7 .70 19 .2 4 :00 1 0 . 8 0 1 9 . 2 7 .60 1 9 . 2 4 :15 1 3 . 0 0 1 9 . 5 7 .80 1 9 . 2 4:30 1 3 . 0 0 1 9 . 5 8.00 1 9 . 2
92
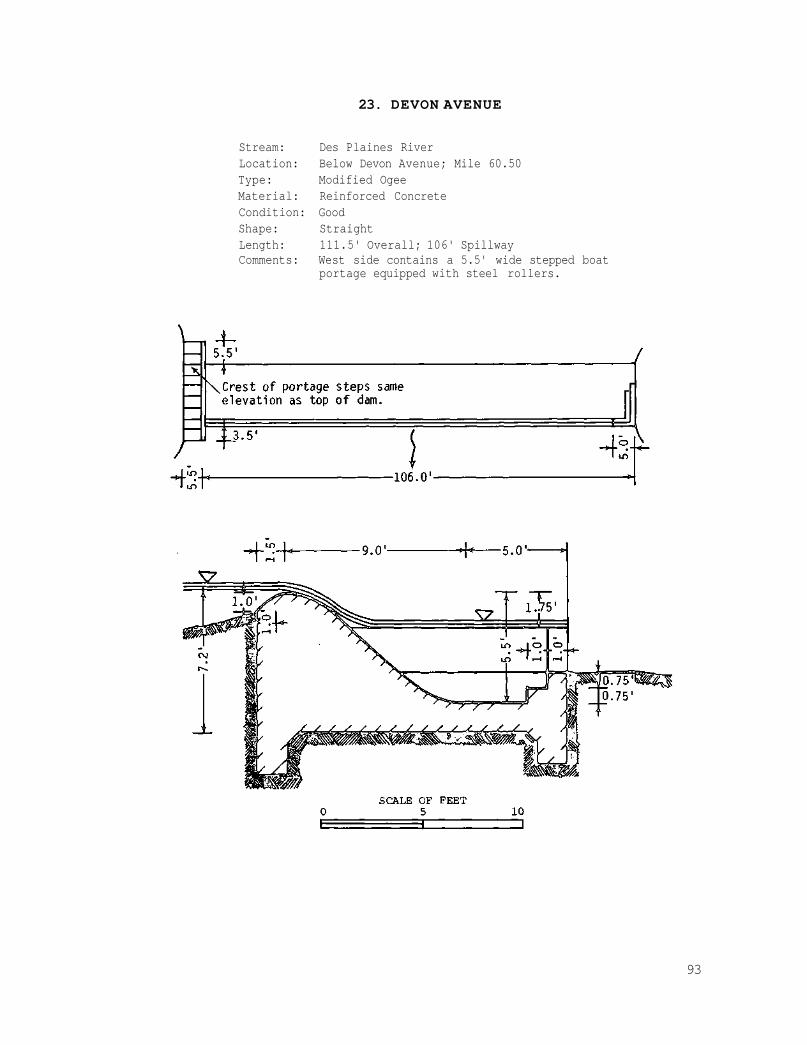
23. DEVON AVENUE
Stream: Des Plaines River Location: Below Devon Avenue; Mile 60.50 Type: Modified Ogee Material: Reinforced Concrete Condition: Good Shape: Straight Length: 111.5' Overall; 106' Spillway Comments: West side contains a 5.5' wide stepped boat
portage equipped with steel rollers.
93

24. Armitage Avenue
23. Devon Avenue
94
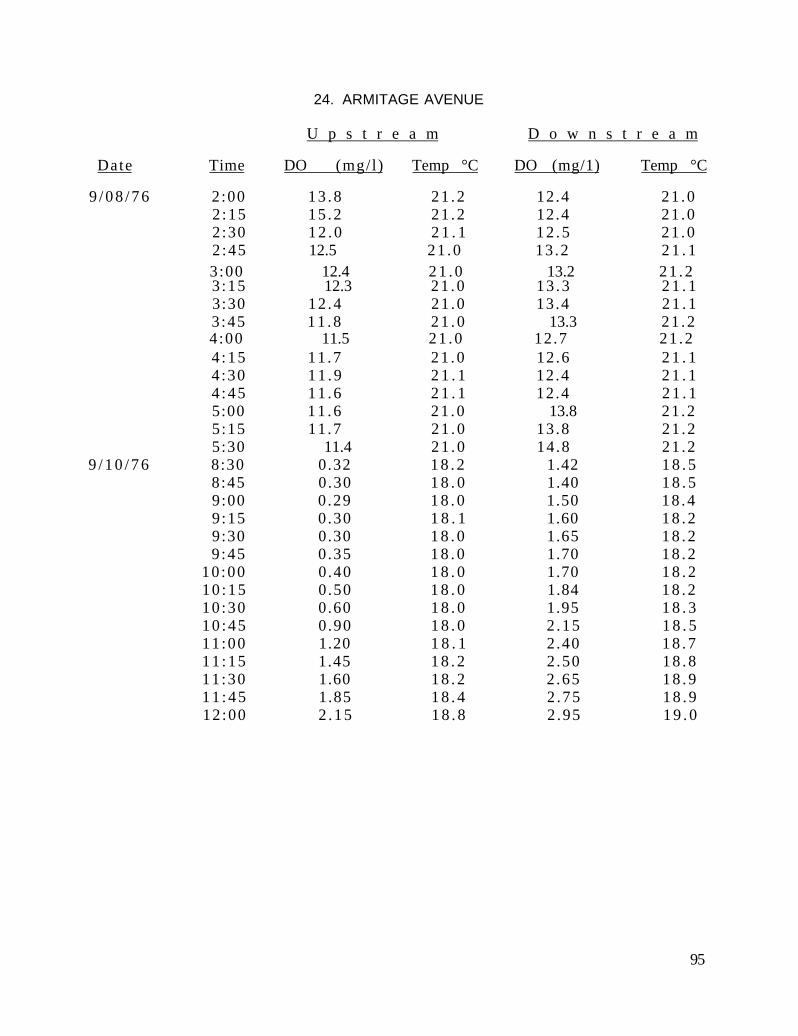
4:00 11.5 2 1 . 0 12.7 21 .2 3 :45 1 1 . 8 2 1 . 0 13.3 21 .2
24. ARMITAGE AVENUE
U p s t r e a m D o w n s t r e a m
Date Time DO (mg/l) Temp °C DO (mg/1) Temp °C
9 / 0 8 / 7 6 2 :00 13 .8 21 .2 12.4 21 .0 2 :15 15 .2 21 .2 12.4 21 .0 2 :30 1 2 . 0 2 1 . 1 12 .5 21 .0 2 :45 12.5 21 .0 13 .2 2 1 . 1 3:00 12.4 2 1 . 0 13.2 21 .2 3 :15 12.3 2 1 . 0 13 .3 2 1 . 1 3:30 12 .4 21 .0 13.4 2 1 . 1
4 :15 11 .7 2 1 . 0 12 .6 2 1 . 1 4 :30 1 1 . 9 2 1 . 1 12.4 2 1 . 1 4 :45 11 .6 2 1 . 1 12.4 2 1 . 1 5:00 1 1 . 6 2 1 . 0 13.8 21 .2 5:15 11 .7 2 1 . 0 13 .8 21 .2 5:30 11.4 2 1 . 0 14 .8 21 .2
9 / 1 0 / 7 6 8:30 0.32 1 8 . 2 1.42 1 8 . 5 8:45 0 .30 1 8 . 0 1.40 1 8 . 5 9:00 0 .29 1 8 . 0 1.50 18 .4 9 :15 0 .30 1 8 . 1 1.60 1 8 . 2 9:30 0.30 1 8 . 0 1.65 1 8 . 2 9 :45 0 .35 1 8 . 0 1.70 1 8 . 2
10 :00 0 .40 1 8 . 0 1.70 1 8 . 2 10 :15 0 .50 1 8 . 0 1.84 1 8 . 2 10 :30 0.60 1 8 . 0 1.95 1 8 . 3 10 :45 0 .90 1 8 . 0 2 .15 1 8 . 5 11 :00 1.20 1 8 . 1 2 .40 1 8 . 7 11 :15 1.45 1 8 . 2 2 .50 1 8 . 8 11 :30 1.60 1 8 . 2 2 .65 1 8 . 9 1 1 : 4 5 1.85 1 8 . 4 2 .75 1 8 . 9 12 :00 2 .15 1 8 . 8 2 .95 1 9 . 0
95
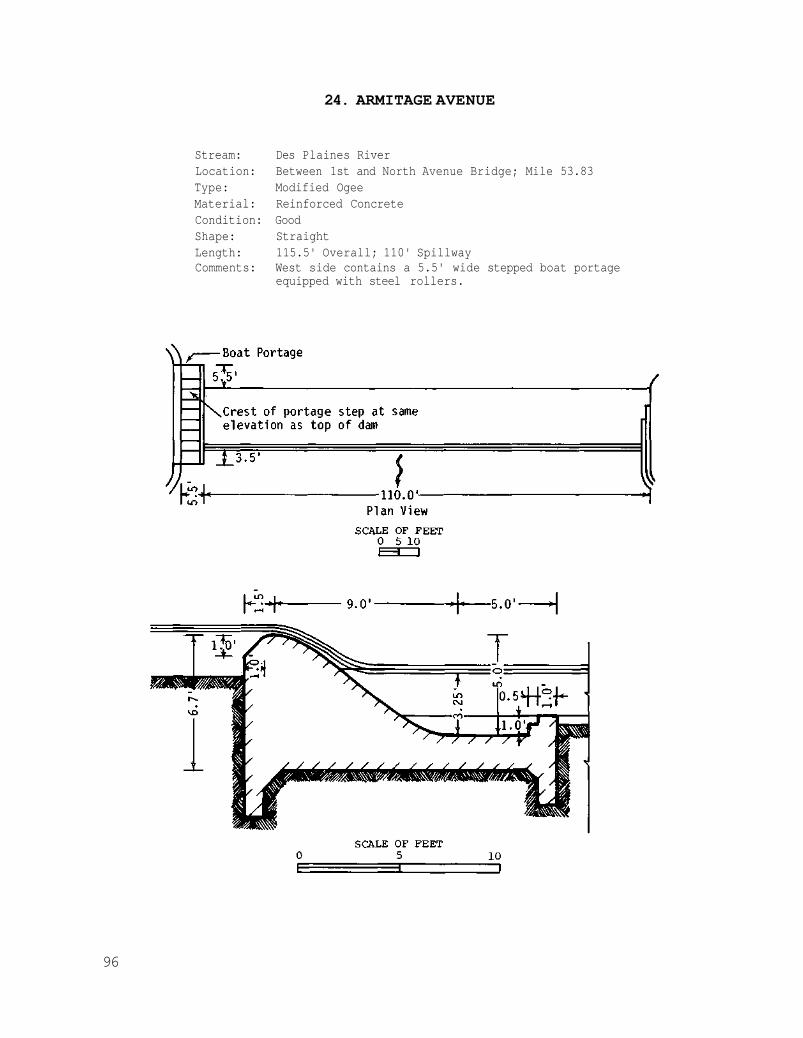
24. ARMITAGE AVENUE
Stream: Des Plaines River Location: Between 1st and North Avenue Bridge; Mile 53.83 Type: Modified Ogee Material: Reinforced Concrete Condition: Good Shape: Straight Length: 115.5' Overall; 110' Spillway Comments: West side contains a 5.5' wide stepped boat portage
equipped with steel rollers.
96

25. HOFFMAN
U p s t r e a m D o w n s t r e a m
D a t e Time DO (mg/1) Temp °C DO (mg/1) Temp °C
8 / 2 5 / 7 6 1 :15 6 . 1 0 2 5 . 0 7 . 4 0 2 4 . 2 1 :30 5 . 3 0 2 4 . 3 7 . 4 0 2 4 . 2 1 : 4 5 5 . 2 0 2 4 . 8 7 . 3 5 2 4 . 2 2 : 0 0 5 . 9 2 2 4 . 9 7 . 4 0 2 4 . 2 2 : 1 5 7 . 0 0 2 5 . 1 7 . 3 0 2 4 . 2 2 : 3 0 6 . 1 0 2 4 . 9 7 . 2 0 2 4 . 1 2 : 4 5 6 . 2 0 2 4 . 8 7 . 2 0 2 4 . 1 3 : 0 0 6 . 9 5 2 5 . 0 7 . 2 5 2 4 . 1 3 : 1 5 6 . 8 9 2 4 . 9 7 . 2 0 2 4 . 1 3 : 3 0 6 . 8 0 2 4 . 9 7 . 4 0 2 4 . 1 3 : 4 5 6 . 9 0 2 4 . 9 7 . 2 0 2 4 . 1 4 : 0 0 7 . 0 0 2 4 . 8 7 . 3 0 2 4 . 1 4 : 1 5 7 . 1 0 2 4 . 8 7 . 2 0 2 4 . 0 4 : 3 0 6 . 8 0 2 4 . 6 7 . 2 5 2 4 . 0 4 : 4 5 6 . 6 5 2 4 . 5 7 . 2 0 2 4 . 0 5 : 0 0 6 . 2 0 2 4 . 3 7 . 1 0 2 4 . 0 5 : 1 5 5 . 6 5 2 3 . 9 7 . 3 0 2 4 . 1
8 / 2 7 / 7 6 9 : 0 0 1 . 4 5 2 4 . 5 4 . 6 5 2 4 . 5 9 : 1 5 1 . 4 2 2 4 . 6 4 . 8 5 2 4 . 5 9 : 3 0 1 . 4 2 2 4 . 6 4 . 8 0 2 4 . 5 9 : 4 5 1 . 5 5 2 4 . 6 4 . 8 0 2 4 . 4
1 0 : 0 0 1 . 6 0 2 4 . 5 4 . 9 1 2 4 . 2 1 0 : 1 5 1 . 4 2 2 4 . 5 4 . 9 0 2 4 . 1 1 0 : 3 0 1 . 3 8 2 4 . 4 4 . 8 7 2 4 . 1 1 0 : 4 5 1 . 3 0 2 4 . 4 4 . 9 5 2 4 . 0 1 1 : 0 0 1 . 3 0 2 4 . 2 4 . 9 0 2 4 . 0 1 1 : 1 5 1 . 2 5 2 4 . 2 4 . 8 8 2 4 . 0 1 1 : 3 0 1 . 4 0 2 4 . 4 4 . 9 0 2 4 . 0 1 1 : 4 5 1 . 4 0 2 4 . 7 4 . 9 8 2 4 . 0 1 2 : 0 0 1 . 7 0 2 4 . 9 4 . 9 0 2 4 . 1
97
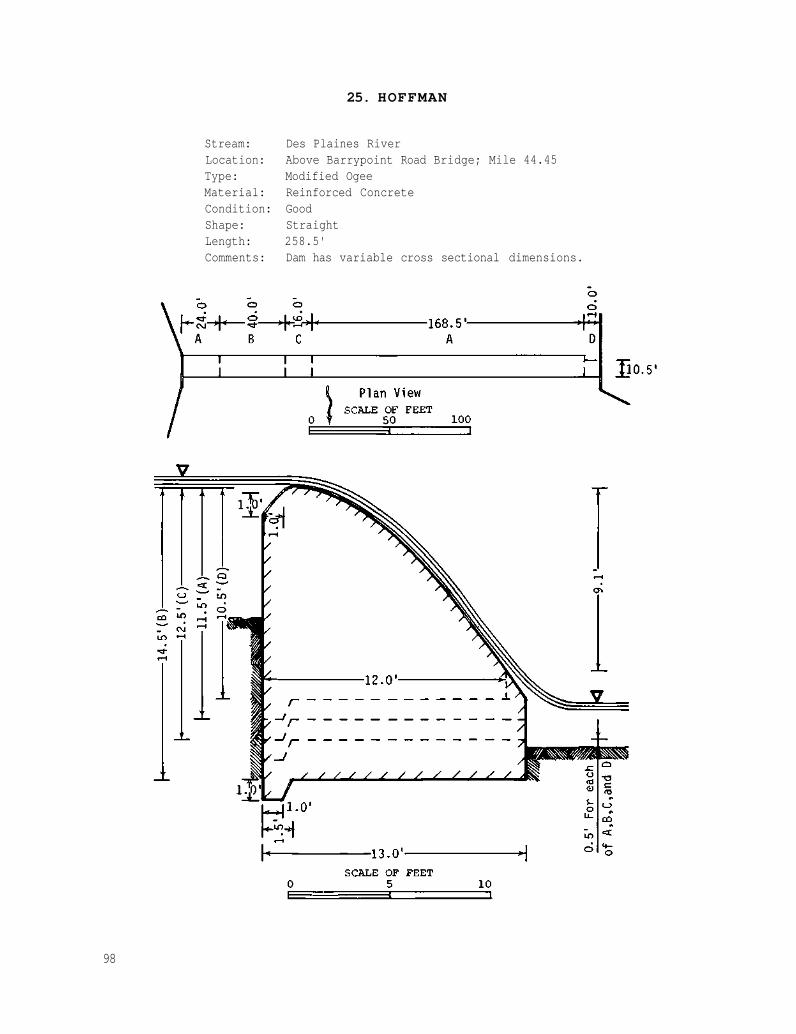
25. HOFFMAN
Stream: Des Plaines River Location: Above Barrypoint Road Bridge; Mile 44.45 Type: Modified Ogee Material: Reinforced Concrete Condition: Good Shape: Straight Length: 258.5' Comments: Dam has variable cross sectional dimensions.
98
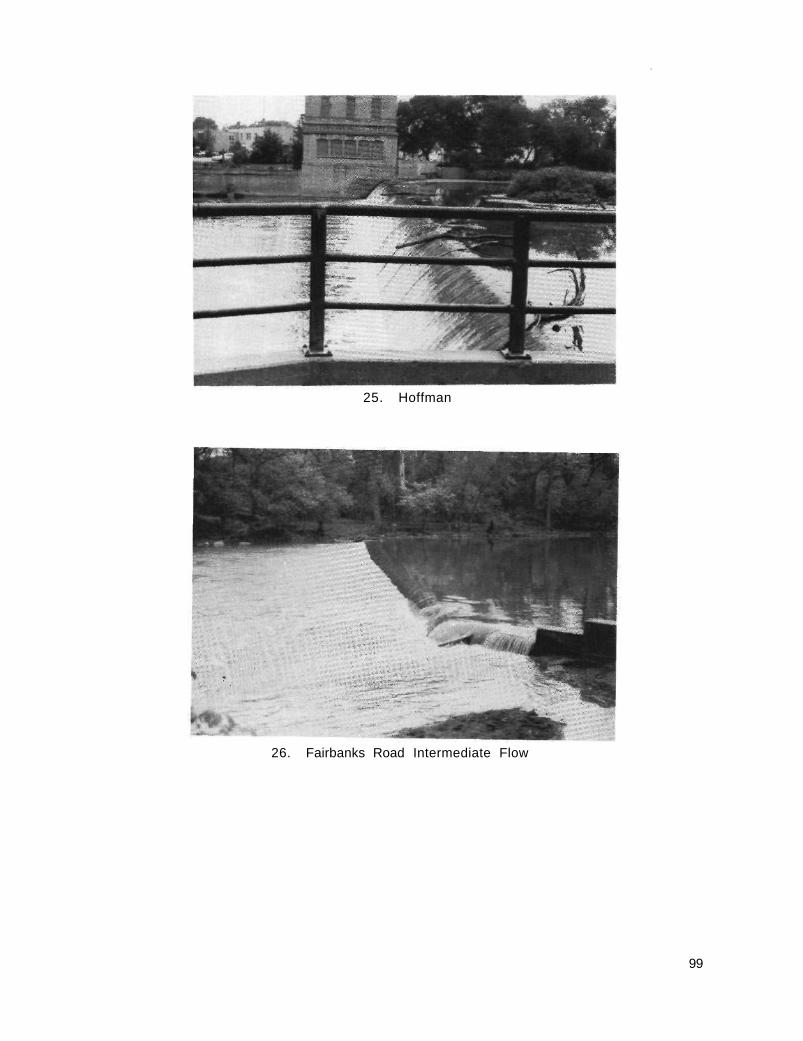
26. Fairbanks Road Intermediate Flow
25. Hoffman
99

26. FAIRBANKS ROAD
U p s t r e a m D o w n s t r e a m
D a t e Time DO (mg/1 ) Temp °C DO (mg/1) Temp °C
8 / 2 6 / 7 6 9 : 1 5 4 . 4 0 2 3 . 5 5 . 9 0 2 3 . 4 9 : 3 0 4 . 4 0 2 3 . 6 5 . 8 0 2 3 . 4 9 : 4 5 4 . 5 0 2 3 . 8 5 . 8 0 2 3 . 3
1 0 : 0 0 4 . 6 5 2 3 . 9 5 . 9 0 2 3 . 5 1 0 : 1 5 4 . 8 0 2 4 . 0 5 . 9 0 2 3 . 5 1 0 : 3 0 4 . 9 0 2 4 . 0 6 . 0 0 2 3 . 7 1 0 : 4 5 5 . 0 5 2 4 . 1 6 . 0 0 2 3 . 8 1 1 : 0 0 5 . 2 0 2 4 . 2 6 . 0 2 2 3 . 9 1 1 : 1 5 5 . 3 5 2 4 . 3 6 . 1 0 2 3 . 9 1 1 : 3 0 5 . 5 5 2 4 . 5 6 . 1 5 2 4 . 0 1 1 : 4 5 5 . 7 0 2 4 . 7 6 . 2 1 2 4 . 0 1 2 : 0 0 5 . 8 3 2 4 . 7 6 . 3 0 2 4 . 0 1 2 : 1 5 6 . 0 0 2 4 . 8 6 . 3 3 2 4 . 1 1 2 : 3 0 6 . 0 9 2 4 . 8 6 . 3 7 2 4 . 1 1 2 : 4 5 6 . 1 0 2 4 . 8 6 . 3 0 2 4 . 2
1 : 0 0 6 . 2 0 2 4 . 8 6 . 4 0 2 4 . 2 1 : 1 5 6 . 3 0 2 4 . 9 6 . 3 0 2 4 . 2 1 :30 6 . 3 0 2 4 . 9 6 . 3 5 2 4 . 2 1 : 4 5 6 . 3 0 2 5 . 0 6 . 3 5 2 4 . 4 2 : 0 0 6 . 3 0 2 5 . 0 6 . 3 0 2 4 . 5 2 : 1 5 6 . 1 5 2 5 . 0 6 . 2 0 2 4 . 5 2 : 3 0 6 . 2 0 2 5 . 0 6 . 3 0 2 4 . 7 2 : 4 5 6 . 1 2 2 5 . 5 6 . 3 0 2 4 . 7 3 : 0 0 6 . 1 0 2 5 . 1 6 . 1 0 2 4 . 8 3 : 1 5 6 . 0 5 2 5 . 1 6 . 1 0 2 4 . 9 3 : 3 0 6 . 0 0 2 5 . 2 6 . 0 3 2 4 . 9 3 : 4 5 6 . 1 0 2 5 . 2 6 . 0 0 2 4 . 9 4 : 0 0 6 . 0 0 2 5 . 2 5 . 9 0 2 4 . 9 4 : 1 5 6 . 0 0 2 5 . 3 5 . 9 0 2 4 . 9 4 : 3 0 5 . 8 0 2 5 . 3 5 . 9 0 2 4 . 9 4 : 4 5 5 . 8 0 2 5 . 3 5 . 8 0 2 4 . 9 5 : 0 0 5 . 6 5 2 5 . 3 5 . 9 0 2 4 . 9 5 : 1 5 5 . 5 0 2 5 . 2 5 . 8 5 2 4 . 9
100
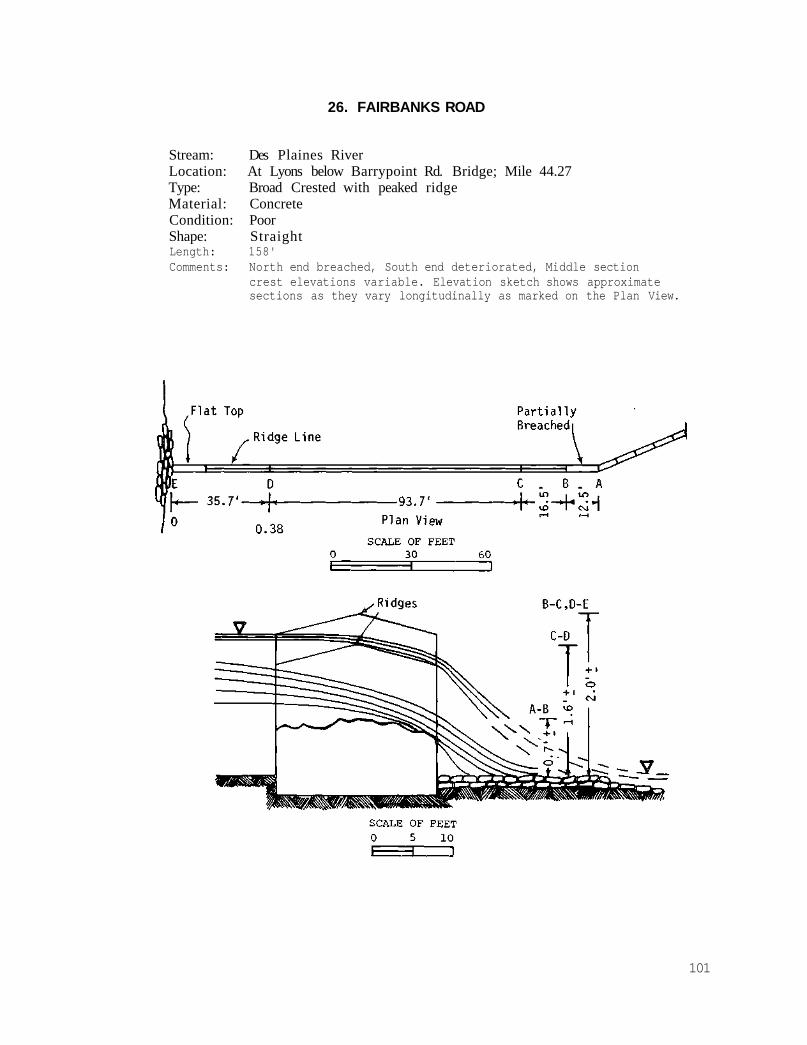
26. FAIRBANKS ROAD
Stream: Des Plaines River Location: At Lyons below Barrypoint Rd. Bridge; Mile 44.27 Type: Broad Crested with peaked ridge Material: Concrete Condition: Poor Shape: Straight Length: 158' Comments: North end breached, South end deteriorated, Middle section
crest elevations variable. Elevation sketch shows approximate sections as they vary longitudinally as marked on the Plan View.
101
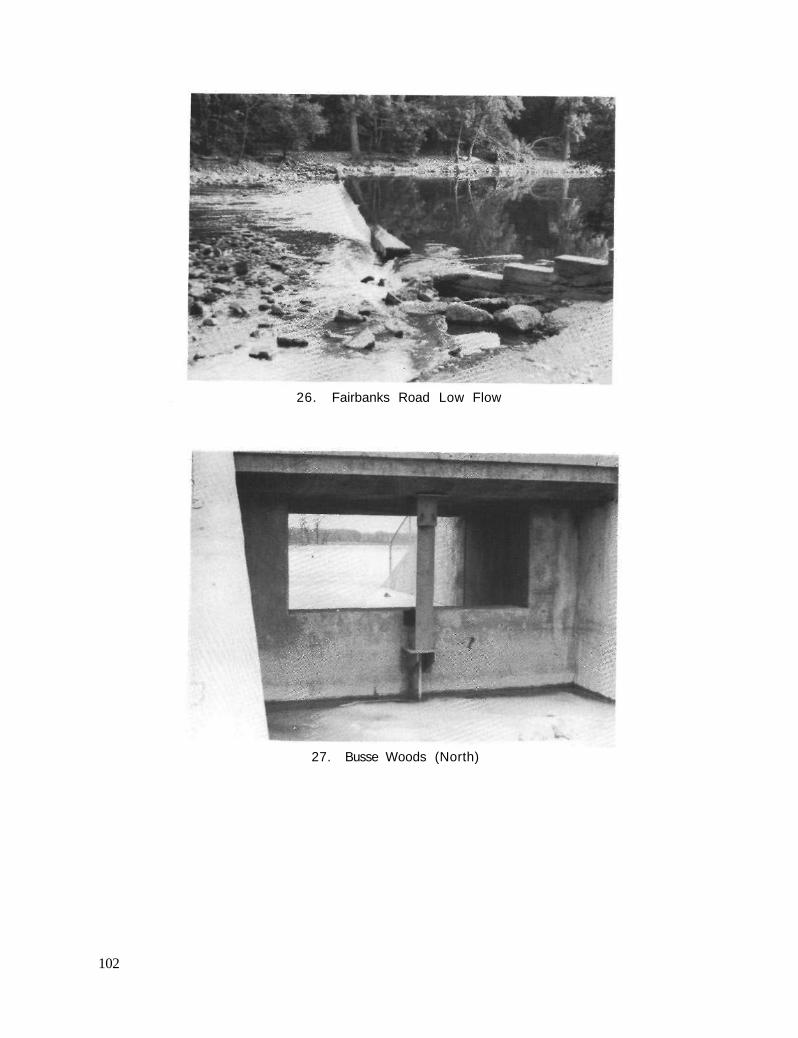
27. Busse Woods (North)
26. Fairbanks Road Low Flow
102

27. BUSSE WOODS (NORTH) (No observed data)
Stream: West Branch Salt Creek Location: Above abandoned Bisner Road; Mile 33.13 Type: Broad Crested Material: Reinforced Concrete Condition: Excellent Shape: Straight Length: 14' Comments: Small structure completed during 1977 and not overflowing
as of Apri l 1978.
103

28. BUSSE WOODS (MIDDLE)
U p s t r e a m D o w n s t r e a m
Date Time DO (mg/1) Temp °C DO (mg/1) Temp °C
4 / 6 / 7 7 8:50 1 0 . 0 6 .8 1 0 . 2 7 .0 9 :00 9 .5 6 .8 1 0 . 2 7 .0 9:15 9.4 6 .8 10 .2 7 .0 9:30 9 . 1 6 .8 1 0 . 1 7.0 9 :45 9 .0 6 . 9 1 0 . 1 7 . 0
10 :00 9.0 6 .8 10 .2 7 .0 10 :15 9 .3 6 .8 1 0 . 3 7 .0 10 :30 8 .9 6 .8 1 0 . 3 7 . 1 10 :45 8.9 6 .9 1 0 . 1 7 .0 11 :00 8.9 7 . 0 1 0 . 1 7 .0 1 1 : 1 5 8.8 6 . 9 1 0 . 1 7 .0 11 :30 8.9 7 . 0 10 .2 7 .0 11 :45 8.8 7 . 0 10 .2 7 . 1 12 :00 8.8 7 . 0 1 0 . 2 7 . 1 12 :15 8.7 7 . 0 1 0 . 1 7 . 1 12 :30 8.7 7 . 0 1 0 . 1 7 . 1 12 :45 8.7 7 . 0 1 0 . 1 7 . 1
1:00 8.7 7 . 0 1 0 . 1 7.1 1:15 8.7 7 . 0 1 0 . 0 7 . 1 1:30 8.7 7 . 1 1 0 . 1 7 . 1 1:45 8.7 7 . 0 1 0 . 0 7 . 1 2 :00 8.7 7 . 0 1 0 . 1 7 .0 2 :15 8.7 7 . 1 1 0 . 2 7 .2 2:30 8.7 7 .2 10 .2 7 .2 2 :45 8.7 7 .2 10 .2 7 .2 3 :00 8.7 7 . 3 1 0 . 2 7 .2 3 :15 8.7 7 .2 10 .2 7 . 3 3:30 8 .8 7 .2 10 .2 7 .2 3:45 8.8 7 . 3 1 0 . 3 7 . 3 4 :00 8.7 7 . 3 10 .2 7 . 3
104

28. BUSSE WOODS (MIDDLE)
Stream: West Branch Salt Creek Location: Below abandoned Bisner Road; Mile 32.85 Type: Broad Crested Material: Reinforced Concrete Shape: Straight Length: 73.0' Comments: Newly Constructed
105
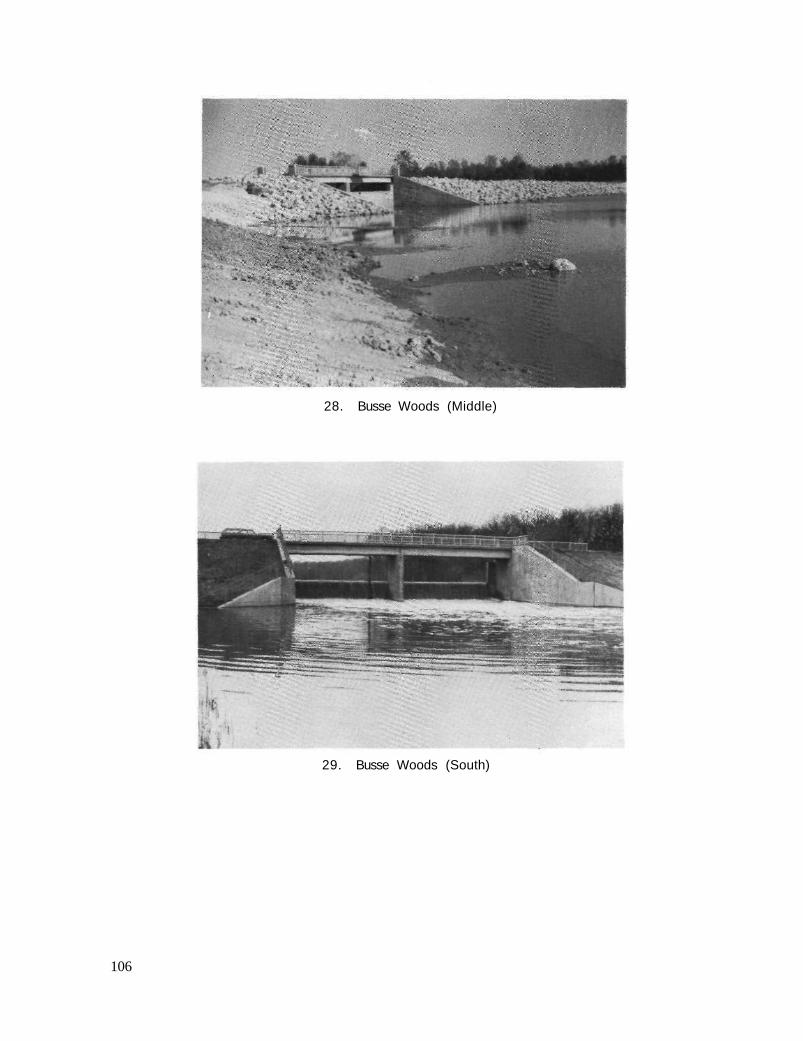
29. Busse Woods (South)
28. Busse Woods (Middle)
106
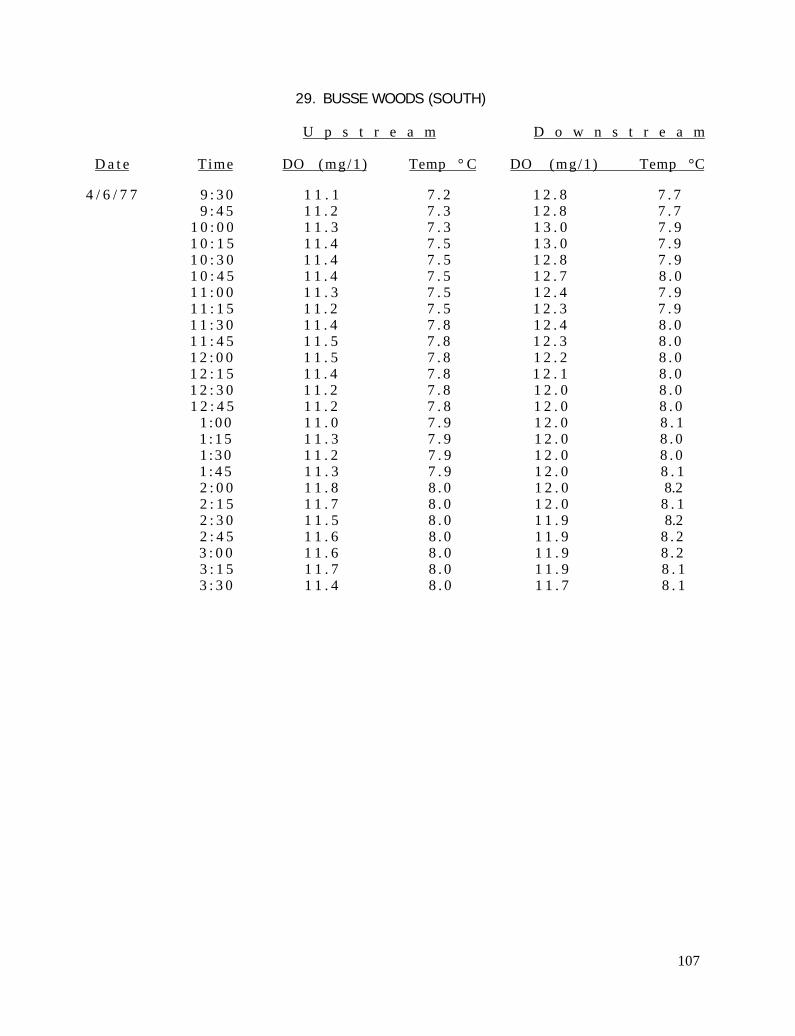
29. BUSSE WOODS (SOUTH)
U p s t r e a m D o w n s t r e a m
D a t e Time DO (mg/1 ) Temp ° C DO (mg/1) Temp °C
4 / 6 / 7 7 9 : 3 0 1 1 . 1 7 . 2 1 2 . 8 7 . 7 9 : 4 5 1 1 . 2 7 . 3 1 2 . 8 7 . 7
1 0 : 0 0 1 1 . 3 7 . 3 1 3 . 0 7 . 9 1 0 : 1 5 1 1 . 4 7 . 5 1 3 . 0 7 . 9 1 0 : 3 0 1 1 . 4 7 . 5 1 2 . 8 7 . 9 1 0 : 4 5 1 1 . 4 7 . 5 1 2 . 7 8 . 0 1 1 : 0 0 1 1 . 3 7 . 5 1 2 . 4 7 . 9 1 1 : 1 5 1 1 . 2 7 . 5 1 2 . 3 7 . 9 1 1 : 3 0 1 1 . 4 7 . 8 1 2 . 4 8 . 0 1 1 : 4 5 1 1 . 5 7 . 8 1 2 . 3 8 . 0 1 2 : 0 0 1 1 . 5 7 . 8 1 2 . 2 8 . 0 1 2 : 1 5 1 1 . 4 7 . 8 1 2 . 1 8 . 0 1 2 : 3 0 1 1 . 2 7 . 8 1 2 . 0 8 . 0 1 2 : 4 5 1 1 . 2 7 . 8 1 2 . 0 8 . 0
1 : 0 0 1 1 . 0 7 . 9 1 2 . 0 8 . 1 1 : 1 5 1 1 . 3 7 . 9 1 2 . 0 8 . 0 1 :30 1 1 . 2 7 . 9 1 2 . 0 8 . 0 1 : 4 5 1 1 . 3 7 . 9 1 2 . 0 8 . 1 2 : 0 0 1 1 . 8 8 . 0 1 2 . 0 8.2 2 : 1 5 1 1 . 7 8 . 0 1 2 . 0 8 . 1 2 : 3 0 1 1 . 5 8 . 0 1 1 . 9 8.2 2 : 4 5 1 1 . 6 8 . 0 1 1 . 9 8 . 2 3 : 0 0 1 1 . 6 8 . 0 1 1 . 9 8 . 2 3 : 1 5 1 1 . 7 8 . 0 1 1 . 9 8 . 1 3 : 3 0 1 1 . 4 8 . 0 1 1 . 7 8 . 1
107

29. BUSSE WOODS (SOUTH)
Stream: Salt Creek Location: Above Arlington Heights Road; Mile 31.70 Type: Broad Crested Material: Reinforced Concrete Condition: Excellent Shape: Straight Length: 76.5' Comment: Newly Constructed
108
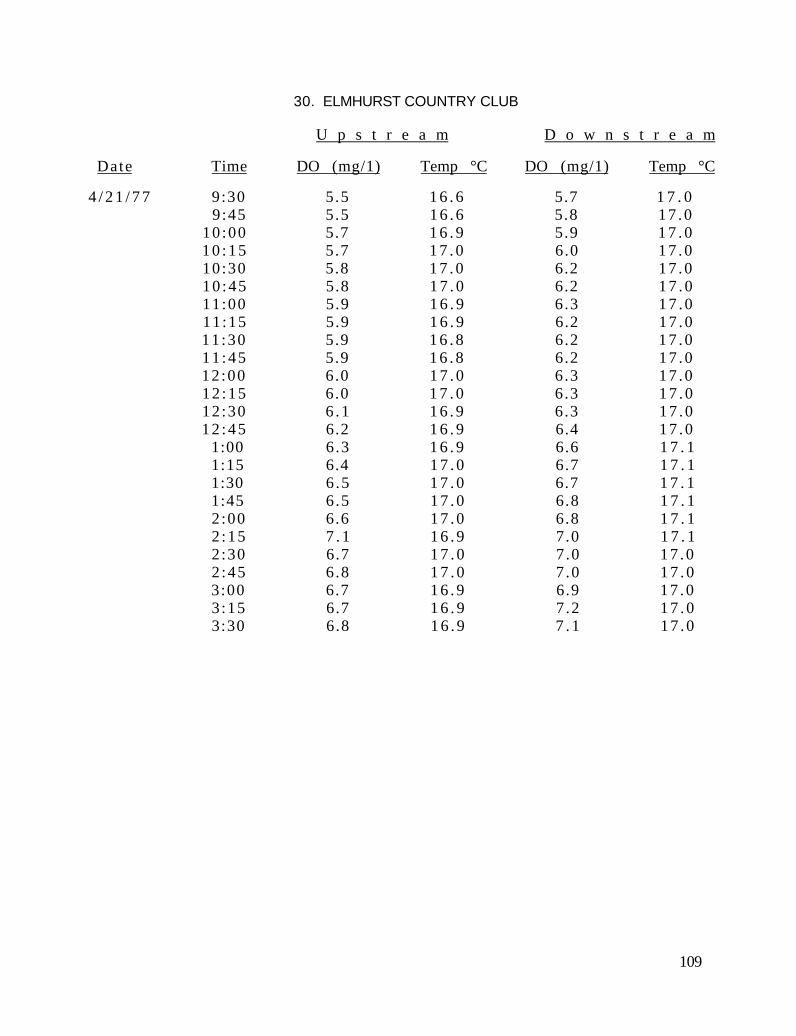
30. ELMHURST COUNTRY CLUB
U p s t r e a m D o w n s t r e a m
Date Time DO (mg/1) Temp °C DO (mg/1) Temp °C
4 / 2 1 / 7 7 9:30 5.5 1 6 . 6 5.7 1 7 . 0 9:45 5.5 1 6 . 6 5.8 17 .0
10 :00 5.7 1 6 . 9 5.9 1 7 . 0 10 :15 5.7 1 7 . 0 6.0 1 7 . 0 10:30 5.8 1 7 . 0 6.2 17 .0 10 :45 5.8 1 7 . 0 6.2 1 7 . 0 11:00 5.9 1 6 . 9 6.3 1 7 . 0 11:15 5.9 1 6 . 9 6.2 17 .0 11 :30 5.9 1 6 . 8 6.2 1 7 . 0 11 :45 5.9 1 6 . 8 6.2 17 .0 12 :00 6.0 1 7 . 0 6.3 17 .0 12 :15 6.0 1 7 . 0 6.3 1 7 . 0 12 :30 6 .1 1 6 . 9 6.3 17 .0 12 :45 6.2 1 6 . 9 6.4 17 .0
1:00 6.3 1 6 . 9 6.6 1 7 . 1 1:15 6.4 1 7 . 0 6.7 1 7 . 1 1:30 6 .5 1 7 . 0 6.7 1 7 . 1 1:45 6.5 1 7 . 0 6.8 1 7 . 1 2 :00 6.6 1 7 . 0 6.8 1 7 . 1 2 :15 7 . 1 1 6 . 9 7.0 1 7 . 1 2 :30 6.7 1 7 . 0 7 .0 17 .0 2 :45 6.8 1 7 . 0 7 .0 1 7 . 0 3:00 6.7 1 6 . 9 6.9 17 .0 3 :15 6.7 1 6 . 9 7 .2 1 7 . 0 3:30 6.8 1 6 . 9 7 . 1 17 .0
109
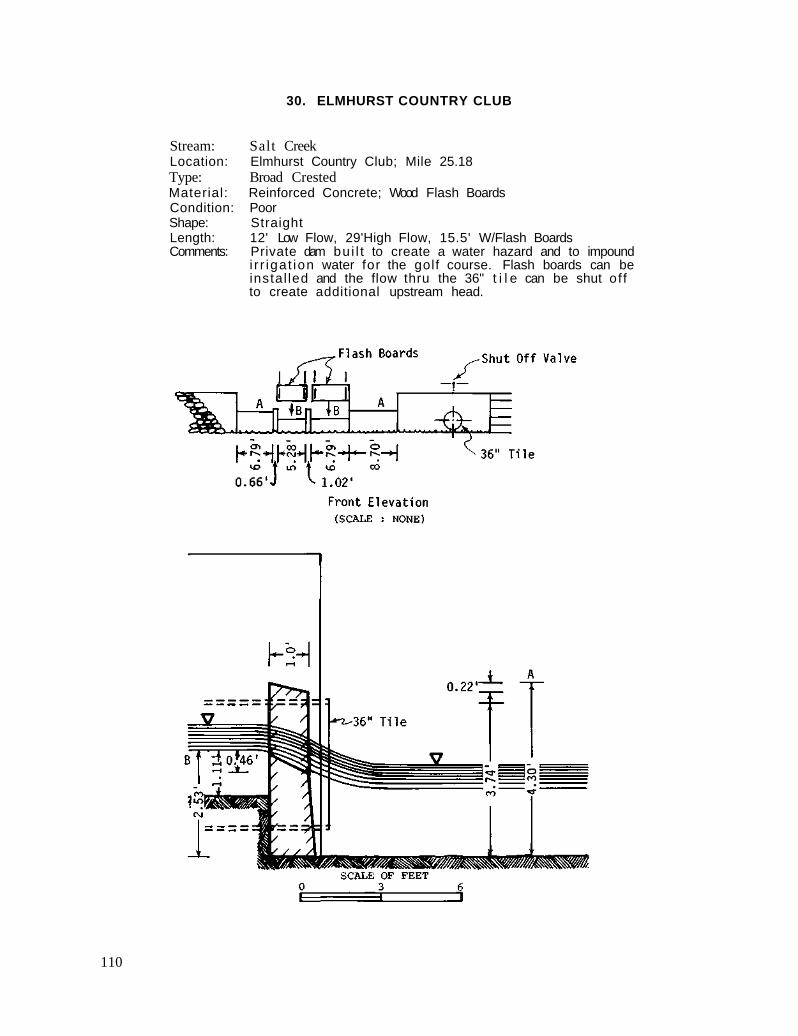
30. ELMHURST COUNTRY CLUB
Stream: Salt Creek Location: Elmhurst Country Club; Mile 25.18 Type: Broad Crested Material: Reinforced Concrete; Wood Flash Boards Condition: Poor Shape: Straight Length: 12' Low Flow, 29'High Flow, 15.5' W/Flash Boards Comments: Private dam bu i l t to create a water hazard and to impound
i r r iga t ion water for the golf course. Flash boards can be instal led and the flow thru the 36" t i l e can be shut of f to create additional upstream head.
110
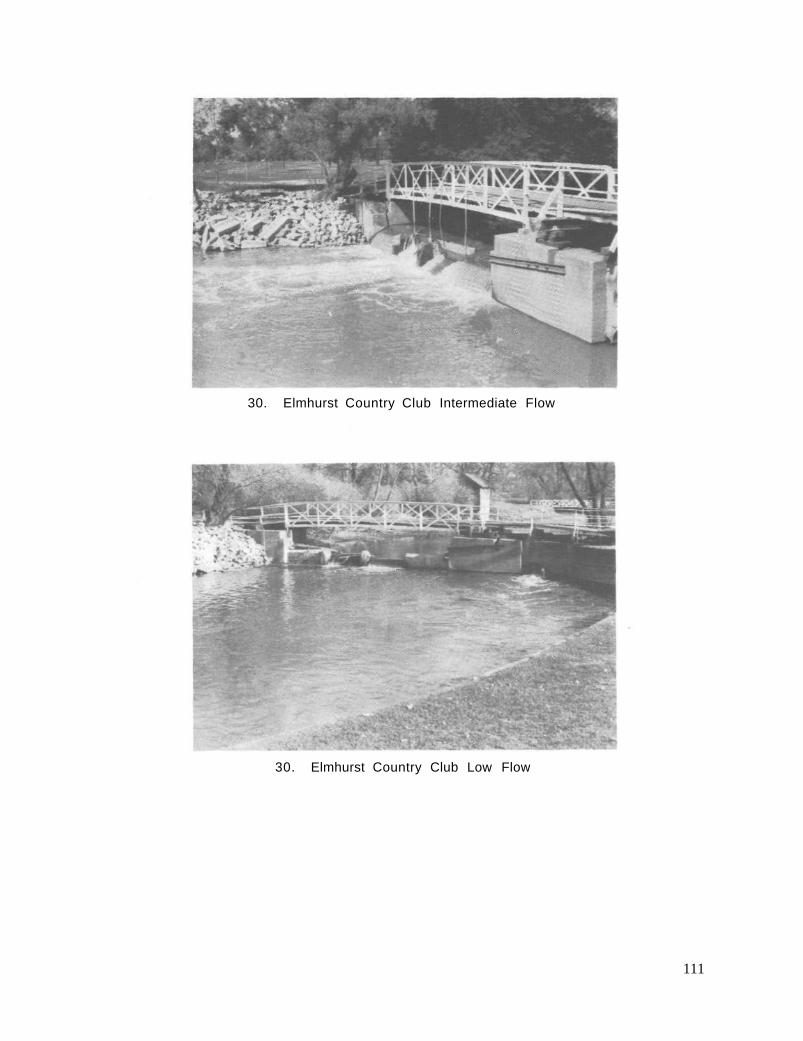
30. Elmhurst Country Club Low Flow
30. Elmhurst Country Club Intermediate Flow
111

31. OAK BROOK
U p s t r e a m D o w n s t r e a m
Date Time DO (mg/1) Temp °C DO ( m g / 1 ) Temp °C
4/20/77 9:30 4.0 16.4 5,3 16.4 9:45 3.8 16.3 4.0 16.4
Diversion 10:00 3.7 16.3 4.1 16.4 Gates 10:15 3.7 16.3 3.7 16.3 0pen 10:30 3.8 16.3 3.6 16.3
10:45 3.9 16.3 5.8 16.3 Diversion 11:00 3.8 16.3 5,9 16.3 Gates 11:15 3.8 16.3 6.0 16.5 Closed 11:30 4.0 16.8 5,9 16.5
11:45 4.1 16.9 5.9 16.6 12:00 4.1 16.9 5,9 16.7 12:15 3.9 17.0 6.0 16.8 12:30 3.9 17.0 5.9 16.9 12:45 4.3 17.1 5.9 17.0 1:00 4.4 17.2 5.9 17.0 1:15 4.5 17.5 6.0 17.0 1:30 4.6 17.5 6.0 17.0 1:45 4.4 17.4 6.0 17.1 2:00 4.4 17.2 6.0 17.1 2:15 4.8 17.0 6.3 17.0 2:30 4.7 17.0 6.4 15.0 2:45 4.7 17.5 7.0 14.0 3:00 4.5 18.0 6.3 14.0 3:15 4.8 17.8 6.3 14.2 3:30 4.8 17.8 6.3 14.2
112
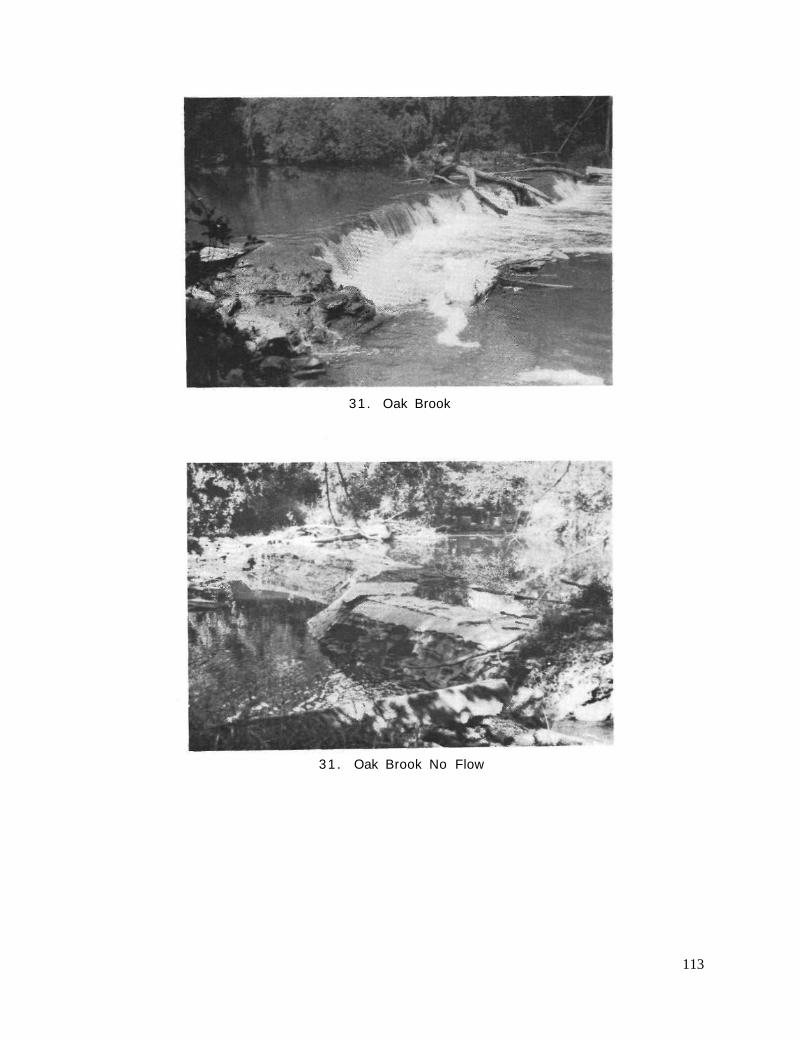
31 . Oak Brook No Flow
31 . Oak Brook
113

31-31A. OAK BROOK
Stream: Salt Creek Location: Below 31st Street Bridge; Mile 13.53 Type: Broad Crested Material: Concrete Faced Stone Slab Condition: Poor Shape: Serpentine Length: 73' Comments: Access to dam difficult; located on private property
(a riding stable). Flow can be diverted around the dam via two 6' sluice gates located on a bypass channel on the west end of the dam.
114
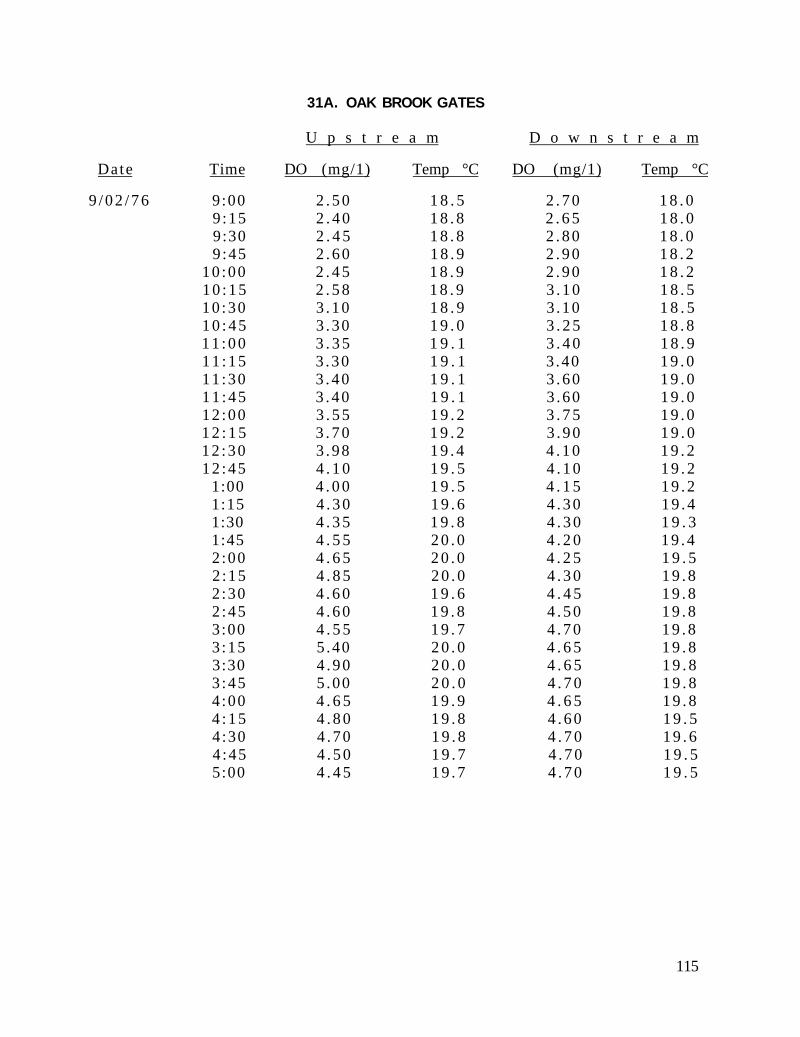
31A. OAK BROOK GATES
U p s t r e a m D o w n s t r e a m
Date Time DO (mg/1) Temp °C DO (mg/1) Temp °C
9 / 0 2 / 7 6 9:00 2 . 5 0 1 8 . 5 2 . 7 0 1 8 . 0 9 :15 2 . 4 0 1 8 . 8 2 . 6 5 1 8 . 0 9:30 2 . 4 5 1 8 . 8 2 . 8 0 1 8 . 0 9 :45 2 . 6 0 1 8 . 9 2 . 9 0 1 8 . 2
10 :00 2 . 4 5 1 8 . 9 2 . 9 0 1 8 . 2 1 0 : 1 5 2 . 5 8 1 8 . 9 3 . 1 0 1 8 . 5 10 :30 3 .10 1 8 . 9 3 .10 1 8 . 5 1 0 : 4 5 3 .30 1 9 . 0 3 . 2 5 1 8 . 8 1 1 : 0 0 3 . 3 5 1 9 . 1 3 . 4 0 1 8 . 9 1 1 : 1 5 3 .30 1 9 . 1 3 .40 1 9 . 0 11 :30 3 . 4 0 1 9 . 1 3 . 6 0 1 9 . 0 1 1 : 4 5 3 . 4 0 1 9 . 1 3 .60 1 9 . 0 12 :00 3 . 5 5 1 9 . 2 3 . 7 5 1 9 . 0 1 2 : 1 5 3 . 7 0 1 9 . 2 3 . 9 0 1 9 . 0 12 :30 3 .98 1 9 . 4 4 . 1 0 1 9 . 2 12 :45 4 . 1 0 1 9 . 5 4 . 1 0 1 9 . 2
1:00 4 . 0 0 1 9 . 5 4 . 1 5 1 9 . 2 1:15 4 . 3 0 1 9 . 6 4 . 3 0 1 9 . 4 1:30 4 . 3 5 1 9 . 8 4 . 3 0 1 9 . 3 1:45 4 . 5 5 2 0 . 0 4 . 2 0 1 9 . 4 2 :00 4 . 6 5 2 0 . 0 4 . 2 5 1 9 . 5 2 :15 4 . 8 5 2 0 . 0 4 . 3 0 1 9 . 8 2 :30 4 . 6 0 1 9 . 6 4 . 4 5 1 9 . 8 2 :45 4 . 6 0 1 9 . 8 4 . 5 0 1 9 . 8 3:00 4 . 5 5 1 9 . 7 4 . 7 0 1 9 . 8 3 :15 5 .40 2 0 . 0 4 . 6 5 1 9 . 8 3:30 4 . 9 0 2 0 . 0 4 . 6 5 1 9 . 8 3 :45 5 .00 2 0 . 0 4 . 7 0 1 9 . 8 4 :00 4 . 6 5 1 9 . 9 4 . 6 5 1 9 . 8 4 : 1 5 4 . 8 0 1 9 . 8 4 . 6 0 1 9 . 5 4 :30 4 . 7 0 1 9 . 8 4 . 7 0 1 9 . 6 4 :45 4 . 5 0 1 9 . 7 4 . 7 0 1 9 . 5 5:00 4 . 4 5 1 9 . 7 4 . 7 0 1 9 . 5
115
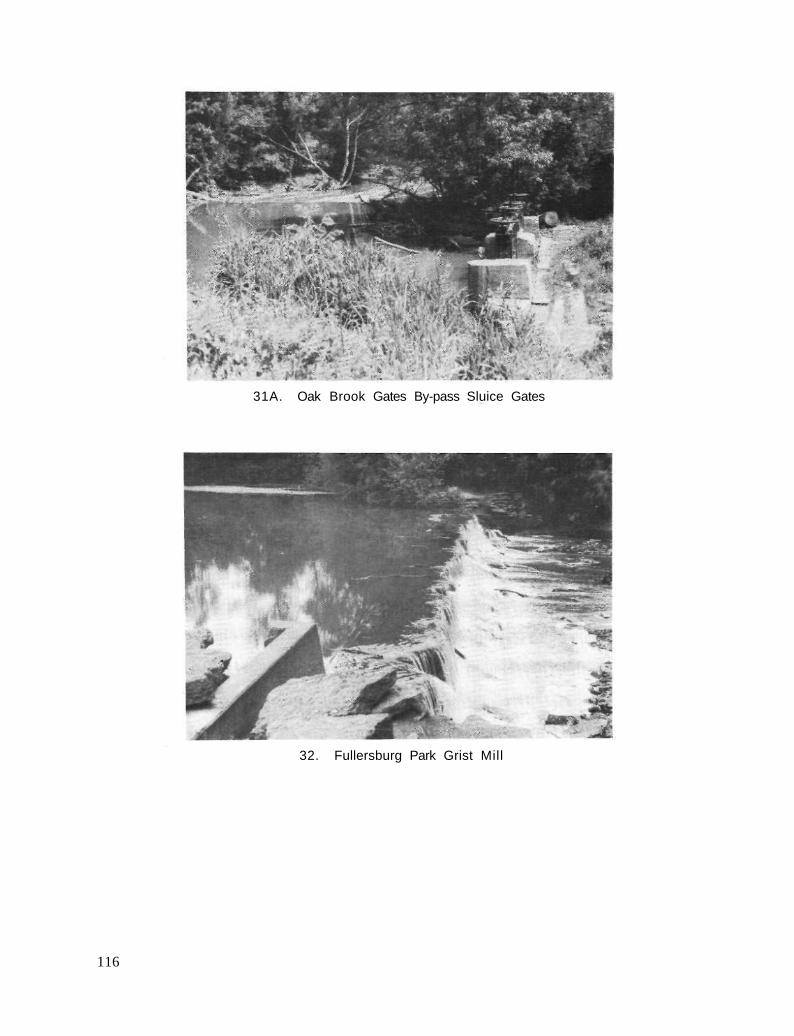
32. Fullersburg Park Grist Mill
31A. Oak Brook Gates By-pass Sluice Gates
116
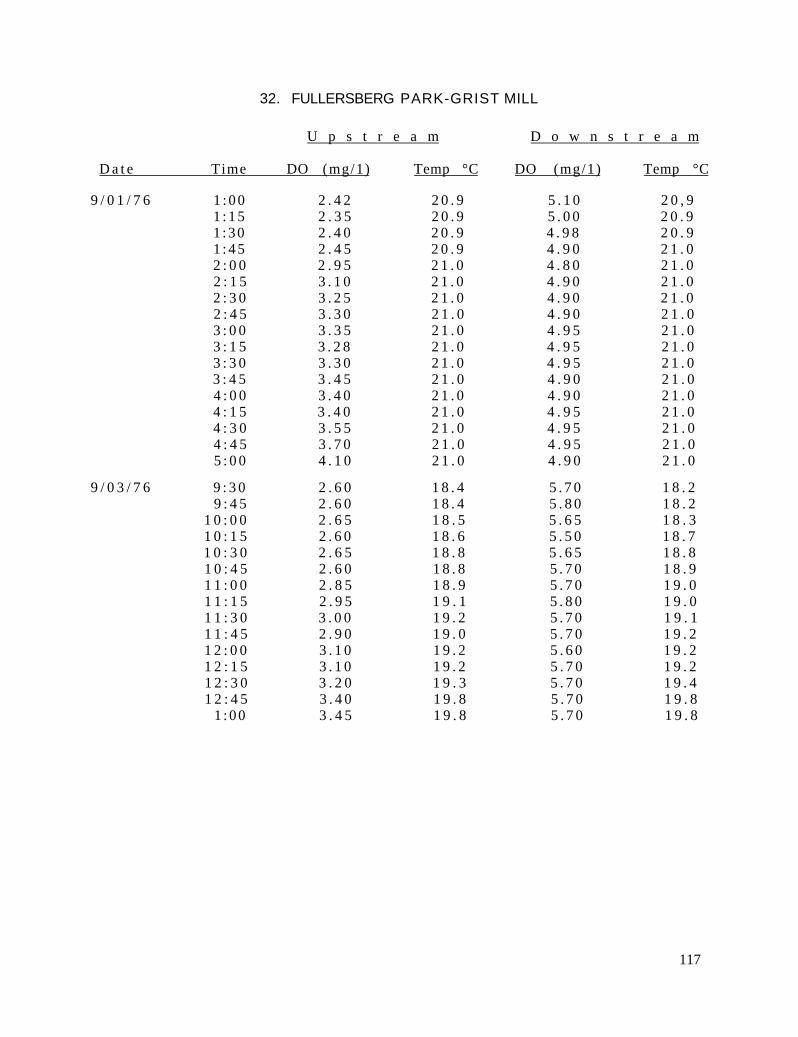
32. FULLERSBERG PARK-GRIST MILL
U p s t r e a m D o w n s t r e a m
D a t e Time DO (mg/1) Temp °C DO (mg/1) Temp °C
9 / 0 1 / 7 6 1 : 0 0 2 . 4 2 2 0 . 9 5 . 1 0 2 0 , 9 1 : 1 5 2 . 3 5 2 0 . 9 5 . 0 0 2 0 . 9 1 : 3 0 2 . 4 0 2 0 . 9 4 . 9 8 2 0 . 9 1 : 4 5 2 . 4 5 2 0 . 9 4 . 9 0 2 1 . 0 2 : 0 0 2 . 9 5 2 1 . 0 4 . 8 0 2 1 . 0 2 : 1 5 3 . 1 0 2 1 . 0 4 . 9 0 2 1 . 0 2 : 3 0 3 . 2 5 2 1 . 0 4 . 9 0 2 1 . 0 2 : 4 5 3 . 3 0 2 1 . 0 4 . 9 0 2 1 . 0 3 : 0 0 3 . 3 5 2 1 . 0 4 . 9 5 2 1 . 0 3 : 1 5 3 . 2 8 2 1 . 0 4 . 9 5 2 1 . 0 3 : 3 0 3 . 3 0 2 1 . 0 4 . 9 5 2 1 . 0 3 : 4 5 3 . 4 5 2 1 . 0 4 . 9 0 2 1 . 0 4 : 0 0 3 . 4 0 2 1 . 0 4 . 9 0 2 1 . 0 4 : 1 5 3 . 4 0 2 1 . 0 4 . 9 5 2 1 . 0 4 : 3 0 3 . 5 5 2 1 . 0 4 . 9 5 2 1 . 0 4 : 4 5 3 . 7 0 2 1 . 0 4 . 9 5 2 1 . 0 5 : 0 0 4 . 1 0 2 1 . 0 4 . 9 0 2 1 . 0
9 / 0 3 / 7 6 9 : 3 0 2 . 6 0 1 8 . 4 5 . 7 0 1 8 . 2 9 : 4 5 2 . 6 0 1 8 . 4 5 . 8 0 1 8 . 2
1 0 : 0 0 2 . 6 5 1 8 . 5 5 . 6 5 1 8 . 3 1 0 : 1 5 2 . 6 0 1 8 . 6 5 . 5 0 1 8 . 7 1 0 : 3 0 2 . 6 5 1 8 . 8 5 . 6 5 1 8 . 8 1 0 : 4 5 2 . 6 0 1 8 . 8 5 . 7 0 1 8 . 9 1 1 : 0 0 2 . 8 5 1 8 . 9 5 . 7 0 1 9 . 0 1 1 : 1 5 2 . 9 5 1 9 . 1 5 . 8 0 1 9 . 0 1 1 : 3 0 3 . 0 0 1 9 . 2 5 . 7 0 1 9 . 1 1 1 : 4 5 2 . 9 0 1 9 . 0 5 . 7 0 1 9 . 2 1 2 : 0 0 3 . 1 0 1 9 . 2 5 . 6 0 1 9 . 2 1 2 : 1 5 3 . 1 0 1 9 . 2 5 . 7 0 1 9 . 2 1 2 : 3 0 3 . 2 0 1 9 . 3 5 . 7 0 1 9 . 4 1 2 : 4 5 3 . 4 0 1 9 . 8 5 . 7 0 1 9 . 8
1 : 0 0 3 . 4 5 1 9 . 8 5 . 7 0 1 9 . 8
117
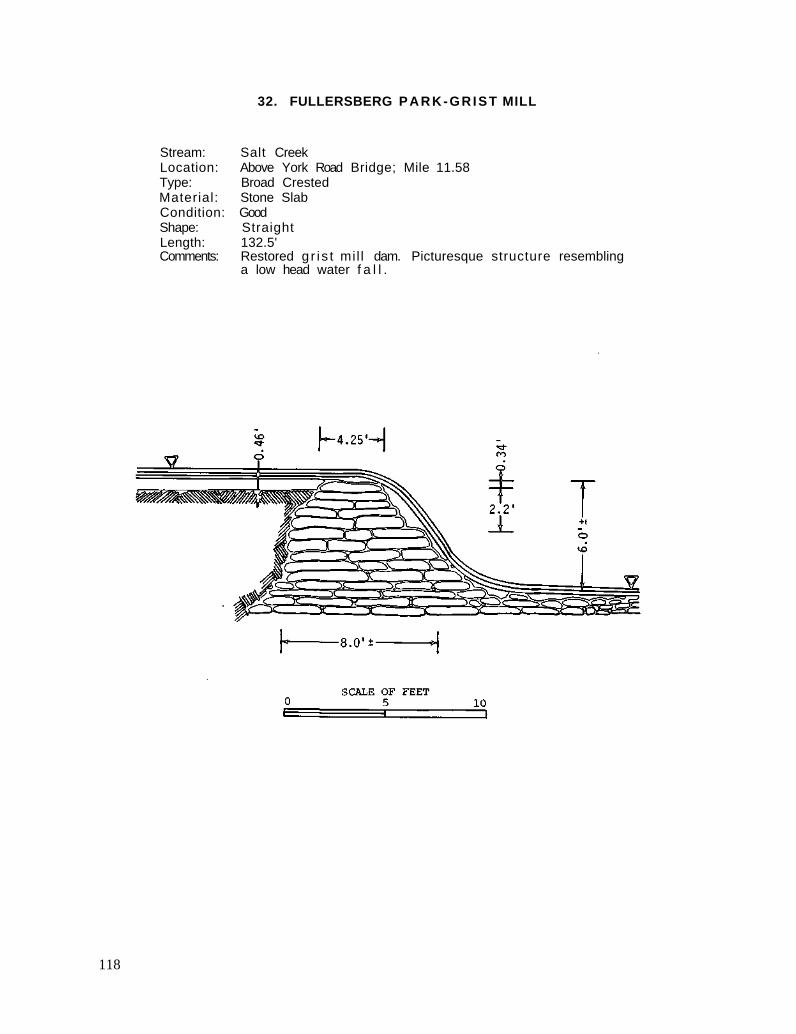
32. FULLERSBERG PARK-GRIST MILL
Stream: Salt Creek Location: Above York Road Bridge; Mile 11.58 Type: Broad Crested Material: Stone Slab Condition: Good Shape: Straight Length: 132.5' Comments: Restored g r i s t mil l dam. Picturesque structure resembling
a low head water f a l l .
118
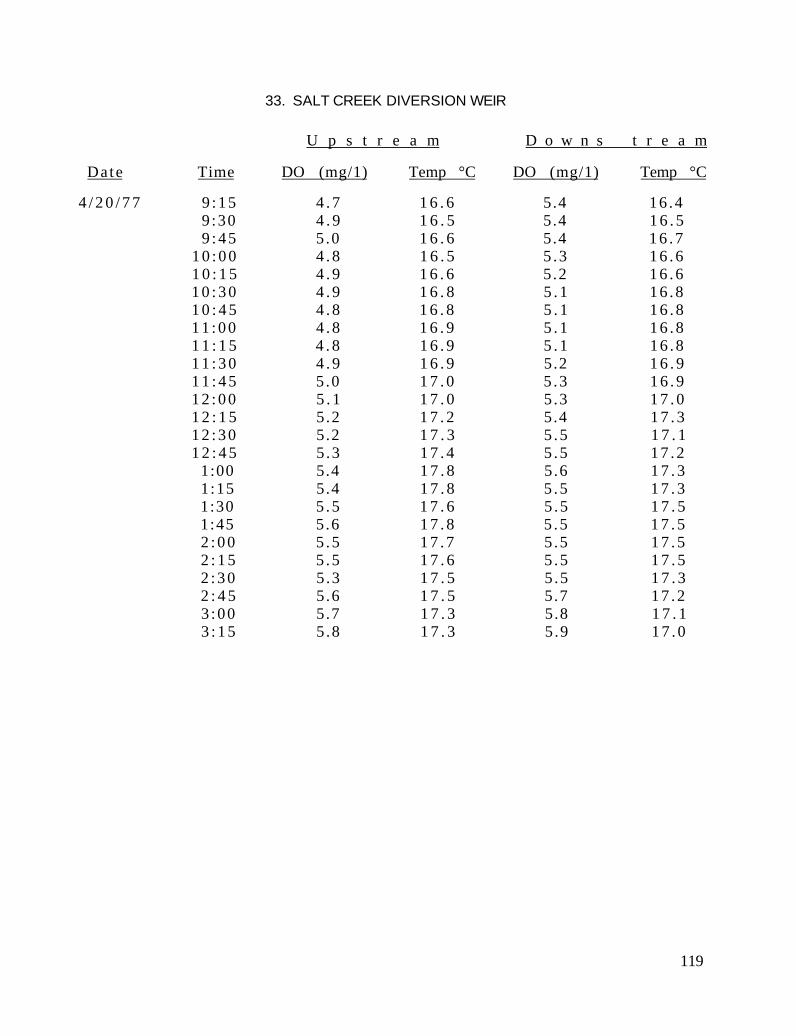
33. SALT CREEK DIVERSION WEIR
U p s t r e a m D o w n s t r e a m
Date Time DO (mg/1) Temp °C DO (mg/1) Temp °C
4 / 2 0 / 7 7 9 :15 4 . 7 1 6 . 6 5.4 16 .4 9 :30 4 . 9 1 6 . 5 5.4 1 6 . 5 9 : 4 5 5 .0 1 6 . 6 5.4 1 6 . 7
1 0 : 0 0 4 . 8 1 6 . 5 5 .3 1 6 . 6 1 0 : 1 5 4 . 9 1 6 . 6 5 .2 1 6 . 6 1 0 : 3 0 4 . 9 1 6 . 8 5 . 1 16 .8 1 0 : 4 5 4 . 8 1 6 . 8 5 . 1 1 6 . 8 1 1 : 0 0 4 . 8 1 6 . 9 5 . 1 1 6 . 8 1 1 : 1 5 4 . 8 1 6 . 9 5 . 1 16 .8 1 1 : 3 0 4 . 9 1 6 . 9 5.2 1 6 . 9 1 1 : 4 5 5 .0 1 7 . 0 5 .3 1 6 . 9 1 2 : 0 0 5 . 1 1 7 . 0 5 .3 1 7 . 0 1 2 : 1 5 5 .2 1 7 . 2 5.4 1 7 . 3 1 2 : 3 0 5.2 1 7 . 3 5 .5 1 7 . 1 1 2 : 4 5 5 .3 1 7 . 4 5 .5 17 .2
1:00 5.4 1 7 . 8 5 .6 1 7 . 3 1:15 5.4 1 7 . 8 5 .5 1 7 . 3 1:30 5 .5 1 7 . 6 5 .5 1 7 . 5 1:45 5 .6 1 7 . 8 5 .5 1 7 . 5 2 : 0 0 5 .5 1 7 . 7 5 .5 1 7 . 5 2 : 1 5 5 .5 1 7 . 6 5 .5 1 7 . 5 2 : 3 0 5 .3 1 7 . 5 5 .5 1 7 . 3 2 : 4 5 5 .6 1 7 . 5 5.7 17 .2 3 :00 5.7 1 7 . 3 5.8 1 7 . 1 3 : 1 5 5 .8 1 7 . 3 5 .9 1 7 . 0
119
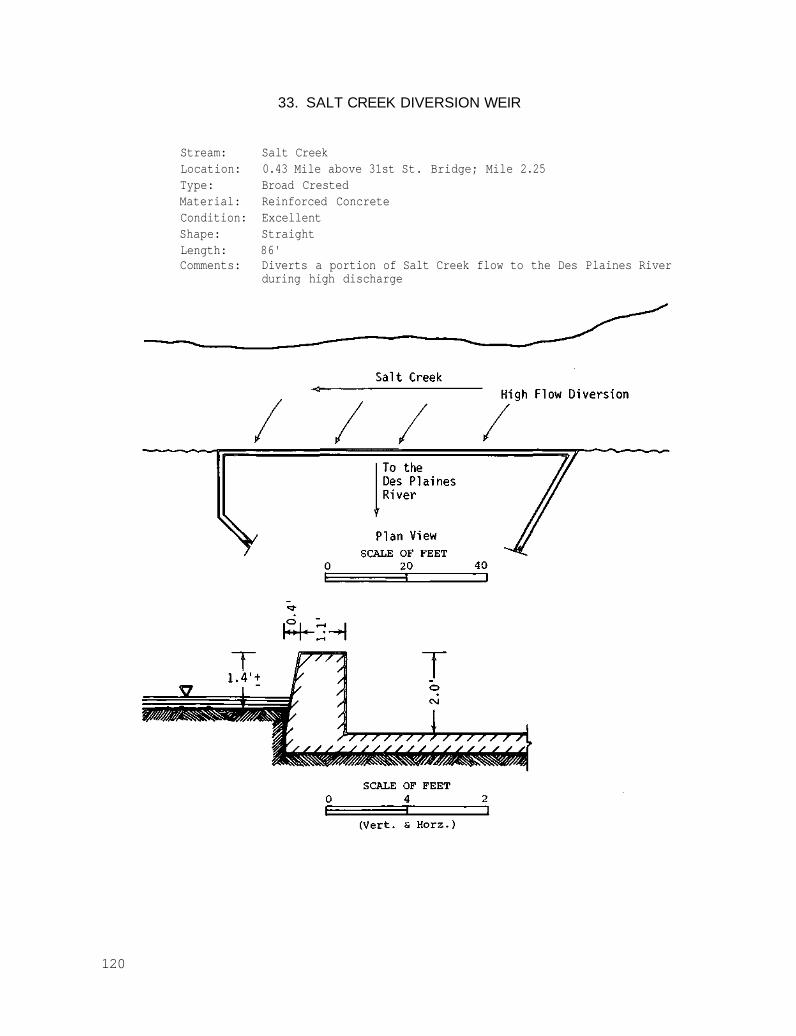
33. SALT CREEK DIVERSION WEIR
Stream: Salt Creek Location: 0.43 Mile above 31st St. Bridge; Mile 2.25 Type: Broad Crested Material: Reinforced Concrete Condition: Excellent Shape: Straight Length: 86' Comments: Diverts a portion of Salt Creek flow to the Des Plaines River
during high discharge
120
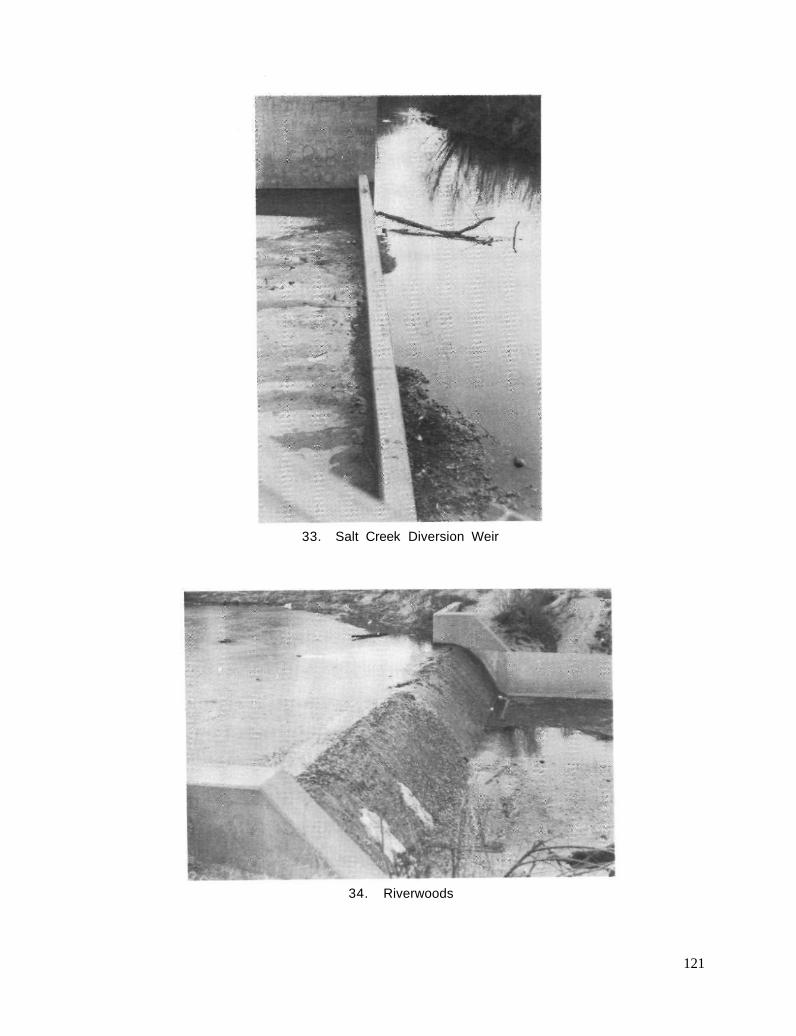
34. Riverwoods
33. Salt Creek Diversion Weir
121
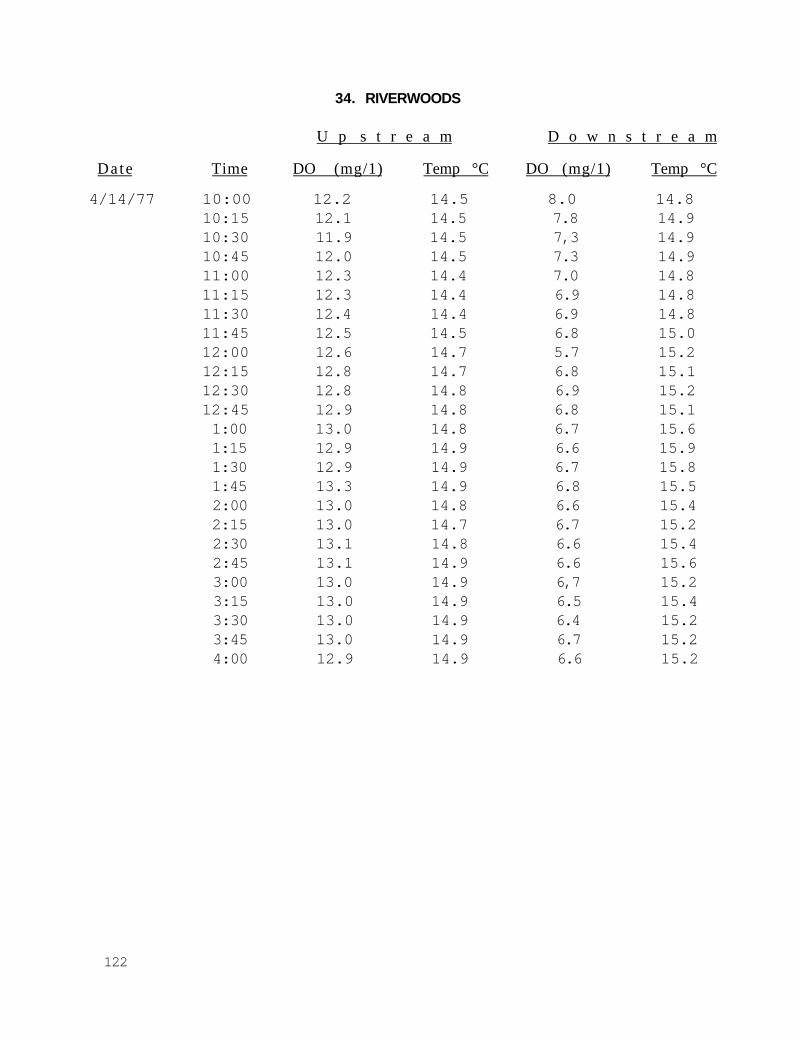
34. RIVERWOODS
U p s t r e a m D o w n s t r e a m
Date Time DO (mg/1) Temp °C DO (mg/1) Temp °C
4/14/77 10:00 12.2 14.5 8.0 14.8 10:15 12.1 14.5 7.8 14.9 10:30 11.9 14.5 7,3 14.9 10:45 12.0 14.5 7.3 14.9 11:00 12.3 14.4 7.0 14.8 11:15 12.3 14.4 6.9 14.8 11:30 12.4 14.4 6.9 14.8 11:45 12.5 14.5 6.8 15.0 12:00 12.6 14.7 5.7 15.2 12:15 12.8 14.7 6.8 15.1 12:30 12.8 14.8 6.9 15.2 12:45 12.9 14.8 6.8 15.1 1:00 13.0 14.8 6.7 15.6 1:15 12.9 14.9 6.6 15.9 1:30 12.9 14.9 6.7 15.8 1:45 13.3 14.9 6.8 15.5 2:00 13.0 14.8 6.6 15.4 2:15 13.0 14.7 6.7 15.2 2:30 13.1 14.8 6.6 15.4 2:45 13.1 14.9 6.6 15.6 3:00 13.0 14.9 6,7 15.2 3:15 13.0 14.9 6.5 15.4 3:30 13.0 14.9 6.4 15.2 3:45 13.0 14.9 6.7 15.2 4:00 12.9 14.9 6.6 15.2
122
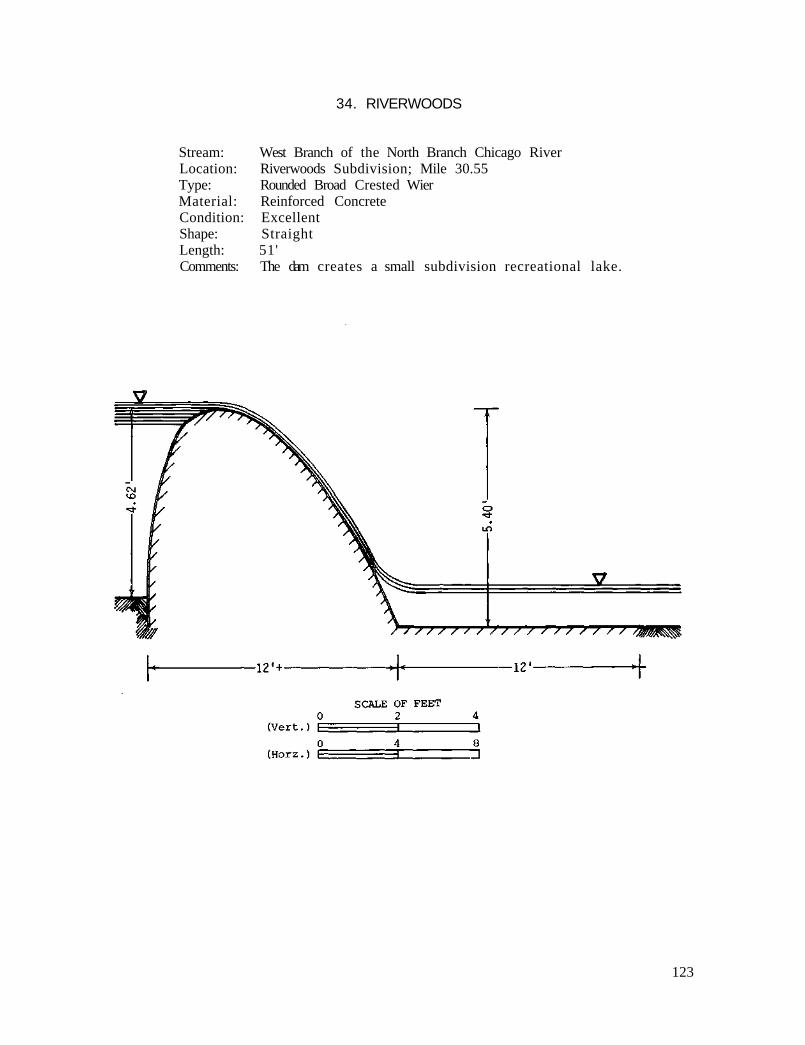
34. RIVERWOODS
Stream: West Branch of the North Branch Chicago River Location: Riverwoods Subdivision; Mile 30.55 Type: Rounded Broad Crested Wier Material: Reinforced Concrete Condition: Excellent Shape: Straight Length: 51' Comments: The dam creates a small subdivision recreational lake.
123
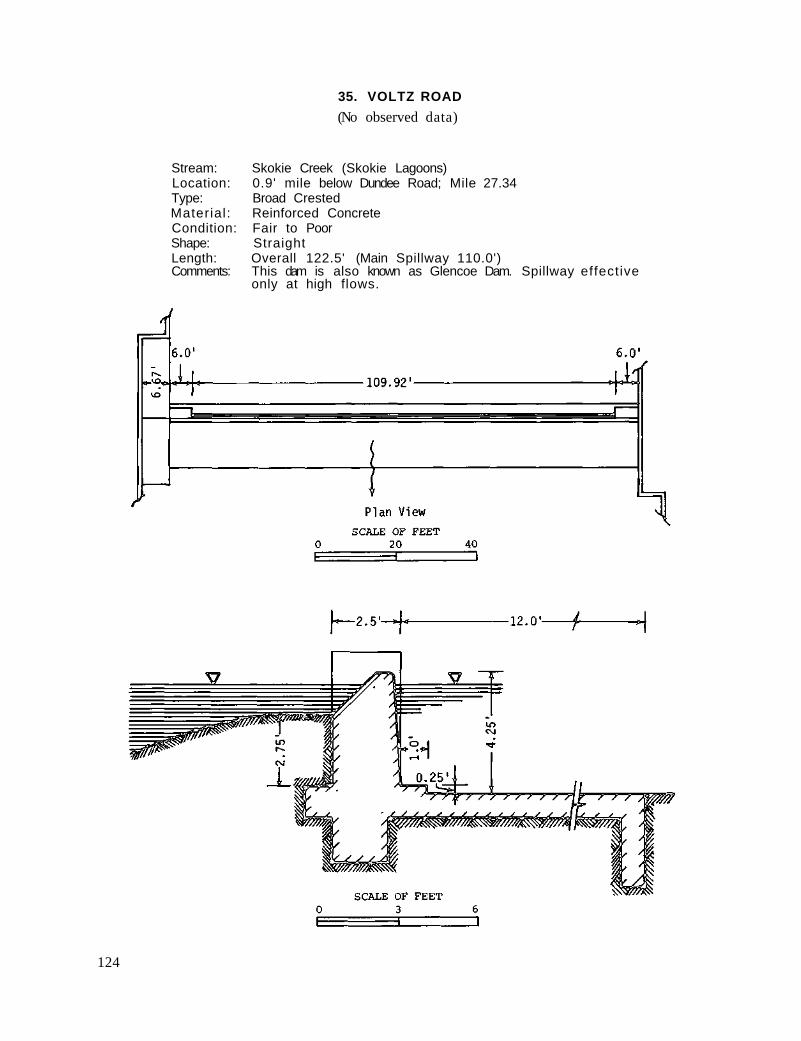
35. VOLTZ ROAD (No observed data)
Stream: Skokie Creek (Skokie Lagoons) Location: 0.9' mile below Dundee Road; Mile 27.34 Type: Broad Crested Material: Reinforced Concrete Condition: Fair to Poor Shape: Straight Length: Overall 122.5' (Main Spillway 110.0') Comments: This dam is also known as Glencoe Dam. Spillway effective
only at high flows.
124

36. Tower Road
35. Voltz Road
125
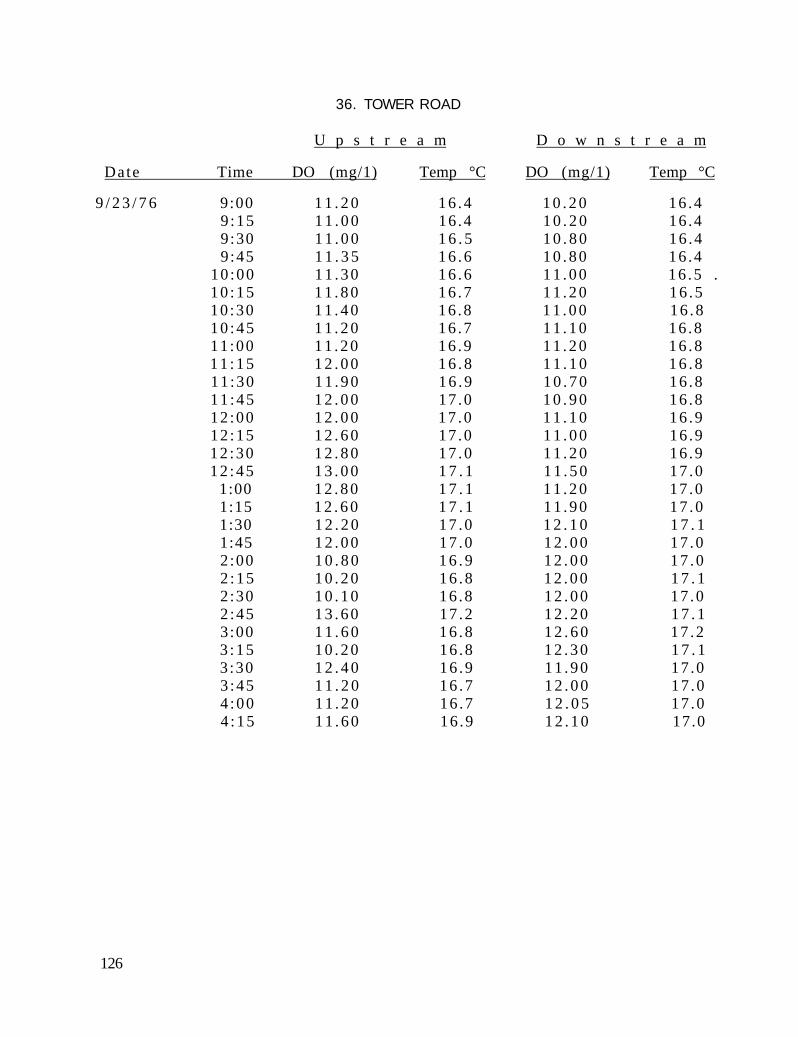
36. TOWER ROAD
U p s t r e a m D o w n s t r e a m
Date Time DO (mg/1) Temp °C DO (mg/1) Temp °C
9 / 2 3 / 7 6 9:00 1 1 . 2 0 16 .4 1 0 . 2 0 16 .4 9 :15 1 1 . 0 0 16 .4 1 0 . 2 0 16 .4 9:30 1 1 . 0 0 1 6 . 5 1 0 . 8 0 16 .4 9 :45 1 1 . 3 5 16 .6 1 0 . 8 0 16 .4
10 :00 1 1 . 3 0 16 .6 1 1 . 0 0 16 .5 . 10 :15 1 1 . 8 0 16 .7 1 1 . 2 0 16 .5 10 :30 1 1 . 4 0 16 .8 1 1 . 0 0 16 .8 10 :45 1 1 . 2 0 16 .7 1 1 . 1 0 16 .8 11 :00 1 1 . 2 0 16 .9 1 1 . 2 0 16 .8 1 1 : 1 5 1 2 . 0 0 1 6 . 8 1 1 . 1 0 1 6 . 8 11 :30 1 1 . 9 0 16 .9 1 0 . 7 0 16 .8 11 :45 1 2 . 0 0 17 .0 1 0 . 9 0 16 .8 12 :00 1 2 . 0 0 17 .0 1 1 . 1 0 16 .9 12 :15 1 2 . 6 0 17 .0 1 1 . 0 0 16 .9 12 :30 1 2 . 8 0 17 .0 1 1 . 2 0 16 .9 12 :45 1 3 . 0 0 1 7 . 1 1 1 . 5 0 17 .0
1:00 1 2 . 8 0 1 7 . 1 1 1 . 2 0 17 .0 1:15 1 2 . 6 0 1 7 . 1 1 1 . 9 0 17 .0 1:30 1 2 . 2 0 17 .0 1 2 . 1 0 1 7 . 1 1:45 1 2 . 0 0 17 .0 1 2 . 0 0 17 .0 2 :00 1 0 . 8 0 1 6 . 9 1 2 . 0 0 17 .0 2 :15 1 0 . 2 0 16 .8 1 2 . 0 0 1 7 . 1 2 :30 1 0 . 1 0 16 .8 1 2 . 0 0 17 .0 2 :45 1 3 . 6 0 17 .2 1 2 . 2 0 1 7 . 1 3:00 1 1 . 6 0 16 .8 1 2 . 6 0 17 .2 3 :15 1 0 . 2 0 16 .8 1 2 . 3 0 1 7 . 1 3 :30 1 2 . 4 0 16 .9 1 1 . 9 0 17 .0 3 :45 1 1 . 2 0 16 .7 1 2 . 0 0 17 .0 4 :00 1 1 . 2 0 16 .7 1 2 . 0 5 17 .0 4 :15 1 1 . 6 0 16 .9 1 2 . 1 0 17.0
126
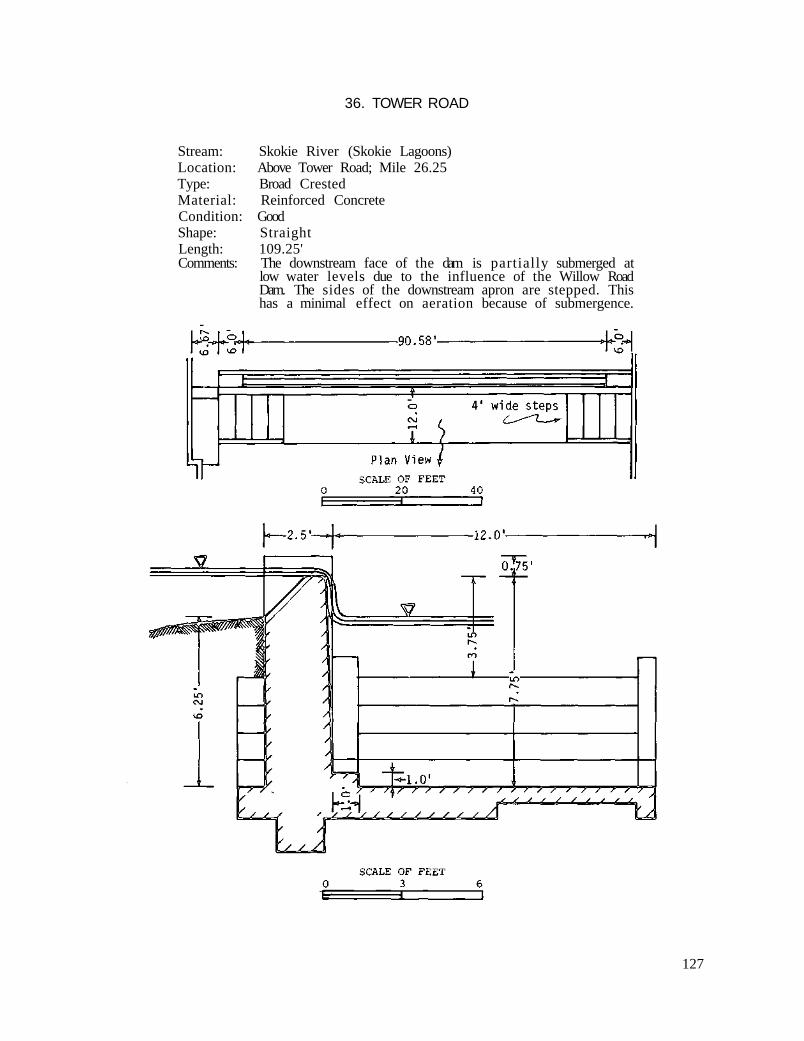
36. TOWER ROAD
Stream: Skokie River (Skokie Lagoons) Location: Above Tower Road; Mile 26.25 Type: Broad Crested Material: Reinforced Concrete Condition: Good Shape: Straight Length: 109.25' Comments: The downstream face of the dam is partially submerged at
low water levels due to the influence of the Willow Road Dam. The sides of the downstream apron are stepped. This has a minimal effect on aeration because of submergence.
127
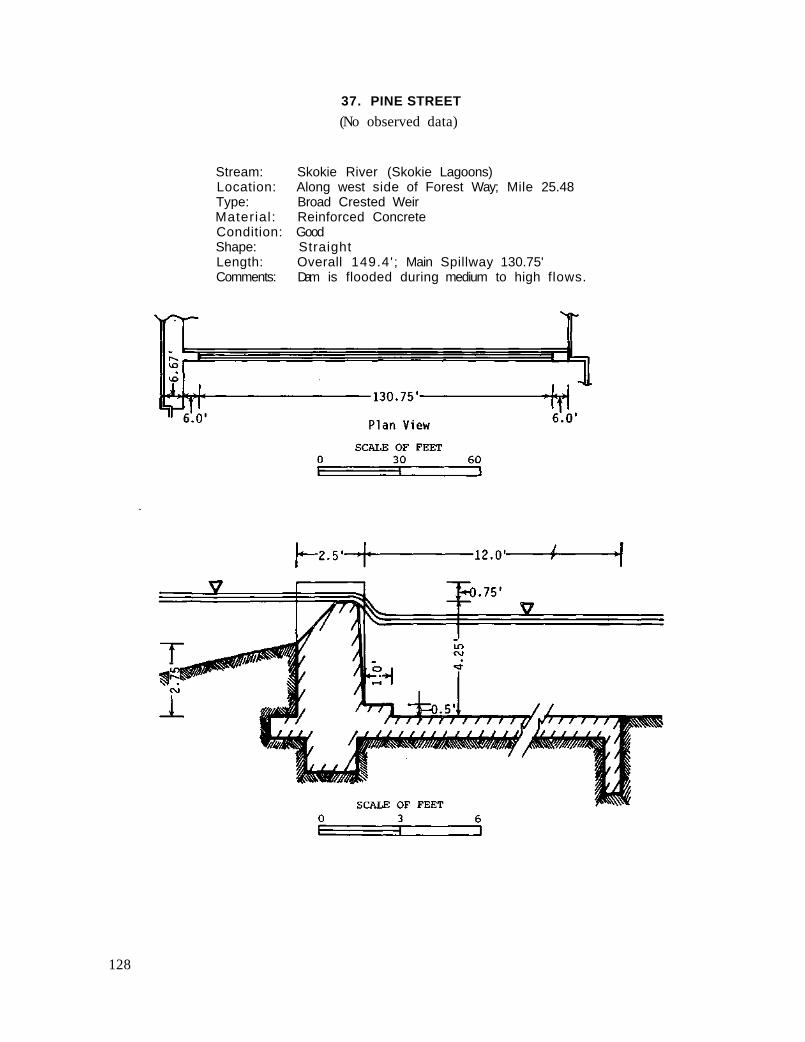
37. PINE STREET (No observed data)
Stream: Skokie River (Skokie Lagoons) Location: Along west side of Forest Way; Mile 25.48 Type: Broad Crested Weir Material: Reinforced Concrete Condition: Good Shape: Straight Length: Overall 149.4'; Main Spillway 130.75' Comments: Dam is flooded during medium to high flows.
128
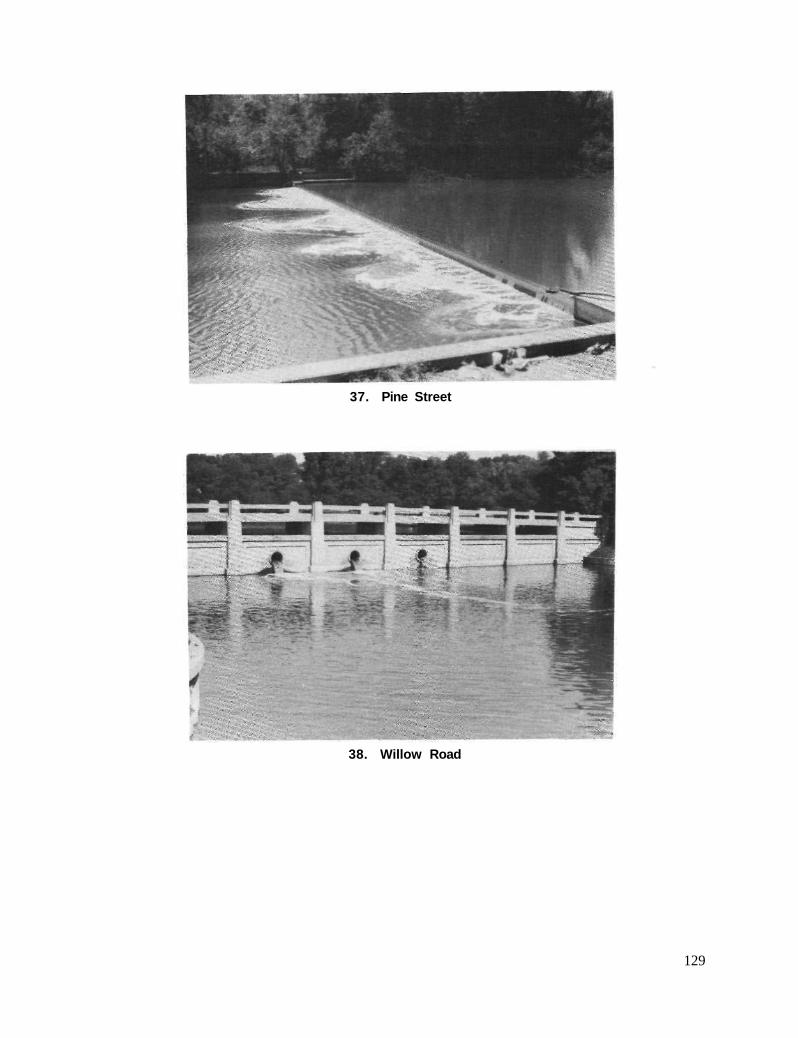
38. Willow Road
37. Pine Street
129
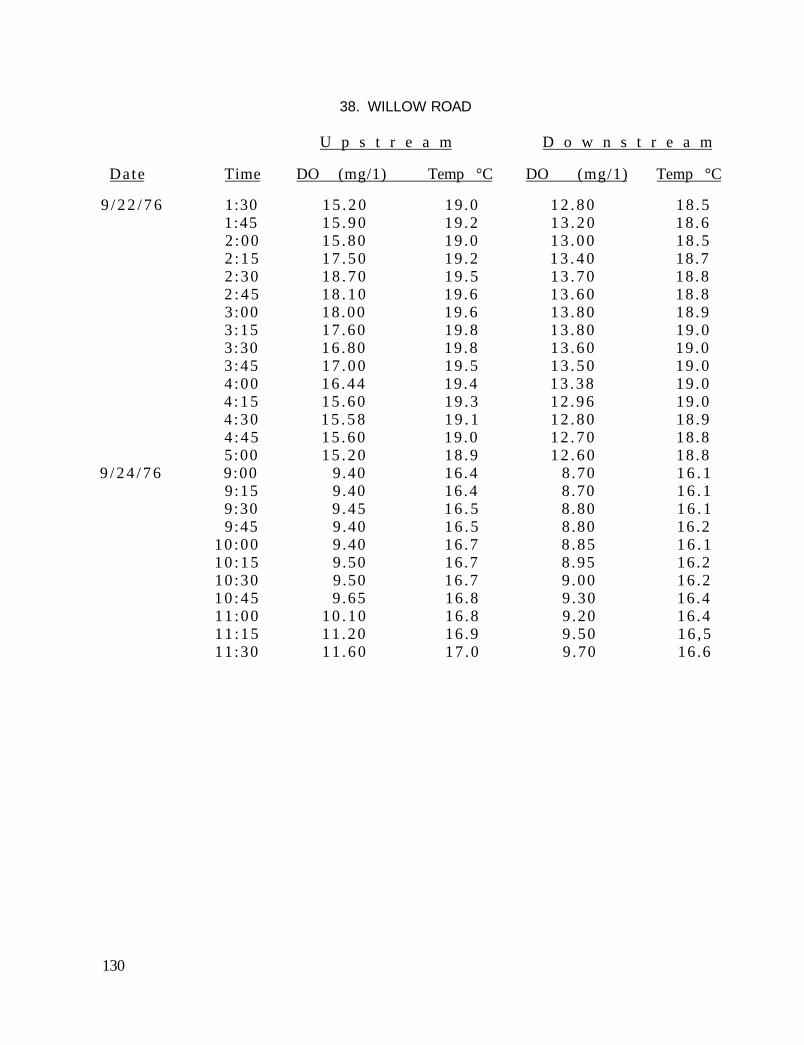
38. WILLOW ROAD
U p s t r e a m D o w n s t r e a m
Date Time DO (mg/1) Temp °C DO (mg/1) Temp °C
9 / 2 2 / 7 6 1:30 1 5 . 2 0 19 .0 1 2 . 8 0 18 .5 1:45 1 5 . 9 0 19 .2 1 3 . 2 0 18 .6 2 :00 1 5 . 8 0 19 .0 1 3 . 0 0 18 .5 2 :15 1 7 . 5 0 19 .2 1 3 . 4 0 18 .7 2 :30 1 8 . 7 0 19 .5 1 3 . 7 0 18 .8 2 : 4 5 1 8 . 1 0 19 .6 1 3 . 6 0 18 .8 3 :00 18 .00 19 .6 1 3 . 8 0 18 .9 3 :15 17 .60 19 .8 1 3 . 8 0 19 .0 3 :30 1 6 . 8 0 19 .8 1 3 . 6 0 19 .0 3 :45 1 7 . 0 0 19 .5 1 3 . 5 0 19 .0 4 :00 16 .44 19 .4 1 3 . 3 8 19 .0 4 : 1 5 1 5 . 6 0 19 .3 1 2 . 9 6 19 .0 4 :30 1 5 . 5 8 1 9 . 1 1 2 . 8 0 18 .9 4 : 4 5 1 5 . 6 0 19 .0 1 2 . 7 0 18 .8 5 :00 1 5 . 2 0 18 .9 1 2 . 6 0 18 .8
9 / 2 4 / 7 6 9:00 9.40 16 .4 8 .70 1 6 . 1 9 :15 9.40 16.4 8 .70 1 6 . 1 9:30 9 .45 1 6 . 5 8 .80 1 6 . 1 9:45 9 .40 1 6 . 5 8 .80 16 .2
10 :00 9 .40 16 .7 8 .85 1 6 . 1 1 0 : 1 5 9 .50 16 .7 8 .95 16 .2 10 :30 9.50 16 .7 9 .00 16 .2 1 0 : 4 5 9 .65 16 .8 9 .30 16.4 11 :00 1 0 . 1 0 16 .8 9 .20 16 .4 11 :15 1 1 . 2 0 16 .9 9 .50 16 ,5 11 :30 1 1 . 6 0 17 .0 9 .70 16 .6
130
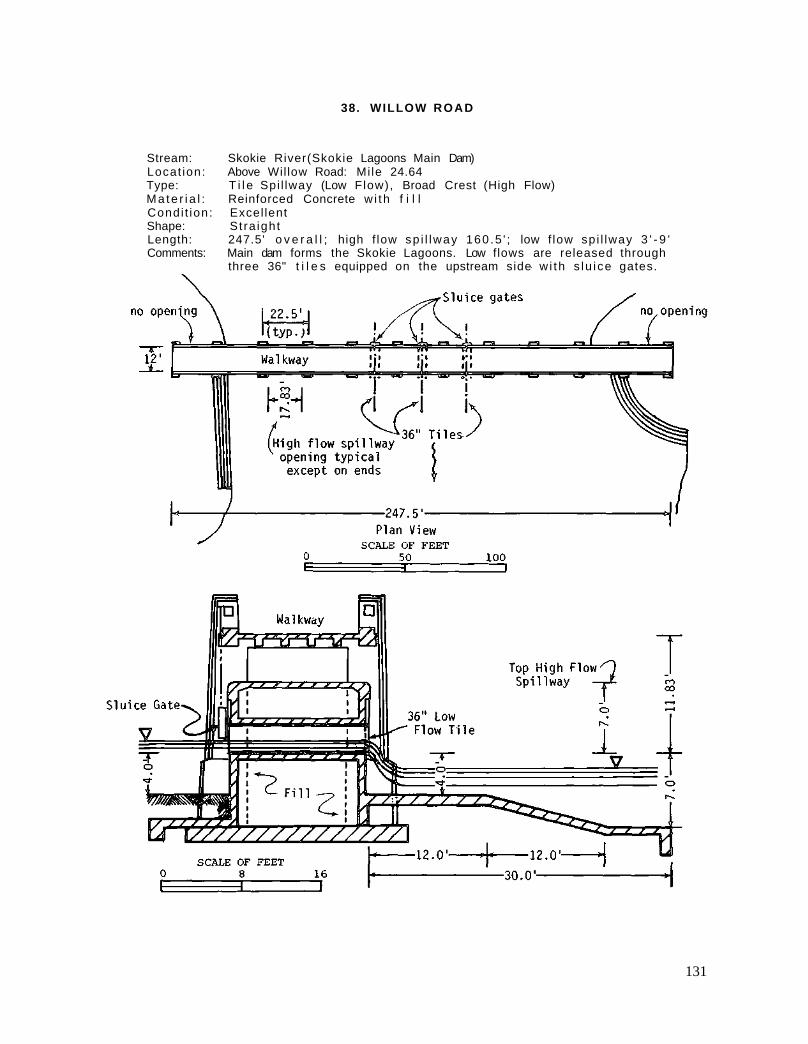
38. WILLOW ROAD
Stream: Skokie River(Skokie Lagoons Main Dam) Locat ion: Above Wil low Road: Mi le 24.64 Type: T i l e Spi l lway (Low Flow), Broad Crest (High Flow) Ma te r i a l : Reinforced Concrete w i th f i l l Condi t ion: Excel lent Shape: St ra ight Length: 247.5' o v e r a l l ; high f low sp i l lway 160 .5 ' ; low f low sp i l lway 3 ' - 9 ' Comments: Main dam forms the Skokie Lagoons. Low flows are released through
three 36" t i l e s equipped on the upstream side w i th s lu ice gates.
131
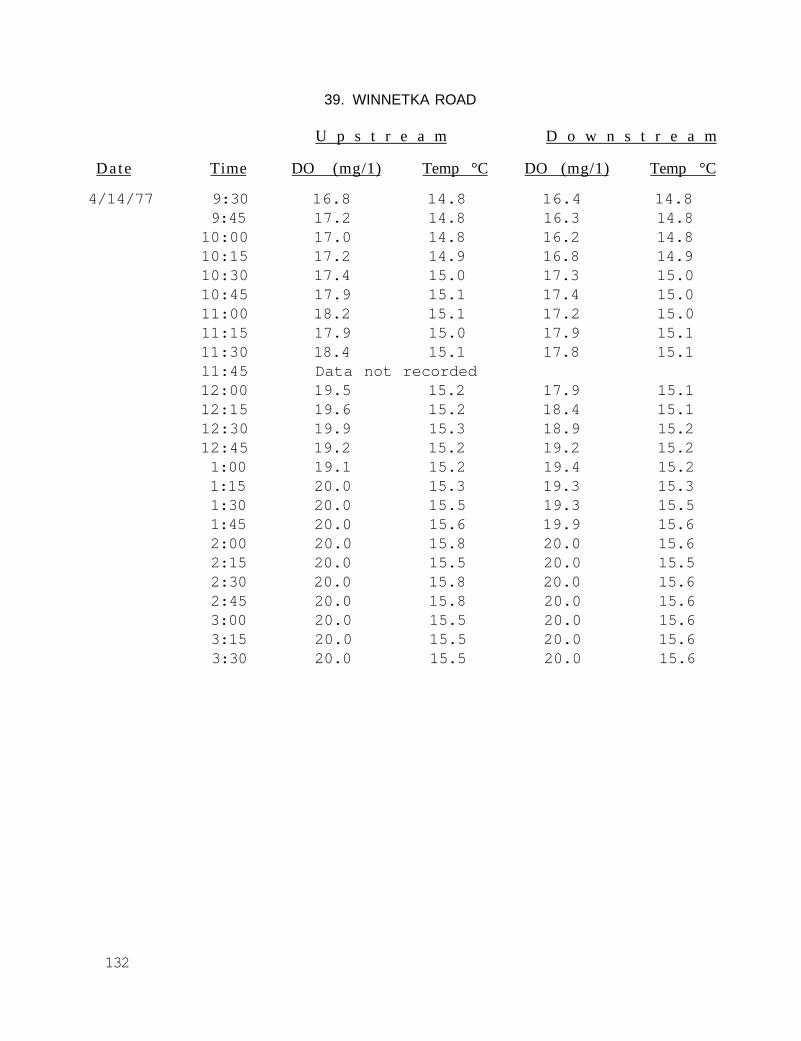
39. WINNETKA ROAD
U p s t r e a m D o w n s t r e a m
Date Time DO (mg/1) Temp °C DO (mg/1) Temp °C
4/14/77 9:30 16.8 14.8 16.4 14.8 9:45 17.2 14.8 16.3 14.8
10:00 17.0 14.8 16.2 14.8 10:15 17.2 14.9 16.8 14.9 10:30 17.4 15.0 17.3 15.0 10:45 17.9 15.1 17.4 15.0 11:00 18.2 15.1 17.2 15.0 11:15 17.9 15.0 17.9 15.1 11:30 18.4 15.1 17.8 15.1 11:45 Data not recorded 12:00 19.5 15.2 17.9 15.1 12:15 19.6 15.2 18.4 15.1 12:30 19.9 15.3 18.9 15.2 12:45 19.2 15.2 19.2 15.2 1:00 19.1 15.2 19.4 15.2 1:15 20.0 15.3 19.3 15.3 1:30 20.0 15.5 19.3 15.5 1:45 20.0 15.6 19.9 15.6 2:00 20.0 15.8 20.0 15.6 2:15 20.0 15.5 20.0 15.5 2:30 20.0 15.8 20.0 15.6 2:45 20.0 15.8 20.0 15.6 3:00 20.0 15.5 20.0 15.6 3:15 20.0 15.5 20.0 15.6 3:30 20.0 15.5 20.0 15.6
132
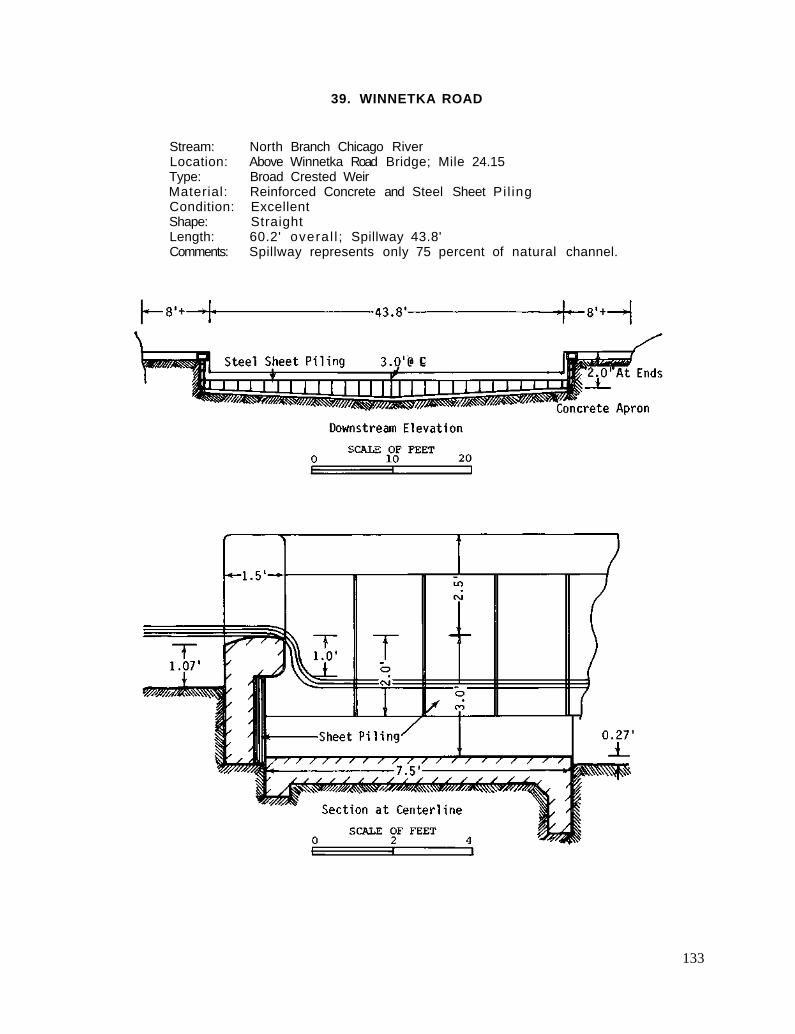
39. WINNETKA ROAD
Stream: North Branch Chicago River Location: Above Winnetka Road Bridge; Mile 24.15 Type: Broad Crested Weir Material: Reinforced Concrete and Steel Sheet Pi l ing Condition: Excellent Shape: Straight Length: 60.2' overal l ; Spillway 43.8' Comments: Spillway represents only 75 percent of natural channel.
133

39. Winnetka Road
40. Glenview Country Club
134
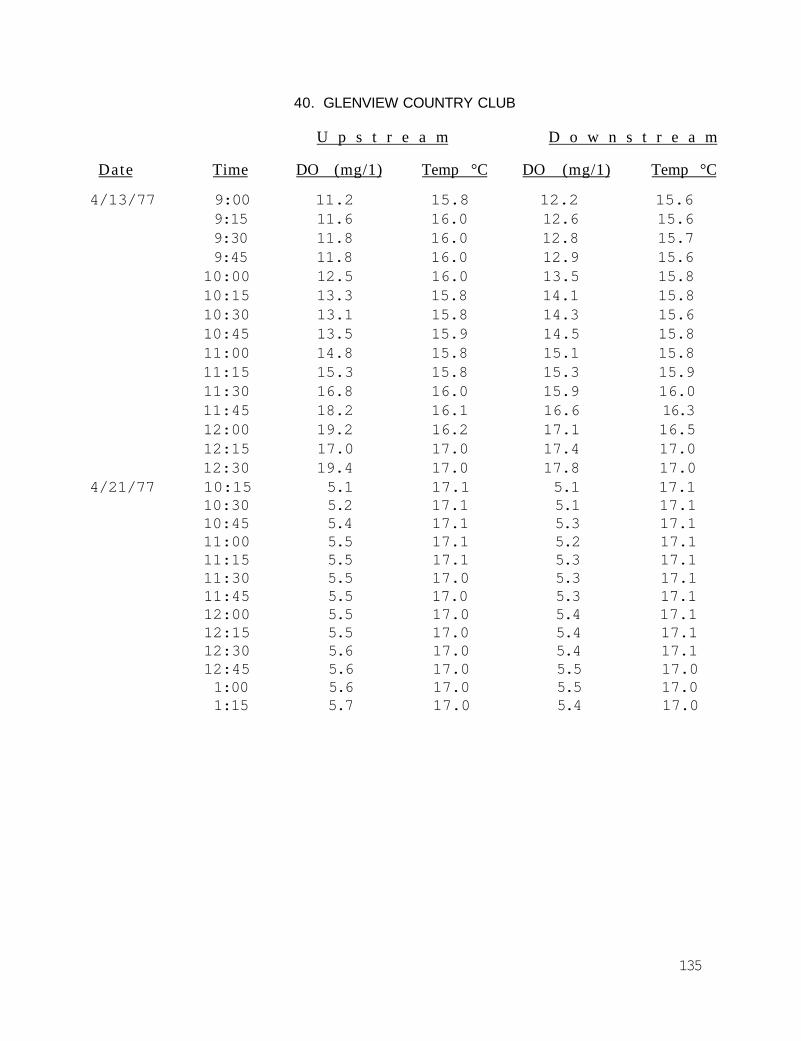
40. GLENVIEW COUNTRY CLUB
U p s t r e a m D o w n s t r e a m
Date Time DO (mg/1) Temp °C DO (mg/1) Temp °C
4/13/77 9:00 11.2 15.8 12.2 15.6 9:15 11.6 16.0 12.6 15.6 9:30 11.8 16.0 12.8 15.7 9:45 11.8 16.0 12.9 15.6
10:00 12.5 16.0 13.5 15.8 10:15 13.3 15.8 14.1 15.8 10:30 13.1 15.8 14.3 15.6 10:45 13.5 15.9 14.5 15.8 11:00 14.8 15.8 15.1 15.8 11:15 15.3 15.8 15.3 15.9 11:30 16.8 16.0 15.9 16.0 11:45 18.2 16.1 16.6 16.3 12:00 19.2 16.2 17.1 16.5 12:15 17.0 17.0 17.4 17.0 12:30 19.4 17.0 17.8 17.0
4/21/77 10:15 5.1 17.1 5.1 17.1 10:30 5.2 17.1 5.1 17.1 10:45 5.4 17.1 5.3 17.1 11:00 5.5 17.1 5.2 17.1 11:15 5.5 17.1 5.3 17.1 11:30 5.5 17.0 5.3 17.1 11:45 5.5 17.0 5.3 17.1 12:00 5.5 17.0 5.4 17.1 12:15 5.5 17.0 5.4 17.1 12:30 5.6 17.0 5.4 17.1 12:45 5.6 17.0 5.5 17.0 1:00 5.6 17.0 5.5 17.0 1:15 5.7 17.0 5.4 17.0
135
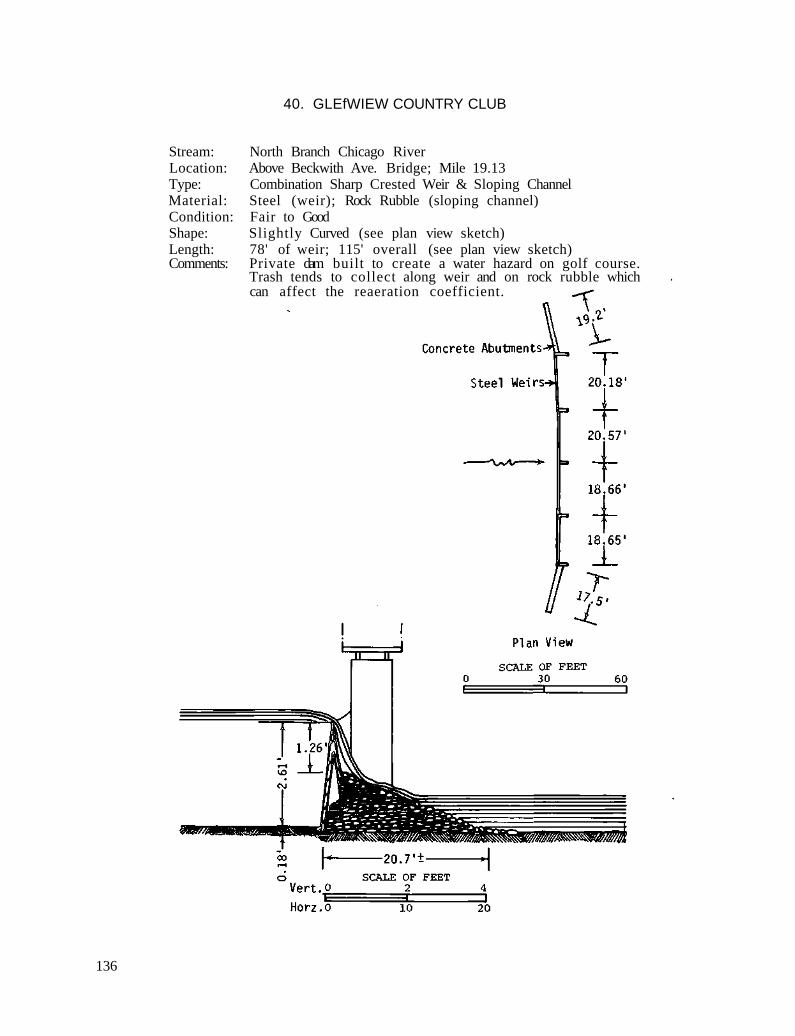
40. GLEfWIEW COUNTRY CLUB
Stream: North Branch Chicago River Location: Above Beckwith Ave. Bridge; Mile 19.13 Type: Combination Sharp Crested Weir & Sloping Channel Material: Steel (weir); Rock Rubble (sloping channel) Condition: Fair to Good Shape: Slightly Curved (see plan view sketch) Length: 78' of weir; 115' overall (see plan view sketch) Comments: Private dam built to create a water hazard on golf course.
Trash tends to collect along weir and on rock rubble which can affect the reaeration coefficient.
136
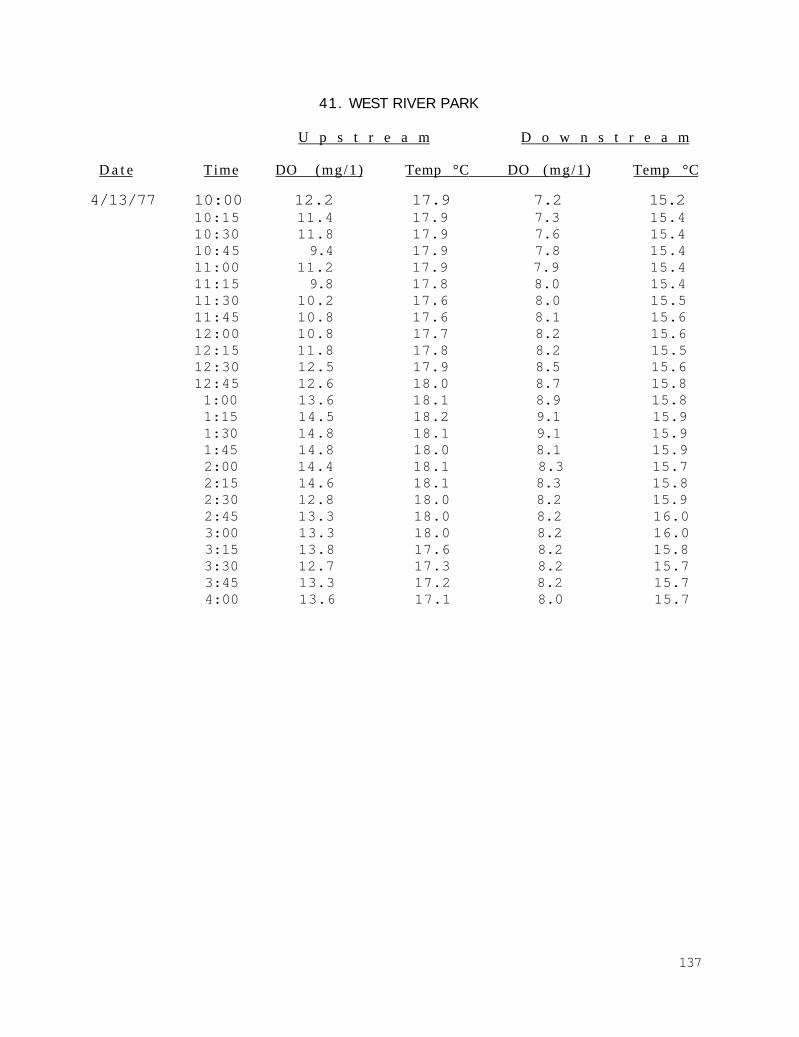
41. WEST RIVER PARK
U p s t r e a m D o w n s t r e a m
D a t e Time DO (mg/1) Temp °C DO (mg/1) Temp °C
4/13/77 10:00 12.2 17.9 7.2 15.2 10:15 11.4 17.9 7.3 15.4 10:30 11.8 17.9 7.6 15.4 10:45 9.4 17.9 7.8 15.4 11:00 11.2 17.9 7.9 15.4 11:15 9.8 17.8 8.0 15.4 11:30 10.2 17.6 8.0 15.5 11:45 10.8 17.6 8.1 15.6 12:00 10.8 17.7 8.2 15.6 12:15 11.8 17.8 8.2 15.5 12:30 12.5 17.9 8.5 15.6 12:45 12.6 18.0 8.7 15.8 1:00 13.6 18.1 8.9 15.8 1:15 14.5 18.2 9.1 15.9 1:30 14.8 18.1 9.1 15.9 1:45 14.8 18.0 8.1 15.9 2:00 14.4 18.1 8.3 15.7 2:15 14.6 18.1 8.3 15.8 2:30 12.8 18.0 8.2 15.9 2:45 13.3 18.0 8.2 16.0 3:00 13.3 18.0 8.2 16.0 3:15 13.8 17.6 8.2 15.8 3:30 12.7 17.3 8.2 15.7 3:45 13.3 17.2 8.2 15.7 4:00 13.6 17.1 8.0 15.7
137
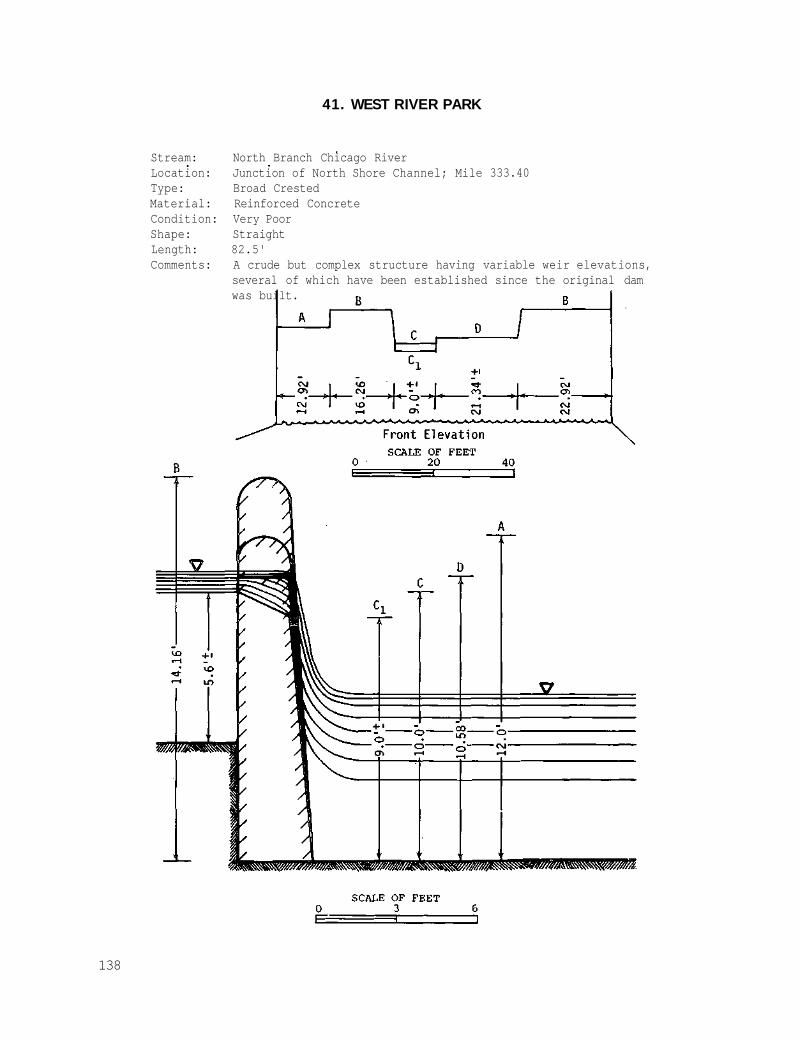
41. WEST RIVER PARK
Stream: North Branch Chicago River Location: Junction of North Shore Channel; Mile 333.40 Type: Broad Crested Material: Reinforced Concrete Condition: Very Poor Shape: Straight Length: 82.5' Comments: A crude but complex structure having variable weir elevations,
several of which have been established since the original dam was built.
138
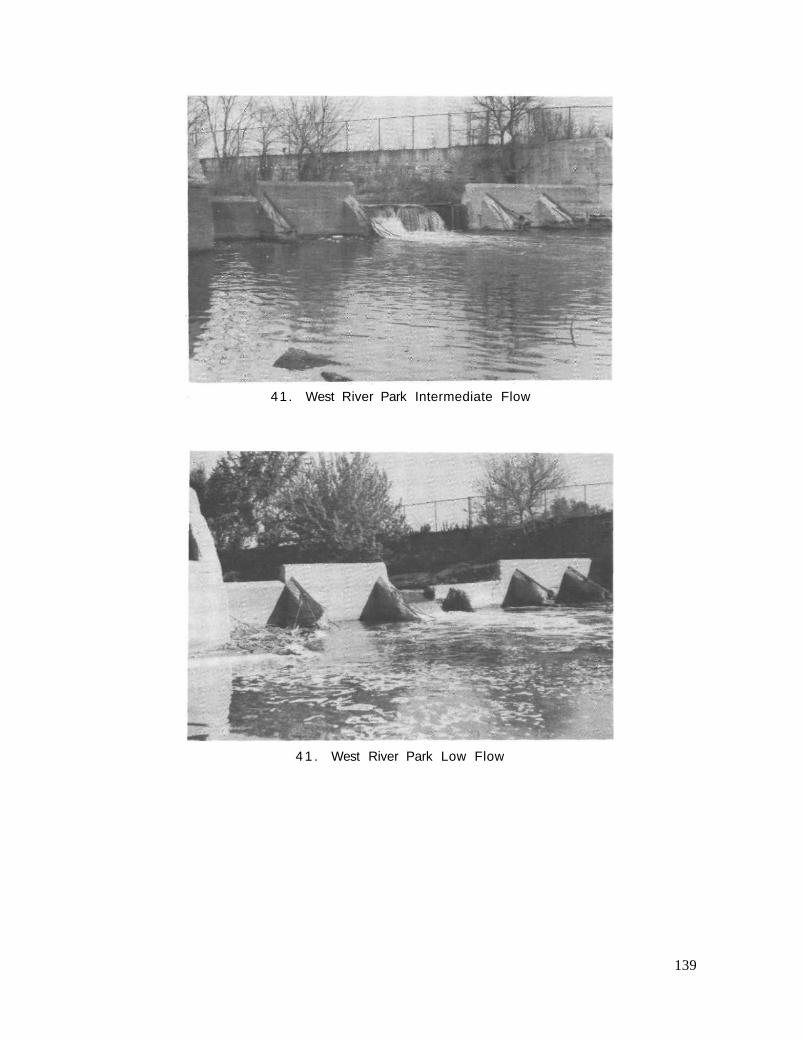
4 1 . West River Park Low Flow
41 . West River Park Intermediate Flow
139

42-42A. CHURCHILL WOODS (Observed data in table 2)
Stream: East Branch Du Page River Location: At Crescent Blvd.; Mile 46.78 Type: Sharp Crested (low flow), Sloping Channel (high flow) Material: Concrete with wood flash boards Condition: Poor Shape: Straight Length: 53.5' high flow, 3.25' low flow Comments: Low flows are released through a weir in the center of the
dam. Dam is in poor condition and needs repair.
140
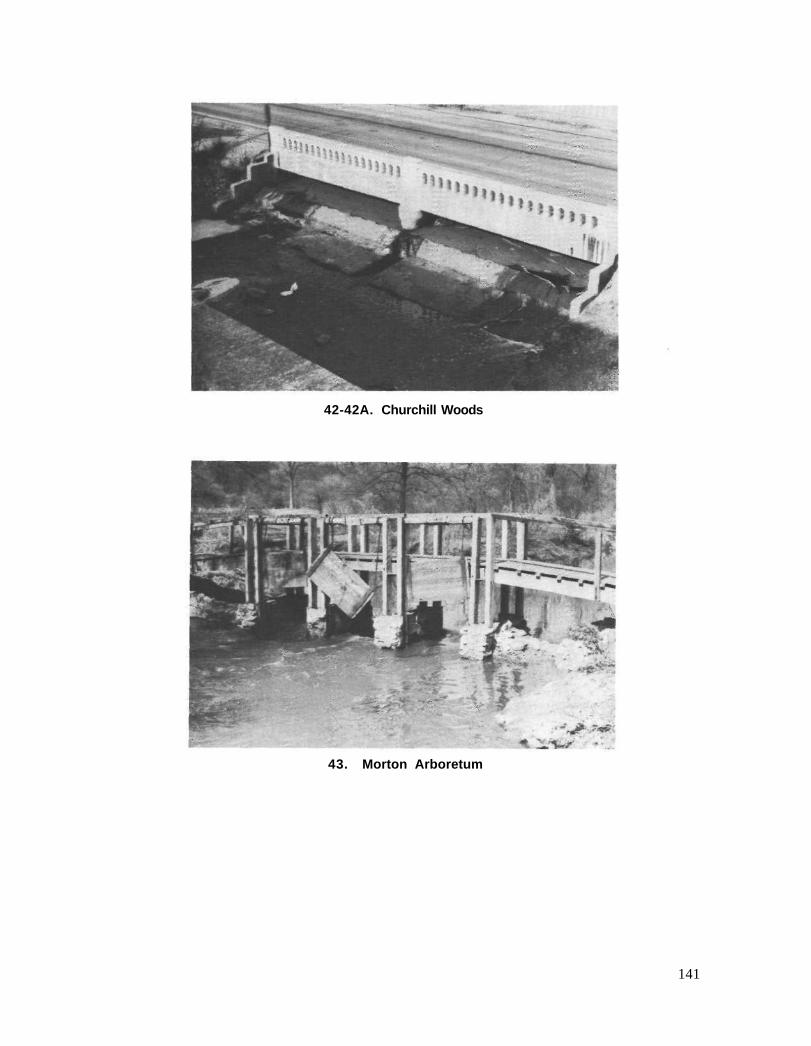
43. Morton Arboretum
42-42A. Churchill Woods
141
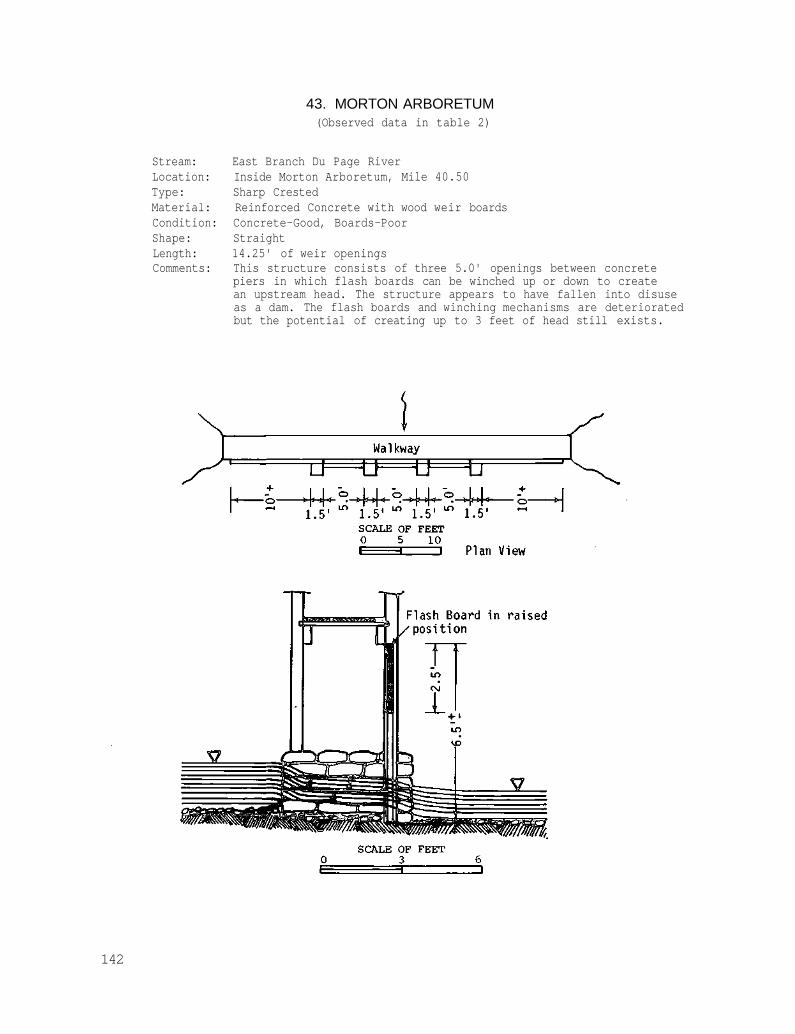
43. MORTON ARBORETUM (Observed data in table 2)
Stream: East Branch Du Page River Location: Inside Morton Arboretum, Mile 40.50 Type: Sharp Crested Material: Reinforced Concrete with wood weir boards Condition: Concrete-Good, Boards-Poor Shape: Straight Length: 14.25' of weir openings Comments: This structure consists of three 5.0' openings between concrete
piers in which flash boards can be winched up or down to create an upstream head. The structure appears to have fallen into disuse as a dam. The flash boards and winching mechanisms are deteriorated but the potential of creating up to 3 feet of head still exists.
142
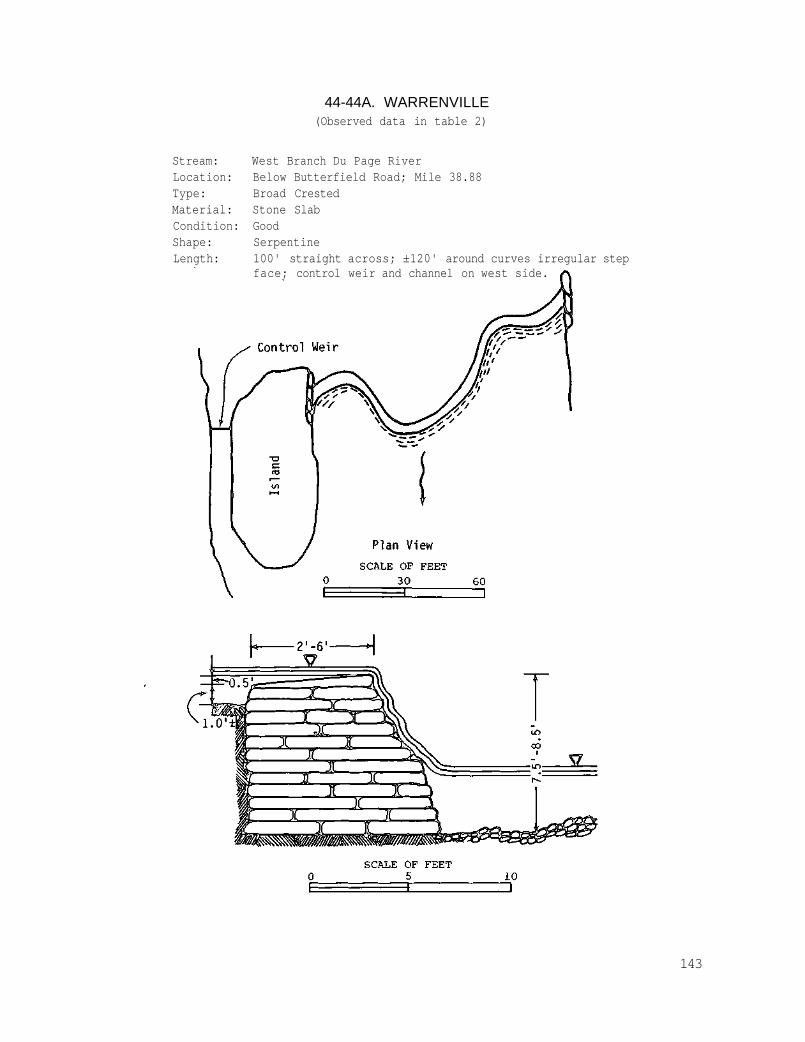
44-44A. WARRENVILLE (Observed data in table 2)
Stream: West Branch Du Page River Location: Below Butterfield Road; Mile 38.88 Type: Broad Crested Material: Stone Slab Condition: Good Shape: Serpentine Length: 100' straight across; ±120' around curves irregular step
face; control weir and channel on west side.
143

44A. Warrenvilie Weir
44. Warrenville
144
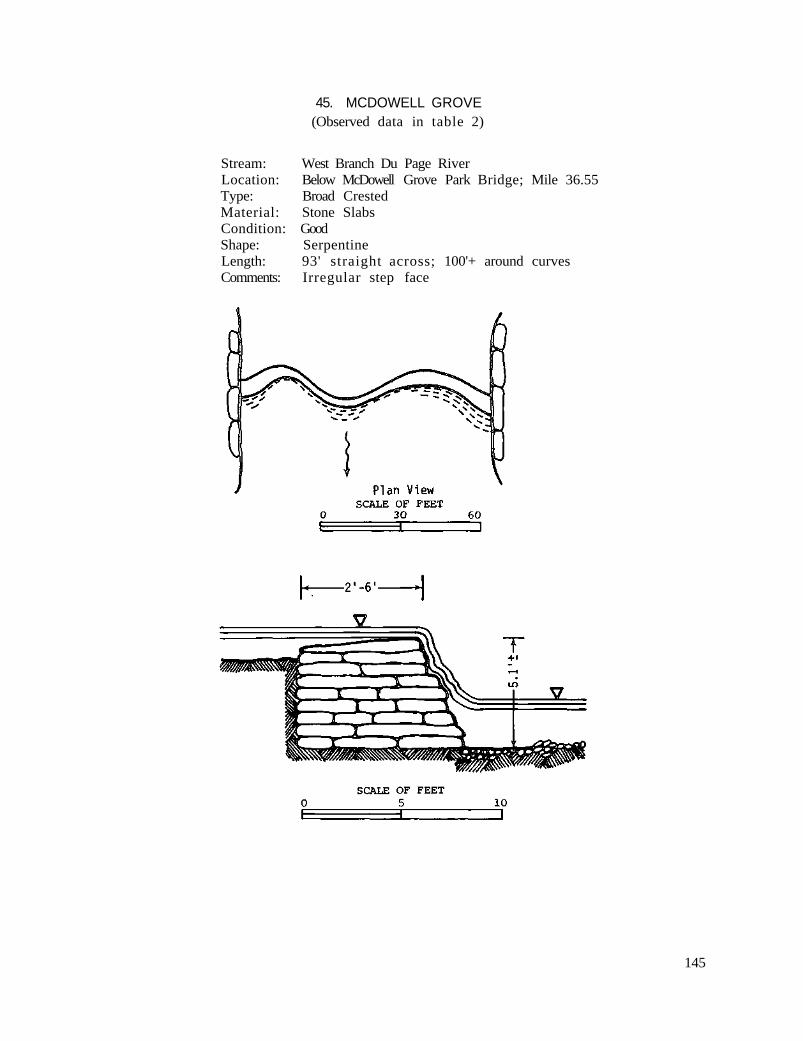
45. MCDOWELL GROVE (Observed data in table 2)
Stream: West Branch Du Page River Location: Below McDowell Grove Park Bridge; Mile 36.55 Type: Broad Crested Material: Stone Slabs Condition: Good Shape: Serpentine Length: 93' straight across; 100'+ around curves Comments: Irregular step face
145

46. Hammel Woods
45. McDowell Grove
146

46. HAMMEL WOODS
U p s t r e a r n D o w n s t r e a m
Date Time DO (mg/1) Temp °C DO (mg/1) Temp °C
9/27/76 11:00 8.12 15.0 8.10 14.8 11 :15 8.00 1 5 . 0 8 .10 14 .9 11 :30 8.12 1 5 . 1 8 .10 15 .0 11:45 8.35 1 5 . 3 8 .10 15 .0 12:00 8 .35 15 .8 8 .30 15 .3 12 :15 8.50 15 .9 8 .40 15 .7 12 :30 8 .50 1 6 . 0 8 .40 15 .9 1 2 : 4 5 8.60 16 .0 8 .50 16 .0
1:00 8.60 16 .0 8 .70 16 .0 1:15 8 .63 1 6 . 1 8 .80 1 6 . 1 1:30 8.85 16 .4 8.62 16 .2 1:45 8.92 16 .6 8 .75 16 .6 2:00 9.00 16 .8 8 .91 16 .8 2 :15 9.07 16 .9 8 .90 16 .9 2 :30 9 .18 1 7 . 0 8 .98 17 .0 2 :45 9.22 17 .0 9 .05 17 .0 3:00 9.30 17 .2 9 .10 1 7 . 1 3 :15 9.30 17 .2 9 .10 1 7 . 1 3:30 9 .40 1 7 . 5 9 .15 17 .3 3 :45 9 .38 17 .4 9 .10 17 .4 4 :00 9 .35 17 .4 9 .20 17 .5 4 :15 9.30 1 7 . 5 9 .12 17 .5 4:30 9 .30 17 .4 9 .10 1 7 . 5 4 :45 9.20 17 .4 9 .05 17.4 5:00 9 .10 17 .2 8 .95 17 .2 5:15 9 .05 1 7 . 1 8 .90 17 .2 5:30 9 .00 1 7 . 1 8 .85 1 7 . 1 5:45 8.90 1 7 . 1 8 .85 1 7 . 1
147
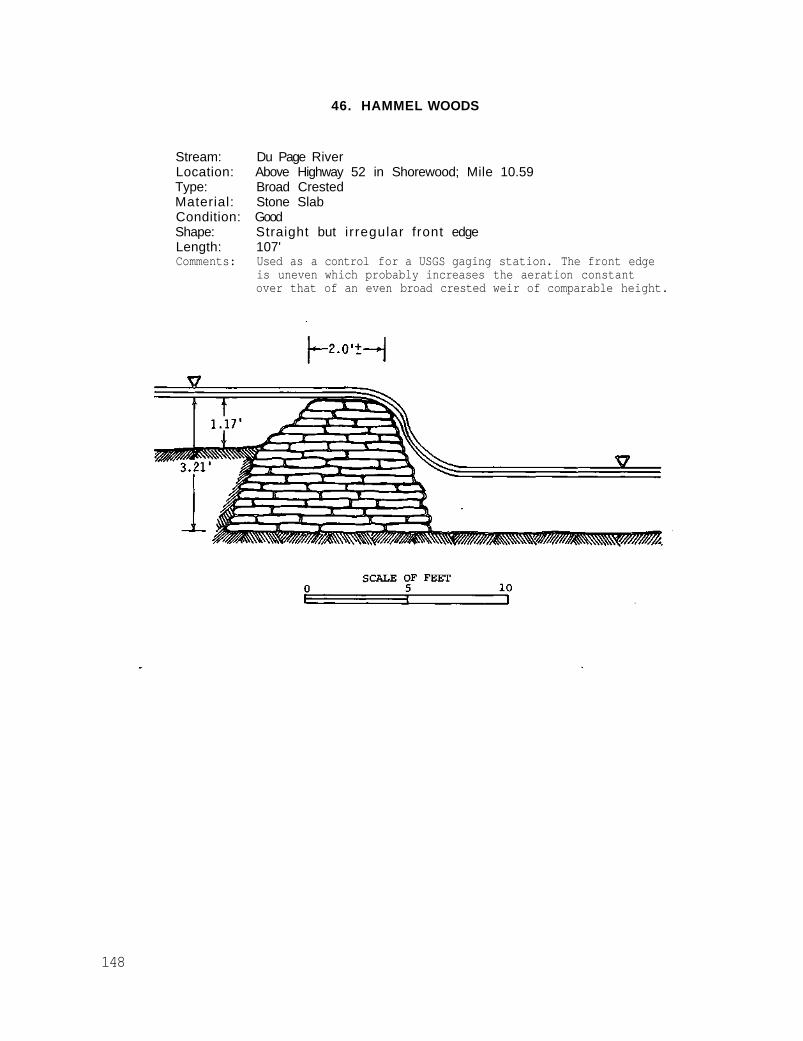
46. HAMMEL WOODS
Stream: Du Page River Location: Above Highway 52 in Shorewood; Mile 10.59 Type: Broad Crested Material: Stone Slab Condition: Good Shape: Straight but i rregular front edge Length: 107' Comments: Used as a control for a USGS gaging station. The front edge
is uneven which probably increases the aeration constant over that of an even broad crested weir of comparable height.
148
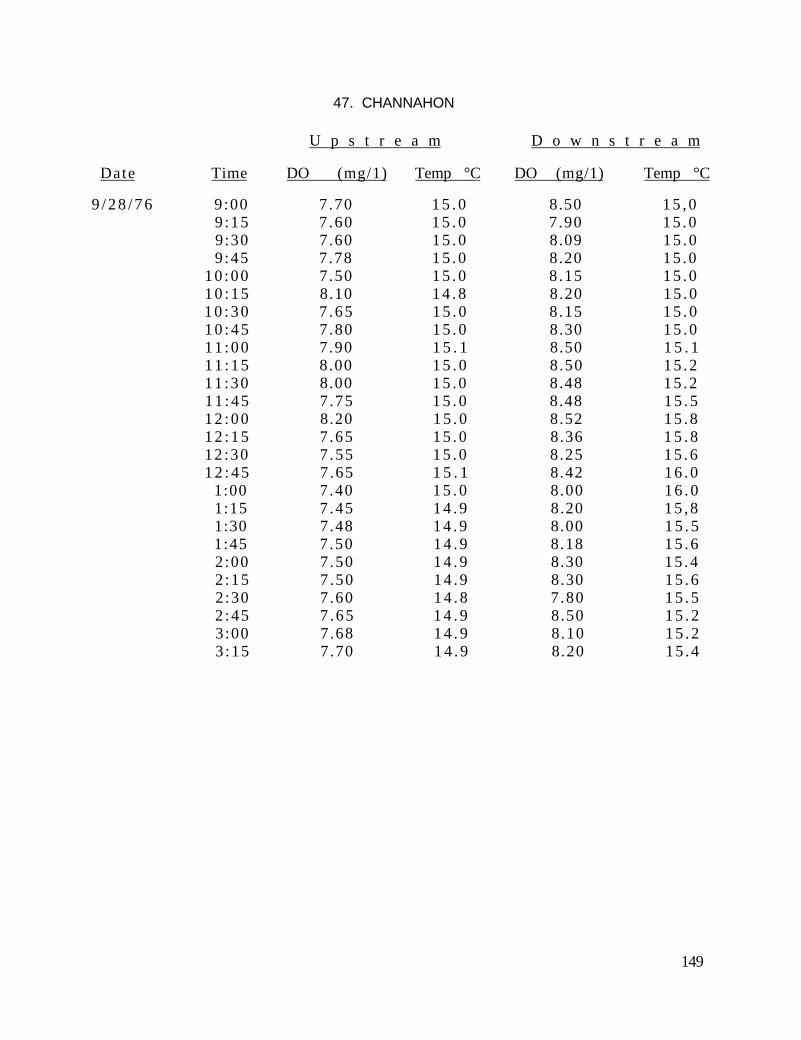
47. CHANNAHON
U p s t r e a m D o w n s t r e a m
Date Time DO (mg/1) Temp °C DO (mg/1) Temp °C
9 / 2 8 / 7 6 9 :00 7 .70 1 5 . 0 8.50 1 5 , 0 9 :15 7 .60 1 5 . 0 7 .90 1 5 . 0 9:30 7 .60 1 5 . 0 8.09 1 5 . 0 9 :45 7 .78 1 5 . 0 8.20 15 .0
10 :00 7 .50 1 5 . 0 8 .15 1 5 . 0 1 0 : 1 5 8.10 1 4 . 8 8.20 1 5 . 0 1 0 : 3 0 7 .65 1 5 . 0 8 .15 1 5 . 0 1 0 : 4 5 7 .80 1 5 . 0 8.30 1 5 . 0 1 1 : 0 0 7 .90 1 5 . 1 8.50 1 5 . 1 1 1 : 1 5 8.00 1 5 . 0 8.50 15 .2 11 :30 8.00 1 5 . 0 8.48 15 .2 1 1 : 4 5 7 .75 1 5 . 0 8.48 1 5 . 5 1 2 : 0 0 8.20 1 5 . 0 8.52 1 5 . 8 1 2 : 1 5 7 .65 1 5 . 0 8.36 1 5 . 8 12 :30 7 .55 1 5 . 0 8 .25 1 5 . 6 1 2 : 4 5 7 .65 1 5 . 1 8.42 1 6 . 0
1:00 7 .40 1 5 . 0 8.00 1 6 . 0 1:15 7 .45 1 4 . 9 8.20 1 5 , 8 1:30 7 .48 1 4 . 9 8.00 1 5 . 5 1:45 7 .50 1 4 . 9 8.18 1 5 . 6 2 :00 7 .50 1 4 . 9 8.30 15 .4 2 :15 7 .50 1 4 . 9 8.30 1 5 . 6 2 :30 7 .60 1 4 . 8 7 .80 1 5 . 5 2 :45 7 .65 1 4 . 9 8.50 1 5 . 2 3:00 7 .68 1 4 . 9 8.10 1 5 . 2 3 :15 7 .70 1 4 . 9 8.20 15 .4
149
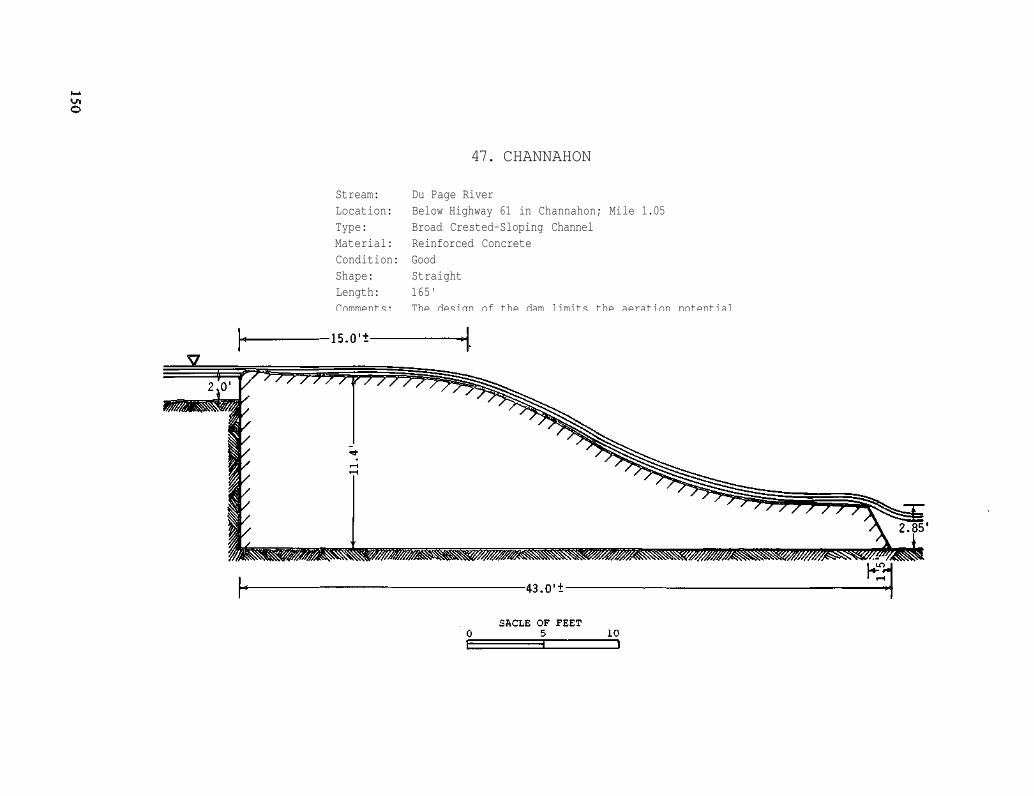
47. CHANNAHON
Stream: Du Page River Location: Below Highway 61 in Channahon; Mile 1.05 Type: Broad Crested-Sloping Channel Material: Reinforced Concrete Condition: Good Shape: Straight Length: 165' Comments: The design of the dam limits the aeration potential
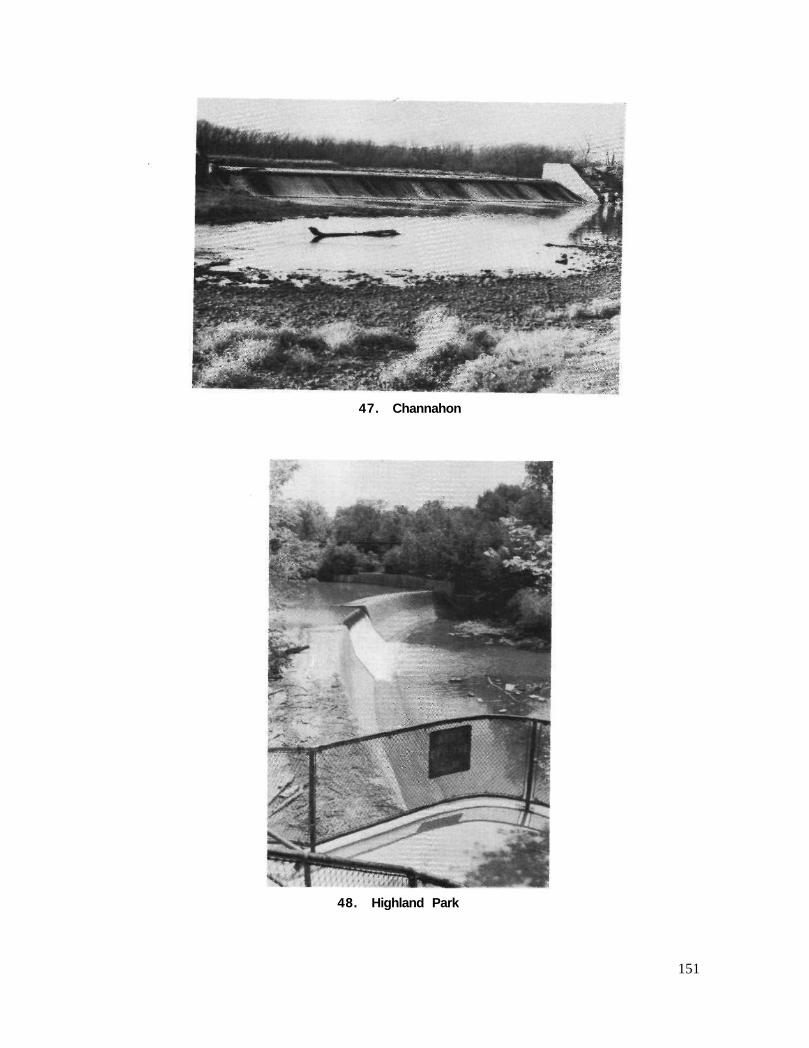
48. Highland Park
47. Channahon
151
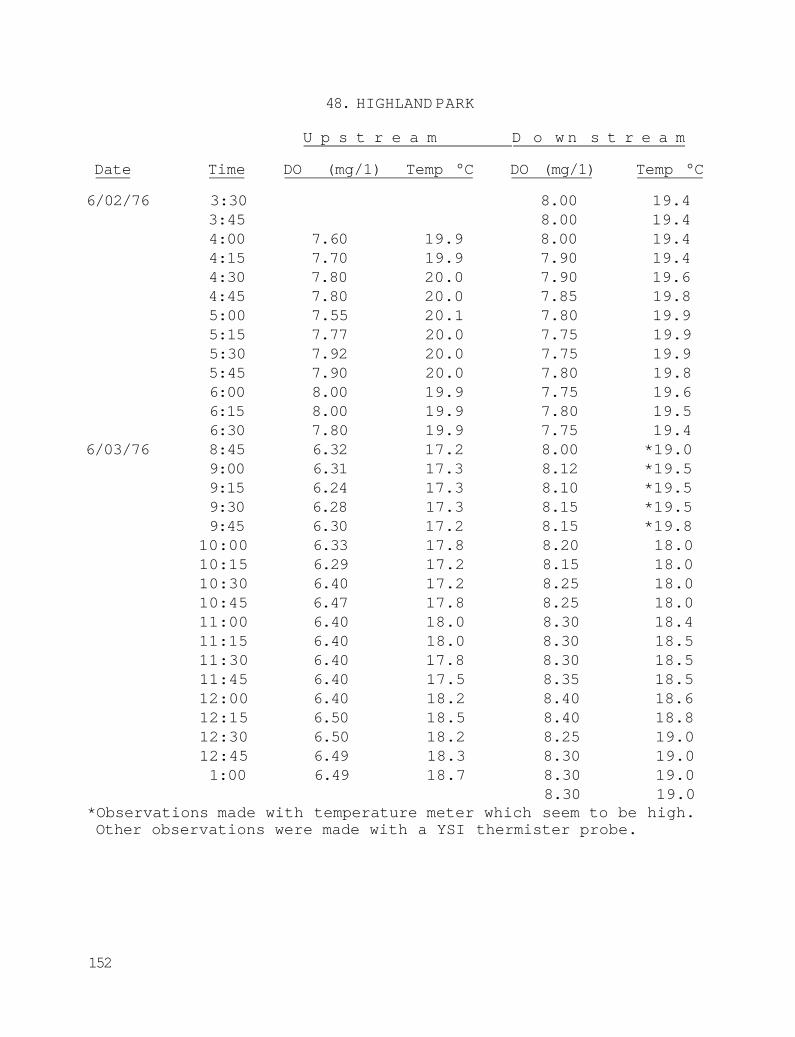
48. HIGHLAND PARK
U p s t r e a m D o w n s t r e a m Date Time DO (mg/1) Temp °C DO (mg/1) Temp °C 6/02/76 3:30 8.00 19.4
3:45 8.00 19.4 4:00 7.60 19.9 8.00 19.4 4:15 7.70 19.9 7.90 19.4 4:30 7.80 20.0 7.90 19.6 4:45 7.80 20.0 7.85 19.8 5:00 7.55 20.1 7.80 19.9 5:15 7.77 20.0 7.75 19.9 5:30 7.92 20.0 7.75 19.9 5:45 7.90 20.0 7.80 19.8 6:00 8.00 19.9 7.75 19.6 6:15 8.00 19.9 7.80 19.5 6:30 7.80 19.9 7.75 19.4
6/03/76 8:45 6.32 17.2 8.00 *19.0 9:00 6.31 17.3 8.12 *19.5 9:15 6.24 17.3 8.10 *19.5 9:30 6.28 17.3 8.15 *19.5 9:45 6.30 17.2 8.15 *19.8
10:00 6.33 17.8 8.20 18.0 10:15 6.29 17.2 8.15 18.0 10:30 6.40 17.2 8.25 18.0 10:45 6.47 17.8 8.25 18.0 11:00 6.40 18.0 8.30 18.4 11:15 6.40 18.0 8.30 18.5 11:30 6.40 17.8 8.30 18.5 11:45 6.40 17.5 8.35 18.5 12:00 6.40 18.2 8.40 18.6 12:15 6.50 18.5 8.40 18.8 12:30 6.50 18.2 8.25 19.0 12:45 6.49 18.3 8.30 19.0 1:00 6.49 18.7 8.30 19.0
8.30 19.0 *Observations made with temperature meter which seem to be high. Other observations were made with a YSI thermister probe.
152
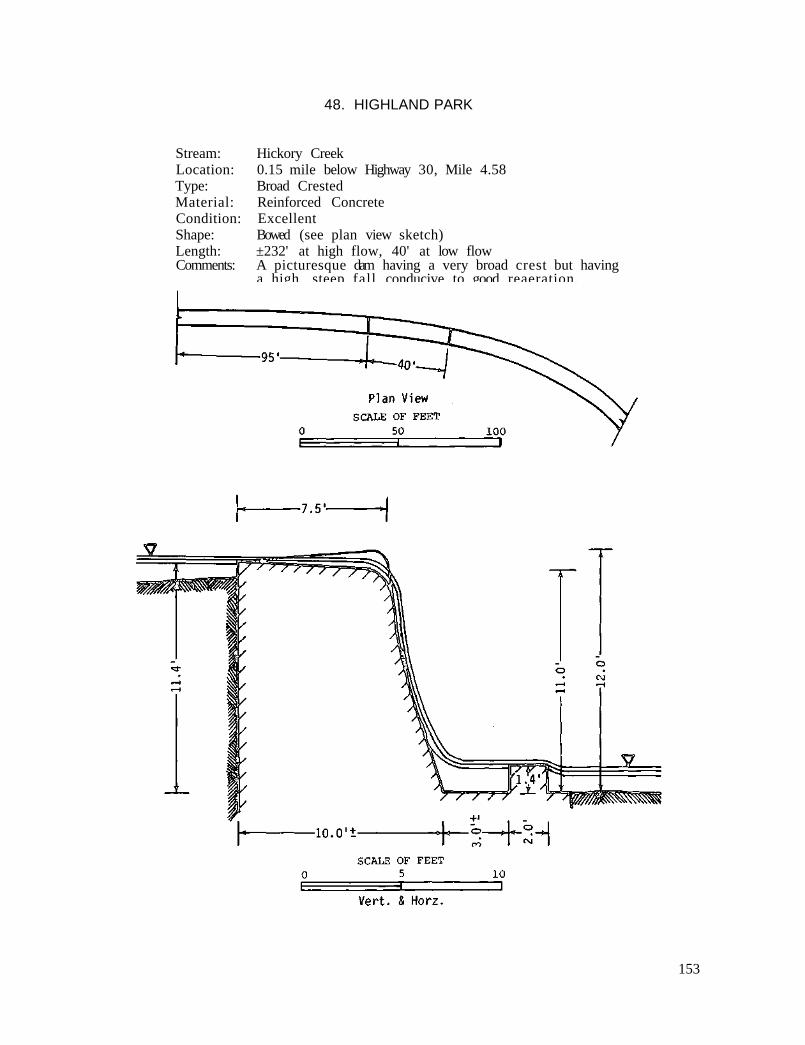
48. HIGHLAND PARK
Stream: Hickory Creek Location: 0.15 mile below Highway 30, Mile 4.58 Type: Broad Crested Material: Reinforced Concrete Condition: Excellent Shape: Bowed (see plan view sketch) Length: ±232' at high flow, 40' at low flow Comments: A picturesque dam having a very broad crest but having
a high, steep fall conducive to good reaeration.
153

Printed by authority of the State of Illinois - Ch. 127, IRS, Par. 58.29 (12-78-1000)