Embed Size (px)
Citation preview

30830 | Phys. Chem. Chem. Phys., 2016, 18, 30830--30836 This journal is© the Owner Societies 2016
Cite this:Phys.Chem.Chem.Phys.,
2016, 18, 30830
Effects of carbon surface topography on theelectrode/electrolyte interface structure andrelevance to Li–air batteries
S. V. Pavlov and S. A. Kislenko*
This work is focused on the effect of the electrode/electrolyte interface restructuring under the variation
of carbon surface topography, as one of the possible factors determining the electrochemical activity of
different carbon materials in Li–air batteries. Molecular dynamics simulation was used to investigate an
acetonitrile-based electrolyte in contact with the following carbon surfaces: graphene plane, single-layer
graphene edge, and multi-layer graphene edge. It was shown that the surface topography strongly
influences the electrolyte structure at the interface. Acetonitrile has a layered structure at the plane and
the edge of graphene nanoribbons and a qualitatively different chessboard structure at the multi-layer
graphene edge. It was found from the potentials of mean force that the variation of the surface
topography induces the redistribution of the reactants Li+ and O2 near the surface and influences their
adsorption rate. This should affect the kinetics of the oxygen reduction reaction and may explain massive
deposition of discharge products on graphene edges in Li–air batteries.
1 Introduction
Li–air batteries are among the most promising electrochemicalpower sources because of a very high practical energy density ofabout 1000 W h kg�11,2 that significantly exceeds the energydensity of state-of-the-art Li-ion batteries (150 W h kg�1).3
However, such performance has not yet been achieved. To solvethis problem new air cathodes are particularly developed basedon carbon powders, nanotubes and fibers, and graphenes.4
The crucial role of the morphology and the microstructure ofthe air electrode has been well recognized. Optimization of theseproperties provides high electrode conductivity, fast transport ofthe reactants O2 and Li+,5 and efficient deposition and storage ofthe insulating discharge products (Li2O2, Li2O).5,6 Experiments onmaterials with controlled porosity revealed that pores of 10–100 nmin diameter mainly contribute to discharge capacity.6–9 Theimportance of establishing a 3-phase electrochemical interfacewas also demonstrated.9,10
Another important issue concerns the electrochemical activityof carbon nanomaterials. It was shown that nitrogen-dopedporous carbon, nanotubes, and graphenes catalyze the oxygenreduction reaction (ORR).11–14 In addition, it was found thatsurface defects and singularities possess electrocatalytic activity.For example, the rate of electron transfer at the basal plane of
graphite is negligibly small in comparison with that at edge-planesites.15–18 This fact possibly explains a large amount of Li2O2 atgraphene edges after the discharge process,10 and selectiveelectrodeposition of MoO2 at step edges of graphite.19 In Patel’swork the slow rate of the electron transfer at the basal planewas not confirmed.20 However, recent delicate experiments on asingle-layer graphene sheet removed the doubts concerning theunique electrochemical properties of graphene edges.21,22 Theaccelerated electron transfer at open ends of carbon nanotubeswas also reported.15,17,23,24 Sidewalls of nanotubes also showelectrocatalytic activity, which depends on electrochemicalspecies dissolved in an electrolyte solution.25,26
Interpretation of these experimental results is hindered bythe lack of understanding of interfacial processes at the mole-cular level. Atomistic simulations are widely used to solve thisproblem. For instance, using quantum-chemical calculations,some features of oxygen reduction on the electrode surface,27
the catalytic mechanism of nitrogen-doped graphenes,28–30 aswell as the mechanism and thermodynamics for the dispro-portionation of LiO2 to Li2O2 were clarified.31,32
The electrocatalytic properties of different carbon nano-materials are typically attributed to the electronic structure ofthe surface and reactants.16,33 This agrees with the DFT calcu-lations predicting fast electron transfer at graphene edges dueto the decreased energy difference between the Fermi level andthe peak position of the density of states in the unoccupied O-2porbital of the adsorbed O2 molecule.28 However, the electrode/electrolyte interface structure leaves out of account. In our
Joint Institute for High Temperatures of the Russian Academy of Sciences,
Izhorskaya st. 13 Bd.2, 125412, Moscow, Russian Federation.
E-mail: [email protected], [email protected]
Received 10th August 2016,Accepted 6th October 2016
DOI: 10.1039/c6cp05552d
www.rsc.org/pccp
PCCP
PAPER
Ope
n A
cces
s A
rtic
le. P
ublis
hed
on 1
1 O
ctob
er 2
016.
Dow
nloa
ded
on 3
/22/
2022
10:
56:0
5 A
M.
Thi
s ar
ticle
is li
cens
ed u
nder
a C
reat
ive
Com
mon
s A
ttrib
utio
n-N
onC
omm
erci
al 3
.0 U
npor
ted
Lic
ence
.
View Article OnlineView Journal | View Issue

This journal is© the Owner Societies 2016 Phys. Chem. Chem. Phys., 2016, 18, 30830--30836 | 30831
previous works, it was shown by molecular dynamics (MD)simulation that an electrolyte is ordered at the interface,34–39
and this ordering influences the kinetics of heterogeneousprocesses.36,37 On the other hand, computer simulation andexperimental results show the dependence of the interfacestructure on the surface type.40–44 Thus, it can be supposedthat the variation of the surface topography results in restruc-turing of the electrode/electrolyte interface and, in turn, affectsthe kinetics of the ORR.
The goal of this work is to determine and investigate thetopography effect of the carbon surface on the interface structure,and analyze the results in the context of the ORR kinetics. The MDsimulation was used for the investigation of the aprotic solventacetonitrile (ACN) in contact with the following carbon surfaces:graphene plane, and single- and multi-layer graphene edges. ACNwas chosen because it is quite stable toward superoxide andcommonly used in investigations.45 Potentials of mean force werecalculated for the reactants Li+ and O2 with the aim of estimatingthe influence of the surface topography on the concentrationdistributions and rates of adsorption of the reactants.
2. Computational details
We used an orthorhombic simulation box, which contained all thesurfaces under the investigation simultaneously (Fig. 1). The solventslab of 12 nm in width was confined on both sides by crystalsurfaces 7.4 � 4.7 nm2 in area. The left surface is the parallel-oriented four-layer graphene. The right surface is the perpendicularlyoriented graphite with armchair edges. It imitates a multi-layergraphene edge. An armchair graphene nanoribbon of 3.7 nm inwidth is located in the central part of the box. Hydrogen atoms wereattached to edges of all graphenes. The intersurface separationswere chosen in such a way to avoid interference between nearbyinterfaces. 3D periodic boundary conditions were employed.Periodicity in the x direction was 25 nm.
The all-atom model developed by Nikitin et al. was usedfor ACN molecules.46 The Lennard-Jones parameters for C andH surface atoms were taken from the AMBER force field.Carbon surface atoms were fixed during the simulation, whilehydrogen atoms attached to the graphene edges were not fixed.
The bond stretching parameters of the C–H bond and associatedatom charges were equal to those of the benzene molecule.47 TheO–O bond length of the oxygen molecule was set to 1.21 Å;48,49
the stretching force constant (kr = 1694 kcal mol�1 �2) wasderived by fitting to the experimental vibrational frequency.50
The Lennard-Jones parameters for O and Li were taken fromthe AMBER force field.
The MD simulation was performed in the NVT ensemble attemperature T = 300 K kept constant using a Nose–Hooverthermostat. The system contained 4573 ACN molecules to ensure1 bar pressure in the liquid phase. The Ewald method with areal space cutoff value of 1 nm was used to investigate theelectrostatic interaction. The equations of motion were solvedusing the Verlet leapfrog integration algorithm with a time stepof 1 fs. The cutoff radius of the van der Waals interactionwas 1 nm. The system was equilibrated for 0.2 ns beforecollecting data. The simulation length used for statisticalaveraging was 5 ns.
To compute the potential of mean force (PMF) we employedone of the variants of restrained MD simulation and thermo-dynamic integration.51–53 The PMF for Li+ and O2 in ACN as afunction of the distance to a particular surface was calculatedby integrating the average force in the direction perpendicularto the surface h fx(x)i, acting on the whole solute (Li+ or O2):
FðxÞ ¼ �ðxxbulk
fxðxÞh idx
where xbulk is any position in the solvent bulk.To estimate the average force, we ran a series of MD
simulations where the solute is restrained at different distancesfrom the surface with the step of 0.5 Å. The distance of thesolute from the surface was fixed with the harmonic potentialsU(x) = k(x � xi)
2(k = 500 kJ mol�1 �2), acting on the Li+ ion orthe oxygen molecule.
On average, the net force h fx(x)i, acting on the solute due tothe solvent and the surface, is balanced by the harmonicrestraint force h f res
x (x)i, i.e. h fx(x)i + h f resx (x)i = 0. So, we can
obtain h fx(x)i indirectly using the equation h fx(x)i = �h f resx (x)i.
At each distance from the surface the force h f resz (z)i was averaged
over 0.5 ns.We used the DL_POLY classic package to perform MD
simulations.54 The calculations were run on the supercomputersMVS-100K and MVS-10P of the Joint Supercomputer Center ofthe Russian Academy of Sciences.
3. Results and discussion3.1 Solvent structure at the interface
Fig. 2a–c show contour maps of the mass density of acetonitrilenear the studied surfaces. It can be seen that the solvent has anordered structure, which essentially depends on the surfacetopography. Solvent has a layered structure near the plane ofthe multi-layer graphene (Fig. 2a). The width of the layers isapproximately 4 Å that corresponds to the size of ACN molecules.As one moves from the surface to the bulk, the structure of thesolvent becomes less ordered as a result of the thermal motionFig. 1 Snapshot of the simulation box.
Paper PCCP
Ope
n A
cces
s A
rtic
le. P
ublis
hed
on 1
1 O
ctob
er 2
016.
Dow
nloa
ded
on 3
/22/
2022
10:
56:0
5 A
M.
Thi
s ar
ticle
is li
cens
ed u
nder
a C
reat
ive
Com
mon
s A
ttrib
utio
n-N
onC
omm
erci
al 3
.0 U
npor
ted
Lic
ence
.View Article Online
30832 | Phys. Chem. Chem. Phys., 2016, 18, 30830--30836 This journal is© the Owner Societies 2016
of the solvent molecules. The ordering length is about 13 Å. Thisvalue characterizes spatial correlation in acetonitrile, i.e. the sizeof the short-range order in liquid. One can also note that thesolvent structures near the planes of the single- and multi-layergraphene are nearly identical (Fig. 2a and b). This indicates thatonly the top graphene layer influences the interface structure.
This observation reflects the typical behavior of liquid at acrystal surface. A similar layered structure has been previouslypredicted in our works on MD simulation of various surface/liquidinterfaces34–39,55 and has been confirmed experimentally.44,56–58
The layered structure is also observed near the edge of thesingle-layer graphene (Fig. 2b); in this case the solvent monolayers
Fig. 2 Maps of mass density (a–c), charge density (d–f), order parameter P1 (g–i), and order parameter P2 (j–l) near the studied surfaces.
PCCP Paper
Ope
n A
cces
s A
rtic
le. P
ublis
hed
on 1
1 O
ctob
er 2
016.
Dow
nloa
ded
on 3
/22/
2022
10:
56:0
5 A
M.
Thi
s ar
ticle
is li
cens
ed u
nder
a C
reat
ive
Com
mon
s A
ttrib
utio
n-N
onC
omm
erci
al 3
.0 U
npor
ted
Lic
ence
.View Article Online

This journal is© the Owner Societies 2016 Phys. Chem. Chem. Phys., 2016, 18, 30830--30836 | 30833
of ACN have some curvature because of the curved pattern ofthe surface. A qualitatively different structure is observed nearthe edge of the multi-layer graphene (Fig. 2c). In this case thegraphene sheets are alternately shifted with respect to eachother creating the lateral inhomogeneity of the surface. Due tothis feature, the continuity of the solvent layers is broken. Peaksand valleys of local density form a ‘‘chessboard’’ structure.
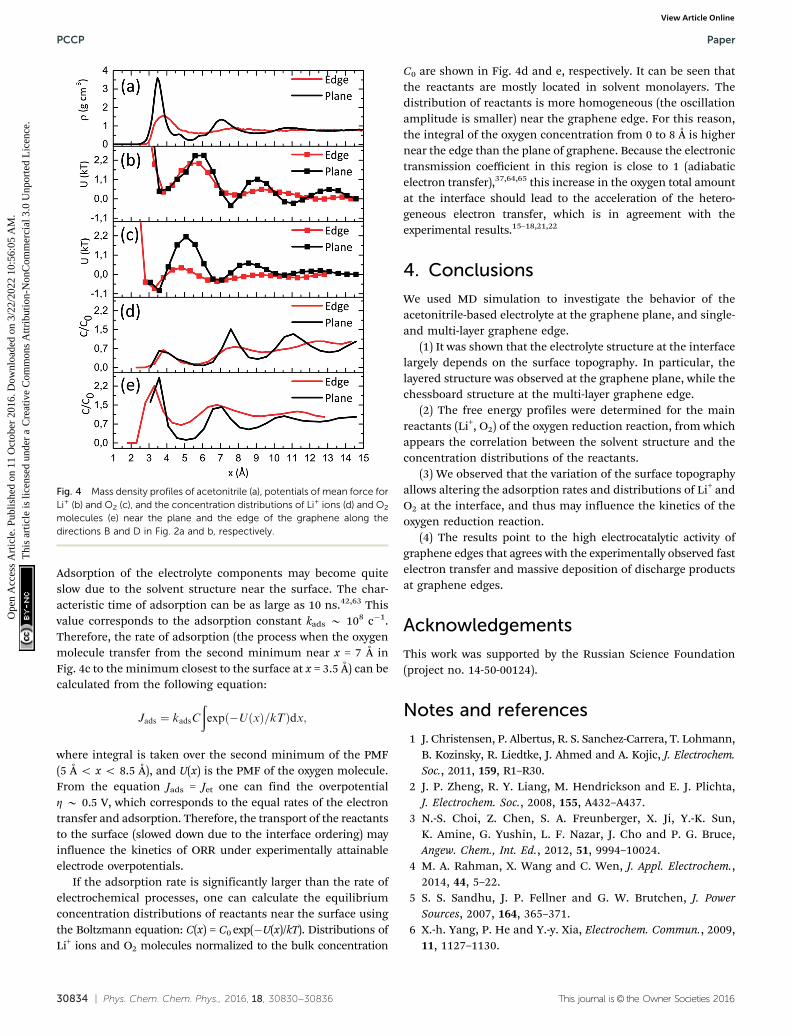
For detailed quantitative analysis of the influence of a carbonsurface topography on the electrode/solvent interface structure,we show in Fig. 3 the mass density profiles along the character-istic directions depicted in Fig. 2a–c. It can be noted that theoscillation amplitude along the direction D is smaller than thatalong the direction B, i.e. the layered structure at the single-layergraphene edge is less pronounced than that near the plane. Thedecrease of the closest to surface density maximum from 3.6 to1.6 g cm�3 is especially noticeable. Oscillations of local densitywith an increased period of about 6 Å are obtained along thedirection C near the graphene edges pushed out from thesurface; the first density maximum amounts to 1.8 g cm�3.Density oscillations are largest near the deeper edges (direction A),and closest to the surface density maximum reach 4.4 g cm�3 whilethe bulk density of ACN equals to 0.79 g cm�3.
In Fig. 2d–f we show maps of charge density. Due to thepolarity of the ACN molecules, the ordering near the cathodesurfaces leads to an inhomogeneous charge distribution. Such adistribution should result in the corresponding inhomogeneityof the electric field near the electrode surface and affect thebehavior of charged and polar species at the interface. In general,the maps of charge density and mass density qualitativelyduplicate each other.
To analyze the orientational order of acetonitrile moleculeswe calculated the order parameters P1 = hcos yi (Fig. 2g–i) andP2 = h3/2 cos2 y � 1/2i (Fig. 2j–l), where y is the angle betweenthe vector directed along the ACN molecule (from C to N atoms)and the normal to the cathode surface. Near the grapheneplane the parameters P1 and P2 behave in a qualitatively similarmanner. In the region near x = �6 Å, which corresponds to theacetonitrile molecules adsorbed on the surface, we find thatP1 = 0.15 and P2 = �0.45 (Fig. 2g and j). These values indicatenearly parallel orientation of the ACN molecules to the surface.
The order parameter P2 in Fig. 2k shows the orientational ordernear the plane as well as at the edge of the graphene. Incontrast, the parameter P1 in Fig. 2h depicts the orientationalorder produced by the graphene edge only, and does not reflectthe ordering near the plane. Polar bonds C–H at the grapheneedge orient dipole moments of the ACN molecules around it,thus forming the structure, which consists of concentric circles.This indicates that the electrode/electrolyte interface structurecan be affected not only by the geometry of the cathode surface,but also by the polarity of functional groups attached to the edge.It is interesting to note that at the edge of the multi-layergraphene the length of the order characterized by the parameterP1 in Fig. 2i is considerably larger than the one characterized bythe parameter P2 in Fig. 2l.
3.2 Potentials of mean force for Li+ and O2
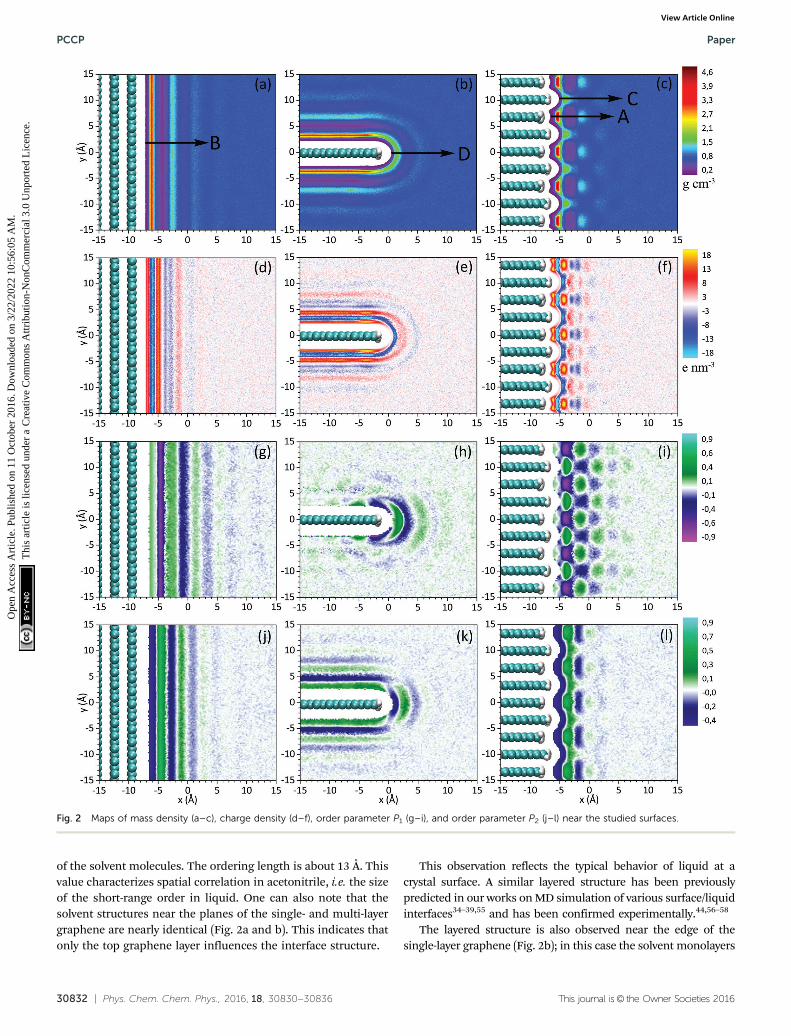
In order to determine the distributions of the main reactants ofthe ORR, we calculated the potential of mean force (PMF) forthe lithium ion and the oxygen molecule. Distributions near theplane and the edge of the graphene (along the directions B andD in Fig. 2a and b, respectively) were compared.
The PMF (Fig. 4b for Li+ and Fig. 4c for O2) exhibits qualita-tively similar oscillating behavior in all cases. In Fig. 4a we showonce again the mass density profiles of the solvent to facilitatethe comparison with the potentials of mean force. One can seethe correlation between the local density of the solvent and thepotentials of mean force for the solutes. Energy barriers coincidewith the mass density minima. This effect is associated withthe energy consumption to move a solute from one solvent layerto another. The PMF minimum closest to the cathode surfacecorresponds to the adsorbed reactants. Thus, the adsorption ofLi+ and O2 is an activation process.
It is noticeable that for both reactants the height of the barriersis smaller near the edge than near the plane of graphene. It canbe explained by the fact that the solvent layers near the edge areless pronounced and have smaller density. The most profoundeffect is observed for oxygen, for which the value of the highestenergy barrier becomes smaller than kT. In this case the adsorp-tion mechanism changes from activation to diffusion control.Consequently, the rate of Li+ and O2 adsorption is higher on theedge of graphene. It may lead to acceleration of the ORR if therate of adsorption is comparable to or slower than that ofthe rate-limiting step of the ORR.
Because of the complexity of the oxygen reduction reactionand the dependence of the rates of elementary steps on thesolvent,59,60 such a comparison requires a separate study. For acrude estimate we compare rates of adsorption and the hetero-geneous electron transfer from the surface to an oxygen mole-cule with the formation of a superoxide ion O2
� (the firstelementary step of the ORR). The experimentally measuredstandard rate constant of the electron transfer in acetonitrilek0
et is approximately equal to 10�4 cm c�1.61,62 Thus, the electrontransfer rate (electron flow per unit area) can be estimated usingthe Tafel equation Jet = k0
etC exp(aFZ/RT), where C is the oxygenconcentration in an electrolyte, Z is the overpotential, a is thecharge transfer coefficient, and F is the Faraday constant.
Fig. 3 Mass density profiles along the characteristic directions A, B, C, andD depicted in Fig. 2a–c.
Paper PCCP
Ope
n A
cces
s A
rtic
le. P
ublis
hed
on 1
1 O
ctob
er 2
016.
Dow
nloa
ded
on 3
/22/
2022
10:
56:0
5 A
M.
Thi
s ar
ticle
is li
cens
ed u
nder
a C
reat
ive
Com
mon
s A
ttrib
utio
n-N
onC
omm
erci
al 3
.0 U
npor
ted
Lic
ence
.View Article Online
30834 | Phys. Chem. Chem. Phys., 2016, 18, 30830--30836 This journal is© the Owner Societies 2016
Adsorption of the electrolyte components may become quiteslow due to the solvent structure near the surface. The char-acteristic time of adsorption can be as large as 10 ns.42,63 Thisvalue corresponds to the adsorption constant kads B 108 c�1.Therefore, the rate of adsorption (the process when the oxygenmolecule transfer from the second minimum near x = 7 Å inFig. 4c to the minimum closest to the surface at x = 3.5 Å) can becalculated from the following equation:
Jads ¼ kadsC
ðexpð�UðxÞ=kTÞdx;
where integral is taken over the second minimum of the PMF(5 Å o x o 8.5 Å), and U(x) is the PMF of the oxygen molecule.From the equation Jads = Jet one can find the overpotentialZ B 0.5 V, which corresponds to the equal rates of the electrontransfer and adsorption. Therefore, the transport of the reactantsto the surface (slowed down due to the interface ordering) mayinfluence the kinetics of ORR under experimentally attainableelectrode overpotentials.
If the adsorption rate is significantly larger than the rate ofelectrochemical processes, one can calculate the equilibriumconcentration distributions of reactants near the surface usingthe Boltzmann equation: C(x) = C0 exp(�U(x)/kT). Distributions ofLi+ ions and O2 molecules normalized to the bulk concentration
C0 are shown in Fig. 4d and e, respectively. It can be seen thatthe reactants are mostly located in solvent monolayers. Thedistribution of reactants is more homogeneous (the oscillationamplitude is smaller) near the graphene edge. For this reason,the integral of the oxygen concentration from 0 to 8 Å is highernear the edge than the plane of graphene. Because the electronictransmission coefficient in this region is close to 1 (adiabaticelectron transfer),37,64,65 this increase in the oxygen total amountat the interface should lead to the acceleration of the hetero-geneous electron transfer, which is in agreement with theexperimental results.15–18,21,22
4. Conclusions
We used MD simulation to investigate the behavior of theacetonitrile-based electrolyte at the graphene plane, and single-and multi-layer graphene edge.
(1) It was shown that the electrolyte structure at the interfacelargely depends on the surface topography. In particular, thelayered structure was observed at the graphene plane, while thechessboard structure at the multi-layer graphene edge.
(2) The free energy profiles were determined for the mainreactants (Li+, O2) of the oxygen reduction reaction, from whichappears the correlation between the solvent structure and theconcentration distributions of the reactants.
(3) We observed that the variation of the surface topographyallows altering the adsorption rates and distributions of Li+ andO2 at the interface, and thus may influence the kinetics of theoxygen reduction reaction.
(4) The results point to the high electrocatalytic activity ofgraphene edges that agrees with the experimentally observed fastelectron transfer and massive deposition of discharge productsat graphene edges.
Acknowledgements
This work was supported by the Russian Science Foundation(project no. 14-50-00124).
Notes and references
1 J. Christensen, P. Albertus, R. S. Sanchez-Carrera, T. Lohmann,B. Kozinsky, R. Liedtke, J. Ahmed and A. Kojic, J. Electrochem.Soc., 2011, 159, R1–R30.
2 J. P. Zheng, R. Y. Liang, M. Hendrickson and E. J. Plichta,J. Electrochem. Soc., 2008, 155, A432–A437.
3 N.-S. Choi, Z. Chen, S. A. Freunberger, X. Ji, Y.-K. Sun,K. Amine, G. Yushin, L. F. Nazar, J. Cho and P. G. Bruce,Angew. Chem., Int. Ed., 2012, 51, 9994–10024.
4 M. A. Rahman, X. Wang and C. Wen, J. Appl. Electrochem.,2014, 44, 5–22.
5 S. S. Sandhu, J. P. Fellner and G. W. Brutchen, J. PowerSources, 2007, 164, 365–371.
6 X.-h. Yang, P. He and Y.-y. Xia, Electrochem. Commun., 2009,11, 1127–1130.
Fig. 4 Mass density profiles of acetonitrile (a), potentials of mean force forLi+ (b) and O2 (c), and the concentration distributions of Li+ ions (d) and O2
molecules (e) near the plane and the edge of the graphene along thedirections B and D in Fig. 2a and b, respectively.
PCCP Paper
Ope
n A
cces
s A
rtic
le. P
ublis
hed
on 1
1 O
ctob
er 2
016.
Dow
nloa
ded
on 3
/22/
2022
10:
56:0
5 A
M.
Thi
s ar
ticle
is li
cens
ed u
nder
a C
reat
ive
Com
mon
s A
ttrib
utio
n-N
onC
omm
erci
al 3
.0 U
npor
ted
Lic
ence
.View Article Online
This journal is© the Owner Societies 2016 Phys. Chem. Chem. Phys., 2016, 18, 30830--30836 | 30835
7 M. Mirzaeian and P. J. Hall, Electrochim. Acta, 2009, 54,7444–7451.
8 M. Mirzaeian and P. J. Hall, J. Power Sources, 2010, 195,6817–6824.
9 C. Tran, X.-Q. Yang and D. Qu, J. Power Sources, 2010, 195,2057–2063.
10 Y. Li, J. Wang, X. Li, D. Geng, R. Li and X. Sun, Chem.Commun., 2011, 47, 9438–9440.
11 P. Kichambare, J. Kumar, S. Rodrigues and B. Kumar,J. Power Sources, 2011, 196, 3310–3316.
12 P. Kichambare, S. Rodrigues and J. Kumar, ACS Appl. Mater.Interfaces, 2012, 4, 49–52.
13 Y. Li, J. Wang, X. Li, D. Geng, M. N. Banis, R. Li and X. Sun,Electrochem. Commun., 2012, 18, 12–15.
14 Y. Li, J. Wang, X. Li, J. Liu, D. Geng, J. Yang, R. Li and X. Sun,Electrochem. Commun., 2011, 13, 668–672.
15 C. E. Banks, T. J. Davies, G. G. Wildgoose andR. G. Compton, Chem. Commun., 2005, 829–841.
16 T. J. Davies, M. E. Hyde and R. G. Compton, Angew. Chem.,2005, 117, 5251–5256.
17 C. E. Banks and R. G. Compton, Analyst, 2006, 131,15–21.
18 A. Ambrosi, A. Bonanni and M. Pumera, Nanoscale, 2011, 3,2256–2260.
19 M. P. Zach, K. H. Ng and R. M. Penner, Science, 2000, 290,2120–2123.
20 A. N. Patel, M. G. Collignon, M. A. O’Connell, W. O. Y. Hung,K. McKelvey, J. V. Macpherson and P. R. Unwin, J. Am.Chem. Soc., 2012, 134, 20117–20130.
21 W. Yuan, Y. Zhou, Y. Li, C. Li, H. Peng, J. Zhang, Z. Liu,L. Dai and G. Shi, Sci. Rep., 2013, 3, 2248.
22 S. Banerjee, J. Shim, J. Rivera, X. Jin, D. Estrada, V. Solovyeva,X. You, J. Pak, E. Pop, N. Aluru and R. Bashir, ACS Nano,2013, 7, 834–843.
23 C. E. Banks and R. G. Compton, Analyst, 2005, 130,1232–1239.
24 A. Chou, T. Bocking, N. K. Singh and J. J. Gooding, Chem.Commun., 2005, 842–844, DOI: 10.1039/B415051A.
25 T. S. Miller, N. Ebejer, A. G. Guell, J. V. Macpherson andP. R. Unwin, Chem. Commun., 2012, 48, 7435–7437.
26 K. Gong, S. Chakrabarti and L. Dai, Angew. Chem., Int. Ed.,2008, 47, 5446–5450.
27 Z. Shi, J. Zhang, Z.-S. Liu, H. Wang and D. P. Wilkinson,Electrochim. Acta, 2006, 51, 1905–1916.
28 H. Kim, K. Lee, S. I. Woo and Y. Jung, Phys. Chem. Chem.Phys., 2011, 13, 17505–17510.
29 H. Tominaga, W. Ikeda and M. Nagai, Phys. Chem. Chem.Phys., 2011, 13, 2659–2662.
30 T. Ikeda, M. Boero, S.-F. Huang, K. Terakura, M. Oshimaand J.-i. Ozaki, J. Phys. Chem. C, 2008, 112, 14706–14709.
31 V. S. Bryantsev, M. Blanco and F. Faglioni, J. Phys. Chem. A,2010, 114, 8165–8169.
32 U. Das, K. C. Lau, P. C. Redfern and L. A. Curtiss, J. Phys.Chem. Lett., 2014, 5, 813–819.
33 K. K. Cline, M. T. McDermott and R. L. McCreery, J. Phys.Chem., 1994, 98, 5314–5319.
34 S. A. Kislenko, I. S. Samoylov and R. H. Amirov, Phys. Chem.Chem. Phys., 2009, 11, 5584–5590.
35 S. A. Kislenko, R. H. Amirov and I. S. Samoylov, Phys. Chem.Chem. Phys., 2010, 12, 11245–11250.
36 S. A. Kislenko, R. H. Amirov and I. S. Samoylov, J. Phys.Chem. C, 2013, 117, 10589–10596.
37 V. A. Nikitina, S. A. Kislenko, R. R. Nazmutdinov,M. D. Bronshtein and G. A. Tsirlina, J. Phys. Chem. C,2014, 118, 6151–6164.
38 S. A. Kislenko, V. A. Nikitina and R. R. Nazmutdinov, HighEnergy Chem., 2015, 49, 341–346.
39 S. A. Kislenko, V. A. Nikitina and R. R. Nazmutdinov, Phys.Chem. Chem. Phys., 2015, 17, 31947–31955.
40 J. Vatamanu, L. Cao, O. Borodin, D. Bedrov and G. D. Smith,J. Phys. Chem. Lett., 2011, 2, 2267–2272.
41 C. Merlet, C. Pean, B. Rotenberg, P. A. Madden, B. Daffos,P. L. Taberna, P. Simon and M. Salanne, Nat. Commun.,2013, 4, 2701.
42 S. Kerisit, D. J. Cooke, D. Spagnoli and S. C. Parker, J. Mater.Chem., 2005, 15, 1454–1462.
43 N. Sieffert and G. Wipff, J. Phys. Chem. C, 2008, 112,19590–19603.
44 R. Atkin and G. G. Warr, J. Phys. Chem. C, 2007, 111,5162–5168.
45 V. S. Bryantsev, V. Giordani, W. Walker, M. Blanco,S. Zecevic, K. Sasaki, J. Uddin, D. Addison andG. V. Chase, J. Phys. Chem. A, 2011, 115, 12399–12409.
46 A. M. Nikitin and A. P. Lyubartsev, J. Comput. Chem., 2007,28, 2020–2026.
47 W. D. Cornell, P. Cieplak, C. I. Bayly, I. R. Gould, K. M.Merz, D. M. Ferguson, D. C. Spellmeyer, T. Fox,J. W. Caldwell and P. A. Kollman, J. Am. Chem. Soc., 1995,117, 5179–5197.
48 K. P. Huber and G. Herzberg, Molecular Spectra and MolecularStructure. IV. Constants of Diatomic Molecules, Van NostrandReinhold, New York, 1979.
49 C. Hartnig and M. T. M. Koper, J. Electroanal. Chem., 2002,532, 165–170.
50 K. K. Irikura, J. Phys. Chem. Ref. Data, 2007, 36, 389–397.51 J. Van Eerden, W. J. Briels, S. Harkema and D. Feil, Chem.
Phys. Lett., 1989, 164, 370–376.52 V. Vivcharuk, B. Tomberli, I. S. Tolokh and C. G. Gray, Phys.
Rev. E: Stat., Nonlinear, Soft Matter Phys., 2008, 77,031913.
53 I. S. Tolokh, V. Vivcharuk, B. Tomberli and C. G. Gray, Phys.Rev. E: Stat., Nonlinear, Soft Matter Phys., 2009, 80, 031911.
54 I. T. Todorov, W. Smith, K. Trachenko and M. T. Dove,J. Mater. Chem., 2006, 16, 1911–1918.
55 S. A. Kislenko, V. A. Kislenko and V. F. Razumov, Colloid J.,2015, 77, 727–732.
56 S. H. Oh, Y. Kauffmann, C. Scheu, W. D. Kaplan andM. Ruhle, Science, 2005, 310, 661–663.
57 R. G. Horn and J. N. Israelachvili, J. Chem. Phys., 1981, 75,1400–1411.
58 H. K. Christenson, J. Chem. Phys., 1983, 78, 6906–6913.59 K. M. Abraham, J. Electrochem. Soc., 2015, 162, A3021–A3031.
Paper PCCP
Ope
n A
cces
s A
rtic
le. P
ublis
hed
on 1
1 O
ctob
er 2
016.
Dow
nloa
ded
on 3
/22/
2022
10:
56:0
5 A
M.
Thi
s ar
ticle
is li
cens
ed u
nder
a C
reat
ive
Com
mon
s A
ttrib
utio
n-N
onC
omm
erci
al 3
.0 U
npor
ted
Lic
ence
.View Article Online

30836 | Phys. Chem. Chem. Phys., 2016, 18, 30830--30836 This journal is© the Owner Societies 2016
60 L. Johnson, C. Li, Z. Liu, Y. Chen, S. A. Freunberger,P. C. Ashok, B. B. Praveen, K. Dholakia, J.-M. Tarasconand P. G. Bruce, Nat. Chem., 2014, 6, 1091–1099.
61 C. O. Laoire, S. Mukerjee, K. M. Abraham, E. J. Plichta andM. A. Hendrickson, J. Phys. Chem. C, 2009, 113, 20127–20134.
62 C. O. Laoire, S. Mukerjee, K. M. Abraham, E. J. Plichta andM. A. Hendrickson, J. Phys. Chem. C, 2010, 114, 9178–9186.
63 S. Kerisit and S. C. Parker, J. Am. Chem. Soc., 2004, 126,10152–10161.
64 V. A. Nikitina, A. V. Rudnev, G. A. Tsirlina and T. Wandlowski,J. Phys. Chem. C, 2014, 118, 15970–15977.
65 D. E. Khoshtariya, T. D. Dolidze, M. Shushanyan, K. L. Davis,D. H. Waldeck and R. van Eldik, Proc. Natl. Acad. Sci. U. S. A.,2010, 107, 2757–2762.
PCCP Paper
Ope
n A
cces
s A
rtic
le. P
ublis
hed
on 1
1 O
ctob
er 2
016.
Dow
nloa
ded
on 3
/22/
2022
10:
56:0
5 A
M.
Thi
s ar
ticle
is li
cens
ed u
nder
a C
reat
ive
Com
mon
s A
ttrib
utio
n-N
onC
omm
erci
al 3
.0 U
npor
ted
Lic
ence
.View Article Online