Embed Size (px)
Citation preview

Effectiveness of Rice Procurement Program and the Determinants of the Farm Level Stocks of Rice in Bangladeshi
Mohammad J. Alam1&*, Shaheen Akter2 and Ismat A. Begum3
1 Deptt. of Agribusiness and Marketing, Bangladesh Agricultural University, Bangladesh * Dyson School of Applied Economics and Management, Cornell University, New York, USA 2 Technology and Management Centre for Development, ODID, University of Oxford, UK 3 Deptt. of Agricultural Economics, Bangladesh Agricultural University, Bangladesh
Abstract
Domestic rice procurement program serves the dual purposes of building rice stocks for the public
food grain distribution system and of providing income support to farmers. Government of
Bangladesh provides a support price higher than the cost of production. However, we examine the
effectiveness of rice procurement program and analyse the factors influencing farm level rice
stocks, to understand the household level food security. In doing so, we use Household Income and
Expenditure Survey 2010 data, historical and field survey data. We find that government stock and
market price were negatively correlated with domestic procurement but the planned distribution
was positive correlated with it. Results also show that annual household income including farm
income increased dueii to procurement program. Moreover, stocks at the farm level vary positively
with respect to own price but negatively with respect to consumer price of coarse rice.
Keywords: Rice procurement program, farm level stock, effectiveness, Bangladesh
June, 2015

2
1. Introduction
In Bangladesh, as per defined public policy documents, domestic rice procurement serves the
dual purposes of building rice stocks for the public food grain distribution system and of
providing income support to farmers. To fulfill the later the government provides a support price
higher than the cost of production of rice in order to ensure that farmers do not produce at a loss.
Higher prices, however, are in conflict with the objective of keeping prices low enough so that
the low-income consumers can afford to buy food. This conflict can be avoided through higher
government subsidies, but these have budgetary implications for the country and can reduce
investment in public goods essential for long-term growth. Subsidies have also implications for
market distortion. Inefficient use of relevant goods and services or resources results in higher
environmental consequences. For example, input subsidies may help poor farmers to keep cost of
production down but the overuse would reduce soil quality and harm biodiversity. There are also
evidences of leakages; subsidies benefit wealthy farmers instead of poorer farmers.
Besides having an impact on the government budget, procurement prices of rice that are much
higher than market prices, in turn, favor rent seeking opportunities leading to further increase in
costs for the government. Since the bulk of rice that is procured is bought from millers or other
traders (Ali, 2010), any rents would disproportionately benefit millers and traders.
Apart from that, the timing of the announcement of the procurement price is also an important
decision. Announcement of the price in advance of planting would allow the government some
influence over the area planted, it could encourage investment by farmers and greater use of
inputs, and it could improve prices when farmers engage in distress sales before harvest. But
advance announcement of a price of course may make it more difficult to defend the price at the
time of actual procurement.
However, given the budgetary pressure in one hand, and potential misuse of public resources on
the other, the National Food Policy Plan of Action (2008-2015), recognises the importance of
evaluating the effectiveness of the program and if needed, enhancing the effectiveness of the
program and providing effective support to producer prices, while ensuring stable prices for the
consumers. Formulating optimum policy that benefits both producers and consumers is always

3
poses serious challenges for the policy makers. But it is not yet identified what works better for
the betterment of farmers who are the major suppliers of agricultural produce.
Given the above backdrop, this study attempts to assess the effectiveness of the rice procurement
program and to identify the factors associated with the farm level rice stock in Bangladesh. Since
national level rice storage capacity is limited and involves huge public investment, so stock at
farm-level might help in reducing pressure at government storage, hence understanding the
stocks and factors associated with farm-level stock are important and have huge implications for
farm-level food security in Bangladesh. For assessing the program effectiveness the paper
examines how the program objectives are met-up, this is done by using farm level, historical and
Nationally Representative Household Income and Expenditure survey data - this is unique of this
paper. The remainder of the paper is organised as follows. Following introduction, a brief review
of literature is presented in section 2. Section 3 provides data which is followed by a conceptual
note on stock calculation and econometric models in section 4 and section 5. The results and
discussions are presented in section 6. Last section concludes.
2. Literature Review
Quasem (1979) finds that government procurement program of paddy benefited the
intermediaries more than the farmers because of the mechanism of procurement proved little
incentive to farmers for selling at the procurement centers. The study indicates that all size
groups sell paddy immediately after harvest; about half of them buy back in the lean-season at a
higher price. Islam (1982) finds that the procurement policy failed to achieve all the objectives of
the program such as building rice stocks and supporting farmers’ income. The author makes
suggestion for its effective use such as, (a) the procurement centers should be re-arranged in
order to cover the surplus rice growing areas, (b) it should give more emphasis on Boro rice
which represent important growth points so far as food grain production in Bangladesh is
concerned, (c) the procurement should introduce more flexibility regarding the minimum size of
a lot that can be purchased, the moisture content, and the system of price payment, (d) the
procurement price should be fixed at a sufficient high level so that it can create incentive for
increased production, (e) the procurement drive should start immediately after the harvest, a
delay in this respect may cause shortfall in the procurement target.

4
Akter (1990), finds that both net sellers and net buyers benefit from a buffer stock scheme with
either a constant mean price or a modestly increasing price over the paddy season. Net buyers as
well as consumers are losers from a stabilised price higher than average price over the paddy
season. Osmani and Quasem (1990) identified several factors contribute to the unsatisfactory
performance of the domestic rice procurement program in the past. Excessive commercial
imports in public sector particularly in good harvest years used up effective storage capacity
leading to a failure in the procurement program in the next harvest. Moreover, the procurement
program itself limits the access of the farmers so that they are obliged to sell to the private
traders at a lower price. Inadequate number of procurement centers, institutional impediments,
collusion between the traders and the officials are other notable shortcomings of procurement
program in Bangladesh. The authors find that a sizeable share of procurement was from large
farmers and traders, not small and medium farmers. Shahabuddin (1991) states that domestic
procurement of rice is one of the several public policy instruments, which has been using as a
price stabilising mechanism for years. But this mechanism has been found largely ineffective in
maintaining the stability of market prices as the government has not followed a consistent
framework that involve setting a target price range. In developing a consistent framework for
stabilising price in Bangladesh this study suggested a shift from the current practice of quantity
planning to that of price-based planning of the food system.
Shahabuddin (1992) indicates that since both domestic procurement and open market sales are
essentially seasonal operations influenced by seasonal factors, a more disaggregated approach
using seasonal data is considered more appropriate to estimate the quantities of grains to be
procured during harvest season and sold in the lean season to achieve the floor and ceiling price
targets. Such a consistent derivation of quantity targets would not only contribute towards the
preparation of a more realistic food budget but would also assist in a better targeting of policy
instruments for reducing both the inter and the intra year fluctuation of food grain prices.
Chowdhury (1994) mentions that domestic rice procurement is a relatively small source,
accounted for 20%, of the Public Food Distribution System (PFDS) throughout per year during
the 1980s. The study finds that farmers’ share to public procurement is very little so that the
financial coverage is too limited to ensure farmers’ participation in procurement. Moreover, there
was collusion between the procurement functionaries, basically government officials, and the
traders. However, the study states that procurement program has an independent and positive

5
effect on rural rice prices. However, the effect is very small, and it does not necessarily mean
that the program is ‘farmer-friendly’. Rice procurement, however, is a cost-ineffective program.
Dorosh and Shahabuddin (1999) finds that the average wholesale price of Aman rice at harvest
was above the procurement price in five of the last six years, resulting in an average of only
8.9% fulfillment of procurement target. On the other hand, procurement price of Boro rice was
excessively higher in three out of four recent years. This results an extra government cost and a
windfall profits to those who are fortunate enough to sell at the procurement centers. Moreover,
procurement prices substantially above market prices encourage rent-seeking behaviour and add
to the potential for corruption of public officials connected with procurement. The determination
of procurement prices at the level of price support is then a critically important task in order to
ensure adequate production incentives to the farmers, while at the same time minimising costs to
the public exchequer.
Shahabuddin and Islam (1999) evaluates effectiveness of the domestic procurement program in
terms of participation of farmers, traders and millers and problems faced by them in the process
of both paddy and rice procurement. They find that the participation of farmers, especially small
and medium farmers in the domestic procurement program is disappointingly low (only 10%).
To increase farmers’ participation in the procurement program they suggests to reorganise
procurement program at Local Storage Depot (LSD) to minimise unofficial payments to both
officials/staff and labourer, to initiate procurement program soon after harvest, to minimise
irregularities in weighing, to create temporary storage at LSD premises to prevent damage of
farmers’ paddy due to inclement weather, etc. Dorosh et al. (2001) observes that Boro
procurement has been much more reliable than Aman procurement. Procurement of Boro
exceeded 80% of the target on 9 out of 13 years and failed at least 60% of the target in only one
year. Aman procurement, on the other hand, exceeded 80% of the target in only 2 out of 12
years, and failed to reach 60% of the target in 8 out of 12 years. In these eight years, Aman
procurement averaged only 18.5% of the target. Major irregularities in choosing the farmers to
buy paddy are reported by Reza (2001). The major problems in supplying rice to the
procurement centers are illegal payment, taking extra amount, and unnecessary harassment.
Based on the views reported by the farmers, traders and millers, the author suggests for early
start of procurement, stopping corruption and bribing, establishment of a procurement center at
6
the village level, setting the procurement price higher than the market price, directly receiving
the paddy/rice after arrival at the procurement center, increasing the duration of procurement.
Khan and Jamal (1997) find that in most developing countries of the world, large-scale public
food procurement and distribution systems have become too expensive for the country’s
governments. Despite high financial and administrative cost of the programs, the degree of
seasonal price stabilisation and price support achieved through the activities remain quite low.
Using the Bangladesh PFDS as a case study, the research indicates that considerable
improvements in price support could be achieved by providing credit to the farmers immediately
after the harvest. If the government procurement is reduced by 50% in Bangladesh, and
providing 150% of the cost of running PFDS as credit, Bangladesh can improve the farmers’
income and achieve better stability of cereal prices at a cost less than one-third of the current
costs of PFDS. Dorosh and Shahabuddin (2002) show that relatively high degree of price
stability was achieved in the 1990s due to private sector imports that stabilised markets following
major production shortfalls. Domestic rice procurement contributes relatively little in raising
domestic producer prices at harvest time, involved only a small percentage of farmers, and
incurred excessive costs following successful harvests because of setting procurement prices far
in excess of market prices. Almost similar results are reported by Sabur et al. (2003). The
authors report that the lengthy procedures, loss of time and high transportation are the main
causes for not selling paddy to the procurement center. Dorosh and Farid (2003) study the
economic costs of stock quality deterioration in storage, including the implicit costs to recipients
of PFDS. They observe that implicit losses to rice consumers due to quality deterioration were
about 1.05 billion Taka in 2000/01, equal to 10.9% of total net outlay on rice of the PFDS.
Dorosh (2009) studies domestic trade policies and government market interventions in a set of
South Asian countries in response to 2007-08 international price shocks on domestic markets.
The author mentions that the price shock during 2007-08 is a reminder that dependence on
international markets will not guarantee price stability, still the governments should not over-
react to such events and embrace policies that ultimately result in large costs in terms of slower
economic growth and less poverty reduction. Instead, national policies should involve some
combination of promoting domestic production and national stocks to prevent very large price
increases and reliance on international trade to limit the need for government interventions in
most years. Asaduzzaman et al. (2009) states that input subsidies and domestic food grain

7
procurement programs are short term efforts that the government uses to reduce farmers’ costs of
growing food and/or influence the price of food in the market. The paper opine that a systematic
evaluation of government programs like subsidising agricultural inputs or procurement of food
grain should be done urgently to judge the effectiveness and cost of the government for each
approach. The evaluations should include both the direct costs (e.g., of subsidies on inputs, food
grain storage costs, etc.) and the opportunity costs of capital (tying Government funds up in food
grain stores) and labour (using government staff to manage input subsidy schemes and food grain
stores). Shahabuddin et al. (2009) recommends improving the effectiveness of procurement
policy and price support to the farmers by introducing a system of open tendering in order to
reduce costs and improve the reliability of the program. However, the studies show variable
results. This pose a real challenge for policy makers to understand the program effectiveness in
terms of how the program delivers in fulfilling its objectives. This is very important since over
the time, the implementation of program has been varying and rice production seasons changing
- from Aus dominated rice production to Boro dominated rice production. This study however
combines different rich databases such as HIES, 2010, long historical databases and field survey
data, to examines the effectiveness of the program.
3. Data
The data sources of the study are (i) Household Income and Expenditure (HIES) 2010 survey:
HIES 2010 data set is used to analyse the factors affecting farmers stocking behaviour by season.
The household survey was carried out by the Bangladesh Bureau of Statistics during February
2010– January 2011. Total sample size of the survey was 12,240, where 7,840 from rural area
and 4,400 from urban area. Out of these households 4101 households were rice growers in the
survey year. Out of the rice growers, 3245 households produced Boro, 2699 households
produced Aman and 784 households produced Aus rice. (ii) Time series data: For estimating
relationship historical data such as production, target and actual procurement, opening stock,
closing stock, procurement price, market price etc were collected from the secondary sources
such as Yearbook of Agricultural Statistics in Bangladesh, Statistical Yearbook of Bangladesh,
different issues of Food Planning and Monitoring Unit database and finally (c) Primary data:
Primary data for three group of respondents consisting about 800 samples were collected.. The
survey covers the Boro procurement season of 2012. The surveys are done with (i) the farmers
those who did not sell paddy to Local Storage Depot (LSD) (non-participant farmers), (ii) people
8
who sold paddy to LSD (participant farmers) and (iii) people who sold milled rice (millers) to
LSD. The probability proportion to size is used to identify the sample size from three different
categories. A total of 305 non-participant farmers, 181 participating farmers and 296 millers are
surveyed. The surveys are done in the districts of Mymensingh, Tangail, Dinajpur and Naogaon,
where production of rice is high and the government procures a large share of its total
procurement.
4. Stock Calculation
This section discusses how stock is derived from the Household Income and Expenditure Survey
(2010) dataset.
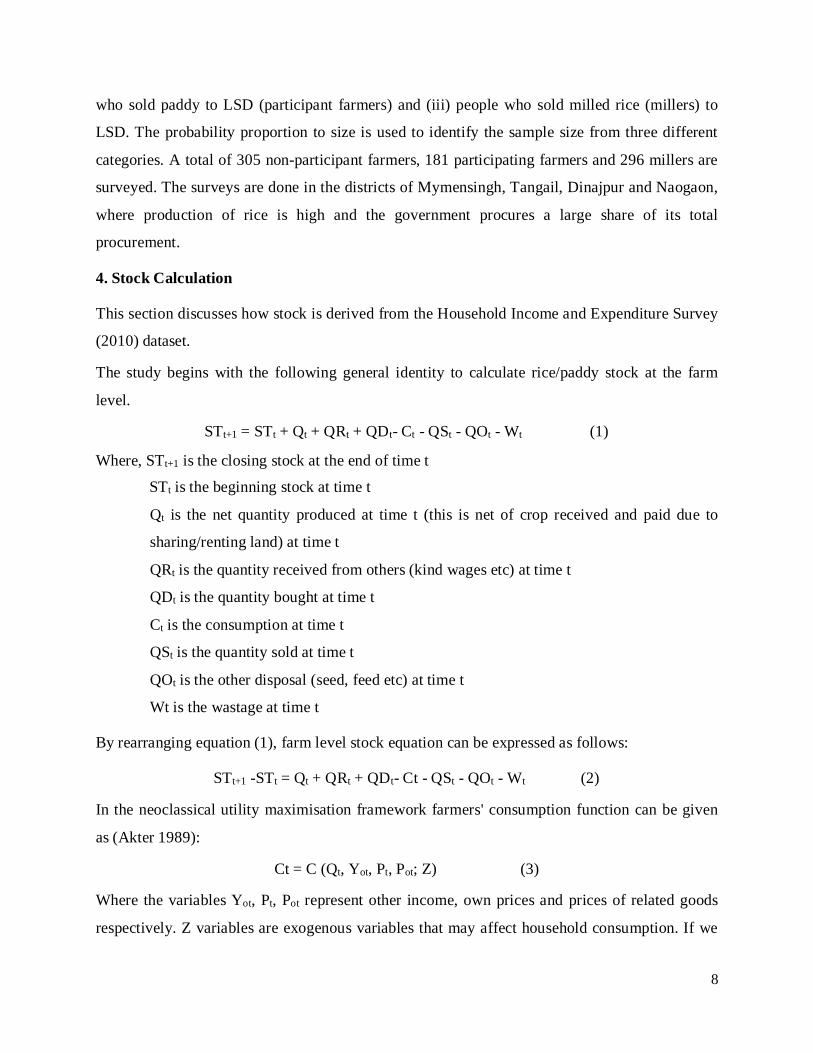
The study begins with the following general identity to calculate rice/paddy stock at the farm
level.
STt+1 = STt + Qt + QRt + QDt- Ct - QSt - QOt - Wt (1)
Where, STt+1 is the closing stock at the end of time t
STt is the beginning stock at time t
Qt is the net quantity produced at time t (this is net of crop received and paid due to
sharing/renting land) at time t
QRt is the quantity received from others (kind wages etc) at time t
QDt is the quantity bought at time t
Ct is the consumption at time t
QSt is the quantity sold at time t
QOt is the other disposal (seed, feed etc) at time t
Wt is the wastage at time t
By rearranging equation (1), farm level stock equation can be expressed as follows:
STt+1 -STt = Qt + QRt + QDt- Ct - QSt - QOt - Wt (2)
In the neoclassical utility maximisation framework farmers' consumption function can be given
as (Akter 1989):
Ct = C (Qt, Yot, Pt, Pot; Z) (3)
Where the variables Yot, Pt, Pot represent other income, own prices and prices of related goods
respectively. Z variables are exogenous variables that may affect household consumption. If we

9
further assume that opening and closing stocks are equal then marketable surplus (net production
minus net disposal) would be the negative of consumption function (3). However seasonal stock
changes should be realistically non-zero as size of production and length of crop seasons are
different. In that case stock function would be a net function of production, marketing and
disposals as follows.
STt+1-STt = ST (Qt, Yot, Pt, Pot; Z) (4)
Here the Z variable includes exogenous disposals as well as household level fixed factors. Thus the nature and extent of household level food grain stocks may be dependent on a range of
factors related to production, consumption, marketing, and other household level and market
level factors (Chowdhury, 1993). The expected signs of the consumption and marketing
functions can easily be derived from the neoclassical consumer theory (Akter 1989). However
the expected signs of the variables in equation (4) will depend on the relative size of the effects
of the variables in consumption and marketing relations. This is because stocks function is the
net of both consumption function and its negative counterpart marketing function. So it is
difficult to predict the a priori sign and size of the relations of the factors, which influence stock
holding behaviour.
HIES 2010 data recorded stocks as follows:
STt = Qt - Ct - QOt - Q (wastage)t - QSt (5)
Where ST is stock; t (2-5) represents season (1=Boro season, 2=Aman season and 3=Aus
season); Q is production, which is used for consumption (C), other disposals (QO) such as given
to landlord, paid for wages, used as seed and livestock feed and any other kind uses; Q (wastage)
represent wastage in the season; and finally QS is the quantity sold.
5. Econometric Models
5.1 Stock Function
The seasonal stock function is as follows:
εβα ++= itiit XS (6)
Where, S= stock (dependent variable) (i represents farming household & t represents seasons).
The explanatory variables Xi are -
X1=Size of production
10
X2=Other sources of acquisition (e. g. payments in kind and payment received) X3=Selling price X4=Consumer price, X5=CV in selling price X6=Main occupation of household X7=Expenditure quartile X8=Size of household X9=Location of household X10=Usable room spacing X11=Household faced shock in last 12 months X12=Household has mobile phone X13=Household has internet X14=Access to credit X15=Farm size X16=Livestock assets X17=Tenurial status X18=Household belonging to surplus or deficit region.
5.2 Econometric Models for Estimating Relationships
The study investigates the relationship between (i) the production deviations from trend (as a
proxy for good and bad harvest) and government procurement to examine the extent to which
government procurement increases when harvests are good and thus supports farm prices when
they most need support, (ii) production deviations from trend and government distribution
through market operations, to examine the extent to which government distribution increased
when harvest were poor and thus contribute to stabilise retail price, (iii) procurement and
planned distribution, (iv) actual procurement and government stock (v) procurement prices with
the prevailing market prices. (vi) government stock and price (market price and procurement
price) levels.
In order to estimate the deviations the study estimated different trend functions such as linear,
polynomial of different order for example 2nd order, 3rd order. Then in fact the trend model is
selected based on `best fit` to the data. Trend deviation is obtained by using subtraction.
Deviations are calculated from the differences between the observed and the estimated values.
The functions are as follows;

11
Linear function: ttY εββ ++= 10
Exponential function btaeY = Quadratic function:
tttY εβββ +++= 2210
Third order polynomial function: ttttY εββββ +++++= 3
32
210
Where, Y is the production (price in the other cases) over time, T is the deterministic time trend,
n is the order of the polynomial and ε is the error term. The order in the polynomial function
were determined based on Akaike information criterion (AIC).
Later, a regression model was estimated as follows:
titit XY εββ ++= 0 (7)
Where Y indicates the actual procurement
itX are explanatory variables such as
tX 1 = Opening government stock at the start of the season
tX 2 =Planned distribution of current season
tX 3 = Deviation of production from trend
tX 4 =Deviation of real (inflation adjusted) market price from average price of past n
years (n= 1, 2 or 3) etc. over time.
In estimating the equation, we consider the properties of time series data. In order to estimate the
relationship between procurement and market price, the regression model presents in equation
(8) is estimated. This was estimated to investigate if procurement price had an impact on market
price.
tptimt PP εββ ++= 0 (8)
Where Pm=market price, and Pp=procurement price.
In order to estimate the relationship between government stock and market price, a regression
model presented in equation (9) was estimated. It was done to determine if government stock has
an impact on market price.
ttimt SP εββ ++= 0 (9)
Where S=government stock.

12
6. Results and Discussions
6.1 Stock Function: Regression Analysis
Assumptions, Variables and Empirical Model
For empirical estimation, the study follows pragmatic approach as follows:
STit = f (Xit) + ut
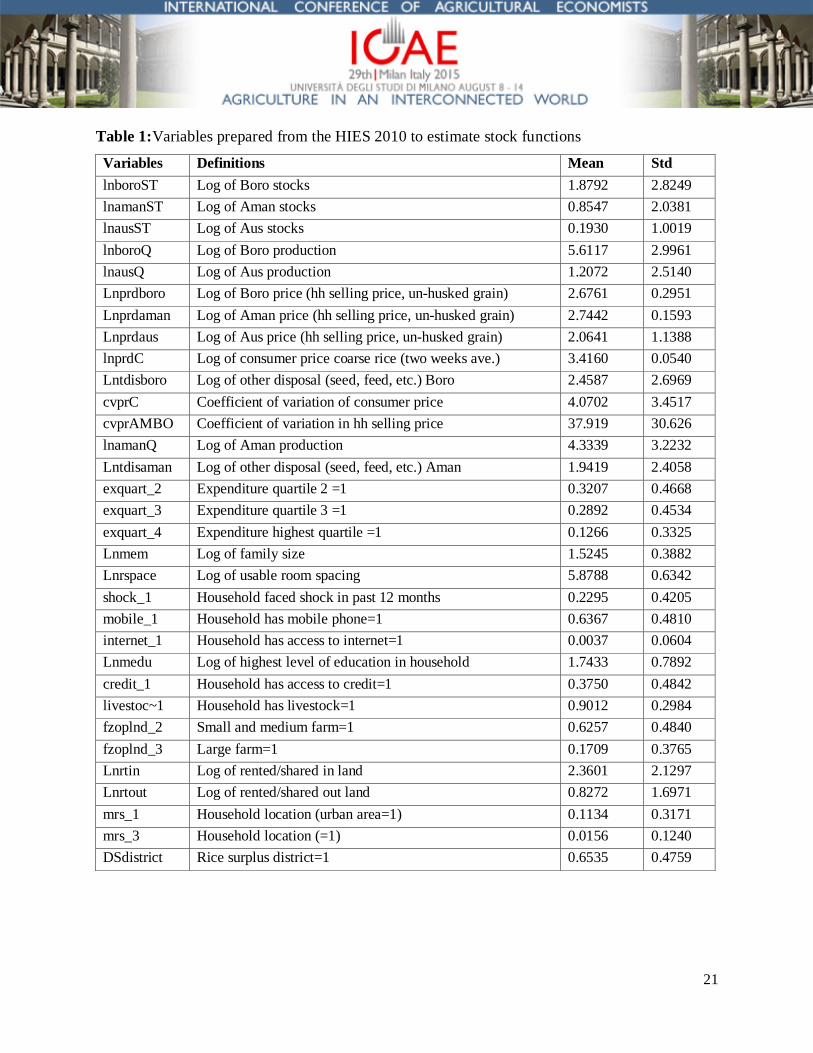
ST and X variables are summarized here in Table 1. The first three variables are dependent
variables in stock regressions in Boro, Aman and Aus rice respectively. They were measured in
kg per household and then converted into log. All variables other than dummy variables are
expressed in log. Log transformation makes interpretation easy and also reduces the
heteroscedasticity problem.
Insert Table 1 here
Independent variables are output measured in kg of respective rice crop (Boro, Aman and, Aus)
per household. Stocking decisions for the year are being made based on how much is actually
produced in a given crop season. Thus the expected sign is positive; more production would
imply a larger amount of stock.
Rice market is reasonably competitive (large number of farmers) to assume that farmers are price
takers. According to standard demand theories, consumption depends on prices, limited income
and a set of other related limiting factors. As we are analysing cross-section data of a particular
season and year, variation in prices received by individual households would reflect other effects
than usual price response. Other things may include quality, quantity, spatial and temporal
variations etc. So we have used the district level average of selling price of Boro, Aman and Aus
rice to represent market price of rice in these three seasons. The district level prices should not be
related to quality factors but may pick up spatial variation. So we introduced some regional
dummy variables to control for spatial variation. Higher price would reduce consumer demand
and farming household as consumer would reduce consumption but as producer would increase
marketing. Price effect on stock would be the net effect. The price effect would be positive,
negative or insignificant depending on the relative magnitude of home demand and market
supply effects. As the food grains are price inelastic we would expect marketing effect of price
difference would be higher. So positive elasticity may indicate expectation about future price

13
changes. If current prices are higher, farming households may stock for future marketing with
expectation of further increase in price. The motive may be a speculative one.
We consider the three rice crops are substitutes, so higher price of one would induce farmers to
consume more of the other. However they are not available at the same time of the year, though
there are overlaps in harvesting time. Higher Aman price means more Aman quantity sold and so
with lower stock of Aman, more Boro/Aus quantity will be consumed and so Boro/Aus stock
will reduce. In this situation we would expect a negative price elasticity of Boro/Aus stock with
respect to Aman price. Higher price effect on consumption may increase the amount of Aman
stock and this may also have negative effect on Boro/Aus stock. On the other hand, higher Aman
price relative to Boro/Aus means more Boro/Aus quantity consumption rises and so Boro/Aus
stock would reduce. In this situation we would expect a negative price elasticity of Boro/Aus
stock with respect to Aman price.
Producer selling price may not reflect competitive market price as some farmers may make
distress sales. Moreover, quality differences cannot be separated due to lack of such data in the
HIES 2010 data set. So we include consumer price of coarse rice in the covariate list. This price
would be further free from quality effect as it is the price of coarse rice, though there is a
difficulty in the data that the information was collected in two representative weeks and so will
not pick up the effect for all three seasons (Boro, Aman and Aus).
Other limiting factors are expenditure quartiles (instead of income/expenditure as continuous
variable), household population, probability of shocks, access to information, credit, other assets,
farm size, rental market etc. All these constraints add complexity on the straight forward
interpretation of the effects.
Estimated Stock Functions
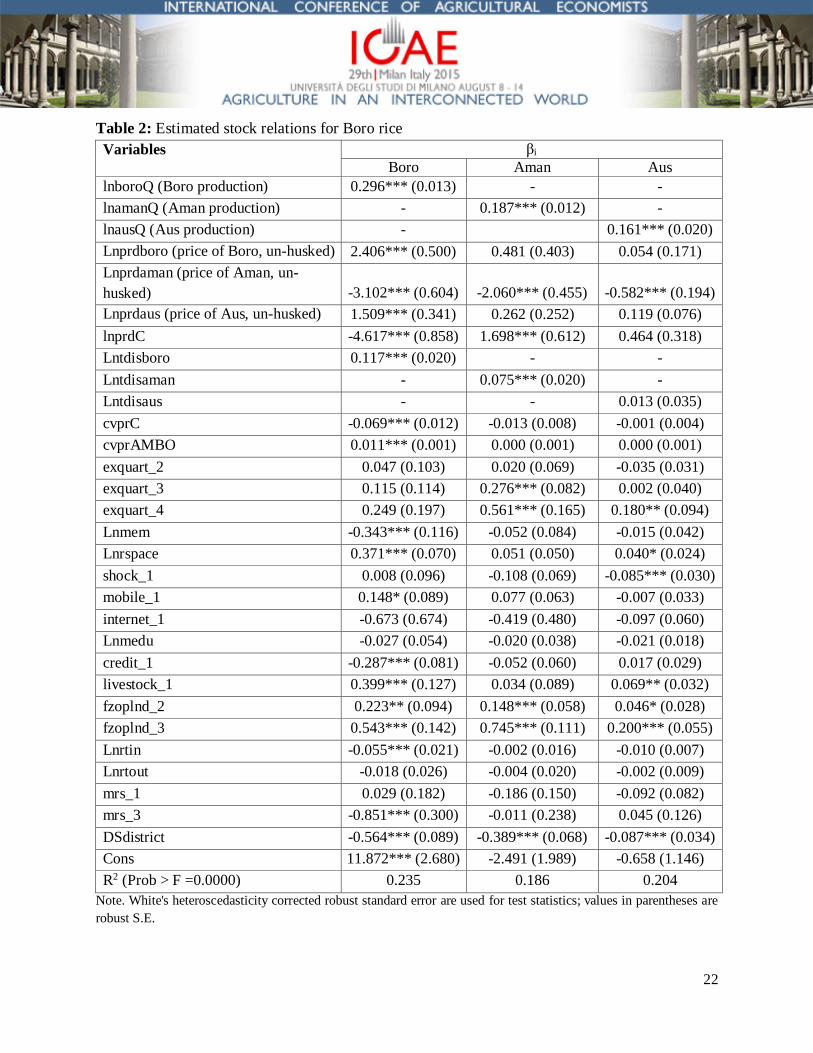
Table 2 depicts stock behaviour of Boro rice. In order to estimate the effects of the covariates,
we first considered the statistical properties of the models. Included variables significantly
explained the stock variation. Heteroscedasticity was detected by the Breusch-Pagan/ Cook-
Weisberg test; Null hypothesis that Ho: Constant variance was rejected at 1% level (Chi2=626.4).
So we present White's heteroscedasticity corrected robust standard errors. Out of 26 independent
variables included in the model, 16 variables are significant at 1% level; two other variables are
significant at 5% and 10% levels.

14
The effect of production on stock is positive as expected. A 10% rise in Boro production causes
about 3% increase in stock. All stock price elasticities are significant and elastic. Price appears a
significant signal for influencing stockholding behaviour of farming households. Positively
elastic price elasticity of stock may indicate partly demand effect of price rise and partly future
expectation of price rise on stockholding behaviour. It is necessary to include a variable
representing future expected price to pick up the effect. One possible variable may be length of
season, which may vary between farms (Akter, 1989). Some farmers produce two rice crops,
others grow all three rice crops. Some farmers may have access to early varieties and other
resources. We also miss the information on beginning stock to identify net stocks for the next
season. These variables may be relate to price causing some bias. We recognise this omitted
variable problem as we do not have any proxy for these variables.
Insert Table 2 here
Other significant variables are household population size, kind disposal like seed, feed etc, price
variability, household has borrowings, farm size, land rental, and spatial dummies. The sign and
size of most of them seem plausible. For example, a 10% rise in family population decreases the
amount of stock by 3.4%. Consumption increases with increase in population and so stock
decreases. The effect of credit is negative and may indicate distress sales due to credit. The
higher the farm size the greater is the amount of stock. Stocks are lower in the deficit districts.
Table 3 presents the stock relations for the Aman season. On the statistical properties, included
variables significantly explained the stock variation. Heteroscedasticity was detected by the
Breusch-Pagan/ Cook-Weisberg test; Null hypothesis that Ho: Constant variance was rejected at
1% level (Chi2=1695.4). So we present White's heteroscedasticity corrected robust standard
errors. Out of 26 independent variables included in the model, 9 variables are significant at 1%
level; other variables are not statistically significant at 5% or 10%.
There are differences between Boro and Aman with respect to effect of prices. Boro stocks vary
positively with respect to own price, whilst Aman stocks vary negatively with respect to own
price. Boro stocks vary negatively with respect to consumer price of coarse rice, whilst Aman
stocks vary positively with respect to consumer price of coarse rice. This is difficult to explain
this opposite relationship with the given data. Also, as we mention earlier, price in cross section
data may not reflect true price effect but price varies due to other factors like quality. Quality

15
effect is not possible to control with the given data. Further analysis with other data is necessary
to confirm the relationship. Consumer price for coarse rice controls for quality and still we see
opposite relationship in Boro and Aman seasons. This needs some clarifications and justification.
This may be due to the variation of farming households' expectation about the price changes
beyond the season. Also we are unable to control for the exact timing of marketing the crop
within a season. There may be variation in the proportionate distress sales between seasons.
Other significant variables are expenditure quartiles, farm size, kind disposals such as seed, feed
etc, and spatial dummies. The sign and size of most of them appear plausible. For example,
farmers in the upper expenditure quartiles have higher stocks. Richer farmers stock more, may be
to avail the opportunity to generate profit from better timing of sales.
Aus season results of stock behaviour are presented in Table 3. Included variables significantly
explained the stock variation. Here also heteroscedasticity was detected by the Breusch-Pagan/
Cook-Weisberg test. So we present White's heteroscedasticity corrected robust standard errors.
Here 5 variables are significant at 1% level, 2 variables are significant at 5% level and 2
variables are significant at 10% level.
The relation of stock with production is consistent in all three seasons. For a 10% increase in
production, Aus stock rises by 1.6%. In the case of Aman, the increase was slightly higher than
Aus and in the case of Boro the rate of change is even little higher. Own price elasticity of stock
is not significant in this case. Other significant variables are top expenditure quarter, free room
space available in the house, shock, farm size and location. The sign and size of these variables
appear consistent.
Thus, stocks depend on the amount of harvest consistently in all seasons. Prices have mixed
effects, further investigation is necessary to confirm the result. There are many constraints that
farmers consider in keeping stocks other than production and prices. So policy makers must
think about measures to ease farm level possible constraints/ a range of factors in order to help
farmers to make competitive decisions regarding stocks.
We reiterate that if farmers store grains when their price is low and sell when their price is high,
then price fluctuations will be reduced (Newbery and Stiglitz, 1981). In this case it is less
necessary for the government to operate a buffer stock scheme to stabilise price, which may not
guarantee income stabilisation and therefore food security. From this analysis, we see that

16
farmers' stocks are responsive to production and prices but their behaviour is constrained by a
number of factors like access to credit in some seasons. As far as stabilisation of income is
concerned it may be more important to direct the policy towards reducing farm level constraints.
In this study we are unable to identify the effect of storage on price stability and therefore
farmers' income due to lack of data on timing of sales. A complete study requires time series data
on prices and marketing along with timing of sales and purchases. We consider this a fertile
ground for future research.
6.2 Results of Estimated Relationships
Procurement model: In both cases of Boro and Aman rice government stock contributed
negatively to actual procurement. However, in both Boro and Aman rice, the results are not
statistically significant, but the coefficient implies that when government stored substantial
amount of grain then actual procurement decreased due to insufficient godown capacity.
Public Food Distribution System (PFDS) is an instrument for ensuring availability of cereal food
at easily affordable prices especially for the people who lives below the poverty line. The
Government procures and stocks food grain which is then released every month for distribution
through the PFDS network. Therefore, if government planned to distribute large amount of food
grain then DOF will have to procure large amount of paddy/rice. However, the relationship
estimation results show that planned distribution has positive relationship with procurement in
both the Boro and Aman rice cases, but the result is statistically significant only in Boro case, as
Aman procurement has a very small portion in total procurement.
To examine the extent to which government procurement increases when harvests are good and
thus supports farm prices when they most need support, we have estimated the relationship
between production deviations from trend (as a proxy for good and bad harvest) and government
procurement. The sign is positive in Boro price which means that when harvest was good actual
Boro procurement was increased. However, the result is not statistically significant so we cannot
make firm conclusion. But in the case of Aman, the sign is negative and statistically significant.
Though it was not expected, it is not surprising. Total procurement in Aman season was very
low. Zaman (2003), found that during 1977-2000, except for four to five years period, the
support price of Aman rice was lower than the prevailing market price in all the years studied.
Moreover as one the objectives of government procurement is to ensure food security for all

17
households as well as providing incentives to farmers, hence, government emphasises on Boro
production for achieving self-sufficiency in food grain. Therefore, if harvest was even good in
Aman season, then decreased actual procurement of Aman is not a shocking result.
The deviation of market price from last 32 years average market price is also taken as
explanatory variable. The sign of coefficient is negative in both the Boro and Aman seasons
which means that if market price is less than the average past 32 years price then actual
procurement increases and if market price is bigger than the average past 32 years price then
actual procurement decreases. However, the result is statistically significant in Aman rice only.
As one of the objectives of procurement program is to stabilise the domestic market price by
preventing the downward trend of post-harvest food grain price, therefore, the harvest time
market price suppose to be lower than the procurement price. In the relationship result it is
observed that market price has negative relationship with actual procurement in both the Boro
and Aman seasons. If market prices increases then actual procurement decreases.
Insert Table 3 here
Procurement price model: In the case of Boro season, relationship between market price and
procurement price is positive and statistically significant at 6% level. It is expected that if
procurement price increases then market price will also increase. In Aman season, similar to the
Boro, the sign is positive, but not statistically significant. However, one can point out the
limitation of the estimated model due to possible reverse causality. The data limitation did not
allow the authors to test the reverse causality.
Government stock model: In both Boro and Aman cases the relationships between market price
and government stock show negative relationship. In both Boro and Aman rice cases the results
are statistically significant at 1% level, which indicates if government stock increases then
market price decreases. This is possible because if government stock`s capacity is reach its peak,
the procurement decreases which in turn decreases market prices.
Government stock and procurement price model: However, in both Boro and Aman cases the
relationship between procurement price and government stock shows negative relationship. From
this result it is not possible to draw firm conclusion as the results are not statistically significant.
18
Results from Field Survey
To fulfill the objective of public rice procurement program as to what extent the current
procurement program farmers’ income, required calculations have been made and presented in
Table 4. The result shows that farm income and annual household income of the participant
farmers increased by 7.16% and 5.57%, respectively due to participation in the program.
When we have looked at the income changes by farm sizes, we find that farm income increased
by 8.54% and 5.85%, respectively for marginal/small and medium/ large farmers. In terms of the
% of the total farm income, marginal/small farmers earned more than the medium/large farmers
but in absolute terms, changes in income of medium/large farmers are higher than marginal/small
farmers. The corresponding increments of income were 6.74 and 4.45% in annual household
income. This indicates that, by participation in the public rice procurement program, the
marginal/small farmers benefitted more than medium/large farmers.
Insert Table 4 here
7. Conclusions
The effect of production on stock is positive as expected. Price appears a significant signal for
influencing stockholding behaviour of farming households. Positively elastic price elasticity of
stock may indicate partly demand effect of price rise and partly future expectation of price rise
on stockholding behaviour. In both Boro and Aman seasons, relationship between market price
and procurement price is positive and the results are statistically significant. Farm income as well
as annual household income of the participant farmers increased by 4.03 and 3.03%, respectively
as they sold their certain amount of paddy to procurement centers. So, the study concludes that
the procurement program supports farmers indirectly through market mechanism as market price
and procurement price are positively associated. Purchases by the government at support market
prices along with demand from other agents push market prices up to benefit the poor farmers
who usually make distress sales at harvest. This is further supported by our findings that the
quantity procured is inversely related to market prices, which implies that when the market price
is low government procures more and pushes prices up. In this way, not only the participating
farmers but also all farmers get benefit.

19
References
Akter, S., 1989. A Quantitative Analysis of Marketable Surplus of Paddy and Food Policy in Bangladesh. A PhD thesis, Wye College, The University of London.
Akter, S., 1990. Buffer stock schemes to support producers income in Bangladesh. Bangladesh Journal of Agricultural Economics, 12 (2):1-23.
Ali, S. A. M. M. 2010. Strengthening the Government`s Instructional Capacity for Improving food security. Final Consultancy report to ADB and the Ministry of Food and Disaster Management.
Asaduzzaman, M., Shahabuddin, Q., Deb, U. K., and S. Jones, 2009. Input Prices, Subsidies and Farmers' Incentives. BIDS Policy Brief Presented at the National Conference on Market Volatility, Vulnerability and Food Security: Strategic Issues and Policy Options on 9 April, 2009, Dhaka, Bangladesh.
Bangladesh Bureau of Statistics (BBS), 2010. Ministry of Planning, Government of the People’s Republic Bangladesh, Dhaka, Bangladesh.
Chowdhury, N., 1994. Causalities and cost effectiveness of public rice procurement in Bangladesh. Bangladesh Food Policy Project, IFPRI, Washington DC.
Dorosh, P. A and Shahabuddin, Q. 2002. Rice Price Stabilization in Bangladesh: An Analysis of Policy Options. Markets and Structural Studies Division, Discussion Paper No. 46. IFPRI. Washington DC.
Dorosh, P. A. 2009. Price stabilization, international trade and national cereal stocks: world price shocks and policy response in South Asia. Food Security. 1:137–149.
Dorosh, P. A. and Farid, N. 2003. Implications of Quality Deterioration for Public Food grain Stock Management and Consumers in Bangladesh. Markets and Structural Studies Division, Discussion Paper No. 55. IFPRI. Washington DC.
Dorosh, P. A. and Shahabuddin, Q. 1999. Price Stabilization and Public Food Grain Distribution in Bangladesh: Policy Options to Enhance National Food Security. FMRSP Working Paper No. 12. IFPRI. Washington DC.
Dorosh, P., Shahabuddin, Q. and Farid, N. 2001. Price Stabilization and the Cost of Food Stock. Synthesis Report No. 1, IFPRI. Washington DC.
HIES, 2010. Preliminary Report on Household Income and Expenditure Survey, Bangladesh Bureau of Statistics, Ministry of Planning, the Government of the People’s Republic, Bangladesh.
20
Islam, R. 1982. Foodgrain procurement, input subsidy and the public food distribution system in Bangladesh: an analysis of the policy package. The Bangladesh Development Studies, 8 (1 & 2): 89-120.
Khan, M. M. & Jamal, A.M.M., 1997. Market based price support program: An alternative approach to large scale food procurement and distribution system. Food Policy, 22(6):475-486.
National Food Policy, 2006. Ministry of Food and Disaster Management, People’s Republic of the Government of Bangladesh, Dhaka, Bangladesh.
National Food Policy Plan of Action, 2008-2015. Ministry of Food and Disaster Management, People’s Republic of the Government of Bangladesh, Dhaka, Bangladesh.
Newbery, D.M.G and Stiglitz, J.E., 1981. The Theory of Commodity Price Stabilization: A Study in the Economics of Risk, OUP, Oxford.
Osmani, S.R. and Quasem, M.A., 1990. Pricing and Subsidy Policies for Bangladesh Agriculture. BIDS Research Monograph No. 11, Dhaka, Bangladesh.
Quasem, M. A., 1979. Marketing of Aman paddy with special reference to the government procurement programme in two selected areas of Bangladesh. Bangladesh Journal of Agricultural Economics,2 (1): 51-74.
Reza, M. S., 2001. An Evaluation of Government Boro Rice Procurement in Selected Areas of Bogra and Naogaon Districts. Unpublished MS thesis submitted to the Department of Agribusiness and Marketing, Bangladesh Agricultural University, Bangladesh.
Sabur, S. A., Jahan, H. and Reza, M. S., 2003. An evaluation of government rice procurement programme in selected areas of Bangladesh. Bangladesh Journal of Agricultural Economics, 26 (1 & 2):111-126.
Shahabuddin, Q., 1991. A Disaggregated Model for Stabilization of Rice Prices in Bangladesh. Working paper no. 3, Food Policy in Bangladesh, IFPRI, Washington DC.
Shahabuddin, Q. and Islam, K. M. N., 1999. Domestic Rice Procurement Programme in Bangladesh-An Evaluation. Food Management and Research Support Project. Dhaka, Bangladesh.
Shahabuddin, Q., Asaduzzaman, M., Clay, E. and Jones, S., 2009. Price Support, Domestic Procurement Programme and Public Stock Management. BIDS Policy Brief, Dhaka, Bangladesh.
21
Table 1:Variables prepared from the HIES 2010 to estimate stock functions
Variables Definitions Mean Std lnboroST Log of Boro stocks 1.8792 2.8249 lnamanST Log of Aman stocks 0.8547 2.0381 lnausST Log of Aus stocks 0.1930 1.0019 lnboroQ Log of Boro production 5.6117 2.9961 lnausQ Log of Aus production 1.2072 2.5140 Lnprdboro Log of Boro price (hh selling price, un-husked grain) 2.6761 0.2951 Lnprdaman Log of Aman price (hh selling price, un-husked grain) 2.7442 0.1593 Lnprdaus Log of Aus price (hh selling price, un-husked grain) 2.0641 1.1388 lnprdC Log of consumer price coarse rice (two weeks ave.) 3.4160 0.0540 Lntdisboro Log of other disposal (seed, feed, etc.) Boro 2.4587 2.6969 cvprC Coefficient of variation of consumer price 4.0702 3.4517 cvprAMBO Coefficient of variation in hh selling price 37.919 30.626 lnamanQ Log of Aman production 4.3339 3.2232 Lntdisaman Log of other disposal (seed, feed, etc.) Aman 1.9419 2.4058 exquart_2 Expenditure quartile 2 =1 0.3207 0.4668 exquart_3 Expenditure quartile 3 =1 0.2892 0.4534 exquart_4 Expenditure highest quartile =1 0.1266 0.3325 Lnmem Log of family size 1.5245 0.3882 Lnrspace Log of usable room spacing 5.8788 0.6342 shock_1 Household faced shock in past 12 months 0.2295 0.4205 mobile_1 Household has mobile phone=1 0.6367 0.4810 internet_1 Household has access to internet=1 0.0037 0.0604 Lnmedu Log of highest level of education in household 1.7433 0.7892 credit_1 Household has access to credit=1 0.3750 0.4842 livestoc~1 Household has livestock=1 0.9012 0.2984 fzoplnd_2 Small and medium farm=1 0.6257 0.4840 fzoplnd_3 Large farm=1 0.1709 0.3765 Lnrtin Log of rented/shared in land 2.3601 2.1297 Lnrtout Log of rented/shared out land 0.8272 1.6971 mrs_1 Household location (urban area=1) 0.1134 0.3171 mrs_3 Household location (=1) 0.0156 0.1240 DSdistrict Rice surplus district=1 0.6535 0.4759
22
Table 2: Estimated stock relations for Boro rice Variables βi
Boro Aman Aus lnboroQ (Boro production) 0.296*** (0.013) - - lnamanQ (Aman production) - 0.187*** (0.012) - lnausQ (Aus production) -
0.161*** (0.020)
Lnprdboro (price of Boro, un-husked) 2.406*** (0.500) 0.481 (0.403) 0.054 (0.171) Lnprdaman (price of Aman, un-husked) -3.102*** (0.604) -2.060*** (0.455) -0.582*** (0.194) Lnprdaus (price of Aus, un-husked) 1.509*** (0.341) 0.262 (0.252) 0.119 (0.076) lnprdC -4.617*** (0.858) 1.698*** (0.612) 0.464 (0.318) Lntdisboro 0.117*** (0.020) - - Lntdisaman - 0.075*** (0.020) - Lntdisaus - - 0.013 (0.035) cvprC -0.069*** (0.012) -0.013 (0.008) -0.001 (0.004) cvprAMBO 0.011*** (0.001) 0.000 (0.001) 0.000 (0.001) exquart_2 0.047 (0.103) 0.020 (0.069) -0.035 (0.031) exquart_3 0.115 (0.114) 0.276*** (0.082) 0.002 (0.040) exquart_4 0.249 (0.197) 0.561*** (0.165) 0.180** (0.094) Lnmem -0.343*** (0.116) -0.052 (0.084) -0.015 (0.042) Lnrspace 0.371*** (0.070) 0.051 (0.050) 0.040* (0.024) shock_1 0.008 (0.096) -0.108 (0.069) -0.085*** (0.030) mobile_1 0.148* (0.089) 0.077 (0.063) -0.007 (0.033) internet_1 -0.673 (0.674) -0.419 (0.480) -0.097 (0.060) Lnmedu -0.027 (0.054) -0.020 (0.038) -0.021 (0.018) credit_1 -0.287*** (0.081) -0.052 (0.060) 0.017 (0.029) livestock_1 0.399*** (0.127) 0.034 (0.089) 0.069** (0.032) fzoplnd_2 0.223** (0.094) 0.148*** (0.058) 0.046* (0.028) fzoplnd_3 0.543*** (0.142) 0.745*** (0.111) 0.200*** (0.055) Lnrtin -0.055*** (0.021) -0.002 (0.016) -0.010 (0.007) Lnrtout -0.018 (0.026) -0.004 (0.020) -0.002 (0.009) mrs_1 0.029 (0.182) -0.186 (0.150) -0.092 (0.082) mrs_3 -0.851*** (0.300) -0.011 (0.238) 0.045 (0.126) DSdistrict -0.564*** (0.089) -0.389*** (0.068) -0.087*** (0.034) Cons 11.872*** (2.680) -2.491 (1.989) -0.658 (1.146) R2 (Prob > F =0.0000) 0.235 0.186 0.204
Note. White's heteroscedasticity corrected robust standard error are used for test statistics; values in parentheses are robust S.E.

23
Table 3: Results of the regression models
Equations (Dep. variable= actual proc. in 000'mt) Coefficient T value P>|t| Boro Constant 482.27 1.37 0.182 Government stock -0.038 -1.42 0.168 Planned distribution 0.930*** 5.14 0.000 Deviation of production from trend 142.27 1.21 0.236 Deviation of real market price from average price -232.16 -1.41 0.170 Market price -0.239 -0.94 0.356 Aman Constant 393.70** 2.15 0.041 Government stock -0.012 -1.00 0.326 Planned distribution 0.145 0.56 0.582 Deviation of production from trend -150.35*** -3.53 0.002 Deviation of real market price from average price -151.47** -2.07 0.048 Market price -0.165 -0.81 0.424 Equations (Dep. variable= market price) Boro Rice Constant 473.24*** 2.77 0.010 Procurement price 0.378* 1.89 0.068 Aman Rice Constant 427.31** 2.65 0.013 Procurement price 0.295 1.47 0.153 Equations (Dependent variable= market price) Boro Constant 912.95*** 17.56 0.000 Government stock -0.075*** -3.96 0.000 Aman Constant 733.54*** 21.54 0.000 Government stock -0.043*** -3.51 0.001 Equations (Dep. variable= procurement price) Boro Rice Constant 848.28*** 15.53 0.000 Government stock -0.017 -0.84 0.41 Aman Rice Constant 818.19*** 23.98 0.000 Government stock -0.019 -1.53 0.137

24
Table 4: Extent of support on farmers’ income
Particulars Farm types
Marginal/ small
Medium/ large All t P>|t|
a. Paddy sold to procurement center (PC) (quintal/farm) 16.76 28.21 22.65 4.141*** 0.000
b. Value of paddy sold to PC in procurement price (Tk/farm) [ax Tk 1800/quintal] 30171 50783 40762 4.141*** 0.000
c. Value of paddy sold to PC in market price (Tk/farm) [ax Tk 1434/quintal]
24037 40457 32474 4.141*** 0.000
d. Cost of selling paddy to PC (Tk/quintal) 59.89 64.50 62.26 0.782 0.435 e. Cost of selling paddy to nearby market (Tk/quintal)
84.43 69.86 76.58 2.446** 0.016
f. Total cost of selling paddy to PC (Tk/farm) [a x d] 1133 1950 1552 2.635*** 0.009
g. Total cost of selling paddy to nearby market (Tk/farm) [a x e] 1112 1546 1335 1.888* 0.061
h. Net margin of selling paddy to PC (Tk/farm) [b- f] 29039 48834 39210 4.186*** 0.000
i. Net margin of selling paddy to nearby market (Tk/farm) [c-g] 22924 38912 31139 4.151*** 0.000
j. Incremental margin of selling paddy to PC (Tk/farm) [h-i]
6115 9922 8071 4.128*** 0.000
k. Farm income (Tk/farm/year) 105337 290486 200469 7.366*** 0.000 l. Average annual household income (Tk/farm/year)
168978 359303 266770 4.387*** 0.000
m. Share of incremental margin of selling paddy to PC in farm income (% of k) 8.54 5.85 7.16 2.198** 0.029
n. Share of incremental margin of selling paddy to PC in annual household income (% of l)
6.74 4.45 5.57 2.601*** 0.010
o. Incremental margin of selling paddy to PC (Tk/quintal) [j/a] 368.47 358.59 363.40 1.044 0.298
Acknowledgement: iThe research was financed under the Research Grants Scheme of the National Food Policy Capacity Strengthening Programme (NFPCSP). The NFPCSP is being implemented by the FAO of the United Nations and the Food Planning and Monitoring Unit, Ministry of Food with the financial support of EU and USAID. Disclaimer: The findings and presentation of material in this paper are those of the author(s). They do not necessarily reflect the views of FAO, nor do they imply the expression of any opinion whatsoever on the part of FAO or of the NFPCSP, Government of Bangladesh, EU or USAID.