Embed Size (px)
Citation preview

Effectiveness of Knowledge Management A process based survey method
Jurgen Fleischer and Andreas Stepping University of Karlsruhe, Institut of Production Science, Kaiser strasse 12, D-76131 Karlsruhe, Germany. Email: juergen.fleischer@wbk uka. de
Abstract: Every company uses knowledge management tools - but only some of them are able to determine their effectiveness. This approach based on a survey method was developed in order to fill this information gap. By means of a three way survey, managers and non-managerial personnel were interviewed about the actual employment of knowledge management methods and tools. This information was assessed and in a further step aggregated into one radar diagram per company. Carried out in several companies, it allows the detection of best-practice knowledge management tools among them.
Key words: Knowledge management. Benchmarking, survey
1. INTRODUCTION
In recent years, companies have increasingly realised the importance of their employees' knowledge and its impact on the competitiveness. Especially in industrialised countries, knowledge increasingly defines a company's potential to act and react sufficiently flexible.
But the question is how companies measure whether their way to deal with knowledge is an effective one? Only few companies are able to determine the effectiveness of employed knowledge management (KM) methods - even less in small and medium sized enterprises (SME).
In a research project funded by Stiftung Industrieforschung, Germany, the Institute of Production Science (wbk), Karlsruhe, Germany, developed a

188 Mr gen Fleischer and Andreas Stepping
tool to benchmark a company's knowledge management along the core process chain.
2. AIM
The aim was to build up a tool to analyse a company's knowledge management with an effort of only one single day. In order to realise surveys in such a short time, an appropriate structure for both the questions and the answers had to be designed. Therefore, a system of questionnaires linked to a database was developed. The relational database stores the questions as well as the answers and the assessments for each interviewed person. It makes a semi-automated evaluation of the survey possible.
The questionnaires were developed to be applied in small and medium sized enterprises (SMEs) so that they take into account the SME-specific conditions like the exceptional overview of employees, short ways and direct communication between the personnel.
3. SURVEY
In order to achieve comparable results in all different companies, a survey by interviews was chosen. This type of survey offers the possibility of detailed explanation and short discussion to minimise issues of comprehen-sibility by the interviewed person. The survey uses questionnaires on two different hierarchical levels: on the one hand department managers and on the other hand non-managerial personnel.
3.1 Department Managers' Questionnaire
This hierarchical level is used to get a quick and wide overview of the company's conditions and the instruments and methods of knowledge management it uses. The manager's questionnaire is subdivided into 4 chapters (Figure 1).
After collecting data about the interviewed person in chapter one and about the company's properties in chapter 2, the third chapter's questions try to assess the current employment of knowledge management instruments. Therefore, almost all questions of this chapter are linked to a predefined assessment system in the database, with the effect that answers can be evaluated once the data is entered in the system.
Effectiveness of Knowledge Management 189
The last chapter opens the possibility to collect, compare and aggregate the SMEs' ideas of how knowledge management should work and which scale it should have in SMEs.
Chapter Content Pages [Chapter 1
Chapter 2
Chapter 3
[Chapter 4
Information about interviewed person lil<e age, number of years in company in order to analyse how much experience the interviewed person has in general and in this company. Brief overview of company's turnover, organisation and product type in order to classify the company Overview of the current situation in the company. This is the only assessed chapter in this questionnaire. How should an optimal knowledge management look like?
2
4
13
e]
Figure 1. Chapters of manager's questionnaires (FLEISCHER, STEPPING 2003)
3,2 Questionnaire for Non-managerial Personnel
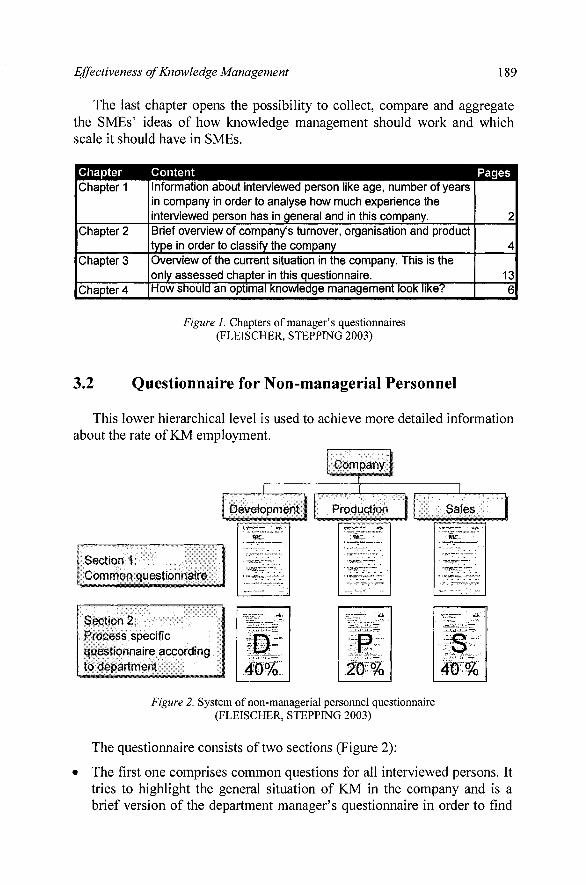
This lower hierarchical level is used to achieve more detailed information about the rate of KM employment.
1
Section 1: Common questionnaire
Section 2: \ Process specific questionnaire according
\ to dBparXm^nX
Company " " ^ f
1 1 1
Deveiopmenl |
•~'irr-"
• Vr3Si~Z:'""'
Production |
•]5^" ""]
Sales 1
Figure 2. System of non-managerial personnel questionnaire (FLEISCHER, STEPPING 2003)
The questionnaire consists of two sections (Figure 2):
The first one comprises common questions for all interviewed persons. It tries to highlight the general situation of KM in the company and is a brief version of the department manager's questionnaire in order to find

190 Mr gen Fleischer and A ndreas Stepping
out inconsistencies between managers and non-managers. All interviewed persons of one company assess e.g. the duration to get access to information in general - independently of their work content.
• The second section contains questions regarding the department the interviewed person is working in. This is only feasible since in SME the employees are not split into many working groups but work more or less as a team. They fulfil some steps of the core process chain, which is split into 24 process steps in the methodology of this project (based on preceding works; SPATH, DILL, SCHARER 2001). These steps are spread over the departments research & development, production and sales. Approximately 40 % of the questions treat the subject area of research & development, 20 % of production and another 40 % of sales. For each process step, most typical in- and output items have been specified. In order to achieve a complete overview, all knowledge components according to Probst like knowledge identification, acquisition, development, distribution, preservation and use are regarded one by one for each process step (PROBST, RAUB, ROMHARDT 1999).
R&D: capacity planning
\Project budgeting relevance:
Does a project budgeting exist?
D Yes
Show us a budget list for your ctrrent project, please.
Needed time:
Up to date: D D
mark: 1 2
Source:
D A D B D C
n No
success: D yes D no
D D D 3 4 5
Media type:
needed:
D 6
D yes
y/h
time
Dno
Figure 3. Three level structure of the process-specific questionnaire (FLEISCHER, STEPPING 2003)
The process-specific questionnaire has a three level structure (Figure 3) and contains process specific subject areas collecting data about typically needed information. The first level builds the process level. All mentioned 24 process steps are subdivided into several packages of questions. Process steps, packages of questions and the detailed questions themselves are interviewed depending on the work content of the interviewed person. The interviewed person may choose for every package of questions whether it

Effectiveness of Knowledge Management 191
matches with the usual work content to approx. 80 % (relevance A), about 20 % (relevance B) or not at all (relevance C). Depending on these categories, the answers are weighed later in the evaluation phase. If relevance C is chosen, the questions are neither asked nor weighed.
There are several categories of questions in this questionnaire. The exceptional property of this approach is to find out how long certain data gathering and use take. The times are measured at the working place itself. But even if the time is short, the information can be incorrect, out-dated or useless. Therefore, the interviewed person can assess whether the information is up to date and needed.
4. ASSESSMENT
Most questions in the questionnaires are chosen to highlight one particular knowledge component (PROBST, RAUB, ROMHARDT 1999). Therefore it is possible to assign all questions to one of these knowledge components in the database. As a consequence, all companies' knowledge management usage is evaluated based on these knowledge components.
Depending on the question type, either the interviewed person gives his own assessment of the situation in the company on a scale between one and six (one means very good, six very bad) or the answers are linked to a predefined assessment assigned by a working group at wbk based on experience.
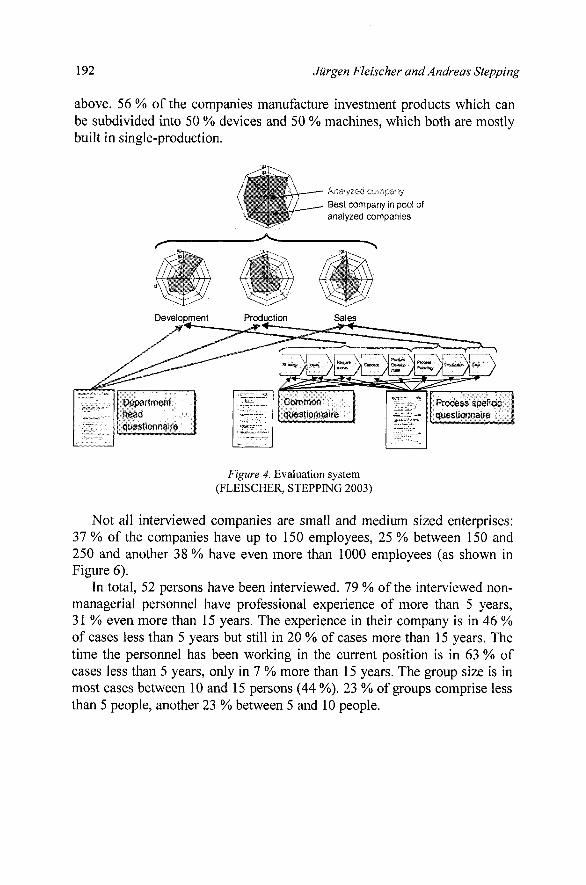
All this information is aggregated into one diagram showing the rate of employment of knowledge management instruments and methods. In later stages it will be possible to compare the analysed company with best-practice companies among those analysed earlier by means of the radar diagram.
This aggregation is done in three steps (Figure 4). The first step consists of the aggregation of all process-specific and common answers to one result per department and company. In the second step, all answers of the 3"̂"̂ section of the department manager questionnaire are evaluated and added to the aggregation per department and company. The last step builds up the fully aggregated radar diagram per company. Each ray represents one of the mentioned knowledge components.
5. RESULTS
5.1 Profile of Interviewed Companies
In summer 2003, several companies belonging to different industrial sectors as shown in Figure 5 were interviewed according to the description
192 Mr gen Fleischer and Andreas Stepping
above. 56 % of the companies manufacture investment products which can be subdivided into 50 % devices and 50 % machines, which both are mostly built in single-production.
Analyzed company Best company in poo! of analyzed companies
head questionnaire
Process speficic Cfyestloonalm
Figure 4. Evaluation system (FLEISCHER, STEPPING 2003)
Not all interviewed companies are small and medium sized enterprises: 37 % of the companies have up to 150 employees, 25 % between 150 and 250 and another 38 % have even more than 1000 employees (as shown in Figure 6).
In total, 52 persons have been interviewed. 79 % of the interviewed non-managerial personnel have professional experience of more than 5 years, 31 % even more than 15 years. The experience in their company is in 46 % of cases less than 5 years but still in 20 % of cases more than 15 years. The time the personnel has been working in the current position is in 63 % of cases less than 5 years, only in 7 % more than 15 years. The group size is in most cases between 10 and 15 persons (44 %). 23 % of groups comprise less than 5 people, another 23 % between 5 and 10 people.

Effectiveness of Knowledge Management 193
vehicle production-
25%
device
production-' 13%
fabrication ^ of metal
\ .^'"'^ ^^^^SN. r p^ciucts x^ ^^^^m. ^̂ "''̂
machine production
37% investnient others consumer- services products
t
60% -
0 % •
„„;,„:l,.^^^5u ..........1 "' ";;f ^ ^ « ; ! ; : «—,...̂ ^^S ~
goods
• series-production
u single-production
^ ^ m . \
^^ '̂ H ! :^:.,^»r !
Figure 5. Industrial sectors of interviewed companies
more than 1000 38%
501 to 1000
up to 150 37%
Figure 6. Number of companies' employees
5.2 Aspects of KM Employment
In order to get an idea of how the interviewed person thinks about knowledge and knowledge management, one of the first questions was "What does the term 'knowledge management' mean to you?" The result is shown in Figure 7: The majority (45 %) thinks of KM as "the way to systematically collect, archive and distribute knowledge" whereas a smaller part

194 Mr gen Fleischer and Andreas Stepping
(26 %) has the definition of "a concept for optimal use of knowledge in order to develop new products, processes and business areas" in mind.
It turned out that the most important source of information is the internet followed by business related journals. Very important sources of information are as well the customers and partners like suppliers and consultants. Professional books, seminars and business sector associations are important for more than 7 % of the interviewed staff Patents and banks are not regarded as important sources for information.
... the way to systematically collect, archive and distribute knowledge
... a concept for optimal use of knowledge in order to develop new products, processes and business areas
... all strategies as a whole in order to use and develop knowledge on all different levels and processes in the company
... less to optimise the knowledge contents than to organise structures, processes and methods
... a way to use knowledge in order to increase productivity
... a possibility to achieve new knowledge
Figure 7. The term „knowledge management" means to me...
The question "What is missing to implement knowledge management methods" showed interesting results: One half is convinced that appropriate software will help and another half says that first of all the budget is missing. Nobody states that a lack of know-how about knowledge management itself exists or that missing interest in knowledge management hinders the implementation of KM.
• • ! J-i'i j i _
Source
Figure 8. Most used sources for information

Effectiveness of Knowledge Management 195
m^
m
%r\ r-̂ '
H ^ -J . \ •^
: ^̂ '̂V ^ '̂
^^^> '̂:' ^:'
: . : : : • = : -
V-"' \̂ '
#%' ^
' ' ^̂ ^̂ ' ^
v^^\ \ ;;; J
i^ " \
software support know-how of knowledge
management
money interest in knowledge
management
others:
Figure 9. What is missing to implement knowledge management methods?
The purpose of knowledge in the interviewed companies is mainly to optimise the company's products and to achieve advantages in comparison to competitors. Innovation and customer acquisition were less important.
100% 1
90%
80%
70%
60%
50%
40%
30% I
20%
10%
0%
customer acquisition
product optimization/ -improvement
00%
It new
business areas new
processes
00%
competitive advantages
Figure 10. What do you need knowledge for?
Another important aspect of knowledge management is the hand-over of projects and information from a leaving employee to the successor. As shown in Figure 11, most employees see the hand-over on a scale between 1 (very bad) and 6 (very good) only at about 3 if there is a successor and even worse if there is no successor.

196 Jurgen Fleischer and Andreas Stepping
6 -
5,5 -
5 -̂
4 5
4 -
3 5 -
2 5 -
2 -
1,5-
1 -
^ \
\
A . . . „ . .....................
total
Maximum 1
Minimum
• Average
6- |
5,5-
5 -
4 ,5 -
4 -
3,5-
3 -
2 ,5-
2 -
1,5 '
1 -
: : . ln „nnnnnv, '^ - -
' f ^
"•J
'
total
Maximum 1
Minimum
• Average
to the sucx:essor? ...if there is no successor?
Figure 11. How good is the hand over of knowledge of a leaving employee ...
The key facts why a hand-over appeared to be good or bad are summarised in Table 3, For example a defined hand over plan and existing documentation of projects and processes are considered as valuable whereas permanent cancellations of hand over meetings or a lack of time on both sides - leaving person and successor - is seen as bad.
Table 3, What is good/bad for an efficient hand-over?
Good
• A good atmosphere relieves the hand over
• Proceed after the hand over plan • Good personal contact to the
successor • Existing documentation • Identification of the employees
avoids the "devil my care" mentality
• Volunteer switch-over
Bad
• Lack of time • Unreadiness to introduce the
successor • Social plan (partly the work ends
overnight) • Lack of a mentor philosophy • Big gap between the ages • No personal interest in the
leaving person • Difficult to assign knowledge in
general • Cancellations
Effectiveness of Knowledge Management 197
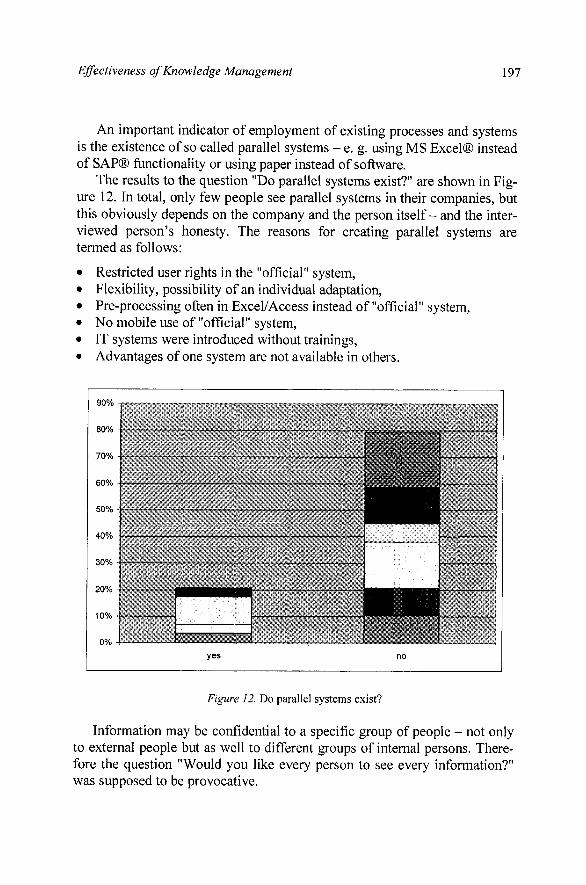
An important indicator of employment of existing processes and systems is the existence of so called parallel systems - e. g. using MS Excel® instead of SAP® functionality or using paper instead of software.
The results to the question "Do parallel systems exist?" are shown in Figure 12. In total, only few people see parallel systems in their companies, but this obviously depends on the company and the person itself- and the interviewed person's honesty. The reasons for creating parallel systems are termed as follows:
• Restricted user rights in the "official" system, • Flexibility, possibility of an individual adaptation, • Pre-processing often in Excel/Access instead of "official" system, • No mobile use of "official" system, • IT systems were introduced without trainings, • Advantages of one system are not available in others.
Figure 12. Do parallel systems exist?
Information may be confidential to a specific group of people - not only to external people but as well to different groups of internal persons. Therefore the question "Would you like every person to see every information?" was supposed to be provocative.

198 Mr gen Fleischer and Andreas Stepping
Only few people (20 %) say that they like to see and let see everybody every information (Figure 13). All others want to restrict the access to information depending on the topic, the current project, the division/department or the hierarchy.
If not, which filter criteria or methodsshould be used (e.g. role of the user, authorization)
80%
division-oriented
hierarciiy-oriented
Figure 13. Would you like every person to see every information
Concerning the creation of a common knowledge base to which partners, suppliers and customers have access, the opinion is pretty clear (see Figure 14). The major part of the interviewed persons does not want to design such a knowledge base. It is preferred to distinguish between three groups: suppliers should be able to refer to the knowledge of the company (46 % yes, 47 % partially) whereas customer and external partners should be less integrated (40 % yes).
5.3 Best-Practice Approaches
As already described above, all answers are assessed and stored in a database. The results of all interviews both on manager and on non-managerial level are aggregated per company into one radar diagram. The comparison of all radar diagrams leads to the Figure 15, where for any knowledge component the best company's result gives an impression of how well knowledge management works in general. The fulfilment of only one knowledge component has been met at 100 % by at least one company. All other knowledge components were met at 90 % at highest or in case of knowledge acquisition only about 65 %.
But what are the reasons for these best-practice companies? Why did they succeed in this benchmark? Which solutions were implemented and are used? The following part is divided into four categories: Organisation, Processes, Tools and Culture. For each of these categories some samples of best practice are given.

Effectiveness of Knowledge Management 199
no yes o%A A 7%
External Partners
partially 47%
Figure 14. Would you like customers, suppliers and other partners to access the same knowledge base?
5.3.1 Organisation
• For any department particular responsibilities for knowledge management are specified.
• Regular benchmarking of core knowledge is carried out. The results are distributed to all employees.
• The availability of a particular knowledge management budget - even if low - is a signal message to all employees.
• The continuous knowledge progress is supervised by a "knowledge board" that controls target achievement.
• The factor of production ^knowledge" is deep-seated in the company's strategy.
• Knowledge objectives are led into the organisation by agreements of objectives.
• Low number of hierarchy levels and short communication support knowledge interchange.

200 Mr gen Fleischer and Andreas Stepping
1: knowledge 2: knowledge 3: knowledge 4: knowledge 5: knowledge 6: knowledge 7: knowledge 8: knowledge
identification distribution use acquisition development evaluation preservation objective
Figure 15. Best-Practice results per knowledge component
5.3.1 Processes
Handover-processes are defined, controlled and part of the agreements of objectives - in both cases of existing and non-existing successor. The search of internal experts is supported by yellow pages and organisation charts. Knowledge-Management intranet-portal designed and developed by the employees to meet their requirements leads to high acceptance and usability, because the key words are deducted from daily work. An additional interface to many company related internet-sites avoids time consuming searches. The company formulates long-term vision and mission for new business areas. Organisation is based on well-documented processes. Knowledge acquisition is a regular process including visits of fairs, contacts to competitors as well as collaborative projects with research institutes.
5.3.2 Tools
Internal advanced trainings like courses, seminars and workshops are regularly used. Additionally, job rotation und project reviews are used to gain knowledge. Giving time for personal development leads to motivated, knowledge sharing staff Research into new subject areas by case-studies.

Effectiveness of Knowledge Management 201
5.3.3 Culture
• The transmission of knowledge is understood as a part of the job. A positive effect is the reduction of the individual work amount, a possible specialisation and the improvement of the team's output.
• There are a lot of informal communication occasions like whiteboards, bill-boards and coffee-comers.
• The acceptance of mistakes is part of the company's vision. • Regular "future meetings" are installed where worker, team leader and
general management are involved. • All employees see the company's advantage in sharing information to get
or stay better than other companies - and as consequence to keep their jobs.
6. SUMMARY
The herein presented approach presents a survey method and an assessment system to determine the effectiveness of knowledge management employment. The survey method consists of several questionnaires dedicated to different process steps and hierarchical levels of a company. By means of this survey method, it is possible to compare several companies in terms of knowledge management employment and to visualise the differences in simple radar diagrams. Based on the best in class company per ray in the radar diagram, one can deduct the best practices which have led to this good assessment.
REFERENCES
FLEISCHER, J.; STEPPING, A.: Effectiveness of Knowledge Management - a Process Based Survey Method. In: Current Trends in Production Management. Eds.: ZULCH, Gert; STOWASSER, Sascha; JAGDEV, Harinder S. Aachen: Shaker Verlag, 2003, pp. 187-193. (esim - European Series in Industrial Management, Volume 6)
PROBST, G.; RAUB, S.; ROMHARDT, K. (eds.): Wissen managen. Wie Unternehmen ihre wertvollste Ressource optimal nutzen. Wiesbaden: Gabler Verlag, 3rd ed., 1999.
SPATH, D.; DILL, C; SCHARER, M.: Vom Markt zum Markt: Produktentstehung als zyklischer Prozess. Stuttgart: LOG_X, 2001.