Embed Size (px)
Citation preview

EFFECTIVENESS OF CRACK SEALING ON PAVEMENT
SERVICEABILITY AND LIFE
FINAL REPORT
Arudi Rajagopal, Ph.D.
INFRAME, 2300 East Kemper Road, Suite A-17
Cincinnati, OH 45241-6501
State Job No. 134364
June 2011
Prepared in cooperation with
The Ohio Department of Transportation and
The U.S. Department of Transportation Federal Highway Administration


1. Report No.
FHWA/OH-2010/14
2. Government Accession No.
3. Recipient’s Catalog No.
4. Title and subtitle
Effectiveness of Crack Sealing on Pavement Serviceability and Life
5. Report Date
June 2011
6. Performing Organization Code
7. Author(s)
Dr. Arudi Rajagopal
8. Performing Organization Report
No.
10. Work Unit No. (TRAIS)
9. Performing Organization Name and Address
Infrastructure Management & Engineering, Inc.
2300 East Kemper Road, Suite A-17
Cincinnati OH 45241-6501
11. Contract or Grant No.
134364
13. Type of Report and Period
Covered
12. Sponsoring Agency Name and Address
Ohio Department of Transportation, 1980, West Broad Street
Columbus, OH 43223
14. Sponsoring Agency Code
15. Supplementary Notes
16. Abstract:
This report presents the details of a study to evaluate effectiveness of Ohio Department of Transportation’s prevailing crack sealing program. Evaluation was performed through field monitoring a large number of crack sealed and control sections. Field monitoring included collection of performance data for over five year period after crack sealing. The data collected was used to address the following specific issues:
Do existing crack sealing practices within ODOT enhance pavement performance?
What is the optimum timing of the treatment?
Does crack sealing extend pavement life?
Is crack sealing a cost effective treatment?
The analysis revel that crack sealed pavements, in general, performed better than the control sections on a 5-year cycle. Regardless of pavement type, aggregate type used in the surface layer, and the prior pavement condition crack sealing always results in performance gain. Maximum performance gain can be achieved by treating pavements with Pavement Condition Rating ranging from 66 to 80. The performance prediction models indicate crack sealing treatment can extend the service life of pavements by up to 3.6 years. The cost analysis using a common metric such as the Net Present Value illustrates that crack sealing, as a maintenance strategy, is economically viable for pavements in the prior PCR range of 66-70. From a practical point of view, it is hereby recommended that ODOT develops a policy to allow crack sealing as a strategy for pavement preventive maintenance for all pavements in the prior PCR range of 66 to 80. 17. Key Words
Crack Sealing, Pavement Performance, Pavement Serviceability, Life, Cost-effectiveness, Performance-effectiveness
18. Distribution Statement
No restrictions. This document is available to the public through the National Technical Information Service, Springfield, Virginia 22161
19. Security Classif. (of this report)
Unclassified
20. Security Classif. (of this page)
Unclassified
21. No. of Pages
81
22. Price
Form DOT F 1700.7 (8-72) Reproduction of completed pages authorized


Disclaimer
The contents of this report reflect the views of the authors who are responsible for the facts and the
accuracy of the data presented herein. The contents do not necessarily reflect the official views or
policies of the Ohio Department of Transportation or the Federal Highway Administration. This
report does not constitute a standard, specification or regulation.


ACKNOWLEDGMENTS
The investigators wish to convey their appreciation to Mr. Roger Green, Mr. Aric Morse, Mr.
Adam Au, Mr. Patrick Bierl and Mr. David Humphrey of the Ohio Department of Transportation
for their help throughout the life of this project. Thanks are also due to Mr. Andrew Williams,
Mr. Brian Schleppi, Mr. Thad Tibbles and Mr. Dave Powers for their valuable contributions. The
cooperation extended by the district and county officials is duly acknowledged. Support rendered
by Dr. C. Keshav, Mr. Mahesh Bhupalam and Mr. Vikram Kirikera in data processing and review
of the report is highly appreciated.


TABLE OF CONTENTS
1. DESCRIPTION OF THE PROBLEM ........................................................................................ 1
2. OBJECTIVES AND SCOPE ...................................................................................................... 4
3. REVIEW OF EXISTING CRACK SEALING PRACTICES IN OHIO .................................... 4
4. DESIGN OF EXPERIMENT ..................................................................................................... 5
4.1 Identification of Experimental Variables .............................................................................. 6
4.2 Compiling a list of Crack Seal Projects ................................................................................ 7
4.3 Preliminary Selection of Test Sections ................................................................................. 8
4.4Setting up Layout of Test Sections ........................................................................................ 9
4.5 Crack Treatment of Test Sections ....................................................................................... 11
4.6 Conducting Field Evaluations ............................................................................................. 11
4.7 Interactive Database ............................................................................................................ 12
5. OVERVIEW OF ANALYSIS APPROACH ............................................................................ 16
6. MEASURE OF EFFECTIVENESS ......................................................................................... 16
6.1 Average Performance Gain ................................................................................................. 17
6.2 Service Life Extension ........................................................................................................ 18
7. DATA ORGANIZATION ........................................................................................................ 19
8. VERIFICATION OF DATA INTEGRITY, COMPLETENESS AND VALIDATION OF
CRACK SEAL DATABASE ................................................................................................... 23
8.1 Validation of the Database .................................................................................................. 24
9. ANALYSIS OF DATA............................................................................................................. 26
9.1 Average Performance Gain ................................................................................................. 29
9.2 Service Life Extension ........................................................................................................ 32
9.3 Results in Summary ............................................................................................................ 41
10. ADDITIONAL PERFORMANCE INDICATORS TO EVALUATE THE EFFECTIVENESS
OF CRACK SEALING ............................................................................................................ 41
11. COST-EFFECTIVENESS OF CRACK SEALING ............................................................... 50
12. SUMMARY and CONCLUSIONS ........................................................................................ 60
13. RECOMMENDATIONS ........................................................................................................ 66
REFERENCES ............................................................................................................................. 67


LIST OF FIGURES
Figure 1. Crack Sealing Operation.................................................................................................. 1
Figure 2. Extensive Crack Sealing in Flexible Pavements ............................................................. 2
Figure 3. Sealing High Severity Cracks .......................................................................................... 2
Figure 4. Sealing Reflection Cracks in Composite Pavements....................................................... 2
Figure 5. Experimental Variables ................................................................................................... 7
Figure 6. Layout of Test Sections ................................................................................................... 9
Figure 7. Location of Test Sections on 2-Lane and 4-Lane Highways ........................................ 10
Figure 8. Schematic Illustration of Process Model ....................................................................... 12
Figure 9. Section Description Module .......................................................................................... 13
Figure 10. Crack Seal Data Entry Module .................................................................................... 14
Figure 11. PCR Data Entry Module .............................................................................................. 15
Figure 12. Deriving Average Performance Gain .......................................................................... 17
Figure 13. Performance Prediction Model Showing Service Life Extension Calculation ........... 19
Figure 14. Identification Numbers for Subsections ...................................................................... 20
Figure 15. Data Organization ........................................................................................................ 22
Figure 16. Comparing Performance of all Data Regardless of Experimental Variables .............. 26
Figure 17. Comparing Performance Based on Pavement Type .................................................... 27
Figure 18. Comparing Performance Based on Pavement and Aggregate Type ........................... 27
Figure 19. Comparing Performance Based on Pavement Type, Aggregate Type and Prior PCR 28
Figure 20. Average Performance Gain ......................................................................................... 30
Figure 21. Performance Prediction Models for All Data .............................................................. 32
Figure 22. Performance Prediction Models for Composite Pavements ........................................ 34
Figure 23. Performance Prediction Models for Flexible Pavements ............................................ 35
Figure 24. Performance Prediction Models for Composite Pavements with Gravel in Surface Layer
...................................................................................................................................... 36
Figure 25. Performance Prediction Models for Composite Pavements with Limestone in Surface
Layer ............................................................................................................................ 37
Figure 26. Performance Prediction Models for Flexible Pavements with Gravel in Surface Layer
...................................................................................................................................... 38

Figure 27. Performance Prediction Models for Flexible Pavements with Limestone in Surface
Layer ............................................................................................................................ 39
Figure 28. ODOT‟s Pavement Condition Rating Form for Flexible Pavements .......................... 42
Figure 29. ODOT‟s Pavement Condition Rating Form for Composite Pavements ...................... 42
Figure 30. Effectiveness Based on (PCR – CS Deficiency) ......................................................... 46
Figure 31. Effectiveness Based on CDV ...................................................................................... 47
Figure 32. Effectiveness Based on CDV + Raveling .................................................................... 48
Figure 33. Effectiveness Based on (CDV – Random) Cracking .................................................. 49
Figure 34. Effectiveness Based on Potholes and Patching ........................................................... 50
Figure 35. Cost-effectiveness of Two Alternate Treatments Based on Service Life for All
Pavement Types ........................................................................................................... 52
Figure 36. Cost-effectiveness of Two Alternate Treatments Based on Service Life for Composite
Pavements .................................................................................................................... 52
Figure 37. Cost-effectiveness of Two Alternate Treatments Based on Service Life for Flexible
Pavements .................................................................................................................... 53
Figure 38. Cost-effectiveness of Two Alternate Treatments Based on Service Life for All
Pavement Types ........................................................................................................... 53
Figure 39. Cost-effectiveness of Two Alternate Treatments Based on Service Life for Composite
Pavements .................................................................................................................... 54
Figure 40. Cost-effectiveness of Two Alternate Treatments Based on Service Life for Flexible
Pavements .................................................................................................................... 54
Figure 41. Cost-effectiveness of Two Alternate Treatments Based on Service Life for All
Pavement Types ........................................................................................................... 56
Figure 42. Cost-effectiveness of Two Alternate Treatments Based on Service Life for Composite
Pavements .................................................................................................................... 57
Figure 43. Cost-effectiveness of Two Alternate Treatments Based on Service Life for Flexible
Pavements .................................................................................................................... 57
Figure 44. Cost-effectiveness of Two Alternate Treatments Based on Service Life for Composite
Pavements .................................................................................................................... 58

List of Tables
Table 1. Matrix of Test Sections ..................................................................................................... 7
Table 2. Data Requested from ODOT Districts .............................................................................. 8
Table 3. Calculating Average Performance Gain ......................................................................... 18
Table 4. Typical PCR Data for a Test Section .............................................................................. 21
Table 5. Data Available for Analysis ............................................................................................ 25
Table 6. Summary of Average Performance Gain Calculations ................................................... 31
Table 7. Service Life Extension .................................................................................................... 33
Table 8. Summary of Service Life Extension (in years) Calculations corresponding to Threshold
PCR = 60 ...................................................................................................................... 40
Table 9. Summary of Service Life Extension (in years) Calculations corresponding to Threshold
PCR = 65 ...................................................................................................................... 40
Table 10. List of Cracking Distresses in Flexible Pavements ...................................................... 44
Table 11. List of Cracking Distresses in Composite Pavements .................................................. 44
Table 12. Maximum deduct points for each indicator .................................................................. 45
Table 13. Service Life of Pavements in PCR Range 66-80 .......................................................... 51
Table 14. Service Life of Pavements in PCR Range 66-70 .......................................................... 56
Table 15. Cost-effectiveness of Crack Seal Based for Different Pavement Condition (Analysis
Period=8 Years) ........................................................................................................... 59


EFFECTIVENESS OF CRACK SEALING ON PAVEMENT
SERVICEABILITY AND LIFE
1. DESCRIPTION OF THE PROBLEM
Sealing cracks in pavements with an asphalt surface is a preventive maintenance activity
performed by most highway agencies including the Ohio Department of Transportation (ODOT).
A range of materials and methods are in use within Ohio for this purpose. The type and severity
of cracks sealed, the extent of crack sealing on a given pavement and choice of a specific
material/method depends on the county manager‟s understanding of the historical performance of
various materials, pavement type (flexible or composite), regional conditions, and availability of
operating funds. Figure 1 shows crack sealing operation while Figures 2 through 4 show typical
crack sealed pavements to illustrate various types of cracks and the extent of cracks sealed.
Figure 1. Crack Sealing Operation
A successful crack sealing job can result in many benefits including substantial life cycle
cost savings, improved customer service, and better system-wide performance. However, crack
sealing may also have adverse effects on the pavement in many ways such as, tracking of sealing
Cleaning cracks with
compressed air
Placing hot sealant with a
squeeze (wand)
Finished Seal

2
material by tire action, reduced skid resistance, and a rougher pavement. Crack sealing is deemed
beneficial if pavement life is increased while maintaining safety and serviceability.
Figure 2. Extensive Crack Sealing in Flexible Pavements
Figure 3. Sealing High Severity Cracks
Figure 4. Sealing Reflection Cracks in Composite Pavements

3
In March 2000, ODOT developed a project in association with the University of Cincinnati
(UC) to „design a project to statistically verify the effectiveness of ODOT‟s current crack sealing
program on pavement condition and life‟. The primary intent of the study was to investigate and
document the effectiveness of crack sealing with respect to: (i) economic benefits, (ii) maintaining
and/or improving serviceability, and (iii) extending pavement life. During the period 2000 through
2002, the UC researchers worked with ODOT engineers, district highway managers and county
managers to initiate this project. The study led to setting up of over 700 test sections (each 1000‟
long), conducting preliminary pavement condition evaluations, and establishment of guidelines for
further monitoring. A report for Phase 1 study [1] was submitted to ODOT describing the details
of the work performed and guidelines for future monitoring.
Following the Phase 1 study, ODOT continued to monitor the performance of the
experimental sections for an additional eight years. In the meantime, in 2008, ODOT initiated
Phase 2 study. The purpose of Phase 2 study was to review the data being collected and to
develop a methodology to comprehensively process and analyze the long-term performance
monitoring data. The present report describes the details of the efforts performed during the
Phase 2 study and includes a description of the data collection procedures, analysis procedure,
results derived, performance and cost benefits of ODOT‟s prevailing crack sealing program,
conclusions, recommendations, and guidelines for implementation of specification changes. In
order to provide continuity from Phase 1, this report includes excerpts from Phase-1 report such as,
a brief description of the experimental plan, testing and evaluation. The Phase-1 report presents a
review of literature and the same is not repeated in this report.

4
2. OBJECTIVES AND SCOPE
The primary focus of this research is to evaluate the effectiveness of crack sealing
procedures currently practiced in Ohio. The study does not concentrate on crack sealant material
type and application methods, but rather on the effectiveness of sealing in general on overall
pavement performance. This research included setting up test and control sections, and
conducting pavement condition evaluations for the long term monitoring of these sections. The
data collected was used to address the following specific issues:
Do existing crack sealing practices within ODOT enhance pavement performance?
If so, what is the optimum timing for treatment?
Does crack sealing extend pavement life?
Does crack sealing provide cost benefit? If so, to what extent?
3. REVIEW OF EXISTING CRACK SEALING PRACTICES IN OHIO
The study began with a survey of ODOT‟s county managers and district officials. A
survey form was mailed to all eighty-eight county managers and twelve district highway managers
to query them on the materials used for crack sealing, application methods, type of cracks sealed,
time of sealing, and their willingness to participate in a study to evaluate the effectiveness of crack
sealing program. Forty six county managers responded to the survey. By summarizing the
survey forms, the following observations were made:
The counties perform crack sealing during the Fall, Winter and Spring months;
Compressed air is commonly used for crack preparation;
The pavement temperature when the seal is applied normally varies from 400F to 100
0F;
The counties „mostly clean‟ the pavement surface and keep the surface „dry‟ before placing

5
the crack seal;
The counties treat cracks of all severity (low, moderate and high). However, a greater
number of counties treat only „moderate‟ cracks;
The types of cracks sealed include alligator, edge, block, longitudinal, reflection, and
transverse cracks;
A range of materials are used for crack sealing. MC-3000 stands out as the most widely
used material;
Routing is not done prior to crack sealing;
The finished sealant is predominantly „level with surface‟ or „overband‟;
The counties perform crack sealing using their own forces. The counties rarely outsource
this work to contractors;
The county managers who responded to the survey were willing to participate in this study
to systematically evaluate the effectiveness of crack sealing practice.
This information was used to develop a plan for the field experiment and to define the exact
scope of the field study namely, the number of test variables to be included, total number of test
sections required, and the availability of sections.
4. DESIGN OF EXPERIMENT
Following the review of crack sealing practices in Ohio, discussions were held with the
technical evaluation team. Several tasks, as mentioned below, to assist in the design and
development of the experiment were finalized:
Identification of experimental variables,
Compiling a list of crack seal projects,

6
Setting up layout of test sections,
Crack treatment of test sections,
Conducting field evaluations,
Determining sample size required,
Defining a measure of effectiveness,
Determining type and frequency of data to be collected,
Developing a database,
Developing guidelines for monitoring.
4.1 Identification of Experimental Variables
Based on a review of variables that are known to affect the pavement performance in
general, and the field variables that may have historically influenced the performance of Ohio‟s
crack sealed pavements in particular, the following three variables, designated as primary factors,
were included in the field experiment:
Pavement type (flexible and composite),
Type of aggregate in the surface layer (gravel and limestone), and
Pavement Condition Rating, PCR (<75, 75-85, >85)
A schematic of the experimental variables is presented in Figure 5. The primary variables
are the factors which exercise considerable influence on the outcome; they are actually selected for
study in the experiment. A matrix of design factors used in the experiment is shown in Table 1.
A group number was assigned to each set of factors as illustrated in the table.

7
Figure 5. Experimental Variables
Table 1. Matrix of Test Sections
Pavement type Flexible Composite
Aggregate in
surface layer Lime Stone Gravel Lime Stone Gravel
PCR of existing
pavement <75 75-85 >85 <75 75-85 >85 <75 75-85 >85 <75 75-85 >85
Group number 1 2 3 4 5 6 7 8 9 10 11 12
4.2 Compiling a list of Crack Seal Projects
In late 2000, the researchers, along with ODOT‟s Pavement Engineering personnel, met
with several district and county managers at their premises. These meetings were convened to
provide the officials information regarding the scope of the research and the type and extent of
cooperation required from them. It was generally agreed to consider only flexible and composite
pavements that the counties have included in their annual crack sealing program. The districts

8
were asked to provide details of pavement sections included in their crack sealing program, as
noted in Table 2.
Table 2. Data Requested from ODOT Districts
List of pavement sections included in the annual crack seal program for Fiscal Year 2000 and 2001
County Route Begin
Log
End
Log
Year of next
resurfacing
Composite
/Flexible
Aggregate in
surface layer
Pavement
Condition
Rating
A comprehensive list of pavement sections intended for crack sealing in the year 2000 and
2001was prepared using the information provided by participating district offices and counties.
4.3 Preliminary Selection of Test Sections
The researchers, often accompanied by ODOT personnel, visited the pavement sections,
the details of which was obtained from the districts, and drove over the entire length of each crack
sealing project. From these projects, one mile long candidate test sections were selected for the
field experiment using the following criteria:
Pavement type: Should be either flexible or composite
Pavement structure: The thickness and the layer configuration should be similar
Pavement Condition: The pavement section should be fairly homogeneous, in terms of
surface condition, between two mile markers, and
Year of next resurfacing: The pavement section under consideration should not be included
in the resurfacing program for at least five more years.

9
Additional information for each section namely, current PCR, aggregate type in the surface
course, functional classification, geometric details, and climate was collected from the available
records. The group number which each pavement section belongs to was identified, and was
assigned a number 1 through 12 as defined in Table 1. This completed the preliminary selection
of the test sections. The sections were well scattered over the state comprising of 57 counties.
4.4Setting up Layout of Test Sections
A typical layout of a test section is shown in Figure 6. As can be seen, each test section is
1-mile long. Each test section was divided into five subsections. In the first year, only
subsection-1 received a crack seal treatment. Then, subsections 2, 3 and 4 received same crack
seal treatments in years 2, 3, and 4 respectively. Subsection 5 was left unsealed and served as
control (do-nothing) subsection. This procedure was adopted so as to study the effect of deferring
crack sealing on pavement condition and life, and at the same time to generate information
regarding the optimum timing of crack seal treatment.
Figure 6. Layout of Test Sections

10
After selecting the test sections, the researchers made paint markings on the pavement to
designate subsections and sequence of crack sealing. Letters were sent to respective counties
with an attachment which showed the exact location of the test sections, and provided details about
the field experiment. The counties were asked to crack seal only one subsection each year.
Often, on each route, two sections with similar conditions were selected. On 2-lane
highways the gap between the two sections was varied from zero to five miles, depending on site
specific conditions. On 4-lane highways, the two sections are either on parallel lanes or in the
same direction as on 2-lane highways. Figure 7 shows the general location of test sections on 2
and 4 lane highways.
Figure 7. Location of Test Sections on 2-Lane and 4-Lane Highways

11
4.5 Crack Treatment of Test Sections
Since this research focused on evaluating the effectiveness of existing crack sealing
practices, the researchers asked the county managers to use their usual practice to seal the cracks in
the test sections, with respect to timing of the treatment, types of cracks sealed, materials used, and
placement procedures. The counties were asked to keep proper documentation of the issues
relating to construction, materials used, placement techniques, environmental conditions at the
time of crack sealing, time required for each operation, type and quantity of material used, and cost
of the operation.
4.6 Conducting Field Evaluations
Field investigation included collecting PCR data for each subsection. Because of the
subjectivity in PCR data collection, the researchers met with the Pavement Management personnel
and calibrated their data collection procedure. In the first year, the researchers collected PCR data
on most of the sections. However, for future data collection, ODOT dedicated one technician for
this project. This technician collected PCR data on all the test sections selected for this study.
Using one rater for the entire period of research eliminated any errors that may arise due to
differences in the observations made by different raters.
PCR data was collected on all test sections prior to crack sealing. In each subsection,
photographs of typical cracks at three locations were taken for visual comparison of pavement
condition.
During meetings with county managers, it was learned in most cases that, after crack
sealing a pavement section, the counties do not perform any maintenance or rehabilitation
activities during the following five years. Because of this practice, this study proposed the

12
performance of the crack treated subsections be monitored for up to five years, after sealing.
Hence the data collection effort continued for a period of five years after sealing the cracks in the
last subsection. Since subsection-4 was treated in year 4, field monitoring was made for a total of
nine years.
4.7 Interactive Database
An interactive database was developed to assist ODOT in (i) data gathering, (ii) data
storing, (iii) data processing, and (iv) data analysis. This database termed ODOT - ECS (Ohio
Department of Transportation - Database to Evaluate Crack Sealing Practices in Ohio) is a
comprehensive MS Windows based software developed in MS Visual Basic and MS Access.
Figure 8 shows an overview of ODOT-ECS. The software offered friendly screens to enter data
and to generate reports. Input to the system included three basic modules namely (i) section
description, (ii) crack seal data, and (iii) PCR data. Figures 9, 10 and 11 show the screen layout
for each of these modules.
Figure 8. Schematic Illustration of Process Model
13
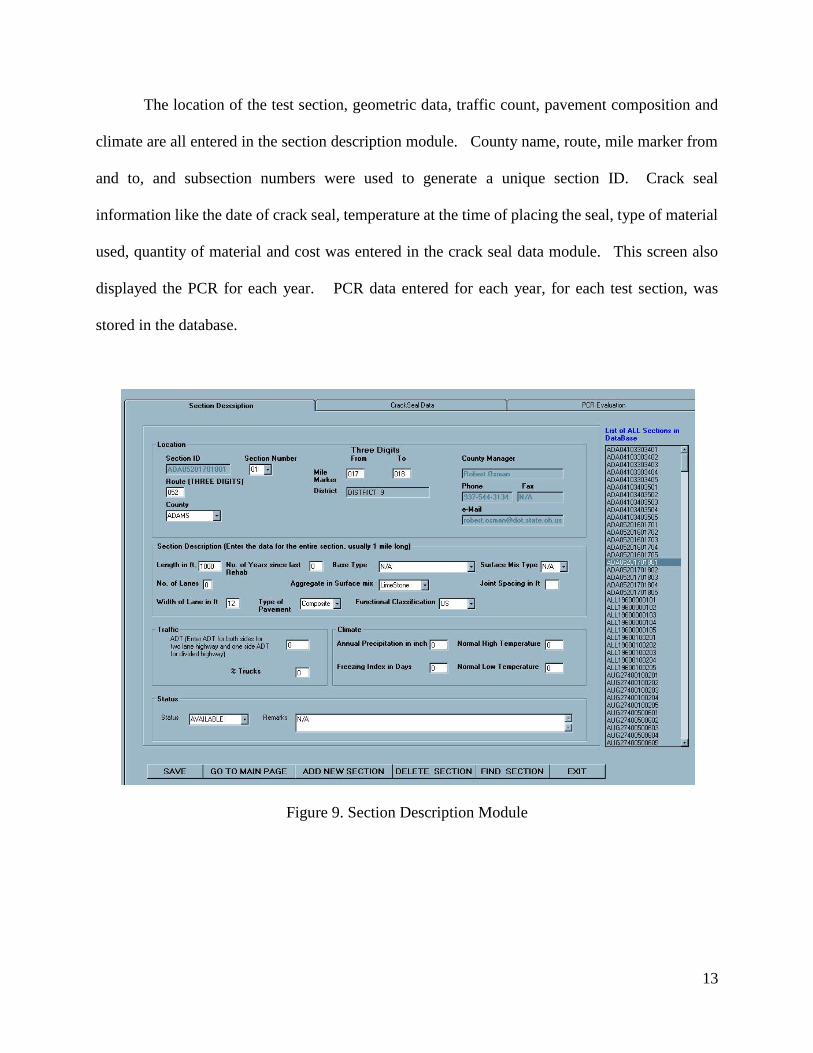
The location of the test section, geometric data, traffic count, pavement composition and
climate are all entered in the section description module. County name, route, mile marker from
and to, and subsection numbers were used to generate a unique section ID. Crack seal
information like the date of crack seal, temperature at the time of placing the seal, type of material
used, quantity of material and cost was entered in the crack seal data module. This screen also
displayed the PCR for each year. PCR data entered for each year, for each test section, was
stored in the database.
Figure 9. Section Description Module

14
Based on ODOT‟s requirements, many reports were generated to do the following:
Query reports with respect to a field variable,
Generate matrix of test sections, and
Generate helpful reports to track:
o Progress
o Problems
o Delays in crack treatment and/or sending information sheet
o Counties to contact
Figure 10. Crack Seal Data Entry Module
15
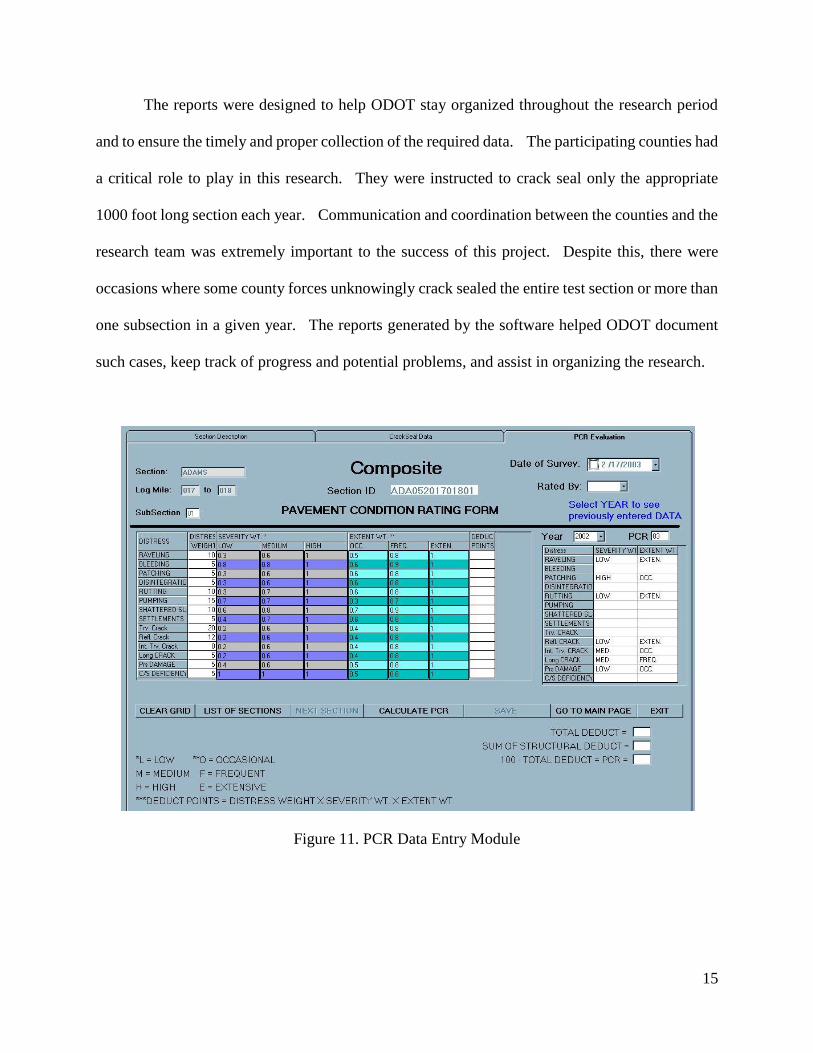
The reports were designed to help ODOT stay organized throughout the research period
and to ensure the timely and proper collection of the required data. The participating counties had
a critical role to play in this research. They were instructed to crack seal only the appropriate
1000 foot long section each year. Communication and coordination between the counties and the
research team was extremely important to the success of this project. Despite this, there were
occasions where some county forces unknowingly crack sealed the entire test section or more than
one subsection in a given year. The reports generated by the software helped ODOT document
such cases, keep track of progress and potential problems, and assist in organizing the research.
Figure 11. PCR Data Entry Module

16
5. OVERVIEW OF ANALYSIS APPROACH
Crack sealing is a pavement preventive maintenance treatment. Investigation of
effectiveness of crack sealing on pavement performance is a classic example of determining the
effectiveness of pavement maintenance treatments on future performance of pavements. When
used appropriately, this treatment may have the ability to improve the pavement performance,
prolong the remaining service life and result in cost-effective pavement maintenance and
management procedure. While investigating if crack sealing is an effective preventive
maintenance treatment, the two important questions which need to be addressed are: where and
when. Where refers to a set of physical conditions and when relates to a time at which crack seal
treatment should be performed. In the present study, where is defined by the two experimental
variables namely, pavement type and type of aggregate used in the surface layer, while when is
described by the PCR value of the pavement at the time of treatment. The analysis focused on
identifying the set of conditions and optimal timing of treatment that would maximize the
performance of pavements.
6. MEASURE OF EFFECTIVENESS
An important step in the evaluation of the effectiveness of crack sealing is to define the
„measure of effectiveness‟, a score describing the performance of pavements. In the present study,
the following two measures of effectiveness were used:
Average performance gain, and
Service life extension.

17
6.1 Average Performance Gain
Figure 12 illustrates the method adopted for deriving average performance gain. A test
section in Fairfield County on state route 22 between mile markers 19 and 20 has been used for this
illustration. The figure shows two performance curves – one for a crack sealed subsection and the
other for the control section. The crack seal treatment was placed when the PCR of the in-service
pavement was 88. As a result of the treatment, the PCR of the pavement increased to 91. The
PCR values of the treated pavement were higher than that of control section during the subsequent
years. The performance gain for each year was calculated as the difference in PCR between the
treated and control subsections, see Table 3.
Figure 12. Deriving Average Performance Gain
9290
8888
83
7573
70
88
91
88
82
78
75
65
70
75
80
85
90
95
1 2 3 4 5 6 7
PC
R
Age, years

18
Table 3. Calculating Average Performance Gain
Age, years PCR of treated
pavement PCR of control section
PCR
difference
1 91 88 3
2 88 83 5
3 82 75 7
4 78 73 5
5 75 70 5
Average performance gain: 5
As can be seen in the figure and table, the performance gain varied with time. Average
performance gain was calculated as the average of PCR difference for five years.
6.2 Service Life Extension
The data from this study was used to verify whether crack sealing extends the service life.
In order to do this, performance curves were developed for crack sealed and control pavements.
As a precursor to the analysis, the subsections were placed into several groups based on prior PCR
such as 45-50, 51-55, 56-60, and so on. These PCR values indicate the condition of the
subsections just before the crack seal treatment. Performance prediction models were developed
for each group of treated subsections with PCR as a function of age. The linear models provided
the best fit in most cases. Based on the discussions with ODOT engineers, service life
calculations were made for threshold PCR values corresponding to 60 and 65. The number of years
required to reach a threshold PCR value of 60 and 65 was read from the graph and was reported as
the life of the treated pavements.

19
Figure 13 shows a sample of the performance prediction model and service life extension
calculation for prior PCR group 66-70.
Figure 13. Performance Prediction Model Showing Service Life Extension Calculation
7. DATA ORGANIZATION
For each of the mile long test section selected for field monitoring, the following
information was collected:
Location: county, route, mile markers
Geometrics and pavement data: number of lanes, width of lane, joint spacing (in case of
composite pavement), pavement type, type of aggregate in surface layer
Traffic: ADT, % truck, functional classification (IR, US, SR)

20
Following this, each test section was divided into five subsections and an 11-digit
identification number was assigned to each subsection as shown in Figure 14.
Figure 14. Identification Numbers for Subsections
The ID comprised of name of the county (3 digits), route number (3 digits), begin mile
marker (3 digits), end mile marker (3 digits), and subsection number (2 digits).PCR data was
collected for all subsections, prior to crack sealing and designated as „prior PCR‟. The PCR of
each subsection within a mile was identical with little variation. This PCR data, along with the
individual distress data that make up PCR was entered and stored in ODOT ECS. Crack seal
treatment was performed on subsection-1 in 2001. PCR data was collected again on all
subsections in 2001 and stored in the database. This step was continued until subsection-4 was
treated. After this period, PCR data collection was continued on all subsections for 5-years.
Table 4 shows an example of PCR data stored for the FAI 22 section.

21
Table 4. Typical PCR Data for a Test Section
PCR Data collection for each test subsection on FAI 22
Year Date of crack seal FAI02201902001 FAI02201902002 FAI02201902003 FAI02201902004 FAI02201902005
2000 12/30/2000 88 88 85 86 87
2001 8/23/2001 91 82 84 82 83
2002 5/24/2002 88 87 80 80 82
2003 6/5/2003 82 82 81 74 75
2004 5/27/2004 78 78 79 75 73
2005 3/21/2005 75 74 72 70 70
2006 5/30/2006 74 71 71 68 68
2007 6/22/2007 74 67 69 65 66
2008
Highlighted values indicate PCR after crack sealing
Crack seal deficiency is one of the distresses surveyed and it carries a 5 point weight. A
crack sealed pavement would gain 5 points according to the survey procedure employed by
ODOT. The first PCR survey after crack sealing was designated as PCR after crack seal. The
first survey was conducted within a few weeks to several months after crack seal operation.
Subsection 1 in the table above shows 3-PCR point gain due to crack treatment while subsection 2
shows 5 point gain. Subsections 3 and 4 indicate only one PCR point gain. This can be
attributed to the time period between crack seal and the survey.
For data processing, a master database was created including all subsections, their
performance data and primary variables. An extract of the database is shown in Figure 15.

22
Additionally, the individual distress data and other data such as geometrics, traffic was stored in
other tables.
Figure 15. Data Organization

23
8. VERIFICATION OF DATA INTEGRITY, COMPLETENESS AND VALIDATION OF
CRACK SEAL DATABASE
Before proceeding with data processing, it was decided to do the following:
1. Thoroughly review the ODOT-ECS database
2. Identify missing data
3. Identify sources for locating missing data
4. Collect missing data and update the database
5. Visit 20% of test sections
6. Validate the ODOT-ECS database
The database organized all the data in several tables as below:
Location details
County
Crack conditions
Performance Data for each year from 2000 through 2008
A review of the database at the beginning of this study revealed that a significant number of
records did not contain the date of crack seal. Also some errors were identified in the distress data
for a few records. When a distress data is entered, the user has to record both severity and extent
values. If either of them is missing, it can result in incorrect PCR value.
An additional computer program was written to scan every record in each table. The
purpose of this software was to conduct a thorough review of the database so as to (i) ensure all
required entries have been made, and (ii) verify correctness of the entries. The program was
designed to systematically access each table and scan the entries. Primary focus was on:

24
Date of crack seal
Distress data
The date of crack seal is extremely important to: (i) ensure crack seal has been performed
as requested by the research team, (ii) confirm an appropriate value has been entered in the
database and, (iii) track and compare the performance of test sections. The distress data entered for
each subsection for each survey period was meticulously checked with respect to the type of
distresses, their severity and extent. The database was also reviewed to ensure that the other
essential fields such as pavement type, type of aggregate in the surface, functional classification
and traffic were entered.
The computer program checked each record for missing and/or invalid entries. Where such
discrepancies were found, the entries were corrected and validated by consulting project liaison.
In 2008, the researchers visited 53 in-service test sections. The primary objective of the
visit was to validate the condition data with respect to the field condition.
8.1 Validation of the Database
Validation of the database was done by performing a range of tests, or by manually
reconciling suspect values. Data validation consisted of two steps: data screening and data
verification. Data screening used a series of validation routines to screen all the data for suspect
(questionable and erroneous) values. This task was accomplished by the computer program.
Data verification was done on a case-by-case decision on what to do with the suspect values -
retain them as valid, reject as invalid, or replace them with redundant valid values (if available).
This part is where judgment by a qualified person is needed. All the records were restored and no
data was left out as invalid. Table 5 shows the number of subsections available in the database.

25
Table 5. Data Available for Analysis
Number of subsections available for analysis
Year Flexible/Lime Stone Flexible/Gravel Composite/Lime Stone Composite/Gravel
2000 340 130 110 105
2001 300 165 114 95
2002 289 160 140 93
2003 291 173 140 100
2004 280 175 140 100
2005 250 175 129 100
2006 204 169 95 100
2007 175 155 67 99
2008 175 155 67 99
It is interesting to see how the number of subsections has changed with time. New sections
were added up to 2004, while at the same time some sections were lost due to either resurfacing
and/or rehabilitation of test sites. Resurfacing and/or rehabilitation were prompted when the test
sites deteriorated to a point warranting such an action. In about 5% of the cases, the test sites were
dropped when all subsections were wrongly crack sealed. The ODOT-ECS database contains all
the data, regardless of whether the test sites are available or dropped, and includes the remarks
column describing the reasons for dropping a test site.

26
9. ANALYSIS OF DATA
Analysis was performed in four parts as below:
1. Comparing performance of all treated and control subsection sections, regardless of
variables such as pavement type, type of aggregate in the surface layer and prior PCR of
treated subsections as shown in Figure 16,
2. Comparing performance of treated and control subsection sections based on the pavement
type, Figure 17, (regardless of aggregate type in surface layer and prior PCR),
3. Comparing performance of treated and control sections based on pavement type and
aggregate in surface layer, Figure 18, (regardless of prior PCR),
4. Comparing performance of treated and untreated pavements based on prior PCR (Figure
19).
Figure 16. Comparing Performance of all Data Regardless of Experimental Variables
All Data
Crack Sealed
(1784 PCR points)
Control
(1784 PCR points)

27
Figure 17. Comparing Performance Based on Pavement Type
Figure 18. Comparing Performance Based on Pavement and Aggregate Type
Flexible
1237 points
Crack Sealed
Control
Composite
547 points
Crack sealed
Control
Flexible
Lime stone
Crack sealed
Control
Gravel
Crack sealed
Control
Composite
Lime stone
Crack sealed
Control
Gravel
Crack sealed
Control

28
Figure 19. Comparing Performance Based on Pavement Type, Aggregate Type and Prior PCR
One of the analysis procedures adopted is testing for differences in average performance
gain. If one desires to know whether a crack treatment applied to a group X affects its
performance, a statistical test is applied to the experimental results to see whether one is justified
in concluding that there is a difference between the average performance gain of the treated
sections and the untreated (control) sections. The two alternative decisions that can be made are:
The average performance gain of a crack sealed section is greater than that of the control
section,
There is no evidence to believe that the average performance gain of a crack sealed section
is greater than that of the control section.
Flexible
Lime stone
Crack sealed
PCR
45-50
PCR
51-55
PCR
56-60
PCR
61-65
PCR
66-70…………
Control
Gravel
Crack sealed
Control
Composite
Lime stone
Crack sealed
Control
Gravel
Crack sealed
Control

29
The decision procedure is a very logical one. Suppose, one wishes to test whether the
subsections in group 1 that are crack sealed in year 2000 and the corresponding control subsections
have the same average performance gain, on the average, after five years. The performance gains
of the crack sealed and the control sections are tabulated and compared to test the significance of
the difference between them. The question that arises is „how large must this difference be in
order to conclude that the two types differ, or „is the observed difference significant?‟. This will
depend on several factors: the amount of variability within each group; the number of sections in
each group; and the confidence in the accuracy of the conclusion. Using the data stored in the
ODOT-ECS database, in conjunction with a statistical package, a comparative analysis was made.
For statistical inference, hypothesis testing (also called significance testing) was used in
comparing two formulations. Hypothesis testing allows an objective comparison of the two
formulations to be made on objective terms, with knowledge of the risks associated with reaching
the wrong conclusions.
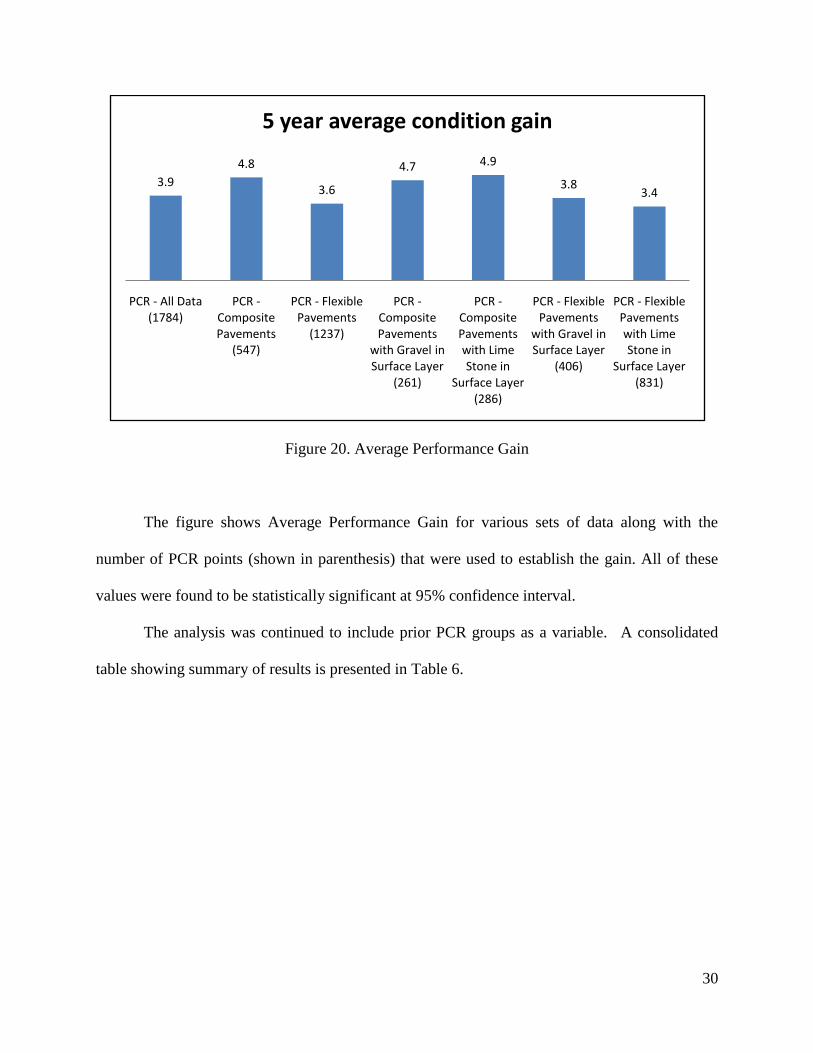
9.1 Average Performance Gain
The Average Performance Gain values were calculated for each pair of treated and control
subsection. The Average Performance Gain for all data was found to be 3.9. This indicates that,
crack sealed pavements, on a whole, result in improved performance on a 5-year cycle. The
difference was found to be statistically significant at 95% confidence interval. Figure 20
demonstrates the Average Performance Gain for the different pavement and aggregate types.
30
Figure 20. Average Performance Gain
The figure shows Average Performance Gain for various sets of data along with the
number of PCR points (shown in parenthesis) that were used to establish the gain. All of these
values were found to be statistically significant at 95% confidence interval.
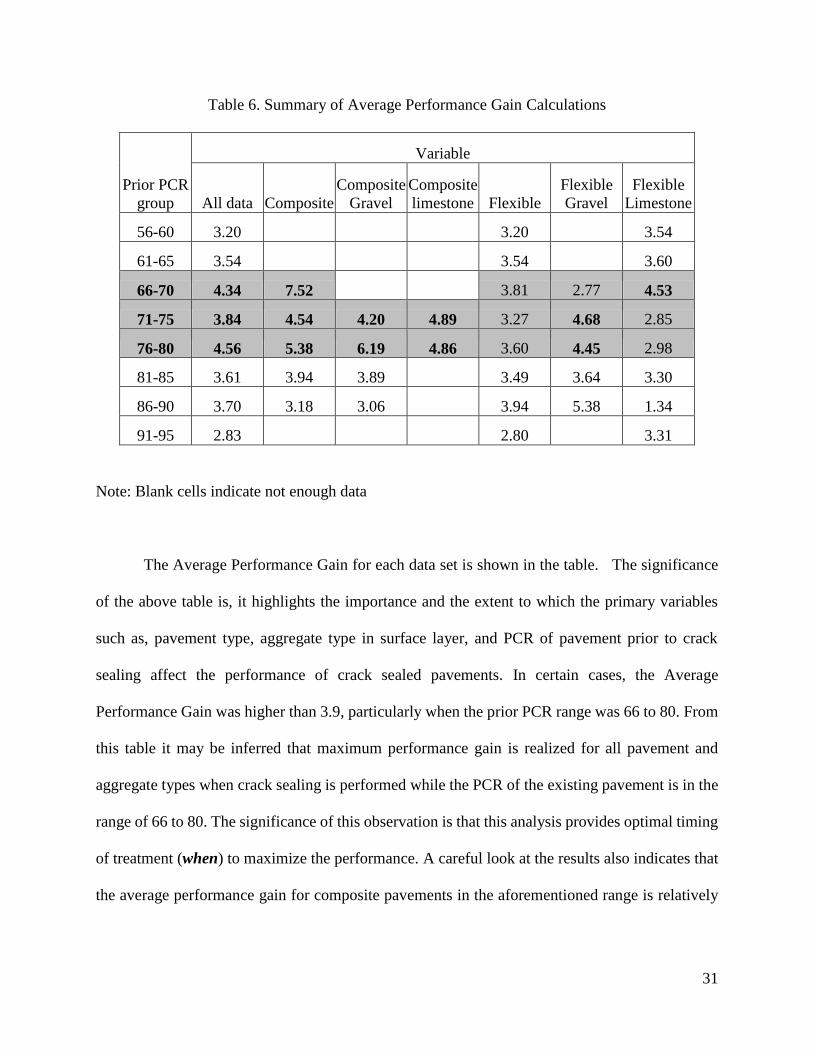
The analysis was continued to include prior PCR groups as a variable. A consolidated
table showing summary of results is presented in Table 6.
3.9
4.8
3.6
4.7 4.9
3.83.4
PCR - All Data (1784)
PCR -Composite Pavements
(547)
PCR - Flexible Pavements
(1237)
PCR -Composite Pavements
with Gravel in Surface Layer
(261)
PCR -Composite Pavements with Lime Stone in
Surface Layer (286)
PCR - Flexible Pavements
with Gravel in Surface Layer
(406)
PCR - Flexible Pavements with Lime Stone in
Surface Layer (831)
5 year average condition gain
31
Table 6. Summary of Average Performance Gain Calculations
Prior PCR
group
Variable
All data Composite
Composite
Gravel
Composite
limestone Flexible
Flexible
Gravel
Flexible
Limestone
56-60 3.20
3.20
3.54
61-65 3.54
3.54
3.60
66-70 4.34 7.52
3.81 2.77 4.53
71-75 3.84 4.54 4.20 4.89 3.27 4.68 2.85
76-80 4.56 5.38 6.19 4.86 3.60 4.45 2.98
81-85 3.61 3.94 3.89
3.49 3.64 3.30
86-90 3.70 3.18 3.06
3.94 5.38 1.34
91-95 2.83
2.80
3.31
Note: Blank cells indicate not enough data
The Average Performance Gain for each data set is shown in the table. The significance
of the above table is, it highlights the importance and the extent to which the primary variables
such as, pavement type, aggregate type in surface layer, and PCR of pavement prior to crack
sealing affect the performance of crack sealed pavements. In certain cases, the Average
Performance Gain was higher than 3.9, particularly when the prior PCR range was 66 to 80. From
this table it may be inferred that maximum performance gain is realized for all pavement and
aggregate types when crack sealing is performed while the PCR of the existing pavement is in the
range of 66 to 80. The significance of this observation is that this analysis provides optimal timing
of treatment (when) to maximize the performance. A careful look at the results also indicates that
the average performance gain for composite pavements in the aforementioned range is relatively
32
higher than that of flexible pavements – 5.81 vs. 3.56. Furthermore, it appears that pavements with
gravel in the surface layer display relatively higher performance gain.
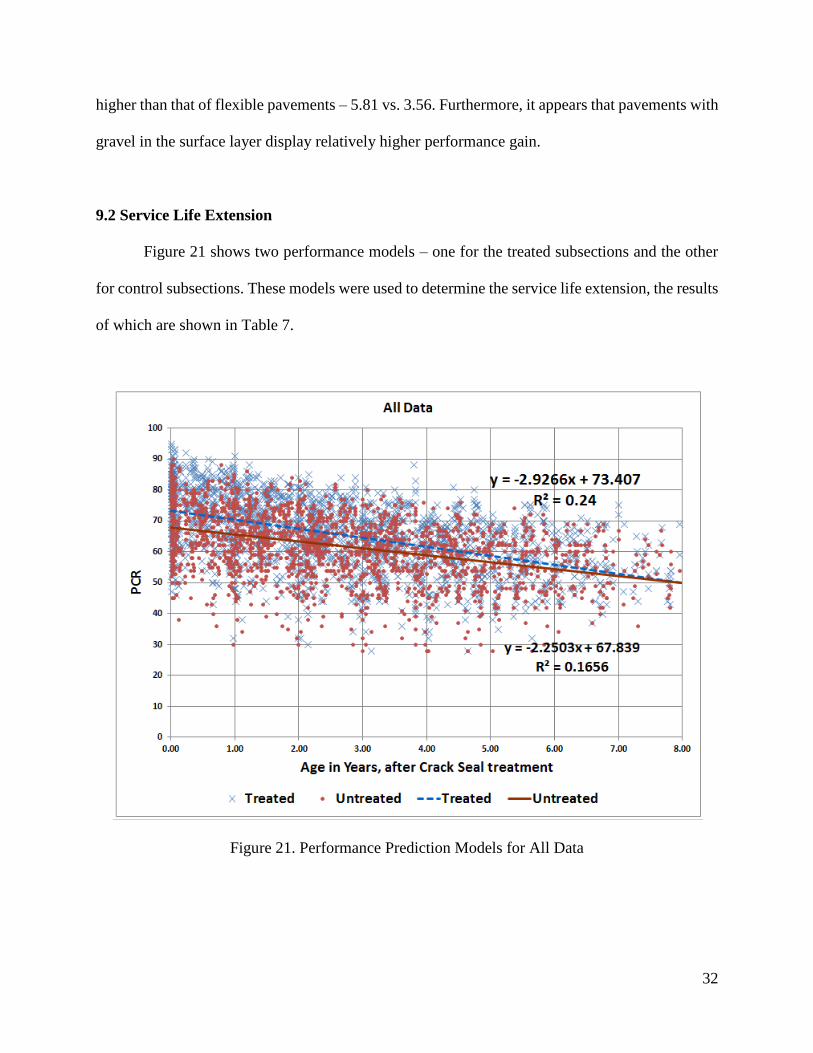
9.2 Service Life Extension
Figure 21 shows two performance models – one for the treated subsections and the other
for control subsections. These models were used to determine the service life extension, the results
of which are shown in Table 7.
Figure 21. Performance Prediction Models for All Data

33
Table 7. Service Life Extension
Threshold PCR Life of Crack sealed
Subsections
Life of Control
Subsections Additional Life, years
60 4.6 3.5 1.1
65 2.9 1.3 1.6
The figure demonstrates a wide scatter of points. This is because all the variables are
included in the analysis which makes the data heterogeneous. As a result, the R2 is low and not
significant. However, the results show a logical trend.
Similar trends are seen in the performance prediction models when the data was grouped
according to pavement types and aggregate type. These models are presented in Figures 22
through 27.

34
Figure 22. Performance Prediction Models for Composite Pavements

35
Figure 23. Performance Prediction Models for Flexible Pavements

36
Figure 24. Performance Prediction Models for Composite Pavements with Gravel in Surface Layer

37
Figure 25. Performance Prediction Models for Composite Pavements with Limestone in Surface
Layer

38
Figure 26. Performance Prediction Models for Flexible Pavements with Gravel in Surface Layer

39
Figure 27. Performance Prediction Models for Flexible Pavements with Limestone in Surface
Layer
Service life extensions for these models were calculated after parsing the data into Prior
PCR Groups. Service life extension was calculated corresponding to two threshold PCRs,
namely PCR=60 and PCR=65. These results are presented in tables 8 and 9 respectively.

40
Table 8. Summary of Service Life Extension (in years) Calculations corresponding to Threshold
PCR = 60
Prior
PCR
group
Variable
All
data Composite
Composite
Gravel
Composite
limestone Flexible
Flexible
Gravel
Flexible
Limestone
66-70 1.85 2.71
1.83 1.47 2.01
71-75 0.55
0.08 0.00 0.43
0.62
76-80 0.63 0.44 2.75
0.52 0.74 0.39
81-85 0.83 0.67
1.18 1.23 1.05
86-90 0.14
91-95
96-100 0.14
0.14
0.26
Note: Shaded area indicates not enough data to develop performance prediction model
Table 9. Summary of Service Life Extension (in years) Calculations corresponding to Threshold
PCR = 65
Prior
PCR
group
Variable
All
data Composite
Composite
Gravel
Composite
limestone Flexible
Flexible
Gravel
Flexible
Limestone
66-70 2.11 3.66
2.01 1.28 2.48
71-75 1.04 0.79 1.00 0.68 0.98 0.86 1.04
76-80 1.27 1.35 2.98 0.61 0.99 0.94 1.05
81-85 1.02 0.86
1.29 1.42 1.08
86-90 0.32
0.28
91-95
0.39
96-100 0.16
0.16
0.33
Note: Shaded area indicates not enough data to develop performance prediction model
The analysis of performance based on the average performance gain, as shown in Table 6,
revealed that maximum performance can be achieved by treating pavements when their PCR is in
the range of 66-80. A careful study of service life extensions estimated as in Tables 8 and 9 shows
that maximum service life extension can be obtained for a narrow PCR range of 66-70 instead of

41
66-80. The R2 value for both types of pavement in the prior PCR group of 66-80 was found to be
0.33 (for treated) and 0.24 (for untreated). The performance models developed for the sections
treated in the prior PCR group of 66-70 show a better fit with R2 value equal to 0.49 (for treated)
and 0.44 (for untreated).
9.3 Results in Summary
In summary, the analysis of data lead to objective evaluation of effectiveness of crack seal
practices and included the following:
Evaluation of the effect of crack sealing on pavement serviceability,
Development of deterioration curves,
Estimation of the effect of crack sealing on remaining service life, and
Identification of optimal timing of treatment
10. ADDITIONAL PERFORMANCE INDICATORS TO EVALUATE THE
EFFECTIVENESS OF CRACK SEALING
Ohio‟s PCR is a composite index derived as a function of several individual distresses.
Individual distresses, listed according to pavement type, are rated based on their severity and
extent. Distress weights and deduct values are used to generate PCR on a 0 to 100 scale. Figures
28 and 29 depict the list of distresses and the method of obtaining PCR for flexible and composite
pavements.

42
Figure 28. ODOT‟s Pavement Condition Rating Form for Flexible Pavements
Figure 29. ODOT‟s Pavement Condition Rating Form for Composite Pavements

43
Although the intent of the present study was to determine the effect of crack sealing on
overall pavement condition, it can be argued that crack sealing is a local treatment at the crack
locations and this treatment may not have influence on distresses such as rutting, bleeding,
settlements, pumping and patching to name a few. Hence it was thought that analyzing the data
with respect to distresses related to cracking of pavements may isolate the distresses and provide
better representation of the effect of crack sealing. The review panel suggested development of
additional performance indicators such as:
1. PCR excluding C/S Deficiency (PCR – CS)
2. Cracking Distress Value (CDV)
3. Cracking Distress excluding Random cracking (CDV - random cracking)
4. Cracking Distress including Raveling (CDV + raveling)
5. Potholes + Patching
Crack seal deficiency distress carries a distress weight equal to five points. (PCR – CS) is
obtained by excluding this distress. In doing so, the maximum points a pavement can achieve is
95.
Cracking Deduct Value (CDV) considers only the crack related distresses for both flexible
and composite pavements. Tables 10 and 11 list the distresses considered for developing CDV.

44
Table 10. List of Cracking Distresses in Flexible Pavements
Distress name Distress
weight Severity Weight Extent Weight
Low Medium High Occasional Frequent Extensive
C/S Deficiency 5 1 1 1 0.5 0.8 1
Whl-Trk Crack 15 0.4 0.7 1 0.5 0.7 1
Blk&Trv Crack 10 0.4 0.7 1 0.5 0.7 1
Long. Jt. Crack 5 0.4 0.7 1 0.5 0.7 1
Edge Crack 5 0.4 0.7 1 0.5 0.7 1
Random Crack 5 0.4 0.7 1 0.5 0.7 1
Table 11. List of Cracking Distresses in Composite Pavements
Distress name Distress
weight Severity Weight Extent Weight
Low Medium High Occasional Frequent Extensive
Trv. Crack (Unjointed
base) 20 0.2 0.6 1 0.4 0.8 1
Refl. Crack (Jointed
base) 12 0.2 0.6 1 0.4 0.8 1
Int. Trv. Crack (Jointed
base) 8 0.2 0.6 1 0.4 0.8 1
Long Crack 5 0.2 0.6 1 0.4 0.8 1
C/S Deficiency 5 1 1 1 0.5 0.8 1
CDV is calculated as:
The maximum deduct points are 45 and 30 for flexible and composite pavements
respectively. Note that the composite pavement has distresses related to both jointed base and
unjointed base types. Appropriate distress weights were considered during calculations based on

45
the type of composite pavement. Similar to CDV, other indicators were calculated by using the
respective distress weights. Table 12 shows the maximum deduct points for each indicator.
Table 12. Maximum deduct points for each indicator
Indicator
Maximum Deduct
Points
Normalized Maximum
Deduct Points
Composite Flexible Composite Flexible
PCR 100 100 100 100
PCR-C/S DEF. 95 95 100 100
CDV 50 45 100 100
CDV - Random NA 40 100 100
CDV + Raveling 40 55 100 100
Potholes + Patching 5 15 100 100
Unlike PCR which operates on 0 to 100 scale, the additional indicators have a different
scale. For a realistic comparison among them, these values were normalized to 100. The results
thus obtained are presented in Figures 30 through 34. Non-normalized values are also indicated in
these figures.

46
Figure 30. Effectiveness Based on (PCR – CS Deficiency)

47
Figure 31. Effectiveness Based on CDV

48
Figure 32. Effectiveness Based on CDV + Raveling

49
Note: Only flexible pavements are presented in above graph as random cracking distress is not
associated with composite pavements.
Figure 33. Effectiveness Based on (CDV – Random) Cracking

50
Figure 34. Effectiveness Based on Potholes and Patching
These figures indicate that crack sealing is an effective pavement preventive maintenance
treatment. All the different indicators show a similar pattern of variation in effectiveness of crack
sealing.
11. COST-EFFECTIVENESS OF CRACK SEALING
The benefits of crack sealing in this study, observed in terms of increase in average
performance gain and extension of pavement service life, has been well-documented in the
previous sections. The average performance gain of pavements in the PCR range 66-80 based on
pavement type (from Table 6) is 4.2, 5.8, and 3.6 years for all pavement types, composite
pavements, and flexible pavements respectively. And the service life of pavements based on
pavement type in the same PCR range calculated at two different PCR threshold points namely,
PCR=60 and PCR=65 is presented in Table 13.

51
Table 13. Service Life of Pavements in PCR Range 66-80
Threshold PCR=60 Threshold PCR=65
All
Pavements
Composite
Pavements
Flexible
Pavements
All
Pavements
Composite
Pavements
Flexible
Pavements
Life of Crack
sealed
Subsections
4.87 7.70 3.14 3.25 5.82 1.81
Life of Control
Subsections 3.79 7.46 2.09 1.56 4.55 0.29
Extension of
Service Life,
years
1.08 0.23 1.06 1.69 1.27 1.52
Consequentially, the question therefore is how do decision-makers use these observations
to decide if application of crack seal as a strategy, in concert with time, is cost-effective?
Therefore, a comparative cost analysis, using a common metric such as the Net Present Value
(NPV) is performed. Net Present Value is the economic indicator of choice. The formula used to
calculate NPV is:
Where:
t – time at which cash is spent, N – total time under consideration, r – discount rate (4%), Ct –
amount spent at time t
The two scenarios considered are namely, a) crack seal now and apply chip seal after a
certain period of time and b) Do nothing now but apply chip seal after a given number of years.
From ODOT‟s 2009 and 2010 construction records, the cost per lane mile for crack seal and chip
seal is known to be $2,504 and $10,565 respectively. The results of the cost analysis are presented
in Figures 35 through 40.

52
Figure 35. Cost-effectiveness of Two Alternate Treatments Based on Service Life for All
Pavement Types
Figure 36. Cost-effectiveness of Two Alternate Treatments Based on Service Life for Composite
Pavements
-10000
-5000
0
5000
10000
15000
0 1 2 3 3.8 4 4.9 5 6 7 8 NPV
Co
st (
$)
PCR Range 66-80, Threshold PCR=60, Analysis Period=8 Years, All Pavement Types
Scenario 1: Crackseal now, apply chipseal 4.9 years later
Scenario 2: Do nothing now, apply chipseal 3.8 years later
-5000
0
5000
10000
15000
0 1 2 3 4.0 5 6.0 7 7.5 7.7 8 NPV
Co
st (
$)
PCR Range 66-80, Threshold PCR=60, Analysis Period=8 Years, Composite Pavements
Scenario 1: Crackseal now, apply chipseal 7.7 years later
Scenario 2: Do nothing now, apply chipseal 7.5 years later

53
Figure 37. Cost-effectiveness of Two Alternate Treatments Based on Service Life for Flexible
Pavements
Figure 38. Cost-effectiveness of Two Alternate Treatments Based on Service Life for All
Pavement Types
-15000
-10000
-5000
0
5000
10000
15000
0 1 2 2.1 3.0 3.1 4.0 5 6 7 8 NPV
Co
st (
$)
PCR Range 66-80, Threshold PCR=60, Analysis Period=8 Years, Flexible Pavements
Scenario 1: Crackseal now, apply chipseal 3.1 years later
Scenario 2: Do nothing now, apply chipseal 2.1 years later
-15000
-10000
-5000
0
5000
10000
15000
0 1 1.6 2 3.0 3.3 4.0 5 6 7 8 NPV
Co
st (
$)
PCR Range 66-80, Threshold PCR=65, Analysis Period=8 Years, All Pavement Types
Scenario 1: Crackseal now, apply chipseal 3.3 years later
Scenario 2: Do nothing now, apply chipseal 1.6 years later

54
Figure 39. Cost-effectiveness of Two Alternate Treatments Based on Service Life for Composite
Pavements
Figure 40. Cost-effectiveness of Two Alternate Treatments Based on Service Life for Flexible
Pavements
-10000
-5000
0
5000
10000
15000
0 1 2 3 4.0 4.5 5.0 5.8 6 7 8 NPV
Co
st (
$)
PCR Range 66-80, Threshold PCR=65, Analysis Period=8 Years, Composite Pavements
Scenario 1: Crackseal now, apply chipseal 5.8 years later
Scenario 2: Do nothing now, apply chipseal 4.5 years later
-15000
-10000
-5000
0
5000
10000
15000
0 0.3 1 1.8 2.0 3 4.0 5 6 7 8 NPV
Co
st (
$)
PCR Range 66-80, Threshold PCR=65, Analysis Period=8 Years, Flexible Pavements
Scenario 1: Crackseal now, apply chipseal 1.8 years later
Scenario 2: Do nothing now, apply chipseal 0.3 years later
55
As can be seen from the above figures, crack sealing turns out to be relatively ineffective in
the PCR range of 66-80 for service life estimates calculated at threshold PCR of 60 and 65 for all
conditions except one – illustrated in Figure 38 – where there is a marginal gain in using crack seal
treatment.
In summary, as mentioned earlier, there is average performance gain (in terms of Pavement
Condition Rating) because of crack seal treatment for all pavement types in the PCR range of
66-80. However, a comparative analysis of two different treatment scenarios, based on NPV
estimates, calculated using the service life of treated and untreated pavement data belonging to the
PCR range of 66-80, by and large does not indicate crack seal to be a cost-effective strategy.
To understand this contradiction, the researchers narrowed the PCR range to 66-70 in
order to evaluate the cost-effectiveness of crack seal based on NPV estimates determined using the
service life of treated and untreated pavements.
The service life estimates of treated and untreated pavements based on pavement type in
the PCR range of 66-70 for two PCR thresholds namely, PCR=60 and PCR=65 is presented in
Table 14. The shaded boxes in the table is intended to indicate that the service life of control
subsections could not be determined using the available data. Thus, the cost-effectiveness of crack
sealing is evaluated for service life estimates calculated at a threshold PCR of 60 for all pavement
types and a threshold PCR of 65 for composite pavements.
56
Table 14. Service Life of Pavements in PCR Range 66-70
Threshold PCR=60 Threshold PCR=65
All
Pavements
Composite
Pavements
Flexible
Pavements
All
Pavements
Composite
Pavements
Flexible
Pavements
Life of Crack
sealed
Subsections
3.12 7.44 2.74 1.69 5.07 1.25
Life of Control
Subsections 1.27 4.75 0.91
1.42
Additional
Life, years 1.85 2.69 1.83 3.65
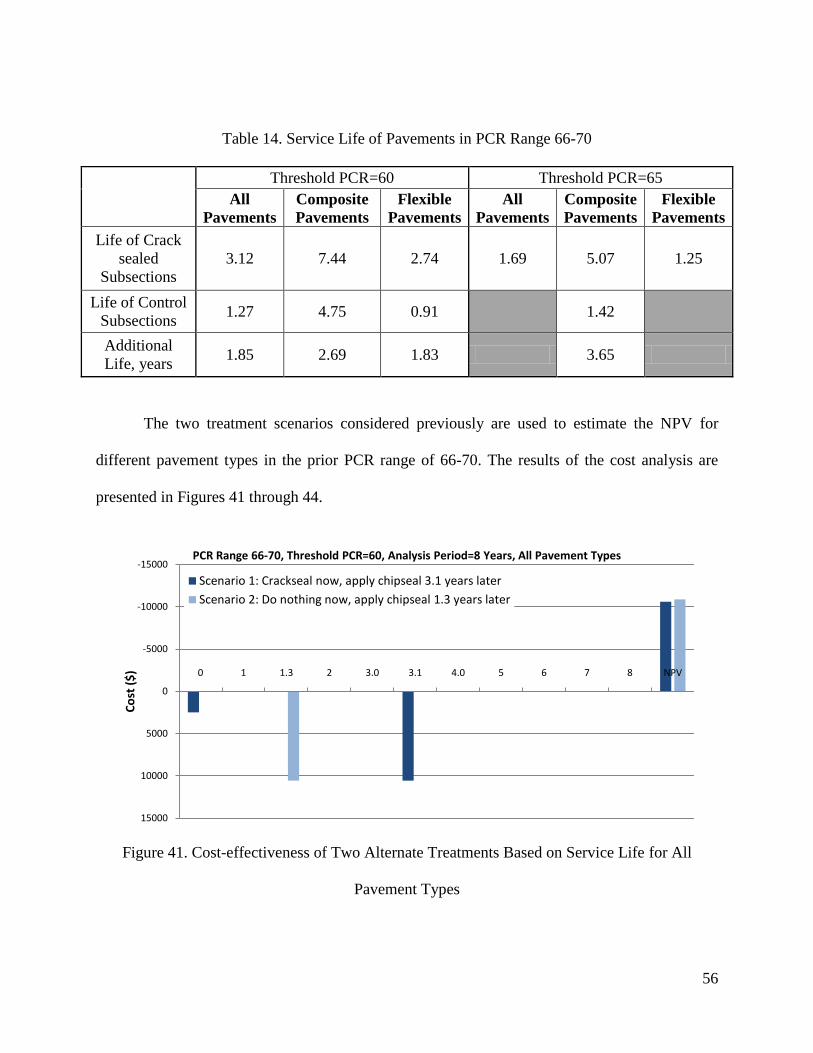
The two treatment scenarios considered previously are used to estimate the NPV for
different pavement types in the prior PCR range of 66-70. The results of the cost analysis are
presented in Figures 41 through 44.
Figure 41. Cost-effectiveness of Two Alternate Treatments Based on Service Life for All
Pavement Types
-15000
-10000
-5000
0
5000
10000
15000
0 1 1.3 2 3.0 3.1 4.0 5 6 7 8 NPV
Co
st (
$)
PCR Range 66-70, Threshold PCR=60, Analysis Period=8 Years, All Pavement Types
Scenario 1: Crackseal now, apply chipseal 3.1 years later
Scenario 2: Do nothing now, apply chipseal 1.3 years later

57
Figure 42. Cost-effectiveness of Two Alternate Treatments Based on Service Life for Composite
Pavements
Figure 43. Cost-effectiveness of Two Alternate Treatments Based on Service Life for Flexible
Pavements
-10000
-5000
0
5000
10000
15000
0 1 2 3 4.0 4.8 5.0 6 7 7.4 8 NPV
Co
st (
$)
PCR Range 66-70, Threshold PCR=60, Analysis Period=8 Years, Composite Pavements
Scenario 1: Crackseal now, apply chipseal 7.4 years later
Scenario 2: Do nothing now, apply chipseal 4.8 years later
-15000
-10000
-5000
0
5000
10000
15000
0 0.9 1 2 2.7 3 4.0 5 6 7 8 NPV
Co
st (
$)
PCR Range 66-70, Threshold PCR=60, Analysis Period=8 Years, Flexible Pavements
Scenario 1: Crackseal now, apply chipseal 2.7 years later
Scenario 2: Do nothing now, apply chipseal 0.9 years later
58
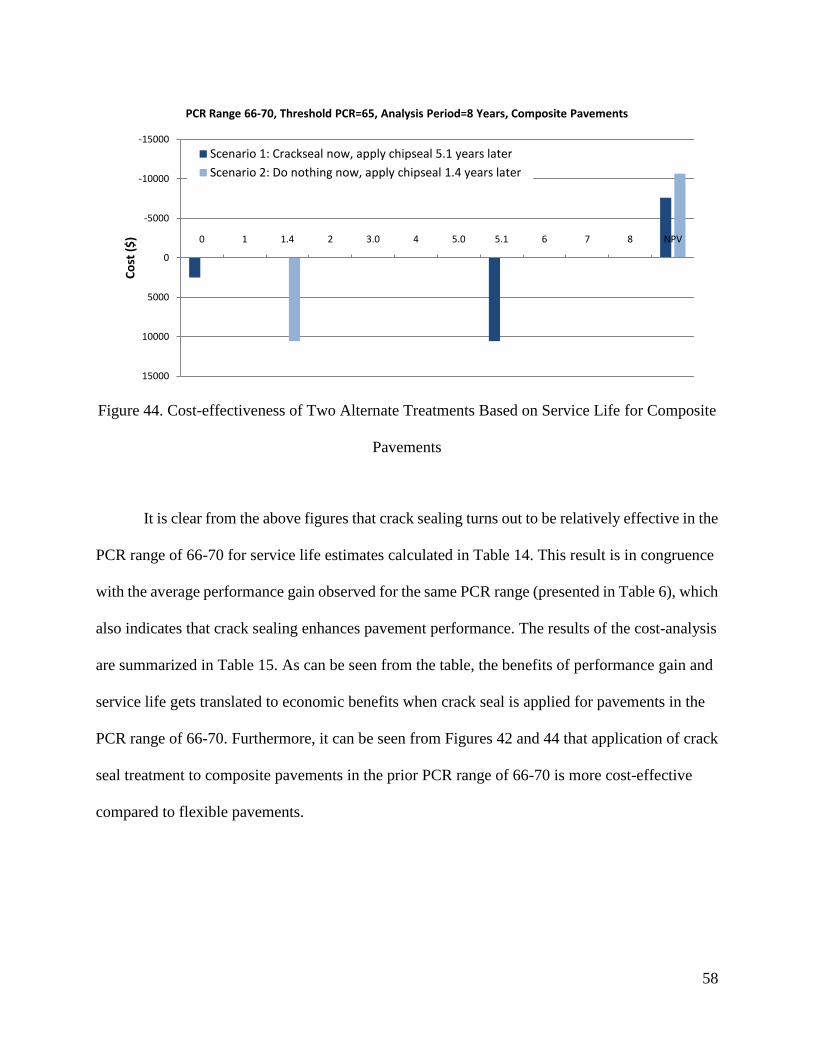
Figure 44. Cost-effectiveness of Two Alternate Treatments Based on Service Life for Composite
Pavements
It is clear from the above figures that crack sealing turns out to be relatively effective in the
PCR range of 66-70 for service life estimates calculated in Table 14. This result is in congruence
with the average performance gain observed for the same PCR range (presented in Table 6), which
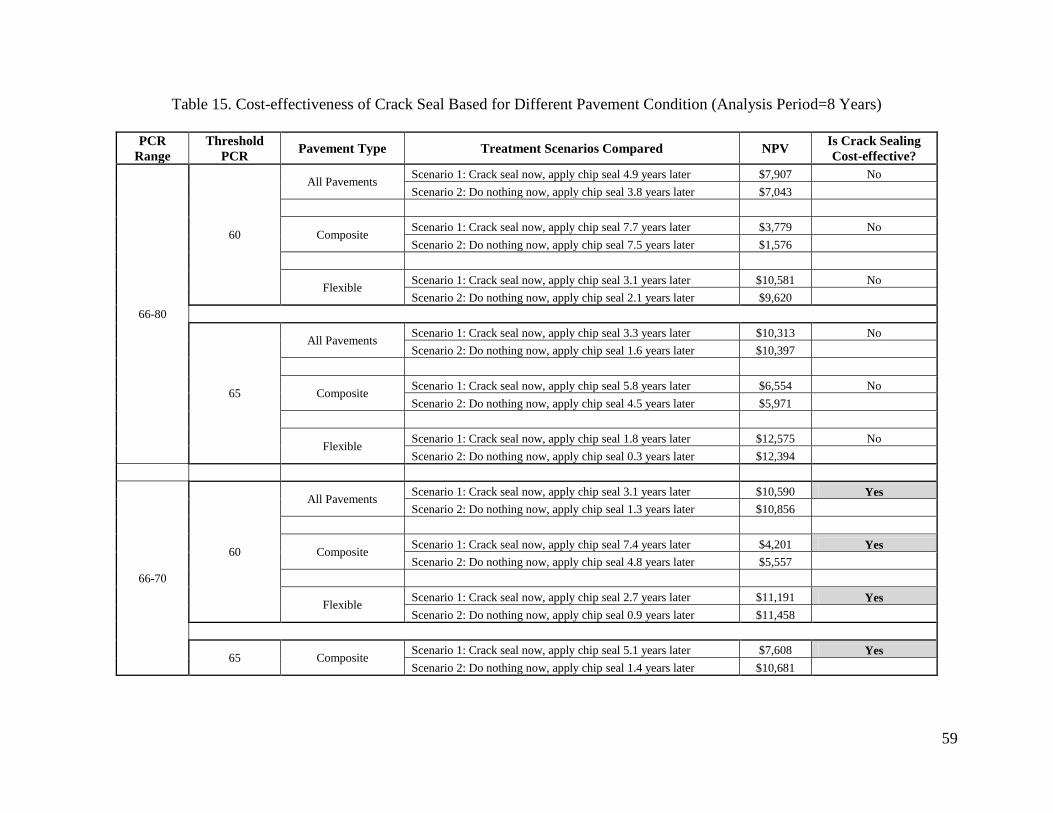
also indicates that crack sealing enhances pavement performance. The results of the cost-analysis
are summarized in Table 15. As can be seen from the table, the benefits of performance gain and
service life gets translated to economic benefits when crack seal is applied for pavements in the
PCR range of 66-70. Furthermore, it can be seen from Figures 42 and 44 that application of crack
seal treatment to composite pavements in the prior PCR range of 66-70 is more cost-effective
compared to flexible pavements.
-15000
-10000
-5000
0
5000
10000
15000
0 1 1.4 2 3.0 4 5.0 5.1 6 7 8 NPV
Co
st (
$)
PCR Range 66-70, Threshold PCR=65, Analysis Period=8 Years, Composite Pavements
Scenario 1: Crackseal now, apply chipseal 5.1 years later
Scenario 2: Do nothing now, apply chipseal 1.4 years later
59
Table 15. Cost-effectiveness of Crack Seal Based for Different Pavement Condition (Analysis Period=8 Years)
PCR
Range
Threshold
PCR Pavement Type Treatment Scenarios Compared NPV
Is Crack Sealing
Cost-effective?
66-80
60
All Pavements Scenario 1: Crack seal now, apply chip seal 4.9 years later $7,907 No
Scenario 2: Do nothing now, apply chip seal 3.8 years later $7,043
Composite Scenario 1: Crack seal now, apply chip seal 7.7 years later $3,779 No
Scenario 2: Do nothing now, apply chip seal 7.5 years later $1,576
Flexible Scenario 1: Crack seal now, apply chip seal 3.1 years later $10,581 No
Scenario 2: Do nothing now, apply chip seal 2.1 years later $9,620
65
All Pavements Scenario 1: Crack seal now, apply chip seal 3.3 years later $10,313 No
Scenario 2: Do nothing now, apply chip seal 1.6 years later $10,397
Composite Scenario 1: Crack seal now, apply chip seal 5.8 years later $6,554 No
Scenario 2: Do nothing now, apply chip seal 4.5 years later $5,971
Flexible Scenario 1: Crack seal now, apply chip seal 1.8 years later $12,575 No
Scenario 2: Do nothing now, apply chip seal 0.3 years later $12,394
66-70
60
All Pavements Scenario 1: Crack seal now, apply chip seal 3.1 years later $10,590 Yes
Scenario 2: Do nothing now, apply chip seal 1.3 years later $10,856
Composite Scenario 1: Crack seal now, apply chip seal 7.4 years later $4,201 Yes
Scenario 2: Do nothing now, apply chip seal 4.8 years later $5,557
Flexible Scenario 1: Crack seal now, apply chip seal 2.7 years later $11,191 Yes
Scenario 2: Do nothing now, apply chip seal 0.9 years later $11,458
65 Composite Scenario 1: Crack seal now, apply chip seal 5.1 years later $7,608 Yes
Scenario 2: Do nothing now, apply chip seal 1.4 years later $10,681

60
12. SUMMARY AND CONCLUSIONS
Sealing of cracks in asphalt surfaced pavements has long been one of the widely practiced
pavement maintenance strategies by the highway agencies. Crack sealing is performed with
intent to reduce water infiltration, prevent pumping and avoid the need for premature base and
pavement repair. A successful crack sealing project can result in numerous benefits such as -
improved pavement condition, increased safety, extended service life, reduced maintenance and
rehabilitation needs and overall, lower life cycle costs. A host of factors namely: sealing materials,
placement techniques, equipment, pavement types and condition, type and severity of crack
sealed, regional environmental and traffic conditions, evaluation procedures and so on are known
to directly influence the level of success that can be attained in a crack sealing project. These
variables often act individually or collectively to affect the outcome of a crack seal project.
Despite the intended benefits, crack sealing may also affect the pavement in many ways like,
tracking of sealing material by tire action, reduced skid resistance, a rougher pavement etc.
Crack sealing is beneficial if pavement life is increased while maintaining serviceability.
A systematic evaluation will help to assess the effectiveness of an agency‟s current crack
sealing practices and will provide necessary data to fine tune the prevailing practice by identifying
specific areas that need improvement. The perceived benefits of such investigation include better
utilization of public funds and greater return on the investment.
Realizing the importance of such an investigation, in 2000, the Ohio Department of Transportation
initiated a 10-year study to „statistically verify the effectiveness of its current force account crack
sealing program on pavement condition and life‟. The primary objective of the study was to
develop a field experiment that would enable ODOT to collect long-term performance data. By

61
analyzing this long term performance data, it was desired that the study will resolve the following
key issues:
Do existing crack sealing practices within ODOT enhance pavement performance?
If so, what is the optimum timing for treatment?
Does crack sealing extend pavement life?
Does crack sealing provide cost benefit? If so, to what extent?
Previous studies carried out by several federal and state agencies have attempted to address
similar concerns. However, no consensus appears to exist about the effectiveness of crack sealing
practices. In comparison, a cursory look at ODOT‟s existing crack sealing practices revealed the
following information:
A range of materials and methods are in use for crack sealing.
The choice of a specific material/method depends on the county manager‟s
understanding of the historical performance of various materials, pavement type
(flexible or composite), regional conditions, availability of operating funds, and so on.
The need for crack sealing is not an issue; instead, the primary concern is to investigate
and document the effectiveness of crack sealing with respect to:
(i) economic benefits,
(ii) maintaining and/or improving serviceability, and
(iii) extending pavement life.
During the period 2000 through 2002, ODOT set up over 700 test sections, each 1000 feet
long, in asphalt surfaced pavements. The test sections were treated by crack sealing materials at
various time periods reflecting varied pavement conditions. Control sections were set up in

62
adjacent areas which served as „do-nothing‟ treatments. The county managers were provided
with guidelines describing the pavement limits, crack sealing schedule, required documentation
and reporting. All these tasks were well coordinated by the Office of Pavement Engineering and
ODOT‟s district and county offices.
At the beginning of the study, a survey was conducted to summarize the prevailing crack
sealing practices in Ohio. The district and county managers provided responses to a series of
questions that assisted in summarizing the current crack sealing practices. The survey revealed
there is a wide variation in the pavement condition prior to crack sealing. Additionally, many
officials, based on their observation of historical performance of crack sealed pavements,
recognized pavement type and the type of aggregate used in the surface layer as key factors
affecting the performance of treated pavements. The field experiment was carefully designed to
establish test sections that included the variables namely:
Pavement type (flexible and composite),
Type of aggregate in the surface layer (lime stone and gravel), and
Pavement condition prior to crack sealing.
The test sections were surveyed annually to record their pavement condition ratings from
the time prior to crack sealing and for a period of five to nine years after sealing, depending on the
longevity of the test sections. Pavement condition survey was conducted in accordance with
ODOT‟s guidelines for pavement condition rating, by visually observing surface distresses and
recording their severity and extent. One technician conducted condition survey of all the sections
throughout the life of the study, thus eliminating differences in judgment between raters.
An interactive database was developed for (i) data gathering, (ii) data storing, (iii) data
processing, and (iv) data analysis. A vast amount of data was acquired that included:

63
PCR data for each year, for each of the 1000 ft long section, including individual
distress data,
Crack seal information: date of treatment, type, amount and cost of material,
application procedure, pavement surface preparation procedure, environmental
condition during crack treatment, and
Section description: pavement type, type of aggregate in surface layer, functional
classification, number of lanes.
In 2008, when the data collection process was completed, a total of 387 treated sections and
corresponding control sections became available for the analysis of effectiveness of crack sealing.
A sum of 1784 PCR points were available for the performance analysis of the treated and control
sections.
As a first step in the analysis, all the PCR points were plotted relative to their
corresponding age. This task resulted in the development of two performance curves – one for
the treated and one for the control sections. The curves were used to derive two performance
indicators namely:
Average performance gain due to crack sealing, and
Service life comparison of treated and control sections.
The difference in PCR values of the treated and control section for each test section was
calculated for each year, up to five years. The average of these differences was denoted as
„average performance gain‟. The average performance gain of all the crack sealed pavements,
regardless of pavement type and prior pavement condition, ranged from 2 to 7 PCR points with an
overall average of 3.9.

64
This meant that, the crack sealed pavements have, in general, performed better than the
untreated sections on a 5-year life cycle. The difference was found to be statistically significant at
95% confidence interval.
Next, the performance models were used to determine the service life of the pavements.
The treated pavements were found to have an additional service life of 1.1 years when compared
using a threshold PCR of 60.
With a view to find the effect of experimental variables on the performance of treated
pavements, the database was sorted out according to variables namely, pavement type (flexible
and composite), aggregate type (lime stone and gravel), and the pavement condition in terms of
prior PCR groups. Seven PCR groups were created on a 5-point range starting from 55 to 60 till
85 to 90.
The analysis – in terms of average performance gain – showed conclusive evidence that
crack sealing is an effective preventive maintenance technique. The performance can be
maximized by treating flexible as well as composite pavements whose PCR is in the range of 66 to
80. It is also interesting to see that performance gain is relatively higher in the case of composite
pavements.
ODOT‟s PCR is a composite index of surface distresses that include cracking and
non-cracking distresses such as raveling, rutting, patching, bleeding and many distresses. Crack
sealing is an activity performed only at the cracks. This maintenance activity will have little to no
effect on the progression of non-cracking distresses. A question arises here about the efficacy of
using PCR to evaluate the effectiveness of crack sealing. To address this question, it was decided
to isolate cracking distresses and further evaluate the effectiveness of crack sealing on pavement

65
performance. Based on the suggestion from ODOT engineers, the following five additional
performance indicators were created:
1. PCR excluding C/S Deficiency
2. Cracking Distress
3. Cracking Distress excluding Random cracking
4. Cracking Distress including Raveling
5. Potholes + Patching
Interestingly, each analysis indicated a similar trend and reaffirmed the effectiveness of
crack sealing of composite pavements with a PCR of 66 to 80.
In summary, the results presented in this study and conclusions made thereof are based on
a large amount of data. The 10-year field experiment provided a unique opportunity to
investigate the long-term performance of nearly 700 test sections. The field experiment was
extensive, well designed, coordinated and documented. The data was analyzed to develop
statistically conclusive evidence about the effectiveness of crack sealing on pavement
performance and the influence of experimental variables.
As mentioned above, it has been observed in this study that the benefits of crack sealing
have resulted in increase in average performance gain and extension of pavement service life.
However, the question is how do decision-makers decide – from these two observations – if
application of crack seal as a strategy, in concert with time, is cost-effective? The cost analysis of
two pavement maintenance treatment alternatives, using a common metric such as the Net Present
Value, presented in Section 11, illustrates that crack sealing, as a maintenance strategy, is
economically viable for pavements in the prior PCR range of 66-70.

66
In conclusion, the results of the study highlighted that crack sealing is an effective
treatment in general. Regardless of pavement type, aggregate type used in the surface layer, and
the prior pavement condition, crack sealing always results in performance gain. However, the
maximum performance gain can be attained when the prior PCR is in the range of 66-80, and the
cost-effectiveness is achieved when the prior PCR is in the range of 66-70. From the
decision-maker‟s perspective, it becomes difficult to implement the crack sealing program for
such a narrow range. On the contrary, while the crack sealing program for the prior PCR range of
66-80 is not entirely cost-effective, it is practically easier to implement the program which also
results in performance gain.
13. RECOMMENDATIONS
From a practical point of view, it is hereby recommended that ODOT develops a policy to
allow crack sealing as a strategy for pavement preventive maintenance for all pavements in the
prior PCR range of 66 to 80.

67
REFERENCES
1. Rajagopal A.S. and Minkarah, I. A, “Effectiveness of Crack Sealing on Pavement
Serviceability and Life”, Report No. FHWA/OH-2003/009, Ohio Department of
Transportation, June 2003.