Embed Size (px)
Citation preview

Effectiveness of CEOs in the Public Sector: Evidence from Further Education Institutions
Jenifer Ruiz-Valenzuela, Camille Terrier, Clémentine Van Effenterre
Briefing Note 005
December 2017
BRIEFING NOTE

The Centre for Vocational Education Research (CVER) is an independent research centre funded by the UK Department for Education. CVER brings together four partners: the LSE Centre for Economic Performance; University of Sheffield; National Institute of Economic and Social Research and London Economics.
Any views expressed are those of the authors, and do not represent the views of DfE. For more details on the Centre, go to cver.lse.ac.uk
Authors:
Jenifer Ruiz-Valenzuela, Centre for Economic Performance (CEP) and Centre for Vocational Education Research (CVER), London School of Economics (LSE). Email: [email protected]
Camille Terrier, Massachusetts Institute of Technology, School Effectiveness and Inequality Initiative and CEP and CVER (LSE). Email: [email protected]
Clémentine Van Effenterre, Harvard Kennedy School (WAPPP); CEP and CVER (LSE). Email: [email protected]
Acknowledgements: We are grateful to Sandra McNally, Bev Robinson and Alison Wolf for comments on earlier versions of this briefing note, and to Charlynne Pullen for providing us with access to the SIR dataset. Nathalie Baker provided superb research assistance for this project.
Published by: Centre for Vocational Educational Research London School of Economics & Political Science Houghton Street London WC2A 2AE
All rights reserved. No part of this publication may be reproduced, stored in a retrieval system or transmitted in any form or by any means without the prior permission in writing of the publisher nor be issued to the public or circulated in any form other than that in which it is published.
Requests for permission to reproduce any article or part of the Briefing Paper should be sent to the editor at the above address.
© J. Ruiz-Valenzuela, C. Terrier, C. Van Effenterre, December 2017

Executive summary
The understudied role of further education. Most policy debates addressing educationalissues focus on primary and secondary education. When higher education is considered, it isoften through the narrow angle of university attendance and completion. Yet, most students donot follow an academic track, and most importantly, most of them do not go to university. InEngland, about 60 per cent of a typical cohort enrolls in post-compulsory institutions qualifiedas “further education colleges”. Most of these students attend general/tertiary further educationcolleges, which provide some form of vocational or technical training. For various reasons,this sector has historically been under-considered by academics and policy makers alike. Yet,to have a fuller picture of the education system, studying vocational or technical colleges alongwith academic colleges is particularly important because the students the former colleges caterfor have lower educational attainment, come from more disadvantaged backgrounds, and aremost at risk of dropping out from the education system. Further education is therefore a keydeterminant of England’s educational level, social mobility, unemployment, and other labourmarket indicators. This briefing note fills some of the knowledge gap by investigating the roleof principals in further education colleges.
Political context. This study comes along with a growing interest from policy makers invocational and technical education. Following the 2010 election of the British Coalition Gov-ernment and the Wolf Review of 14-19 Vocational Qualifications (Wolf, 2011), the Governmentstarted to give more autonomy to further education colleges. One of the objectives was to freethem from central government control by reinforcing the role of college governors in settingthe strategic direction of the colleges and selecting the best principal (Department for BusinessInnovation and Skills, 2013). More recently, the post-16 skills plan of the Department for Ed-ucation aims at re-structuring technical education. This new educational context highlights theneed for strong leadership in the post-16 education sector, and for more research in this area.
Data and methodology. This briefing note uses a novel panel dataset of principals in FEinstitutions in England over the period 2003 to 2015, and combines it with data on educa-tion performance coming from the Individualised Learner Records (ILR), the National PupilDatabase (NPD) and the Higher Education Statistics Agency (HESA). It also exploits the in-formation contained in the Staff Individualised Records (SIR). To estimate the importance ofprincipals, we exploit the fact that we observe principals and colleges over time. We thereforesee a given principal in different institutions, and a given institution managed by different prin-cipals. This allows us to use an empirical strategy that takes into account the fact that principalsmight sort into different types of colleges depending on their characteristics. We focus only onthe outcomes of publicly funded learners that can be linked to their past education performance.This means we necessarily focus on young learners (who did their GCSE exams between theyears 2002 and 2014). We evaluate the impact of principals on outcomes for these learners butnot for those who are older. The latter is an important part of the work of FE colleges, thoughnot for Sixth Form Colleges that generally cater for those aged 16-18.
Outcomes used to measure principals’ effectiveness. We proceed in two steps to investi-gate college principals’ role. First, we look at whether principals do matter for students’ educa-
1

tional performance. The three achievement outcomes we use are whether the student achievesa Level 2 qualification, whether the student achieves a Level 3 qualification, and whether thestudent enrols in any kind of Level 4 –or above– qualification. Then, we investigate poten-tial mechanisms that could explain principals’ performance, in particular recruitment and wagepolicies set by the principals. We construct outcomes that capture the share of teachers thatare hired under a permanent contract, the share of female teachers, the share of teachers with aQualified Teacher Status (QTS) and teacher’s average salary.
Better principals do make a difference to their student’s educational outcomes. Ourresults reveal that principals do matter for the educational performance of their students, andthat principals differ in their ability to enable students to progress. After having estimated theperformance of college principals, we rank them by increasing order. We find that switchingfrom a principal who is at the bottom 25th percentile to a principal who is in the top 75th per-centile increases students’ probability to achieve level 2 by 15.9 percentage points, to achievelevel 3 by 14.1 percentage points, and to enrol in a Level 4 or above qualification by 3.7 per-centage points. This shows that leadership does make a clear difference to learner performance;and that it matters to attract and retain ‘high quality’ principals.
Principals’ characteristics do not seem to explain differences in effectiveness. We theninvestigate whether principals’ performance correlates with their age and gender, as well astheir salary and teaching qualification. Overall, we find no significant correlations betweenthese characteristics and students’ educational outcomes, suggesting that principals’ perfor-mance might be driven by characteristics that we do not observe in the data. It is particularlyinteresting to notice that principals’ effectiveness seems unrelated to their salary.
Differences in recruitment and wage policies might explain principals’ effectiveness.The second part of the analysis is devoted to differences between principals in their recruit-ment and wage policies. Again, we find strong differences between college principals in theirrecruitment and wage policies. Our results show that switching from a principal who is at thebottom 25th percentile to a principal who is at the top 25th percentile would increase the shareof teachers under a permanent contract by 12.9 percentage points, the share of female teachersby 5.5 percentage points, and the share of certified teachers by 14.1 percentage points. Princi-pals also significantly differ in terms of salary policies. Switching from a principal who is at thebottom 25th percentile to a principal who is at the top 25th percentile of the wage fixed-effectsdistribution would increase the average gross annual salary of teachers by £3,511.
Take-away. This policy brief shows that principals do matter for the educational perfor-mance of their students. Most importantly, principals notably differ in their ability to enablestudents to progress. This has wide-ranging implications. First, it matters to invest time andresources in finding ways to improve the quality of leadership amongst FE principals. Second,our results show how important it is to attract and retain high quality principals to FE colleges.While the findings elsewhere in the literature show that teachers impact student achievement,the quality of the principal is also a determining factor. And whereas the recruitment of anew high-performing teacher affects a few classes, the recruitment (or the training) of a high-performing principal directly impacts thousands of students in a college. This suggests that
2

effective ways of improving the quality of college principals might also be cost-effective.
3

1 Introduction
The past twenty years have witnessed a large increase in research about the role of Chief Ex-ecutive Officers (CEOs) in the management of firms, as well as about what constitutes goodmanagement practices (Bertrand and Schoar, 2003; Lazear et al., 2015; Bloom et al., 2016). Itis now widely recognized that CEOs have an important impact on the success of private com-panies. However, the economics literature on CEO effectiveness in the public sector is morelimited.1 Yet, this question merits examination for at least two reasons. First, a significantproportion of public sector resources is invested in public services, notably for managers’ re-muneration. It is also fundamental to understand what makes good public-sector managers tobetter inform decisions on leadership and management in key public services such as health,transport and education.
A growing literature has tried to assess the impact of principals in compulsory educationin different countries (Branch et al., 2012; Coelli and Green, 2012; Dhuey and Smith, 2014;Grissom et al., 2015; Clark et al., 2009). Böhlmark et al. (2016) for instance find that indi-vidual principals have a substantive impact on school policies, working conditions and studentoutcomes.2 Perhaps surprisingly, far less research has been devoted to studying the impact ofprincipals in post-compulsory education.
This briefing note aims to fill that gap by considering principals (“CEOs”) of post-compulsoryeducation institutions in England – referred to as further education (FE) institutions. In partic-ular, the analysis considers principals in two types of institutions: General FE and Tertiary col-leges and Sixth Form Colleges. There are several reasons why management in post-compulsoryeducation institutions might differ from management in primary or secondary schools. First,general FE and Tertiary colleges share several characteristics with public institutions such asuniversities and hospitals. They are very large and unlike secondary schools –that offer a singleservice– general FE and Tertiary colleges offer a great variety of courses and qualifications ina wide range of vocational and academic subjects at many levels.3 They also cater for a hetero-geneous population of students in terms of age (i.e. 45% of the students are older than 25 – asdocumented by Hupkau and Ventura (2017)). This complexity of provision and range of po-tential funding sources make the management of these type of colleges very challenging. SixthForm Colleges are smaller institutions (the median is less than 2000 students per institution)and offer a more homogeneous selection of post-16 qualifications that are more likely to leadto progression to higher education.4
1See Bloom et al. (2015) for instance that analyse the causal impact of competition on managerial qualityusing data from public hospitals in the United Kingdom. Other papers have analysed the relationship betweenprincipals’ pay and their performance (Besley and Machin, 2008).
2They also find that characterising successful management with observable characteristics is difficult, suggest-ing that the role of unobservable innate skills might be central.
3The median number of learners in academic year 2014 was 6749 students per institution according to Hupkauand Ventura (2017). In terms of qualification levels, General FE and Tertiary colleges offer qualifications fromentry level to Level 7. A more in-depth explanation of English qualifications levels is given in Section 2 and inHupkau et al. (2017).
4The age distribution is also different: 89% of students attending Sixth Form Colleges in 2014 were in the 16to 18 age group, and 90% were doing so on a full-time basis (Hupkau and Ventura, 2017).
4

Principals of FE institutions in England are appointed by a governing body, and their rolesand responsibilities are defined in each college’s Articles of Government.5
Much like CEOs in the private sector, principals have a multi-dimensional role. They arein charge of the corporate strategy and policy of the college (including advising the governorson the educational character and mission of the College). They provide leadership and man-agement for the college staff and students. They supervise teaching activities, determine theappropriateness of the college’s core activities, and ensure retention, pass rates, high grades,value added and progression of students. Finally, acting as accounting officer, principals arealso responsible for the financial health of the college (see Association of Colleges (2017), orSala (2003) for more information on the role of principals). As Böhlmark et al. (2016) pointout, principals provide management in complex and knowledge-intensive organisations; andprincipal’s leadership is often viewed as a crucial component for educational success.
This briefing note uses a novel panel dataset of principals in FE institutions in England overthe period 2003 to 2015, and combines it with data on education performance coming from theIndividualised Learner Records (ILR), the National Pupil Database (NPD) and the Higher Edu-cation Statistics Agency (HESA). It also exploits for the first time the information contained inthe Staff Individualised Records (SIR). When estimating the importance of principals (“princi-pal fixed effects”), being able to follow principals and colleges over time allows us to use anempirical strategy that takes into account the fact that principals might sort into different typesof colleges depending on their characteristics.6
Our results show that principals have a substantial impact both in terms of their student’sachievement and in terms of staff recruitment and wage policies. Switching from a principalwho is at the 25th percentile of the performance distribution to a principal who is in the 75thpercentile increases students’ probability to achieve level 2 by 15.9 percentage points, and toachieve level 3 by 14.1 percentage points. Interestingly, we find no significant correlationsbetween observable principal characteristics – such as gender, age, whether principals haveteacher qualifications and salary – and educational outcomes. This is similar to what the teachervalue added literature finds. As Böhlmark et al. (2016) point out, it seems difficult to identifywhat makes good principals using observable characteristics only.
This analysis is highly relevant with regard to current UK government policy. Since theelection of the Coalition Government in May 2010, there have been reforms in most aspectsof 14-19 education policy. The Wolf Review of 14-19 Vocational Qualifications (Wolf, 2011)and the subsequent government response emphasised the value of apprenticeships, work-basedlearning and internships. As a response, the Government has “freed FE colleges from centralgovernment control, and reinforced the increasingly important role of college governors insetting the strategic direction of their institutions” and selecting the best principal (Departmentfor Business Innovation and Skills, 2013). The more recent Report of the Independent Panel on
5Prior to 2011, the Instrument and Articles were the same for all colleges, but the Education Act 2011 gave col-leges the power to vary their Instruments and Articles provided that certain key features were included. For moreinformation, see https://www.aoc.co.uk/funding-and-corporate-services/governance/induction-governors/the-local-framework.
6We refer the reader to section 3 for a detailed account of our methodology as well as a description of how wedeal with the different identification challenges.
5

Technical Education (Sainsbury, 2016) and the subsequent re-structuring of technical educationenvisaged in the post-16 skills plan (Department for Education and Department for BusinessInnovation and Skills, 2016) will also affect the post-16 education sector and its management.This new educational context highlights the need for strong leadership in the post-16 educationsector, and for more research in this area.
The briefing note is structured as follows. Section 2 presents the data used in this projectand provides some summary statistics. Section 3 discusses the estimation strategy as well as themain challenges to identification of causal effects. Section 4 quantifies the importance of prin-cipals of General FE colleges and Sixth Form colleges and Section 5 offers some concludingremarks.
2 Data
As Bertrand and Schoar (2003) point out, a straightforward way to determine whether there aresystematic differences in the way principals behave is to ask whether there are important “prin-cipal fixed effects” in college outcomes and/or practices, controlling for all relevant observablecollege-level characteristics. Therefore, in order to identify principal fixed effects, we constructa college-level panel data set that allows tracking of individual principals over time. We startby using the EduBase dataset provided by the Department for Education. The EduBase is aregister of educational establishments in England and Wales, maintained by the Department forEducation. It provides information on establishments providing compulsory, higher and furthereducation. This dataset includes the name and last name of the principal in each institutionand for each academic year. However, this dataset is prone to a substantial amount of measure-ment error in terms of the exact timing of principal changes. To mitigate this weakness, foreach institution, we have performed online searches to identify the principal in each academicyear from 2003 to 2016. We reconstruct movements of principals using online searches andother sources, such as local and specialised newspapers (like FE Week or the Times EducationSupplement). This information, together with official documents (like Ofsted reports), haveallowed us to construct an accurate panel of principal-by-college-by-year dataset. When per-forming online searches, we collected additional information like the reason behind a changeof principal. We use this information to perform robustness checks to our main identificationstrategy.
We construct outcomes related to the educational achievement of students by using informa-tion contained in the Key Stage 5 Records coming from the National Pupil Database (NPD), theIndividual Learner Record (ILR) database and the Higher Education Statistics Agency (HESA)dataset. The three achievement outcomes we use are whether the student achieves a Level 2qualification, whether the student achieves a Level 3 qualification, and whether the student en-rols in any kind of Level 4 –or above- qualification. In the English education system, level 2qualifications are expected when a student finishes Key Stage 4 by age 16 (lower secondary).Level 3 qualifications are the next level up and are equivalent to upper-secondary qualifica-tions. Level 4 qualifications or above are usually taken after upper-secondary education (post-
6

18). The vast majority of the latter (Level 4 or above qualifications) are offered in universities(bachelor degrees are Level 6 qualifications, for instance), though some are offered in Generaland Tertiary FE colleges. A more in-depth description of the English post-16 education systemis provided in Hupkau et al. (2017). We follow this hierarchy to define our first two college-level educational outcomes. Specifically, we look at the fraction of students that achieve a level2, and the fraction that achieve a level 3 qualification, from the pool of students that respectivelyenrol in a level 2 or level 3 qualification. Our third educational outcome captures whether cer-tain principals are more effective in enabling their students to progress to education at level 4or above. In particular, this variable measures progression to higher-level qualifications withinthe same college or in other higher education institutions. For these educational outcomes,the analysis is confined to publicly funded learners who are young enough to have previouseducation records in the National Pupil Database (i.e. they appear in the NPD version of theILR from 2003 to 2015 –and until 2013 for the Level4+ outcome) and who were enrolled ina general/tertiary further education college or sixth form college during the period under anal-ysis. It is worth mentioning that a big fraction of students in general/tertiary FE colleges willbe enrolled in qualifications that are not Level 2 or Level 3 (e.g. below Level 2 qualifications);whereas most students enrolled in sixth form colleges will be enrolled in Level 3 qualifications.Furthermore, the highest fraction of learners in FE colleges are over 19 years of age whereasthose in sixth form colleges will mostly be aged 16-18.
Additionally, we use information from the student spring Census and NPD datasets (KeyStage 2 and 4) to construct variables about the student’s prior attainment (total points in thenational Key Stage 2 and Key Stage 4 examinations), ethnicity, language spoken at home,gender and whether the student has ever received free school meals (FSM).
To investigate some mechanisms that could explain the degree of principals’ effectiveness(including staff recruitment and salaries), we use data from the Staff Individualized Record(SIR) dataset for academic years 2004/2005 to 2013/2014.7 To the best of our knowledge,this data has never been used before for the purposes of academic research. However, thisdataset comes with some limitations that are discussed in Appendix 1. Finally, we obtain dataon the principal’s salary from the College Accounts dataset for academic years 2001/2002 to2014/2015.8
Given that the variation of interest is at the college level, we aggregate the data and workwith observations that represent averages at the college-academic year level. This also hasthe advantage of keeping the estimation strategy consistent between outcomes at the student,teacher and college level.
7This dataset is provided by the Education and Training Foundation.8The college accounts are compiled by the Skills Funding Agency and the Education Funding
Agency. More information can be found here: https://www.gov.uk/government/publications/sfa-financial-management-college-accounts.
7

3 Descriptive statistics
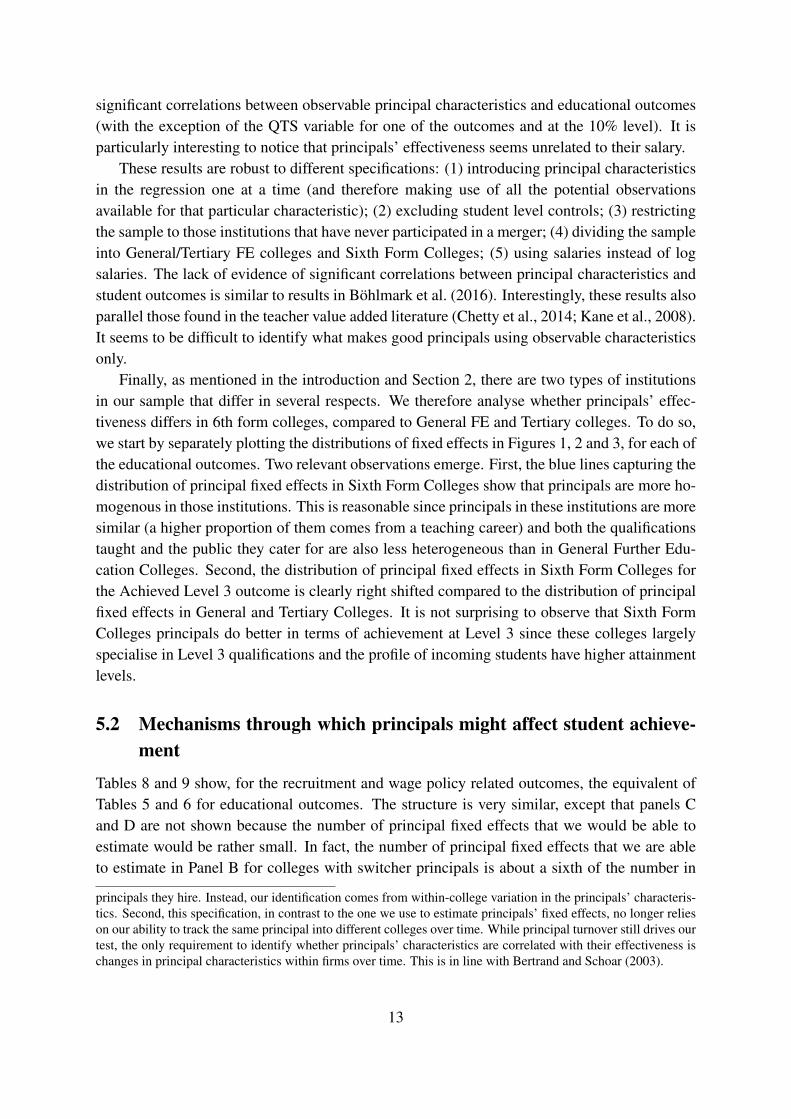
Table 1 reports the number of institutions in our study. Over the period, there are 369 uniqueinstitutions divided between General FE and tertiary colleges (265) and Sixth Form Colleges(104).9 This number masks a decreasing trend in the number of institutions during the period,which is the result of mergers of institutions that have been taking place in the Further Edu-cation sector in England. Using data from the Association of Colleges on the list of mergersthat have occurred since 1993, we have built a dataset of college mergers to identify the finalmerged institution as well as the prior institutions involved in the merger.10 The last row inTable 1 shows that there are roughly two principals per college during the period under study.
Table 2 describes principals’ characteristics during the period.11 The average principal ageis 56, and very similar for both General FE and Tertiary Colleges and Sixth Form Colleges.Principals’ salary (measured in pounds) is higher in General FE and Tertiary Colleges, whilethe proportion of principals that have qualified teacher status (QTS) is higher for Sixth FormColleges.12 It is more common that principals of FE colleges have had previous professionalexperiences outside the education sector. There are more male than female principals. Unfortu-nately, information on principal characteristics is often missing (i.e. not available for every yearin the different datasets). This is especially the case for the variables in Table 2 that come fromthe College Accounts (Principal’s salary) and the SIR (Proportion of principals with QualifiedTeacher Status). As detailed in Appendix 1, since participation in the survey is not compul-sory, there is a substantial amount of missing information. Therefore, results that use principalcharacteristics and more generally, SIR data, have to be interpreted with caution.
As can be seen in the last column of Table 3, the same caution applies to outcomes related torecruitment and wage policies. The number of non-missing observations reflects the availableobservations for each outcome, and the averages in the table are constructed over this numberof observations (college-by-year). Table 3 shows that the achievement rate of those enrolledin level 2 qualifications is similar across institution types, but the achievement rate of thoseenrolled in level 3 qualifications is 20 percentage points higher in Sixth Form Colleges. Thisis likely to reflect the profile of incoming students rather than any differential effectivenessbetween these types of institutions. These two outcomes cover the period 2003 to 2015. Forthe third outcome, we do not look at outcomes after 2012, to ensure that the last cohorts ofstudents in our sample have enough time to progress to higher levels of education.13 Thisexplains why the number of college-year observations in the last column of Table 3 is smallerfor this outcome. The enrolment rates in Level 4 qualifications reflect what was anticipatedabove. Students in Sixth form Colleges are almost 30 percentage points more likely to progress
9These institutions are identified using the Unique Reference Number (URN) indicator in the EduBase dataset.10When estimating the principal fixed effects on any of the outcome measures, it is important to net out the
effect of principals from that of mergers. More details about how we deal with this are provided in Section 3.11We show this information for the last year the principal is observed in the data.12This is unsurprising given that QTS is a general teaching qualification designed for schools (which would
resemble Sixth Form Colleges far more closely than FE colleges).13Students starting a qualification in FE colleges after 2013 would not have had the chance to progress to level
4+ education, so we would not have an outcome for them.
8

to a level 4 qualification. Again, this is likely to be partly explained by the rather differentprofile of incoming students in the two types of institutions.
The next set of outcomes is related to staff recruitment and staff wage policies. In particular,we construct outcomes that capture the share of teachers that are hired under a permanentcontract, the share of female teachers, the share of teachers with a Qualified Teacher Status(QTS) and teacher’s average salary. Principals can arguably have a strong impact on theseoutcomes, depending on their different views on issues such as gender-balanced teaching staff,contractual arrangements, or the need for their teachers to have formal teaching qualifications(one can become an FE teacher without a teaching qualification in England). In terms of wagesetting, colleges are able to negotiate their own salary scales with the national trade unions,and salaries vary according to experience (both within and outside of the teaching profession),qualifications, subject demand, institution and geographical location.
The statistics shown in the bottom panel of Table 3 reveal significant differences acrossinstitution types; in particular, when it comes to the contractual arrangements and share ofteachers with a qualified teacher status. Sixth Form Colleges hire more teachers under perma-nent contracts and more teachers with a qualified teacher status. Full-time teachers in thoseinstitutions also earn more. As noted above, given the limitations of the SIR data outlinedin Appendix 1 (non-compulsory participation in the survey, attrition and backfilling), analysisof recruitment and wage practices is more limited than analysis of student achievement. Theresults should therefore be interpreted with caution.14
4 Empirical strategy
The key challenge for any study aimed at identifying the causal effect of principals on student’ssuccess or management practices is to disentangle the contribution of principals from otherinstitutional level factors that can potentially drive these outcomes. Being able to disentanglethese two effects is particularly important if one thinks that there might be assortative matchingbetween good principals and colleges with more favourable characteristics (better governance,higher achieving students, etc.). A strategy to separate these effects is to include college fixed-effects in the regressions used to relate outcomes to principal fixed effects. Such effects accountfor unobserved characteristics of the colleges that are constant over time and impact student’sachievement and management practices (by unobserved, we mean the colleges’ characteristicsthat we, as researchers, cannot observe, or for which we do not have data). By adding collegefixed effects, the identification of the principal effects stems from within college variation inoutcomes under different principals.15
Formally, we derive our empirical strategy from Bertrand and Schoar (2003) and Böhlmark
14The following variables are available for years 2003 to 2014: share of teachers that are permanent staff, shareof female teachers, teacher’s gross salary and teacher’s salary variation. Share of teachers with QTS is availablefor years 2003 to 2011.
15When college fixed effects are accounted for, it becomes evident that the estimation of principals’ performance(as measured by a vector of principals’ fixed-effects) is not possible for principals who never leave a given collegeif that college has only one principal.
9

et al. (2016) and estimate the following regression:
Yst = αs + δt + β1Xst + β2Xst−1 + µp + εst (1)
Where Yst is the outcome of college s in academic year t; αs are college fixed effects ac-counting for all non-varying college characteristics and δt is a vector of year dummies. Xst
is a vector of time varying college level characteristics accounting for selection of studentsof different ability and socioeconomic background into different institutions. This vector in-cludes average performance in terms of capped total points at Key Stage 4 (age 16), averageperformance in Key Stage 2 (age 11), and indicators for the average fraction of students thatare female, of white ethnicity, have ever received Free School Meals (FSM), speak EnglishLanguage at home and have ever been classified as having special education needs (SEN). Thevector of principal fixed effects is given by µp. We correct the standard errors for clustering atthe college level.
Finally, even if the termsXst and µp mitigate issues of student and principals’ selection intocolleges, principals’ selection might still be correlated with trends in student achievement (orother characteristics). In other words, some colleges might change the college principal as aresponse to a decrease in outcomes. When the new principal takes over, mean reversion woulddrive the potential recovery, rather than actual improvement due to the new principal’s actions.In order to deal with this challenge, we introduce a set of pre-arrival controls at the college level(for one and two years before the arrival of the new principal), including the share of studentswho ever received free school meals, the share of female students and the share of non-whitestudents, as well as the lagged value of the outcome of interest. This is captured by the termXst−1 in equation 1.
We account for sampling error in the estimation of principal fixed effects by applying ashrinkage estimator to obtain the true variance of principal fixed effects (Kane and Staiger,2002).16 With limited number of observations at the college level, due to sampling variations,a few students can have a large impact on test scores, and on estimations of principals’ fixedeffects. The observed distribution of principal fixed effects recovered from the estimation ofequation 1 would therefore overstate the true distribution of principal fixed effects.
There is one main limitation to this framework. Some principals do not change collegeduring the period (and are therefore only observed in one college). For such principals, a fixedeffect can be estimated if s/he is observed in a college that has at least one other principal thatchanges college in the sample. For non-movers principals, even if we estimate a fixed effect, itis impossible to disentangle the effect of time-specific college unobserved characteristics andtheir principal fixed effect. In order to overcome this problem, the best solution would be torestrict our sample to work with principals that switch colleges during the period of observation(also called switchers). Unfortunately, our sample would become very small if we were to useonly switchers. As an alternative, we show results for the whole sample first, and then for a
16At the school level, Kane and Staiger (2002) found that in the smallest schools, more than half (56 percent)of the variance in mean gain scores is due to sampling variation and other non-persistent factors. Several recentapplications have therefore used empirical Bayes estimates to estimate teacher value added (Jacob and Lefgren,2005; Kane et al., 2008; Chetty et al., 2014).
10

sample of principals that are either switchers or are principals that are observed in colleges thatemploy at least another switcher principal during the sample period.
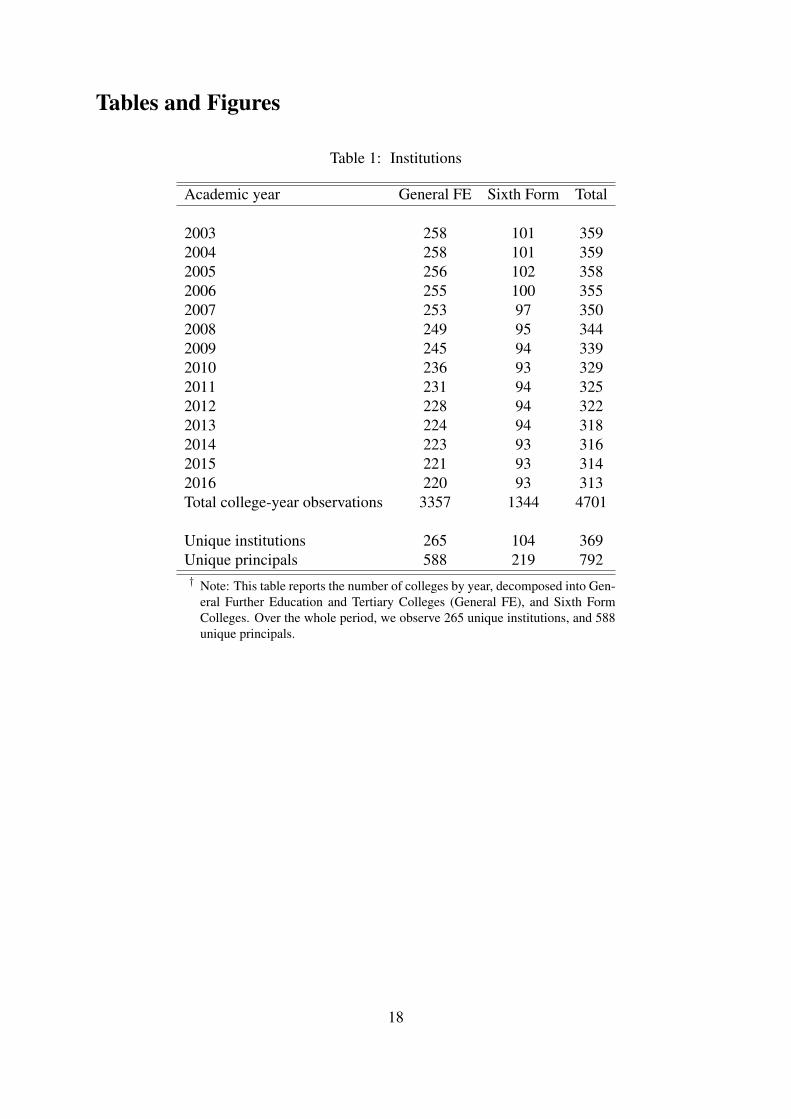
For the educational outcomes, we perform two additional robustness checks. First, we useinformation on the reason why a principal left a college. We might worry that a principal’schange is driven by reasons that we do not observe, such as an internal scandal or issues be-tween the principal and teachers or other staff members. If this was the case, then college levelunobservable characteristics – such as the attractiveness of the college for instance - might dif-fer before and after the change of principal. This would make it more difficult to disentanglethe principal effect from college-level, time-specific unobserved characteristics. To addressthis concern, we collected data on the reason why principals in the sample left a given col-lege. Table 4 shows that the most frequent reason for principal switch is retirement. Between27% and 32% of principals leave their college because of retirement.17 Among all reasons forprincipal change, it is less likely that retirement is correlated with college and student charac-teristics than departures due to resignations or scandals. Retirement is mainly associated withprincipal’s age. As a robustness check, we therefore use the sample of principals that retire andprincipals that follow a retirement (that is, those who are hired after a principal retires). We callthis sample the retirement sample.18
Finally, when estimating the principal fixed effects on any of the outcome measures, it isimportant to net out the effect of principals from that of institutional mergers. Given the amountof restructuring in the Further Education sector in England during the sample period (describedin Section 2.1), we use the sample of colleges that have never been part of a merger processas a second robustness check. Unfortunately, the small sample size prevents us from doing thetwo latter robustness checks for outcomes related to management practices (that is, using theretirement and non-mergers samples). Finally, for outcomes constructed using the SIR data,we include an additional dummy variable in the regressions indicating whether the variable hasbeen backfilled.
5 Results
5.1 Educational Outcomes
Table 5 presents the adjusted R-squared of regressions with and without principal fixed effects.The aim is to see whether (and by how much) adding principal fixed effects to the regressionsincreases the share of the variation of outcome variables explained by predictor variables. Thetable is divided in four panels. Panel A shows the results when all available observations areused; whereas panel B uses the sample of colleges where there is at least one switcher. Thenumber of principals fixed effects identified decreases considerably in Panel B, but results arevery similar. For the preferred specification (Panel B), adding principal fixed effects increases
17For almost 9% of the principals, we were unable to find the reason of change, and 32% of the principals inour sample are still observed in their position in the last year of observation.
18Some principals at the end of their careers might be less motivated than younger principals. The inclusion ofpre-arrival controls mitigate this concern.
11

the adjusted R-squared by 1 and 2 percentage points, respectively, for the Achieved Level2 and Level 3 outcomes, and very little for the outcome capturing progression to Level 4+education. The results are very similar when restricting the sample to institutions that nevermerged (Panel D). However, changes in adjusted R-squared are considerably higher when weuse the retirement sample. Overall, Table 5 shows that principals do matter for the educationalperformance of students. Something relevant here is the fact that the inclusion of college fixedeffects in the regressions could be wiping away some of the potential impact of principals,especially if we think that there’s assortative matching between good principals and colleges.In this case, it could be argued that the results in this briefing note provide a lower bound forprincipal effects.
Table 6 contains information about the distribution of principal fixed effects and about itsoverall significance. We use the same 4-panel structure as in Table 5. The F-statistics fromtests of joint significance of the different sets of principal fixed effects are large and allow usto reject in all cases the null hypothesis that all principal fixed effects are zero. Qualitatively,the results in all four panels are similar. Looking at the distribution of principals’ fixed effectsgives us some indication on the difference that better principals can make to their student’seducational outcomes, once college fixed effects and other variables capturing selection andstudent composition have been accounted for. To interpret principals’ fixed effects, it mighthelp to have a benchmark in mind: in the full sample, 56% of the students enrolled in a level2 qualification achieve that qualification, and 58% of the students enrolled in a level 3 qualifi-cation achieve that qualification. For the preferred specification in Table 6 (Panel B), and forthe level 2 achievement outcome in panel B, the twenty-fifth percentile of the principals’ fixed-effects distribution equals -0.077, while the seventy-fifth percentile equals 0.082. This meansthat switching from a principal who is at the bottom 25th percentile to a principal who is at thetop 25th percentile increases students’ probability to achieve level 2 by 15.9 percentage points,and to achieve level 3 by 14.1 percentage points. College principals make less of a differencefor student enrolment in a Level 4 or above qualification.
We can also directly interpret the percentile values. A principal in the bottom quartile ofprincipals’ effectiveness decreases the chances of their students achieving Level 3 qualificationsby 6.1 percentage points in the preferred specification (panel B); whereas a principal in the topquartile increases that probability by 8 percentage points. Not surprisingly, and as seen in Table5 for the R-squared results, the ability to impact progression to education at Level 4 and aboveis smaller compared to the ability to impact achievement results in the college itself.
The previous results have provided suggestive evidence of systematic differences in achieve-ment among principals. However, the presence of principal fixed effects does not tell us muchabout which specific principal characteristics might influence their effectiveness. We thereforeanalyse the possible role of principals’ age and gender, as well as whether the principal has aqualified teacher status and his/her salary. Table 7 shows the results of a regression of each ed-ucational outcome variable on these observable principal characteristics, college fixed effects,academic year dummies, and student controls at the college level.19 Results in Table 7 show no
19There are two points worth emphasizing about the specification we use here. First, our specification includescollege fixed effects. Our identification is therefore not driven by average differences across colleges in the type of
12
significant correlations between observable principal characteristics and educational outcomes(with the exception of the QTS variable for one of the outcomes and at the 10% level). It isparticularly interesting to notice that principals’ effectiveness seems unrelated to their salary.
These results are robust to different specifications: (1) introducing principal characteristicsin the regression one at a time (and therefore making use of all the potential observationsavailable for that particular characteristic); (2) excluding student level controls; (3) restrictingthe sample to those institutions that have never participated in a merger; (4) dividing the sampleinto General/Tertiary FE colleges and Sixth Form Colleges; (5) using salaries instead of logsalaries. The lack of evidence of significant correlations between principal characteristics andstudent outcomes is similar to results in Böhlmark et al. (2016). Interestingly, these results alsoparallel those found in the teacher value added literature (Chetty et al., 2014; Kane et al., 2008).It seems to be difficult to identify what makes good principals using observable characteristicsonly.
Finally, as mentioned in the introduction and Section 2, there are two types of institutionsin our sample that differ in several respects. We therefore analyse whether principals’ effec-tiveness differs in 6th form colleges, compared to General FE and Tertiary colleges. To do so,we start by separately plotting the distributions of fixed effects in Figures 1, 2 and 3, for each ofthe educational outcomes. Two relevant observations emerge. First, the blue lines capturing thedistribution of principal fixed effects in Sixth Form Colleges show that principals are more ho-mogenous in those institutions. This is reasonable since principals in these institutions are moresimilar (a higher proportion of them comes from a teaching career) and both the qualificationstaught and the public they cater for are also less heterogeneous than in General Further Edu-cation Colleges. Second, the distribution of principal fixed effects in Sixth Form Colleges forthe Achieved Level 3 outcome is clearly right shifted compared to the distribution of principalfixed effects in General and Tertiary Colleges. It is not surprising to observe that Sixth FormColleges principals do better in terms of achievement at Level 3 since these colleges largelyspecialise in Level 3 qualifications and the profile of incoming students have higher attainmentlevels.
5.2 Mechanisms through which principals might affect student achieve-ment
Tables 8 and 9 show, for the recruitment and wage policy related outcomes, the equivalent ofTables 5 and 6 for educational outcomes. The structure is very similar, except that panels Cand D are not shown because the number of principal fixed effects that we would be able toestimate would be rather small. In fact, the number of principal fixed effects that we are ableto estimate in Panel B for colleges with switcher principals is about a sixth of the number in
principals they hire. Instead, our identification comes from within-college variation in the principals’ characteris-tics. Second, this specification, in contrast to the one we use to estimate principals’ fixed effects, no longer relieson our ability to track the same principal into different colleges over time. While principal turnover still drives ourtest, the only requirement to identify whether principals’ characteristics are correlated with their effectiveness ischanges in principal characteristics within firms over time. This is in line with Bertrand and Schoar (2003).
13

Panel B in Tables 5 and 6. For this reason, even if the results are qualitatively similar for bothsamples, we focus our comments on the results in Panels A of Tables 8 and 9.
The results in Table 8 suggest that principals have a significant impact on recruitment andwage policies. For all outcomes, the set of principals’ fixed effects increases the predictivepower of the models, as measured by change in adjusted R-squared. This is particularly truefor the share of female teachers (5-percentage point increase).
As with the educational outcomes, we then look at the distribution of the principals’ fixed-effects. This provides some evidence on the difference that principals make in terms of theshare of female, certified, permanent teachers, and in terms of salaries, once we account forcollege fixed effects and other variables capturing selection and student composition. The F-statistics from tests of joint significance of the different sets of principal fixed effects displayedin Table 9 are large and always allow us to reject the null hypothesis that all principal fixedeffects are zero.
The results reveal that a principal in the bottom quartile of principals’ fixed effects reducesthe share of teachers under a permanent contract by 6.2 percentage points (for a mean valueof 62.7%), the share of female teachers by 2.7 percentage points (for a mean value of 54.9%),and the share of certified teachers by 8.4 percentage points (for a mean value of 51.9%). Onthe other hand, a principal in the upper quartile of principals’ fixed effects increases the shareof teachers under a permanent contract by 6.7 percentage points, the share of female teachersby 2.8 percentage points, and the share of certified teachers by 5.7 percentage points. Anotherway to interpret these results is to look at the impact of switching from a principal who is at the25th percentile to a principal who is at the 75th percentile. Our results reveal that such a switchwould increase the share of teachers under a permanent contract by 12.9 percentage points, theshare of female teachers by 5.5 percentage points, and the share of certified teachers by 14.1percentage points. Principals also significantly differ in terms of salary policies. Switchingfrom a principal who is at the 25th percentile to a principal who is at the 75th percentile of thewage fixed-effects distribution would increase the average annual gross salary of the teachersby £3,511 (for a mean value of £31,511 average salary for full-time teachers in the sample).
6 Concluding remarks
This briefing note investigates the role of principals in further education colleges. We use apanel dataset of principals in FE institutions in England over the period 2003 to 2015 to lookat whether principals do matter for students’ educational performance. Then, we investigatepotential mechanisms that could explain principals’ performance, in particular recruitment andwage policies set by the principals.
Our results reveal that principals do matter for the educational performance of their stu-dents, and that principals substantially differ in their ability to enable students to progress. Wefind that switching from a principal who is at the bottom 25th percentile to a principal whois in the top 25th percentile increases students’ probability to achieve level 2 by 15.9 percent-age points, to achieve level 3 by 14.1 percentage points, and to enrol in a Level 4 or above
14

qualification (equivalent to higher education) by 3.7 percentage points. Such differences ineffectiveness are not explained by principals’ gender, age or salary. We find, however, strongdifferences between college principals in their recruitment and wage policies.
These results have wide-ranging policy implications. First, policy makers and collegesshould find out ways of detecting low-performing principals and of improving the quality ofleadership amongst college principals. Second, our results show how important it is to attractand retain high quality principals to further education colleges. Principals have a surprisinglylow profile in the debates about education. The focus instead usually falls on curriculum, col-lege/institution types (traditional versus academies) and teachers (how to measure their effec-tiveness, attract and keep good ones). We hear far more talk about holding teachers accountablethan about principals. But, as we show, principals can make a real difference, and more atten-tion could be devoted to them. For example, in the U.S, the federal education law passed in2015 to replace the No Child Left Behind Act, puts a new emphasis on the development ofprincipals. Some cities and states also increasingly recognize the key role that principals play.In Chicago, students, parents and teachers fill out an annual survey evaluating their principal.Principals are important because they offer one of the most effective means to improve col-lege performance. Although teachers have been shown to impact on student achievement, therecruitment of a new high-performing teacher affects a few classes, whereas the recruitment(or the training) of a high-performing principal directly impacts on thousands of students in acollege. Finding ways to improve principal quality could be cost-effective in that it potentiallyaffects so many students.
15

References
Association of Colleges (2017). Induction of Governor, The local frame-work. https://www.aoc.co.uk/funding-and-corporate-services/governance/induction-governors/the-local-framework.
Bertrand, M. and A. Schoar (2003). Managing with Style: The Effect of Managers on FirmPolicies. The Quarterly Journal of Economics 118(4), 1169–1208.
Besley, T. and S. Machin (2008, February). Are Public Sector CEOs Different? LeadershipWages and Performance in Schools. Working paper.
Bloom, N., E. Brynjolfsson, L. Foster, M. Patnaik, I. Saporta-Eksten, J. Van Reenen, and R. S.Jarmin (2016, March). What Drives Differences in Management? NBER Working Paper23300,.
Bloom, N., C. Propper, S. Seiler, and J. Van Reenen (2015). The Impact of Competitionon Management Quality: Evidence from Public Hospitals. The Review of Economic Stud-ies 82(2), 457–489.
Böhlmark, A., E. Grönqvist, and J. Vlachos (2016). The Headmaster Ritual: The Importance ofManagement for School Outcomes. Scandinavian Journal of Economics 118(4), 912–940.
Branch, G., E. Hanushek, and S. Rivkin (2012, February). Estimating the Effect of Leaders onPublic Sector Productivity: The Case of School Principals. NBER Working Paper 17803,.
Chetty, R., J. N. Friedman, and J. E. Rockoff (2014). Measuring the impacts of teachers I:Evaluating bias in teacher value-added estimates. American Economic Review 104(9), 2593–2632.
Clark, D., P. Martorell, and J. Rockoff (2009, December). School Principals and SchoolPerformance. National Center for Analysis of Longitudinal Data in Education Research(CALDER) Working Paper 38,.
Coelli, M. and D. A. Green (2012). Leadership effects: School principals and student outcomes.Economics of Education Review 31(1), 92–109.
Department for Business Innovation and Skills (2013). A Review of Further Education andSixth Form College Governance. Technical report.
Department for Education and Department for Business Innovation and Skills (2016). Post-16Skills Plan. Technical report.
Dhuey, E. and J. Smith (2014). How important are school principals in the production of studentachievement? Canadian Journal of Economics 47(2), 634–663.
Grissom, J. A., D. Kalogrides, and S. Loeb (2015). Using Student Test Scores to MeasurePrincipal Performance. Educational Evaluation and Policy Analysis 37(1), 3–28.
16

Hupkau, C., S. McNally, J. Ruiz-Valenzuela, and G. Ventura (2017). Post-compulsory edu-cation in England: choices and implications. National Institute Economic Review 240(1),51.
Hupkau, C. and G. Ventura (2017, February). Further Education in England: Learners andInstitutions. Centre for Vocational Education Research (CVER) Briefing Note 001,.
Jacob, B. and L. Lefgren (2005, July). Principals as Agents: Subjective Performance Measure-ment in Education. NBER Working Paper 11463,.
Kane, T. J., J. E. Rockoff, and D. O. Staiger (2008). What does certification tell us about teachereffectiveness? Evidence from New York City. Economics of Education Review 27(6), 615–631.
Kane, T. J. and D. O. Staiger (2002). The Promise and Pitfalls of Using Imprecise SchoolAccountability Measures. Journal of Economic Perspectives 16(4), 91–114.
Lazear, E. P., Shaw Kathryn L., and C. T. Stanton (2015). The Value of Bosses. Journal ofLabor Economics 33(4), 823–861.
Sainsbury, D. (2016). Report of the Independent Panel on Technical Education. TechnicalReport April.
Sala, F. (2003). Leadership in Education: Effective U.K. College Principals. Nonprofit Man-agement and Leadership 14(2), 171–189.
Wolf, A. (2011). Review of Vocational Education – The Wolf Report. Technical Report March.
17
Tables and Figures
Table 1: Institutions
Academic year General FE Sixth Form Total
2003 258 101 3592004 258 101 3592005 256 102 3582006 255 100 3552007 253 97 3502008 249 95 3442009 245 94 3392010 236 93 3292011 231 94 3252012 228 94 3222013 224 94 3182014 223 93 3162015 221 93 3142016 220 93 313Total college-year observations 3357 1344 4701
Unique institutions 265 104 369Unique principals 588 219 792† Note: This table reports the number of colleges by year, decomposed into Gen-
eral Further Education and Tertiary Colleges (General FE), and Sixth FormColleges. Over the whole period, we observe 265 unique institutions, and 588unique principals.
18

Table 2: Descriptive Statistics on Principals
General FE Sixth Form Total No Principals
Unique principals 588 219 792
Proportion Female 0.398 0.306 0.374 792(0.490) (0.462) (0.484)
Age 56 57 57 643(6) (5) (6)
Average Salary (annual, in pounds) 151710 118247 143593 437(36488) (24153) (36802)
Proportion with Qualified Teacher Status 0.519 0.890 0.596 478(0.500) (0.314) (0.491)
† Note: General FE includes General FE colleges and Tertiary Colleges. The table shows means and stan-dard deviations (in parentheses). The data corresponds to the last year the principal is observed in oursample. Average salaries are deflated using the consumer price index (with 2015=100). Sources: Pro-portion female and age (own construction departing from Edubase Dataset); Average Salary (College Ac-counts: https://www.gov.uk/government/publications/sfa-financial-management-college-accounts); Proportionwith Qualified Teacher Status (QTS) comes from the Staff Individualised Records Dataset. It is calculated asequal to 1 if the principal is ever observed in the QTS category.
19

Table 3: Descriptive Statistics: Outcome Variables
General FE 6th Form Total Non-missing
A. Educational OutcomesAchieved Level 2 qualification 0.569 0.552 0.564 4263
(0.162) (0.239) (0.188)
Achieved Level 3 qualification 0.524 0.728 0.583 4263(0.139) (0.181) (0.178)
Ever enrolled in Level4+ qualification 0.269 0.647 0.379 3331(0.098) (0.146) (0.206)
B. Recruitment and salary policiesShare of teachers that are permanent staff 0.581 0.791 0.627 2372
(0.273) (0.162) (0.267)
Share of female teachers 0.540 0.580 0.549 2375(0.112) (0.064) (0.105)
Share of teachers with QTS 0.441 0.776 0.519 2071(0.241) (0.174) (0.267)
Teachers’ salary (annual, in pounds) 30003 36570 31511 2203(6643) (6744) (7215)
† Note: This table reports descriptive statistics on educational outcomes (in the upper part of the table) andon recruitment and salary policies (in the lower part of the table). The first column presents statistics forGeneral FE which includes General FE colleges and Tertiary Colleges. The second column presents statisticsfor 6th form colleges. The last column reports the number of non-missing observations (at the college-by-yearlevel). QTS stands for Qualified Teacher Status. Teacher’s salary and teacher’s salary variation is for full-timeteachers.
20
Table 4: Reasons Behind a Principal Change
Reasons General FE (%) Sixth Form (%) Total (%)
Changed jobs/position 3.79 4.25 3.91Changed colleges 6.21 5.66 6.06Health related problem 0.52 0.47 0.51Interim principal 8.79 5.19 7.83Merger 2.07 1.42 1.89Resigned 6.21 2.83 5.30Retirement 27.59 32.08 28.79Scandal 4.66 3.77 4.42Principal in last year observed 31.03 36.32 32.45Unknown reason 9.14 8.02 8.84† This table reports statistics on the reasons behind a principal departure. Source: Own data
collection. Numbers are percentages. Principal in last year observed means that the principalis still in the post in the last year in the sample.
21

Table 5:Education Outcomes: How Much Do Principal Fixed Effects Add to the Explained Variation?
Adjusted R-squaredCollege-level outcomes No Principal FE Principal FE Number principals
A. Within college estimatesAchieved Level 2 Qualification 0.6991 0.7034 500Achieved Level 3 Qualification 0.7409 0.7559 499Ever enrolled in Level4+ Qualification 0.9872 0.9883 348
B. Within college estimates in the sample of colleges with switchersAchieving Level 2 qualification 0.7124 0.7227 314Achieving Level 3 qualification 0.6567 0.6795 313Ever enrolled in Level4+ qualification 0.9818 0.9836 194
C. Robustness check: Sample of principals that retire or are appointed after a retirementAchieving Level 2 qualification 0.6862 0.7171 115Achieving Level 3 qualification 0.5210 0.6601 111Ever enrolled in Level4+ qualification 0.9095 0.9690 116
D. Robustness check: Sample of institutions that never mergedAchieving Level 2 qualification 0.7255 0.7371 162Achieving Level 3 qualification 0.6380 0.6584 161Ever enrolled in Level4+ qualification 0.9625 0.9645 90† Note: This table presents the adjusted R-squared of regressions estimating the probability of achieving a certain
college-level outcome with and without principal fixed effects. In the first column, controls include total aver-age KS2 score, total average KS4 score, ethnicity, gender, whether the pupil ever received free school meals,institution and year fixed effects. Pre-arrival controls are also included: proportion of girls, free-school meals,non-white students and pupils who entered level 3 in the college one and two years prior to principal’s arrival.In the second column, principals’ fixed effects are added. Standard errors are clustered at the college level.Panel A shows the results when all available observations are used, whereas panel B uses the sample of collegeswhere there is at least one switcher.
22

Table 6: Education Outcomes: Distribution of Principal Fixed Effects
s.d p25 p75 F-stat P-value Number ofppal FE
A. Within college estimatesAchieved Level 2 Qualification 0.128 -0.063 0.063 198.734 0.000 500Achieved Level 3 Qualification 0.106 -0.065 0.068 83526.484 0.000 499Ever enrolled in Level4+ Qualification 0.030 -0.022 0.017 1932.295 0.000 348
B. Within college estimates in the sample of colleges with switchers:Achieved Level 2 Qualification 0.143 -0.077 0.082 115.249 0.000 314Achieved Level 3 Qualification 0.110 -0.061 0.080 639.498 0.000 313Ever enrolled in Level4+ Qualification 0.028 -0.020 0.017 195.539 0.000 194
C. Robustness check: Sample of principals that retire or are appointed after a retirement:Achieving Level 2 Qualification 0.068 -0.038 0.049 4.802 0.000 115Achieving Level 3 Qualification 0.129 -0.066 0.099 25.894 0.000 111Ever enrolled in Level4+ Qualification 0.032 -0.025 0.020 16.347 0.000 116
D. Robustness check: Sample of institutions that never merged:Achieving Level 2 Qualification 0.146 -0.441 0.493 18.816 0.000 162Achieving Level 3 Qualification 0.102 -0.343 0.248 19.615 0.000 161Ever enrolled in Level4+ Qualification 0.019 -0.038 0.055 12.745 0.000 90† Note: This table contains statistics on the distribution of principal fixed effects and their overall significance. In each
regression, the dependent variable is the probability of a certain college-level outcome, and controls include total averageKS2 score, total average KS4 score, ethnicity, gender, whether the pupil ever received free school meals, institution andyear fixed effects. Standard errors are clustered at the college level. Statistics presented in this table apply the shrinkageestimator. The F-stat and associated P-value are obtained from a model assuming general heteroscedasticity, with robuststandard errors. Panel A shows the results when all available observations are used, whereas panel B uses the sample ofcolleges where there is at least one switcher.
23

Table 7: Education Outcomes: Impact of Principal Characteristics
Achieving Level 2 Achieving Level 3 Ever Enrolled Level 4+Age -0.003 -0.012 0.003
(0.008) (0.010) (0.002)
Age squared 0.000 0.000 -0.000(0.000) (0.000) (0.000)
Qualified Teacher Status -0.022* -0.016 -0.001(0.012) (0.012) (0.003)
Woman -0.004 -0.009 -0.002(0.011) (0.013) (0.003)
Log Salary -0.009 0.011 -0.003(0.019) (0.025) (0.005)
Observations 3257 3258 2727† Note: This table reports coefficients from within-college regressions where the column variable is regressed
on the row variables. Observations are at the college-year level. Regressions include student controls (KS4and KS2 prior attainment scores, and ethnicity, gender, ever FSM, ever SEN, and language dummies), collegefixed effects and academic year dummies. The regression for the third outcome (Level 4+) only includesobservations until academic year 2011/2012. Standard errors clustered at the college level in parentheses(results are very similar if standard errors are clustered at the principal level instead); *(p<0.1), **(p<0.05),***(p<0.01).
24

Figure 1: Distribution of Principal Fixed Effects by Institution Type
02
46
8
Den
sity
-.4 -.2 0 .2 .4Principals FE
Gen FE + Tertiary 6th form
Achieving level 2 conditional on enrollmentShrinkage estimator
25
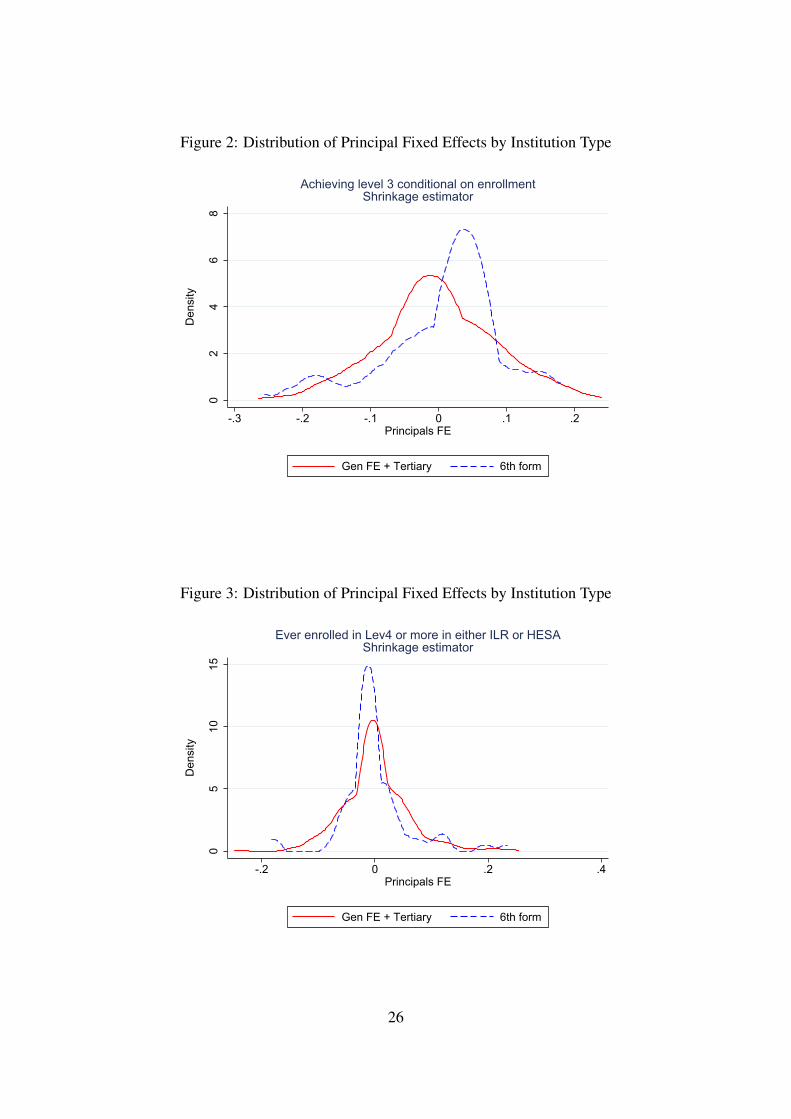
Figure 2: Distribution of Principal Fixed Effects by Institution Type
02
46
8
Den
sity
-.3 -.2 -.1 0 .1 .2Principals FE
Gen FE + Tertiary 6th form
Achieving level 3 conditional on enrollmentShrinkage estimator
Figure 3: Distribution of Principal Fixed Effects by Institution Type
05
1015
Den
sity
-.2 0 .2 .4Principals FE
Gen FE + Tertiary 6th form
Ever enrolled in Lev4 or more in either ILR or HESAShrinkage estimator
26

Table 8: Recruitment and Wage PoliciesHow Much Do Principal Fixed Effects Add to the Explained Variation?
Adjusted R-squaredCollege-level outcomes No Principal FE Principal FE Number principals
A. Within college estimatesShare of teachers permanent staff 0.7626 0.7718 158Share of female teachers 0.6539 0.7064 159Share of teachers with QTS 0.7992 0.8159 141Teachers’ average salary 0.6319 0.6330 146
B. Within college estimates in the sample of colleges with switchersShare of teachers permanent staff 0.7827 0.7912 52Share of female teachers 0.3511 0.5033 43Share of teachers with QTS 0.6543 0.7775 33Teachers’ average salary 0.6414 0.6635 49† Note: This table presents the adjusted R-squared of regressions of college-level recruitment and wage
variables with and without principal fixed effects. In the first column, controls include total average KS2score, total average KS4 score, ethnicity, gender, whether the pupil ever received free school meals, adummy variable controlling for whether the data has been backfilled in the SIR dataset, institution andyear fixed effects. We also include principals pre-arrival control variables such as proportion of girls,free-school meals, non-white students and pupils who entered level 3 in the college one and two yearsprior to principal’s arrival. In the second column, principals’ fixed effects are added. Panel A showsthe results when all available observations are used, whereas panel B uses the sample of colleges wherethere is at least one switcher. Standard errors are clustered at the college level. QTS stands for QualifiedTeacher Status. Teachers’ average salary is for full-time teachers.
27

Table 9: Recruitment and Wage Policies: Distribution of Principal Fixed Effects
s.d p25 p75 F-stat P-value Number ofppal FE
A. Within college estimatesShare of teachers permanent staff 0.124 -0.062 0.067 30.459 0.000 158Share of female teachers 0.065 -0.027 0.028 75.786 0.000 159Share of teachers with QTS 0.149 -0.084 0.057 148.292 0.000 141Teachers’ average salary 3829.667 -1838.644 1672.887 18.076 0.000 146
B. Within college estimates in the sample of colleges with switchers:Share of teachers permanent staff 0.082 -0.052 0.061 5.017 0.000 52Share of female teachers 0.079 -0.044 0.025 23.463 0.000 43Share of teachers with QTS 0.157 -0.084 0.081 15.972 0.000 33Teachers’ average salary 2809.437 -1186.327 1407.108 8.150 0.000 49† Note: This table contains statistics on the distribution of principal fixed effects and their overall significance. In each
regression, the dependent variable is a college-level recruitment or wage variable, and controls include total average KS2score, total average KS4 score, ethnicity, gender, whether the pupil ever received free school meals, institution and year fixedeffects. Standard errors are clustered at the college level. Statistics presented in this table apply the shrinkage estimator. TheF-stat and associated P-value are obtained from a model assuming general heteroscedasticity, with robust standard errors.QTS stands for Qualified Teacher Status. Teachers’ average salary is for full-time teachers. Panel A shows the results whenall available observations are used, whereas panel B uses the sample of colleges where there is at least one switcher.
28

Appendix 1. Treatment of duplicates and attrition in the SIRdataset
Participation in the SIR data collection is voluntary for colleges. Therefore, some colleges havenot returned the information every year. To avoid having discontinuities in the data, the SIR datais reported by using a “backfill methodology” to fill the missing variables. This method consistsof using the information available in a given year to fill the missing information in previousyears. Intuitively, this artificial solution to attrition can be problematic for two reasons. First,replacing missing information by its value from the previous year can create significant noise inthe available information. Second, for all backfilled years, the college level data omits the newrecruitment of staff members. This means that, for backfilled years, not only the characteristicsof the staff members might be incorrect, but also the number of staff members in a college(which omits turnover and new staff recruitments). Fortunately, the backfilled variables are allidentified. Table A1 reports the percentage of information that has been backfilled for each yearavailable in the sample. Attrition rises significantly from 2010/2011 to 2013/14. In the analysis,we keep backfilled information but control for a dummy indicating whether the information hasbeen backfilled for a given college and academic year.
Table 10: Percentage of observations affected by backfilling
Academic Year Percent not backfilled Percent backfilled2004/05 90.29 9.712005/06 91.86 8.142006/07 75.06 24.942007/08 91.12 8.882008/09 79.87 20.132009/10 75.38 24.622010/11 59.38 40.622011/12 46.22 53.782012/13 38.94 61.062013/14 41.52 58.48Total 71.59 28.41† Note: Percentage of observations affected by backfilling in the Staff
Individualised Records (SIR) dataset.
29

CVER PUBLICATIONS
Research Papers
Building apprentices’ skills in the workplace: Car Service in Germany, the UK and Spain, CVER Research Paper 011, December 2017 Philipp Grollmann, Hilary Steedman, Anika Jansen and Robert Gray
Apprenticeships for Young People in England: Is there a Payoff? CVER Research Paper 010, November 2017 Chiara Cavaglia, Sandra McNally and Guglielmo Ventura
The Payoff to Vocational Qualifications: Reconciling Estimates from Survey and Administrative Data, CVER Research Paper 009, November 2017 Gavan Conlon, Sophie Hedges, Steven McIntosh, Damon Morris and Pietro Patrignani
Peer Effects and Social Influence in Post-16 Educational Choice, CVER Research Paper 008, November 2017 Sophie Hedges and Stefan Speckesser,
The earnings differentials associated with vocational education and training using the Longitudinal Education Outcomes data, CVER Research Paper 008, October 2017 Gavan Conlon, Sophie Hedges and Pietro Patrignani
The longer the better? The impact of the 2012 apprenticeship reform in England on achievement and other outcomes, CVER Research Paper 006, September 2017 Vahé Nafilyan and Stefan Speckesser
Post 16 remedial policies: a literature review, CVER Research Paper 005, April 2017 Clémentine Van Effenterre
Young people in low level vocational education: characteristics, trajectories and labour market outcomes CVER Research Paper 004, March 2017 Sophie Hedges, Vahé Nafilyan, Stefan Speckesser and Augustin de Coulon
Vocational vs. General Education and Employment over the Life-Cycle: New Evidence from PIAAC CVER Research Paper 003, November 2016 Franziska Hampf and Ludger Woessmann
Labour Market Returns to Vocational Qualifications in the Labour Force Survey, CVER Research Paper 002, October 2016 Steven McIntosh and Damon Morris
Post-Compulsory Education in England: Choices and Implications, CVER Research Paper 001, July 2016 Claudia Hupkau, Sandra McNally, Jenifer Ruiz-Valenzuela and Guglielmo Ventura

Briefing Notes
Effectiveness of CEOs in the Public Sector: Evidence from Further Education Institutions, CVER Briefing Note 005, December 2017 Jenifer Ruiz-Valenzuela, Camille Terrier, Clémentine Van Effenterre
An analysis of the duration and achievement of apprenticeships in England, CVER Briefing Note 004, September 2017 Matthew Bursnall, Vahé Nafilyan, Stefan Speckesser
The incidence of publicly funded training in England, CVER Briefing Note 003, March 2017 Gavan Conlon, Sophie Hedges, Daniel Herr and Pietro Patrignani
The Decision to Undertake an Apprenticeship: A Case Study, CVER Briefing Note 002, March 2017 Steven McIntosh
Further Education in England: Learners and Institutions, CVER Briefing Note 001, February 2017 Claudia Hupkau and Guglielmo Ventura
http://cver.lse.ac.uk