Embed Size (px)
Citation preview

‘Effective visualization of strategy’ Master Thesis
FACULTY OF BEHAVIOURAL MANAGEMENT AND SOCIAL SCIENCES UNIVERSITY OF TWENTE
Name: Z.I.M. Geuke
Student number:
s1209957
Supervisors: Dr.ir. E. Hofman
R. Siebelink MSc
Date: 17-12-2018
2
Abstract
Appropriate management of strategy is essential for the survival and success of businesses.
Effective communication is key for effective implementation of strategy. The use of
visualization in strategy communication has effects on the quality of the communication.
Various studies find contradictory results regarding whether these effects are positive or
negative. A systematic discourse on how visualization can be successfully implemented in
strategy communication does currently not exist. In this study, the first step towards creating
such a discourse is made. Requirements for the effective use of strategy visualizations were
formulated. The key drivers of these requirements were determined to be strategic content,
strategy communication, functional visuals and usability. An existing strategy visualization
method, technology roadmapping, was analyzed using the requirements. Technology
roadmaps scored predominantly positive, according to the formulated requirements, but
showed some room for improvement. A recommendation is made that addresses the
shortcomings that technology roadmaps showed during the analysis. In conclusion, in order to
effectively visualize strategy, the main focus during the design phase should be addressing its
strategic content, strategic communication value, functional visuals and usability.
3
Table of contents
Abstract .................................................................................................................................................. 2
1. Introduction ................................................................................................................................... 4
2. Research Design ................................................................................................................................. 6
2.1 Problem statement ............................................................................................................ 6
2.2 Research objectives and questions ................................................................................... 6
2.3 Research model ................................................................................................................ 7
2.4 Methodology .................................................................................................................... 8
3. Problem investigation: .................................................................................................................... 16
3.1 Strategy: definition and description ............................................................................... 16
3.2 Strategy communication: definition and description ..................................................... 17
3.3 Strategy communication: managing change .................................................................. 18
3.4 Strategy communication: obstacles ................................................................................ 19
3.5 Strategy communication: effectiveness .......................................................................... 21
3.6 Visualization: definition and description ....................................................................... 22
3.7 Visualization in communication: benefits & disadvantages .......................................... 22
3.8 Visualization methods .................................................................................................... 25
3.9 Visualization of strategy ................................................................................................. 26
3.10 Visualization of strategy: design criteria ...................................................................... 27
3.11 Stakeholders of strategy communication ..................................................................... 29
3.12 Summary of literature review ....................................................................................... 30
4. Treatment design ............................................................................................................................. 32
4.1 Introduction .................................................................................................................... 32
4.2 Key driver method .......................................................................................................... 32
5. Case: technology roadmapping ...................................................................................................... 43
5.1 Scoring the technology roadmap .................................................................................... 43
5.2 Analysis .......................................................................................................................... 46
5.3 Validation ....................................................................................................................... 49
5.3 Recommendation ............................................................................................................ 51
6. Conclusion ........................................................................................................................................ 56
7. Discussion ......................................................................................................................................... 57
7.1 Findings .......................................................................................................................... 57
7.2 Comparison to other studies ........................................................................................... 58
7.3 Limitations ..................................................................................................................... 58
7.4 Implications .................................................................................................................... 59
8. References ........................................................................................................................................ 60
4
1.Introduction The world is perpetually changing, becoming increasingly complex. conditions change
and uncertainty arises. Businesses have to continuously adapt accordingly, to cope with the
changing circumstances (Grant, 2003). The survival and success of businesses is affected by
its ability to manage its strategy (Teece, Pisano & Shuen, 1997). A strategy can be defined as
a pattern in decisions with regards to the intended approaches to change (Mintzberg, 1978).
Hrebiniak (2006) states that the implementation of a strategy yields several problems.
These problems share a common driver, as most relate to the fact that strategy formulation
and strategy implementation are interdependent and often executed by different actors.
Careful strategy design does not always translate to effective execution of said strategy.
Hrebiniak argues that communication, through transfer of knowledge and achieving
coordination across operating units within a business, is vital to strategic success.
Communication during strategy execution quickly becomes a challenge, since organizations
oftentimes consist of multiple layers, different departments, and various functions, all of
which can play different parts in said execution (Hrebiniak, 2006).
The stakeholders of strategy communication are all parties that come into contact with
the strategy, its communication, implementation and consequences. The stakeholders can be
divided into four categories. Top management (Breene, Nunes & Shill, 2007), middle
management (Shi, Markoczy & Dess, 2009), regular employees (Hambrick & Canella, 1989)
and shareholders (Kaplan & Norton, 2004; Velasco, 2006). These stakeholders must
collectively make sure that the strategy is formulated, designed, communicated, and
implemented in such a way that all parties are sufficiently informed about the relevant
implications of said strategy.
Lengler & Eppler (2007) emphasize that a communicator should not only be occupied
with conveying the message, but also shape the message to the recipient’s context, in such a
way that this recipient can reconstruct the knowledge, integrate it and put it to meaningful
action. Li, Guo-hui & Eppler (2011) found four dominant problem areas of strategy
communication: awareness and attention to strategy information, understanding and
comprehension of the strategy, agreement and support of the strategy, and retention or recall
of the strategic content.
There are multiple methods of communication. Many businesses, due to their size,
have no other option than to use mediated communication methods for strategy
communication, rather than having all communication take place face-to-face. The benefit of
mediated communication methods lies in its multiplicative power and its speed to reach a
larger audience (Fidler & Johnson, 1984). The weakness of mediated communication methods
could be considered its effectiveness when it comes to higher complexities. The complexity of
strategies is variable, as complexity can be described to be the amount of all relevant variables
5
and interactions (Sommer & Loch, 2004). In order to communicate strategies of larger
complexity, communication methods have to be appropriate and of sufficient quality.
The communication methods that businesses use to communicate their strategy are not
always of sufficient quality. Cummings & Angwin (2011) found that many employees of
organizations are not sure what they are meant to do to enact the company’s strategy. In a
survey by Hunter & O’Shannassy (2007), 79% of the respondents indicated the need to more
effectively communicate strategy internally. This suggests that current communication
methods are often lacking in quality.
A solution for this lack of quality in communication methods can be found in the
conceptualization and visualization of strategy (Farace, Monge & Russell, 1977; Foos &
Goolkasian, 2005; Kernbach, Eppler & Bresciani, 2015). Burkhard (2005a) found evidence
that there is a huge potential when complementary visualizations are used during strategy
implementation, but a systematic discourse on how to actually implement visualization in
strategy communication is currently missing.
The findings of Griffin (1995), Bresciani & Eppler (2009) and Vliegen & van Wijk
(2006) suggest that the use of visualization in strategy communication affects communication
quality negatively. Visual representations could for example be interpreted differently, and
strategy visualizations might not always be fit for use given the specific context.
This study is intended to investigate the use of visualization in the communication of
strategy. The findings of various scholars, such as those stated above, suggest that there is a
fine line between the effective use of visualization in strategy communication, and making
communication of strategy more difficult by (ineffectively) implementing visualization.
The objective of this study is to find how strategy can be effectively visualized, so that
it improves the quality of strategy communication between stakeholders. Ultimately, the goal
of this study was to make a recommendation regarding the effective implementation of
visualization in strategy communication. This recommendation has been constructed by
creating a substantiated list of requirements that effective strategy visualizations have to meet
in order to be considered effective. The requirements for strategy visualizations were
determined using the design cycle from the design science methodology (Wieringa, 2014),
after which these requirements have been analysed using the key driver method (Heemels &
Somers, 2006).
In order to formulate the recommendation, a strategy visualization method was used as
a case. This visualization method has been analysed using the newly constructed list of
requirements. Suggestions for improvement of this visualization method were made based on
its performance with regards to the requirements.
6
2. Research Design
2.1 Problem statement
Businesses have to continuously adapt in order to cope with changing circumstances
and conditions (Grant, 2003). They do so by implementing new strategies or adapting their
current strategy. In order for strategies to work, communication is key (Hrebiniak, 2006).
Communication is a complex and time-consuming process. Larger businesses tend to use
mediated communication methods, which are characterized by the use of information systems,
due to their multiplicative power and its speed to reach a larger audience (Fidler & Johnson,
1984). The use of mediated communication does however pose a weakness, as mediated
communication methods have a lower effectiveness when it comes to communication of
strategies of higher complexity (Fidler & Johnson, 1984).
A solution for decreasing the complexity through communication could be found in
conceptualization and visualization of strategy. Various scholars have found the use of
visualization to have positive effects on the quality of strategy communication (Farace,
Monge & Russell, 1977; Foos & Goolkasian, 2005; Kernbach, Eppler & Bresciani, 2015).
Others have found that the use of visualization can have negative effects on the quality of
strategy communication (Griffin, 1995; Bresciani & Eppler, 2009; Vliegen & van Wijk,
2006).
The problem addressed in this study is the contradiction in the results of various
scholars regarding the effects of the use of visualization in strategy communication. Their
contradicting results suggest that the use of visualization in strategy communication can have
positive effects, but only when done properly. How this can actually be done seems not to be
clear. Burkhard (2005a) supports this statement, as he states that there is no clear discourse on
how to implement visualization in strategy communication. He found evidence that there is a
huge potential when visualizations are used for strategy communication.
The goal of this study was to make a recommendation regarding how strategy can be
visualized effectively so that it improves the quality of strategy communication between
stakeholders. This recommendation was formulated using a case, the strategy visualization
method of technology roadmapping. This visualization method was used as the base of the
recommendation, it has been analysed and suggestions towards its improvement have been.
2.2 Research objectives and questions
In order to make a recommendation, the needs and requirements of all the different
stakeholders regarding strategy communication had to be assessed. The researcher set out to
find in literature what research has already been done regarding the use of visualization in
communication of business strategies. This lead to the formulation of the following main
research objectives and the sub-objectives. For each of these objectives, the research
questions that are considered relevant are shown.
7
Main objective: To make a recommendation on the effective use of strategy visualization to
improve strategy communication between stakeholders.
A: How to effectively visualize strategy in order to improve communication of strategy
between stakeholders?
Sub-objective 1: Define strategy communication
A: What is strategy communication?
Sub-objective 2: Determination of effectiveness in strategy communication
A: What determines effective strategy communication?
B: What obstacles are there that hinder effective strategy communication?
Sub-objective 3: Defining strategy visualization and its use
A: How can strategy be visualized?
B: What determines effective strategy visualization?
C: How does the use of visualization affect strategy communication?
Sub-objective 4: Determination of the role of stakeholders in strategy communication
A: Who are the stakeholders in strategy communication?
B: How is communication of strategy different for the different stakeholders?
C: What requirements do the different stakeholders have for strategy visualization?
2.3 Research model
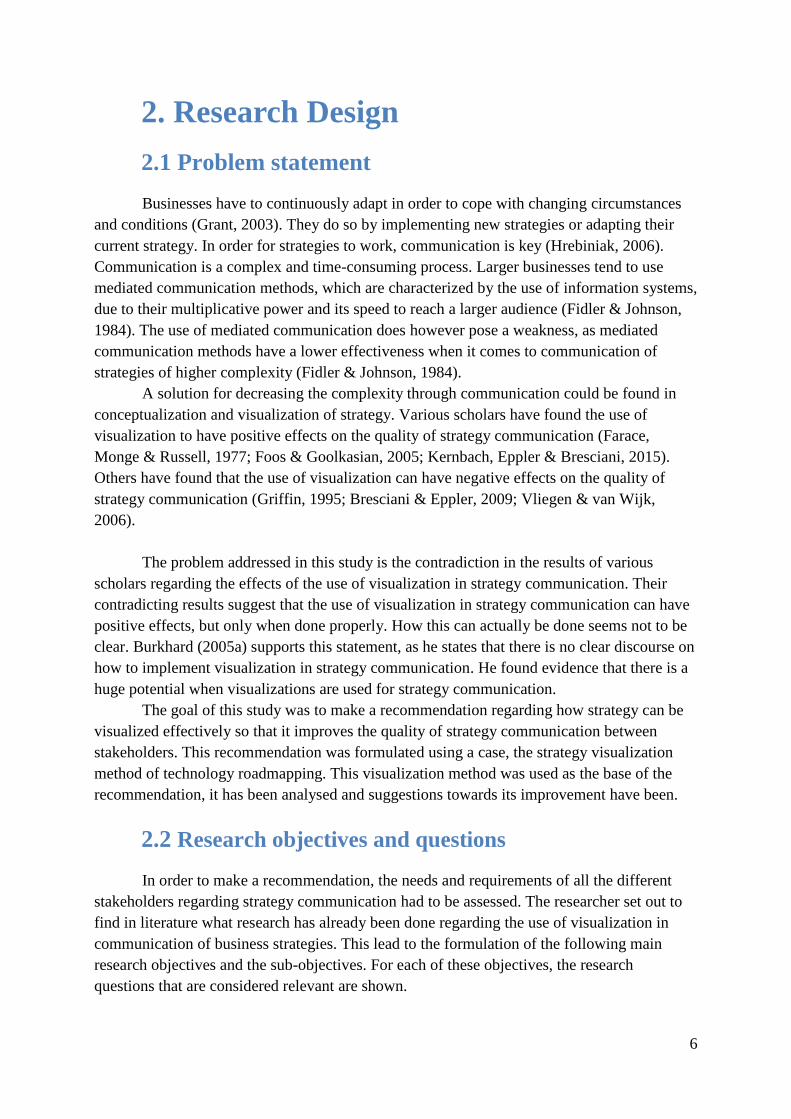
A research model has been developed to give an overview of the course of this study.
This research model is based on the theory by Doorewaard & Verschuren (2007) and is shown
in Figure 1. The essence is: Visualization theory has been consulted to look into effective
visualization methods, and requirements for effective strategy visualization have been
formulated. Communication theory was consulted to determine when strategy communication
can be considered effective, and requirements for effective strategy communication have been
formulated. Stakeholders of strategy communication were identified, and requirements that
they have for the effective use of strategy visualization in strategy communication have been
formulated, also, a strategy executive has been interviewed. The four sources of requirements
were combined by performing the key driver method. The results of this key driver method
have been applied to a case, the strategy visualization method of technology roadmapping, in
order to formulate a recommendation regarding the use of strategy visualization in strategy
communication.
8
Figure 1: Research model, based on theory by Doorewaard & Verschuren (2007)
2.4 Methodology
2.4.1 Design cycle
2.4.1.1 Description
Assuming that a new, effective strategy visualization is to be created, it has to be
designed systematically. Design can be done using different techniques, but in this study the
design cycle from the design science methodology has been (partially) used (Wieringa, 2014).
This method has been selected due to the fact that it is a rational process meant for designing
treatment, that incorporates the requirements from different stakeholders. Wieringa states that
treatment is a better term to use here than solutions, as there is a possibility that the designed
‘solution’ may solve a problem only partially or not at all, it could also introduce new
problems.
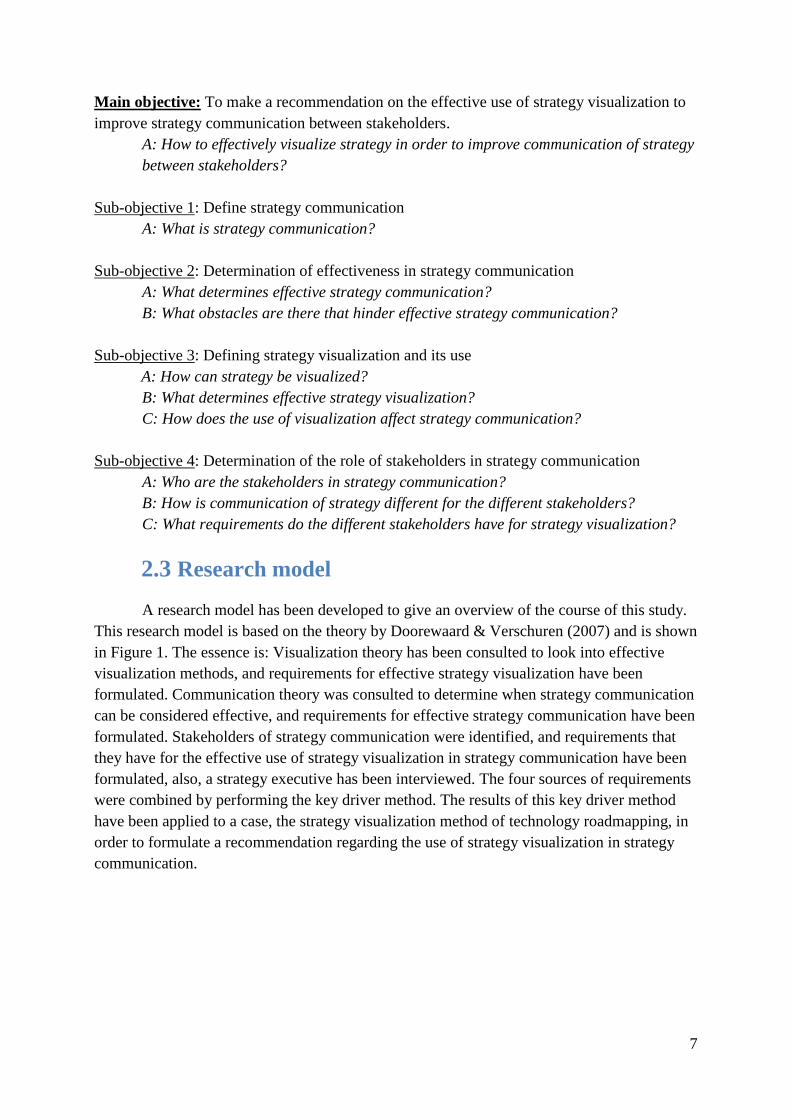
According to Wieringa (2014), the design cycle is decomposed into three tasks,
namely, problem investigation, treatment design, treatment validation, described more
thoroughly in the next section. The design cycle is part of a larger cycle, the engineering
cycle, which also incorporates treatment implementation and implementation evaluation,
shown in Figure 2 below.
Figure 2: Design cycle (Wieringa, 2014)
9
The scope of this study limits itself to parts of the first three steps of the design cycle.
The problem was investigated and put into perspective, and a set of requirements for a
treatment to this problem was constructed. This set of requirements was then be used to assess
an already existing treatment. After analysing the existing treatment, a recommendation has
been written for the design of a more effective treatment for the problem at hand. This
recommendation was then be validated by performing an expert review.
2.4.1.2 Design cycle steps
Problem investigation: The researcher sets out to describe what phenomena must be
improved, and why, by doing so, the problem will be identified, described, explained and
evaluated. The stakeholders of the problem have to be determined, and their role with regards
to the problem described. A conceptual framework is to be created so that the research
problem can be framed, putting it into the right perspective.
Treatment design: The researcher must specify requirements for a treatment to the
problem, and must note assumptions that are made due to the context of the problem. Also
requirements that stakeholders have for the treatment have to be considered. If there are any
treatments already available, these can be looked into, to find strengths and weak spots.
Ultimately, a new treatment is to be designed.
Treatment validation: The researcher sets out to validate the designed treatment. Does
the designed treatment satisfy the requirements that have been listed for it. Does the treatment
produce the effects that it was designed to do?
The next section will describe how and to what extent the three steps of the design
cycle will be followed through with in this study.
2.4.1.3 Problem investigation
During the first step of the design cycle, literature research has been done in order to
create a baseline of understanding regarding the problem at hand. Next, the researcher set out
to find out what research has already been done.
The topics that are relevant to this research are strategy communication, effective
communication, visualization of strategy and stakeholders of strategy communication. The
goal here is to answer the research sub-questions that have been formulated for these topics.
First, a literature review has been done to elaborate on strategy communication, this
was done to figure out what content is communicated exactly, and what techniques or
methods are currently used in order to communicate said strategy. Subsequently, literature has
been consulted to determine when strategy communication is considered to be effective, and
what obstacles one can run into while trying to communicate strategy effectively. Next,
visualization literature was reviewed to see how strategy can be visualized, how visualization
can be incorporated into strategy communication, and how this affects said strategy
communication. Last, the stakeholders of strategy communication have been identified using
literature. The role of each stakeholder towards the problem has been be described, and put
into context.
10
2.4.1.4 Treatment design
Now that the specific problem has been defined, it can be addressed. In order to
address the problem with a treatment, a list of requirements for said treatment has to be
constructed. These requirements can be stakeholder requirements, system requirements or
organizational requirements. These requirements also have to be weighed appropriately to the
context.
In order to be able to create a requirements list that provides a structured overview,
rather than just an unordered list of requirements, the key driver method was used. The key
driver method is a structured approach to obtain system requirements in a systematic way and
provide an structured overview of said requirements (Heemels & Somers, 2006). For this
reason, the key driver method fits well in the overall structure of the design cycle.
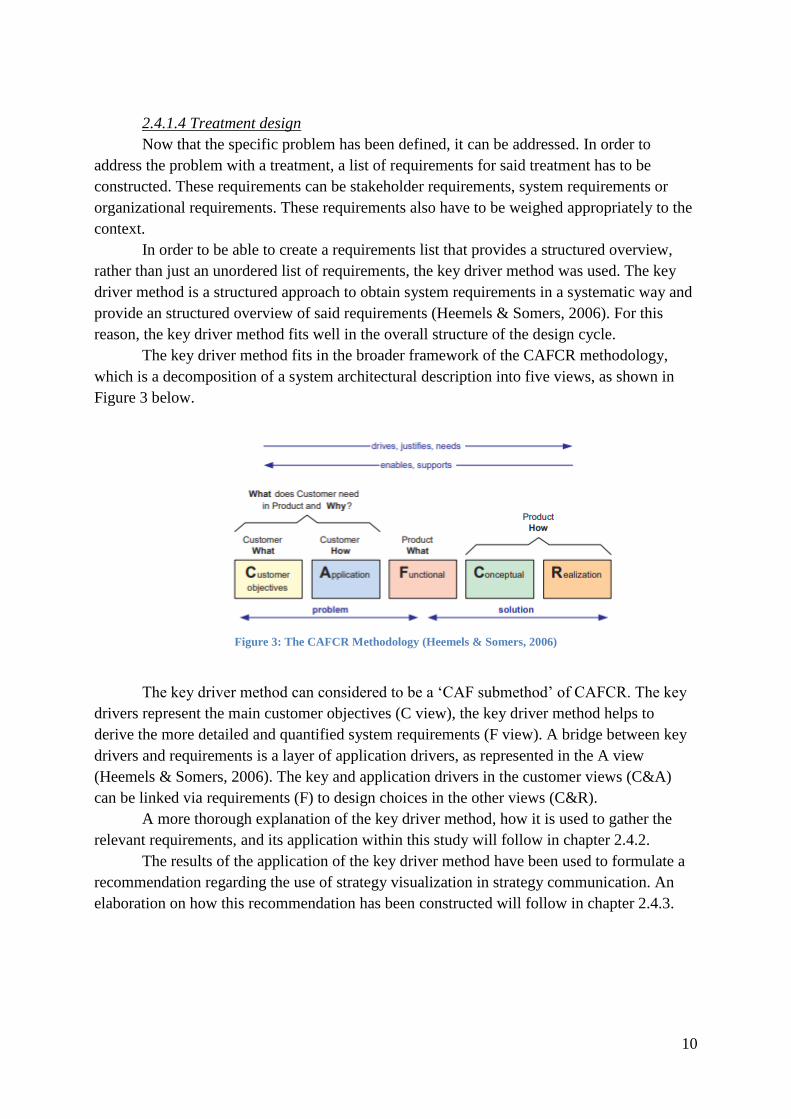
The key driver method fits in the broader framework of the CAFCR methodology,
which is a decomposition of a system architectural description into five views, as shown in
Figure 3 below.
Figure 3: The CAFCR Methodology (Heemels & Somers, 2006)
The key driver method can considered to be a ‘CAF submethod’ of CAFCR. The key
drivers represent the main customer objectives (C view), the key driver method helps to
derive the more detailed and quantified system requirements (F view). A bridge between key
drivers and requirements is a layer of application drivers, as represented in the A view
(Heemels & Somers, 2006). The key and application drivers in the customer views (C&A)
can be linked via requirements (F) to design choices in the other views (C&R).
A more thorough explanation of the key driver method, how it is used to gather the
relevant requirements, and its application within this study will follow in chapter 2.4.2.
The results of the application of the key driver method have been used to formulate a
recommendation regarding the use of strategy visualization in strategy communication. An
elaboration on how this recommendation has been constructed will follow in chapter 2.4.3.
11
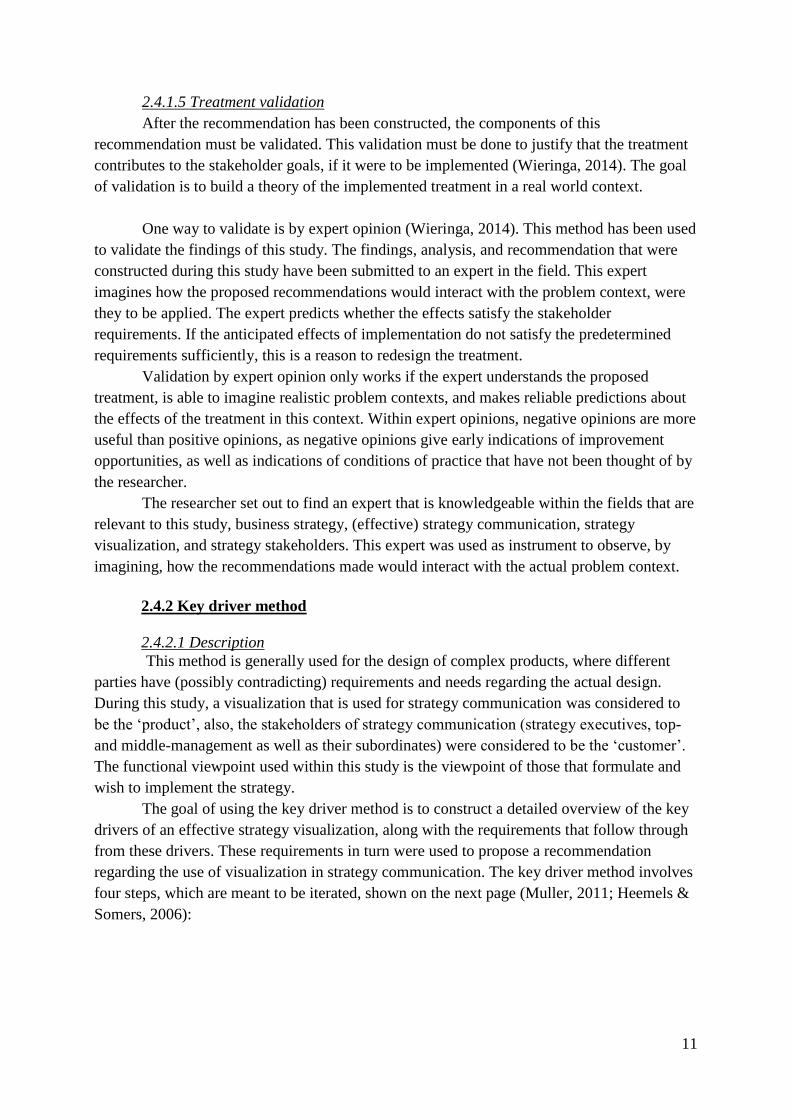
2.4.1.5 Treatment validation
After the recommendation has been constructed, the components of this
recommendation must be validated. This validation must be done to justify that the treatment
contributes to the stakeholder goals, if it were to be implemented (Wieringa, 2014). The goal
of validation is to build a theory of the implemented treatment in a real world context.
One way to validate is by expert opinion (Wieringa, 2014). This method has been used
to validate the findings of this study. The findings, analysis, and recommendation that were
constructed during this study have been submitted to an expert in the field. This expert
imagines how the proposed recommendations would interact with the problem context, were
they to be applied. The expert predicts whether the effects satisfy the stakeholder
requirements. If the anticipated effects of implementation do not satisfy the predetermined
requirements sufficiently, this is a reason to redesign the treatment.
Validation by expert opinion only works if the expert understands the proposed
treatment, is able to imagine realistic problem contexts, and makes reliable predictions about
the effects of the treatment in this context. Within expert opinions, negative opinions are more
useful than positive opinions, as negative opinions give early indications of improvement
opportunities, as well as indications of conditions of practice that have not been thought of by
the researcher.
The researcher set out to find an expert that is knowledgeable within the fields that are
relevant to this study, business strategy, (effective) strategy communication, strategy
visualization, and strategy stakeholders. This expert was used as instrument to observe, by
imagining, how the recommendations made would interact with the actual problem context.
2.4.2 Key driver method
2.4.2.1 Description
This method is generally used for the design of complex products, where different
parties have (possibly contradicting) requirements and needs regarding the actual design.
During this study, a visualization that is used for strategy communication was considered to
be the ‘product’, also, the stakeholders of strategy communication (strategy executives, top-
and middle-management as well as their subordinates) were considered to be the ‘customer’.
The functional viewpoint used within this study is the viewpoint of those that formulate and
wish to implement the strategy.
The goal of using the key driver method is to construct a detailed overview of the key
drivers of an effective strategy visualization, along with the requirements that follow through
from these drivers. These requirements in turn were used to propose a recommendation
regarding the use of visualization in strategy communication. The key driver method involves
four steps, which are meant to be iterated, shown on the next page (Muller, 2011; Heemels &
Somers, 2006):

12
2.4.2.2 Key driver method steps
1. Define the scope specific
- Who are considered to be the stakeholders in this situation, and what is considered
relevant to them? How are the stakeholders interconnected, and how does this translate
to certain requirements? Does the context of strategy communication and the use of
visualization within said communication create any new requirements that are not
directly related to the stakeholders?
2. Acquire and analyze facts
- Extract facts from product specifications and ask why questions about the
specification of existing products. Literature was reviewed to find whether strategy
communication in itself introduces requirements for a strategy visualization. A
stakeholder analysis was done to construct the stakeholder requirements for strategy
visualizations.
3. Build a graph of relations between drivers and requirements
- List all requirements from all stakeholders, and find the key drivers by comparing
similarities of requirements, also look for contradicting requirements, build a graph of
the relations between drivers and requirements. One requirement can serve multiple
key-drivers, and one key-driver results in many different requirements.
4. Obtain feedback
- In order to put the graph of requirements and drivers to the test, it can be discussed
with different stakeholders. This could result in new insights or requirements that had
previously not been considered.
2.4.2.3 Requirements gathering
To be able to make a valid list of requirements, a set of steps has to be followed
through with (Muller, 2011):
1. Stakeholders and their wishes, wants, and needs
- It has to be clear who the stakeholders are, what they want to achieve with the product,
and why. This can be done by, for example, doing a stakeholder analysis (Harrison &
St John, 1998). The stakeholders’ requirements were formulated by reviewing
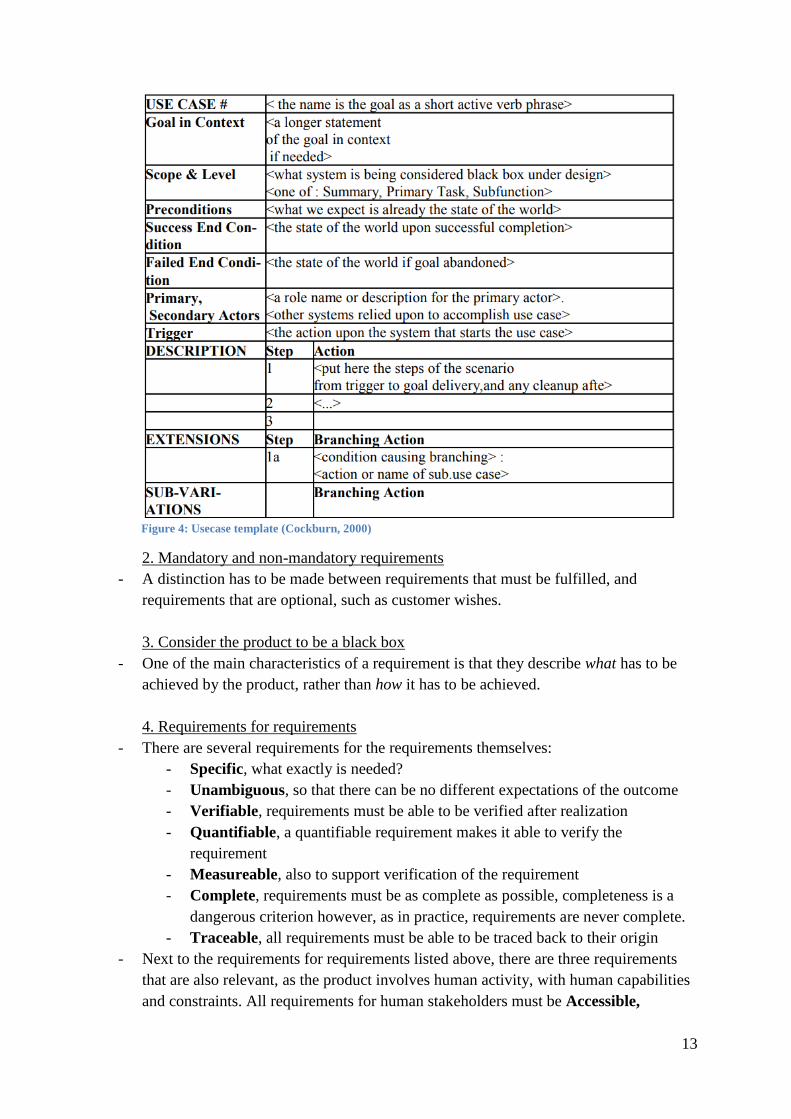
literature, and performing use cases. Cockburn (2000) argues that use cases are the
norm for writing functional requirements for object-oriented information systems,
which makes this method The use cases are based on a template by Cockburn (2000),
shown in Figure 4 on the next page.
13
Figure 4: Usecase template (Cockburn, 2000)
2. Mandatory and non-mandatory requirements
- A distinction has to be made between requirements that must be fulfilled, and
requirements that are optional, such as customer wishes.
3. Consider the product to be a black box
- One of the main characteristics of a requirement is that they describe what has to be
achieved by the product, rather than how it has to be achieved.
4. Requirements for requirements
- There are several requirements for the requirements themselves:
- Specific, what exactly is needed?
- Unambiguous, so that there can be no different expectations of the outcome
- Verifiable, requirements must be able to be verified after realization
- Quantifiable, a quantifiable requirement makes it able to verify the
requirement
- Measureable, also to support verification of the requirement
- Complete, requirements must be as complete as possible, completeness is a
dangerous criterion however, as in practice, requirements are never complete.
- Traceable, all requirements must be able to be traced back to their origin
- Next to the requirements for requirements listed above, there are three requirements
that are also relevant, as the product involves human activity, with human capabilities
and constraints. All requirements for human stakeholders must be Accessible,
14
Understandable, and have a Low threshold. These three requirements may be
conflicting with requirements prescribed in the requirement management process.
Many problems in practice can be traced back to violation of the human-imposed
requirements(Muller, 2011).
2.4.3 Recommendation: Case study
2.4.3.1 Preparation of the recommendation
After determining the key drivers of effective use of strategy visualization in strategy
communication, these key drivers can be used to formulate a recommendation. This
recommendation is made using an existing strategy visualization method as base. This
strategy visualization method was analysed using the key drivers that have been formulated
during the earlier phase. Ultimately, it is argued how the visualization method can be
improved, why it should be improved, and how this can be done.
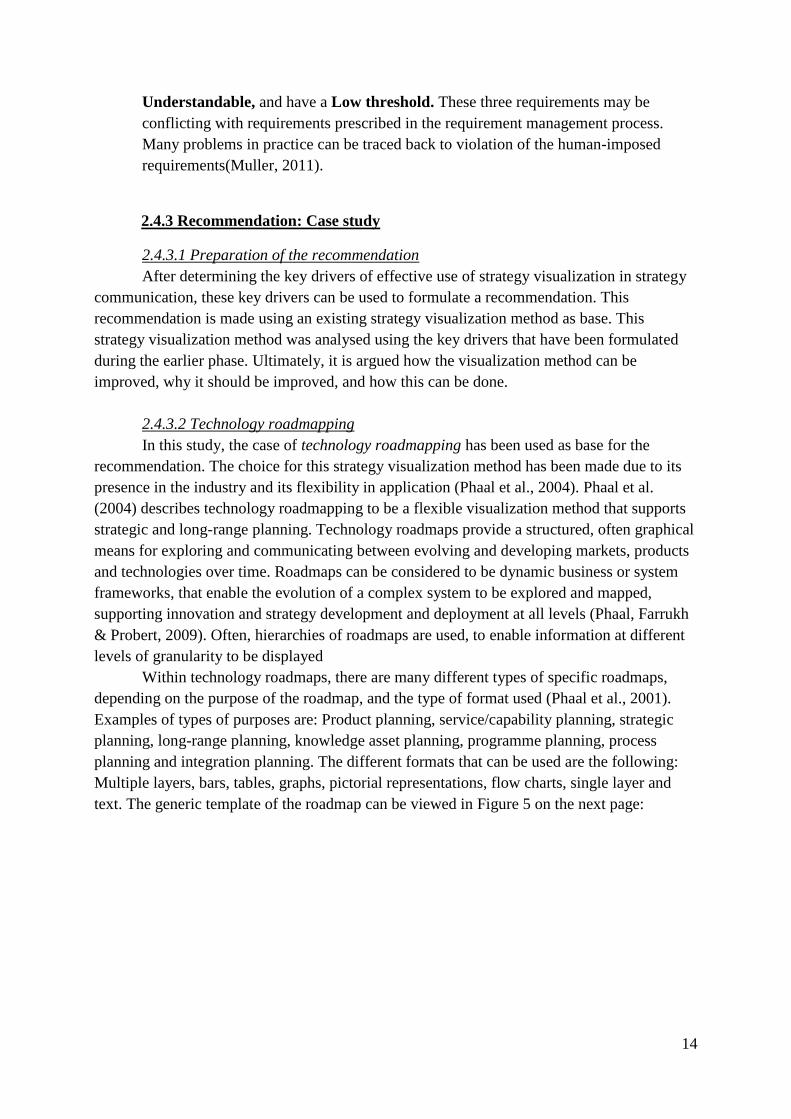
2.4.3.2 Technology roadmapping
In this study, the case of technology roadmapping has been used as base for the
recommendation. The choice for this strategy visualization method has been made due to its
presence in the industry and its flexibility in application (Phaal et al., 2004). Phaal et al.
(2004) describes technology roadmapping to be a flexible visualization method that supports
strategic and long-range planning. Technology roadmaps provide a structured, often graphical
means for exploring and communicating between evolving and developing markets, products
and technologies over time. Roadmaps can be considered to be dynamic business or system
frameworks, that enable the evolution of a complex system to be explored and mapped,
supporting innovation and strategy development and deployment at all levels (Phaal, Farrukh
& Probert, 2009). Often, hierarchies of roadmaps are used, to enable information at different
levels of granularity to be displayed
Within technology roadmaps, there are many different types of specific roadmaps,
depending on the purpose of the roadmap, and the type of format used (Phaal et al., 2001).
Examples of types of purposes are: Product planning, service/capability planning, strategic
planning, long-range planning, knowledge asset planning, programme planning, process
planning and integration planning. The different formats that can be used are the following:
Multiple layers, bars, tables, graphs, pictorial representations, flow charts, single layer and
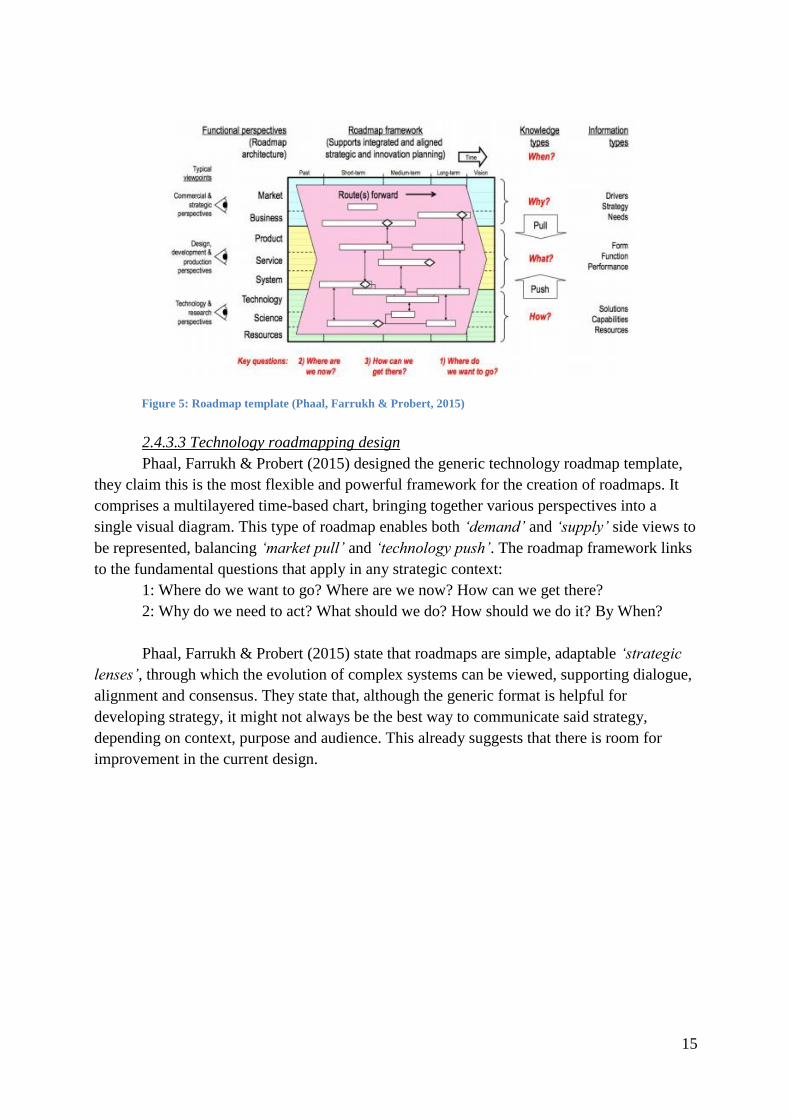
text. The generic template of the roadmap can be viewed in Figure 5 on the next page:
15
2.4.3.3 Technology roadmapping design
Phaal, Farrukh & Probert (2015) designed the generic technology roadmap template,
they claim this is the most flexible and powerful framework for the creation of roadmaps. It
comprises a multilayered time-based chart, bringing together various perspectives into a
single visual diagram. This type of roadmap enables both ‘demand’ and ‘supply’ side views to
be represented, balancing ‘market pull’ and ‘technology push’. The roadmap framework links
to the fundamental questions that apply in any strategic context:
1: Where do we want to go? Where are we now? How can we get there?
2: Why do we need to act? What should we do? How should we do it? By When?
Phaal, Farrukh & Probert (2015) state that roadmaps are simple, adaptable ‘strategic
lenses’, through which the evolution of complex systems can be viewed, supporting dialogue,
alignment and consensus. They state that, although the generic format is helpful for
developing strategy, it might not always be the best way to communicate said strategy,
depending on context, purpose and audience. This already suggests that there is room for
improvement in the current design.
Figure 5: Roadmap template (Phaal, Farrukh & Probert, 2015)
16
3. Problem investigation:
In this literature review, the researcher showcases previous research regarding the
relevant topics: strategy communication, effective communication, visualization of strategy
and stakeholders of strategy communication. The goal here is to answer the research sub-
questions that have been formulated for these topics.
3.1 Strategy: definition and description
A strategy can be defined as a pattern in a stream of decisions with regards to the
intended changes (Mintzberg, 1978). More specifically, business strategy can be summarized
as the set of plans designed to achieve a business’ goals, and strategic management is the set
of decisions and actions that result in the formulation and implementation of mentioned plans
(Koskei, 2003). Strategic management guides the aspects of general management that have
effects on the survival and success of businesses (Teece, Pisano & Shuen, 1997) Strategic
management can be divided in three interdependent steps, strategy formulation, strategy
implementation and strategy evaluation (David, 2011).
Strategy formulation consists multiple tasks, one is gathering and specifying the
objectives and goals of the business, and another task consists of planning actions for actors
within the business, these actions should be in accordance with the formulated objectives and
goals (David, 2011).
According to Hrebiniak and Joyce (1984), strategy implementation is a set of actions
regarding organizational structures, key personnel activities, and control systems designed to
control performance with respect to the desired ends. Similarly, Floyd and Wooldridge (1992)
state that implementation is the managerial interventions that align organizational actions with
strategic intention. In order to be able to communicate strategy implementation, all
departments of the business are required to be appropriately aligned (Beer, 1980;
Venkatraman & Camillus, 1984). Noble (1999) combined several perspectives on strategy
implementation, with a focus on the processes involved, this resulted in strategy
implementation being defined as the communication, interpretation, adoption and enactment
of strategic plans.
Strategy evaluation is the third step of strategic management, where the process of
strategy implementation is evaluated. During this third step, the business’ actions, as carried
out during the implementation stage, are monitored, to verify whether they are in line with the
business objectives or goals as described during the strategy formulation stage (David, 2011).
If evaluation is properly carried out, this creates a closed loop, feedback from the
implementation can be used in the next formulation stage.
Alternatively, strategies can form gradually, rather than being a set of the three steps
mentioned above. Strategy makers can choose to make strategic decisions one by one,
forming and adjusting the overarching strategy over time. Mintzberg (1978) refers to this as
strategy formation.
17
3.2 Strategy communication: definition and description
It is clear that there is a need for effective and sound inter-organizational
communication, in order to formulate, implement and evaluate strategies. The survival and
success of a business is partly dependent on the effectiveness of its strategic management
(Teece, Pisano & Shuen, 1997), therefore it is of importance that communication is of
sufficient quality. It could be argued that the implementation stage of a strategy consists
mostly of the communication of said strategy to all actors involved. Kaplan & Norton (2005)
define strategy communication as “Communicating and educating employees about the
strategy of the organization” (p. 18). They also state that effective communication to
employees about strategy, targets, and initiatives is vital if employees are to contribute to the
strategy (Kaplan & Norton, 2005).
Hrebiniak (2006) states that the implementation stage always involves more people
than the formulation stage. In addition to this, strategy implementation is usually played out
over longer periods of time. Communication down the organization, or across different
functions or departments, over a longer time span, becomes more of a challenge. Especially
when the number of people involved is large, the challenge of effective strategy
communication becomes greater. Hrebiniak (2006) also argues that communication through
transferring knowledge and achieving coordination across operating units within a business
are vital to strategic success.
Beer & Eisenstat (2000) state that one of the major barriers in strategy implementation
is poor vertical communication, this is in resemblance with what Hrebiniak (2006) argued.
When strategies are formulated, this is usually done in the upper side of the chain of
command. In order to implement said strategy, it has to be communicated vertically down the
organization, involving a larger amount of people.
Farace, Monge & Russell (1977) state that communication also plays a key role in
overcoming resistance to innovations and in the reduction of uncertainty. Strategy being an
innovation that has to be adopted by the entirety of the business, suggests that proper
communication is vital to successful implementation of said strategy.
Hambrick and Cannella (1989) argue that employees are the people who will make a
strategy work, requiring them to be fully informed about the intended changes to the current
course of events and underlying intentions of these changes. Employees have to be ‘sold’ a
strategy in order for it to work, requiring full understanding of said strategy. If the quality of
the executed communication is not sufficient, thus not having ‘sold’ the strategy to
employees, this will result in insufficiently informed employees, limiting adoption of changes,
and therefore making the implementation of a strategy less successful.
Fidler & Johnson (1984) state that an increase in communication is linked to a
decrease in uncertainty, therefore lowering resistance to adoption of new strategies.
Communication can be used as tool to counter to the problems that arise when strategies
become more complex, however, the proper execution of communication itself introduces
new obstacles too.
18
3.3 Strategy communication: managing change
Hrebiniak (2006) argues that there are two different approaches to managing large
changes due to implementation of new strategies; sequential or complex change. A sequential
intervention consist of smaller, more manageable pieces or proportions of the large change,
over a longer period of time, whereas a complex change consists of all changes to be
implemented simultaneously during a usually shorter implementation horizon. Depending on
the objectives of the implementation of a new strategy, and the anticipated time-horizon in
which these objectives are to be achieved, different approaches are appropriate. Hrebiniak
(2006) suggests that an organization that faces a large strategic change should always rely on
sequential change, when there a sufficient time span to do so. It could however be the case
that there simply is not enough time to perform all portions of the change step-by-step, where
complex change becomes the favourable choice. Below, the benefits and disadvantages of the
two types of change are listed.
Sequential change benefits from its step-by-step process, as this allows managers to
reduce resistance to change, as the success of the first stages in the change process can be
used to win over doubters who were originally against the entire intervention. Step-by-step
sequential change also allows cause-effect analysis of the independent steps, since the degree
of success during certain stages can be attributed to specific steps. Lastly, sequential change
allows for incremental investment of time, money and effort. There is no need to “bet the
entire house” on a new strategy, as small portions of an investment can be done with minimal
risk, lowering the overall risk profile and uncertainty for the organization (Hrebiniak, 2006).
Sequential change has several disadvantages that can be attributed to one
characteristic. Sequential change takes time. Different parts of the change are spread over the
course of months or even years. One disadvantage that results from this is that people lose
sight of the ultimate goals of the change. Another disadvantage of the long implementation
horizon of sequential change is the volatility of external factors, over the course of several
months to years, competitors’ actions or plans could change, consumers could change in
spending behaviour, rules and legislations presented by the government could change.
Sequential change must always be ready to adapt to any of these external sources of change.
Complex change, in contrast to sequential change, benefits most from its
implementation horizon, as complex change can be done over much shorter periods of time.
This shorter time span allows for quick adaptability to changes from external sources.
Complex change allows large problems to be confronted faster, and simultaneously.
It is however difficult to coordinate and control complex change, as too much is going
on at once. Secondly, cause-effect analysis is next-to impossible, as the effects of independent
steps of the larger change are almost not analysable. Third, learning suffers, resulting from the
inability to do cause-effect analysis, organizations are almost unable to learn from mistakes,
as it is unclear what portion of the overall change caused a certain outcome. Fourth, it is
necessary to relax the performance criteria against which people are held accountable. The
only way to make a complex change work, is to reduce its complexity.
19
Sommer & Loch (2004) describe complexity as the amount of variables and
interactions, they however also state that the use of the term complexity is not consistent in
literature. Using the definition of complexity of Sommer & Loch (2004), when there is a high
amount of variables and interaction, this leads to increased difficulty in assessing optimal
actions beforehand.
Fidler & Johnson (1984) define complexity as the number of dimensions along which
an innovation can be evaluated by a potential receiver, which makes it an inherent
characteristic of said innovation, innovation here being the business strategy. They argue that
a greater complexity leads to higher resistance to adopting a new strategy within the
organization. They also found greater complexities to be linked to a lower likelihood of
successful strategy implementation.
In the context of strategy, the variables or dimensions that are most relevant for
businesses are industry characteristics, environment, size, time span of change, and
objectives. Larger businesses, those that operate in uncertain industries and/or environments
and businesses with more complex objectives over shorter time spans, and all possible
combinations, are required to implement strategies of larger complexity to be able to cope
with its conditions. This higher complexity might result in added risk, higher inter-
organizational adoption resistance, uncertainty and a lower likelihood of successful
implementation (Fidler & Johnson, 1984).
The sequential change process as defined above, offers a method of reducing
complexity, it does this by spreading the objectives of a strategic change over a longer period
of time, this enables the business to account for changes in the industry or environment, while
taking its time to follow through with the steps required to make the larger overall change.
In turbulent, highly competitive and/or changing industries however, there could
simply be insufficient time to apply the sequential change process. A business might not have
the ability to timely react to external forces, and has to stay ahead. In order to be able to do so,
the business must find other methods of reducing complexity, enabling complex change
Summarizing the relevance of the change approaches and strategy complexity, time
spans of objectives are of great importance, change has to be made in an appropriate fashion,
accounting for all relevant (both internal and external) factors.
3.4 Strategy communication: obstacles
Next to the varying complexities of strategies, there are more obstacles that prevent
strategies to be communicated properly, e.g. Lengler & Eppler (2007) emphasize that the
communicator should not only be occupied with conveying the message, but also shape the
message to the recipient’s context, in such a way that this recipient can reconstruct the
knowledge, integrate it and put it to meaningful action.
Kaplan & Norton (2008) emphasize that strategies that are not communicated well are
very difficult to execute well. Executives would prefer a decent strategy that is executable by
their organization to a brilliant strategy that the organization does not understand and
therefore cannot deliver. In other words, a strategy that is clearly communicated enables better
strategy implementation. In a 2005 study, more than 90% of a company’s employees were
found not to be aware of its strategy, or not to comprehend it (Kaplan & Norton, 2005).

20
Kaplan & Norton (2008) state that employees can’t implement a strategy that they are not
aware of, and employees who do not understand the strategy are unable to link their daily
actions to its successful execution, management should therefore align employees with the
strategy. All employees have to understand the strategy and are motivated to achieve it, in
order for it to be successfully executed.
Cummings & Angwin (2011) found it not to be a surprise that many people in
organizations are not sure what to do to enact the company’s strategy, as a result of the fact
that company strategies are generally being captured in and communicated by documents and
generic PowerPoint presentations, that are packed with text and numbers. In a study by
Hunter & O’Shannassy (2007), 79% of respondents to a survey indicated the need to more
effectively communicate their strategy internally. This suggests that communication as it is
carried out now leans towards being of insufficient quality.
According to Hrebiniak (2006), one basic problem is that managers know more about
strategy formulation than implementation. They’ve been trained to plan, not implement plans.
A large difference can be distinguished between planning a strategy and executing
implementing strategy, since planning a strategy involves little communication, while
implementation consists largely of communication. Another problem Hrebiniak (2006) found
is that some top-level managers believe strategy implementation is ‘below them’ - something
best left to lower-level employees, while improper informed lower-level employees, as result
of insufficient communication, are unable to execute plans accordingly. This inability of
managers in execution or implementation of strategies is a result of most MBA programs
being focussed on strategy formulation and functional planning. Core courses are typically
about competitive strategy, marketing strategy, financial strategy etc. These core courses do
however lack the emphasis on the actual ‘doing’ (Hrebiniak, 2006).
Li, Guo-hui & Eppler (2011) did a literature review, reviewing 60 studies regarding
strategy implementation, and found four main problem areas that hinder said implementation:
attention, comprehension, agreement and retention.
Attention:
Consensus can not be achieved if lower-level management and nonmanagement are
not aware of the same information as those that are trying to implement the strategy,
therefore, proper attention to the strategic information needs to be stimulated. Kaplan &
Norton (2008) found that “employees cannot help implement a strategy that they are not
aware of”(p. 12)
Comprehension:
Employees who do not understand the strategy are unable to adjust their daily actions
to its successful implementation, it is deemed important that employees really understand the
strategy rather than just seeing or hearing about it. A shared understanding of management
and those at the operational level with the strategic goals is of critical importance for effective
implementation.
21
Agreement:
Management should align employees with the strategy, as the majority of employees is
required to agree with and be committed and motivated to implementing the strategy, in order
for it to work. Schaap (2006) concluded that “when employees do not understand and agree
with the company's strategic plan, there will be a much higher likelihood that the
implementation process of that plan will fail” (p. 23).
Retention:
The strategy needs to be communicated in a memorable way, to stimulate retention in
employees. An employee that can not remember the key elements of the strategy is an
employee who cannot participate to the successful execution of the strategy. Collis & Rukstad
(2008) state that few executives can remember the companies’ strategy enough to be able to
summarize it in such a way that colleagues would put it the same way. This suggests that said
executives have not been instructed about the strategy in a memorable way.
3.5 Strategy communication: effectiveness
Communication can be executed in various ways, but for communication to be
effectively executed, the problems summed above have to be overcome.
Fidler & Johnson (1984) found one of the primary structural features associated with
the diffusion of innovation within organizations to be the number and arrangement of
communication channels. Each channel has its own capacities with regard to the type and
volume of information that is to be shared among parties. The efficacy of communication
channels is important, as it partially determines the cost effectiveness of the process of
strategy implementation.
Rogers & Shoemaker (1971) state that there are two possible channels of
communication that have been focused on in innovation research: Interpersonal, involving
primarily face-to-face modalities; and mediated channels, which are usually a method that lies
between source and receiver (often referred to as mass media).
Carr & Kaynak (2007), state that there are multiple methods of communication,
traditional communication methods are those that involve the use of telephone, fax, email,
written and face-to-face contact. More advanced methods of communication are computer-to-
computer links, electronic data interchange and enterprise resource planning.
Interpersonal channels can often provide the social support and enhanced confidence
in the outcomes of the innovation that is crucial to the implementation of this innovation
(Katz, 1957; Katz, 1961). Mediated channels, usually written ones, provide information in a
more general way. The strength of mediated channels lies in its multiplicative power and its
speed to reach a larger audience (Fidler & Johnson, 1984). “For increasingly risky
innovations, interpersonal channels will become increasingly effective in innovation
implementation; conversely, with decreases in perceived risk, mediated channels become
more efficacious in innovation implementation” (Fidler & Johnson 1984, p. 708).
Communication costs that are linked to the use of interpersonal communication
channels are usually higher than those linked to mediated channels. Therefore, when risk and
complexity are low, mediated channels can widely distribute all essential information
22
regarding the intervention not only with a minimum of effort, but also costs (Rogers &
Shoemaker, 1971). It could be beneficial to find a method or mean of communication that
both benefits from the low effort and costs of a mediated channel, but also addresses potential
complexity issues.
One key for the better execution of strategies is thus to engage employees through a
better way of communicating the strategy. Many researchers have mentioned the
importance of communication for the strategy implementation process (Mazzola &
Kellermanns, 2010) and “communication is mentioned more frequently than any other
single item promoting successful strategy implementation” (Li, Guo-hui & Eppler, 2011, p.
18).
Yet, little empirical research has so far looked at what really constitutes effective
managerial communication of business strategies (Kernbach, Eppler & Bresciani, 2015).
Kernbach et al. (2015) state that strategy communication could benefit from the use of
visualization, as there are extensively documented benefits of graphic representations for
complex communication.
3.6 Visualization: definition and description
Visualization is a very broad concept, it includes everything that involves some kind
of graphical or visual display. MacEachren (1994) defines visualization as “to bring
something as picture before the mind” (p. 53). Usage of visualization can range from simple,
for example a euro-symbol (€) instead of ‘euro’ in plain text, to more complex, for example
an interactive map of air pressure over time, such as used in the weather report in the news. A
visualization can replace one word, but can also tell an entire story with one figure. When the
weather reporter shows a map such as described in the example, this carries a relatively large
message, one view of a weather map can explain the forecasted weather of a day or even
week to even those that are uninstructed.
3.7 Visualization in communication: benefits &
disadvantages
In psychology literature, Foos & Goolkasian (2005) state that people can receive and
understand instructions with higher complexities far more readily when they are presented
graphically, rather than textually. Further, individuals have better recall of pictures, while
printed words receive less attention. This suggests that adding visuals in the form of graphs or
pictures to mediated channel communication could make the use of mediated channels for
communication a more viable method when complexities are higher, while keeping effort and
costs low.
Farace, Monge & Russell (1997) argue that communication through mediated
communication channels benefits from the use of symbol systems, as these reduce
uncertainty, making the contents of the message more clear to readers. The reduction of
uncertainty subsequently contributes to the reduction of complexity. Symbol systems, when
properly implemented, are collections of symbols that evoke similar symbol-referent
23
relationships for both the sender and receiver of messages. This in turn makes it possible for
communication to be less filled with text.
Similarly, Rode (2000) has shown that processing information through the visual
system rather than through language can substantially increase the degree to which
complexity can be handled successfully. “Representing connected information visually rather
than verbally serves as an important tool to support knowledge capturing by reducing
working memory capacity demands and thus enhance our ability to perceive complex
relationships” (p. 7).
Tory & Möller (2004) state that visualization can support cognition of data or
information in various ways. visualization can increase resources through parallel processing,
offloading work to the perceptual system, reduce demands on human memory, and increase
storage and accessibility of information. Next to that, visualization can help group related
information, represent a large quantity of data in a small space, and impose structure on data
and tasks in such a way that it reduces task complexity. Visualization can also enhance
recognition, as visualizations of information are easier to be recognised than recalling said
information, and higher level patterns can be recognised if data is aggregated more
selectively. Visualization can also support cognition through perceptual monitoring and being
a manipulable medium, since using preattentive visual characteristics allows monitoring of a
large number of potential events, and manipulation of the structural organization of data may
allow different patterns to be recognised (Tory & Möller, 2004).
Kernbach, Eppler & Bresciani (2015) did an experiment to gather evidence regarding
whether the use of visualization is better than text in communication of a business strategy.
Subjects were found to pay significantly more attention to, agree more with and better recall
the strategy when they had seen a graphic representation of the strategy rather than a textually
identical bulleted list version. However, no significant difference could be found regarding
the comprehension of the strategy. Subjects that were shown graphic representations of
strategies perceived the presentation and presenter significantly more positively than those
that were shown bulleted lists.
Contrarily, Griffin (1995) found the use of visuals in business communication through
symbols to be more complicated. The use of symbols could be an aid in lowering complexity
when communicating. The meaning and message that symbols carry are however largely
dependent on how they are interpreted. “When considering the importance of business
communication and the fragile nature of the message, business people must recognize that
symbols mean different things to different people” (p. 186). Griffin (1995) also states that the
interpretation of certain symbols is influenced by cultural differences. This brings up the
following problem, how must visualization be implemented in communication, to ensuring
that said visuals represent the actual message correctly, to all receivers respectively.
Abdallah & Langley (2014) state that this ambiguity in strategic communication is not
necessarily bad, as it can offer considerable benefits, such as enabling strategic development
and change, and contribution to cyclical patterns of strategy development and reorientation.
Bresciani & Eppler (2009) did a literature review to investigate other potential pitfalls
of visualizations used for communication. They did so in order to attempt to deepen and
structure the understanding of the possible limitations of visualizations, rather than to
24
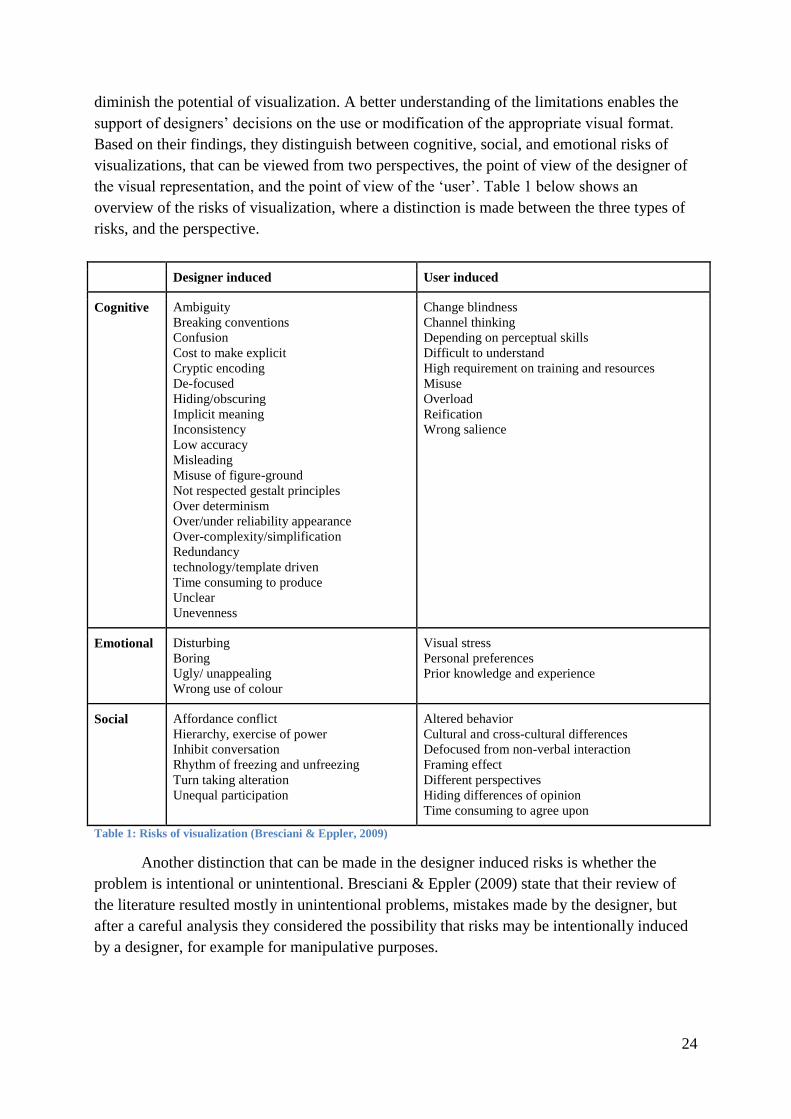
diminish the potential of visualization. A better understanding of the limitations enables the
support of designers’ decisions on the use or modification of the appropriate visual format.
Based on their findings, they distinguish between cognitive, social, and emotional risks of
visualizations, that can be viewed from two perspectives, the point of view of the designer of
the visual representation, and the point of view of the ‘user’. Table 1 below shows an
overview of the risks of visualization, where a distinction is made between the three types of
risks, and the perspective.
Designer induced User induced
Cognitive Ambiguity
Breaking conventions
Confusion
Cost to make explicit
Cryptic encoding
De-focused
Hiding/obscuring
Implicit meaning
Inconsistency
Low accuracy
Misleading
Misuse of figure-ground
Not respected gestalt principles
Over determinism
Over/under reliability appearance
Over-complexity/simplification
Redundancy
technology/template driven
Time consuming to produce
Unclear
Unevenness
Change blindness
Channel thinking
Depending on perceptual skills
Difficult to understand
High requirement on training and resources
Misuse
Overload
Reification
Wrong salience
Emotional
Disturbing
Boring
Ugly/ unappealing
Wrong use of colour
Visual stress
Personal preferences
Prior knowledge and experience
Social Affordance conflict
Hierarchy, exercise of power
Inhibit conversation
Rhythm of freezing and unfreezing
Turn taking alteration
Unequal participation
Altered behavior
Cultural and cross-cultural differences
Defocused from non-verbal interaction
Framing effect
Different perspectives
Hiding differences of opinion
Time consuming to agree upon
Table 1: Risks of visualization (Bresciani & Eppler, 2009)
Another distinction that can be made in the designer induced risks is whether the
problem is intentional or unintentional. Bresciani & Eppler (2009) state that their review of
the literature resulted mostly in unintentional problems, mistakes made by the designer, but
after a careful analysis they considered the possibility that risks may be intentionally induced
by a designer, for example for manipulative purposes.
25
3.8 Visualization methods
There are many visualization methods. “A visualization method is a systematic, rule-
based, external, permanent, and graphic representation that depicts information in a way that
is conducive to acquiring insights, developing an elaborate understanding, or communicating
experiences” (Lengler & Eppler, 2007, p. 1). In their paper, Lengler & Eppler (2007)
attempted to create visual overview of all visualization methods that are fit for use in
management. It is called the periodic table of visualization methods, and within this table they
categorized the visualization methods based on five dimensions. These five dimensions were
based on previous (meta-)taxonomies as proposed by previous studies, and are chosen
specifically because they should address challenges related to managerial thinking(cognitive
challenges), managerial communication(social challenges) and the managers’ ability to
motivate and engage their peers and employees(emotional challenges). The five dimensions
are described below:
Complexity of visualization
Low to high, referring to the number of rules applied for use and/or the number of
interdependencies of the elements to be visualized. As it is with strategy, visualizations can
vary largely, as a lot of variables could be accounted for.
Main application or Content area
Visualizations tend to differ according to what kind of information they are representing,
these kinds of information can be categorised under: Data, Information, Concept, Metaphor,
Strategy, Compound Knowledge. It is important that it is clearly visible what kind of
information is being shown.
Point of view
This dimension describes the extent to which detail is shown, also categorised: Detail
(individual item highlighting) Overview (big picture), and the combination Detail and
Overview (both at the same time). The point of view immediately shows what detail is meant
to be emphasized by the visualization.
Type of Thinking Aid
Is the visualization method trying to reduce complexity, then it is Convergent, if it adds
complexity, it is Divergent. Visualization can be used to simplify information of high
complexity, while it could also show the complication of something that seems simple
firsthand.
Type of Representation
There is Process representation, which is stepwise cyclical in time and/or continuous
sequential, and Structure representation, for example hierarchy or causal networks. This is
also an important dimension, as here again, the visualization should be very clear as to what
type of information it is trying to convey.
26
An example of visualization in business communication can be found in business
modelling, where models are becoming increasingly more complex, similarly to business
strategies. Visual representations of a business model usually enhance understanding among
readers (Osterwalder & Pigneur, 2005). Gordijn & Akkermans (2003) found that using
conceptualizations to capture business models enables users to present them graphically, with
little additional effort.
3.9 Visualization of strategy
Lengler & Eppler (2007), argue that strategy visualizations are visualizations of
concepts, and what sets them apart from other concept visualizations is is their higher degree
of complexity of visualization. This higher degree of complexity can be explained by the fact
that obtaining an understanding of the visualization may require more management or domain
specific knowledge. They found a sizable amount of visualizations that are used for strategy
communications: supply demand chain, performance charting, strategy map, organization
chart, house of quality, feedback diagram, failure tree, magic quadrant, stakeholder rating
map, porter’s five forces, s-cycle, stakeholder map, life-cycle diagram, technology roadmap,
edgeworth box, portfolio diagram, strategic game board, mintzberg’s organigraph, zwicky’s
morphological box, affinity diagram, decision discovery diagram, bcg matrix, strategy
canvas, value chain, hype-cycle ishikawa diagram, taps and spray diagram. Even though
these visualization methods are all meant to visualize strategies, they differ in degree of
complexity, low to high, point of view, detail, overview or both, type of thinking-aid,
convergent or divergent and type of representation, process or structure visualization.
Burkhard (2005a) introduced Strategy Visualization, which is defined as the
systematic use of complementary visual representations to improve the analysis, development,
formulation, communication, and implementation of strategies in organizations. Strategy
Visualization is more than a mapping of measurements, as it is developed to engage and
activate employees. Since a strategy is required to be communicated to the stakeholder’s
context, it is similar to other knowledge visualizations. The Strategy Visualization is based on
the Knowledge Visualization Framework (Burkhard, 2005b; Eppler & Burkhard, 2006),
which designates all graphic means that can be used to develop or convey insights,
experiences, methods, or skills among individuals. For effective transfer and creation through
knowledge through visualizations, four questions should be considered:
What’s the goal of using a visualization method?
What type of knowledge needs to be visualized?
Who is being addressed?
What is the best method to visualize this indicator?
In a case study, Burkhard (2005a) revised the Knowledge Visualization Framework
and applied it to strategies. Applying the framework opened up a new understanding of how a
strategy can be communicated by using complementary visualizations. Two conclusions were
drawn, within the implementation of strategies, there is a huge potential when complementary
visualizations are used, and currently, a systematic discourse on visualization in strategic
27
management is missing. The visualizations used in their case study had attracted individuals,
presented overview and detail, and fostered the creation of a shared vision among the
presenter and addressees. The complementary use of visualizations, illustrating different
levels of detail and different aspects of the strategy, lead to more motivation and engagement
regarding the strategy implementation.
Cummings & Angwin (2011) argue that individualized visualizations of strategy could
enable more effective conceptualization and communication of strategies that are higher in
complexity. They refer to this visualization of strategy with the term stratography.
Stratography is defined as pictorial abstractions that outline the unique terrains and/or some
relationships related to this terrain: competition, internal relationships, or market conditions in
which organizations are embedded.
3.10 Visualization of strategy: design criteria
According to surveys conducted by Cummings & Angwin (2011), there are seven
good stratography practices. These stratography practices could be called the design criteria
for a functional strategic visualization. Four of these criteria are associated with mechanical
movements, stopping the eye, spreading the eye across a terrain; enabling the eye to seek out
connections; and facilitating the eye to zoom in and out. The latter three are more related to
cognitive and sensual principles, mimesis, synaesthesis and mnemonics.
Attracting and focusing the eye
Good stratography requires the eye to be stopped, in order to command a viewer's
attention. To do so, the visual representation should be perceived to be interesting, useful and
easily comprehensible. Key elements for stopping the eye and encouraging it to pay attention
to a visual are:
● Novelty, which can go a long way toward earning a second glance, but too much can
make a graphic to appear irrelevant;
● Aesthetics, clear lines and good use of colours, not too many of either;
● Purpose, the first time a graphic is viewed, it should be clear what it seeks to do.
● Utility, the graphic should convey a sense that the viewer could acquire interesting
information from it.
Spreading the eye
In western cultures, the eye is generally accustomed to scanning graphics
hierarchically from the top left corner across and down the page, or clockwise from left to
right, down and back around. In business context, good stratography should work with, rather
than against, this grain. Enabling the eye to move in a comfortable manner, so that it can
quickly more understand the underlying message, is generally more effective.
28
Encouraging the eye to search
After attracting and focusing the eye, a good graphical representation may do two
more things simultaneously. Keeping it engaged to the picture, and begin to loosen up the eye,
enabling it to seek new patterns or information.
Facilitating the eye’s zooming in and out
The visual representation should enable the eye to see both the big picture and the
detail, as both the simple and complex components are important aspects of effective strategic
action. Good stratography should support this. Too much detail can turn people off, so the
fewest dimensions necessary to aid decision making should be incorporated. Even though
three dimensions may be a better representation of reality, two-dimensional graphics or maps
allow work to be much easier. Within the two dimensions, no more than seven colours, seven
directions or seven value categories should be introduced, as this would become too detailed.
Similarly, the amount of different shapes should be kept low, to simplify complexity.
Mimesis: Leading the eye in human direction
Visual representations can mirror the different directions that individuals might take in
actual life. Strategy implementation, presented as text, can only go left to right and top to
bottom, other directions would lead to confusion, whereas visuals can show mimetic
dimensions that help learning and retention by connecting cognition to physiology.
Synaesthesis: uniting different modes of communication, sense and behaviours
An advantage with regards to communication that visualizations have is that it can be
multimodal: it can consist of more than just text. Multimodality enhances the ability to
communicate meaning (Hull & Nelson, 2005). Effective multimodal visual representations
also have a synaesthetic effect, that is, they encourage readers to engage other senses to work
together to give the visual a greater meaning. For example, a good map of subway tracks
invites you to trace what you see. Synaesthesis supports readers to get a greater mental
connection to the meaning of the visual.
Mnemonics: Entering the mind’s eye
Subsequently, a good stratography should be mnemonic: easy to remember. It is more
likely that a reader will remember a graph and its meaning as opposed to a plain text that
covers the same information. This ‘stickiness’ is most important for strategy communication,
as it should be enacted in real time, all the time. It is most helpful if people are able to recall a
broad picture of how they are instructed to contribute. This mnemonic quality of visual
representations is mostly a sum of the six practices listed above, if performed correctly. If the
visualization is able to; arrest the eye; spread the vision across the picture; draw in the eye and
lead it in certain ways; aid the viewer in zooming into specific details of the greater picture;
bring other senses into play; and help focus the viewer’s mind, then the chances are high that
it will be remembered. One important additional requirement here is the rule of seven, an
interesting eccentricity of the way the human brain works. Humans tend to be more able to
remember visuals that have seven or less main elements as opposed to more than seven.
29
3.11 Stakeholders of strategy communication
There are several stakeholders that are relevant to strategy, its formulation,
communication and implementation, listed below:
Top management
This is the team that formulates, designs and wishes to implement the strategy in a
business. Some top management teams have a chief strategy officer (CSO)(or equivalent), this
is a executive who is responsible for developing, communicating, executing, implementing
and sustaining strategic initiatives in businesses (Breene, Nunes & Shill, 2007). Their role in
use of the strategy communication is the largest. CSO’s articulate a clear definition of the
strategy, and explain how each employee can fit into the greater scheme of this strategy by
adjusting their daily activities to the overall business objectives. Through the use of the
strategy communication, they spread all knowledge required to implement the strategy, down
the chain of command to all levels or departments of the business (Breene, Nunes & Shill,
2007).
Middle-management
These are the groups of managers who are located below top-managers and above
first-level supervision in the hierarchy, that disseminate and communicate the strategic plans
that top-management wishes to implement down the chain of command, to their subordinates
(Wooldridge, Schmid & Floyd, 2008). Shi, Markoczy & Dess (2009) argue that middle
management plays a brokerage role in businesses, where they mediate the flow of resources or
information between other unconnected actors. In this case this means that they communicate
strategic information down the chain of command, and if this results in difficulties or other
problems, these can be communicated back up the chain of command.
Regular employees
This is essentially all non-management personnel. These are the individuals that have
to execute the plans that are described in the strategy. How the strategy relates to their
everyday activities is what is relevant to them. Also, how their activities fit into the bigger
picture of the business’ activities may prove to be important to them. Hambrick and Cannella
(1989) argue that all employees need to be sufficiently informed about the strategy and its
implications, in order for it to work. Their role can be described as the actor that actually
executes the plans described in the strategy.
Shareholders
Shareholders are internal and external individuals or groups that legally hold shares of
the company. Shareholders are concerned with the business increasing or at least sustaining
its shareholder value, and strategy is how a business intends to create sustainable growth in
shareholder value (Kaplan & Norton, 2004). Shareholders are affected by strategy and have
power in influencing it to maximise shareholder value for themselves (Velasco, 2006).
30
3.12 Summary of literature review
In order to give a structured overview of the findings of the literature review, some of
the sub questions as formulated in the study design have been answered below.
Sub-objective 1: Define strategy communication
A: What is strategy communication?
Strategy communication can be described as the communication and education of
employees regarding the strategic goals of the company. This means that all employees of an
organization have to be thoroughly informed of what their daily activities are, and how these
activities fit into the greater scheme of the business’ objectives. Strategy communication is a
substantial component of the process of strategy implementation. Sufficient strategy
communication has been found to be a requirement for businesses to successfully implement
their strategies. The content that is to be communicated includes but is not limited to all
strategic plans that the business
Sub-objective 2: Determination of effectiveness in strategy communication
A: What determines effective strategy communication?
In order for strategy communication to be effective, several main problems have to be
overcome. These main problems are: raising attention and awareness amongst those that are
communicated to, making sure that the communicated strategy is understood thoroughly
enough to be able to put it to use, stimulating support and commitment of the strategy, and
communicating in a memorable way, so that it can be clearly remembered.
B: What obstacles are there that hinder effective strategy communication?
There are different sources of obstacles that hinder effective strategy communication,
not all of which can be avoided. For example, when businesses grow, this often involves an
increase in the amount of employees it has, which in turn makes communication more
difficult, as more individuals have to be informed of the course of events. Other obstacles in
achieving effective strategy communication are all practices that:
- Do not foster awareness of employees to the strategy
- Communicate the strategy in such a way that it is not understood by those that are
enacting the activities it involves
- Do not inspire employees to support and commit to the strategy
- Are not memorable enough for employees to remember
Sub-objective 3: Defining strategy visualization and its use
A: How can strategy be visualized?
Visualization is a broad concept, it includes anything that brings a picture or message
to mind through the use of a graphical or visual display. Regarding to strategy, visualizations
are usually representations of strategies or elements of said strategy, displayed in such a way
that it gives a clear overview. There are numerous methods of visualization that can aid in
communicating strategies. Examples are strategy maps, porter’s five forces, technology
roadmaps, strategy canvases, and value chains.
31
B: What determines effective strategy visualization?
Effective strategy visualization takes place when the visualization is able to aid or
replaces dialogue regarding strategy communication. Visualization, when implemented
correctly, can aid in communication by for example conveying the same message with less
text, or by giving a better overview of the entire process for comprehension purposes.
Effective use of visualization in strategy communication can lead to an increase in attention,
agreement and degree of retention of said communication. The use of complementary
visualizations in communication is expected to have great potential in improving said
communication
C: How does the use of visualization affect strategy communication?
There is a dichotomy in literature regarding the effects of visualization on
communication quality. On the one hand visualization is expected increase communication
effectiveness through enhancing attention, agreement and retention levels, but due to
ambiguity, the addition of visualization could also lead to confusion, especially when the
information that is being communicated could be interpreted differently by different parties.
Sub-objective 4: Determination of the role of stakeholders in strategy
communication
A: Who are the stakeholders in strategy communication?
The stakeholders of strategy communication can be categorised in four groups, top
management, middle management, regular employees and shareholders.
B: How is communication of strategy different for the different stakeholders?
Each stakeholder has a different role regarding strategy communication, for example,
top management is mainly responsible for the formulation of said strategy and communicating
it in such a way that their subordinates know what to do or how to communicate the
information down the chain of command towards the respective relevant parties. Middle
management’s role in strategy communication can be summarized as the brokerage role.They
manage the flow of strategic resources up and down the command, providing subordinates
with the information that is relevant for them, and providing feedback regarding the execution
of the strategic plans to their superiors. Regular employees are the individuals that actually
execute the strategic plans, their role in the communication of strategy more passive. The are
supposed to be ‘sold’ the plan and its consequences. If their motivation, attention, support,
comprehension and retention of the information is not sufficient, they will not be able to
execute the plans as effective. Shareholders also hold a more passive role. They wish to be
and stay informed about the business and its activities, therefore they are concerned with how
the business’ strategic plans aims to increase the shareholder value (or at least sustain).
The information gathered during this literature review has given a more in-depth view
into problem and its context. A framework was created regarding the research topics strategy,
strategy communication, stakeholders of strategy communication, and strategy visualization.
Next up is the design of a treatment to the problem. In order to design a treatment,
requirements for such a treatment will have to be constructed.
32
4. Treatment design
4.1 Introduction
Now that the specific problem has been defined and put into perspective, it can be
addressed. In order to design a treatment for the problem, a list of requirements for said
treatment has to be constructed. These requirements can be stakeholder requirements, system
requirements or organizational requirements. These requirements also have to be weighed
appropriately to the context.
4.2 Key driver method
In order to create an overview of all the requirements for the design of the strategy
visualization, the key driver method is used. In this section the scope will be defined, all
stakeholders will be summed up and their requirements for a treatment will be gathered.
Using these requirements together with requirements that can be formulated using literature,
the key drivers will be formulated. These key drivers in turn will make it possible to do make
a grounded recommendation regarding the design of an effective strategy visualization.
4.2.1 Define the scope specific
There are several stakeholders that are relevant to a strategy visualizations meant for
use in strategy communication. The stakeholders are listed below, along with a description of
how they perceive the problem and its possible treatment.
4.2.1.1 General description of the scope:
A strategy is what businesses use to cope with (external) conditions and circumstances
in order to survive. Strategies are most often formulated by top management, and are meant to
be communicated towards everyone in the business, to a certain degree. Depending on an
employees’ individual task description, a component or a larger portion of the strategy can be
considered relevant to them. Strategy visualizations are meant to be used to aid in the
communication of strategies. They are supposed to facilitate in communicating information
effectively, by showcasing relevant information to the right parties in such a way that they are
informed sufficiently on when to do what, and why.
4.2.1.2 Top management:
Top management are those that formulate, design and wish to implement the strategy
in a business. Through the use of the strategy visualization, they wish to spread all knowledge
required to implement the strategy, on all levels or departments of the business. Top managers
must be able to graphically show what strategic plans are intended to be implemented, and
how these plans link to the business’ objectives. A strategy visualization could also aid top
management during the formulation stage of the strategy, e.g. by creating a clear overview of
the anticipated plans early on, so that shortcomings can be discovered early on in the
formulation process.
33
4.2.1.3 Middle management:
These are the groups of individuals that communicate the strategy further down the
chain of command. The strategy visualization should therefore be meant to facilitate said
communication. The visualization must be sufficiently informative, so that they can bring
their actions in line with the strategy. They need the strategy visualization to inform them on
what to communicate, to what extent, to whom and why. Also, if they receive feedback from
subordinates regarding the strategy and its execution, or have feedback themselves, they
should know how this feedback can be passed back up the chain of command (e.g.who to
inform when activity X does not result in the expected outcome).
4.2.1.4 Regular employees:
Regular employees are all personnel that is not considered to be management, they are
the individuals that actually execute the strategy. Using a strategy visualization, they must be
able to view what the implications of the strategy are for their daily activities. Only if they are
informed sufficiently so that they understand what the consequences of the strategy for their
individual activities are, they will be able to execute it effectively. They must also be able to
view how their daily activities fit in the greater picture of the business and its objectives.
Similar to the middle management, regular employees should be informed how to process
potential feedback.
4.2.1.5 Shareholders:
These are the groups or individuals that hold shares in the business, they are concerned
with what the business is up to, and how this will relate to their returns. Using the strategy
visualization, shareholders must be able to view what the business is focussing its efforts on.
Shareholders are concerned with shareholder value, and the strategy should reflect how the
business is increasing (or at least sustaining) this value. Shareholders should be able to see
performance measures so that they know how the business is doing.
4.2.2 Acquire and analyze facts
In order to create a comprehensive overview of all requirements, these requirements
first have to be gathered. The requirements were gathered in three ways:
- by doing a stakeholder analysis, in order to obtain stakeholder-specific requirements
- by doing an interview, to obtain requirements from practice
- by reviewing literature regarding strategy visualization in strategy communication, for
requirements based on theory.
4.2.2.1 Stakeholder analysis
A stakeholder analysis involves identifying and prioritising stakeholders, assessing
their needs, collecting their ideas and integrating this knowledge into the strategic
management process (Harrison & St John, 1998). The stakeholders have already been
identified, and can be categorised into four groups; top managers, middle managers, regular
employees and shareholders. Using use-case scenarios, requirements that these stakeholders
have were gathered. These use case scenarios are be based on a template by Cockburn (2000).
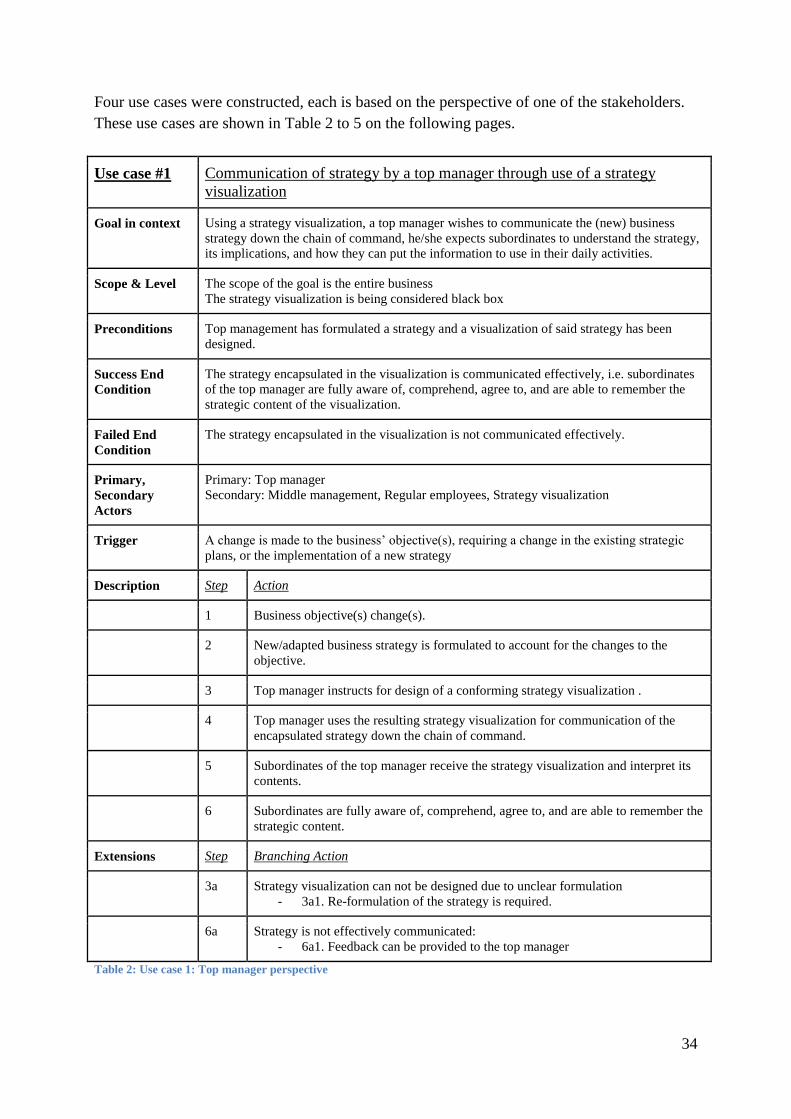
34
Four use cases were constructed, each is based on the perspective of one of the stakeholders.
These use cases are shown in Table 2 to 5 on the following pages.
Use case #1 Communication of strategy by a top manager through use of a strategy
visualization
Goal in context Using a strategy visualization, a top manager wishes to communicate the (new) business
strategy down the chain of command, he/she expects subordinates to understand the strategy,
its implications, and how they can put the information to use in their daily activities.
Scope & Level The scope of the goal is the entire business
The strategy visualization is being considered black box
Preconditions Top management has formulated a strategy and a visualization of said strategy has been
designed.
Success End
Condition
The strategy encapsulated in the visualization is communicated effectively, i.e. subordinates
of the top manager are fully aware of, comprehend, agree to, and are able to remember the
strategic content of the visualization.
Failed End
Condition
The strategy encapsulated in the visualization is not communicated effectively.
Primary,
Secondary
Actors
Primary: Top manager
Secondary: Middle management, Regular employees, Strategy visualization
Trigger A change is made to the business’ objective(s), requiring a change in the existing strategic
plans, or the implementation of a new strategy
Description Step Action
1 Business objective(s) change(s).
2 New/adapted business strategy is formulated to account for the changes to the
objective.
3 Top manager instructs for design of a conforming strategy visualization .
4 Top manager uses the resulting strategy visualization for communication of the
encapsulated strategy down the chain of command.
5 Subordinates of the top manager receive the strategy visualization and interpret its
contents.
6 Subordinates are fully aware of, comprehend, agree to, and are able to remember the
strategic content.
Extensions Step Branching Action
3a Strategy visualization can not be designed due to unclear formulation
- 3a1. Re-formulation of the strategy is required.
6a Strategy is not effectively communicated:
- 6a1. Feedback can be provided to the top manager
Table 2: Use case 1: Top manager perspective
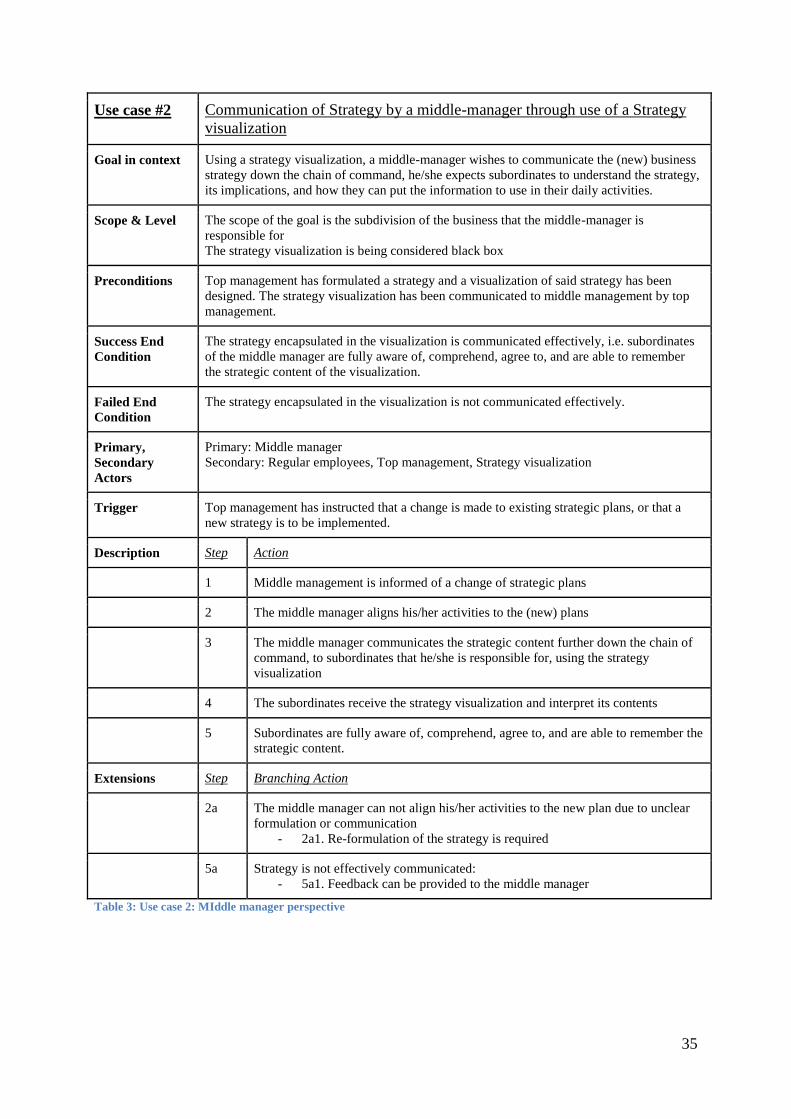
35
Use case #2 Communication of Strategy by a middle-manager through use of a Strategy
visualization
Goal in context Using a strategy visualization, a middle-manager wishes to communicate the (new) business
strategy down the chain of command, he/she expects subordinates to understand the strategy,
its implications, and how they can put the information to use in their daily activities.
Scope & Level The scope of the goal is the subdivision of the business that the middle-manager is
responsible for
The strategy visualization is being considered black box
Preconditions Top management has formulated a strategy and a visualization of said strategy has been
designed. The strategy visualization has been communicated to middle management by top
management.
Success End
Condition
The strategy encapsulated in the visualization is communicated effectively, i.e. subordinates
of the middle manager are fully aware of, comprehend, agree to, and are able to remember
the strategic content of the visualization.
Failed End
Condition
The strategy encapsulated in the visualization is not communicated effectively.
Primary,
Secondary
Actors
Primary: Middle manager
Secondary: Regular employees, Top management, Strategy visualization
Trigger Top management has instructed that a change is made to existing strategic plans, or that a
new strategy is to be implemented.
Description Step Action
1 Middle management is informed of a change of strategic plans
2 The middle manager aligns his/her activities to the (new) plans
3 The middle manager communicates the strategic content further down the chain of
command, to subordinates that he/she is responsible for, using the strategy
visualization
4 The subordinates receive the strategy visualization and interpret its contents
5 Subordinates are fully aware of, comprehend, agree to, and are able to remember the
strategic content.
Extensions Step Branching Action
2a The middle manager can not align his/her activities to the new plan due to unclear
formulation or communication
- 2a1. Re-formulation of the strategy is required
5a Strategy is not effectively communicated:
- 5a1. Feedback can be provided to the middle manager
Table 3: Use case 2: MIddle manager perspective
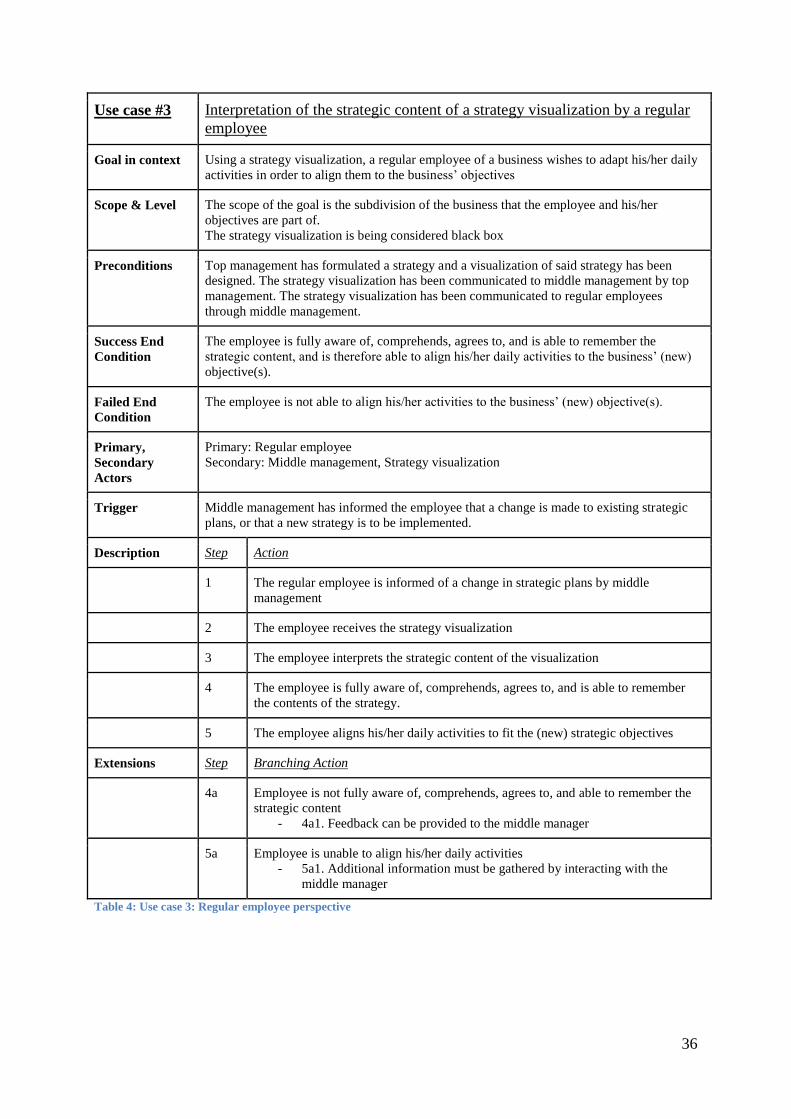
36
Use case #3 Interpretation of the strategic content of a strategy visualization by a regular
employee
Goal in context Using a strategy visualization, a regular employee of a business wishes to adapt his/her daily
activities in order to align them to the business’ objectives
Scope & Level The scope of the goal is the subdivision of the business that the employee and his/her
objectives are part of.
The strategy visualization is being considered black box
Preconditions Top management has formulated a strategy and a visualization of said strategy has been
designed. The strategy visualization has been communicated to middle management by top
management. The strategy visualization has been communicated to regular employees
through middle management.
Success End
Condition
The employee is fully aware of, comprehends, agrees to, and is able to remember the
strategic content, and is therefore able to align his/her daily activities to the business’ (new)
objective(s).
Failed End
Condition
The employee is not able to align his/her activities to the business’ (new) objective(s).
Primary,
Secondary
Actors
Primary: Regular employee
Secondary: Middle management, Strategy visualization
Trigger Middle management has informed the employee that a change is made to existing strategic
plans, or that a new strategy is to be implemented.
Description Step Action
1 The regular employee is informed of a change in strategic plans by middle
management
2 The employee receives the strategy visualization
3 The employee interprets the strategic content of the visualization
4 The employee is fully aware of, comprehends, agrees to, and is able to remember
the contents of the strategy.
5 The employee aligns his/her daily activities to fit the (new) strategic objectives
Extensions Step Branching Action
4a Employee is not fully aware of, comprehends, agrees to, and able to remember the
strategic content
- 4a1. Feedback can be provided to the middle manager
5a Employee is unable to align his/her daily activities
- 5a1. Additional information must be gathered by interacting with the
middle manager
Table 4: Use case 3: Regular employee perspective
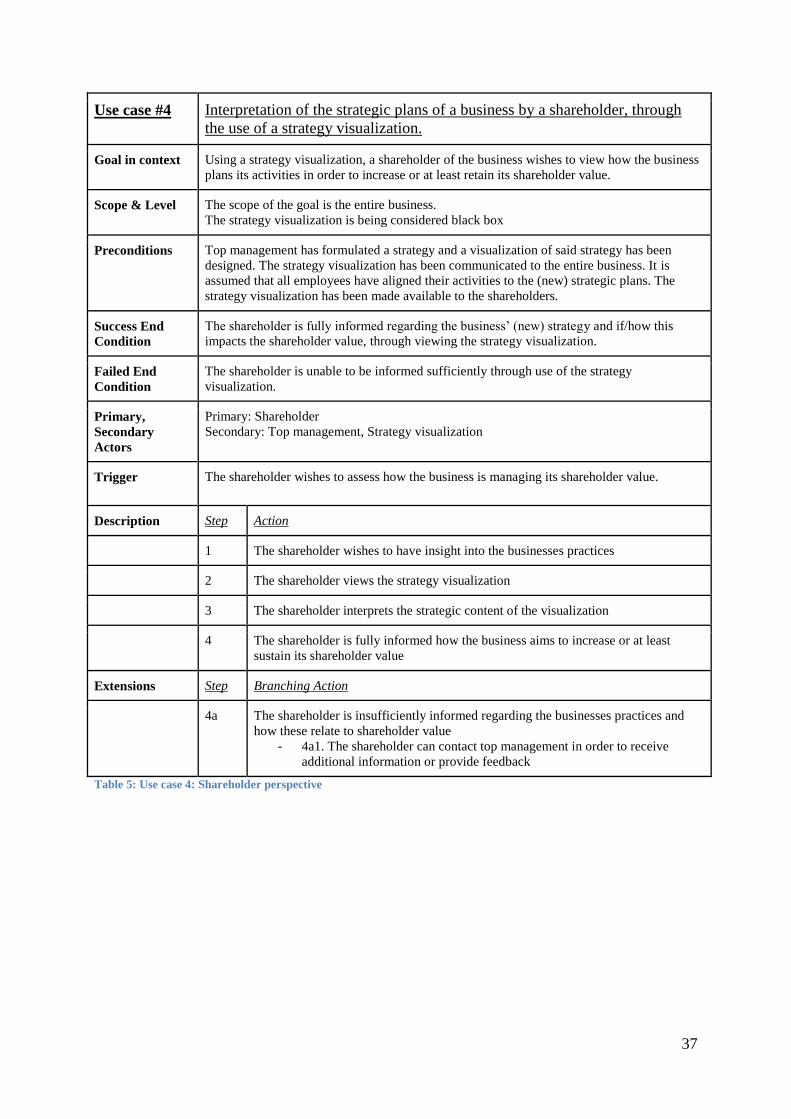
37
Use case #4 Interpretation of the strategic plans of a business by a shareholder, through
the use of a strategy visualization.
Goal in context Using a strategy visualization, a shareholder of the business wishes to view how the business
plans its activities in order to increase or at least retain its shareholder value.
Scope & Level The scope of the goal is the entire business.
The strategy visualization is being considered black box
Preconditions Top management has formulated a strategy and a visualization of said strategy has been
designed. The strategy visualization has been communicated to the entire business. It is
assumed that all employees have aligned their activities to the (new) strategic plans. The
strategy visualization has been made available to the shareholders.
Success End
Condition
The shareholder is fully informed regarding the business’ (new) strategy and if/how this
impacts the shareholder value, through viewing the strategy visualization.
Failed End
Condition
The shareholder is unable to be informed sufficiently through use of the strategy
visualization.
Primary,
Secondary
Actors
Primary: Shareholder
Secondary: Top management, Strategy visualization
Trigger The shareholder wishes to assess how the business is managing its shareholder value.
Description Step Action
1 The shareholder wishes to have insight into the businesses practices
2 The shareholder views the strategy visualization
3 The shareholder interprets the strategic content of the visualization
4 The shareholder is fully informed how the business aims to increase or at least
sustain its shareholder value
Extensions Step Branching Action
4a The shareholder is insufficiently informed regarding the businesses practices and
how these relate to shareholder value
- 4a1. The shareholder can contact top management in order to receive
additional information or provide feedback
Table 5: Use case 4: Shareholder perspective
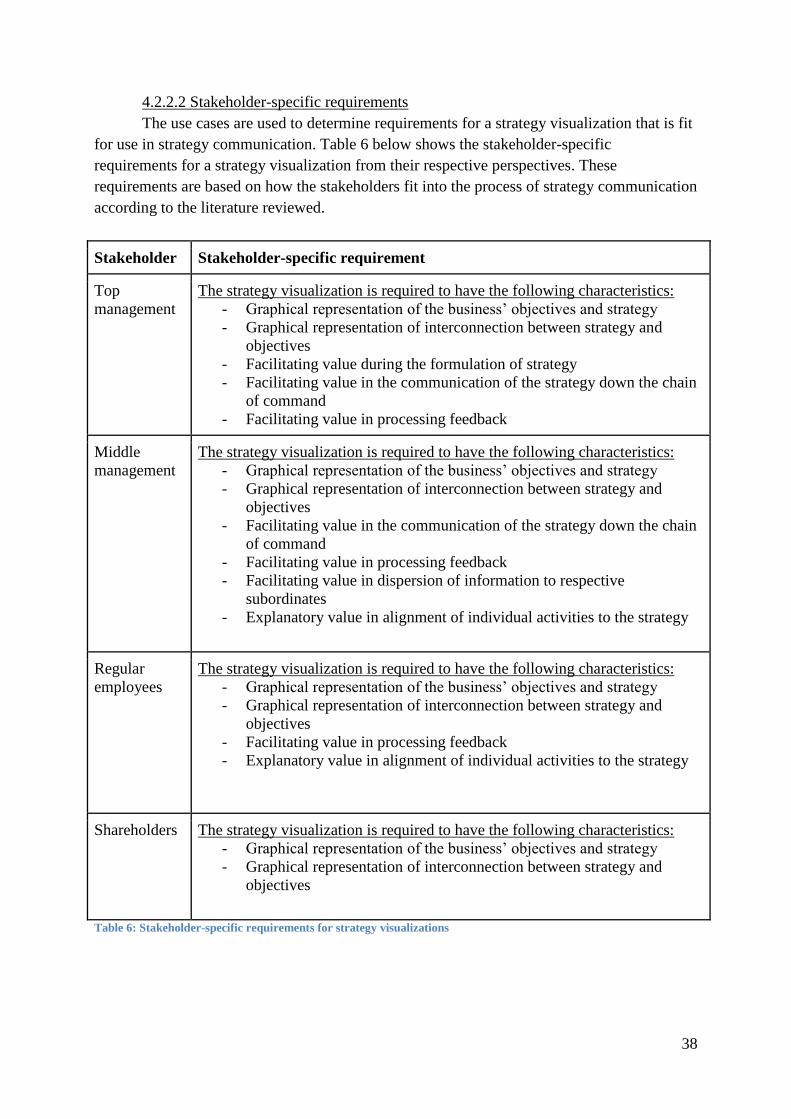
38
4.2.2.2 Stakeholder-specific requirements
The use cases are used to determine requirements for a strategy visualization that is fit
for use in strategy communication. Table 6 below shows the stakeholder-specific
requirements for a strategy visualization from their respective perspectives. These
requirements are based on how the stakeholders fit into the process of strategy communication
according to the literature reviewed.
Stakeholder Stakeholder-specific requirement
Top
management
The strategy visualization is required to have the following characteristics:
- Graphical representation of the business’ objectives and strategy
- Graphical representation of interconnection between strategy and
objectives
- Facilitating value during the formulation of strategy
- Facilitating value in the communication of the strategy down the chain
of command
- Facilitating value in processing feedback
Middle
management
The strategy visualization is required to have the following characteristics:
- Graphical representation of the business’ objectives and strategy
- Graphical representation of interconnection between strategy and
objectives
- Facilitating value in the communication of the strategy down the chain
of command
- Facilitating value in processing feedback
- Facilitating value in dispersion of information to respective
subordinates
- Explanatory value in alignment of individual activities to the strategy
Regular
employees
The strategy visualization is required to have the following characteristics:
- Graphical representation of the business’ objectives and strategy
- Graphical representation of interconnection between strategy and
objectives
- Facilitating value in processing feedback
- Explanatory value in alignment of individual activities to the strategy
Shareholders The strategy visualization is required to have the following characteristics:
- Graphical representation of the business’ objectives and strategy
- Graphical representation of interconnection between strategy and
objectives
Table 6: Stakeholder-specific requirements for strategy visualizations
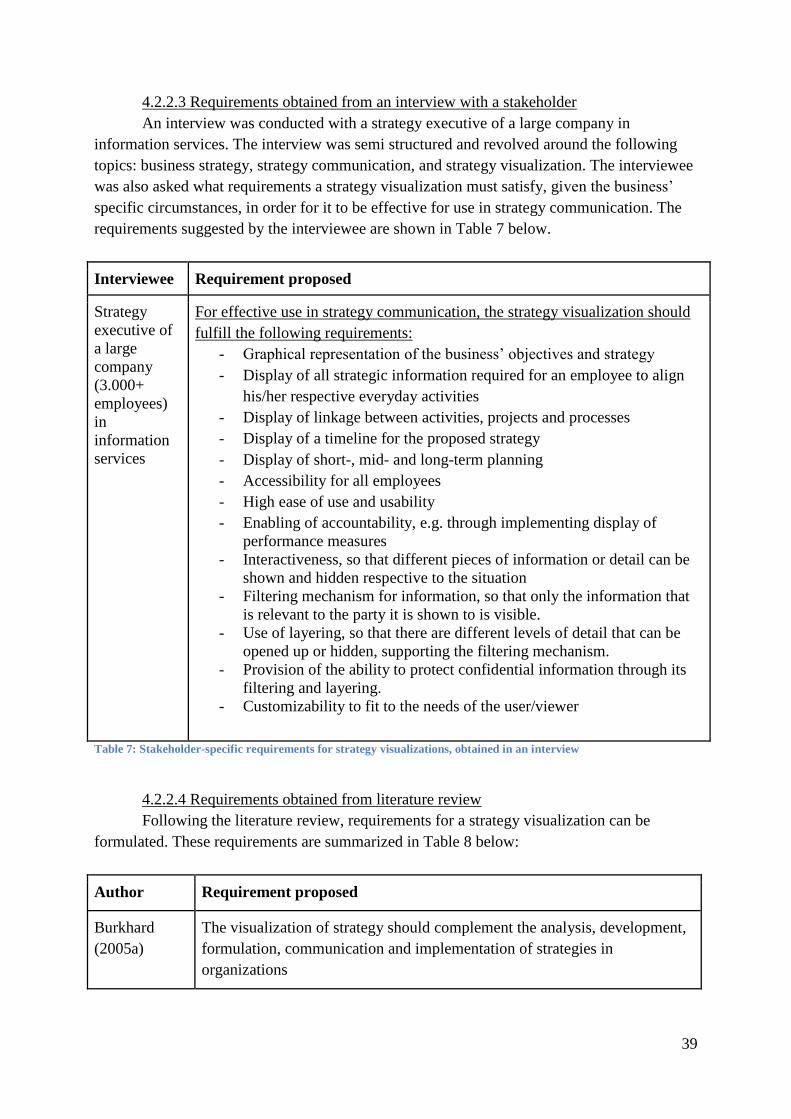
39
4.2.2.3 Requirements obtained from an interview with a stakeholder
An interview was conducted with a strategy executive of a large company in
information services. The interview was semi structured and revolved around the following
topics: business strategy, strategy communication, and strategy visualization. The interviewee
was also asked what requirements a strategy visualization must satisfy, given the business’
specific circumstances, in order for it to be effective for use in strategy communication. The
requirements suggested by the interviewee are shown in Table 7 below.
Interviewee Requirement proposed
Strategy
executive of
a large
company
(3.000+
employees)
in
information
services
For effective use in strategy communication, the strategy visualization should
fulfill the following requirements:
- Graphical representation of the business’ objectives and strategy
- Display of all strategic information required for an employee to align
his/her respective everyday activities
- Display of linkage between activities, projects and processes
- Display of a timeline for the proposed strategy
- Display of short-, mid- and long-term planning
- Accessibility for all employees
- High ease of use and usability
- Enabling of accountability, e.g. through implementing display of
performance measures
- Interactiveness, so that different pieces of information or detail can be
shown and hidden respective to the situation
- Filtering mechanism for information, so that only the information that
is relevant to the party it is shown to is visible.
- Use of layering, so that there are different levels of detail that can be
opened up or hidden, supporting the filtering mechanism.
- Provision of the ability to protect confidential information through its
filtering and layering.
- Customizability to fit to the needs of the user/viewer
Table 7: Stakeholder-specific requirements for strategy visualizations, obtained in an interview
4.2.2.4 Requirements obtained from literature review
Following the literature review, requirements for a strategy visualization can be
formulated. These requirements are summarized in Table 8 below:
Author Requirement proposed
Burkhard
(2005a)
The visualization of strategy should complement the analysis, development,
formulation, communication and implementation of strategies in
organizations
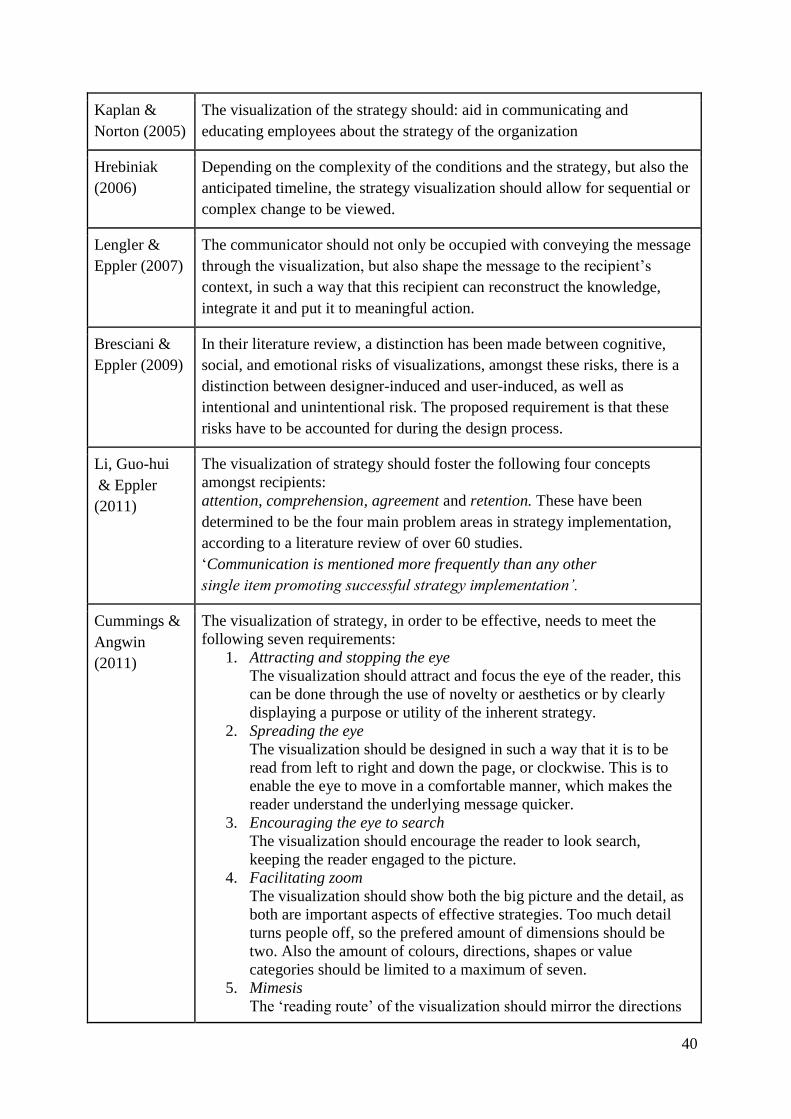
40
Kaplan &
Norton (2005)
The visualization of the strategy should: aid in communicating and
educating employees about the strategy of the organization
Hrebiniak
(2006)
Depending on the complexity of the conditions and the strategy, but also the
anticipated timeline, the strategy visualization should allow for sequential or
complex change to be viewed.
Lengler &
Eppler (2007)
The communicator should not only be occupied with conveying the message
through the visualization, but also shape the message to the recipient’s
context, in such a way that this recipient can reconstruct the knowledge,
integrate it and put it to meaningful action.
Bresciani &
Eppler (2009)
In their literature review, a distinction has been made between cognitive,
social, and emotional risks of visualizations, amongst these risks, there is a
distinction between designer-induced and user-induced, as well as
intentional and unintentional risk. The proposed requirement is that these
risks have to be accounted for during the design process.
Li, Guo-hui
& Eppler
(2011)
The visualization of strategy should foster the following four concepts
amongst recipients:
attention, comprehension, agreement and retention. These have been
determined to be the four main problem areas in strategy implementation,
according to a literature review of over 60 studies.
‘Communication is mentioned more frequently than any other
single item promoting successful strategy implementation’.
Cummings &
Angwin
(2011)
The visualization of strategy, in order to be effective, needs to meet the
following seven requirements:
1. Attracting and stopping the eye
The visualization should attract and focus the eye of the reader, this
can be done through the use of novelty or aesthetics or by clearly
displaying a purpose or utility of the inherent strategy.
2. Spreading the eye
The visualization should be designed in such a way that it is to be
read from left to right and down the page, or clockwise. This is to
enable the eye to move in a comfortable manner, which makes the
reader understand the underlying message quicker.
3. Encouraging the eye to search
The visualization should encourage the reader to look search,
keeping the reader engaged to the picture.
4. Facilitating zoom
The visualization should show both the big picture and the detail, as
both are important aspects of effective strategies. Too much detail
turns people off, so the prefered amount of dimensions should be
two. Also the amount of colours, directions, shapes or value
categories should be limited to a maximum of seven.
5. Mimesis
The ‘reading route’ of the visualization should mirror the directions
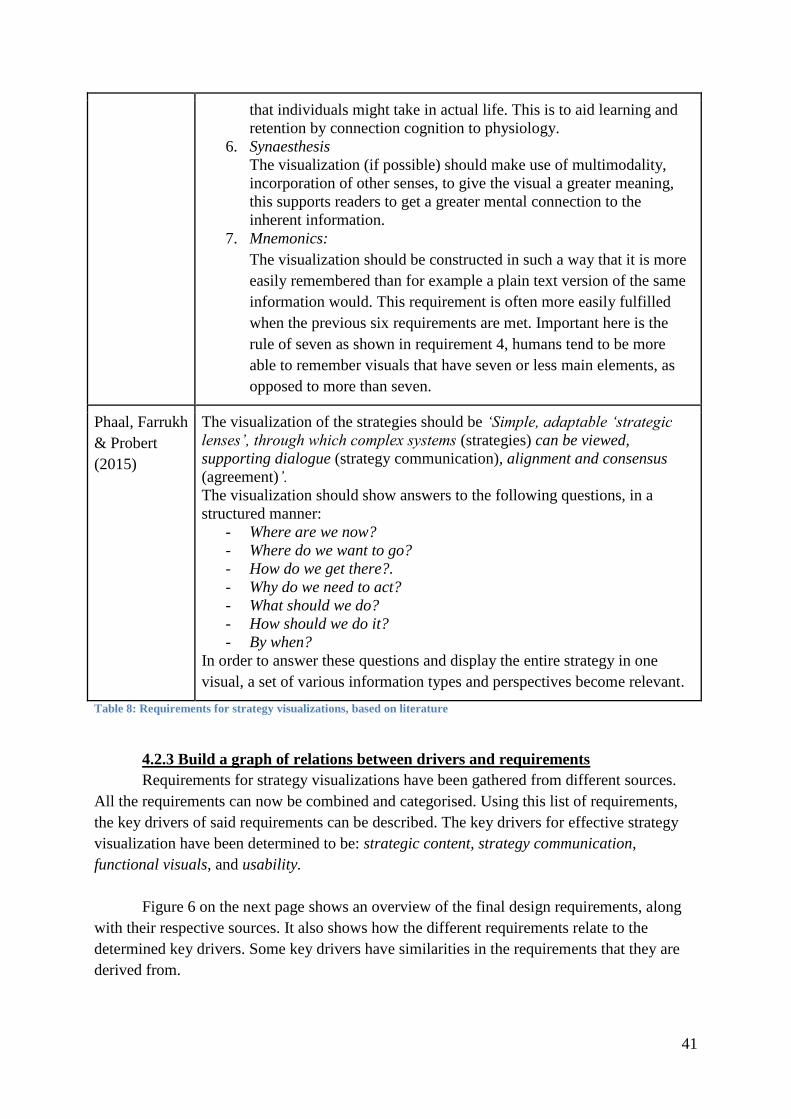
41
that individuals might take in actual life. This is to aid learning and
retention by connection cognition to physiology.
6. Synaesthesis
The visualization (if possible) should make use of multimodality,
incorporation of other senses, to give the visual a greater meaning,
this supports readers to get a greater mental connection to the
inherent information.
7. Mnemonics:
The visualization should be constructed in such a way that it is more
easily remembered than for example a plain text version of the same
information would. This requirement is often more easily fulfilled
when the previous six requirements are met. Important here is the
rule of seven as shown in requirement 4, humans tend to be more
able to remember visuals that have seven or less main elements, as
opposed to more than seven.
Phaal, Farrukh
& Probert
(2015)
The visualization of the strategies should be ‘Simple, adaptable ‘strategic
lenses’, through which complex systems (strategies) can be viewed,
supporting dialogue (strategy communication), alignment and consensus
(agreement)’.
The visualization should show answers to the following questions, in a
structured manner:
- Where are we now?
- Where do we want to go?
- How do we get there?.
- Why do we need to act?
- What should we do?
- How should we do it?
- By when?
In order to answer these questions and display the entire strategy in one
visual, a set of various information types and perspectives become relevant.
Table 8: Requirements for strategy visualizations, based on literature
4.2.3 Build a graph of relations between drivers and requirements
Requirements for strategy visualizations have been gathered from different sources.
All the requirements can now be combined and categorised. Using this list of requirements,
the key drivers of said requirements can be described. The key drivers for effective strategy
visualization have been determined to be: strategic content, strategy communication,
functional visuals, and usability.
Figure 6 on the next page shows an overview of the final design requirements, along
with their respective sources. It also shows how the different requirements relate to the
determined key drivers. Some key drivers have similarities in the requirements that they are
derived from.
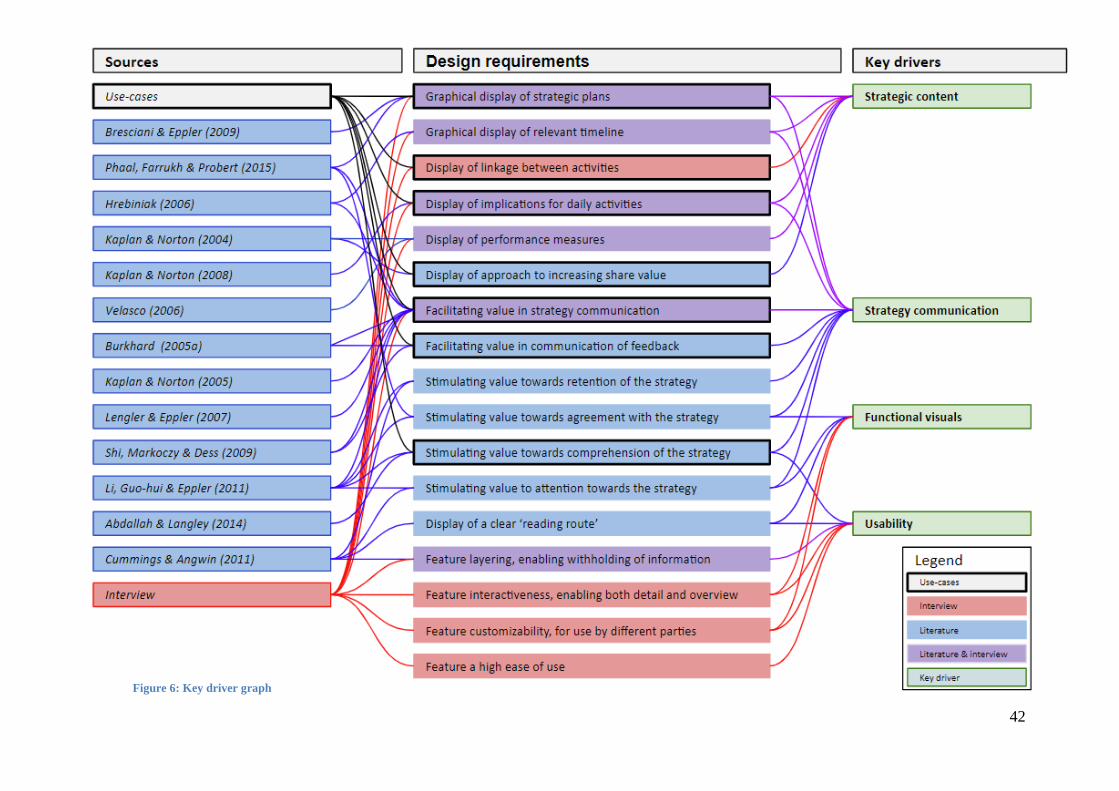
42
Figure 6: Key driver graph
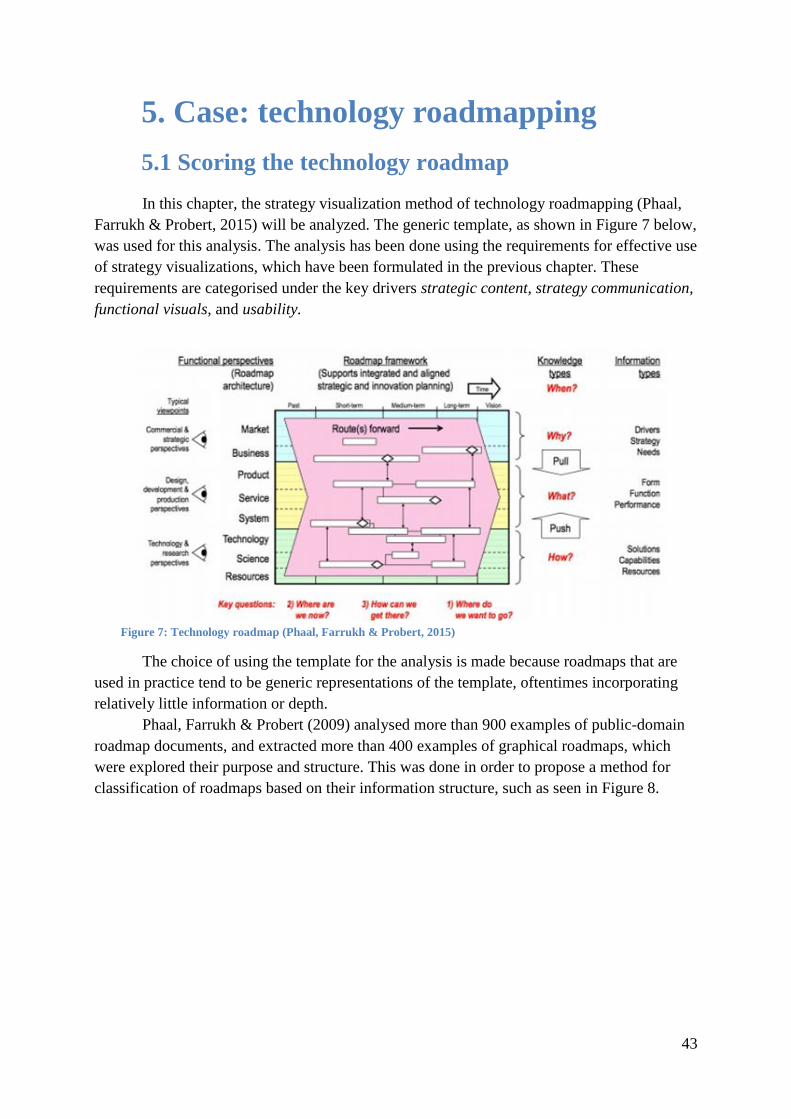
43
5. Case: technology roadmapping
5.1 Scoring the technology roadmap
In this chapter, the strategy visualization method of technology roadmapping (Phaal,
Farrukh & Probert, 2015) will be analyzed. The generic template, as shown in Figure 7 below,
was used for this analysis. The analysis has been done using the requirements for effective use
of strategy visualizations, which have been formulated in the previous chapter. These
requirements are categorised under the key drivers strategic content, strategy communication,
functional visuals, and usability.
The choice of using the template for the analysis is made because roadmaps that are
used in practice tend to be generic representations of the template, oftentimes incorporating
relatively little information or depth.
Phaal, Farrukh & Probert (2009) analysed more than 900 examples of public-domain
roadmap documents, and extracted more than 400 examples of graphical roadmaps, which
were explored their purpose and structure. This was done in order to propose a method for
classification of roadmaps based on their information structure, such as seen in Figure 8.
Figure 7: Technology roadmap (Phaal, Farrukh & Probert, 2015)
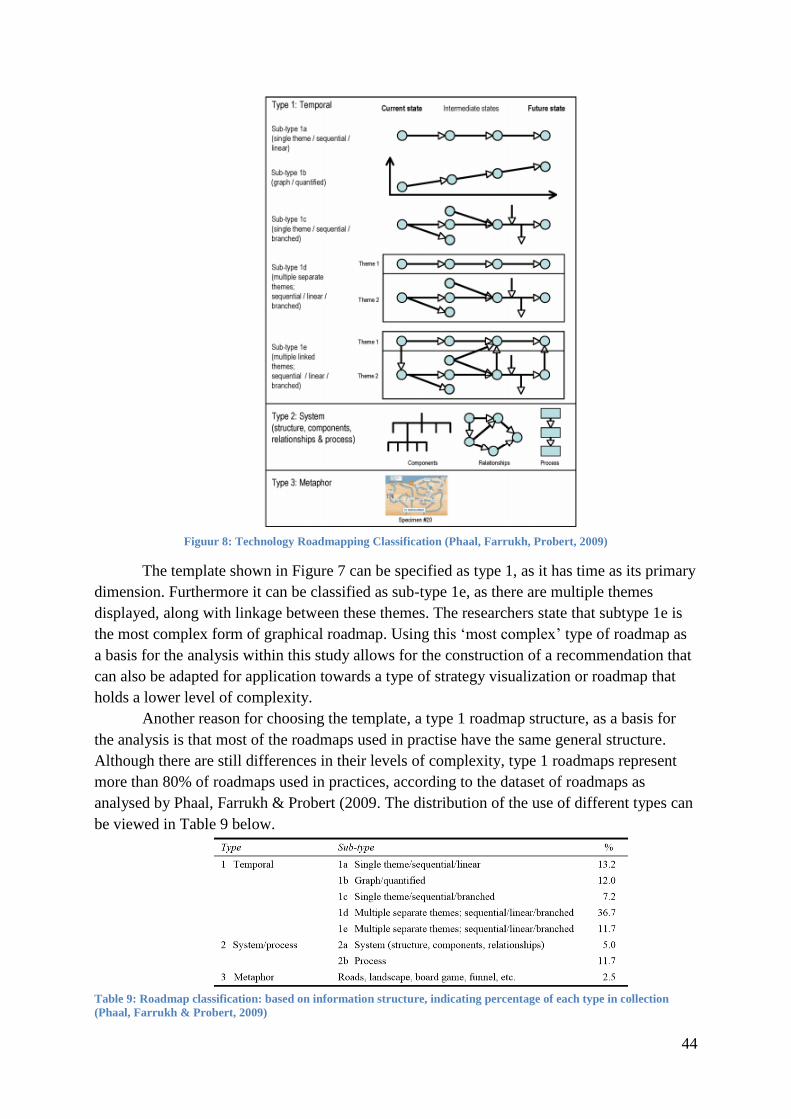
44
Figuur 8: Technology Roadmapping Classification (Phaal, Farrukh, Probert, 2009)
The template shown in Figure 7 can be specified as type 1, as it has time as its primary
dimension. Furthermore it can be classified as sub-type 1e, as there are multiple themes
displayed, along with linkage between these themes. The researchers state that subtype 1e is
the most complex form of graphical roadmap. Using this ‘most complex’ type of roadmap as
a basis for the analysis within this study allows for the construction of a recommendation that
can also be adapted for application towards a type of strategy visualization or roadmap that
holds a lower level of complexity.
Another reason for choosing the template, a type 1 roadmap structure, as a basis for
the analysis is that most of the roadmaps used in practise have the same general structure.
Although there are still differences in their levels of complexity, type 1 roadmaps represent
more than 80% of roadmaps used in practices, according to the dataset of roadmaps as
analysed by Phaal, Farrukh & Probert (2009. The distribution of the use of different types can
be viewed in Table 9 below.
Table 9: Roadmap classification: based on information structure, indicating percentage of each type in collection
(Phaal, Farrukh & Probert, 2009)
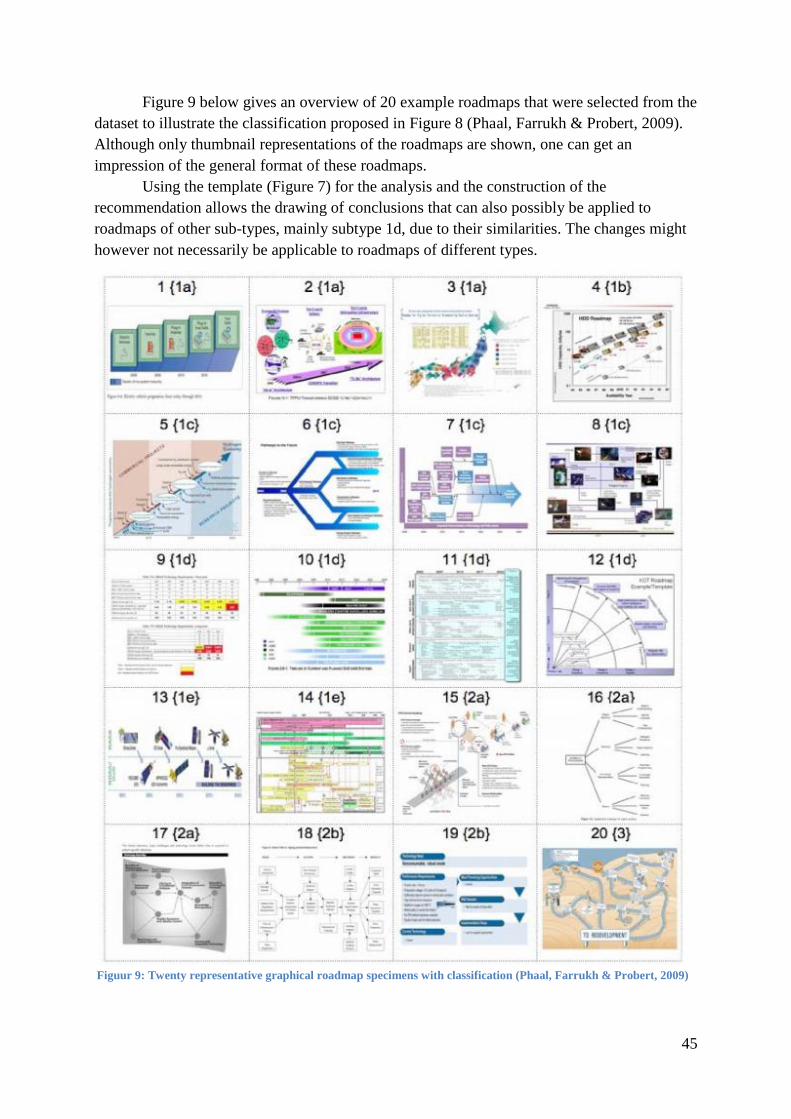
45
Figure 9 below gives an overview of 20 example roadmaps that were selected from the
dataset to illustrate the classification proposed in Figure 8 (Phaal, Farrukh & Probert, 2009).
Although only thumbnail representations of the roadmaps are shown, one can get an
impression of the general format of these roadmaps.
Using the template (Figure 7) for the analysis and the construction of the
recommendation allows the drawing of conclusions that can also possibly be applied to
roadmaps of other sub-types, mainly subtype 1d, due to their similarities. The changes might
however not necessarily be applicable to roadmaps of different types.
Figuur 9: Twenty representative graphical roadmap specimens with classification (Phaal, Farrukh & Probert, 2009)
46
5.2 Analysis
To analyse the roadmap template, it will now be checked by reviewing it according to
each design requirement individually. This analysis will follow the structure as shown in the
key driver graph, if a requirement relates to multiple key drivers, it will only be discussed in
the first key driver it is related to. After checking the template using each requirement, a more
generalized summary of how the template scores will be provided.
5.2.1 Strategic content
5.2.1.1 Graphical display of strategic plans
The roadmap template shows the business strategy in a structural way, by showing the
business’ anticipated goals, the current state, and the activities planned in order to achieve the
objective(s) from the current state. It does however provide little room to elaborate on the
business’ objectives, which could hinder agreement to the approach taken.
5.2.1.2 Graphical display of relevant timeline
The roadmap shows a representation of the relevant timeline, it does so by showing
the short-term, mid-term, and long-term planning of activities. It shows how these activities
are anticipated to transform the business from its current state into its vision over the period of
time.
5.2.1.3 Display of linkage between activities
The roadmap shows how the different planned activities, processes or projects are
interconnected, it does so by connecting them with arrows. It does however show little detail
regarding how this interconnection should be interpreted.
5.2.1.4 Display of implications for daily activities
The roadmap does not necessarily show how employees can adjust their daily
activities in order for them to align with the business’ objectives.
5.2.1.5 Display of performance measures
The roadmap does not show any performance measures.
5.2.1.6 Display of approach to increasing shareholder value
The roadmap does not show the direct approach to increasing (or at least sustaining)
shareholder value, it does however show the approach taken to achieving the business’
objectives, and these objectives may hold implications for the shareholder value.
5.2.2 Strategy communication
5.2.2.1 Facilitating value in strategy communication
The roadmap provides value in strategy communication by giving a overview of how
the strategy is structured. It shows what activities the different departments have to align their
practices to in order for the business to reach the objectives from its current state. It also
shows a rough time planning for these activities.
47
5.2.2.2 Facilitating value in communication of feedback
The roadmap does not directly provide facilitating value for the processing of
feedback. However, it could be said that the structured overview of the strategy gives
employees a better overview of how they can pinpoint what projects or processes are not
running smoothly or sufficient enough, which makes communicating feedback easier. This is
also true from the management point of view, assuming that some kind of performance data is
available for the activities shown on the roadmap, managers are able to address specifically
those employees or departments that require feedback on their activities.
5.2.2.3 Stimulating value towards retention of strategy
The roadmap does not directly provide stimulating value towards the retention of the
strategy. It doesn’t incorporate mnemonics or any other methods that help viewers of the
visualization remember the contents.
5.2.2.4 Stimulating value towards agreement with the strategy
The roadmap does not directly stimulate agreement to the strategy as a whole. It does
however show how the different components, i.e. activities, of the strategy interconnect and
are supposed to lead to the business to the achievement of its business goals. It could be said
that the breakdown of the strategy gives the viewer a better understanding of why certain
components have to be fulfilled, which in turn could improve agreement towards the strategy
as a whole.
5.2.2.5 Stimulating value towards comprehension of the strategy
The roadmap does provide a stimulating value towards comprehension of the strategy.
It gives an in-depth look into how the strategy is structured, providing detail of the different
departments and how they collaborate. The breakdown of the strategy into its components
shows why different employees have to do what, and when, in order for the business to reach
its objectives.
5.2.2.6 Stimulating value to attention towards the strategy
The roadmap does provide a stimulating value to attention towards the strategy. It
makes all viewers aware of how the strategy as a whole is structured, the interconnection of
the collaborations of different departments and their activities. It also shows how their
individual activities are required to be performed as indicated, in order for the business as a
whole to be able to achieve its goals.
5.2.3 Functional visuals
5.2.3.1 Display of a clear ‘reading route’
The roadmap shows a clear reading route, as indicated by the left-to-right arrow up
top. Also it shows a chronologically structured timeline for the business’ objectives, indicated
by the planning of current, short-, medium-, and long-term activities, and how these relate to
the business’ vision.
48
5.2.3.2 Feature layering, enabling withholding of information
The roadmap template does not feature layering, or the ability to withhold
information. The template as is, is a static figure of the business strategy, and therefore it can
not contain additional layers of information, which makes it impossible to withhold
information that is already present in the figure.
5.2.3.3 Feature interactiveness, enabling both detail and overview
The roadmap template does not feature interactiveness, and is therefore less able to
provide both detail and overview of the contents. Again, the template is a static figure, in
order to be able to interact with a figure, it should first be digitized.
5.2.4 Usability
5.2.4.1 Feature customizability, for use by different parties
The roadmap template, as a static figure, can be customized to the needs of every
viewer individually, this would however be very time-consuming, especially considering that
changes may be made as time passes. For this reason, hierarchies of roadmaps are often used,
so that different levels of granularity can be displayed to different groups of viewers.
5.2.4.2 Feature a high ease of use
The roadmap does feature a respectable ease of use. It is a clear and structured
representation of the business strategy, which should be readily interpretable. It can easily be
used in the communication of strategy, by showing how the more complex overall plan breaks
down into smaller components.
5.2.5 Summarizing observations
The technology roadmapping template by Phaal, Farrukh & Probert (2015) scores
predominantly positive. It covers the content of the strategic plans clearly and in a structured
way. It facilitates communication of the strategic information both up and down the chain of
command, giving a clear overview of what information is relevant for which party. It is not
necessarily visually attractive, but incorporates some functional visuals required for
communication of the content. The usability of the template is difficult to determine, as it is
just a static figure. Being a static figure, its usability is high, but it can not yet be determined
if this would still be the case, if the static figure were to become a more interactive or layered.
The technology roadmap does however have drawbacks. It does not really provide the
ability to show great detail of specific activities, projects or processes, which in turn makes it
difficult for viewers of the visualization to be able to align their daily activities, but also might
make it more difficult to foster agreement to the approach taken. The lack of incorporated
performance measures makes it difficult to locate bottlenecks or difficulties that individuals,
teams or departments are encountering. Also, the roadmap does not directly provide insight in
how the business is trying to increase (or at least sustain) its shareholder value. The roadmap
does not use mnemonics or other methods to stimulate retention of the content, and also does
not directly stimulate agreement to the strategy. The roadmap template does not feature
layering of information, or interactiveness, the lack of either makes it difficult to give more a
49
deeper insight into the information provided, if this were to be required. Lastly, customizing
the roadmap, being a static figure, to the viewpoint and needs of every different viewer, is
laborious. The current method of customization is to create hierarchies of different roadmaps
so that these can be distributed to specific stakeholders respectively.
5.3 Validation
5.3.1 Expert opinion
In order to validate the findings of this study, validation by expert opinion was
conducted. This validation is required to justify whether the proposed additions would satisfy
the stakeholder goals, were they to be implemented. Expert opinions only work if the expert
understands the proposed treatment, is able to imagine realistic problem contexts, and makes
reliable predictions about the effects of the treatment within the context. This means that it is
essential to find an expert that is suitable for the specific context of the study.
5.3.1.1 Expert: Dr Robert Phaal
This study, its findings and the recommendation were submitted to an expert in the
field. The expert that was contacted for this study is Dr Robert Phaal, who coincidentally also
contributed to the design of the roadmap template that was analysed. Phaal works at the
department of engineering at the university of Cambridge, and researches the application of
engineering principles and methods to management and organisational challenges in the
context of high tech innovation and strategy. Phaal is particularly interested in roadmapping
as a platform for strategic toolkits, as he considers it a flexible class of management tool for
supporting strategy and innovation.
Phaal fits well within the context of this study, as his expertise lies with strategic
technology management, and particularly because of his interest in roadmapping and strategy
visualization itself. Over the years, Phaal has published numerous papers regarding
roadmapping and its application regarding development, support and communication of
strategy.
5.3.1.2 General remarks
Phaal noted that he liked the framework for the application of visualization in strategy
communication, and the focus on roadmapping of this study. Furthermore, he made some
remarks regarding several aspects of this study, discussed below.
Relevance
Phaal agreed on the relevance of this study, as there has been very little focus on the
general application of visuals in strategy. Also, there has been very little focus on
roadmapping in particular, which he found to be strange, given its visual form and wide
applicability.
Representative set of roadmaps
Phaal commented on the amount and variability of the roadmaps that were used to
substantiate the choice of using the template for the analysis. The researcher originally used a
50
sample of four roadmaps that were obtained from the industry, concluding that they were
similar to the template in terms of information structure.
This lead to use of the sample of twenty roadmaps that was also used for defining
roadmap classifications. The paper that proposed this sample also investigated the distribution
of what types of roadmaps are used in practice. The diversity and variability of roadmap types
along with the corresponding distribution levels supported choosing the template for analysis.
5.3.1.3 Remarks on the results of this study
Improving roadmaps
Phaal noted that roadmaps are currently being used in a great variety of ways. The
roadmaps that are used are very varied in terms of purpose, format and most importantly
quality. He commented that the quality of roadmaps in practice is typically not great, which
suggests that there is plenty of scope for improvement. This means that there is a good
opportunity to contribute to improving the roadmaps, their quality, and the overall
roadmapping process.
General conclusions
Phaal noted that due to the fact that only the template was assessed using the
framework, the researcher should be tentative about drawing general conclusions. For this
reason suitable caveats should be included. Although many of the roadmaps used in practice
share the same information structure as the template (at least to some degree), this does not
directly mean that recommendations based on the template will be applicable and/or useful
for such roadmaps.
Some limitations have been added to the recommendations, as these recommendations
might not be applicable due to a variety of conditions. These limitations will be described
more thoroughly in the discussion.
Analysing a generic template has advantages and disadvantages. Results could be
widely applicable to a diverse set of roadmaps, since a lot of roadmaps share similar
information structure. However, roadmaps could also differ from the template heavily,
resulting in questionable applicability of the recommendations. The template does not account
for the diversity of conditions that a company is subjected to, which can influence how they
design, use and maintain their roadmaps.
Requirement construction
Phaal commented on the list of requirements that was constructed by using the key
driver method, which was used to score the generic roadmapping template. He stated that all
the issues that were pointed out in the template are fair enough, although one could also find
examples of roadmaps in practice that satisfy each of the formulated requirements, separately.
To the knowledge of Phaal, no roadmap currently exists that would satisfy all of the
formulated requirements within one figure.
Using a combination of design approaches or components from different roadmaps
could be the way to go in order to construct a roadmap that would satisfy all of the
requirements in one figure. However, this is also heavily dependent on how the anticipated
51
‘ideal’ roadmap would be used in practice. The use of the roadmap as a strategic tool in the
real world could possibly alter certain requirements due to specific circumstances.
5.3.2 Validation summary
The researcher set out to validate the results of this study, by expert opinion. The
study was subjected to a review from an expert in the field of strategy visualization. The
expert acknowledged the relevance of this study, and made meaningful comments that lead to
improvements in the approach taken. He supported that recommendations made, based on the
formulated requirements, could possibly lead to the improvement of roadmaps and their
application in strategy communication. However, he did note that recommendations based on
the template may not be applicable to certain real world cases, since the template does not
account for specific circumstances that businesses may be influenced by. Due to the fact that
the actual application of roadmaps may be very different from a filled-in template, a
recommendation may not have the anticipated results.
5.3 Recommendation
Using the key drivers formulated in chapter 4 and the analyzed strategy visualization
method of technology roadmapping, a recommendation will now follow. This
recommendation uses technology roadmapping as a baseline and criticises how a (new or
improved) strategy visualization should be designed in order for it to be more effective for use
in strategy communication. The choice of using roadmapping as a baseline was made due to
the fact that the method tackles a sizable amount of the requirements that effective strategy
visualizations should have, according to the analysis done, in order to be effective for use in
strategy communication.
A business that wishes to improve its strategy communication could benefit from the
use of strategy visualization. Various methods of strategy visualization exist. Technology
roadmaps are one of these methods, which can be described as simple, adaptable ‘strategic
lenses’, through which the evolution of complex systems can be viewed, supporting dialogue,
alignment and consensus (Phaal, Farrukh & Probert, 2015). Technology roadmaps scored
predominantly positive according to the key drivers for effective strategy visualization
formulated during this study, suggesting it is an effective method for use in strategy
communication. However, the findings of this study suggest that there is room for
improvement. Below, a few suggestions to the structural design of the roadmap template will
be given.
5.2.1 Extensive business objectives description
First, the roadmap template could benefit from a more extensive description of the
business objectives (or vision). Employees who are more informed about the goals of their
joint efforts will have a better understanding of why a certain approach towards this goal is
taken, and how this approach might affect their daily activities. Next to this, their better
understanding of the end goal could positively influence their agreement to the approach.
Also, a more elaborate description of the business objective, perhaps with the use of
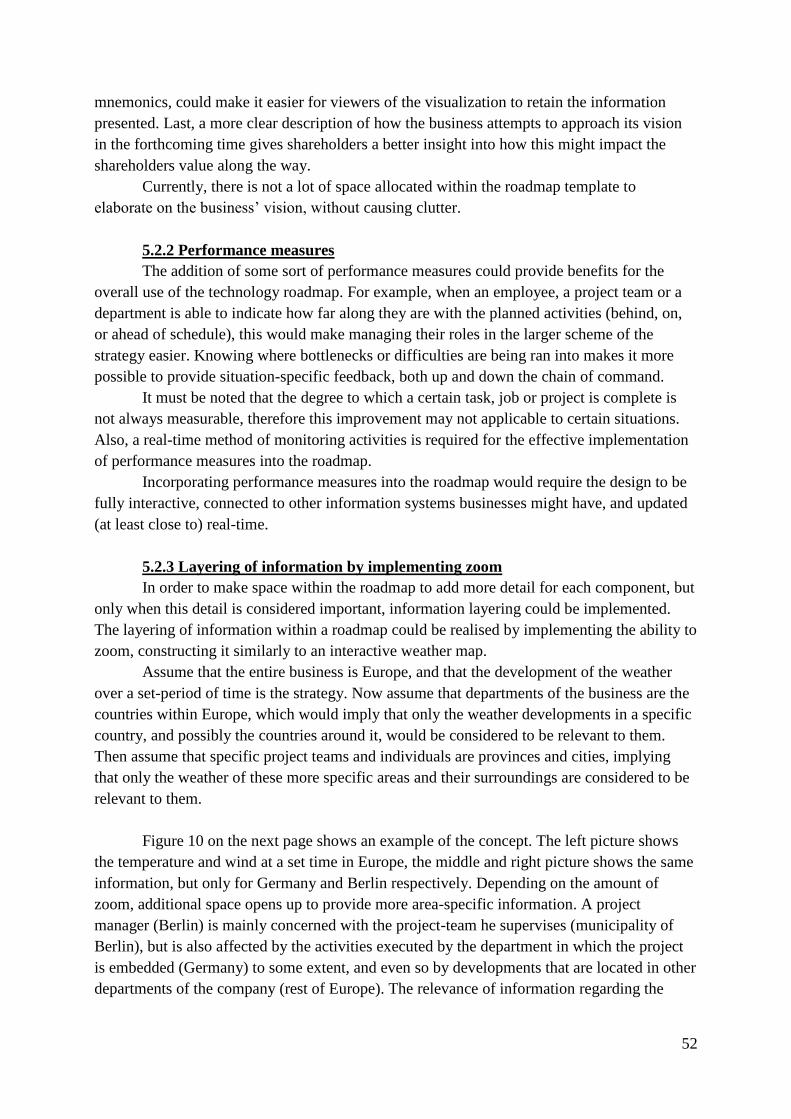
52
mnemonics, could make it easier for viewers of the visualization to retain the information
presented. Last, a more clear description of how the business attempts to approach its vision
in the forthcoming time gives shareholders a better insight into how this might impact the
shareholders value along the way.
Currently, there is not a lot of space allocated within the roadmap template to
elaborate on the business’ vision, without causing clutter.
5.2.2 Performance measures
The addition of some sort of performance measures could provide benefits for the
overall use of the technology roadmap. For example, when an employee, a project team or a
department is able to indicate how far along they are with the planned activities (behind, on,
or ahead of schedule), this would make managing their roles in the larger scheme of the
strategy easier. Knowing where bottlenecks or difficulties are being ran into makes it more
possible to provide situation-specific feedback, both up and down the chain of command.
It must be noted that the degree to which a certain task, job or project is complete is
not always measurable, therefore this improvement may not applicable to certain situations.
Also, a real-time method of monitoring activities is required for the effective implementation
of performance measures into the roadmap.
Incorporating performance measures into the roadmap would require the design to be
fully interactive, connected to other information systems businesses might have, and updated
(at least close to) real-time.
5.2.3 Layering of information by implementing zoom
In order to make space within the roadmap to add more detail for each component, but
only when this detail is considered important, information layering could be implemented.
The layering of information within a roadmap could be realised by implementing the ability to
zoom, constructing it similarly to an interactive weather map.
Assume that the entire business is Europe, and that the development of the weather
over a set-period of time is the strategy. Now assume that departments of the business are the
countries within Europe, which would imply that only the weather developments in a specific
country, and possibly the countries around it, would be considered to be relevant to them.
Then assume that specific project teams and individuals are provinces and cities, implying
that only the weather of these more specific areas and their surroundings are considered to be
relevant to them.
Figure 10 on the next page shows an example of the concept. The left picture shows
the temperature and wind at a set time in Europe, the middle and right picture shows the same
information, but only for Germany and Berlin respectively. Depending on the amount of
zoom, additional space opens up to provide more area-specific information. A project
manager (Berlin) is mainly concerned with the project-team he supervises (municipality of
Berlin), but is also affected by the activities executed by the department in which the project
is embedded (Germany) to some extent, and even so by developments that are located in other
departments of the company (rest of Europe). The relevance of information regarding the
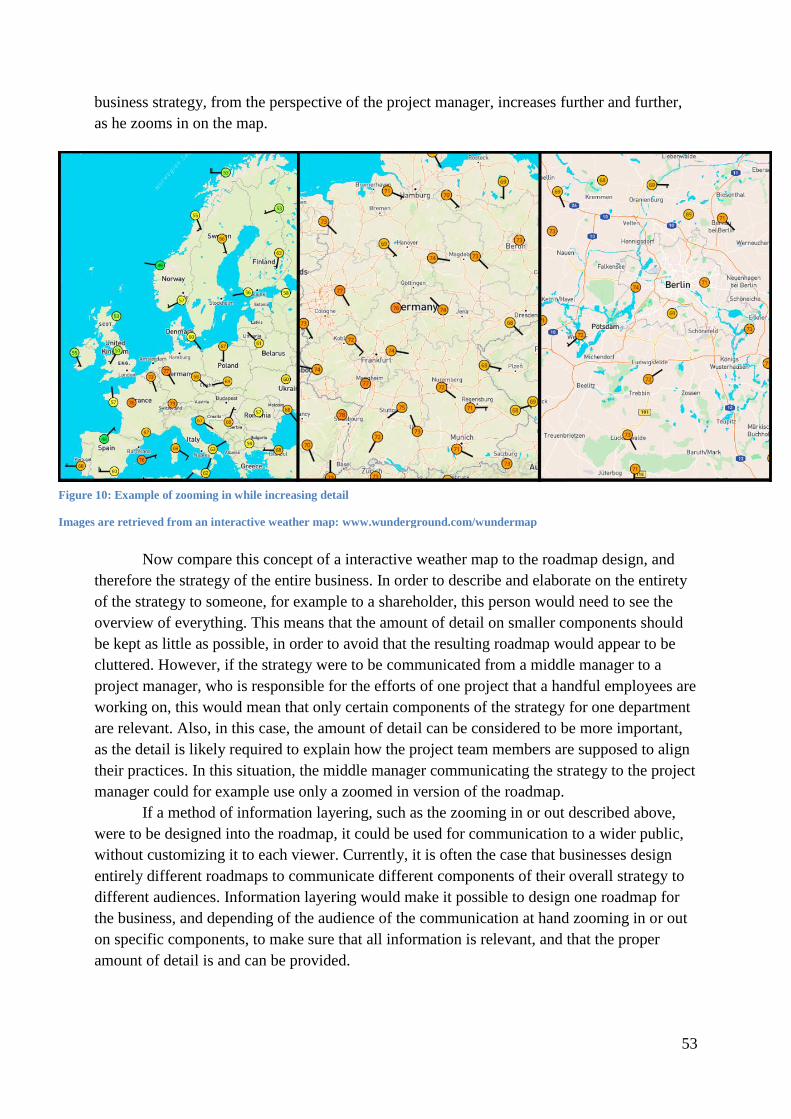
53
business strategy, from the perspective of the project manager, increases further and further,
as he zooms in on the map.
Now compare this concept of a interactive weather map to the roadmap design, and
therefore the strategy of the entire business. In order to describe and elaborate on the entirety
of the strategy to someone, for example to a shareholder, this person would need to see the
overview of everything. This means that the amount of detail on smaller components should
be kept as little as possible, in order to avoid that the resulting roadmap would appear to be
cluttered. However, if the strategy were to be communicated from a middle manager to a
project manager, who is responsible for the efforts of one project that a handful employees are
working on, this would mean that only certain components of the strategy for one department
are relevant. Also, in this case, the amount of detail can be considered to be more important,
as the detail is likely required to explain how the project team members are supposed to align
their practices. In this situation, the middle manager communicating the strategy to the project
manager could for example use only a zoomed in version of the roadmap.
If a method of information layering, such as the zooming in or out described above,
were to be designed into the roadmap, it could be used for communication to a wider public,
without customizing it to each viewer. Currently, it is often the case that businesses design
entirely different roadmaps to communicate different components of their overall strategy to
different audiences. Information layering would make it possible to design one roadmap for
the business, and depending of the audience of the communication at hand zooming in or out
on specific components, to make sure that all information is relevant, and that the proper
amount of detail is and can be provided.
Figure 10: Example of zooming in while increasing detail
Images are retrieved from an interactive weather map: www.wunderground.com/wundermap
54
This addition to the roadmap design would allow the communicator of the strategy to
choose the amount of detail the visualization shows, so that all the information communicated
is relevant to that specific interaction. Being able to do so, the viewer of the roadmap is not
shown much information that is not relevant to their practices or responsibilities. Keeping
most of the shown details relevant to the viewer could positively affect comprehension and
retention of the content, as well as provide a better explanation of how the strategic plans are
supposed to impact their daily activities.
Addition of an ability to zoom in and out does implicate that the roadmap has to be
designed as an interactive digital figure. Currently, roadmaps used in the industry are often
static figures. The concept of information layering would require businesses to have an
information sharing system that supports such a kind of interactive digital figure.
5.2.4 Filtering of information
Some businesses have a large amount of different departments, as a result of operating
in multiple countries or a vast diversity in practices. Other businesses have a strategy that
contains sensitive or confidential information. These businesses could benefit from being able
to filter out information in the roadmap when it is communicated to a certain audience, both
for confidentiality reasons as well as to avoid clutter.
Depending on an employee’ s hierarchical position within the company this employee
would be granted access to only those details of the strategy that are considered relevant to
his/her position, activities and responsibilities, while still being able to view the general
overview of the entire strategy.
The idea of a filter mechanism within the roadmap goes hand in hand with the
layering of information, as described above. Looking back at the example given of the map of
Europe, this employee would be able to see the zoomed out version of the map, thus being
able to view the general weather developments in the entirety of Europe. However, this
employee would, depending on their hierarchical position, only be able to zoom in on specific
countries, and therefore only able to view the more detailed description of the weather
development of these countries.
This concept of information filtering based on hierarchical position would allow
businesses to use one roadmap for the practices of different departments or even the entire
business, while still ensuring that the roadmap is uncluttered. Also, this would make it
possible to implement necessary confidential information into the roadmap, while still
keeping this information hidden from those that shouldn’t be able to access it.
Implementation of such an information filtering mechanism would make customization of the
roadmap to a specified audience relatively easy, given that the roadmap itself is already
created.
55
5.2.5 Summary of recommendations
The analysis of the technology roadmap template, using the requirements formulated
during the key driver method, revealed that it displays some potential shortcomings. In order
to address these shortcomings, a few recommendations have been made. The
recommendations of improvements to the template could all be implemented by designing the
roadmap to be an interactive, digital figure. The interactiveness would allow for information
layering and adding performance measures to be implemented. Making the figure digitally
accessible should make it possible for viewers to zoom in and out of the information layers,
choosing the amount of detail visible. Also, the figure being designed for digital and
interactive use would open up possibilities for information filtering, further narrowing down
the amount of detail visible. It would be beneficial to be able to customize the visibility of
components of the strategy to specific viewers, by filtering out information that is trivial for
their individual operations.
The recommendations made are possibly only applicable to roadmaps that are
constructed similar to the template, i.e. other type 1 roadmaps, since these mostly differ based
on the complexity of the information provided. If the proposed additions to the roadmap
template are considered to be only applicable to type 1 roadmaps, this would mean that
roughly 80% of the roadmaps that are used in practice could be adapted (Phaal, Farrukh &
Probert, 2008). If the recommendations would only be applicable to roadmaps that can be
classified as subtype 1d or 1e (due to the fact that these are very similar to the analysed
template, also in degree of complexity), this would still mean that close to 50% of the
roadmaps found in practice could possibly be improved upon.
56
6. Conclusion
Businesses need to implement strategies in order to cope with their circumstances and
conditions. This strategy has to be communicated throughout the entire organization. Every
employee has to align his/her activities with the overall plan in order for it to work.
Traditional communication methods such as face-to-face contact and written text-based
communication work for this purpose, however, these methods have a low multiplicative
power, and it might take a lot of effort or time for the information to reach the entirety of the
audience. Mediated communication methods combat this lack of multiplicative power and
allow for information to quickly reach a broader audience. Mediated communication methods
have not always shown to be beneficial for use, especially when the complexity of a strategy
is high. Visualization has proven to be beneficial for reducing complexity in communication,
therefore reducing the disadvantages of using mediated communication methods. However,
visualization has also been found to have negative effects on communication of strategy, this
is due to the fact that there is no clear discourse on how to actually implement visualization
into the communication process.
This study set out to research how strategy visualization can be used so that it aids in
strategy communication. By conducting a partial design cycle, the first steps towards a new
strategy visualization design have been made. The problem has been fully investigated, by
analysing the context of the problem and the relevant stakeholders. Requirements for a
treatment design have been gathered using different methods, and the key driver method has
been used to find what common ground these requirements have. Using this method, the key
drivers for effective strategy visualization have been determined to be: strategic content,
strategy communication, functional visuals, and usability.
According to the findings of this study, a strategy visualization that is developed while
paying attention to these key drivers, and their respective requirements as formulated in
chapter 4 and 5, will be more effective for use in strategy communication.
57
7. Discussion
7.1 Findings
This study set out to find how strategy can be effectively visualized so that it improves
communication between stakeholders in strategy communication. Literature research and an
interview was done in order to get an understanding of the problem and its context. A partial
design cycle was followed through with in order to get a more in depth look into the problem.
Next, an overview of requirements for such a visualization was constructed using the key
driver method. In order for a strategy visualization to be effective for use in strategy
communication, it should satisfy requirements that can be grouped under the four determined
key drivers: strategic content, strategy communication, functional visuals and usability.
This means that in order to be effective, a strategy visualization must comprehensively
display the strategic content, in such a way that it is communicated fully and clearly. The
visualization must also make use of functional visual components, that guide the reader into
the, for them respectively, right direction. Lastly, the visualization must have a high usability,
so that it can be effective for use in practice.
Many of the requirements for effective use of strategy visualizations are covered by
the technology roadmapping template design by Phaal, Farrukh & Probert (2015), but there is
still room for improvement. Especially because the roadmaps found in practice are typically
low in quality. A recommendation was made with regards to improving the roadmap template
design, which can be summarized as follows:
More extensive detail should be provided on the overarching business objectives, in
order to foster attention and agreement, but also to create a better knowledge base for
comprehension of the strategies’ contents. Performance measures could be implemented, in
order to make it easier to manage strategic plan components, and enabling better
communication of feedback both up and down the chain of command. Information layering
should be implemented, so that the amount of detail is adjustable to the specific situation,
ensuring that only relevant information is presented. And last, information filtering is
recommended to be incorporated into the roadmap design. Addition of information filtering
would allow the roadmap design to be fully and easily customizable to situations in which the
strategy is communicated to a certain stakeholder or another specific audience. Also,
implementation of information filtering would make it possible to hide potential sensitive
information, this is useful for businesses that have a strategy which incorporates confidential
information.
These recommendations do require the roadmap design to be fully digitised, in such a
way that it is an interactive digital figure that any stakeholder of the strategy has access to (to
at least some extent). Also, the roadmap would have to be connected to an information system
that is updated real-time (or very regularly), in order for the performance measures to be
implemented. The additions would result in one ‘master’-roadmap that must be designed by
the business, which incorporates all strategy information and details, so that the layering and
filtering system would disperse the information appropriately.
58
If the technology roadmap template was redesigned in such a way that all the
recommendations are incorporated, the new roadmap would score better according to the
requirements and key drivers formulate during this study, and therefore be more suitable for
effective communication of strategy.
7.2 Comparison to other studies
The literature that was reviewed during this study showed that there is a dichotomy
regarding the effects of using strategy visualization in strategy communication (Farace,
Monge & Russell, 1977; Griffin, 1995; Foos & Goolkasian, 2005; Vliegen & van Wijk,
2006); Bresciani & Eppler, 2009; Abdallah & Langley, 2014; Kernbach, Eppler & Bresciani,
2015). Burkhard (2005a) found that the use of visualization has potential, but that there is a
lack of a clear description of an approach towards implementing visualization. Despite that
there are numerous methods to visualize strategy, no golden standard has yet been
determined.
In particular regarding roadmapping, Kerr & Phaal (2015) state that the visual design
of roadmaps has been largely overlooked, with little attention given to their graphic design,
undermining the value of roadmaps as a communication tool. They attempted to provide an
approach towards designing roadmaps that are effective for use in practice. This approach was
however tailored towards roadmaps in general, not strategy communication in particular.
This study attempted to make the first steps towards designing a method for
implementing visualization in strategy visualization, by constructing requirements for such a
visualization. To the knowledge of the researcher, no study towards requirements for effective
strategy visualizations has been conducted before, within the field of business strategy
communication.
7.3 Limitations
This study holds several limitations, discussed below.
The design cycle was only partially conducted, the problem was investigated, the
context was analysed, requirements for a treatment were constructed, a recommendation was
written, and the requirements and recommendation were validated by expert opinion.
However, no design of a treatment was made. The actual design of a treatment to the problem,
would allow for better validation of the formulated requirements, this in turn making the
findings more grounded. Also, after validation of the end-product, the cycle could have been
iterated, using the obtained knowledge as starting point in order to dig deeper into the
problem and its treatment. The construct of the design cycle is meant to be iterated to get the
best results.
The key driver method was also only partially performed. In order to validate the
determined key drivers, these have to be discussed with stakeholders. Similar to the design
cycle, the key driver method is also a cycle that is supposed to be iterated, using newly found
59
knowledge to fuel new approaches to the problem. Although, an iteration of the key driver
method was performed using an expert opinion. The expert that was consulted for validation
of the recommendation also commented on the requirements that were formulated. His
feedback was implemented in order to improve the proposed requirements.
Only one interview with a stakeholder of strategy communication was conducted. This
interview allowed for an insight into the practicalities of strategy in businesses the real world.
However, it did not create an extensive understanding of how the research problem manifests
itself in for example businesses of a different size or industry. Also the perspectives of
different stakeholder could give better insight into how the problem is experienced in the
field.
Only one strategy visualization method, technology roadmapping, was analysed using
the findings of this study. In order to be able to make a more generalizable recommendation,
more strategy visualization methods could have been analyzed. The choice of technology
roadmapping was made based on its presence in the industry and its flexibility in application.
Also within technology roadmapping, the recommendation made in this study may not always
be applicable, this is due to the fact that only a template of a technology roadmap was used
for the analysis.
One should be tentative of drawing conclusions from the analysis of a template, since
real world examples of roadmaps that are based on this template may differ greatly. This
difference between real world examples and the template could be so substantial that the
recommendations have effects that are not in line with the anticipated goals, or can no longer
be implemented.
7.4 Implications
This study investigated the use of visualization in strategy communication. While
there are numerous strategy visualization methods, little research has been done towards the
actual performance of said visualizations in use, designing new strategy visualizations, or
improving existing ones. This study took a step into the direction of improving strategy
communication while incorporating strategy visualization. Further research is needed in order
to validate and verify the formulated requirements.
60
8. References
Abdallah, C., & Langley, A. (2014). The double edge of ambiguity in strategic
planning. Journal of Management Studies, 51(2), 235-264.
N. Athanassopoulou, (2014). Roadmapping Workshop for the EPSRC Centre for
Innovative Manufacturing in Ultra Precision
Athanassopoulou, N., Thompson, H., & Reimann, M. (2015). Strategic Research &
Innovation Roadmap and Business Opportunities for ICT in Manufacturing.
Beer, M. (1980). Organization change and development. Santa Monica.
Beer, M., & Eisenstat, R. A. (2000). The silent killers of strategy implementation and
learning. Sloan management review, 41(4), 29.
Blackwell, A. F., Phaal, R., Eppler, M., & Crilly, N. (2008, September). Strategy
roadmaps: new forms, new practices. In International Conference on Theory and Application
of Diagrams (pp. 127-140). Springer, Berlin, Heidelberg.
Breene, R. T. S., Nunes, P. F., & Shill, W. E. (2007). The chief strategy officer.
Harvard business review, 85(10), 84.
Bresciani, S., & Eppler, M. J. (2009). The risks of visualization. Identität und Vielfalt
der Kommunikations-wissenschaft, 165-178.
Burkhard, R. A. (2005a). Strategy visualization: A new research focus in knowledge
visualization and a case study. In Proceedings of I-KNOW (Vol. 5).
Burkhard, R. A. (2005b). Towards a framework and a model for knowledge
visualization: Synergies between information and knowledge visualization. Knowledge and
information visualization, 29-42.
Carr, A. S., & Kaynak, H. (2007). Communication methods, information sharing,
supplier development and performance: an empirical study of their relationships.
International Journal of Operations & Production Management, 27(4), 346-370.
Cockburn, A. (2000). Writing effective use cases, The crystal collection for software
professionals. Addison-Wesley Professional Reading.
Collis, D. J., & Rukstad, M. G. (2008). Can You Say What Your Strategy Is?. harvard
business review, 1.
61
Consultancy, I. F. M. (2016). Report of the Roadmapping Workshop: Bulk
Superconductivity.
Cummings, S., & Angwin, D. (2011). Stratography: The art of conceptualizing and
communicating strategy. Business Horizons, 54(5), 435-446.
David, F. R. (2011). Strategic management: Concepts and cases. Pearson/Prentice
Hall.
Doorewaard, H., & Verschuren, P. (2007). Het ontwerpen van een onderzoek. Den
Haag: Boom.
Eppler, M. J., & Burkhard, R. A. (2006). Knowledge visualization. In Encyclopedia of
knowledge management (pp. 551-560). IGI Global.
Farace, R. V., Monge, P. R., & Russell, H. M. (1977). Communicating and organizing
(Vol. 1077). Reading, MA: Addison-Wesley.
Fidler, L. A., & Johnson, J. D. (1984). Communication and innovation
implementation. Academy of Management Review, 9(4), 704-711.
Floyd, S. W., & Wooldridge, B. (1992). Middle management involvement in strategy
and its association with strategic type: A research note. Strategic management journal,
13(S1), 153-167.
Goolkasian, P., & Foos, P. W. (2005). Bimodal format effects in working memory. The
American journal of psychology, 61-78.
Gordijn, J., & Akkermans, J. M. (2003). Value-based requirements engineering:
exploring innovative e-commerce ideas. Requirements engineering, 8(2), 114-134.
Grant, R. M. (2003). Strategic planning in a turbulent environment: Evidence from the
oil majors. Strategic management journal, 24(6), 491-517.
Griffin, R. E. (1995). Using Symbols in International Business Presentations: How
Well Are They Understood?.
Hambrick, D. C., & Cannella, A. A. (1989). Strategy implementation as substance and
selling. The Academy of Management Executive, 3(4), 278-285.
Hamilton, C., Maw, A., Gill, A., Brahmbhatt, M., Phaal, R., & Pickard, J. (2017).
Paediatric neurorehabilitation: finding and filling the gaps through the use of the Institute for
Manufacturing strategic roadmapping method. BMJ Innovations, 2017;3:137-143.
62
Harrison, J. S., & John, C. H. S. (1994). Strategic management of organizations and
stakeholders: Theory and cases. West Group.
Heemels, W. P. M. H., Somers, L. J. A. M., van den Bosch, P., Yuan, Z., van der Wijst,
B., van den Brand, A., & Muller, G. J. (2006). The key driver method. Boderc: Model-Based
Design of High-Tech Systems, edited by W. Heemels and GJ Muller, 27-42.
Hrebiniak, L. G., & Joyce, W. F. (1984). Implementing strategy. New York:
Macmillan.
Hrebiniak, L. (2006). Obstacles to effective strategy implementation.Organizational
dynamics, 35(1), 12-31. doi: 10.1016/j.orgdyn.2005.12.001
Hull, G. A., & Nelson, M. E. (2005). Locating the semiotic power of multimodality.
Written communication, 22(2), 224-261.
Hunter, P., & O'Shannassy, T. (2007). Contemporary strategic management practice
in Australia:" Back to the future" in the 2000s. Singapore Management Review, 29(2), 21.
Kaplan, R. S., & Norton, D. P. (2004). The strategy map: guide to aligning intangible
assets. Strategy & leadership, 32(5), 10-17.
Kaplan, R. S., & Norton, D. P. (2005). The office of strategy management. Strategic
Finance, 87(4), 8.
Kaplan, R. S., & Norton, D. P. (2008). The execution premium: Linking strategy to
operations for competitive advantage. Harvard Business Press.
Katz, E. (1957). The two-step flow of communication: An up-to-date report on an
hypothesis. Public opinion quarterly, 21(1), 61-78.
Katz, E. (1961). The social itinerary of technical change: two studies on the diffusion
of innovation. Human Organization, 20(2), 70-82.
Kernbach, S., Eppler, M. J., & Bresciani, S. (2015). The use of visualization in the
communication of business strategies: An experimental evaluation. International Journal of
Business Communication, 52(2), 164-187.
Kerr, C., & Phaal, R. (2015). Visualizing roadmaps: A design-driven approach.
Research-Technology Management, 58(4), 45-54.
Koskei, F. K. (2003). Strategy implementation and its challenges in Public
corporations: the case of Telkom Kenya Limited (Doctoral dissertation, University of
Nairobi).
63
Lengler, R., & Eppler, M. J. (2007). Towards a periodic table of visualization methods
for management. In IASTED Proceedings of the Conference on Graphics and Visualization in
Engineering (GVE 2007), Clearwater, Florida, USA.
Li, Y., Guo-hui, S., & Eppler, M. J. (2011). Making Strategy Work: A Literature
Review on the Factors influencing Strategy Implementation.
MacEachren, A. M. (1994). Visualization in modern cartography: setting the agenda.
Visualization in modern cartography, 28(1), 1-12.
Maguire, M. (2001). Methods to support human-centred design. International journal
of human-computer studies, 55(4), 587-634.
Mazzola, P., & Kellermanns, F. W. (2011). Handbook of research on strategy process.
Edward Elgar Publishing Limited.
Mintzberg, H. (1978). Patterns in strategy formation. Management science, 24(9),
934-948.
Muller, G. (2011). Systems architecting: A business perspective. In INCOSE
International Symposium (Vol. 21, No. 1, pp. 1845-2142).
Noble, C. H. (1999). The eclectic roots of strategy implementation research. Journal
of business research, 45(2), 119-134.
Osterwalder, A., Pigneur, Y., & Tucci, C. L. (2005). Clarifying business models:
Origins, present, and future of the concept. Communications of the association for
Information Systems, 16(1), 1.
Phaal, R., Farrukh, C. J., & Probert, D. R. (2004). Technology roadmapping—a
planning framework for evolution and revolution. Technological forecasting and social
change, 71(1), 5-26.
Phaal, R., Farrukh, C. J., & Probert, D. R. (2009). Visualising strategy: a
classification of graphical roadmap forms. International Journal of Technology Management,
47(4), 286-305.
Phaal, R., Farrukh, C., & Probert, D. (2015, March). Roadmapping for strategy and
innovation. In IEE Seminar on justifying and selecting innovation projects.
Rode, C. (2000). In the Eye of the Beholder-Visual and Verbal Cognitive Capacities in
Complex Problem Solving. Zürich, Think Tools AG.
Rogers, E. M., & Shoemaker, F. F. (1971). Communication of Innovations; A Cross-
Cultural Approach.
64
Schaap, J. I. (2006). Toward strategy implementation success: An empirical study of
the role of senior-level leaders in the Nevada gaming industry. UNLV Gaming Research &
Review Journal, 10(2), 2.
Shi, W., Markoczy, L., & Dess, G. G. (2009). The role of middle management in the
strategy process: Group affiliation, structural holes, and tertius iungens. Journal of
management, 35(6), 1453-1480.
Sommer, S. C., & Loch, C. H. (2004). Selectionism and learning in projects with
complexity and unforeseeable uncertainty. Management science, 50(10), 1334-1347.
Teece, D. J., Pisano, G., & Shuen, A. (1997). Dynamic capabilities and strategic
management. Strategic management journal, 509-533.
Tory, M., & Moller, T. (2004). Human factors in visualization research. IEEE
transactions on visualization and computer graphics, 10(1), 72-84.
Velasco, J. (2006). The fundamental rights of the shareholder. UC Davis L. Rev., 40,
407.
Venkatraman, N., & Camillus, J. C. (1984). Exploring the concept of “fit” in strategic
management. Academy of management review, 9(3), 513-525.
Vliegen, R., Van Wijk, J. J., & van der Linden, E. J. (2006). Visualizing business data
with generalized treemaps. IEEE Transactions on visualization and computer graphics, 12(5),
789-796.
Wieringa, R. J. (2014). Design science methodology for information systems and
software engineering. Springer.
Wooldridge, B., Schmid, T., & Floyd, S. W. (2008). The middle management
perspective on strategy process: Contributions, synthesis, and future research. Journal of
management, 34(6), 1190-1221.