Embed Size (px)
Citation preview
F. W. Klaiber, T. J. Wipf, E. J. Kash
Effective Structural Concrete RepairVolume 2 of 3
Use of FRP to Prevent ChloridePenetration in Bridge Columns
March 2004
Sponsored by theIowa Department of Transportation
Highway Division and theIowa Highway Research Board
Iowa DOT Project TR - 428
Final
Department of Civil, Construction andEnvironmental Engineering

The opinions, findings, and conclusions expressed in thispublication are those of the authors and not necessarily those of
the Iowa Department of Transportation.
F. W. Klaiber, T. J. Wipf, E. J. Kash
Effective Structural Concrete RepairVolume 2 of 3
Use of FRP to Prevent ChloridePenetration in Bridge Columns
March 2004
Sponsored by theIowa Department of Transportation
Highway Division and theIowa Highway Research Board
Iowa DOT Project TR – 428
Final
Department of Civil, Construction andEnvironmental Engineering

General Abstract
Structural concrete is one of the most commonly used construction materials in theUnited States. However, due to changes in design specifications, aging, vehicle impact, etc. –there is a need for new procedures for repairing concrete (reinforced or pretressed)superstructures and substructures. Thus, the overall objective of this investigation was to developinnovative cost effective repair methods for various concrete elements. In consultation with theproject advisory committee, it was decided to evaluate the following three repair methods:
• Carbon fiber reinforced polymers (CFRPs) for use in repairing damaged prestressedconcrete bridges
• Fiber reinforced polymers (FRPs) for preventing chloride penetration of bridge columns• Various patch materials
The initial results of these evaluations are presented in this three volume final report. Eachevaluation is briefly described in the following paragraphs. A more detailed abstract of eachevaluation accompanies the volume on that particular investigation.
Repair of Impact Damaged Prestressed Concrete Beams with CFRP (Volume 1)Four full-sized prestressed concrete (PC) beams were damaged and repaired in the laboratoryusing CFRP. It was determined that the CFRP repair increased the cracking load and restored aportion of the lost flexural strength. As a result of its successful application in the laboratory,CFRP was used to repair three existing PC bridges. Although these bridges are still beingmonitored, results to date indicate the effectiveness of the CFRP.
Use of FRP to Prevent Chloride Penetration in Bridge Columns (Volume 2 - thisvolume) Although chemical deicing of roadways improves driving conditions in the winter, thechlorides (which are present in the majority of deicing materials) act as a catalyst in the corrosionof reinforcement in reinforced concrete. One way of preventing this corrosion is to install abarrier system on new construction to prevent chloride penetration. Five different fiberreinforced polymer wrap systems are being evaluated in the laboratory and field. In thelaboratory one, two, and three layers of the FRP system are being subjected to AASHTO pondingtests. These same FRP wrap systems have been installed at five different sites in the field (i.e.one system at each site). Although in the initial stages of evaluation, to date all five FRP wrapsystems have been effective in keeping the chloride level in the concrete below the corrosionthreshold.
Evaluation of Repair Materials for Use in Patching Damaged Concrete (Volume 3)There are numerous reasons that voids occur in structural concrete elements; to prevent additionalproblems these voids need repaired. This part of the investigation evaluated several repairmaterials and identified repair material properties that are important for obtaining durableconcrete repairs. By testing damaged reinforced concrete beams that had been repaired andwedge cylinder samples, it was determined that the most important properties for durableconcrete repair are modulus of elasticity and bond strength. Using properties isolated in thisinvestigation, a procedure was developed to assist in selecting the appropriate repair material fora given situation.

Effective Structural Concrete Repair
General Introduction
Structural concrete is one of the most commonly used construction materials in
the United States. Due to changes in the design specification for bridges, increases in
legal loads, potential for over-height vehicle impacts, and general bridge deterioration,
there is need for new procedures for strengthening and/or rehabilitating existing
reinforced and prestressed concrete bridges. In this investigation, strengthening and
rehabilitating are considered to be specific means of repairing. The problems previously
noted occur in the superstructure as well as in the substructure and are commonplace for
state bridge engineers, county engineers and consultants.
In the past, several different materials and procedures have been used for
strengthening/rehabilitating structural concrete with varying degrees of success. Some of
the procedures used may be effective initially, however, they may not be effective long
term especially if the deterioration is due to chloride contamination. Thus, research was
needed to develop successful repair methods/materials for strengthening/rehabilitating
various structural concrete bridge elements.
Overall Research Objectives
The overall objective of this project was to develop innovative repair methods that
employ materials which result in the cost effective repair of structural concrete elements.
Carbon Fiber Reinforced Polymers (CFRPs) were found to be the most effective material
for long term repair. They have shown promise for use in strengthening and/or
rehabilitating various bridge elements. These materials have the advantage of large
iii

strength/weight ratios, excellent corrosion and fatigue properties, and are relatively
simple to install.
To insure the success of this project, a project advising committee (PAC)
consisting of members from the Iowa DOT Office of Bridges and Structures and the Iowa
County Engineers Association was formed The research team met with the PAC on six
different occasions. During the initial meetings, the numerous problems engineers have
with structural concrete bridge elements were discussed. In later meetings, the research
team proposed some potential solutions to the problems previously noted. The outcome
of the last PAC meeting was that the following three repair methods should be
investigated:
1.) Evaluation of CFRP for use in repairing/strengthening damaged prestressed
concrete bridges,
2.) Evaluation of FRP for preventing chloride penetration into bridge columns,
3.) Evaluation of various patch materials.
This project involved a combination of laboratory and field tests. In two cases (1
and 2 noted above), there were laboratory investigations prior to investigating the
procedure/material in the field in demonstration projects. The procedures/materials used
in the demonstration projects will be periodically inspected until the end of the contract
which is Dec., 2008. A log noting the date of the inspection, condition of strengthening
system, etc. will be kept for each demonstration project. If a significant change in the
strengthening system is observed at one of the demonstrate sites, the structure could be
tested if such a test would provide additional information on the repair material/system.
iv

Reports
Since there were three unique repair systems/materials investigated in this project,
the results are presented in three separate volumes. Laboratory as well as field test results
are presented in this three volume final report. Following this initial report, brief interim
reports on the demonstration projects will be submitted approximately every two years.
At the conclusion of the project (Dec. 2008), a final summary report will be submitted.
As previously noted, each volume of this final report is written independently.
Thus, the reader may read the volume of interest without knowledge of the other two
volumes. To further assist the readers in their review of this final report:
• Each volume has a unique abstract, summary, and conclusions, which are
pertinent to that part of the investigation. Application guides for installing CFRP
on damaged prestressed concrete beams and FRP on columns are presented in
Volumes 1 and 2, respectively. A general abstract briefly summarizing the entire
project is presented at the beginning of each volume. Thus, the three volume
report has four abstracts.
• Each volume has a reference list that is unique to that part of the project. A
limited number of references have been cited in more than one volume of the final
report.
• The three volumes have different authors – the senior members of the research
team plus the graduate research assistant(s) who worked on that part of the
investigation.
v

Volume 2 Abstract
Yearly, over 500 million dollars are spent on the chemical deicing of roadways to
improve travel conditions during winter snow and ice storms. The chlorides within the
salts however act as a catalyst in the corrosion of reinforcement in reinforced concrete. It
is estimated that several billion dollars are needed to rehabilitate the nation’s bridges that
have deteriorated due to this reinforcement corrosion. Several researchers have observed
that if a barrier protection system against corrosion was installed at the time of
construction, corrosion could be prevented. This report summarizes the initial stages of
an investigation of one such system. Five different fiber reinforced polymer (FRP) wrap
systems, applied to prevent chloride penetration into the concrete, are being evaluated in
the laboratory and field.
In the field portion, reinforced concrete columns at five different sites had a FRP
barrier system installed. These five columns are being monitored yearly to determine if
chlorides, from deicing salts applied to adjacent roadways during winter months, have
penetrated the wrap. In the laboratory, an AASHTO ponding test was initiated on
concrete slabs constructed to evaluate one layer, two layers, and three layers of the same
five different FRP wrap systems. In addition to the FRP wrap systems, two protective
top coats were installed on the same concrete slab. The concrete slab was then subjected
to a three percent sodium chloride solution during 90 day ponding cycles.
To date, a single layer of all five FRP wrap systems has been effective in keeping
the chloride level in the concrete below the corrosion threshold. With the exception of
one product, the single layer of FRP wrap has been effective in preventing chlorides from
penetrating into the concrete. However in this case, level of chlorides in the concrete is
still below the threshold limit. The effectiveness of the five FRP systems, based on both
the field and laboratory data, will be presented in a supplementary report at the
conclusion of this investigation.
vii
ix
TABLE OF CONTENTS
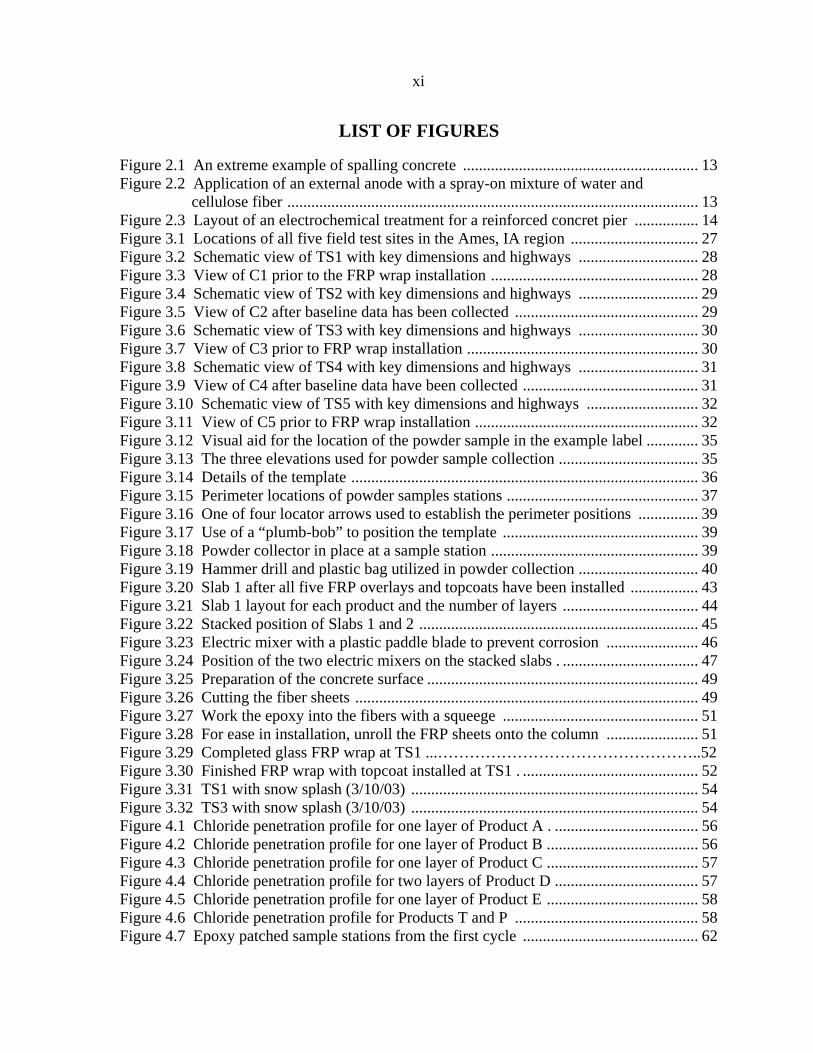
LIST OF FIGURES .................................................................................................................xi
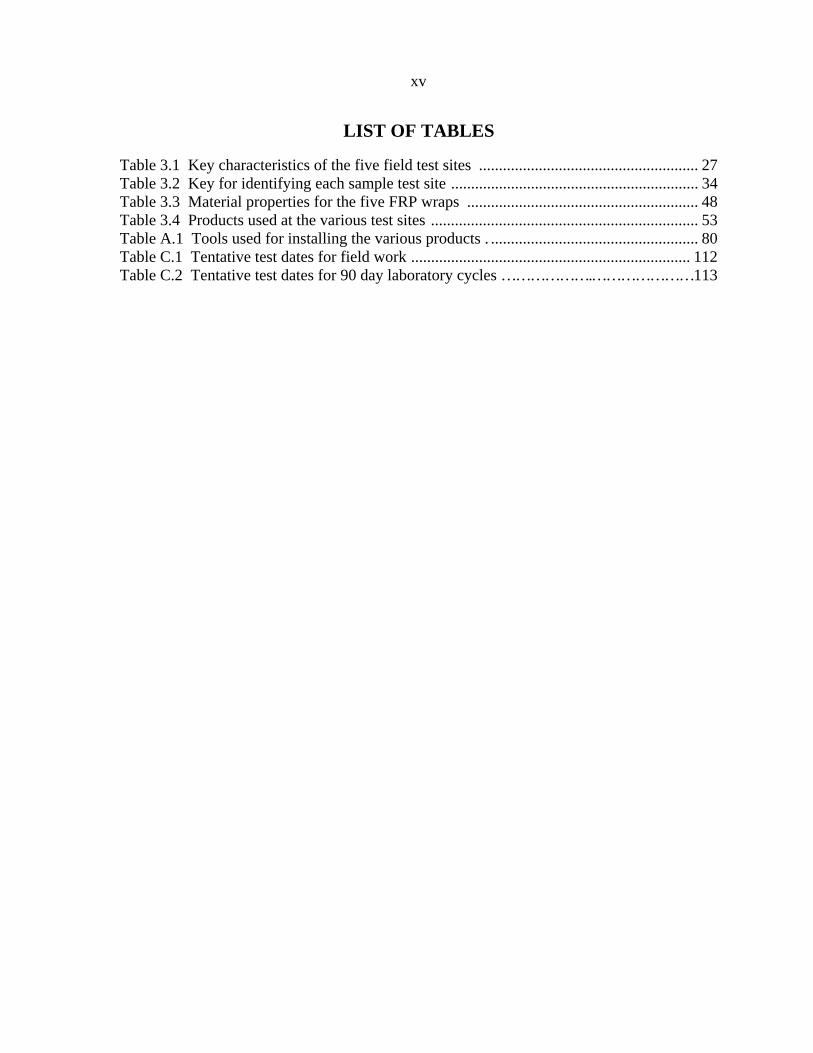
LIST OF TABLES .................................................................................................................. xv
1. INTRODUCTION ............................................................................................................... 11.1 Background ................................................................................................................... 11.2 Project Objective ........................................................................................................... 21.3 Project Scope .................................................................................................................. 3
2. LITERATURE REVIEW .................................................................................................... 52.1 Reinforcement Corrosion .............................................................................................. 5
2.1.1 Corrosion Process of Reinforcement ..................................................................... 52.1.2 Chloride Sources .................................................................................................... 82.1.3 Factors that Influence the Rate of Corrosion ......................................................... 8
2.2 Prevention, Repair and Rehabilitation of Chloride Contaminated Concrete ................ 92.2.1 Prevention of Chloride Contamination .................................................................. 92.2.2 Repair of Chloride Contaminated Concrete ......................................................... 102.2.3 Rehabilitative Methods for Chloride Contaminated Reinforced Concrete .......... 12
2.3 Fiber Reinforced Polymers .......................................................................................... 152.3.1 FRP Properties and Rehabilitative Characteristics ............................................... 162.3.2 Research Conducted on FRP and Chloride Contaminated Reinforced
Concrete ............................................................................................................... 182.3.3 Environmental Factors on FRP ............................................................................ 23
3. EXPERIMENTAL PROGRAM ....................................................................................... 253.1 Field Specimens .......................................................................................................... 25
3.1.1 Evaluation and Description of Test Sites ............................................................. 253.1.2 Acquisition of Chloride Data ............................................................................... 26
3.1.2.1 Standard Test Method for Chloride Sample Collection ................................ 333.1.2.2 Template for Data Acquisition ...................................................................... 333.1.2.3 Collection Procedure for Field Test Sites ..................................................... 38
3.2 Laboratory Specimens ................................................................................................. 413.2.1 AASHTO Ponding Test ....................................................................................... 413.2.2 Specimen Geometry and Fabrication ................................................................... 423.2.3 Circulation System ............................................................................................... 46
3.3 FRP Material ............................................................................................................... 473.3.1 Summary of FRP Properties ................................................................................. 473.3.2 FRP Installation Process ...................................................................................... 48
3.3.2.1 Typical Application for Fiber Wraps ............................................................ 483.3.2.2 Installation Locations Specific to Product Type ........................................... 53
3.4 Acquisition of Environmental Data ............................................................................. 53
x
4. RESULTS ......................................................................................................................... 55 4.1 Laboratory Specimens ................................................................................................ 55
4.1.1 Chloride Penetration in the Laboratory Specimens ............................................. 55 4.1.2 Laboratory Experimental Errors .......................................................................... 61
4.2 Field Test Site Columns .............................................................................................. 61 4.2.1 Chloride Penetration in the Field Test Columns .................................................. 63 4.2.2 Review of Baseline Data ...................................................................................... 63
4.2.2.1 Leaching Occurrence at TS4 ......................................................................... 65 4.2.2 Discussion of TS1 Results ................................................................................... 67
5. SUMMARY AND TRENDS ............................................................................................ 69
5.1 Summary ..................................................................................................................... 69 5.2 Trends ......................................................................................................................... 71
APPENDIX A: PROCEDURES FOR INSTALLING A FRP WRAP ON A
REINFORCED CONCRETE COLUMN .................................................. 73 APPENDIX B: CHLORIDE PROFILES FOR TS1-TS5 ..................................................... 93 APPENDIX C: FUTURE TEST DATES ........................................................................... 111 REFERENCES ................................................................................................................... 115 ACKNOWLEDGEMENTS ................................................................................................. 119
xi
LIST OF FIGURES
Figure 2.1 An extreme example of spalling concrete ........................................................... 13 Figure 2.2 Application of an external anode with a spray-on mixture of water and
cellulose fiber ....................................................................................................... 13 Figure 2.3 Layout of an electrochemical treatment for a reinforced concret pier ................ 14 Figure 3.1 Locations of all five field test sites in the Ames, IA region ................................ 27 Figure 3.2 Schematic view of TS1 with key dimensions and highways .............................. 28 Figure 3.3 View of C1 prior to the FRP wrap installation .................................................... 28 Figure 3.4 Schematic view of TS2 with key dimensions and highways .............................. 29 Figure 3.5 View of C2 after baseline data has been collected .............................................. 29 Figure 3.6 Schematic view of TS3 with key dimensions and highways .............................. 30 Figure 3.7 View of C3 prior to FRP wrap installation .......................................................... 30 Figure 3.8 Schematic view of TS4 with key dimensions and highways .............................. 31 Figure 3.9 View of C4 after baseline data have been collected ............................................ 31 Figure 3.10 Schematic view of TS5 with key dimensions and highways ............................ 32 Figure 3.11 View of C5 prior to FRP wrap installation ........................................................ 32 Figure 3.12 Visual aid for the location of the powder sample in the example label ............. 35 Figure 3.13 The three elevations used for powder sample collection ................................... 35 Figure 3.14 Details of the template ....................................................................................... 36 Figure 3.15 Perimeter locations of powder samples stations ................................................ 37 Figure 3.16 One of four locator arrows used to establish the perimeter positions ............... 39 Figure 3.17 Use of a “plumb-bob” to position the template ................................................. 39 Figure 3.18 Powder collector in place at a sample station .................................................... 39 Figure 3.19 Hammer drill and plastic bag utilized in powder collection .............................. 40 Figure 3.20 Slab 1 after all five FRP overlays and topcoats have been installed ................. 43 Figure 3.21 Slab 1 layout for each product and the number of layers .................................. 44 Figure 3.22 Stacked position of Slabs 1 and 2 ...................................................................... 45 Figure 3.23 Electric mixer with a plastic paddle blade to prevent corrosion ....................... 46 Figure 3.24 Position of the two electric mixers on the stacked slabs . .................................. 47 Figure 3.25 Preparation of the concrete surface .................................................................... 49 Figure 3.26 Cutting the fiber sheets ...................................................................................... 49 Figure 3.27 Work the epoxy into the fibers with a squeege ................................................. 51 Figure 3.28 For ease in installation, unroll the FRP sheets onto the column ....................... 51 Figure 3.29 Completed glass FRP wrap at TS1 ...…………………………………………..52 Figure 3.30 Finished FRP wrap with topcoat installed at TS1 . ............................................ 52 Figure 3.31 TS1 with snow splash (3/10/03) ........................................................................ 54 Figure 3.32 TS3 with snow splash (3/10/03) ........................................................................ 54 Figure 4.1 Chloride penetration profile for one layer of Product A . .................................... 56 Figure 4.2 Chloride penetration profile for one layer of Product B ...................................... 56 Figure 4.3 Chloride penetration profile for one layer of Product C ...................................... 57 Figure 4.4 Chloride penetration profile for two layers of Product D .................................... 57 Figure 4.5 Chloride penetration profile for one layer of Product E ...................................... 58 Figure 4.6 Chloride penetration profile for Products T and P .............................................. 58 Figure 4.7 Epoxy patched sample stations from the first cycle ............................................ 62

xii
Figure 4.8 Sample stations from the second cycle where the surrounding FRP fiber system has been removed .................................................................................... 62
Figure 4.9 Chloride content at the Mid-height position of C1............................................... 64 Figure A.1 Product A employed at TS4 ................................................................................ 74 Figure A.2 Product A on C4 at TS4 is located within 14 ft of passing traffic ...................... 75 Figure A.3 Product B employed at TS2 ................................................................................ 75 Figure A.4 Product B on C2 at TS2 is located within 10.5 ft of passing traffic ................... 76 Figure A.5 Product C employed at TS5 ................................................................................ 76 Figure A.6 Product C on C5 at TS5 is located within 10.25 ft of passing traffic ................. 77 Figure A.7 Product D employed at TS3 ................................................................................ 78 Figure A.8 Prdouct E employed at TS1 ................................................................................ 78 Figure A.9 Product D on C3 at TS3 is located within 5.2 ft of passing traffic ..................... 79 Figure A.10 Product E on C1 at TS1 is located within 7.2 ft of passing traffic . .................. 79 Figure A.11 Grind the concrete surface to remove any unevenness ..................................... 81 Figure A.12 Weigh out each component .............................................................................. 81 Figure A.13 Mix the primer’s main agent and hardener for three minutes .………………….82 Figure A.14 Column with primer system installed ............................................................... 82 Figure A.15 The putty’s main agent and hardener are measured by weight ........................ 83 Figure A.16 Blend until an even gray color appears ............................................................ 83 Figure A.17 Column with both the primer and putty system installed ................................. 83 Figure A.18 Use a tarp or other protective cover to lay out the fiber. ................................... 84 Figure A.19 Use scissors or a rotary knife to cut the E-glass sheets ..................................... 84 Figure A.20 Create a temporary saturation trough ............................................................... 84 Figure A.21 Mix the epoxy’s main agent and hardener in a clean container for the time
specified by the manufacturer ........................................................................... 85 Figure A.22 Use a 3/8 in. nap roller to apply the undercoat in smooth even strokes ........... 85 Figure A.23 Complete installation of undercoat ................................................................... 86 Figure A.24 Installing the fiber wrap on a column begins from the bottom ........................ 86 Figure A.25 Plastic paddle wheel ......................................................................................... 87 Figure A.26 Roll in the direction of the fibers ...................................................................... 87 Figure A.27 Pour epoxy directly onto the fiber sheet ........................................................... 88 Figure A.28 Move squeegee in the direction of the fibers to work in the epoxy .................. 88 Figure A.29 Utilize two people to unroll the FRP sheet ....................................................... 89 Figure A.30 Paddle wheel with a metal spline ...................................................................... 90 Figure A.31 Apply the overcoat with 3/8 in. nap roller in the direction of the fibers .......... 90 Figure A.32 Let the epoxy set-up overnight and the hardened substance can be removed,
allowing the containers to be used again ........................................................... 91 Figure A.33 Completed glass fiber wrap .............................................................................. 92 Figure A.34 Roll on the topcoat with a long nap roller ........................................................ 92 Figure A.35 Finished product ............................................................................................... 92 Figure B.1 Chloride content at the Top position of C1 and the TS1 control ........................ 95 Figure B.2 Chloride content at the Mid-height positon of C1 .............................................. 96 Figure B.3 Chloride content at the Low position of C1 and the TS1 control ....................... 97 Figure B.4 Chloride content at the Top position of C2 and the TS2 control ........................ 98 Figure B.5 Chloride content at the Mid-height position of C2 ............................................. 99
xiii
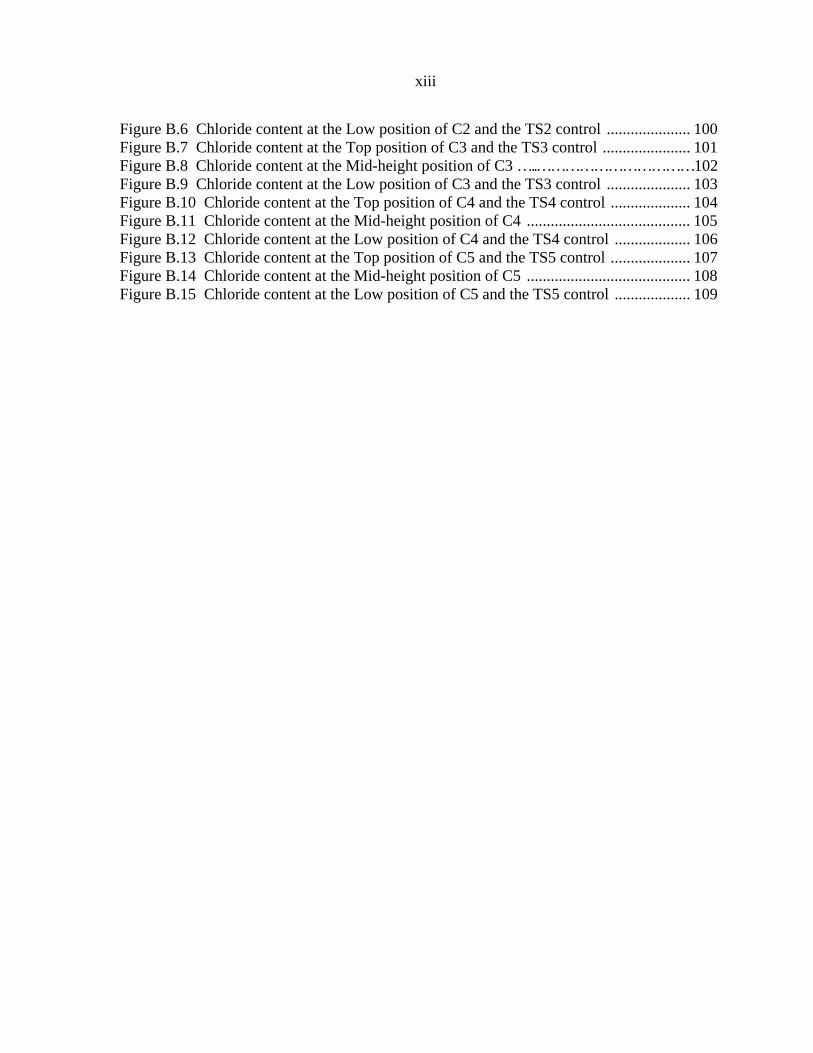
Figure B.6 Chloride content at the Low position of C2 and the TS2 control ..................... 100 Figure B.7 Chloride content at the Top position of C3 and the TS3 control ...................... 101 Figure B.8 Chloride content at the Mid-height position of C3 …..……………………………102 Figure B.9 Chloride content at the Low position of C3 and the TS3 control ..................... 103 Figure B.10 Chloride content at the Top position of C4 and the TS4 control .................... 104 Figure B.11 Chloride content at the Mid-height position of C4 ......................................... 105 Figure B.12 Chloride content at the Low position of C4 and the TS4 control ................... 106 Figure B.13 Chloride content at the Top position of C5 and the TS5 control .................... 107 Figure B.14 Chloride content at the Mid-height position of C5 ......................................... 108 Figure B.15 Chloride content at the Low position of C5 and the TS5 control ................... 109
xv
LIST OF TABLES
Table 3.1 Key characteristics of the five field test sites ....................................................... 27 Table 3.2 Key for identifying each sample test site .............................................................. 34 Table 3.3 Material properties for the five FRP wraps .......................................................... 48 Table 3.4 Products used at the various test sites ................................................................... 53 Table A.1 Tools used for installing the various products . .................................................... 80 Table C.1 Tentative test dates for field work ...................................................................... 112 Table C.2 Tentative test dates for 90 day laboratory cycles ……………….…………………113

1. INTRODUCTION
1.1 Background
In 1991, a special report published by the Transportation Research Board stated that
in the United States, $1.5 billion is spent on snow and ice removal programs each year.
Chemical deicing, which included ten million tons of salt, accounts for 1/3 of these
expenditures (1). During a typical winter storm, the Ames District of the Iowa Department
of Transportation (Iowa DOT) spreads an average of 500 pounds of salt/lane/mile during
each pass they make on Interstate-35. Depending on the severity of the storm, this quantity
of salt can be spread on anywhere from 350 to 400 lane miles, which is 175 to 200 thousand
pounds of salt per storm. The salt and ice removal program undoubtedly provides significant
benefits for public safety by providing less hazardous road conditions during the winter
months, but at a cost to the transportation infrastructure. It is estimated that $28 billion is
needed for the rehabilitation of the nation’s bridges that have deteriorated as a result of
corrosion of the reinforcement in concrete (2).
The chlorides within the salt act as a catalyst in the natural corrosion process. Once
corrosion commences, the reinforcement transforms into rust, which is a porous product that
occupies more space than the steel. As corrosion continues in a structure, the corrosion
product, rust, exerts tensile forces on the surrounding concrete thus inducing delamination
along the interface between the steel and concrete. Ultimately, this reduction in the cross-
section of the reinforcement and the loss of bond reduce the serviceability and structural
capacity. However, the problem with corrosion in the reinforcement is not always the
deterioration of the steel, but the initial spalling and cracking of the concrete. For example, a
man was killed in New York when he drove underneath a reinforced concrete bridge as a
2
piece of concrete fell off due to corrosion (3). To prevent incidents like this from happening,
there are various techniques to prevent chlorides from causing corrosion in the
reinforcement. Methods of prevention include deflection systems, barriers, corrosion
inhibitors, waterproof membranes and seals. Many of these techniques, however, do not last
the life of the reinforced concrete structure. Thus, there are several methods of rehabilitation
that can be implemented once corrosion has occurred. Methods of repair and rehabilitation
include patching and the electrical chemical treatments of cathodic protection, chloride
extraction and realkalization. All of these methods are described in detail later in this
document.
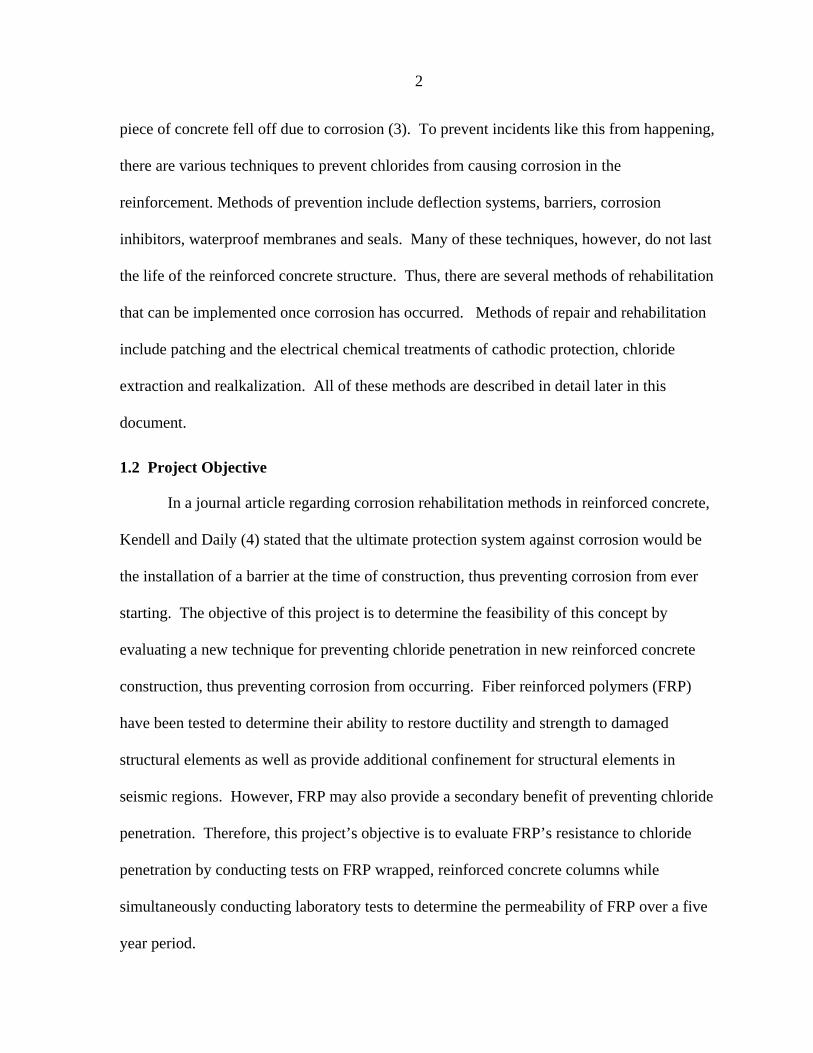
1.2 Project Objective
In a journal article regarding corrosion rehabilitation methods in reinforced concrete,
Kendell and Daily (4) stated that the ultimate protection system against corrosion would be
the installation of a barrier at the time of construction, thus preventing corrosion from ever
starting. The objective of this project is to determine the feasibility of this concept by
evaluating a new technique for preventing chloride penetration in new reinforced concrete
construction, thus preventing corrosion from occurring. Fiber reinforced polymers (FRP)
have been tested to determine their ability to restore ductility and strength to damaged
structural elements as well as provide additional confinement for structural elements in
seismic regions. However, FRP may also provide a secondary benefit of preventing chloride
penetration. Therefore, this project’s objective is to evaluate FRP’s resistance to chloride
penetration by conducting tests on FRP wrapped, reinforced concrete columns while
simultaneously conducting laboratory tests to determine the permeability of FRP over a five
year period.

3
1.3 Project Scope
Both field and laboratory experiments were initiated to evaluate five different FRP
wrap systems and two protective topcoats. Five reinforced concrete columns in the vicinity
of Ames, Iowa were selected for the field evaluation. A baseline was established at all field
test sites by acquiring samples at twelve locations around the perimeter of the column and at
three different depths. The samples were analyzed to determine the initial level of chlorides
within the concrete. One column at each test site was wrapped with one of the five FRP
wrap systems. Two systems utilized glass fibers whereas the other three utilized different
carbon wrap systems. All five systems were then painted with a protective topcoat to reduce
UV exposure. Over the next five years, these five columns will be visually inspected to
ensure that the wrap is performing adequately and additional samples will be obtained,
analyzed and compared to the baseline data to determine if the FRP wrap system is an
effective barrier to chlorides.
In the laboratory portion of this research project, the performances of the FRP wraps
in an aggressive chloride environment were investigated. All five FRP wraps and the two
topcoats were installed on one slab. These wraps were placed in one, two and three layers on
the slab, which was then subjected to an American Association of State Highway and
Transportation Officials (AASHTO) ponding test (5). This test required the test surface to be
submerged in at least 0.5 in. of a three percent sodium chloride solution. Wraps were
submerged for 90 days; then, the solution was drained and samples were obtained. The slab
was then patched and submerged again for another 90 days. This process will be repeated for
five years, resulting in a total of 18 tests. Throughout the program, results from both the field
4
and laboratory chloride penetration tests will be used to establish a profile that illustrates the
effectiveness of FRP wraps in preventing chloride penetration.
In Chapter Two, the basic corrosion process as well as current methods of
rehabilitation and repair are reviewed. Chapter Three presents the outline for both the field
and laboratory experiments of the project. The results from the sampling process are
discussed in Chapter Four with a final summary and trends presented in Chapter Five. Note
that this document only discusses the first year and a half of both the field and laboratory
tests. Subsequently, a final report will be prepared at the conclusion of this project that
includes the data for the remaining three and a half years in an abridged format. This final
report will contain the conclusions and recommendations based on the five years of data.

5
2. LITERATURE REVIEW
2.1 Reinforcement Corrosion
Prior to determining if a material is adequate to prevent the initiation of corrosion, it
is helpful if one has a basic understanding of the corrosion process. Therefore, in the
following sections, a brief review of the actual corrosion mechanism in reinforced concrete
as well as the various factors that influence the rate of corrosion are presented.
2.1.1 Corrosion Process of Reinforcement
In order to understand the various methods for rehabilitating and preventing chloride
contamination of concrete, one must review the process of corrosion. Reinforced concrete in
its natural state does not corrode, even if moisture is present. The cement in concrete will
naturally form an alkaline solution that protects the steel. This solution reacts with
penetrating acids to form a neutral product that creates a passive layer around the steel
consisting of dense hydroxides with minerals from the cement. This natural process creates
both an anode and cathode to establish an electrical balance. The anode is the actual site of
corrosion whereas the cathode is the site of the protective covering. Corrosion begins at the
anode when the electrochemical process is initiated by the oxidation of the iron. Oxidation is
the process when an oxidizing agent, which is oxygen in this case, takes electrons from the
iron atoms, transitioning them into soluble ions that enter the solution. This process is
represented in Eqn (1):
Fe → Fe2+ + 2e- Eqn (1)
As previously stated, an electrical balance must be maintained in the system.
Therefore, at the cathode, the liberated electrons will be combined with water and oxygen to
6
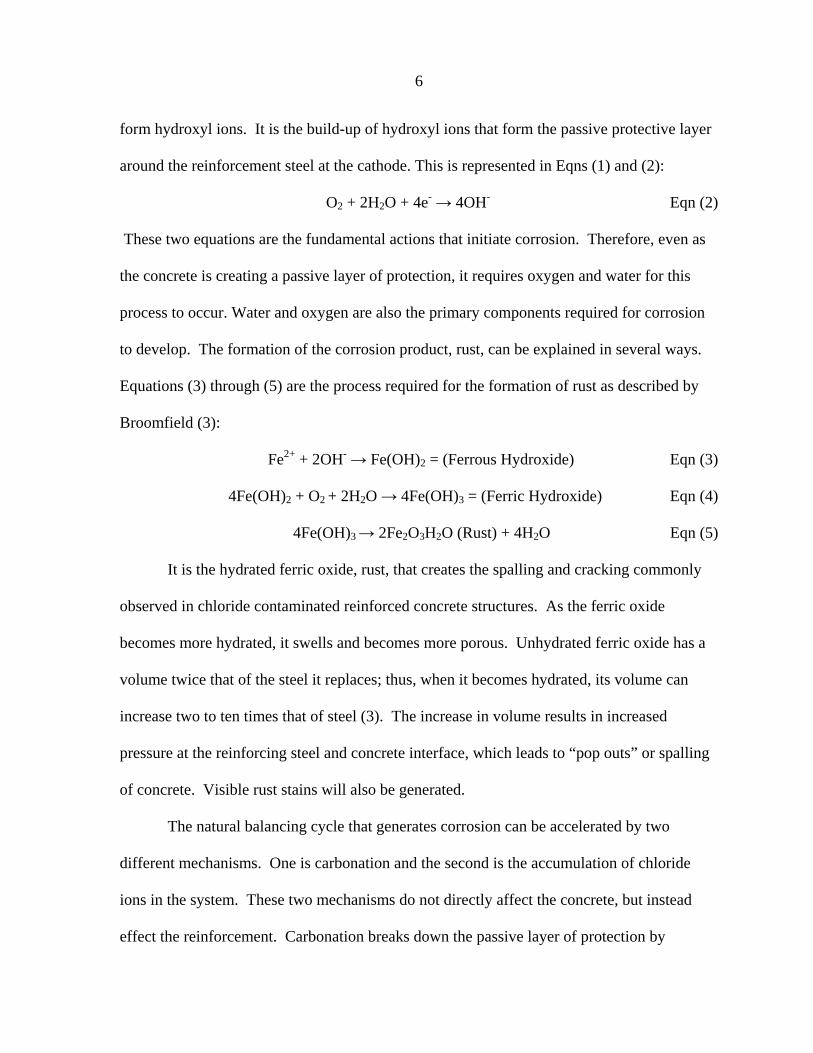
form hydroxyl ions. It is the build-up of hydroxyl ions that form the passive protective layer
around the reinforcement steel at the cathode. This is represented in Eqns (1) and (2):
O2 + 2H2O + 4e- → 4OH- Eqn (2)
These two equations are the fundamental actions that initiate corrosion. Therefore, even as
the concrete is creating a passive layer of protection, it requires oxygen and water for this
process to occur. Water and oxygen are also the primary components required for corrosion
to develop. The formation of the corrosion product, rust, can be explained in several ways.
Equations (3) through (5) are the process required for the formation of rust as described by
Broomfield (3):
Fe2+ + 2OH- → Fe(OH)2 = (Ferrous Hydroxide) Eqn (3)
4Fe(OH)2 + O2 + 2H2O → 4Fe(OH)3 = (Ferric Hydroxide) Eqn (4)
4Fe(OH)3 → 2Fe2O3H2O (Rust) + 4H2O Eqn (5)
It is the hydrated ferric oxide, rust, that creates the spalling and cracking commonly
observed in chloride contaminated reinforced concrete structures. As the ferric oxide
becomes more hydrated, it swells and becomes more porous. Unhydrated ferric oxide has a
volume twice that of the steel it replaces; thus, when it becomes hydrated, its volume can
increase two to ten times that of steel (3). The increase in volume results in increased
pressure at the reinforcing steel and concrete interface, which leads to “pop outs” or spalling
of concrete. Visible rust stains will also be generated.
The natural balancing cycle that generates corrosion can be accelerated by two
different mechanisms. One is carbonation and the second is the accumulation of chloride
ions in the system. These two mechanisms do not directly affect the concrete, but instead
effect the reinforcement. Carbonation breaks down the passive layer of protection by

7
lowering the pH level of the protective barrier. Usually, the passive layer has a pH level
between 12 and 13, which is relatively constant because there are more calcium hydroxide
ions in the cement’s pores than in the dissolved solution. Carbonation is the interaction of
carbon dioxide with water to form a carbonic acid, which has a pH level of four. This acid in
turn will react with the calcium hydroxide ions in the solution to form calcium carbonate. As
the carbonic acid reacts with the calcium hydroxide, it exhausts the surplus calcium
hydroxide ions retained in the cement pores which results in lowering the pH level (3). Once
the pH level drops, the reinforcement looses its protective properties by neutralizing the
protective layer surrounding the steel. Ultimately, this leaves the reinforcement susceptible
to a corrosion attack.
Chloride penetration acts as a catalyst to the corrosion process. It does not reduce the
pH level like carbonation does, but instead directly damages the steel at weak points. Voids
in the concrete that bond to the reinforcement create susceptible areas for chloride attack.
With the gap between steel and concrete, water can enter and transport chlorides to the steel
surface. When an adequate concentration of chloride ions has accumulated, they begin to
break down any remaining passive layer on the steel and allow the corrosion process to
continue at a faster rate.
As chlorides damage the steel, the solid FeCl2 seen in Eqn (6) forms which breaks
down into chloride and iron ions (3):
FeCl2 → Fe2+ + 2Cl- Eqn (6)
The chloride ions are recycled back into the system to attack again while the iron ions are
consumed in the process to create ferrous hydroxide in Eqn (3), which ultimately generates
rust. The general consensus in several reports states that 0.4 percent by weight of cement is

8
the threshold for chlorides that have been cast into concrete. Usually, this condition is found
in older structures in which chlorides were used as an accelerator or when aggregates that
inherently contain chlorides are used. This threshold reduces to 0.2 percent by weight when
the chlorides are diffused in. An example of contamination by diffusion is ocean spray
consistently misting a reinforced concrete structure. Once the chloride concentration reaches
either of these thresholds, corrosion initiates.
2.1.2 Chloride Sources
There are two primary sources of chlorides that were mentioned in the previous
section. Chlorides are either cast into concrete or diffuse in from the outside (3). Until thirty
years ago, chlorides were still used as set accelerators. Chlorides have also been cast into
concrete because sea water or contaminated aggregates were used in the mix. Diffusion
occurs mainly through salt spray, either from the sea or deicing salts. However, air pollution
and contaminated ground water are other potential sources of chlorides through diffusion (7).
2.1.3 Factors that Influence the Rate of Corrosion
There are several factors that influence the rate of corrosion in steel reinforcement.
First are the factors that contribute to the transportation of chlorides in a liquid media.
Capillary pore size can increase the movement of chlorides whereas entrained air and cracks
create voids that block transportation. Also, a lower water/cement ratio and a dense binder
aid in reducing chloride transportation (8). The age, type of binder, size and type of
aggregates and chemical additives used are all factors that influence the deterioration of
concrete due to chlorides. Other factors are temperature and relative humidity. As the
temperature rises, the ions gain mobility and the salts become more soluble, thus accelerating
the oxidation reaction. However, as the temperature is decreased, the reverse behavior

9
occurs. The ions slow down and the corrosion process halts when the pore waters freeze. It
should be noted that the freezing point is lowered due to the excess of chloride ions in the
solution. The relative humidity within the concrete may not be at the same levels as the
atmospheric humidity levels because of water splash or solar heat gain, which are all capable
of raising the humidity level. Note that corrosion is thought to be at a maximum at a 90-95
percent relative humidity (3).
2.2 Prevention, Repair and Rehabilitation of Chloride Contaminated Concrete
Each reinforced concrete structure that is inspected and found to have deterioration
due to the effects of chlorides has four options; repair, rehabilitate, replace or do nothing.
Replacement or the do nothing options are both dependent on how much structural capacity
has been lost due to corrosion. If the structure appears to be in relatively good condition, the
inspectors may continue to monitor the corrosion and observe if it worsens. However, if the
deterioration is significant, replacement may be the only feasible option. For the remaining
structures that fall into the category where action needs to be taken to halt the process of
corrosion, the ideal choice is either repair or rehabilitation. All of these options could be
eliminated if a chloride prevention system had been installed immediately following
construction. In the following three sections, various methods of prevention as well as
methods of repair and rehabilitation are reviewed.
2.2.1 Prevention of Chloride Contamination
Currently there are several methods to prevent chloride contamination, the most basic
being barriers and deflection systems. Gutters and drains can be utilized to guide water away
from susceptible areas of the structure. Barriers have been constructed out of masonry,
which do not actually stop the chlorides (8). However, the masonry bricks which are initially
10
for aesthetics also protect the concrete in that the chlorides will have to pass through the four
or more inches of cover provided by the masonry to penetrate the concrete. Another method
of protection is to add a corrosion inhibitor to either the concrete surface or the reinforcement
directly. The inhibitor prevents the cathodic and anodic reactions from taking place at the
interface of concrete and steel. However, the inhibitors can be consumed and only work up
to a given level of chloride ingress (9).
A technique that has been popular in Europe is to install a waterproof membrane on
the decks prior to the laying of the top layer of asphalt. This system, however, is not without
problems; these membranes have been known to fail at joints, curbs and drains where
chlorides can get underneath them. Also, the membranes can be damaged if the asphalt is too
hot. Overall, the membranes only have a life of about ten to fifteen years (3). A similar
technique that has been tested is a highly-elastic acrylic rubber coating that can be applied
over reinforced concrete surfaces (10). Research has shown that these provide excellent
resistance against chlorides. Lastly, as a prevention method, penetrating sealers can be
applied. These sealers keep chlorides out of the concrete, but allow water vapor to pass
through the membrane. However, sealers do not have the ability to bridge cracks, should
they be pre-existing. Sealers lose their appeal in inclement weather. The concrete pores
require an adequate amount of water in order to react with the sealer, but not an excess of
water that it will push the sealer out. Should it rain during installation, the entire process
would require a second application, thus increasing the cost of the protective system (3).
2.2.2 Repair of Chloride Contaminated Concrete
Once reinforced concrete has been contaminated by chlorides, there are two
alternatives outside of replacing it - repair or rehabilitation. The appropriate system for a

11
given situation depends on the structure type, condition and the structural capacity level that
needs to be maintained. To repair chloride damage, one needs to merely replace or fix the
contaminated parts. However, this only takes care of the symptoms, where rehabilitation
essentially restores the concrete and reinforcement to their original condition.
The first step in repairing contaminated concrete is to remove all unsound material.
This is accomplished with pneumatic hammers, hydrojetting or milling. The method chosen
is a factor of contractor preference and the project budget. Once the unsound material is
removed, which should include up to one inch behind the reinforcement, the exposed
reinforcement surface should be cleaned. Depending on the severity of the chloride
contamination and how much material had to be removed, temporary support may be
required until the repair is complete. Next a sound, cementitious repair material is applied as
a patch. The repair material should be chosen so that the steel is returned to a high alkaline
environment which will promote the reformation of the passive layer (3).
When only a patch is used without the benefit of a rehabilitative process, care should
be taken that the corrosion process is not accelerated. Acceleration of the corrosion is a
potential threat because the patch can actually halt all anodic reaction in its vicinity and
therefore stop the production of hydroxyl ions at the cathode that are used in creating the
passive layer. This causes the area around the patch to become the new anode where the
chloride hydroxide ratio can reach a critical level and require balancing, which in turn causes
the entire area around the patch to corrode. All this can be avoided with the additional use of
a rehabilitative method.
Another procedure for repairing reinforced concrete columns is to employ a steel
jacket. With this method, a steel jacket is placed around the exterior of the column and a

12
grout is placed between the column’s surface and the steel jacket to establish a secure bond.
This provides confinement for the column, without having to remove and replace the
unsound concrete. However, this is a short-term repair; the original corrosion problem needs
to be addressed by either painting or galvanizing the steel jacket to ensure that it too will not
corrode once exposed to deicing salts and other forms of chloride contaminants.
2.2.3 Rehabilitative Methods for Chloride Contaminated Reinforced Concrete
There are three primary non-destructive rehabilitative procedures available. All three
halt or prevent the corrosion process in either chloride contaminated or carbonated concrete.
This is accomplished by a process that is both electrical and chemical. An external anode is
applied to the concrete so that when an electrical current is passed through the anode giving it
a positive charge, the opposite is happening in the reinforcement. The entire reinforcement
surface becomes the cathode. The three electrochemical extraction techniques are cathodic
protection, chloride extraction and realkalization; each technique utilizes the basic process
previously described.
For cathodic protection, the anode is embedded within the surface of the concrete and
remains there for the entire life of the structure. When a small direct current is passed from
the surface anode to the reinforcement, it forces the anodic reaction to stop at the site of the
steel concrete interface, leaving only the induced cathodic reaction active. With the entire
steel surface as a cathode, the generation of hydroxyl ions increases the alkalinity and
rebuilds the passive layer. The chloride ion has a negative charge; therefore, it will be
repelled by the negative charge of the cathode at the steel and migrate towards the positive
charge of the external anode. This method of rehabilitation has been known to last for
twenty years (3).

13
Figure 2.1 An extreme example of spalling concrete (11).
Figure 2.2 Application of an external anode with a spray-on mixture of water and cellulose fiber (11).
The second alternative is chloride extraction. This is a similar process to cathodic
protection, but instead of permanently embedding the anode, it is only temporarily attached.
An electrical power source, higher than that used in cathodic protection, is used to pass a
direct current from the anode to the cathode so that the entire rehabilitation process requires
only four to six weeks to complete. The external anode is usually made of a titanium wire
mesh which is connected to the concrete surface by a mixture of cellulose fibers and water,
which is similar to paper mâché (3). An example of a spalling reinforced concrete column is
shown in Figure 2.1, and the process of installing the cellulose fibers through a spray mixture
is illustrated in Figure 2.2. The objective of this process is to transport the chloride ions out
of the concrete by ion migration under the influence of the electric field generated by the
direct current. The system must be kept wet because water is the medium through which the
current and ions flow. As these ions migrate towards the external anode, they become
trapped in the cellulose fibers of the paper mâché. At the conclusion of the rehabilitation
period, the external anode is removed in combination with all the trapped chloride ions. A
14
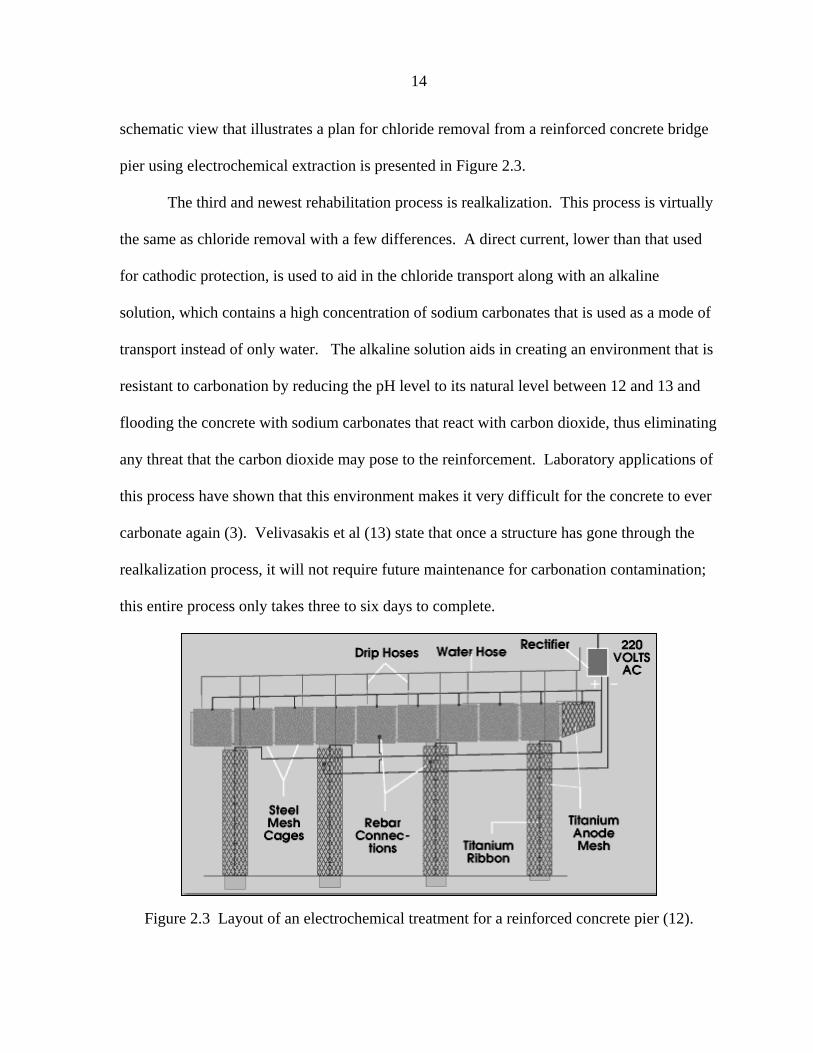
Figure 2.3 Layout of an electrochemical treatment for a reinforced concrete pier (12).
schematic view that illustrates a plan for chloride removal from a reinforced concrete bridge
pier using electrochemical extraction is presented in Figure 2.3.
The third and newest rehabilitation process is realkalization. This process is virtually
the same as chloride removal with a few differences. A direct current, lower than that used
for cathodic protection, is used to aid in the chloride transport along with an alkaline
solution, which contains a high concentration of sodium carbonates that is used as a mode of
transport instead of only water. The alkaline solution aids in creating an environment that is
resistant to carbonation by reducing the pH level to its natural level between 12 and 13 and
flooding the concrete with sodium carbonates that react with carbon dioxide, thus eliminating
any threat that the carbon dioxide may pose to the reinforcement. Laboratory applications of
this process have shown that this environment makes it very difficult for the concrete to ever
carbonate again (3). Velivasakis et al (13) state that once a structure has gone through the
realkalization process, it will not require future maintenance for carbonation contamination;
this entire process only takes three to six days to complete.
15
It should be noted that there are various side effects that occur as the result of these
processes, both beneficial and detrimental to the reinforced concrete system. Beneficial
effects include a significant drop in the rate of future corrosion, increased resistivity to future
chloride and carbonation attacks and an improved resistance to freeze/thaw effects. The
prevalent detrimental effect is that of hydrogen embrittlement, which is usually only of
concern in prestressed concrete structures. Hydrogen embrittlement occurs when high
strength steels trap hydrogen atoms created from the rehabilitation processes within their
framework at defects and grain boundaries. This causes the steel to weaken and therefore
causes a premature failure of the structure. As soon as the electrochemical process induced
by the rehabilitation method is completed, the hydrogen atoms diffuse into the atmosphere
and return the steel back to its normal ductile state (13).
2.3 Fiber Reinforced Polymers
Over the last thirty years, fiber reinforced polymers (FRP) have emerged as potential
solutions to the various problems within the transportation infrastructure. Most commonly,
FRP is in the form of sheets or jackets to either restore damaged reinforced concrete to its
original structural strength or, in certain situations, to increase the original strength as well as
improve confinement in seismic regions. This application allows for optimal use of the FRP
so that advantage can be taken of its material properties, low weight and resistance to
corrosion.
Over the past few years, researchers have become more interested in this last
characteristic of FRP, its resistance to corrosion. Various experiments have been conducted
to determine if a FRP wrap is capable of halting corrosion or at the very least containing the
chlorides. In the paragraphs that follow, the use of FRP in various rehabilitation systems as
16
well as the numerous experimental programs in which FRP is subjected to a chloride
environment are summarized. A brief synopsis is also included that assesses the performance
of FRP in various environments.
2.3.1 FRP Properties and Rehabilitative Characteristics
FRP has been utilized in various strengthening systems for several years in areas
outside of civil engineering. An example of this is the use of polyvinyl chloride piping
(PVC). In the fifties, FRP was used to reinforce PVC piping to increase the pipe’s pressure
capacity and stiffen the flanges. The FRP extended the life of the piping as well as aided in
providing resistance to chemical leakage. The PVC pipes could crack, but the corrosive
liquids would only leak through the FRP after prolonged exposure to the chemical attack
(14). This same concept has been expanded and used more extensively in civil engineering
applications.
FRP wraps, which are a two part system, have become the most common form. The
first part is the fiber itself, which is woven into sheets. By varying the direction and design
of the weave, the manufacturers can create fibers with varying strengths and flexibilities. The
most commonly manufactured fibers employ glass and carbon. The more commonly
available fibers are as follows:
E-glass is the most common fiber because of its strength and resistance to water
degradation. It is also used as an electrical insulator.
S-type fibers have a higher strength than E-glass fibers and a higher resistance to
corrosion.
C-glass fibers have the highest corrosion resistance of the glass fibers.
17
Aramid (Kevlar®) is the most common synthetic fiber which displays high tensile
strength, fatigue and impact resistance, yet its stiffness is significantly below that of
glass.
Carbon fibers are generally five times stronger than glass fibers, have the highest
stiffness of all the fibers, and resist continuous loads better; however, they are
significantly more expensive than glass fibers.
The second component of the FRP wraps is the epoxy resin that is used to impregnate
the epoxy sheets. Once saturated with the epoxy resin, the composite is created and can be
installed on the concrete surface or, in the case of multiple layers of the composite wrap, to
itself. In sheet form, FRP is available in rolls which can then be applied like wallpaper.
Other forms of FRP are custom manufactured shells that clamp into place around a column,
various reinforcement and beam cross-sections, and modular protruded bridge deck sections.
Today, FRP is no longer being wrapped on just PVC piping, but various reinforced
concrete structures as well. FRP wraps have been tested to determine their abilities in
restoring strength and ductility as well as upgrading seismic resistance. Experiments have
shown that stress – strain curves plotted from the testing of the confined concrete have good
energy dissipation characteristics, which indicates that FRP wraps would aid in preventing
catastrophic failures in seismic zones (15). Wraps have proven to be a successful external
confinement mechanism for strengthening concrete in seismic regions taking the place of
conventional steel jackets (16). However, FRP costs more than concrete and steel retrofits.
This initial high cost is offset by several factors: lesser weight, reduced installation time,
decreased maintenance and FRP’s resistance to corrosion. When all these factors are
18
weighed, plus the increase in life expectancy that results with the FRP wraps, the initial costs
are offset by a savings of 10-30 percent for a 75 year design life (17).
2.3.2 Research Conducted on FRP and Chloride Contaminated Reinforced Concrete
The use of FRP wrap as a means of confinement in seismic regions has been taken
one step further by researching FRP’s ability to rehabilitate reinforced concrete structures
that have corroded. It was stated previously that the corrosion process generates expansive
forces on the concrete, which causes it to crack and spall. Experimentation has shown that
the FRP wrap acts as a remedy for these expansive forces. Not only does it slow down the
rate of reaction, but it also confines the concrete core which provides ductility and strength
for the column (16).
There are multiple ongoing experiments that are investigating the effects of wrapping
chloride contaminated concrete. Soudki and Sherwood (18) constructed ten reinforced
concrete beams with seven of them containing variable levels of cast-in-place chlorides. Six
of these were then covered with an external carbon wrap and the remaining four were left
uncovered for baseline comparison. Accelerated corrosion was then induced using an
impressed current in four of the wrapped beams and three of the unwrapped beams to varying
degrees of corrosion: five, ten and 15 percent mass loss. The carbon wraps proved to be
successful up to the 15 percent mass loss because no delamination was observed and the
specimen’s rupture strain was not reached. The results of a four-point flexure test concluded
that the carbon wrap increased the yield and ultimate strength by an average 24.5 and 50
percent, respectively, when compared to the beams that had undergone corrosion with no
protective wrap. The CFRP wrapped specimen that had the highest degree of corrosion, a 15
percent mass loss, had a 30 percent increase in ultimate strength over the unwrapped control
19
specimen that had not been subjected to any accelerated corrosion. The only case where the
unwrapped control specimens outperformed the wrapped specimens that were subjected to
accelerated corrosion was in the case of ductility. Some loss of ductility was observed in the
wrapped specimens.
Fuentes (19), a graduate student at the University of Texas at Austin, constructed 18
beams and 42 cylinders that had cast-in-place chlorides along with flexural cracks. Some of
these specimens were then damaged further with a chipping hammer so that two different
patch materials could be evaluated. Others were sealed with a corrosion inhibitor or wrapped
with two different FRP systems on both wet and dry surfaces. These specimens were then
subjected to a continuous rotation of one week in a 3.5 percent salt solution and then allowed
to air dry for two weeks. Every three months, half-cell potential readings were collected
from all specimens. The first few readings revealed a 90 percent probability that no
corrosion was taking place; however, the experimental program will continue monitoring
these specimens for several years.
The University of Toronto (20) conducted an experiment using seven third-scale
models of reinforced concrete columns that had cast-in-place chlorides around the
reinforcement as well as a high water-to-cement ratio. Five of these columns were subjected
to accelerated corrosion by an impressed current through the reinforcement for 49 weeks.
Next, three of the corroded columns were repaired with a carbon fiber wrap. It was found
that the carbon wrap improved the ductility and strength of the corroded members.
Specifically, the carbon wrap increased the load carrying capacity of one of the columns by
28 percent and reduced the corrosion rate by 50 percent. Interestingly, the corrosion
damaged and wrapped column that achieved the 28 percent increase due to the wrap actually

20
exceeded the load capacity of the control column. Also, the increased ductility of a wrapped
column was shown when its axial deformation was greater than six times that of the control
specimen during the ultimate load test.
Teng, Sotelino and Chen (21) conducted experiments that utilized glass wraps in both
a field and a laboratory setting in Indiana. Three layers of FRP wrap along with two layers
of a protective coat were used on reinforced concrete columns. They were inspected every
two months for temperature variation between the outside fibers and the core column
temperature and it was concluded that there was minimal variation. However, two of the
wrapped columns were damaged in an automobile incident and it was noted that once the
epoxy cover was removed, the glass fibers became exposed to moisture and swelled. This
increase in volume caused additional damage to other fibers. In the laboratory, over 80
specimens were constructed and wrapped with varying layers of FRP or just the epoxy resin.
These were then subjected to an accelerated corrosive environment where they were cycled
through one week in a five percent salt solution and then allowed one week to air dry. This
continued for 40 weeks. The final conclusion of this experiment was that the glass FRP and
the epoxy resin by itself both provide an excellent protection system against corrosive agents.
In England, Scarth and Keble have conducted research on aramid FRP’s ability to
inhibit corrosion and chloride penetration (22). They selected six reinforced concrete column
sites that displayed signs of chloride contamination. It was found that the higher levels of
chloride were in the bottom third of the column and in joints where water leaked. However,
before they could wrap any of the columns they first needed to bring the chloride level below
0.3 percent by conducting electrochemical chloride extraction. Their research showed that
the chloride extraction process only reduced the chlorides by 75 percent in the top layer of

21
concrete. Due to concern that the corrosion may continue once the wraps were in place and
there would be no means to visibly inspect the concrete, a permanent corrosion monitoring
system (PCMS) was installed. Once this system was in place, a uni-directional aramid FRP
wrap system was applied to the entire column. First the wrap system was placed vertically
along the column with a taper; the top of the column had a minimum thickness of 0.04 in.
and the bottom had a maximum thickness of 0.5 in. Once the vertical wraps were in place,
three layers of the wrap system were then placed along its entire length of the column in the
hoop direction. In the last two years, the data from the PCMS have not changed, which has
led to Scarth and Keble’s conclusion that the aramid FRP provides an impermeable barrier to
chlorides.
The Department of Civil and Environmental Engineering at Florida A&M University
in conjunction with Florida State University conducted tests that utilized two different epoxy
resins and carbon FRP as possible chloride barriers (23). Forty-two 4 in. concrete test
cylinders were cast with one bar of reinforcement through the center. By altering the
orientation of the carbon fibers, epoxy type and the number of wrap layers, 13 different
surface treatment options were established. Once these surface treatments were applied to
the test cylinders they were placed into a five percent sodium chloride solution. Each
cylinder was then connected to a DC power supply, in order that an impressed current could
be initiated. All cylinders had their corrosion potentials and impressed current flow levels
monitored continually as well as a periodic visual inspection. Whenever a spike in electrical
activity, crack or debonded wrap was noticed, that particular cylinder was pulled from the
sodium chloride solution and analyzed for chloride content and mass loss. In general, the
authors concluded that the type of epoxy resin used does have a significant effect on the

22
specimen’s performance. Also the specimens with only epoxy resin had 1.5 times the
amount of chlorides than the specimens with one layer of carbon FRP wrap. The specimens
with two layers of carbon FRP wrap had even less chloride levels than those with one layer.
Overall, the carbon FRP wraps were evaluated as potentially effective in reducing corrosion
in reinforced concrete structures located in marine environments.
Sen, at the University of Florida, has conducted research to assess the long-term
performance of FRP as a possible prestressing material in marine environments (24).
Aramid, carbon and fiberglass were the materials investigated. It proved to be difficult to
establish a short-term test that could adequately represent a long-term test. The primary
reasons for this were the complexities of the degradation of fiber/epoxy system, the lack of
material data and how to calibrate the results. A test was created that required 66 precast
beams that were wrapped with one of the three materials. The fiberglass was kept in a
constant environment, partially submerged in a tank that cycled through wet-dry cycles for
20 months. The aramid and carbon wraps were kept outside and partially submerged for a
period of 36 months. At the completion of these cycles, all beams were tested to ultimate
capacity. The results showed that the fiberglass and aramid wraps failed due to the exposure
of the wet-dry cycling and the carbon fibers showed no reduction in capacity when compared
to control specimens that did not experience the wet-dry cycling.
However, the Florida DOT’s (19) tests did not prove to be as successful as those
previously mentioned. The Florida DOT wrapped only the mid-splash zone of reinforced
concrete columns located in a marine environment with a fiberglass jacket. They found that
through capillary action the water rose in the column behind the wrap and became trapped
along with the chlorides it transported which ultimately increased the corrosion rate. The
23
wrap effectively prevents visual inspections of the corrosion behind the wraps which makes
this situation even more precarious. The New York DOT launched a similar program in
1998 that looked into the effectiveness of FRP for preserving deteriorated concrete (25). Six
columns that had extensive deterioration were wrapped on the Court Street Bridge in Owego,
New York with both carbon and glass fibers. After five years of exposure to the
environment, the wraps will be removed along with the columns for testing to determine how
effective the wraps are as a rehabilitative mechanism.
2.3.3 Environmental Factors on FRP
A concern with the FRP wraps are their ability to endure periods of freeze/thaw as
well as fluctuating levels of relative humidity. For instance, a specific concern is that should
moisture become trapped behind the wrap on a column it could cause a significant increase in
volume. Because this is all occurring behind the wrap, the possibility of catching the
corrosive action during a visual inspection is doubtful. The program that the Florida DOT
ran had this type of situation occur; however, it was the result of the wrap being installed in a
marine environment.
As for the concern with FRP’s durability in environments that go through freeze and
thaw cycles, various experiments have been run that show that repeated freeze/thaw cycles
do not significantly damage the anchorage of either glass or carbon FRP to reinforced
concrete. Green and Bisby (26) have performed studies to observe the effects of thermal
expansion and contraction in FRP and concrete due to freeze/thaw cycling. More
specifically, they observed the temperature-induced stresses in the adhesive layer of the FRP
to determine if they caused premature bond failure. In one of their projects, carbon FRP
plates were epoxied to concrete specimens. These were exposed to cold air at -18°C for 16
24
hours and then subjected to a warm bath at 15°C for eight hours, equaling one freeze/thaw
cycle. Groups of the specimens went through 0, 50, 150 or 300 of these cycles. The
specimens were next subjected to either a pull-off test or a four-point bending test. Results
indicated that freeze/thaw cycling did not lower their load carrying capacity, but various
failure modes were observed. This is an indication that the adhesive may be affected by
freeze/thaw exposures.
A second study by Bisby and Green (27) utilized the same cycling test with both
carbon and glass FRP sheets attached to the concrete beams instead of the carbon FRP plates
utilized in their earlier experiment. The results were similar revealing that the flexural four-
point test indicated no significant damage to the anchorage of the FRP sheets to the beams.
Again, there was variation in the failure modes that was due to differences in the elastic
properties of the adhesives.
Malvar et al (28) investigated epoxy by testing its short-term adhesion characteristics
with regard to temperature, humidity, chloride content and a primer applied to the test
specimen’s surface prior to epoxy application. A pull-out test was conducted to determine
the effects of these characteristics on the bond interface. The majority of the results showed
that the bond strength decreased at high temperatures and humidity, 35°C and 95 percent,
respectively; therefore, it was concluded that a maximum humidity of 85 percent for adhesive
application was appropriate. However, the tests that were run on a concrete pile from a
marine environment showed an enhanced bond strength because the surface had been
prepared by hydroblasting the concrete surface and applying a primer.
25
3. EXPERIMENTAL PROGRAM
3.1 Field Specimens
The experimental portion of this investigation was divided into two parts; field tests
and laboratory tests. In the following sections, the process used to determine the location of
the field test sites as well as the process utilized to collect baseline data from each site are
described.
3.1.1 Evaluation and Description of Test Sites
A survey of reinforced concrete bridges within forty miles of Ames, Iowa was
conducted to locate five test sites at which fiber wraps could be applied to bridge piers. The
forty mile distance was selected so that all test sites can be inspected within a few hours.
Also, since data will be collected from each site during the next five years, it is more efficient
to select test sites in the Ames area. The first step in this process was to drive the major
highways in the vicinity of Ames and record the maintenance numbers of every bridge with
reinforced concrete piers in good condition located along the route. These maintenance
numbers were then used to obtain the maintenance histories and descriptions of each bridge.
From these data, the number of bridges for potential test sites was reduced to nineteen.
To determine the five most desirable locations from these nineteen, an evaluation
matrix was created. This matrix ranked various test site characteristics by giving a higher
weighted percentage to characteristics that were thought to be more essential to this project.
At the top of the list was the distance from the columns to passing traffic. The closer the
column was to passing traffic, the higher it ranked. Another characteristic evaluated was the
safety features along the pier. For instance, guardrails were weighted higher than jersey
barriers because the guardrail has an open configuration that will allow spray, which is

26
generated from passing to traffic during wet conditions, to go through onto the column.
Other characteristics that were considered are condition of the concrete surface, annual
average daily traffic, distance from Ames and diameter of the column.
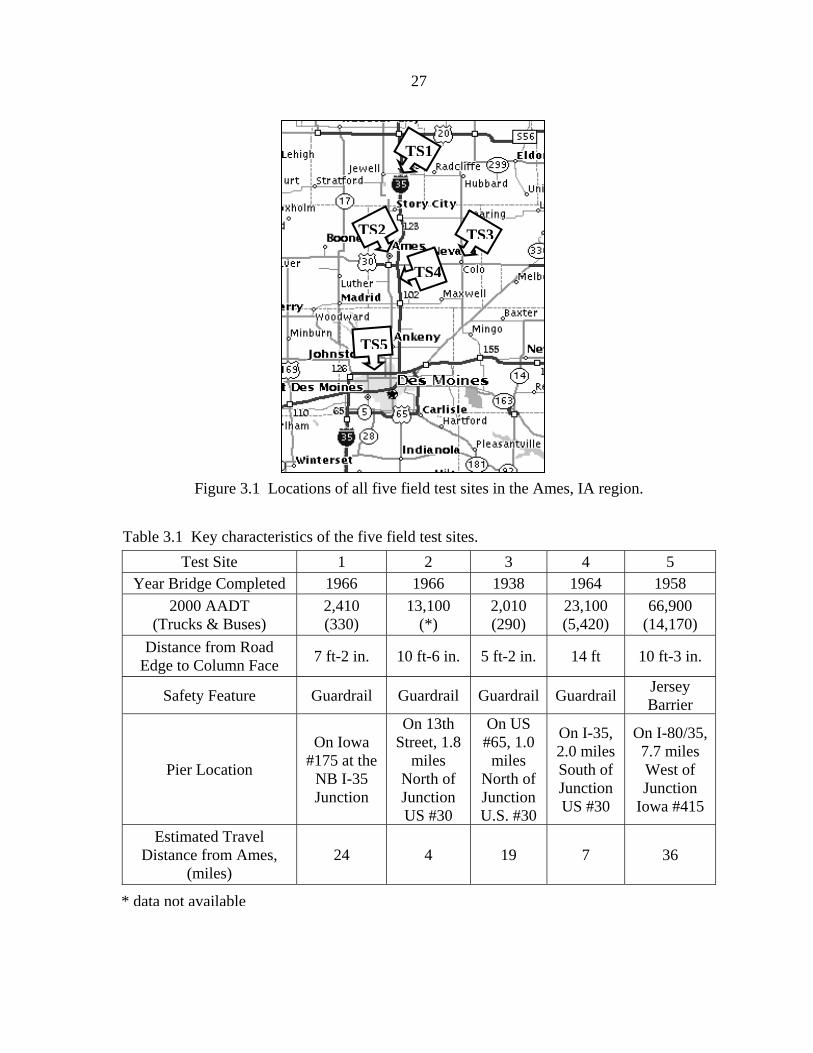
From this evaluation, five test site locations were selected, and are identified in
Figure 3.1. Table 3.1 lists the characteristics used in the selection of each test site. Note that
in these and other figures that follow, the five test sites have been identified with the label TS
for “test site” along with a numerical notation. The columns that were chosen to receive a
wrap at each test site are designated with a C and the equivalent numerical value of the test
site. Therefore, the first test site is represented as TS1 with wrapped column, C1. Figure 3.2
through Figure 3.11 are schematic drawings and photographs of each test site to identify the
column at a given test site that was wrapped with FRP. Additional information that is
presented in these figures includes the distance from the face of the column to passing traffic,
the column diameter and the highway on which the column is located. In a few of the
photographs of the columns, Figure 3.5 and Figure 3.9, one can observe the holes where
baseline data was obtained.
3.1.2 Acquisition of Chloride Data
Chloride data were acquired from various locations at each of the five test sites. This
required a standard procedure, ASTM C 1218: Standard Test Method for Water-Soluble
Chloride in Mortar and Concrete (30), for obtaining the data needed in this project. The
samples that were gathered for each ASTM test consisted of pulverized concrete (i.e. a
powder sample). These powder samples were then analyzed to determine the percentage of
chlorides they contained. A template was developed to aid in the collection process of
powder samples at each test site. In the following sections, information on the procedure
27
TS3
TS5
TS1
TS2
TS4
Figure 3.1 Locations of all five field test sites in the Ames, IA region.
Test Site 1 2 3 4 5 Year Bridge Completed 1966 1966 1938 1964 1958
2000 AADT (Trucks & Buses)
2,410 (330)
13,100 (*)
2,010 (290)
23,100 (5,420)
66,900 (14,170)
Distance from Road Edge to Column Face 7 ft-2 in. 10 ft-6 in. 5 ft-2 in. 14 ft 10 ft-3 in.
Safety Feature Guardrail Guardrail Guardrail Guardrail Jersey Barrier
Pier Location
On Iowa #175 at the
NB I-35 Junction
On 13th Street, 1.8
miles North of Junction US #30
On US #65, 1.0
miles North of Junction U.S. #30
On I-35, 2.0 miles South of Junction US #30
On I-80/35, 7.7 miles West of Junction
Iowa #415
Estimated Travel Distance from Ames,
(miles) 24 4 19 7 36
Table 3.1 Key characteristics of the five field test sites.
* data not available

28
N
7’-2” from the front of the column to the edge of the road
I-35 North Bound Lane
Ø 2’-6” (typ)
IA #175 WBL
IA #175 EBL
C1
Figure 3.2 Schematic view of TS1 with key dimensions and highways.
C1
Figure 3.3 View of C1 prior to the FRP wrap installation.

29
C2
I-35 North Bound Lane
N
13th Street EBL
13th Street WBL
10’-6” from the front of the column to the edge of the road
Ø 3’-0” (typ)
Figure 3.4 Schematic view of TS2 with key dimensions and highways.
Figure 3.5 View of C2 after baseline data has been collected.
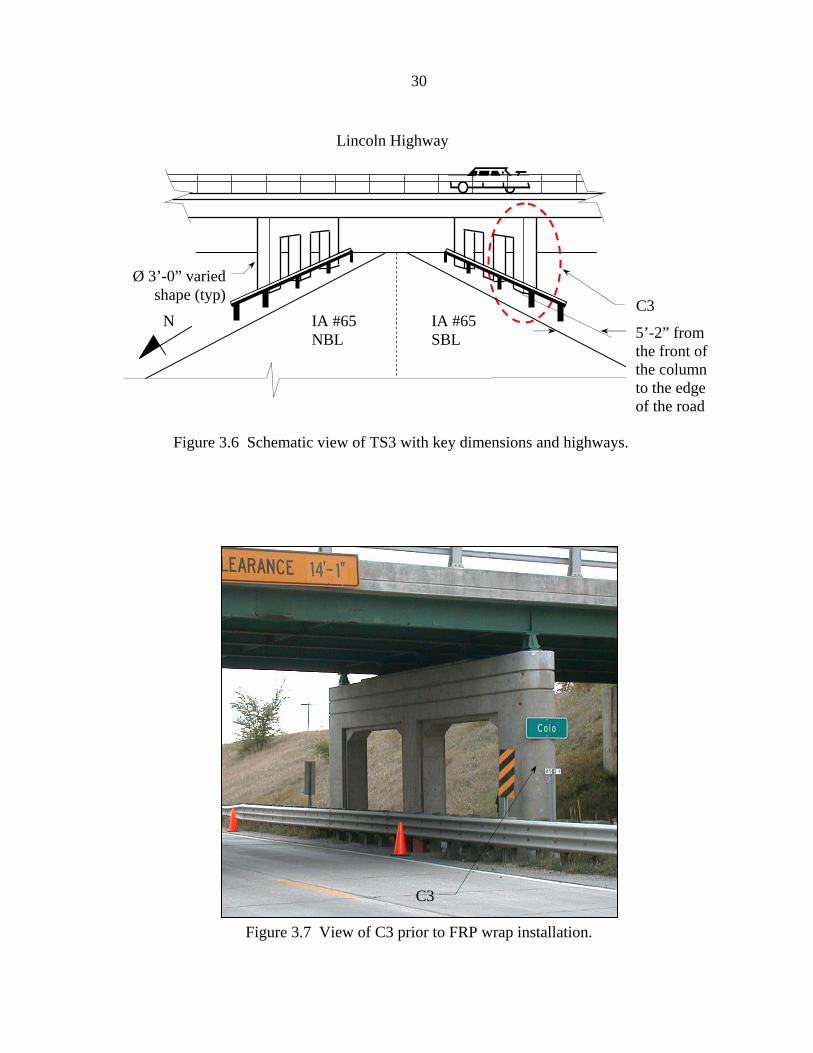
30
Lincoln Highway
N IA #65 SBL
IA #65 NBL 5’-2” from
the front of the column to the edge of the road
C3
Ø 3’-0” varied shape (typ)
Figure 3.6 Schematic view of TS3 with key dimensions and highways.
C3
Figure 3.7 View of C3 prior to FRP wrap installation.

31
N
Ø 2’-6” (typ)
I-35 SBL
I-35 NBL
260th Street
14’-0” from the front of the column to the edge of the road
C4
Figure 3.8 Schematic view of TS4 with key dimensions and highways.
Figure 3.9 View of C4 after baseline data have been collected.
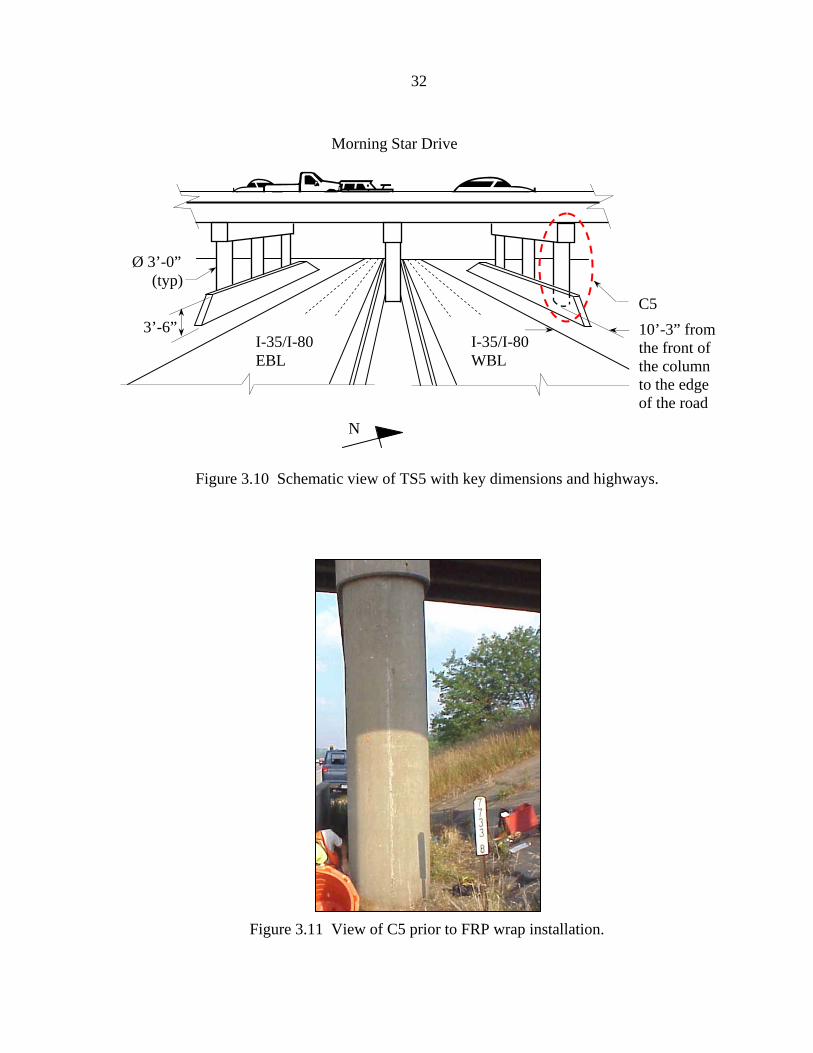
32
Morning Star Drive
N
I-35/I-80 WBL
Ø 3’-0” (typ)
3’-6” I-35/I-80 EBL
C5 10’-3” from the front of the column to the edge of the road
Figure 3.10 Schematic view of TS5 with key dimensions and highways.
Figure 3.11 View of C5 prior to FRP wrap installation.
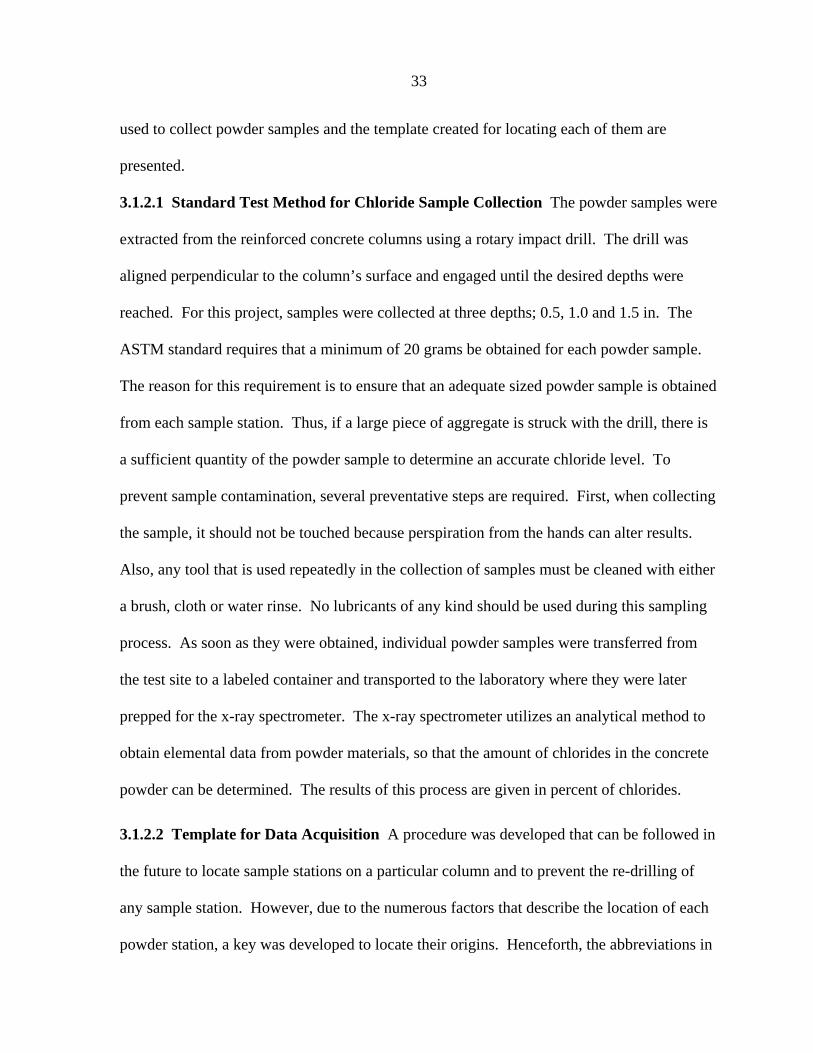
33
used to collect powder samples and the template created for locating each of them are
presented.
3.1.2.1 Standard Test Method for Chloride Sample Collection The powder samples were
extracted from the reinforced concrete columns using a rotary impact drill. The drill was
aligned perpendicular to the column’s surface and engaged until the desired depths were
reached. For this project, samples were collected at three depths; 0.5, 1.0 and 1.5 in. The
ASTM standard requires that a minimum of 20 grams be obtained for each powder sample.
The reason for this requirement is to ensure that an adequate sized powder sample is obtained
from each sample station. Thus, if a large piece of aggregate is struck with the drill, there is
a sufficient quantity of the powder sample to determine an accurate chloride level. To
prevent sample contamination, several preventative steps are required. First, when collecting
the sample, it should not be touched because perspiration from the hands can alter results.
Also, any tool that is used repeatedly in the collection of samples must be cleaned with either
a brush, cloth or water rinse. No lubricants of any kind should be used during this sampling
process. As soon as they were obtained, individual powder samples were transferred from
the test site to a labeled container and transported to the laboratory where they were later
prepped for the x-ray spectrometer. The x-ray spectrometer utilizes an analytical method to
obtain elemental data from powder materials, so that the amount of chlorides in the concrete
powder can be determined. The results of this process are given in percent of chlorides.
3.1.2.2 Template for Data Acquisition A procedure was developed that can be followed in
the future to locate sample stations on a particular column and to prevent the re-drilling of
any sample station. However, due to the numerous factors that describe the location of each
powder station, a key was developed to locate their origins. Henceforth, the abbreviations in

34
Table 3.2 Key for identifying each sample test site. TS = Test Site: 1, 2, 3, 4, 5
E = Elevation: T (Top), M (Mid), L (Low)P = Perimeter: 1, 2, 3, 4D = Depth: 0.5, 1, 1.5
Table 3.2 will be used. An example of an identification label for a powder station using
these abbreviations would be TS5.EM.P2.D1.1. Figure 3.12 is a visual guide to explain the
origin of this powder station. The “TS5” indicates that the powder sample was taken at test
site five, whereas the “EM” specifies that the powder sample was obtained at mid-elevation,
three feet above the ground as shown in the figure. Since the FRP was installed on the
bottom five feet of each column site, data were collected at three elevations: one, three and
4.25 ft from the ground surface. Henceforth, these elevations will be described as Low (one
ft), Mid (three ft) and Top (4.25 ft), and they are illustrated in Figure 3.13. “P2” is the
number two position around the column’s perimeter, which is indicated by the shaded
number in Section A-A of Figure 3.12. The label “D1” means that the powder sample was
obtained from a depth of 1.0 in. Finally, the last number, “1” in this example, indicates that
this sample came from the first position on the template, which is shown in Detail B of
Figure 3.12. A more comprehensive depiction of the template is shown in Figure 3.14. More
details on each of these locating features are presented in the following paragraphs.
The perimeter of each column (C1 through C5) selected as a FRP wrap site has 12
sample stations at various elevations. The primary layout for these sample stations around
the column’s perimeter are illustrated in Figure 3.15. The letter “d” represents distance from
the face of the column to the edge of the nearest traffic lane; these distances were given in
Table 3.1.

35
6’
2’
1’
1’- 8” Top
Mid
Low
1’- 3”
Locator Arrow
Figure 3.13 The three elevations used for powder sample collection.
5 ft of Fiber Reinforced Polymer Wrap
3’
Mid
A A
Detail B
a.) Side view of wrapped column
60°
60°
1
4
3
2
b.) Section A-A
c.) Detail B
Figure 3.12 Visual aid for the location of the powder sample in the example label.
1
Traf
fic F
low

36
11
5
10
1 7
2
9 4S
3
6
8
5S
11S
10S
1S 7S
3S
6S
8S4
2S
9S
R=6 in.
R=3 in.
a.) Schematic of template b.) Actual template used in the field
c.) Template in use at TS5
Figure 3.14 Details of the template.

37
Roa
d d
Detail A
a.) Plan View
Columns
60°
60°
1
42
3
b.) Detail A
3
60°
1
2 4
Note: Numbers identify the layout for sample stations around the outside perimeter of the column.
c.) Alternate Detail A for TS3
Figure 3.15 Perimeter locations of powder sample stations.
The template created is shown in both Figure 3.14 a. and b., where the numbered
circles identify the stations for obtaining powder samples. After one station is used, it is
crossed off; the next ascending number is used the next time samples are obtained. Note that
there is a second set of numbers with a label “S” on the template. These secondary sample
stations are identified and should be used if a safety feature, such as a guardrail, makes it
difficult to obtain a powder sample at the desired sample station.
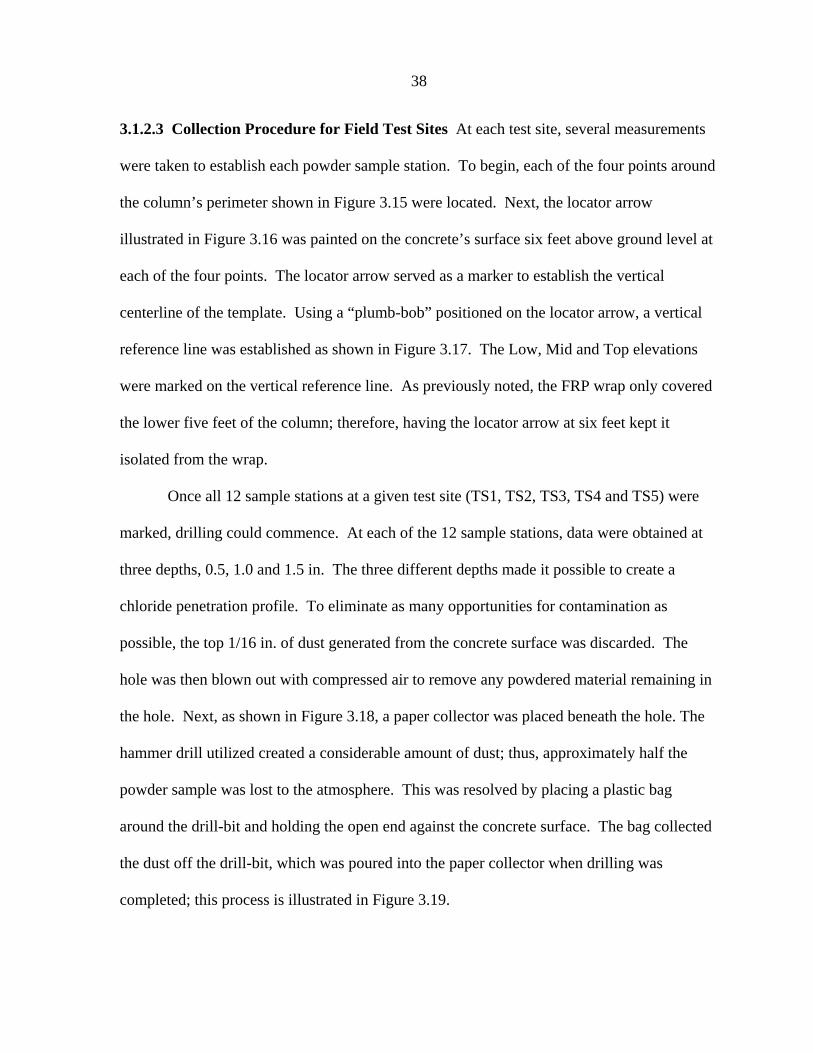
38
3.1.2.3 Collection Procedure for Field Test Sites At each test site, several measurements
were taken to establish each powder sample station. To begin, each of the four points around
the column’s perimeter shown in Figure 3.15 were located. Next, the locator arrow
illustrated in Figure 3.16 was painted on the concrete’s surface six feet above ground level at
each of the four points. The locator arrow served as a marker to establish the vertical
centerline of the template. Using a “plumb-bob” positioned on the locator arrow, a vertical
reference line was established as shown in Figure 3.17. The Low, Mid and Top elevations
were marked on the vertical reference line. As previously noted, the FRP wrap only covered
the lower five feet of the column; therefore, having the locator arrow at six feet kept it
isolated from the wrap.
Once all 12 sample stations at a given test site (TS1, TS2, TS3, TS4 and TS5) were
marked, drilling could commence. At each of the 12 sample stations, data were obtained at
three depths, 0.5, 1.0 and 1.5 in. The three different depths made it possible to create a
chloride penetration profile. To eliminate as many opportunities for contamination as
possible, the top 1/16 in. of dust generated from the concrete surface was discarded. The
hole was then blown out with compressed air to remove any powdered material remaining in
the hole. Next, as shown in Figure 3.18, a paper collector was placed beneath the hole. The
hammer drill utilized created a considerable amount of dust; thus, approximately half the
powder sample was lost to the atmosphere. This was resolved by placing a plastic bag
around the drill-bit and holding the open end against the concrete surface. The bag collected
the dust off the drill-bit, which was poured into the paper collector when drilling was
completed; this process is illustrated in Figure 3.19.
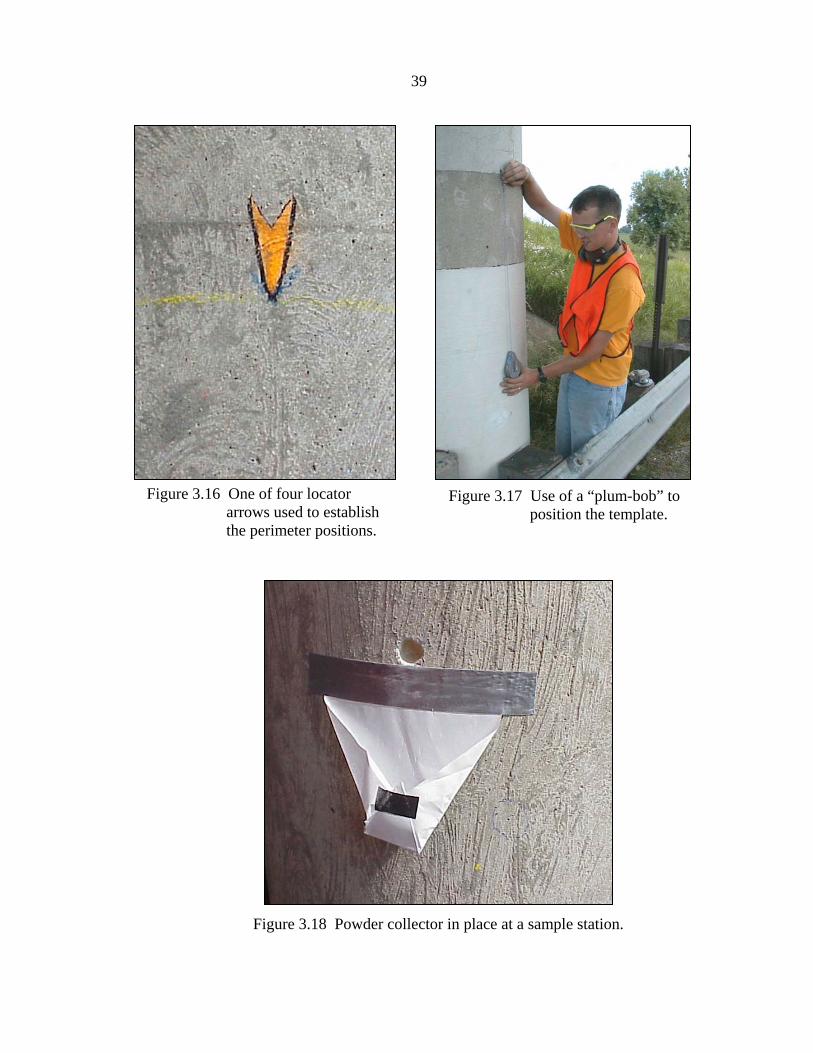
39
Figure 3.16 One of four locator arrows used to establish the perimeter positions.
Figure 3.17 Use of a “plum-bob” to position the template.
Figure 3.18 Powder collector in place at a sample station.

40
Figure 3.19 Hammer drill and plastic bag utilized in powder collection.
Concrete powder that remained in the hole was then collected with a brush. Once
again, compressed air was blown into the hole to remove any powder that remained. This
cleared all material from the hole so the next sample would be free of contaminants. The
powder sample was then poured into a labeled container. The paper collector and plastic bag
were replaced after collecting each powder sample. The drill bit was cleaned and the
equipment was then ready for the next sample site. Once samples were obtained from all
three depths, the holes were immediately patched with a non-shrink grout. In situations
where samples were obtained from a column with a wrap in place, an additional protective
topcoat was applied over the patch.
It should also be noted that in addition to the five test columns selected in the field to
receive an FRP wrap system, a second column at each test site was used as a control. These
are identified in Appendix A. The control column was the neighboring column to the
wrapped column at most test sites. Baseline data were collected from these secondary
control columns using the same method as was used on the wrapped columns. With the

41
control column data, it will be possible to compare the chloride penetration results from a
wrapped column to an unprotected column at the conclusion of this project. Baseline data for
these control columns is presented in Appendix B along with the baseline data for the
wrapped test columns.
3.2 Laboratory Specimens
The laboratory portion of this project consists of two slabs subjected to the AASHTO
T 259-80 ponding test (5). The laboratory tests are to determine the effectiveness of the FRP
as a barrier to chlorides in an accelerated environment. One slab was constructed for use as a
control and the second one was for testing the permeability of the various FRP wraps. This
portion of the project will also be monitored over a five year period. The following sections
describe the AASHTO ponding test and the construction of the two slabs in the laboratory
utilizing the AASHTO test as guide.
3.2.1 AASHTO Ponding Test
As stated previously in Chapter One, the T 259-80 test is the Standard Method of Test
for Resistance of Concrete to Chloride Ion Penetration. This test was used to establish the
effects of varying a concrete’s properties to chloride penetration. The parameters that can be
varied include cement type, water-cement ratio, admixtures and differing curing treatments.
However, there is also another statement within the test procedure that allowed for the
evaluation of a special overlay material that is installed on the specimen. For this project, the
special overlay was the FRP wrap system.
The AASHTO test required a minimum slab thickness slab of two inches when a
special overlay is evaluated. This test also specified that dams with a minimum height of
0.75 in. above the concrete surface are to be placed around the perimeter. The dam can be

42
cast monolithically with the slab or it can be created from a secondary material and placed
either during the casting or after it has cured.
The degree of saturation in the slab at the time of ponding affects the chloride ingress;
therefore, the AASHTO test required that the slab have 28 days to air-dry prior to any
ponding. This eliminates variation in the results because concrete that was saturated prior to
ponding absorbed significantly less water, which reduced chloride absorption during the
ponding. At the end of the 28 day air-dry period, the slab is to be subjected to 90 days of
continuous ponding with a three percent sodium chloride solution. The minimum depth of
ponding was 0.5 in. To maintain this depth, glass plates were recommended to be installed
over the slab to reduce evaporation. It is noted that additional sodium chloride solution can
be added if evaporation does occur. At the end of 90 days, the solution is drained and the
surface is allowed to dry.
The final step in the AASHTO ponding test was to obtain a sample. First, any
accumulation of salt crystal residue should be removed. Then powder samples can be taken
from the concrete at depths of 0.5, 1.0, and 1.5 in., which were the same depths that were
used in the field tests. Each powder sample can then be evaluated with an x-ray spectrometer
to determine its chloride content.
3.2.2 Specimen Geometry and Fabrication
For this project, two slabs were constructed for the laboratory specimens. One slab,
Slab 1, has all five FRP wraps installed on it along with the two protective topcoats; the
second slab, Slab 2, was used as a control. Recall from the description of the project that
data will be collected for five years, which means that 18 ponding cycles will occur. At the
end of each ponding cycle, three powder samples were taken from beneath each FRP wrap
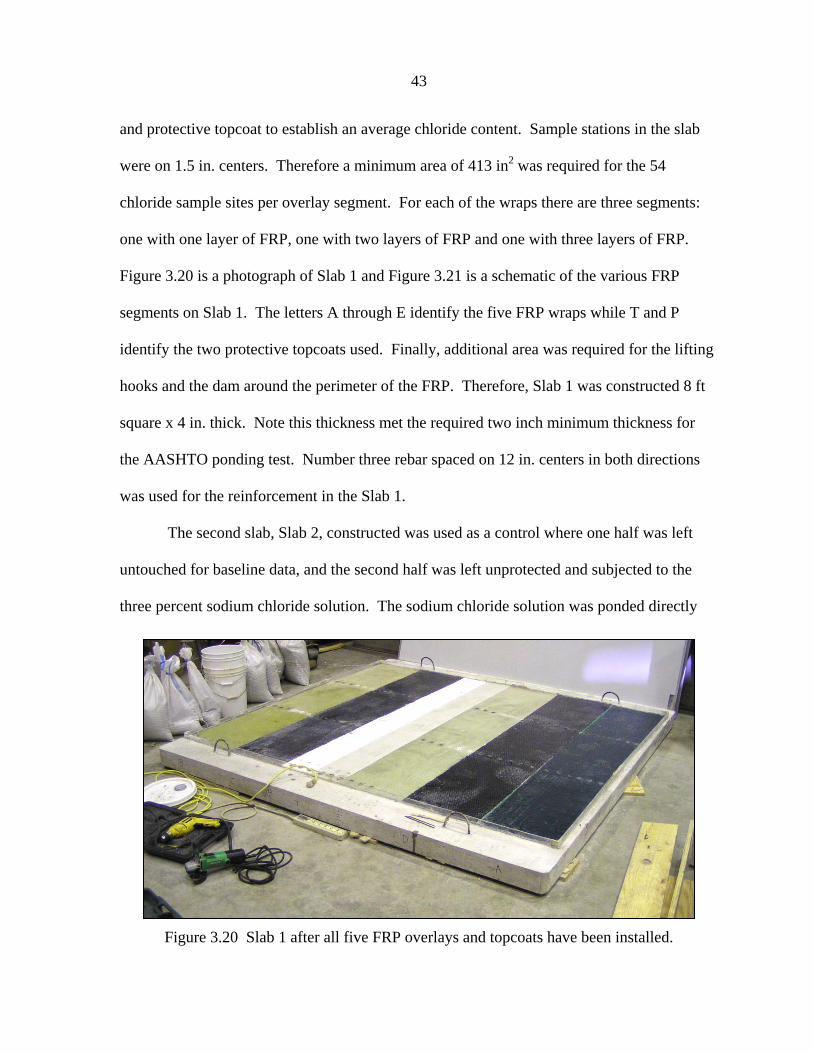
43
Figure 3.20 Slab 1 after all five FRP overlays and topcoats have been installed.
and protective topcoat to establish an average chloride content. Sample stations in the slab
were on 1.5 in. centers. Therefore a minimum area of 413 in2 was required for the 54
chloride sample sites per overlay segment. For each of the wraps there are three segments:
one with one layer of FRP, one with two layers of FRP and one with three layers of FRP.
Figure 3.20 is a photograph of Slab 1 and Figure 3.21 is a schematic of the various FRP
segments on Slab 1. The letters A through E identify the five FRP wraps while T and P
identify the two protective topcoats used. Finally, additional area was required for the lifting
hooks and the dam around the perimeter of the FRP. Therefore, Slab 1 was constructed 8 ft
square x 4 in. thick. Note this thickness met the required two inch minimum thickness for
the AASHTO ponding test. Number three rebar spaced on 12 in. centers in both directions
was used for the reinforcement in the Slab 1.
The second slab, Slab 2, constructed was used as a control where one half was left
untouched for baseline data, and the second half was left unprotected and subjected to the
three percent sodium chloride solution. The sodium chloride solution was ponded directly

44
One Layer
Two Layers
Three Layers
A T P E D C B
Lifting Hook (typ)
Figure 3.21 Slab 1 layout for each product and the number of layers.
onto the concrete’s surface to observe the digress of the concrete when there were no
special overlays. Because there were only two sections on Slab 2, it only required area for
two sets of 54 test sites. Thus, Slab 2 could have been made 2 ft x 4.5 ft x 4 in., but for
convenience the slab was constructed 2 ft x 8 ft x 4 in. Slab 2 could then span Slab 1, which
created a platform on which electric mixers used to agitate the sodium chloride solution
could be mounted. More details on the mixers are provided later. Number three rebar spaced
at 12 in. on center in both directions was installed in Slab 2 for reinforcement.
For this project, plexiglas was used to create the dams. They were embedded in the
concrete to resist pull-out as well as prevent leakage of the sodium chloride solution. This
was accomplished by drilling 3/4 in. holes every three inches along the bottom of the
plexiglas. The total height of the plexiglas was three inches, thus permitting 1.5 in. to be
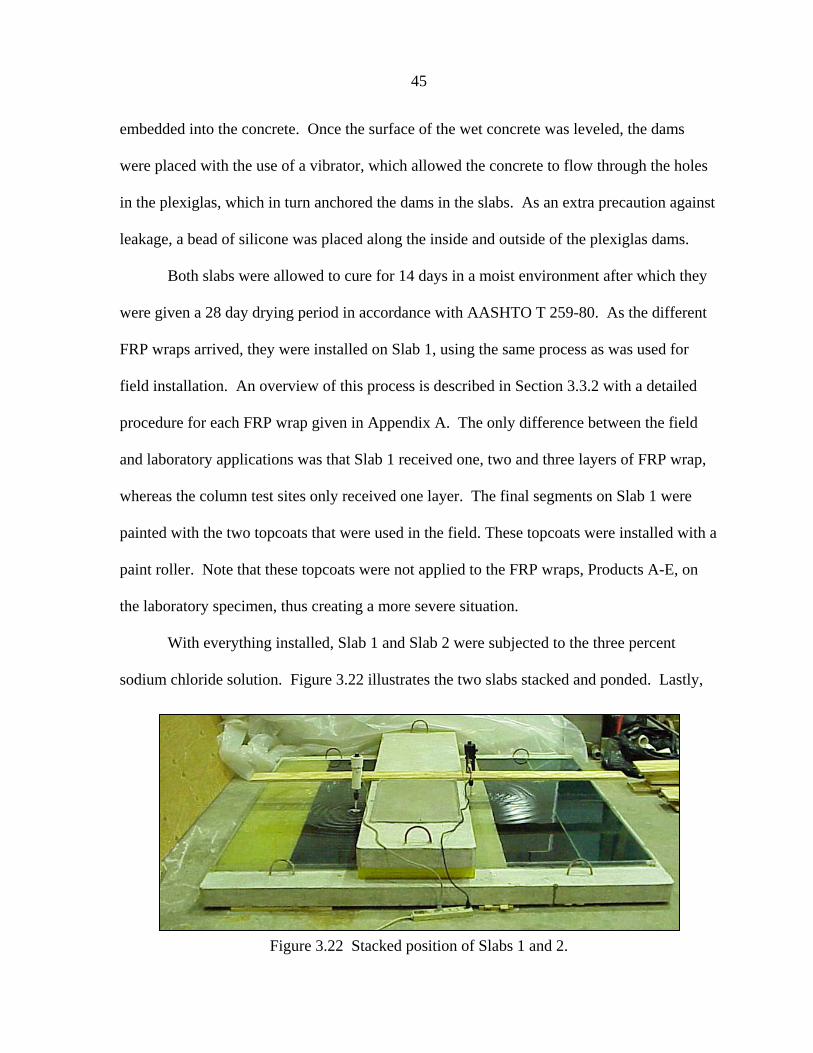
45
Figure 3.22 Stacked position of Slabs 1 and 2.
embedded into the concrete. Once the surface of the wet concrete was leveled, the dams
were placed with the use of a vibrator, which allowed the concrete to flow through the holes
in the plexiglas, which in turn anchored the dams in the slabs. As an extra precaution against
leakage, a bead of silicone was placed along the inside and outside of the plexiglas dams.
Both slabs were allowed to cure for 14 days in a moist environment after which they
were given a 28 day drying period in accordance with AASHTO T 259-80. As the different
FRP wraps arrived, they were installed on Slab 1, using the same process as was used for
field installation. An overview of this process is described in Section 3.3.2 with a detailed
procedure for each FRP wrap given in Appendix A. The only difference between the field
and laboratory applications was that Slab 1 received one, two and three layers of FRP wrap,
whereas the column test sites only received one layer. The final segments on Slab 1 were
painted with the two topcoats that were used in the field. These topcoats were installed with a
paint roller. Note that these topcoats were not applied to the FRP wraps, Products A-E, on
the laboratory specimen, thus creating a more severe situation.
With everything installed, Slab 1 and Slab 2 were subjected to the three percent
sodium chloride solution. Figure 3.22 illustrates the two slabs stacked and ponded. Lastly,

46
Figure 3.23 Electric mixer with a plastic paddle blade to prevent corrosion.
to minimize evaporation, the ponded surfaces were covered with plastic sheeting.
3.2.3 Circulation System
A system utilizing two electronic mixers placed on both sides of Slab 2 was
introduced in the laboratory to keep the sodium chloride in solution. One of the electric
mixers is shown in Figure 3.23 while the photograph in Figure 3.24 illustrates the position of
the two mixers on Slab 2. The electronic mixers operated a paddle blade that stirs the
solution. Note that the paddle blade is fabricated from plastic to eliminate corrosion. This
circulation system prevented the chloride particles from settling out to maintain a constant
three percent sodium chloride solution. Due to the small surface area that is ponded on Slab
2, electronic mixers were not required. Another complication with the large surface area was
evaporation, thus additional sodium chloride solution needed to be added. With the mixers, a
uniform mixture was quickly achieved between the existing and the added solution.

47
Figure 3.24 Position of the two electric mixers on the stacked slabs.
3.3 FRP Material
This section describes the five different FRP wraps used in this project and the
general application procedure used. Information on the products used at each of the five test
sites (TS1 through TS5) is also provided.
3.3.1 Summary of FRP Properties
Both carbon and glass FRP wraps were employed to determine their effectiveness as
a barrier to chlorides when combined with an epoxy matrix. Table 3.3 summarizes the
various material properties for each of the five FRP wraps used. These values were provided
by the manufacturers, and are for one layer of resin undercoat, one layer of fibers and one
layer of resin overcoat. The manufacturer of Product A included a disclaimer that these
values were for informational purposes only because it is improbable that the resin thickness
used to arrive at these results would be the same as used in an actual application.
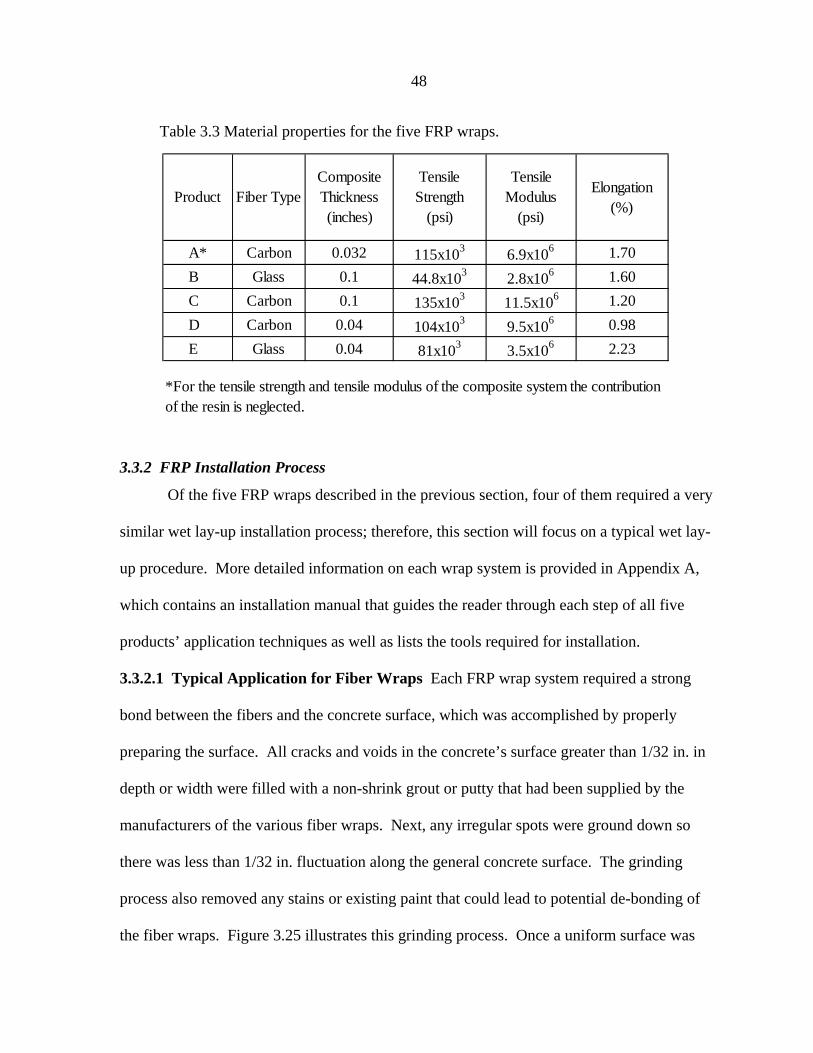
48
Product Fiber TypeComposite Thickness (inches)
Tensile Strength
(psi)
Tensile Modulus
(psi)
Elongation (%)
A* Carbon 0.032 115x103 6.9x10⁶ 1.70B Glass 0.1 44.8x10³ 2.8x10⁶ 1.60C Carbon 0.1 135x103 11.5x10⁶ 1.20D Carbon 0.04 104x103 9.5x10⁶ 0.98E Glass 0.04 81x103 3.5x10⁶ 2.23
*For the tensile strength and tensile modulus of the composite system the contribution of the resin is neglected.
Table 3.3 Material properties for the five FRP wraps.
3.3.2 FRP Installation Process
Of the five FRP wraps described in the previous section, four of them required a very
similar wet lay-up installation process; therefore, this section will focus on a typical wet lay-
up procedure. More detailed information on each wrap system is provided in Appendix A,
which contains an installation manual that guides the reader through each step of all five
products’ application techniques as well as lists the tools required for installation.
3.3.2.1 Typical Application for Fiber Wraps Each FRP wrap system required a strong
bond between the fibers and the concrete surface, which was accomplished by properly
preparing the surface. All cracks and voids in the concrete’s surface greater than 1/32 in. in
depth or width were filled with a non-shrink grout or putty that had been supplied by the
manufacturers of the various fiber wraps. Next, any irregular spots were ground down so
there was less than 1/32 in. fluctuation along the general concrete surface. The grinding
process also removed any stains or existing paint that could lead to potential de-bonding of
the fiber wraps. Figure 3.25 illustrates this grinding process. Once a uniform surface was
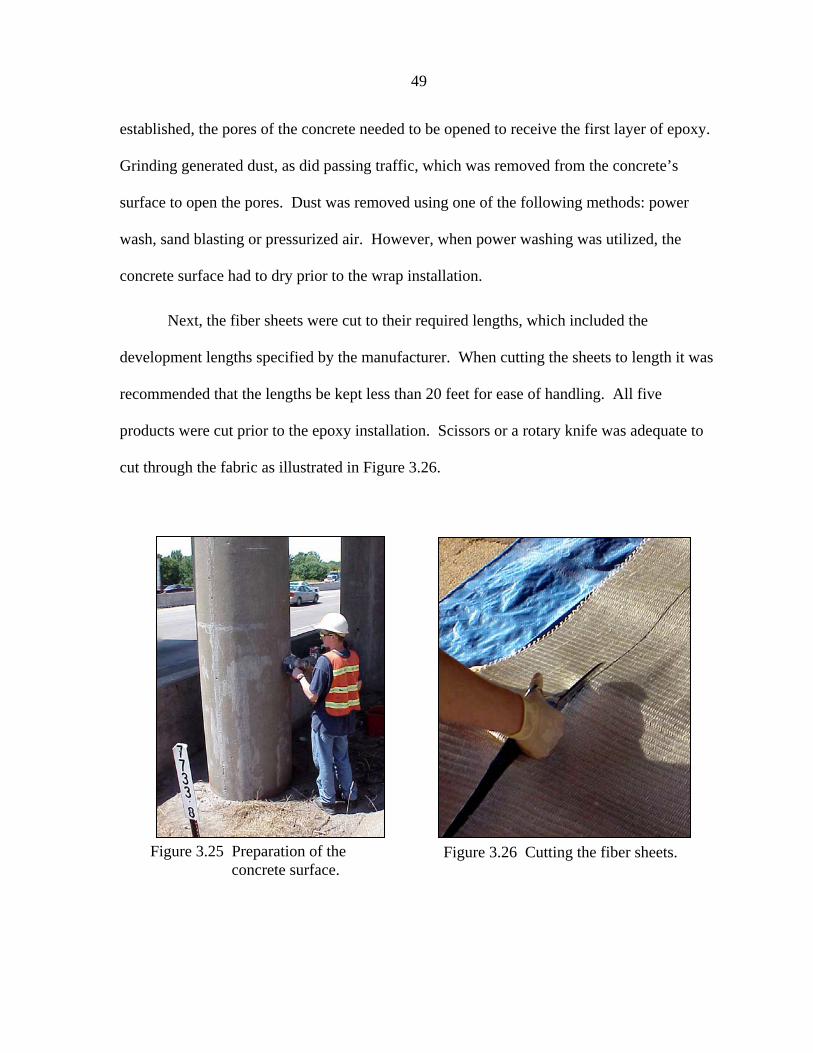
49
Figure 3.25 Preparation of the concrete surface.
Figure 3.26 Cutting the fiber sheets.
established, the pores of the concrete needed to be opened to receive the first layer of epoxy.
Grinding generated dust, as did passing traffic, which was removed from the concrete’s
surface to open the pores. Dust was removed using one of the following methods: power
wash, sand blasting or pressurized air. However, when power washing was utilized, the
concrete surface had to dry prior to the wrap installation.
Next, the fiber sheets were cut to their required lengths, which included the
development lengths specified by the manufacturer. When cutting the sheets to length it was
recommended that the lengths be kept less than 20 feet for ease of handling. All five
products were cut prior to the epoxy installation. Scissors or a rotary knife was adequate to
cut through the fabric as illustrated in Figure 3.26.

50
For the wet lay-up field applications, a trough was constructed to aid in the epoxy
saturation process. The trough consisted of plywood spanning over two sawhorses with a
plastic sheet placed over the top to protect the plywood. Another option was to have a
mechanical saturator on site, which is usually used on larger projects. Once the trough was
in place, the first batch of epoxy was mixed for the prime coat. Each product had a two part
epoxy system, a hardener and a resin. Every manufacturer specifies the ratio to use when
mixing these two parts and provides a time chart that indicated the pot life of each product
with respect to the current temperature. Both parts were blended with a drill utilizing a
paddle blade for the time specified by the manufacturer. After the epoxy was mixed, it was
applied to the concrete’s surface with a paint roller.
With the prime coat in place, the sheets were saturated with epoxy and prepped for
installation. To saturate the FRP, the sheets were placed in the trough and the epoxy was
poured directly onto them. A squeegee was utilized to spread and work the epoxy into the
fibers; this process is illustrated in Figure 3.27. Fiber sheets were turned over and the same
process was repeated on the backside to ensure that the sheets were completely saturated.
Sheets were then rolled onto a piece of PVC piping for ease in installation and transport. The
FRP sheets are transferred onto the concrete surface by unrolling them from the pipe, as
shown in Figure 3.28.
A paddle wheel was rolled over the entire FRP wrap in the direction of the fibers to
allow air to escape as it pushed the fibers into the epoxy and impregnated them. If
misalignment of the fibers occurred, then the backside of a gloved hand was used to smooth
the wraps in the direction of their fibers to minimize the misalignment.

51
Figure 3.27 Work the epoxy into the fibers with a squeegee.
Figure 3.28 For ease in installation, unroll the FRP sheets onto the column.
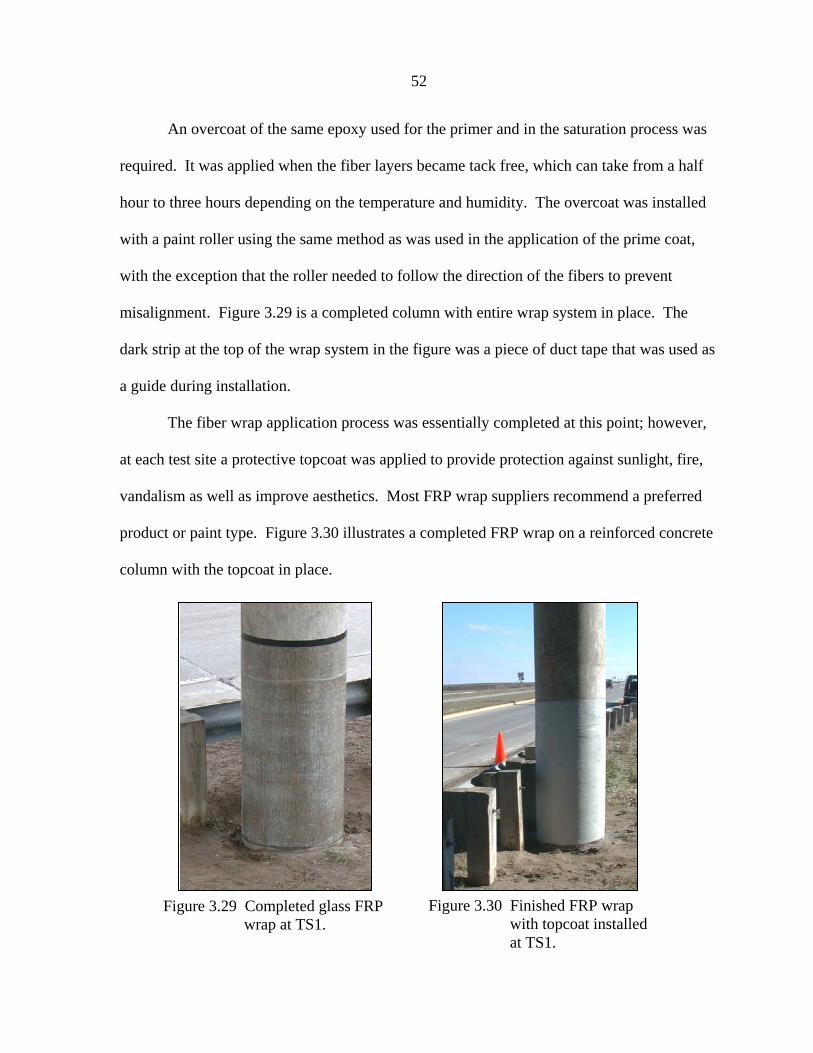
52
An overcoat of the same epoxy used for the primer and in the saturation process was
required. It was applied when the fiber layers became tack free, which can take from a half
hour to three hours depending on the temperature and humidity. The overcoat was installed
with a paint roller using the same method as was used in the application of the prime coat,
with the exception that the roller needed to follow the direction of the fibers to prevent
misalignment. Figure 3.29 is a completed column with entire wrap system in place. The
dark strip at the top of the wrap system in the figure was a piece of duct tape that was used as
a guide during installation.
The fiber wrap application process was essentially completed at this point; however,
at each test site a protective topcoat was applied to provide protection against sunlight, fire,
vandalism as well as improve aesthetics. Most FRP wrap suppliers recommend a preferred
product or paint type. Figure 3.30 illustrates a completed FRP wrap on a reinforced concrete
column with the topcoat in place.
Figure 3.29 Completed glass FRP wrap at TS1.
Figure 3.30 Finished FRP wrap with topcoat installed at TS1.

53
Table 3.4 Products used at the various test sites.
3.3.2.2 Installation Locations Specific to Product Type The five wrap systems and their
corresponding locations in the Ames area are listed in Table 3.4. As stated previously, the
five FRP wrap systems were given the identification A through E. At each of the five test
sites, topcoats were installed on the wrap systems; Product P was used at TS4 while Product
T was used at the other four test sites.
3.4 Acquisition of Environmental Data
The AASHTO ponding test conducted in the laboratory required a solution of three
percent sodium chlorides. However, a relationship needed to be established between the
laboratory work and the sodium chloride content of slush that the test sites will experience.
Therefore, slush samples were collected from each column site to determine if the three
percent standard was an adequate representation of the chloride content in the spray
generated by passing traffic. During the first winter season (2002) after installation of the
FRP wraps, samples of slush were collected after three different snow storms. Figure 3.31
and Figure 3.32 are photographs that illustrate the height of the spray, which was about 5.5 ft
to 6 ft. The first winter season after installation of the wrap systems was mild, which was
indicated by the fact that the Iowa DOT in the Ames region only had to salt the roadways 17
times. Analysis of the samples collected at all the tests sites revealed an average of 1.2
percent of sodium chlorides in the slush. However, a peak of five percent was noticed at
Test Site FRP Wrap System
TS1 E TS2 B TS3 D TS4 A TS5 C

54
Figure 3.31 TS1 with snow splash (3/10/03).
Figure 3.32 TS3 with snow splash (3/10/03).
TS5, which is an indication that during winters with more severe storms, the ice and snow
removal programs would be more aggressive. Therefore, sodium chloride in the slush would
more than likely be higher than 1.2 percent. The three percent standard may be more
accurate during more severe winter seasons and not as conservative as it appears to be for
this first season.
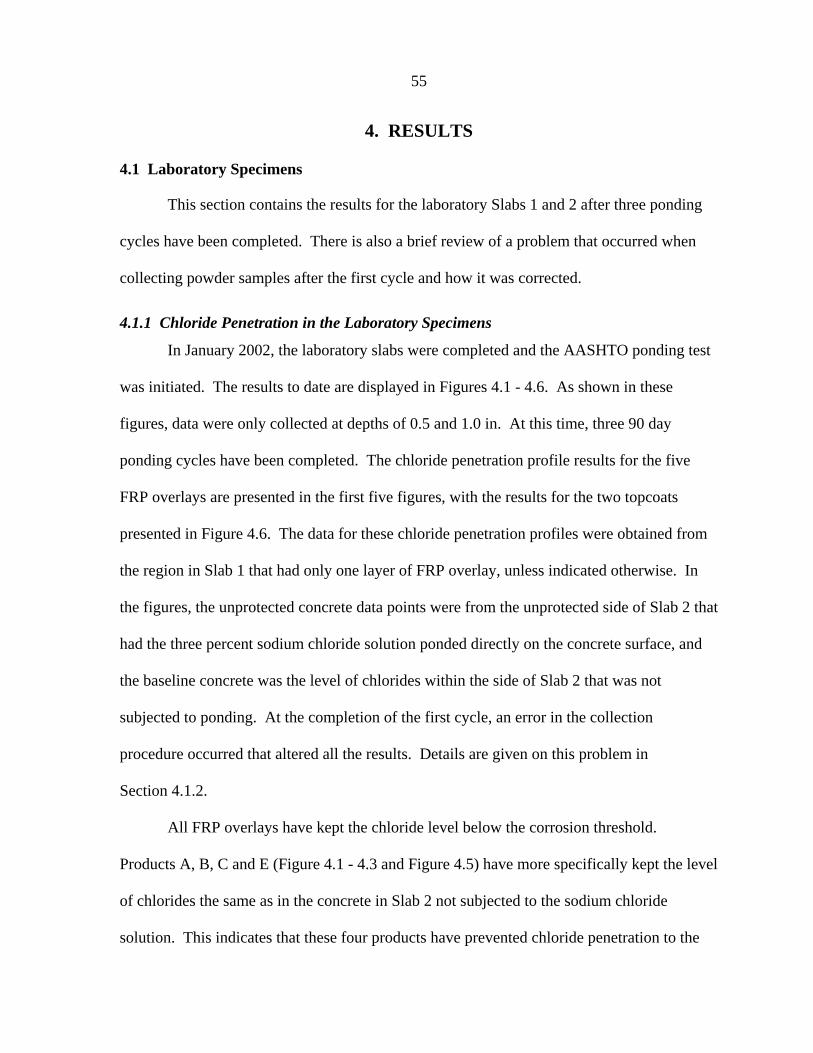
55
4. RESULTS
4.1 Laboratory Specimens
This section contains the results for the laboratory Slabs 1 and 2 after three ponding
cycles have been completed. There is also a brief review of a problem that occurred when
collecting powder samples after the first cycle and how it was corrected.
4.1.1 Chloride Penetration in the Laboratory Specimens
In January 2002, the laboratory slabs were completed and the AASHTO ponding test
was initiated. The results to date are displayed in Figures 4.1 - 4.6. As shown in these
figures, data were only collected at depths of 0.5 and 1.0 in. At this time, three 90 day
ponding cycles have been completed. The chloride penetration profile results for the five
FRP overlays are presented in the first five figures, with the results for the two topcoats
presented in Figure 4.6. The data for these chloride penetration profiles were obtained from
the region in Slab 1 that had only one layer of FRP overlay, unless indicated otherwise. In
the figures, the unprotected concrete data points were from the unprotected side of Slab 2 that
had the three percent sodium chloride solution ponded directly on the concrete surface, and
the baseline concrete was the level of chlorides within the side of Slab 2 that was not
subjected to ponding. At the completion of the first cycle, an error in the collection
procedure occurred that altered all the results. Details are given on this problem in
Section 4.1.2.
All FRP overlays have kept the chloride level below the corrosion threshold.
Products A, B, C and E (Figure 4.1 - 4.3 and Figure 4.5) have more specifically kept the level
of chlorides the same as in the concrete in Slab 2 not subjected to the sodium chloride
solution. This indicates that these four products have prevented chloride penetration to the
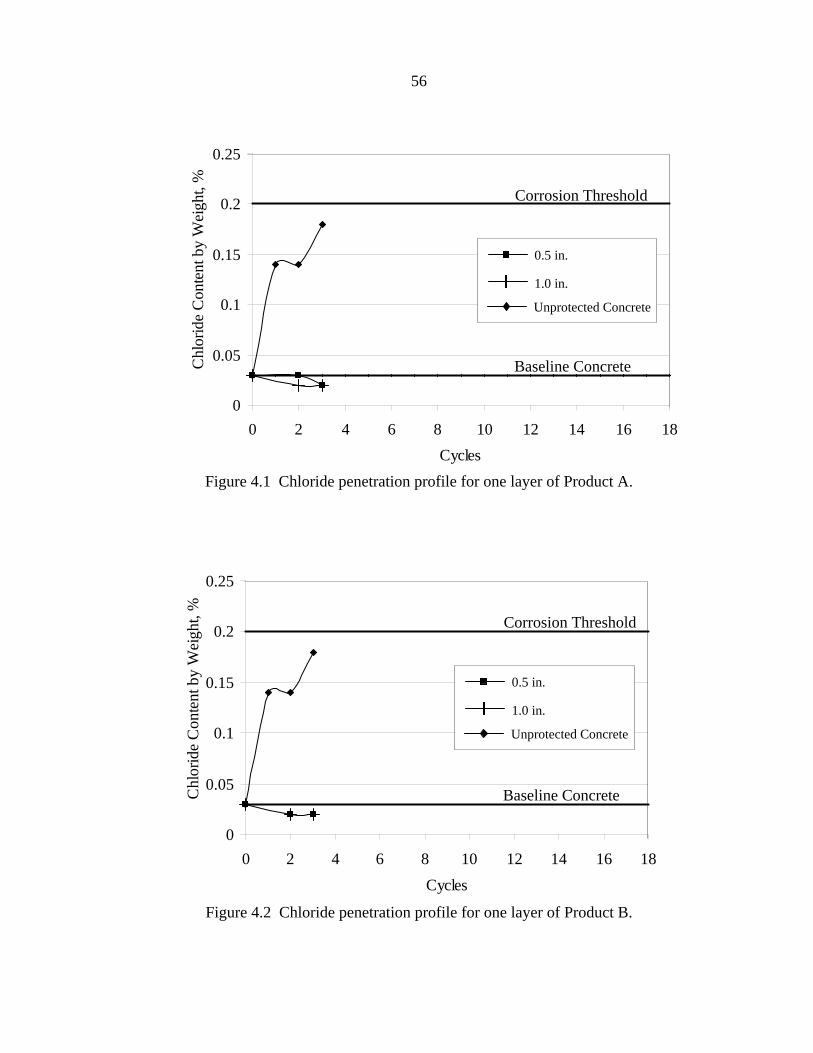
56
0
0.05
0.1
0.15
0.2
0.25
0 2 4 6 8 10 12 14 16 18Cycles
Chl
orid
e C
onte
nt b
y W
eigh
t, %
0.5 in.
Unprotected Concrete
1.0 in.
Baseline Concrete
Corrosion Threshold
Figure 4.1 Chloride penetration profile for one layer of Product A.
0
0.05
0.1
0.15
0.2
0.25
0 2 4 6 8 10 12 14 16 18Cycles
Chl
orid
e C
onte
nt b
y W
eigh
t, %
0.5 in.
Unprotected Concrete
1.0 in.
Corrosion Threshold
Baseline Concrete
Figure 4.2 Chloride penetration profile for one layer of Product B.

57
Figure 4.3 Chloride penetration profile for one layer of Product C.
0
0.05
0.1
0.15
0.2
0.25
0 2 4 6 8 10 12 14 16 18Cycles
Chl
orid
e C
onte
nt b
y W
eigh
t, %
Corrosion Threshold
Baseline Concrete
0.5 in.
Unprotected Concrete
1.0 in.
0
0.05
0.1
0.15
0.2
0.25
0 2 4 6 8 10 12 14 16 18Cycles
Chl
orid
e C
onte
nt b
y W
eigh
t, %
0.5 in. – 2 Layers of FRP
0.5 in.
Unprotected Concrete
1.0 in.
Corrosion Threshold
Baseline Concrete
Figure 4.4 Chloride penetration profile for two layers of Product D.

58
0
0.05
0.1
0.15
0.2
0.25
0 2 4 6 8 10 12 14 16 18Cycles
Chl
orid
e C
onte
nt b
y W
eigh
t, %
Corrosion Threshold
0.5 in.
Unprotected Concrete
1.0 in.
Baseline Concrete
Figure 4.5 Chloride penetration profile for one layer of Product E.
0
0.05
0.1
0.15
0.2
0.25
0 2 4 6 8 10 12 14 16 18Cycles
Chl
orid
e C
onte
nt b
y W
eigh
t, %
Corrosion Threshold
Baseline Concrete
0.5 in. - Topcoat P
1.0 in. - Topcoat T
0.5 in. - Topcoat T
Unprotected Concrete
1.0 in. - Topcoat P
Figure 4.6 Chloride penetration profile for Products T and P.

59
concrete. Since one layer of these FRPs prevented chloride penetration, there was no need to
test the chloride level in the region with two or three layers of FRP. The results for Products
A, B, C and E corresponded with those of Scarth and Keble (22) who wrapped reinforced
concrete columns with at least three layers of aramid FRP for a test period of 1.5 years.
Their results indicated that the FRP was impervious to the chloride splash from passing cars.
The results also validated the findings of Teng, Sotelino and Chen (21) who subjected 80
specimens (wrapped with varying layers of glass FRP) to an accelerated corrosion
environment and determined that the FRP wrap and the epoxy resin itself provided excellent
protection against chloride penetration.
In each of the Figures 4.1 - 4.6, a curved line is displayed that represents the data for
the unprotected ponded side of Slab 2. After nine months of ponding, it also has not reached
the corrosion threshold. However, the curved line represents a continuously increasing
amount of chlorides at a depth of 0.5 in. As the amount of chlorides in the concrete increases
in the ponded side of Slab 2, the level of chlorides can be compared to the level of chlorides
obtained from beneath the FRP overlays. This comparison provides a quantifiable amount of
chlorides that the FRP overlays have “blocked.”
As previously noted, Figures 4.1 - 4.5 indicate that all products except for Product D
in Figure 4.4 have essentially the same results. The results from the second ponding cycle
indicated that chlorides had penetrated the FRP overlay. Upon reviewing the collection
process, it was determined that Product D had a problem that none of the other FRP overlays
experienced. It was observed that as compressed air was blown into a sample collection
hole, the surrounding fiber overlay separated from the concrete slab. This could be caused
by either the wrap delaminating after six months or there was an existing air pocket where

60
the samples were taken. In the laboratory experiment, Products D and E were installed with
the same epoxy resin; since Product E has not displayed a similar phenomenon, there must
have been a poor bond between the FRP and the concrete (i.e. an air pocket). This incident
reinforced the importance of using the air removal roller when installing the FRP wrap
overlay on the slab. It is highly probable that the bottom layer of the wrap system was not
rolled sufficiently, which left a pocket of air between the FRP overlay and the concrete
surface. To correct this problem, as epoxy resin was applied as a sealer over the patches, it
was allowed to seep underneath the fiber wrap system to fill the air pocket.
Even though the air pocket was fixed, to eliminate any additional problems, the
samples from the third cycle were taken in an area approximately 6 in. from the problem
area. The results for the third cycle in Figure 4.4 indicate that all chloride levels for Product
D dropped to match the baseline concrete chloride levels with one exception. The chloride
level at 0.5 in. below one layer of FRP overlay continued to indicate that chlorides had
penetrated the single layer of overlay. This means to date that although Product D has kept
the chloride level below the corrosion threshold, it has allowed a small level of chlorides to
penetrate.
The topcoat results are displayed in Figure 4.6. After three cycles, both topcoats have
kept the chloride levels below the corrosion threshold. There has been an increase in
chlorides at the 0.5 in. depth for both topcoat products. However, at the 1.0 in. depth no
increase in the chloride content above the baseline data in Slab 2 has been observed.
Therefore, over time more than likely the topcoats installed on the columns in the field will
not be sufficient to prevent chloride penetration.

61
4.1.2 Laboratory Experimental Errors
Observe in Figures 4.1 - 4.6 that there is no data point for the first ponding cycle. At
the conclusion of the first cycle, the chloride levels in some of the powder samples collected
from the areas with an FRP overlay were higher than the level of chlorides in the unprotected
portion of Slab 2 that was exposed to the chloride solution. After an investigation into the
possibility of contamination, it was determined that all five FRP overlay systems contained
between 0.1 and 0.3 percent chlorides by weight. These were small amounts; however, recall
that 0.2 percent chlorides by weight was the corrosion threshold for diffused chlorides.
Therefore, if just a few of these fibers were in a powder sample it would alter the results. As
a remedy to this problem, a grinder was used to remove all fibers within in a 2 in. diameter
area of the powder sample station. This process was used to obtain powder samples for the
subsequent cycles as well as for obtaining the field samples. Figure 4.7 and 4.8 illustrate a
patch used with the initial sample acquisition process and the improved process, respectively.
Observe in Figure 4.7 that a hole was drilled through the FRP overlay and the underlying
concrete. With this process, as the bit in the hammer drill used to obtain the sample rotated
against the fibers, the sample became contaminated with pieces of the overlay’s fibers. Next
observe in Figure 4.8 where a grinder has been used to remove a portion of the surrounding
FRP overlay. The sample was obtained near the center of this region without the bit coming
into contact with any of the FRP overlay.
4.2 Field Test Site Columns
This section contains the results from the field test sites one year after the FRP wrap
installation. A review of the baseline data collected prior to the wrap is also included.

62
Figure 4.7 Epoxy patched sample stations from the first cycle.
Figure 4.8 Sample stations from the second cycle where the surrounding FRP fiber system has been removed.
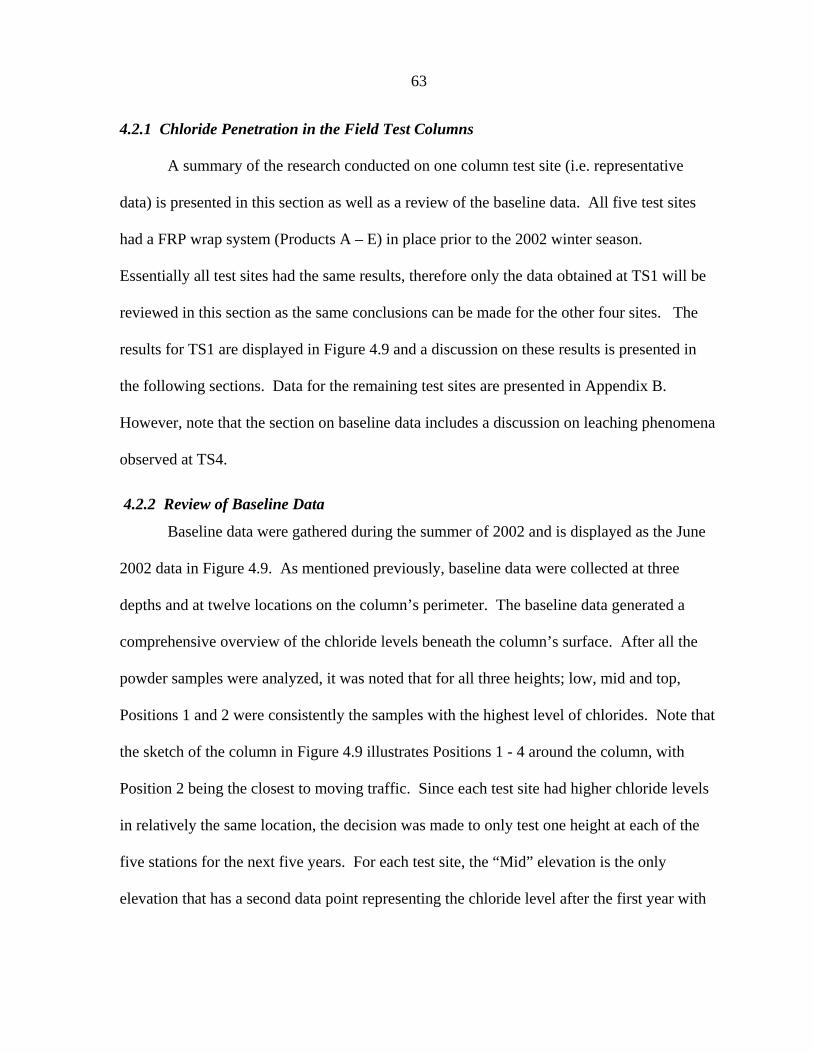
63
4.2.1 Chloride Penetration in the Field Test Columns
A summary of the research conducted on one column test site (i.e. representative
data) is presented in this section as well as a review of the baseline data. All five test sites
had a FRP wrap system (Products A – E) in place prior to the 2002 winter season.
Essentially all test sites had the same results, therefore only the data obtained at TS1 will be
reviewed in this section as the same conclusions can be made for the other four sites. The
results for TS1 are displayed in Figure 4.9 and a discussion on these results is presented in
the following sections. Data for the remaining test sites are presented in Appendix B.
However, note that the section on baseline data includes a discussion on leaching phenomena
observed at TS4.
4.2.2 Review of Baseline Data
Baseline data were gathered during the summer of 2002 and is displayed as the June
2002 data in Figure 4.9. As mentioned previously, baseline data were collected at three
depths and at twelve locations on the column’s perimeter. The baseline data generated a
comprehensive overview of the chloride levels beneath the column’s surface. After all the
powder samples were analyzed, it was noted that for all three heights; low, mid and top,
Positions 1 and 2 were consistently the samples with the highest level of chlorides. Note that
the sketch of the column in Figure 4.9 illustrates Positions 1 - 4 around the column, with
Position 2 being the closest to moving traffic. Since each test site had higher chloride levels
in relatively the same location, the decision was made to only test one height at each of the
five stations for the next five years. For each test site, the “Mid” elevation is the only
elevation that has a second data point representing the chloride level after the first year with

64
Figure 4.9 Chloride content at the Mid-height position of C1.
0
0.05
0.1
0.15
0.2
Jun-02 Jun-03 Jun-04 Jun-05 Jun-06 Jun-07 Jun-08
Chl
orid
e C
onte
nt b
y W
eigh
t, %
0
0.02
0.04
0.06
0.08
0.1
Jun-02 Jun-03 Jun-04 Jun-05 Jun-06 Jun-07 Jun-08
Chl
orid
e C
onte
nt b
y W
eigh
t, %
0
0.005
0.01
0.015
0.02
0.025
Jun-02 Jun-03 Jun-04 Jun-05 Jun-06 Jun-07 Jun-08
Chl
orid
e C
onte
nt b
y W
eigh
t, %
0
0.005
0.01
0.015
0.02
Jun-02 Jun-03 Jun-04 Jun-05 Jun-06 Jun-07 Jun-08
Chl
orid
e C
onte
nt b
y W
eigh
t, %
0.5 in.
1.0 in.
1.5 in.
Key:
L
M
T
1
3
60°
60°
42
c.) Position M1
b.) Position M3
d.) Position M4
a.) Position M2
Test Dates
Test Dates Test Dates
Test Dates
65
the FRP wrap. Therefore, the data displayed in Figure 4.9 is only for the “Mid” elevation;
see Figure 3.13 for the height of this elevation. In Figure 4.9, there are four graphs, each a
display of the chloride profile at the four perimeter locations Position 1 - 4. However, for
this graph they were labeled M1 - M4, indicating a mid-height elevation. The graphs in
Appendix B for all test sites also utilize the labels “T” and “L” representing top and low
elevations respectively.
Only M1, M2 and M3 were tested; M4 was the perimeter location farthest away from
moving traffic, hence the baseline data resulted in negligible amounts of chloride. The
baseline data has results for 0.5, 1.0 and 1.5 in., but only the 0.5 and 1.0 in. depths have been
tested after the first winter season. This was done because this project has a focus on
chloride penetration, where change should occur at the 0.5 in. depth prior to any other depths.
However, due to concern with fiber contamination, both the 0.5 and 1.0 in. depths were
analyzed.
Also included in the baseline data were chloride results for a neighboring column at
each of the selected test sites, which are each located on plan views in Appendix A (see
Figures A.1, A.3, A.5, A.7 and A.8). Their results are displayed as control points for the top
and low elevations in the figures presented in Appendix B. With these controls in place,
observations can be made of the chloride ingress for columns with and without a FRP wrap
system in place.
4.2.2.1 Leaching Occurrence at TS4 Finally, a noteworthy occurrence in the baseline data
was that occasionally the chloride percentages at the depths of 1.0 and 1.5 in. were greater
than those at 0.5 in. as shown in Figure B.9 in Appendix B. The intermittent large aggregate
that can be struck while drilling may explain this random variance. Most aggregates used
66
today in reinforced concrete do not contain chlorides; however, the cement around the
aggregate can have a build-up of chlorides. This could indicate a higher level of chloride
ingress at greater depths when an aggregate is struck within 0.5 in. of the concrete surface.
Nevertheless, ten of the eleven sample stations at TS4 displayed this type of phenomenon.
Therefore, another hypothesis was needed because varying aggregates beneath the concrete
surface cannot explain how chloride percentages at 1.5 in. were greater than those at 0.5 in.
for almost an entire test site.
One possibility is that leaching of the chlorides took place during the summer months
due to hard rains. Leaching will occur in the exterior cover of the concrete’s surface, which
reduces the chloride content at the 0.5 in. depth. Depending on the depth of leaching, it is
possible that the chloride levels at a depth of 1.5 in. can be greater than the chloride levels at
1.0 and 0.5 in. Mejlbro and Pousen (31) noted this phenomenon in their work on modeling
chloride profiles within concrete structures as a result of exposure to de-icing salts. They
recognized that their model for chloride ingress could not be based solely on the
accumulation of chlorides over the winter months, with the chloride levels remaining stable
over the summer season. Although there were not enough data to show the relationship
between the depths of chlorides in concrete versus time to establish a rate at which chlorides
were leached over the summer season, they were still able to create a single model by piecing
together several linear functions versus time. Presumably at TS4 the column (C4) had been
exposed to harsher rains that the other four locations, which ultimately caused the leaching of
chlorides that reside in the shallower depths (0.5 and 1.0 in.).
67
4.2.2 Discussion of TS1 Results
Recall that the data for TS1 are presented in Figure 4.9 and that only the mid-
elevation has a second set of data points. Overall, the baseline data and subsequent samples
are below the corrosion threshold of 0.2 percent. At M1 and M2, up to a 0.02 percent
decrease in chloride content is observed at a depth of 0.5 in., with a small increase in M1 at a
depth of 1.0 in. These minor differences may be a result of samples obtained from offset
sample stations. Since a same sample station can never be used twice (see template in Figure
3.15), an offset station is used, thus the possibility of change beneath the concrete surface is
increased. At various sample stations, a large aggregate may be the majority of the powder
sample and a few inches away another station may contain a large percent of cement, which
contains higher levels of chloride than the aggregate. For both 0.5 and 1.0 in. depths the
chloride content has not increased since the wraps were installed.
69
5. SUMMARY AND TRENDS
5.1 Summary
Every year the United States spends an average of $1.5 billion on snow and ice
removal programs. Over 1/3 of these expenditures were for chemical deicing, which goes
toward the purchase of 10 million tons of salt. Ultimately, this results in $28 million required
for the rehabilitation of the nation’s bridges that have deteriorated as a result of corrosion in
reinforced concrete.
There are several methods of prevention, repair and rehabilitation for corrosion. A
few prevention methods are deflection systems, barriers, corrosion inhibitors, waterproof
membranes and sealants. Methods of rehabilitation include electrical chemical treatments,
which are cathodic protection, chloride extraction and realkalization. Today, several
researchers are looking into the field of fiber reinforced polymers to provide protection and
containment of chlorides. On-going experiments include casting high levels of chlorides into
reinforced concrete specimens to determine if the FRP sheets are capable of containing the
expansive forces generated from the corrosion product. Other experiments have exposed
multiple layers of glass FRP on reinforced concrete columns both in the field and the
laboratory to varying amounts of chlorides. These multiple layered glass FRP wraps have
proven successful in keeping chloride levels constant within the structure after a year of
exposure to deicing salts.
This project utilized both glass and carbon FRP wraps for chloride barrier systems.
The project was divided into two separate experiments - laboratory and field tests – which
are both to run for five years. In the field test, five different FRP systems (three carbon and
two glass) were acquired. One layer of the FRP wraps were installed on five different

70
reinforced concrete columns in the Ames, Iowa area. For further protection against UV
exposure and vandalism, a protective topcoat was placed over each FRP wrap system.
However, prior to the wrap installation, baseline data were collected at twelve locations
around both the test column, which was later wrapped, and a control column, which
remained unwrapped. At each of the twelve locations, data were acquired at three depths,
0.5, 1.0 and 1.5 in. These were then analyzed using a x-ray spectrometer to evaluate the
existing chloride levels within the column. Once the FRP wraps were in place, additional
data were taken from the column after the first winter season. This report only presents the
results from the first season; a supplementary report will be provided at a later date that
includes the results for the subsequent four years. Thus far, no additional chlorides have
penetrated the wraps. A few variations were observed, but these minimal differences in
chloride levels were attributed to the varying aggregate configuration within the concrete
beneath the FRP wrap.
The laboratory test consisted of an AASHTO ponding test. Two reinforced concrete
slabs were constructed; one slab had each of the five FRP overlay systems installed on it and
the two topcoats. The second slab was utilized as a control, where half of the slab remained
unprotected and was subjected to the AASHTO ponding test whereas the other half was not
subjected to any ponding tests. The FRP overlays were installed so that there were sections
on the slab that had one, two and three layers of the overlay. A three percent sodium chloride
solution was then ponded directly onto the slab’s surface for a period of 90 days. The
laboratory test will also continue for a period of five years. To date, three of these cycles
have been completed and one layer of five FRP systems as well as the two topcoats have kept
the chloride content in the slab below the corrosion threshold. However, it has been
71
observed that the topcoats allowed chlorides to penetrate the concrete surface. Also, Product
D permitted an increase in chloride levels beneath one layer of wrap, but no increase under
two layers of FRP wrap. The remaining products - A, B, C and E - have allowed no
chlorides to pass through to the concrete in the slab.
5.2 Trends
Overall, all five FRP wrap systems have kept the chloride level below the corrosion
threshold. To date, the observed trend lines for the laboratory portion have indicated that
Products A, B, C and E have been an effective barrier to chlorides. Each of these products
has not allowed any chlorides to penetrate. Product D’s results have indicated that chlorides
are being allowed to penetrate the FRP overlay. The trend lines thus far for the field indicate
that a single layer of all five FRP wraps are effective. In Appendix C, there are two tables
that indicate when samples are to be obtained from the laboratory slabs and the field test
sites; these tables provide tentative test dates for the next four years. At the end of the five
year test period, a supplementary report with all the additional data collected and conclusions
on the effectiveness of each of the five FRP systems as a chloride barrier, based on both the
field and laboratory experiments, will be submitted.

73
APPENDIX A: PROCEDURES FOR INSTALLING A FRP WRAP ON AREINFORCED
CONCRETE COLUMN
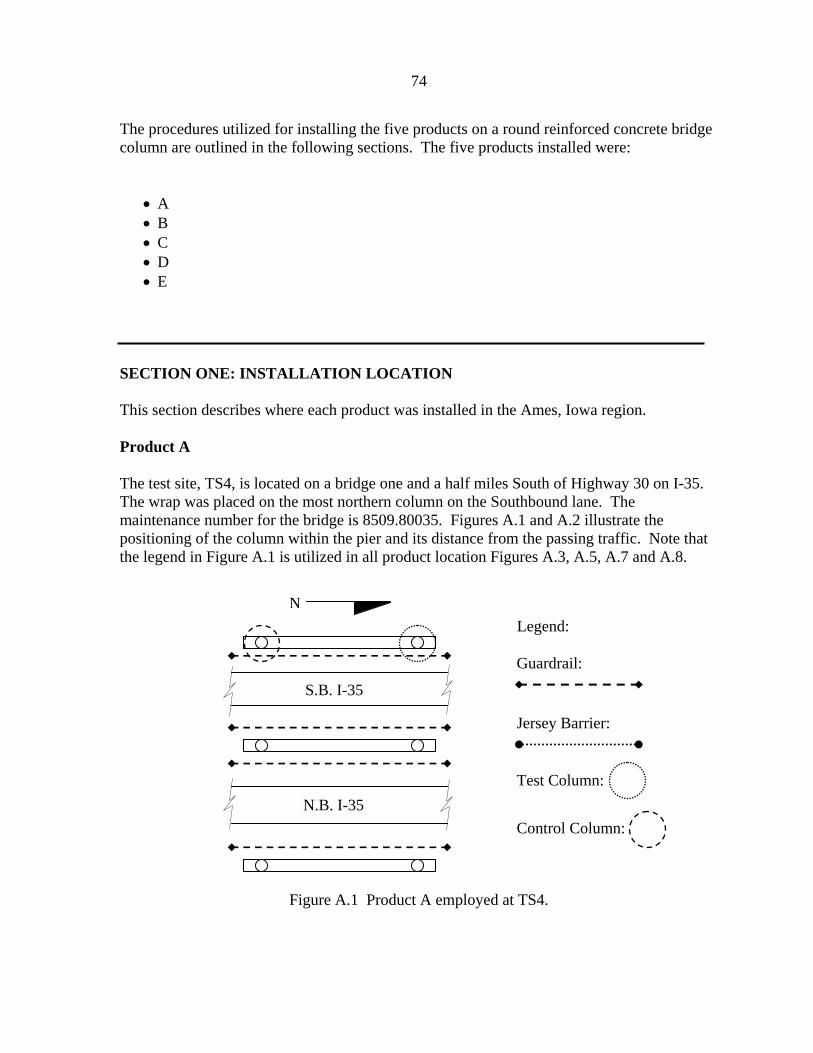
74
N
S.B. I-35
N.B. I-35
Guardrail:
Jersey Barrier:
Test Column:
Control Column:
Figure A.1 Product A employed at TS4.
Legend:
The procedures utilized for installing the five products on a round reinforced concrete bridge column are outlined in the following sections. The five products installed were:
• A • B • C • D • E
SECTION ONE: INSTALLATION LOCATION This section describes where each product was installed in the Ames, Iowa region. Product A The test site, TS4, is located on a bridge one and a half miles South of Highway 30 on I-35. The wrap was placed on the most northern column on the Southbound lane. The maintenance number for the bridge is 8509.80035. Figures A.1 and A.2 illustrate the positioning of the column within the pier and its distance from the passing traffic. Note that the legend in Figure A.1 is utilized in all product location Figures A.3, A.5, A.7 and A.8.

75
Figure A.2 Product A on C4 at TS4 is located within 14 ft of passing traffic.
N
13th Street W.B.L.
13th Street E.B.L.
Figure A.3 Product B employed at TS2.
Product B The test site, TS2, is located on a bridge 1.8 miles north of Junction U.S. 30 on I-35. The wrap was placed on the southeastern column of the bridge carrying the northbound traffic. The maintenance number for the bridge is 8513.6R035. Figures A.3 and A.4 illustrate the positioning of the column within the pier and its distance from the passing traffic.
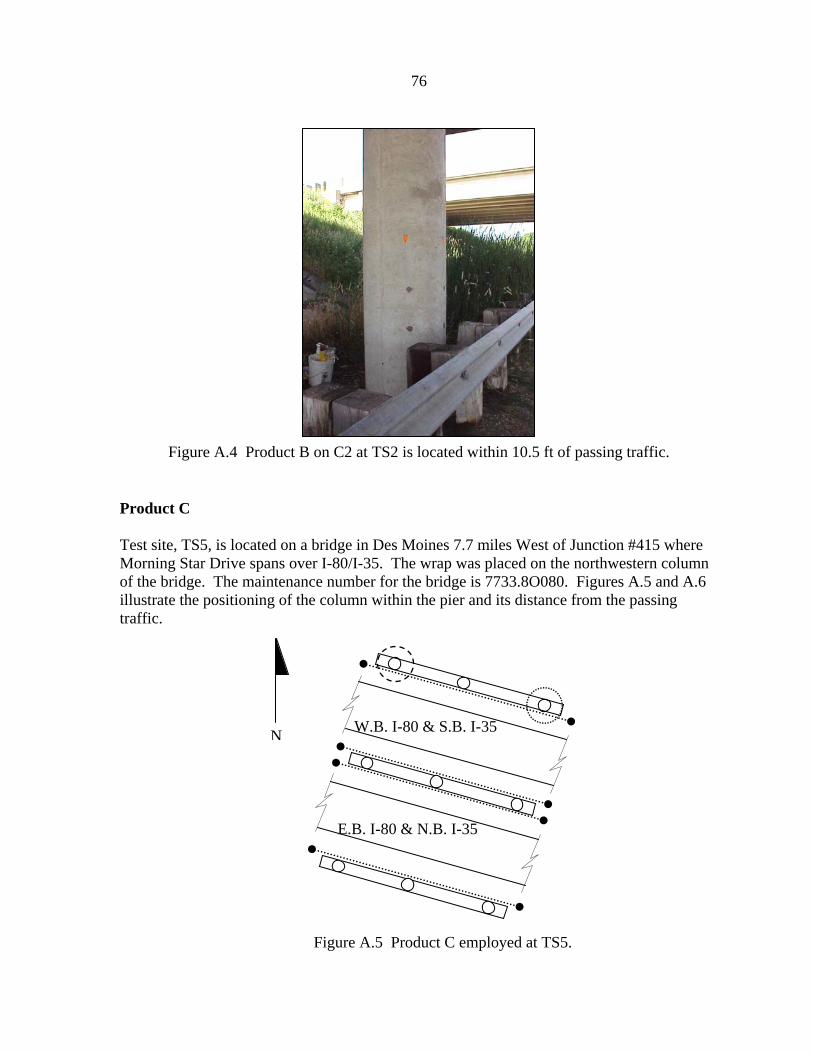
76
Figure A.4 Product B on C2 at TS2 is located within 10.5 ft of passing traffic.
N W.B. I-80 & S.B. I-35
E.B. I-80 & N.B. I-35
Figure A.5 Product C employed at TS5.
Product C Test site, TS5, is located on a bridge in Des Moines 7.7 miles West of Junction #415 where Morning Star Drive spans over I-80/I-35. The wrap was placed on the northwestern column of the bridge. The maintenance number for the bridge is 7733.8O080. Figures A.5 and A.6 illustrate the positioning of the column within the pier and its distance from the passing traffic.
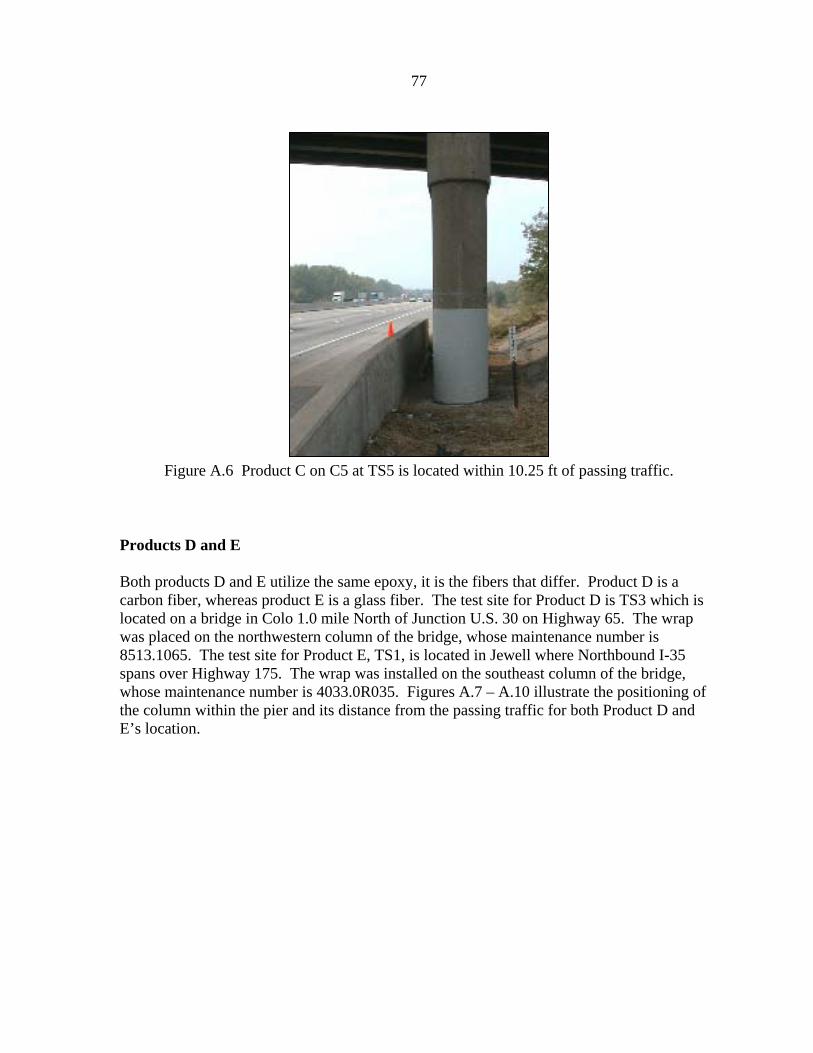
77
Figure A.6 Product C on C5 at TS5 is located within 10.25 ft of passing traffic.
Products D and E Both products D and E utilize the same epoxy, it is the fibers that differ. Product D is a carbon fiber, whereas product E is a glass fiber. The test site for Product D is TS3 which is located on a bridge in Colo 1.0 mile North of Junction U.S. 30 on Highway 65. The wrap was placed on the northwestern column of the bridge, whose maintenance number is 8513.1065. The test site for Product E, TS1, is located in Jewell where Northbound I-35 spans over Highway 175. The wrap was installed on the southeast column of the bridge, whose maintenance number is 4033.0R035. Figures A.7 – A.10 illustrate the positioning of the column within the pier and its distance from the passing traffic for both Product D and E’s location.
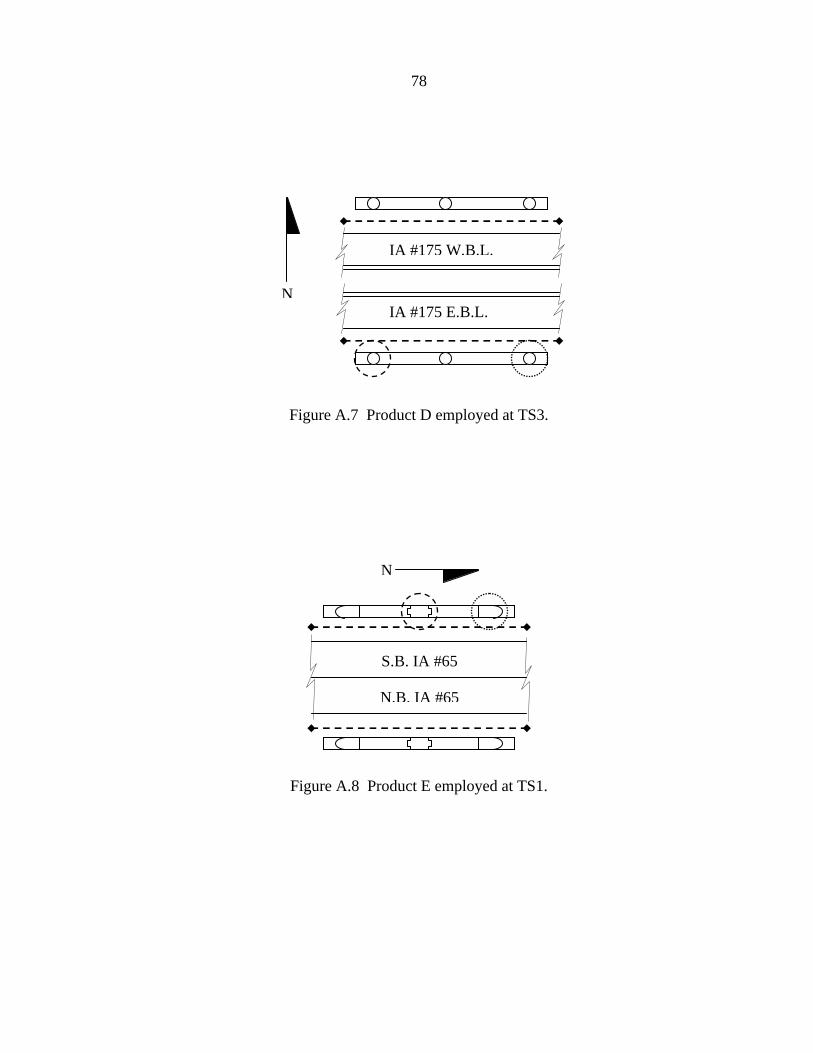
78
NIA #175 E.B.L.
IA #175 W.B.L.
Figure A.7 Product D employed at TS3.
N
S.B. IA #65
N.B. IA #65
Figure A.8 Product E employed at TS1.

79
Figure A.9 Product D on C3 at TS3 is located within 5.2 ft of passing traffic.
Figure A.10 Product E on C1 at TS1 is located within 7.2 ft of passing traffic.
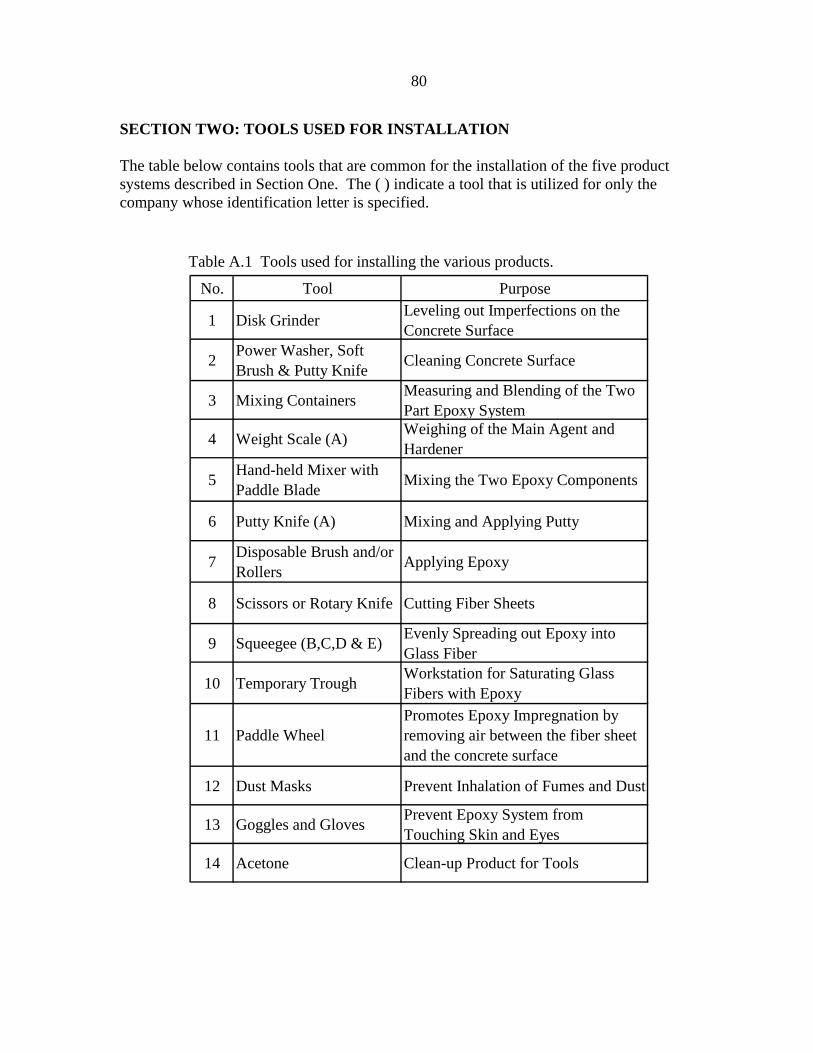
80
SECTION TWO: TOOLS USED FOR INSTALLATION The table below contains tools that are common for the installation of the five product systems described in Section One. The ( ) indicate a tool that is utilized for only the company whose identification letter is specified.
Table A.1 Tools used for installing the various products.
No. Tool Purpose
1 Disk Grinder Leveling out Imperfections on the Concrete Surface
2 Power Washer, Soft Brush & Putty Knife Cleaning Concrete Surface
3 Mixing Containers Measuring and Blending of the Two Part Epoxy System
4 Weight Scale (A) Weighing of the Main Agent and Hardener
5 Hand-held Mixer with Paddle Blade Mixing the Two Epoxy Components
6 Putty Knife (A) Mixing and Applying Putty
7 Disposable Brush and/or Rollers Applying Epoxy
8 Scissors or Rotary Knife Cutting Fiber Sheets
9 Squeegee (B,C,D & E) Evenly Spreading out Epoxy into Glass Fiber
10 Temporary Trough Workstation for Saturating Glass Fibers with Epoxy
11 Paddle WheelPromotes Epoxy Impregnation by removing air between the fiber sheet and the concrete surface
12 Dust Masks Prevent Inhalation of Fumes and Dust
13 Goggles and Gloves Prevent Epoxy System from Touching Skin and Eyes
14 Acetone Clean-up Product for Tools

81
Figure A.12 Weigh out each component.
SECTION THREE: SURFACE PREPERATION To establish a strong bond between the concrete and each FRP product, the surface of the column needs to be properly prepared. Should any holes or cracks be present, these also need to be repaired.
• Step 1. Clear debris from the base of the
column.
• Step 2. Inspect the column’s surface to locate voids, uneven spots and stains. All uneven spots need to be grinded down to less than 1/32 in., as seen in Figure A.11. Also the stains should be removed through the grinding process. Once the surface has been ground down, any voids greater than 1/32 in. that were located need to be filled in with a non-shrink grout.
• Step 3. Dust that was generated from grinding
and passing traffic needs to be cleaned off the column’s surface with pressurized water. Before continuing to the next step dry down the
surface with rags.
Product A has Two Additional Stages: Primer Application
• Step 1. Measure out the primer’s main agent and hardener in accordance with the manufacturer’s specifications. Figure A.12 illustrates that the manufacturer specifies the components to be proportioned by weight.
• Step 2. Combine the primer’s main agent and hardener
into a mixing container as illustrated in Figure A.13. Use the Jiffler mixer with a 5 in. paddle wheel to agitate the primer solution for 3 minutes or until uniform.
• Step 3. Use paint brushes and/or 3/8 in. nap paint
rollers to apply the primer to the concrete surface.
Figure A.11 Grind the concrete surface to remove any unevenness.
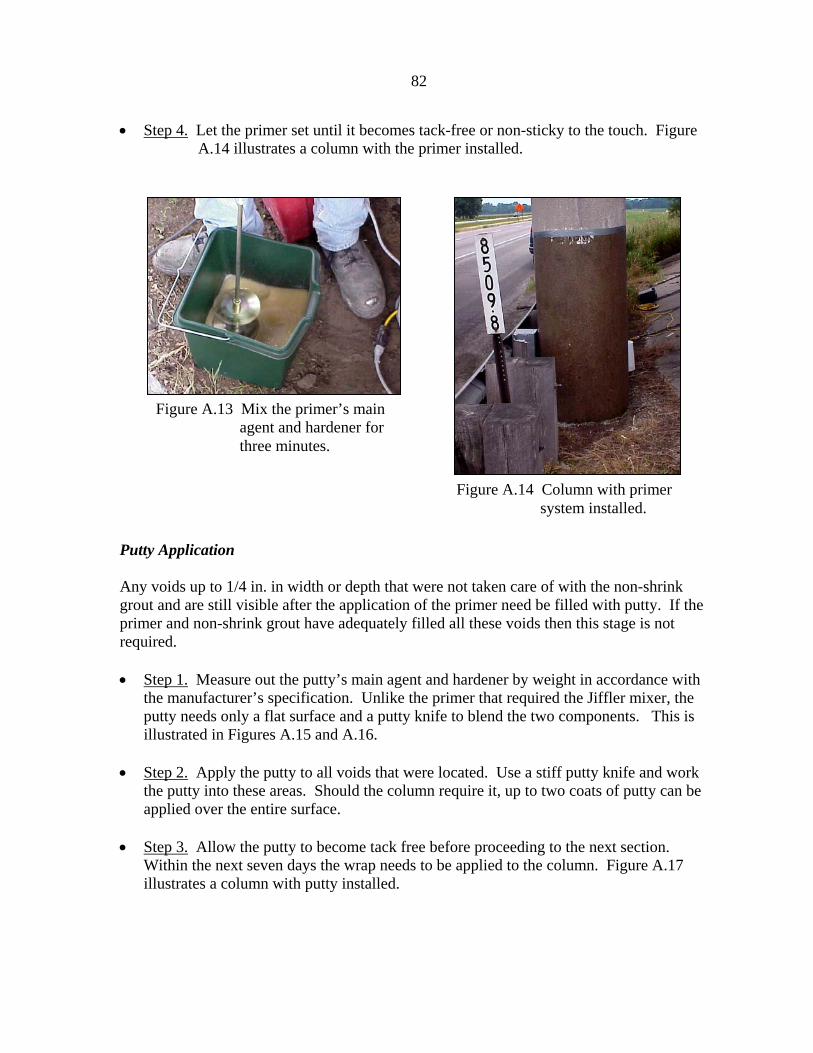
82
• Step 4. Let the primer set until it becomes tack-free or non-sticky to the touch. Figure A.14 illustrates a column with the primer installed.
Putty Application Any voids up to 1/4 in. in width or depth that were not taken care of with the non-shrink grout and are still visible after the application of the primer need be filled with putty. If the primer and non-shrink grout have adequately filled all these voids then this stage is not required. • Step 1. Measure out the putty’s main agent and hardener by weight in accordance with
the manufacturer’s specification. Unlike the primer that required the Jiffler mixer, the putty needs only a flat surface and a putty knife to blend the two components. This is illustrated in Figures A.15 and A.16.
• Step 2. Apply the putty to all voids that were located. Use a stiff putty knife and work
the putty into these areas. Should the column require it, up to two coats of putty can be applied over the entire surface.
• Step 3. Allow the putty to become tack free before proceeding to the next section.
Within the next seven days the wrap needs to be applied to the column. Figure A.17 illustrates a column with putty installed.
Figure A.13 Mix the primer’s main agent and hardener for three minutes.
Figure A.14 Column with primer system installed.

83
Figure A.15 The putty’s main agent and hardener are measured by weight.
Figure A.16 Blend until an even gray color appears.
Figure A.17 Column with both the primer and putty system installed.
SECTION 4: PREPARATION OF FIBER SHEETS Both the carbon and glass fiber sheets need to be cut to their specified length, which includes the development length recommended by the manufacturers. The manufacturers recommend the lengths be kept in the 13-20 foot range for ease of handling. The sheets can be cut at any time prior to installation. A convenient time to accomplish this is when the column’s surface is being prepared. Place a tarp on the ground to keep the fabric clean or use a work bench as shown in Figure A.18. Figure A.19 illustrates that a pair of scissors can be used to easily cut the fabric.
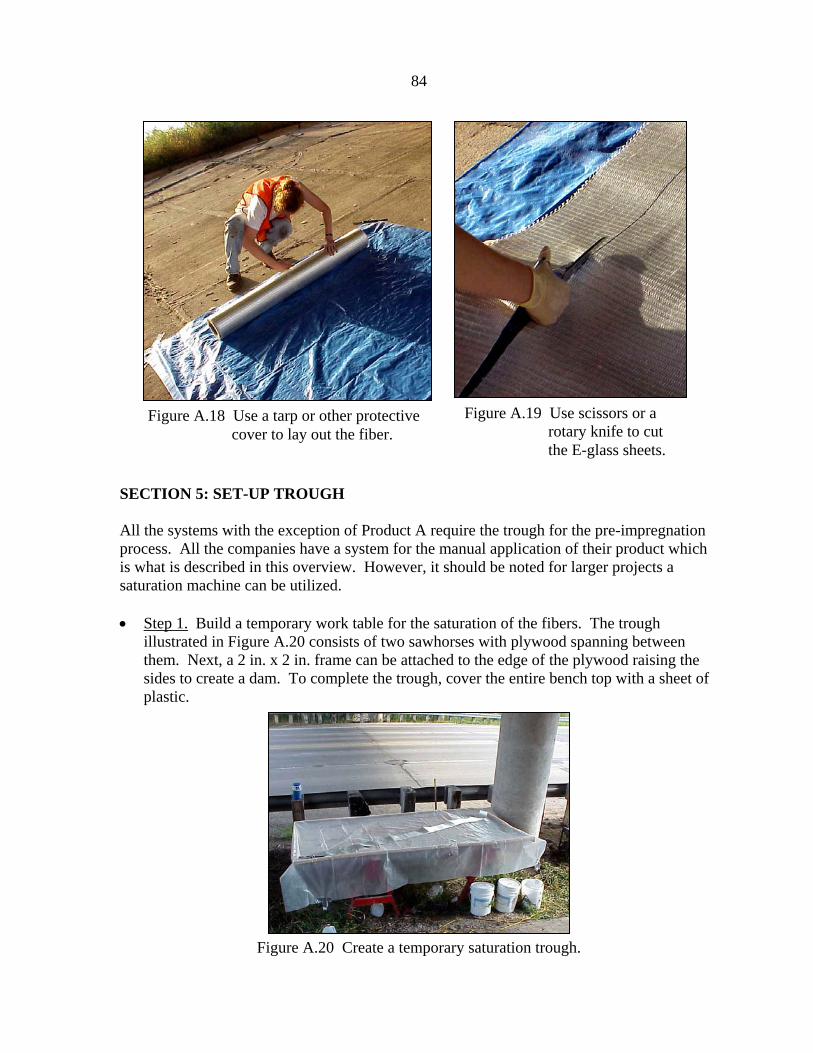
84
Figure A.19 Use scissors or a rotary knife to cut the E-glass sheets.
Figure A.18 Use a tarp or other protective cover to lay out the fiber.
Figure A.20 Create a temporary saturation trough.
SECTION 5: SET-UP TROUGH All the systems with the exception of Product A require the trough for the pre-impregnation process. All the companies have a system for the manual application of their product which is what is described in this overview. However, it should be noted for larger projects a saturation machine can be utilized. • Step 1. Build a temporary work table for the saturation of the fibers. The trough
illustrated in Figure A.20 consists of two sawhorses with plywood spanning between them. Next, a 2 in. x 2 in. frame can be attached to the edge of the plywood raising the sides to create a dam. To complete the trough, cover the entire bench top with a sheet of plastic.

85
SECTION 6: UNDERCOAT APPLICATION Every product system requires an undercoat application. The undercoat for each system is created with the company’s epoxy product, however, Product A utilizes its resin system. • Step 1. Measure out each epoxy’s main agent and hardener in the proportions specified
by the manufacturer. Pour both components into a clean mixing container and proceed to agitate with a Jiffler mixer for the manufacturer’s recommended time (average of four minutes). This is displayed in Figure A.21. Do not use the epoxy if the pot life has been exceeded.
• Step 2. Transfer the mixture into a square-sided pail. This style of pail allows the rollers
to be more efficient. • Step 3. Use paint brushes and/or 3/8 in. nap paint rollers to apply the undercoat as seen
in Figure A.22. One or two coats of the undercoat may be necessary to obtain an even layer of epoxy on the column. Figure A.23 is an example of a column with the undercoat installed. Note that there is a black strip of duct tape at the top of the FRP wrap height which was used as a guide.
Figure A.21 Mix the epoxy’s main agent and hardener in a clean container for the time specified by the manufacturer.
Figure A.22 Use a 3/8 in. nap roller to apply the undercoat in smooth even strokes.

86
Figure A.23 Complete installation of undercoat.
SECTION 7: FIBER SHEET APPLICATION All the products, with the exception of Product A, use the saturated lay-up method. Product A uses a dry lay-up method. The following paragraphs describe both procedures. Dry Lay-Up Procedure for Product A • Step 1. For a column, wrapping is at least a two person effort. One person must hold the
carbon fiber sheets at the beginning as the other person is pulling on the sheet and straightening it as they wrap it around the column. Figure A.24 illustrates this process; the person on the left is holding the initial end of the FRP in place as the person on the right is working the wrap around the column.
Figure A.24 Installing the fiber wrap on a column begins from the bottom.
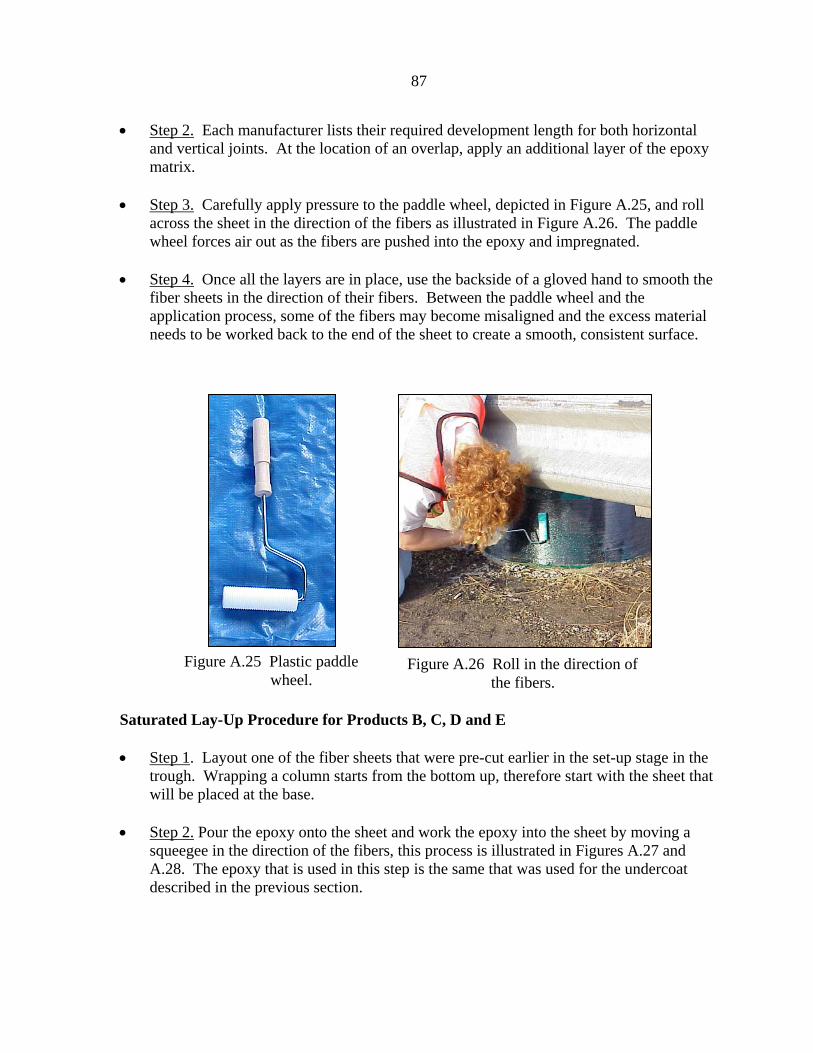
87
Figure A.25 Plastic paddle wheel.
Figure A.26 Roll in the direction of the fibers.
• Step 2. Each manufacturer lists their required development length for both horizontal and vertical joints. At the location of an overlap, apply an additional layer of the epoxy matrix.
• Step 3. Carefully apply pressure to the paddle wheel, depicted in Figure A.25, and roll
across the sheet in the direction of the fibers as illustrated in Figure A.26. The paddle wheel forces air out as the fibers are pushed into the epoxy and impregnated.
• Step 4. Once all the layers are in place, use the backside of a gloved hand to smooth the
fiber sheets in the direction of their fibers. Between the paddle wheel and the application process, some of the fibers may become misaligned and the excess material needs to be worked back to the end of the sheet to create a smooth, consistent surface.
Saturated Lay-Up Procedure for Products B, C, D and E • Step 1. Layout one of the fiber sheets that were pre-cut earlier in the set-up stage in the
trough. Wrapping a column starts from the bottom up, therefore start with the sheet that will be placed at the base.
• Step 2. Pour the epoxy onto the sheet and work the epoxy into the sheet by moving a
squeegee in the direction of the fibers, this process is illustrated in Figures A.27 and A.28. The epoxy that is used in this step is the same that was used for the undercoat described in the previous section.

88
• Step 3. After the top side is saturated with the epoxy, flip the sheet over and repeat the saturation process. Both sides of the sheet should be saturated, not dripping. The E-glass fibers will take on a transparent look as they become saturated and the carbon fibers will take on metallic sheen.
Figure A.27 Pour epoxy directly onto the fiber sheet.
Figure A.28 Move squeegee in the direction of the fibers to work in the epoxy.

89
Figure A.29 Utilize two people to unroll the FRP sheet.
• Step 4. Carefully roll the FRP sheet on a tube. For ease of handling, a piece of PVC piping can be used to wrap the fiber around. The wrap is then installed on the column by “unrolling” the FRP sheet. Figure A.29 illustrates the “unrolling” process. Note that the fibers become very slick when saturated and are difficult to handle. This procedure also requires at least two people. One person holds the initial end tight while the second one smoothes the fiber around the column. Both workers wear gloves at all times throughout this process.
• Step 5. Each manufacture lists their required development length for both horizontal and
vertical joints. At the location of an overlap, apply an additional layer of the epoxy matrix.
• Step 6. Use a metal paddle wheel, which is depicted in Figure A.30 to apply pressure to
the fiber sheets in the direction of their fibers as illustrated in Figure A.30. This roller allows air to escape as the fibers are pushed into the epoxy and impregnated.

90
• Step 7. Once all layers are in place, use the backside of a gloved hand to smooth out the
sheets in the direction of their fibers. Between the paddle wheel and the application process, some of the fibers may become misaligned and the excess material needs to be worked back to the end of the sheet to create a smooth, consistent surface.
SECTION 8: OVERCOAT APPLICATION Begin this stage when the fiber layers become tack free. If there is enough material left from the original batch of epoxy this can be used as the topcoat or, a new batch can be created should there not be enough left or, if the original batch is past its pot life. • Step 1. The overcoat application is the same as the undercoat application. Use rollers
with a 3/8 in. nap and roll the epoxy onto the column in the direction of the carbon fibers to prevent misalignment as seen in Figure A.31.
Figure A.30 Paddle wheel with a metal spline.
Figure A.31 Apply the overcoat with 3/8 in. nap roller in the direction of the fibers.

91
SECTION 9: CLEAN-UP
• Step 1. Clean all the tools as soon as the application process is completed. The mixer bit and roller handles can be cleaned with acetone only while the epoxy matrix is still wet. However, if the epoxy has dried it can only be cleaned by chipping it off.
• Step 2. For the mixing containers, let the unused epoxy set-up and harden. Within 24
hours, the containers can be turned over and the epoxy can be knocked out in large pieces as depicted in Figure A.32.
SECTION 10: TOPCOAT APPLICATION The final stage the FRP wrap installation procedure is to apply a topcoat for further protection against sunlight, fire, vandalism as well as improve aesthetics. All columns, with the exception of the site with product A, utilized topcoat T, a textured topcoat that gives the appearance of concrete, as their protective covering. The site that had Product A installed utilized a latex paint as the protective topcoat. • Step 1. Apply the topcoat over the fiber system. This can be applied after the overcoat
has cured at least 24 hours. Figure A.33 is an example of a cured column prior to receiving the protective topcoat. Figure A.34 shows a worker applying topcoat T with a long nap paint roller. The finished FRP wrap system is shown in Figure A.35.
Figure A.32 Let the epoxy set-up overnight and the hardened substance can be removed, allowing the containers to be used again.

92
Figure A.33 Completed glass fiber wrap.
Figure A.34 Roll on the topcoat with a long nap roller.
Figure A.35 Finished product.
93
APPENDIX B: CHLORIDE PROFILES FOR TS1-TS5
94
This Appendix contains the chloride profiles for all five test sites after the first year of
installation. Note that the figures are displayed in order from the top position to the low
position. A central guide is provided on each page to illustrate where each powder sample
was obtained. For the top and low positions, the central guide has a key that includes control
information. The control points refer to the second column at each test site that had baseline
data collected. At the conclusion of five years, a second round of samples will be collected
from these control columns. At that time, the chloride penetration between an unwrapped
column and a wrapped column can be compared. Recall that Position 2 around the perimeter
is the closest to moving traffic, with Position 4 being the farthest from traffic. Note that not
all test sites have data for Position 3 since there was a low collision wall that connected to the
column at Position 3 at some of the test sites.

Figure B.1 Chloride content at the Top position of C1 and the TS1 control.
0
0.05
0.1
0.15
0.2
Jun-02 Jun-03 Jun-04 Jun-05 Jun-06 Jun-07 Jun-08
Chlo
ride C
onte
nt b
y W
eigh
t, %
c.) Position T1 Test Dates
0
0.005
0.01
0.015
0.02
0.025
Jun-02 Jun-03 Jun-04 Jun-05 Jun-06 Jun-07 Jun-08
Chlo
ride C
onten
t by
Weig
ht, %
'
0
0.005
0.01
0.015
0.02
0.025
Jun-02 Jun-03 Jun-04 Jun-05 Jun-06 Jun-07 Jun-08
Chlor
ide C
onten
t by
Weig
ht, %
'
Test Dates
Test Dates d.) Position T4
b.) Position T3 a.) Position T2
0
0.02
0.04
0.06
0.08
0.1
0.12
0.14
Jun-02 Jun-03 Jun-04 Jun-05 Jun-06 Jun-07 Jun-08
Chlo
ride C
onten
t by
Weig
ht, %
'
Test Dates
L
M
T
0.5 in.
1.0 in.
1.5 in.
Control 0.5 in.
Control 1.0 in.
Control 1.5 in.
Key:
1
3
60°
60°
42
95
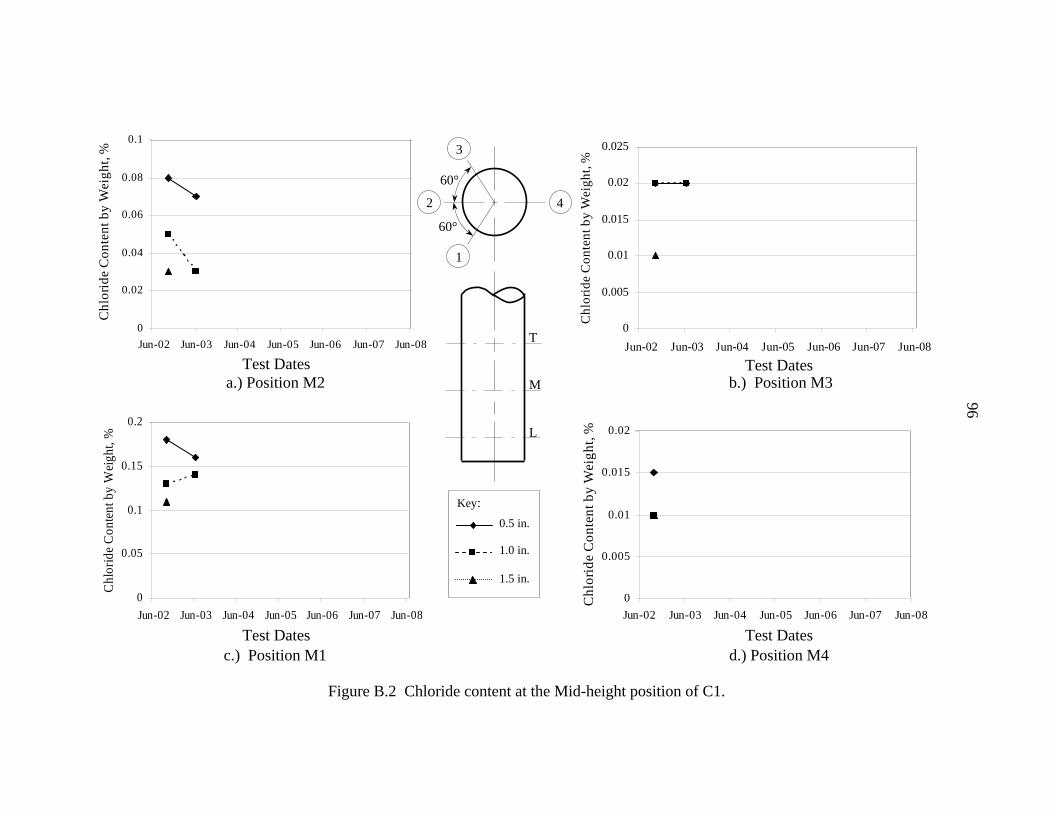
Figure B.2 Chloride content at the Mid-height position of C1.
0
0.05
0.1
0.15
0.2
Jun-02 Jun-03 Jun-04 Jun-05 Jun-06 Jun-07 Jun-08
Chl
orid
e C
onte
nt b
y W
eigh
t, %
0
0.02
0.04
0.06
0.08
0.1
Jun-02 Jun-03 Jun-04 Jun-05 Jun-06 Jun-07 Jun-08
Chl
orid
e C
onte
nt b
y W
eigh
t, %
0
0.005
0.01
0.015
0.02
0.025
Jun-02 Jun-03 Jun-04 Jun-05 Jun-06 Jun-07 Jun-08
Chl
orid
e C
onte
nt b
y W
eigh
t, %
0
0.005
0.01
0.015
0.02
Jun-02 Jun-03 Jun-04 Jun-05 Jun-06 Jun-07 Jun-08
Chl
orid
e C
onte
nt b
y W
eigh
t, %
0.5 in.
1.0 in.
1.5 in.
Key:
L
M
T
1
3
60°
60°
42
c.) Position M1
b.) Position M3
d.) Position M4
a.) Position M2
Test Dates
Test Dates Test Dates
Test Dates
96

Figure B.3 Chloride content at the Low position of C1 and the TS1 control.
0
0.02
0.04
0.06
0.08
0.1
0.12
0.14
0.16
Jun-02 Jun-03 Jun-04 Jun-05 Jun-06 Jun-07 Jun-08
Chl
orid
e C
onte
nt b
y W
eigh
t, %
'
0
0.01
0.02
0.03
0.04
0.05
0.06
0.07
0.08
0.09
Jun-02 Jun-03 Jun-04 Jun-05 Jun-06 Jun-07 Jun-08
Chlo
ride
Cont
ent b
y W
eigh
t, %
'
0
0.01
0.02
0.03
0.04
0.05
Jun-02 Jun-03 Jun-04 Jun-05 Jun-06 Jun-07 Jun-08
Chlo
ride C
onte
nt b
y W
eigh
t, %
'0
0.005
0.01
0.015
0.02
0.025
0.03
0.035
Jun-02 Jun-03 Jun-04 Jun-05 Jun-06 Jun-07 Jun-08
Chlo
ride C
onte
nt b
y W
eight
, %
'
L
M
T
0.5 in.
1.0 in.
1.5 in.
Control 0.5 in.
Control 1.0 in.
Control 1.5 in.
Key:
1
3
60°
60°
42
d.) Position L4
Test Dates
Test Dates
Test Dates
c.) Position L1
a.) Position L2 b.) Position L3
Test Dates
97
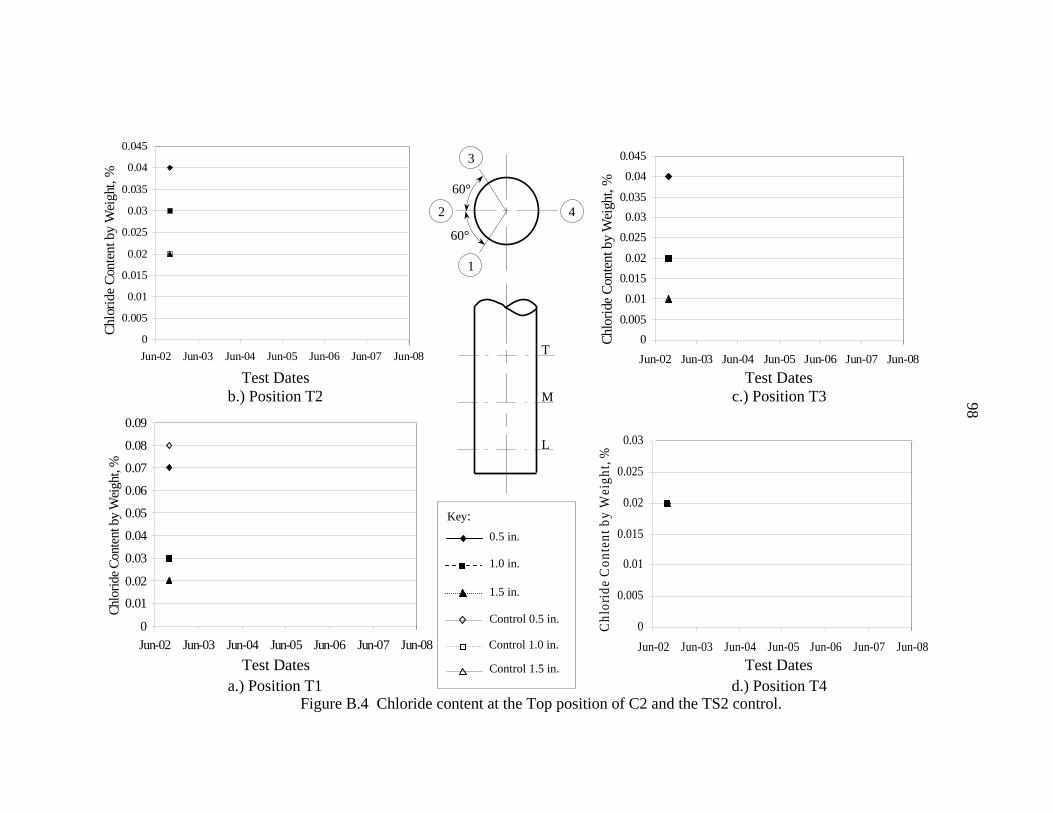
0
0.01
0.02
0.03
0.04
0.05
0.06
0.07
0.08
0.09
Jun-02 Jun-03 Jun-04 Jun-05 Jun-06 Jun-07 Jun-08
Chlo
ride C
onte
nt b
y W
eight
, % '
00.005
0.01
0.0150.02
0.025
0.030.035
0.04
0.045
Jun-02 Jun-03 Jun-04 Jun-05 Jun-06 Jun-07 Jun-08
Chlo
ride C
onten
t by
Wei
ght,
%
'
0
0.005
0.01
0.015
0.02
0.025
0.03
0.035
0.04
0.045
Jun-02 Jun-03 Jun-04 Jun-05 Jun-06 Jun-07 Jun-08
Chlo
ride
Cont
ent b
y W
eigh
t, %
'
Figure B.4 Chloride content at the Top position of C2 and the TS2 control.
Test Dates b.) Position T2
L
M
T
0.5 in.
1.0 in.
1.5 in.
Control 0.5 in.
Control 1.0 in.
Control 1.5 in.
Key:
1
3
60°
60°
42
0
0.005
0.01
0.015
0.02
0.025
0.03
Jun-02 Jun-03 Jun-04 Jun-05 Jun-06 Jun-07 Jun-08
Chl
orid
e C
onte
nt b
y W
eigh
t, %
a.) Position T1 Test Dates
c.) Position T3 Test Dates
d.) Position T4 Test Dates
98

99
0
0.01
0.02
0.03
0.04
0.05
0.06
0.07
0.08
Jun-02 Jun-03 Jun-04 Jun-05 Jun-06 Jun-07 Jun-08
Chlo
ride C
onte
nt b
y W
eigh
t, %
'
0
0.01
0.02
0.03
0.04
0.05
Jun-02 Jun-03 Jun-04 Jun-05 Jun-06 Jun-07 Jun-08
Chlo
ride
Cont
ent b
y W
eigh
t, %
Figure B.5 Chloride content at the Mid-height position of C2.
0.5 in.
1.0 in.
1.5 in.
Key:
L
M
T
1
3
60°
60°
42
0
0.005
0.01
0.015
0.02
0.025
0.03
0.035
Jun-02 Jun-03 Jun-04 Jun-05 Jun-06 Jun-07 Jun-08
Chl
orid
e C
onte
nt b
y W
eigh
t, %
0
0.005
0.01
0.015
0.02
0.025
0.03
0.035
Jun-02 Jun-03 Jun-04 Jun-05 Jun-06 Jun-07 Jun-08
Chl
orid
e C
onte
nt b
y W
eigh
t, %
Test Dates
Test Dates
Test Dates
Test Dates a.) Position M2 b.) Position M3
d.) Position M4 c.) Position M1

00.010.020.030.040.050.060.070.080.090.1
Jun-02 Jun-03 Jun-04 Jun-05 Jun-06 Jun-07 Jun-08
Chlo
ride C
onte
nt b
y W
eigh
t, %
a.) Position L2
b.) Position L3
d.) Position L4 c.) Position L1
0
0.01
0.02
0.03
0.04
0.05
0.06
0.07
0.08
Jun-02 Jun-03 Jun-04 Jun-05 Jun-06 Jun-07 Jun-08
Chl
orid
e C
onte
nt b
y W
eigh
t, %
0
0.005
0.01
0.015
0.02
0.025
0.03
0.035
Jun-02 Jun-03 Jun-04 Jun-05 Jun-06 Jun-07 Jun-08
Chl
orid
e C
onte
nt b
y W
eigh
t, %
0
0.004
0.008
0.012
0.016
0.02
0.024
Jun-02 Jun-03 Jun-04 Jun-05 Jun-06 Jun-07 Jun-08
Chlo
ride C
onten
t by
Wei
ght,
%
'
L
M
T
0.5 in.
1.0 in.
1.5 in.
Control 0.5 in.
Control 1.0 in.
Control 1.5 in.
Key:
1
3
60°
60°
42
Test Dates Test Dates
Test Dates Test Dates
Figure B.6 Chloride content at the Low position of C2 and the TS2 control.
100

0
0.005
0.01
0.015
0.02
0.025
0.03
0.035
0.04
0.045
Jun-02 Jun-03 Jun-04 Jun-05 Jun-06 Jun-07 Jun-08C
hlor
ide
Con
tent
by
Wei
ght,
%
'
0
0.01
0.02
0.03
0.04
0.05
0.06
Jun-02 Jun-03 Jun-04 Jun-05 Jun-06 Jun-07 Jun-08
Chl
orid
e Co
nten
t by
Wei
ght,
%
0.000
0.050
0.100
0.150
0.200
0.250
Jun-02 Jun-03 Jun-04 Jun-05 Jun-06 Jun-07 Jun-08
Chl
orid
e C
onte
nt b
y W
eigh
t, %
0
0.02
0.04
0.06
0.08
0.1
0.12
Jun-02 Jun-03 Jun-04 Jun-05 Jun-06 Jun-07 Jun-08
Chl
orid
e C
onte
nt b
y W
eigh
t, %
Figure B.7 Chloride content at the Top position of C3 and the TS3 control.
c.) Position T1 d.) Position T4
b.) Position T3 a.) Position T2
0.5 in.
1.0 in.
1.5 in.
Control 0.5 in.
Control 1.0 in.
Control 1.5 in.
Key:
L
M
T
60°
1
2
3
4
Test Dates Test Dates
Test Dates Test Dates
101
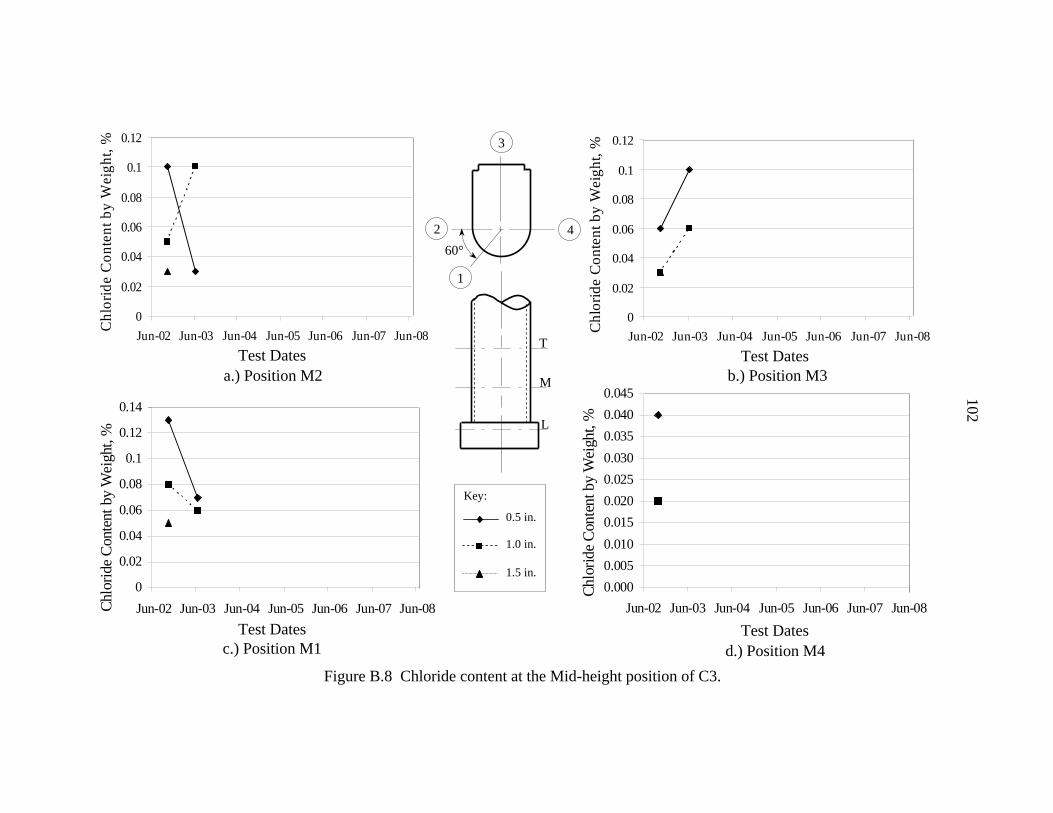
0.0000.0050.0100.0150.0200.0250.0300.0350.0400.045
Jun-02 Jun-03 Jun-04 Jun-05 Jun-06 Jun-07 Jun-08Ch
lorid
e Con
tent
by
Wei
ght,
%
'
0
0.02
0.04
0.06
0.08
0.1
0.12
0.14
Jun-02 Jun-03 Jun-04 Jun-05 Jun-06 Jun-07 Jun-08Chlo
ride C
onte
nt b
y W
eigh
t, %
'
0
0.02
0.04
0.06
0.08
0.1
0.12
Jun-02 Jun-03 Jun-04 Jun-05 Jun-06 Jun-07 Jun-08
Chl
orid
e C
onte
nt b
y W
eigh
t, %
Figure B.8 Chloride content at the Mid-height position of C3.
c.) Position M1 d.) Position M4
b.) Position M3 a.) Position M2
0
0.02
0.04
0.06
0.08
0.1
0.12
Jun-02 Jun-03 Jun-04 Jun-05 Jun-06 Jun-07 Jun-08Chl
orid
e C
onte
nt b
y W
eigh
t, %
Test Dates Test Dates
Test Dates Test Dates
0.5 in.
1.0 in.
1.5 in.
Key:
L
M
T
60°
1
2
3
4
102

0
0.005
0.01
0.015
0.02
0.025
0.03
0.035
Jun-02 Jun-03 Jun-04 Jun-05 Jun-06 Jun-07 Jun-08
Chlo
ride
Cont
ent b
y W
eigh
t, %
'
0
0.01
0.02
0.03
0.04
0.05
0.06
Jun-02 Jun-03 Jun-04 Jun-05 Jun-06 Jun-07 Jun-08Chlo
ride C
onte
nt b
y W
eigh
t, %
'
0.000
0.020
0.040
0.060
0.080
0.100
0.120
Jun-02 Jun-03 Jun-04 Jun-05 Jun-06 Jun-07 Jun-08
Chlo
ride
Con
tent
by
Wei
ght,
%
'
c.) Position L1 d.) Position L4
b.) Position L3 a.) Position L2
0
0.02
0.04
0.06
0.08
0.1
0.12
Jun-02 Jun-03 Jun-04 Jun-05 Jun-06 Jun-07 Jun-08
Chl
orid
e C
onte
nt b
y W
eigh
t, %
0.5 in.
1.0 in.
1.5 in.
Control 0.5 in.
Control 1.0 in.
Control 1.5 in.
Key:
L
M
T
60°
1
2
3
4
Test Dates Test Dates
Test Dates Test Dates
Figure B.9 Chloride content at the Low position of C3 and the TS3 control.
103

0
0.02
0.04
0.06
0.08
0.1
Jun-02 Jun-03 Jun-04 Jun-05 Jun-06 Jun-07 Jun-08
Chl
orid
e C
onte
nt b
y W
eigh
t, %
0
0.01
0.02
0.03
0.04
0.05
0.06
0.07
0.08
Jun-02 Jun-03 Jun-04 Jun-05 Jun-06 Jun-07 Jun-08
Chl
orid
e C
onte
nt b
y W
eigh
t, %
L
M
T
0.5 in.
1.0 in.
1.5 in.
Control 0.5 in.
Control 1.0 in.
Control 1.5 in.
Key:
1
3
60°
60°
42
0
0.01
0.02
0.03
0.04
0.05
0.06
0.07
Jun-02 Jun-03 Jun-04 Jun-05 Jun-06 Jun-07 Jun-08
Chl
orid
e C
onte
nt b
y W
eigh
t, %
0
0.005
0.01
0.015
0.02
0.025
Jun-02 Jun-03 Jun-04 Jun-05 Jun-06 Jun-07 Jun-08Chl
orid
e C
onte
nt b
y W
eigh
t, %
c.) Position T1 Test Dates Test Dates
a.) Position T2 Test Dates
b.) Position T3 Test Dates
d.) Position T4
Figure B.10 Chloride content at the Top position of C4 and the TS4 control.
104

Figure B.11 Chloride content at the Mid-height position of C4.
c.) Position M1
0
0.02
0.04
0.06
0.08
0.1
0.12
Jun-02 Jun-03 Jun-04 Jun-05 Jun-06 Jun-07 Jun-08
Chl
orid
e C
onte
nt b
y W
eigh
t, %
Test Dates d.) Position M4
0
0.005
0.01
0.015
0.02
0.025
0.03
0.035
Jun-02 Jun-03 Jun-04 Jun-05 Jun-06 Jun-07 Jun-08C
hlor
ide
Con
tent
by
Wei
ght,
%
Test Dates
a.) Position M2
0
0.02
0.04
0.06
0.08
0.1
0.12
Jun-02 Jun-03 Jun-04 Jun-05 Jun-06 Jun-07 Jun-08
Chl
orid
e C
onte
nt b
y W
eigh
t, %
Test Dates b.) Position M3
0
0.01
0.02
0.03
0.04
0.05
0.06
Jun-02 Jun-03 Jun-04 Jun-05 Jun-06 Jun-07 Jun-08
Chlo
ride
Cont
ent b
y W
eigh
t, %
Test Dates
0.5 in.
1.0 in.
1.5 in.
Key:
L
M
T
1
3
60°
60° 42
105
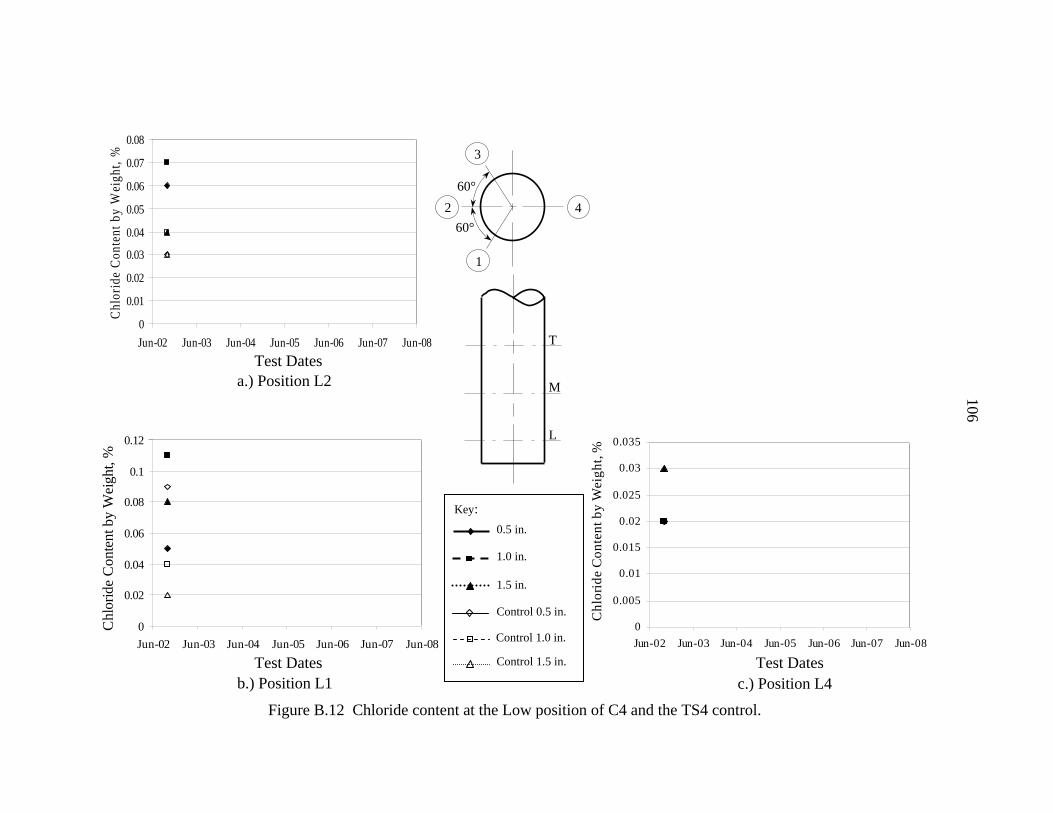
c.) Position L4 b.) Position L1
a.) Position L2
0
0.02
0.04
0.06
0.08
0.1
0.12
Jun-02 Jun-03 Jun-04 Jun-05 Jun-06 Jun-07 Jun-08
Chl
orid
e C
onte
nt b
y W
eigh
t, %
0
0.01
0.02
0.03
0.04
0.05
0.06
0.07
0.08
Jun-02 Jun-03 Jun-04 Jun-05 Jun-06 Jun-07 Jun-08
Chlo
ride
Cont
ent b
y W
eigh
t, %
0
0.005
0.01
0.015
0.02
0.025
0.03
0.035
Jun-02 Jun-03 Jun-04 Jun-05 Jun-06 Jun-07 Jun-08
Chl
orid
e C
onte
nt b
y W
eigh
t, %
Test Dates
Test Dates Test Dates
L
M
T
0.5 in.
1.0 in.
1.5 in.
Control 0.5 in.
Control 1.0 in.
Control 1.5 in.
Key:
1
3
60°
60° 42
Figure B.12 Chloride content at the Low position of C4 and the TS4 control.
106

0.000
0.005
0.010
0.015
0.020
0.025
Jun-02 Jun-03 Jun-04 Jun-05 Jun-06 Jun-07 Jun-08Ch
loride
Con
tent b
y Weig
ht, %
'
0
0.02
0.04
0.06
0.08
0.1
Jun-02 Jun-03 Jun-04 Jun-05 Jun-06 Jun-07 Jun-08
T D
Chl
orid
e C
onte
nt b
y W
eigh
t, %
0
0.01
0.02
0.03
0.04
0.05
0.06
Jun-02 Jun-03 Jun-04 Jun-05 Jun-06 Jun-07 Jun-08
Chl
orid
e C
onte
nt b
y W
eigh
t, %
c.) Position T1 d.) Position T4
b.) Position T3 a.) Position T2
0
0.01
0.02
0.03
0.04
0.05
0.06
0.07
Jun-02 Jun-03 Jun-04 Jun-05 Jun-06 Jun-07 Jun-08
Chlo
ride
Cont
ent b
y W
eigh
t, %
'
L
M
T
0.5 in.
1.0 in.
1.5 in.
Control 0.5 in.
Control 1.0 in.
Control 1.5 in.
Key:
1
3
60°
60°
42
Test Dates Test Dates
Test Dates Test Dates
Figure B.13 Chloride content at the Top position of C5 and the TS5 control.
107
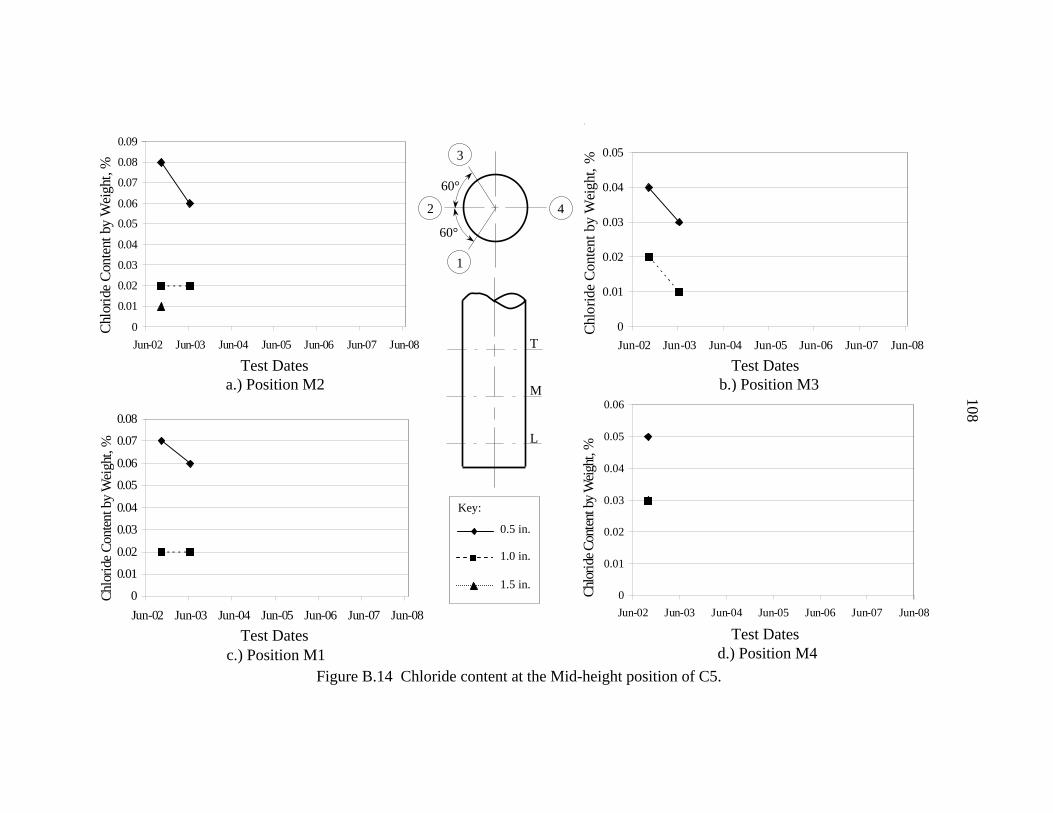
0
0.01
0.02
0.03
0.04
0.05
0.06
0.07
0.08
0.09
Jun-02 Jun-03 Jun-04 Jun-05 Jun-06 Jun-07 Jun-08
Chlo
ride C
onte
nt b
y W
eigh
t, %
'
0
0.01
0.02
0.03
0.04
0.05
0.06
0.07
0.08
Jun-02 Jun-03 Jun-04 Jun-05 Jun-06 Jun-07 Jun-08
Chlo
ride C
onten
t by
Wei
ght,
%
'
Figure B.14 Chloride content at the Mid-height position of C5. c.) Position M1 d.) Position M4
b.) Position M3 a.) Position M2
0
0.01
0.02
0.03
0.04
0.05
Jun-02 Jun-03 Jun-04 Jun-05 Jun-06 Jun-07 Jun-08
Chlo
ride
Cont
ent b
y W
eigh
t, %
'0
0.01
0.02
0.03
0.04
0.05
0.06
Jun-02 Jun-03 Jun-04 Jun-05 Jun-06 Jun-07 Jun-08
Chlo
ride C
onten
t by W
eight
, %
'
0.5 in.
1.0 in.
1.5 in.
Key:
L
M
T
1
3
60°
60°
42
Test Dates Test Dates
Test Dates Test Dates
108
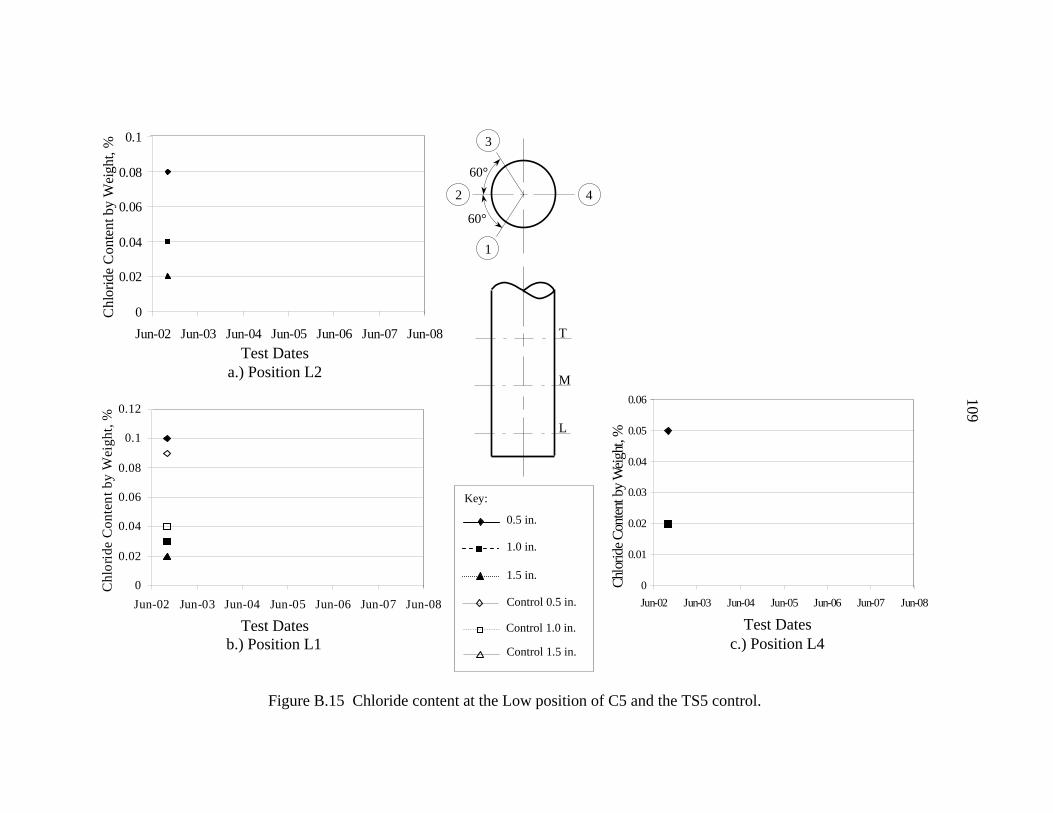
0
0.01
0.02
0.03
0.04
0.05
0.06
Jun-02 Jun-03 Jun-04 Jun-05 Jun-06 Jun-07 Jun-08Ch
lorid
e Con
tent b
y Weig
ht, %
'
0
0.02
0.04
0.06
0.08
0.1
0.12
Jun-02 Jun-03 Jun-04 Jun-05 Jun-06 Jun-07 Jun-08
T D
Chl
orid
e C
onte
nt b
y W
eigh
t, %
b.) Position L1 c.) Position L4
a.) Position L2
Test Dates
0
0.02
0.04
0.06
0.08
0.1
Jun-02 Jun-03 Jun-04 Jun-05 Jun-06 Jun-07 Jun-08
Chl
orid
e C
onte
nt b
y W
eigh
t, %
L
M
T
0.5 in.
1.0 in.
1.5 in.
Control 0.5 in.
Control 1.0 in.
Control 1.5 in.
Key:
1
3
60°
60°
42
Test Dates
Test Dates
Figure B.15 Chloride content at the Low position of C5 and the TS5 control.
109

111
APPENDIX C: FUTURE TEST DATES

112
Table C.1 Tentative test dates for field work.
Test # Date Baseline October - 02
1 June - 032 June - 043 June - 054 June - 065 June - 07
Note: All five test sites are to be analyzed once a year, preferably in June, which are the
lightened test dates displayed in Table C.1. The last test, #5, should have samples
taken from the control column at each test site in addition to obtaining samples from
the wrapped column.
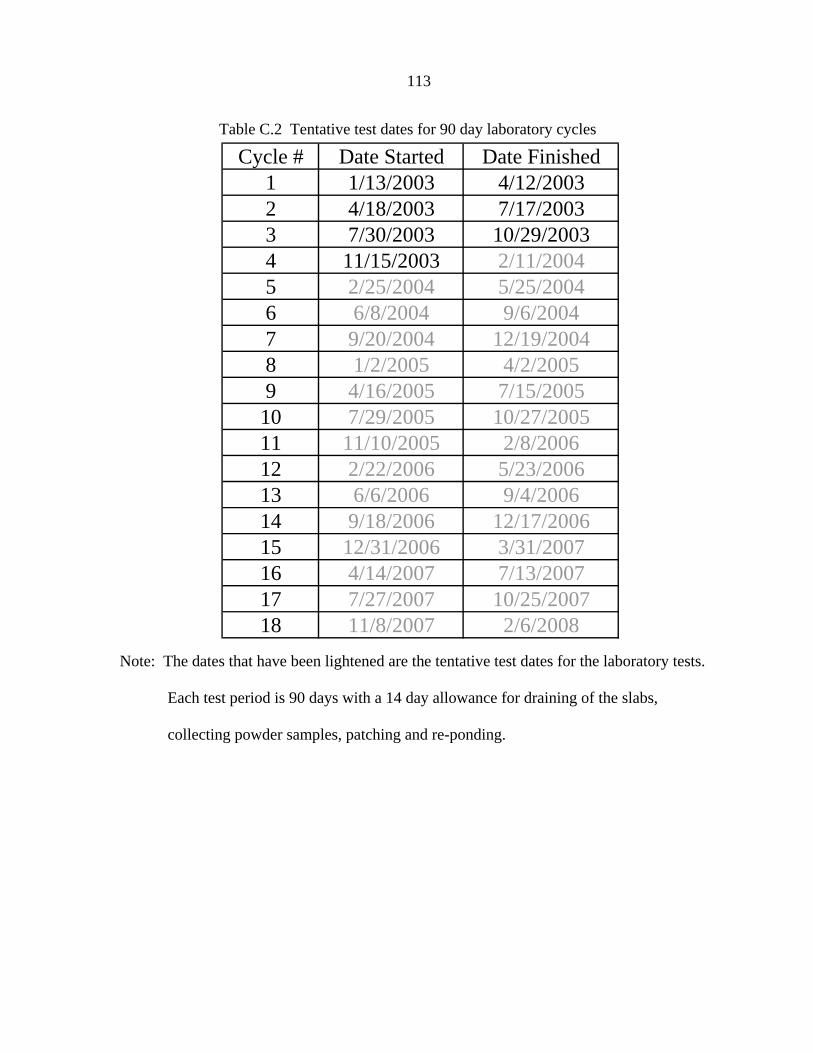
113
Cycle # Date Started Date Finished1 1/13/2003 4/12/20032 4/18/2003 7/17/20033 7/30/2003 10/29/20034 11/15/2003 2/11/20045 2/25/2004 5/25/20046 6/8/2004 9/6/20047 9/20/2004 12/19/20048 1/2/2005 4/2/20059 4/16/2005 7/15/2005
10 7/29/2005 10/27/200511 11/10/2005 2/8/200612 2/22/2006 5/23/200613 6/6/2006 9/4/200614 9/18/2006 12/17/200615 12/31/2006 3/31/200716 4/14/2007 7/13/200717 7/27/2007 10/25/200718 11/8/2007 2/6/2008
Table C.2 Tentative test dates for 90 day laboratory cycles
Note: The dates that have been lightened are the tentative test dates for the laboratory tests.
Each test period is 90 days with a 14 day allowance for draining of the slabs,
collecting powder samples, patching and re-ponding.
115
REFERENCES
(1.) Highway Deicing: Comparing Salt and Calcium Magnesium Acetate, Special Report
No. 235, Transportation Research Board, National Research Council, Washington, DC, 1991, 170 pp.
(2.) Weyers, R.E., “Service Life Model for Concrete Structures in Chloride Laden
Environments,” ACI Materials Journal, Vol. 95, No. 4, July 1998, pp. 445- 453. (3.) Broomfield, John P., Corrosion of Steel in Concrete: Understanding, Investigation
and Repair, St. Edmundsbury Press Limited, Bury St. Edmunds, Suffolk, Great Britain, 1997, 238 pp.
(4.) Daily, S.F. and K. Kendell, “Cathodic Protection for New Concrete,” Concrete
International, Vol. 21, No. 6, June 1999, pp. 63-68. (5.) American Association of State Highway and Transportation Officials (2000). “Standard Method of Test for Resistance of Concrete to Chloride Ion Penetration,” AASHTO Designation: T 259-80, Twentieth Edition, pp. 896-897. (6.) Alekseev, S.N., F.M. Ivanov, S. Modry and P. Schiessel, Durability of Reinforced
Concrete in Aggressive Media, A.A. Balkema Publishers, Brookfield, VT, 1993, 380 pp. (7.) Cardell, C. F. Delalieux, K. Roumpopoulos, A. Moropoulou, F. Auger and R. Van
Grieken, “Salt-Induced Decay in Calcareous Stone Monuments and Buildings in a Marine Environment in SW France,” Construction and Building MATERIALS, Vol. 17, No. 3, 2003, pp. 165-179.
(8.) Buenfeld, N.R. , G.K. Glass, A.M. Hassanein and J. Zhang, “Chloride Transport in
Concrete Subjected to Electric Field,” Journal of Materials in Civil Engineering, Vol. 10, No. 4, November 1998, pp. 220-228.
(9.) Marusin, S.L., “Evaluating Sealers,” Concrete International, Vol. 11, No. 11,
November 1989, pp. 79-81. (10.) Tanikawa, S, R.N. Swamy and T. Laiw, “Performance Characteristics of an Acrylic
Rubber Protective Coating System for Concrete Durability in a Marine Environment,” Proceedings of theThird CANMET/ACI International Conference on Performance of Concrete in a Marine Environment, St. Andrews by-the-Sea, New Brunswick, Canada, August 4-9 1996, pp. 275-294.
(11.) Beaudette, M.R., “Chloride Extraction and Re-alkalization” (2003) www.vector-
corrosion.com/CEandRealk.html (Date Accessed: April 3, 2003).

116
(12.) Clemeña, Jerry and Donald Jackson, “Trial Applications of Electrochemical Chloride Extraction on Concrete Bridge Components in Virginia,” (May 2000) www.virginiadot.org/vtrc/briefs/00-r18rb/ECE_Flash.htm (Date Accessed: August 6, 2003).
(13.) Velivasakis, E.E., S. K. Henriksen and D.W. Whitmore, “Halting Corrosion by
Chloride Extraction and Realkalization,” Concrete International, Vol. 19, No. 12, December 1997, pp. 39-45.
(14.) Kidd, J.A., “The Use of Dual Laminates in the Chemical Industry,” Managing
Corrosion with Plastics, Vol. 4, 1979, pp. 62-67. (15.) Mirmiran, Amir, Mohsen Kargahi, Michel Samaan and Mohsen Shahawy, “Composite FRP-Concrete Column with Bi-Directional External Reinforcement,” Fiber Composites in Infrastructure: Proceedings of the First International Conference on Composites in Infrastructure, Tucson, Arizona, January 17, 1996, pp. 888-903. (16.) Pantazopoulou, S.J., J.F. Bonacci, S. Sheikh, M.D.A.Thomas and N. Hearn, “Repair
of Corrosion-Damaged Columns with FRP Wraps,” Journal of Composites for Construction, Vol. 5, No. 1, February 2001, pp. 3-11.
(17.) Cassity, P.A., “FRP Decks Help Control Corrosion,” Better Bridges, Vol. 71, No. 5,
May 2001, pp. 46-48. (18.) Soudki, K.A. and T.G. Sherwood, “Behaviour of Reinforced Concrete Beams
Strengthened with Carbon Fibre Reinforced Polymer Laminates Subjected to Corrosion Damage,” Canadian Journal of Civil Engineering, Vol. 27, 2000, pp. 1005-1010.
(19.) Fuentes, L.A., Implementation of Composite Wrapping Systems on Reinforced
Concrete Structures Exposed to a Corrosive Laboratory Environment, Masters thesis, University of Texas, Austin, May 1999.
(20.) Lee, C., J.F. Bonacci, M.D.A. Thomas, M.Maalej, S. Khajehpour and N. Hearn,
“Accelerated Corrosion and Repair of Reinforced Concrete Columns Using Carbon Fibre Reinforced Polymer Sheets,” Canadian Journal of Civil Engineering, Vol. 27, 2000, pp. 941-948.
(21.) Teng, Ming-Hung, E. D. Sotelino and W. Chen, “Performance Evaluation of Reinforced
Concrete Bridge Columns Wrapped with Fiber Reinforced Polymers,” Journal of Composites for Construction, Vol. 7, No. 2, May 1, 2003, pp. 83-92.
(22.) Scarth, J. and J. Keble, “Desalination and Column Wrapping of M6 Cumbria Bridges:
Aramid Fibre,” Structural Faults and Repair 2003 10th International Conference and Exhibition, London , UK, July 1-3 2003.
117
(23.) Wootton, Issac A., Lisa K. Spainhour and Nur Yazdani, “Corrosion of Steel Reinforcement in Carbon Fiber-Reinforced Polymer Wrapped concrete Cylinders,” Journal of Composites for Construction, Vol. 7, No. 4, November 2003, pp. 339-347. (24.) Sen, Rajan, “Durability of Advanced Composites in a Marine Environment,”
Proceedings of the International Conference on FRP Composites in Civil Engineering: FRP Composites in Civil Engineering 2001 Volume 1, Hong Kong, China, December 12-15 2001, pp. 1509-1516.
(25.) Halstead, J. Preston, Jerome S. O’Connor, Khuong Luu, Screenivas Alampalli and
Amy Minser, “Fiber-Reinforced Polymer Wrapping of Deteriorated Concrete Columns,” Transportation Research Board, No. 1696, Vol. 2, National Research Council, Washington, DC., 2000, pp. 124-130.
(26.) Green, M.F., L.A. Bisby, Y. Beaudoin and P. Labossiere, “Effect of Freeze-Thaw
cycles on the Bond Durability Between Fibre Reinforced Polymer Plate Reinforcement and Concrete,” Canadian Journal of Civil Engineering, Vol. 27, 2000, pp. 949-959.
(27.) Bisby, L.A. and Mark F. Green, “Resistance to Freezing and Thawing of Fiber- Reinforced Polymer-Concrete Bond,” ACI Structural Journal, Vol. 99, No. 2, April 2002, pp. 215-223. (28.) Malvar, L.J., N.R. Joshi, J.A. Beran and T. Novinson, “Environmental Effects on the
Short-Term Bond of Carbon Fiber-Reinforced Polymer (CFRP) Composites,” Journal of Composites for Construction, Vol. 7, No. 1, February 2003, pp. 58-63.
(29.) Daily, S.F. and K. Kendell, “Cathodic Protection for New Concrete,” Concrete
International, Vol. 21, No. 6, June 1999, pp. 63-68. (30.) American Society for Testing Materials, “Standard Test Method for Water-Soluble Chloride in Mortar and Concrete,” ASTM Designation: C1218/C 1218M-99, West Conshohocken, PA, Vol. 4.02, 2000, pp. 645-647. (31.) Mejlbro, Leif and Ervin Poulsen, “On A Model of Chloride Ingress into Concrete
Exposed to De-Icing Salts Containing Chloride,” International Rilem Workshop of Testing and Modeling Chloride Ingress into Concrete, Paris, France, 2000, pp. 337- 354.

119
ACKNOWLEDGEMENTS
The investigation presented in this report was conducted by the Bridge Engineering
Center at Iowa State University and was sponsored by the Highway Division of the Iowa
Department of Transportation and the Iowa Highway Research Board under Research
Project TR-428.
The authors wish to thank each of the five manufacturers that generously donated
their FRP wrap systems and the topcoats. Special thanks go to Pat Humphres who came to
Iowa and demonstrated how to install the wrap system for the company he represented.
The experimental portion of this project would not have been possible without the
help of five individuals: Doug Wood, Manger of the Structural Engineering Laboratory, Scott
Schlorholtz, Scientist in the Material Analysis Research Laboratory, Mike Todsen, Special
Projects Engineer in the Bridges and Structures Division of the Iowa DOT, Jim Van Sickle of
the Iowa DOT Maintenance Crew and Kris Mach, Manager of the Environmental
Engineering Laboratory. We would also like to thank the following Civil Engineering
undergraduates for all their assistance in the laboratory and field: Ben Dreier, Michelle
Heikens, Riley Smith, Toni Tabbert, Curtis Holub, Ben Woline, Nels Overgaard and Brian
Williams.