Embed Size (px)
Citation preview

Effective Strategies For Internal Outsourcing and Offshoring of Business Services: An Empirical Investigation
O. Zeynep Aksin1 and Andrea Masini23
01 April 2005
=================================================1 College of Administrative Sciences and Economics, Koc University, [email protected] 2 Corresponding author: Department of Operations and Technology Management, London Business School,
[email protected] 3 Author names are listed in alphabetical order.
Abstract
The growing pressure to reduce costs and improve efficiency induces many
organizations to undertake shared services initiatives. This consolidation and streamlining of
common business functions is also known as insourcing, in-house services, business services,
or staff services. While adoption of a shared service structure is viewed by many as an
appropriate strategy to pursue, most companies still struggle to devise optimal strategies and
to generate adequate returns on investments for their projects, because none of the approaches
that are commonly adopted is recognized as universally effective.
This paper builds upon the “structure-environment” perspective to uncover
configurations of Shared Services organizations and to explain why and under what
circumstances some of these configurations exhibit superior results. The conceptual model
proposed challenges the notion of “best practice” and suggests that the effectiveness of a
shared services project depends on the degree of complementarity between the “needs”
arising from the environment in which a company operates and the specific capabilities
developed to address these needs. The theoretical findings are validated empirically through
the analysis of a large sample of European firms that recently undertook initiatives in this
domain. Four dominant configurations of shared service organizations are uncovered, and
their relationship to performance is explored.
Keywords: shared services, offshoring, strategy, empirical analysis

1
1 INTRODUCTION
Increasing competition, the progressive globalization of the economy caused by the
lowering of trade barriers, and the emergence of new market players that benefit from
significant labor cost advantages is pressuring western firms to devise strategies to reduce
costs and improve the efficiency of operations. Among the various alternatives the
development of shared services (SS) is increasingly regarded as a potential solution to this
problem and is being progressively adopted by a growing number of firms.
Shared Services is the strategy of standardizing, streamlining, and consolidating
common business functions and processes in an organization, in order to improve efficiency
and effectiveness with both cost reduction and overall profitability in mind. According to
Bywater (2001) it is: “The co-location of internal services which are removed from the
business to whom they provide the service-internal outsourcing”. In a report by the
Economist Intelligence Unit (1998), shared services are described as: “The apportioning of
standardized and consolidated business functions or processes with a service mentality to
ensure effective operation”. “Shared services-also known as insourcing, in-house services,
business services, or staff services-is more than centralizing routine transactions: the idea is to
leverage best practices, specialized knowledge, and technology to create satisfied internal and
external customers” (The Conference Board, 1998). According to Goold et al. (2001) it is one
of the roles that corporate headquarters can take.
In general, it is believed that moving to a shared service organization (SSO) helps
companies save costs, increase available time for value-added activities in line positions,
improve measurement capability, and achieve better service quality due to a more focused
management attention. American Express and Citigroup report cumulative cost savings three
years after adoption worth more than half a billion and 350 million US dollars respectively.
Average cost savings of 25-30% are not unusual after adopting a shared service structure

2
(Quinn et al. 2000). Not surprisingly, an increasing number of companies consider adopting
SSOs. According to a study by Bywater (2001) over 90% of Fortune 500 and Europe 500
companies have already or are planning to implement SSOs.
Shared service organizations are seen by some as the step taken before outsourcing, and
by others as the alternative to corporate outsourcing. Sometimes the shared service
organization is a third party owned business unit. Thus, in the current debate on business
process outsourcing practices and offshoring of services, understanding shared service
structures and their performance implications will constitute an important piece. To answer
questions about whether to outsource or not, companies need to understand appropriate in-
house solutions better. Similarly, the question of offshoring requires a good understanding of
service structures that guarantee high performance.
Yet, in spite of this rising interest, there is still some uncertainty about the real benefits
of shared services. For instance, of the companies that participated in the Bywater study, 3%
are reported to have implemented a shared services strategy, and then rejected it. This
suggests that while rarely reported, shared service implementations can also fail. According to
Steven Kerr from General Electric (Quinn et al. 2000): “Shared services, like outsourcing, is
not a panacea for all functions. Sometimes it works and sometimes it is not the right strategy -
especially if it has been forced upon reluctant business units. It is not a hammer!”
By the same token, there is also uncertainty about the most appropriate ways to
conceive, implement and manage shared services organizations. A number of alternative - and
often antithetical, approaches to SSOs have been proposed and implemented. As a result,
existing SSOs differ among each other with respect to their overall objectives, their functional
scope and even with respect to the specific business model adopted, which span from purely
introverted approaches to more extroverted ones that privilege customer service over cost
reduction (Citigroup, 2002).
3
Yet, none of these models has proven to be generally superior. The blurred picture on
the practice side is also symptomatic of a knowledge gap at the theoretical level. To our
knowledge, there is no academic study to date that examines the link between strategy,
implementation and resulting performance in SSOs. Claims are mostly based on conceptual
arguments, perhaps supported by anecdotal evidence that associates certain variables and
certain performance measures. However, an empirical justification of a link between SSO
strategies and performance is lacking. Given the prevalence of this organizational structure
and the large benefits associated with its success, understanding how firms organize their
SSOs and determining superior configurations is a critical issue for businesses at large.
Researchers have also generally overlooked the question of whether different SS
strategies display the same degree of effectiveness for firms that have different operational
and organizational needs. This is an important gap, because recent studies that revisited the
relationships between strategy, organizational structure and management processes have
challenged the notion of “single best practice” (Atuahene-Gima and Ko, 2001) and suggested
that similar strategies, organizational forms and – by analogy, similar SS models, may
produce different results in different environmental settings (Brown, 1994; Brown and Magill,
1998). In summary, a review of the extant literature suggests that there is a need for a sounder
characterization of the predominant SSO models (beyond the simple stylized classifications
proposed by industry practitioners) and, also, of a better understanding of the relative
effectiveness of these models.
The objective of this paper is to fill this gap in the literature and to examine the
relationship between different SS strategies and the characteristics of environments in which
SSOs operate. Recognizing the need for exploratory research that shed light on the
predominant SS models and following the increasing interest received by organizational
gestalts (Hambrick, 1984; Miller, 87 and 90, Meyer et al. 1993) in the field of operations

4
strategy (Miller and Roth, 1994; Bensaou and Venkatraman, 1995; Dennis and Meredith
2000), we conduct a configurational analysis. That is, we seek to understand whether SSOs
organize themselves according to “internally consistent combinations of strategy,
organizational architecture and technology that provide superior performance in a given
environment” (Tidd and Hull, 2002, p. 7).
To this end, we adopt a deductive and theory-driven approach (Ketchen and Shook,
1996), which permits the development of testable frameworks while still maintaining enough
degrees of freedom to uncover “natural” configurations. Our contribution is twofold. First,
using data from the Citigroup Business Services Annual Survey of European Shared Services
2002 we identify strategic groups of companies that exhibit similarities with respect to their
SS operations and their environment (i.e. configurations of SSOs). Second we use the
proposed classification to explain performance differences across different companies in the
sample and to shed some light on the relationship between the characteristics of SSOs and
their business results.
The remainder of the paper is organized as follows. Section 2 discusses some of the
most common approaches to shared services and provides a theoretical background. A
stylized conceptual model is presented to uncover configurations based on the hypothesis that
– to improve performance – firms need to achieve a fit between their shared service needs and
their SS strategy. The variables that define SS needs and SS strategy are then introduced.
Section 3 describes the methodology and our overall analytical approach. Section 4 presents
and discusses the results. We first establish four different clusters of shared service
organizations, and subsequently illustrate the link between these clusters and organizational
performance. The paper ends with concluding remarks and a discussion of contributions,
limitations and directions for future research.

5
2 BACKGROUND AND LITERATURE REVIEW
2.1 Alternative Models for Shared Services Organizations
The diversity of organizational forms and management approaches observed in existing
shared service organizations is symptomatic of the many decisions managers face in setting-
up and running SSOs. These involve both the general objective and the scope of the SSO, the
business model adopted as well as the specific strategy followed for its implementation.
First and foremost, the motivations for establishing an SSO can be very different. For
instance, while for some companies the primary objective is cost cutting, others consider
service level improvement as the most important priority. Standardization of processes or
focusing on core capabilities are other common motivations. The functional scope can vary as
well. Whereas most SSOs start with the transactional and administrative side of the finance
and human resource functions, the scope of activities can also extend to information
technology, supply and support functions. It is possible for a SSO to encompass portions of
the professional and technical aspects of these functions as well. The Amherst Group Limited
and Solutia Inc. distinguish between transaction-intensive services and knowledge based
professional services (The Conference Board, 1998). Labeled as centers of scale and centers
of expertise respectively, these services are then managed and funded differently given their
differing strategies.
In addition to differences in functional scope and depth, there are also differences in the
business models adopted (Bywater, 2001; Citigroup, 2002): A more introspective approach
where the organization is treated as a cost center serving internal clients, or a more
extroverted one where the shared service organization is run as a customer-centric separate
business entity, in some cases also serving external clients as in the well known example of
Shell Services International. The Bywater (2001) study labels these two business models as
the incremental approach and the aggressive approach respectively. Quinn et al. (2000)
6
describe an evolution from a basic model to one of a separate business entity. A similar
spectrum of conservative, moderate, advanced SS strategies are suggested by Connell (1996).
Similarly, there is no general agreement about the most effective approaches to
implement a SSO, as one finds differences in implementation strategy as well as performance.
Existing SSOs exhibit differences with respect to their location (greenfield vs. brownfield),
size, technological infrastructure, and human resource practices. For instance, while most
claim that business potential is maximized with an aggressive approach that designs the SSO
as a separate business entity (The Conference Board 1998, Quinn et al. 2000, Bywater 2001,
Citigroup 2002), others argue that success requires a fit between strategy and implementation
(The Conference Board 1998, Economist Intelligence Unit 1998).
This diversity is clearly symptomatic of the fact that no superior SS model has yet been
identified. Indeed, a preliminary analysis conducted on the data set collected for this research
indicates a very weak direct relationship between specific managerial choices and
performance. For instance we find very limited support for the common claim that the
adoption of a customer-centric extroverted model leads to success in SSOs. Sometimes a
more introspective approach can result in better outcomes.
However, the fact that similar models have been applied in different contexts with very
different results suggests that the proposed dichotomy between introverted and customer-
centric approaches is not exhaustive. Combined with the observation that some choices are
clearly restricted by parameters outside the control of SSO management, this also suggests
that rather than looking for best models as such, managers should consider alternative SS
configurations in relation to the specific needs and constraints of their firm. Based on these
preliminary observations and supported by the contingency view in strategy we argue that
different types of environments call for different types of SSO structures and practices.
7
Testing this view requires an elaboration of common environments and common SSO models,
or in other words the identification of dominant SSO configurations.
2.2 A configurational approach to study SSOs
The notion of organizational configurations or gestalts (Miller and Friesen, 1977) is one
of the most well-established concepts in strategy research. According to Miller (1981, p5):
“Instead of looking at a few variables or at linear associations among such variables we
should be trying to find frequently recurring clusters of attributes or gestalts”. Conceptual
arguments for configurations and an overview of the early literature can be found in Miller
(1986) and Miller (1987).
While the notion of gestalts has gained increased recognition from a conceptual
standpoint, researchers have followed different approaches to study configurations, and they
have traditionally distinguished between conceptually established typologies (Hambrick,
1984) and empirically derived taxonomies (Hatten and Hatten, 1985).
Clustering approaches have been the primary method of investigation to establish
taxonomies and have also gained acceptance outside the strategy literature. They have for
example been used in operations management (Miller and Roth, 1994; Boyer et al.,1996;
Boyer et al., 2000; Dennis and Meredith, 2000; Verma and Young, 2000; Duray et al., 2000;
Kathuria, 2000; Jonsson, 2000; Diaz et al., 2000; Yeung et al., 2003) and information systems
(Segars and Grover, 1999; Lee et. al., 2004) settings.
In this paper, we also establish configurations empirically using cluster analysis, as in
Hambrick (1984), Bensaou and Venkatraman (1995). However, while most applications of
cluster analysis are exploratory in nature, and do not test a conceptual model – our work has
the distinguishing feature of combining the two approaches.
The point of departure of our analysis is the well-known theoretical perspective that -
for purposes of effectiveness, firms should deploy strategies or develop capabilities in
8
accordance with the requirements of the environment in which they operate. While it enjoys a
long history in management literature (Lawrence and Lorsch, 1967; Thompson, 1967), this
perspective has taken different conceptualizations in the various disciplines that it has -
directly or indirectly - influenced: in economics with the notion of complementarity (Milgrom
and Roberts, 1990), or in operation management, where both production systems (Keller et
al., 1974) and supply chains (Fisher, 1997) and supplier-buyer relationships (Bensaou and
Venkatraman, 1995) have been analyzed in relation to different environmental contingencies.
Building upon this perspective, we propose a conceptual model of fit that describes the
main decision variables in setting up a shared service organization vis à vis the most
important requirements that this organization must address (Figure 1). We suggests the
general hypothesis that in shared service organizations performance is given by the presence
of fit between environmental needs (i.e. factors that influence performance of an SSO not
controlled by the manager of a SSO) and the combination of specific SS strategic, tactical and
operational decisions made by the SSO manager. For sake of simplicity we refer to this set of
variables as ‘SS capabilities’.
Accordingly, to establish configurations we follow the two-stage procedure described in
Hambrick (1984) and Bensaou and Venkatraman (1995). In the first stage we cluster
organizations based on their shared service needs, and in the second stage, within each SS
needs group we cluster organizations based on their shared service capabilities.
----------------------------------
Figure 1 ABOUT HERE
----------------------------------
2.3 Environmental variables that define Shared Services needs
Shared service needs originate from the structural characteristics of the firm (type of
business model, internal organizational architecture, key strategic priorities, etc.), which are
9
not under direct managerial control, at least during the time horizon of the SSO
implementation. In a nutshell, we expect SS needs to generate pressure to use a SSO either to
standardize business processes and reduce cost, or as a revenue generating opportunity. We
propose that they are primarily defined by means of four variables: the degree of
environmental heterogeneity; the degree of environmental dynamism; the firm’s IT
infrastructure; the size of the firm that establishes the SSO.
2.3.1 Environmental heterogeneity
It is widely acknowledged that “under norms of administrative rationality a firm should
match its internal organizational complexity with its environmental complexity” (Thompson,
1967). Depending on their characteristics, environments generate forces for local
responsiveness and forces for global integration (Goshal and Noria, 1990) to which firms
must react. Firms that operate in environments with different degrees of heterogeneity must
find the right balance between the development of specialized capabilities and centralized
competences (Allen and Boynton, 1991). Therefore, we expect that companies that operate in
homogeneous environments be more likely to benefit from process standardization and should
obtain larger benefits from the implementation of an SS model focused on cost-cutting.
Conversely, companies that operate in a large number of countries (i.e. in a heterogeneous
environment) are more likely to face the need to adapt their business processes to different
local conditions. Hence, we expect these firms to prefer from a customer-centric approach to
shared services
2.3.2 Environmental dynamism
Among the various environmental dimensions that have been analyzed in the context of
strategy-structure contingency studies, market dynamism (Aldrich, 1979; Dess and Beard,
1984; Aragon-Correa and Sharma, 2003) plays a pre-eminent role. By regulating the
evaluative feedback through which companies assess their effectiveness, the clockspeed of an
10
industry (Fine, 1998) dictates the pace at which organizations need to update their process and
organizational routines to remain competitive. We expect this variable to influence the
propensity towards shared services as well as the type of SS model implemented.
In highly dynamic markets, demand fluctuations and changing customer preferences
make a shared service approach more valuable because this strategy helps firms achieve
higher resource utilization. For the same reason, dynamic environments render a SS a
profitable business opportunity and should induce SS providers to profit from their experience
to deliver services to outside firms as well. Therefore we expect firms that operate in dynamic
environments to privilege extroverted customer-centric models over cost-conscious
approaches.
2.3.3 IT infrastructure
The adoption of specific IT infrastructures and systems profoundly shape the nature of
business processes and often require business organizations to modify their internal routines
to adhere to the system’s underlying operating logic (Davenport, 2000). The presence of
integrated information systems such as ERP4 often represents a fertile ground for the
establishment of a SS organization. Besides increasing the accuracy and the timeliness of
information within the organization, these systems also induce adopters to streamline and re-
engineer their business processes (Masini, 2003). In turn, these BPR efforts often enable firms
to identify non-core activities that can be insourced or outsourced. In other words, the
rationalization of business processes that accompanies an ERP implementation often prepares
the ground for the migration to an SS organization. It also facilitates integration across
functions and accelerates information exchange. Therefore, we expect firms that use an
enterprise system to have greater compatibility with a SS organization. Furthermore, as

11
companies that extensively use ERP systems are also more likely to exhibit standardized
processes than companies who do not, we also expect ERP users to have higher needs for
process standardization.
2.3.4 Size
Economic logic suggests that the advantages of establishing a separate shared services
organization increase with the scale of the client organizations for two reasons. First, in small
firms the fixed costs of setting up an SSO are less likely to be recovered through the
rationalization of business processes or the improvement of service. Second, larger
organizations typically exhibit greater inefficiencies due to the higher coordination costs that
they need to incur to manage their internal processes.
This phenomenon is also strictly connected to the notion of complexity (Duncan, 1972;
Tan and Litschert, 1994) and it arises from the “heterogeneity and range of an organization’s
activities” (Child, 1972) that require the support of the SSO. As this type of complexity
typically increases with the number of tasks and with their variety and as both are also a
function of the scale of operations, we expect large companies to face proportionally greater
pressure to adopt shared services strategies that privilege cost-cutting.
2.4 Strategic and operational variables that define Shared Services capabilities
Management scholars increasingly recognize the importance of organizational
capabilities for the achievement of sustained competitive advantage, particularly in dynamic
environments (Pisano, 1994; Eisenhardt and Martin, 2000). These phenomena have been
studied in relation to a variety of business situations such as strategic alliances (Inkpen and
Dinur, 1998), mergers and acquisition (Zollo and Winter, 2001), manufacturing processes
======================================================================================================================================================4 Enterprise Resource Planning systems (ERP or ES) are perhaps the most representative example of this class of
IT. They are large computer systems that – through a common database - integrate different application
programs across all the functions of the firm (Davenport, 2000).
12
(Lapré et al., 2000; Carrillo and Gaimon, 2000), and more recently to the information
technology area (Bharadwaj, 2000; Stratman and Roth, 2002; Masini, 2003). Within the
environment-structure framework, researchers have started applying a contingency
perspective to investigate the relation between the mechanisms that subsume the generation of
capabilities and the environment, particularly in relation to the different type of knowledge
investments undertaken by the firm (Zollo and Winter, 2001).
Along these lines, we also argue that shared service capabilities result from the specific
strategic tactical and operational decisions followed when designing and implementing a SS.
A review of the literature on shared services has enabled us to identify 6 general variables that
are relevant to establish an SS organization: degree of offshoring; degree of outsourcing; SSO
concentration; level of commitment of the parent organization to the SSO; outward
orientation and service monitoring mechanisms.
2.4.1 Outward orientation
One of the primary decisions faced by SSO managers is whether the services will be
provided exclusively to internal clients, as done by Citigroup for example, (i.e. to business
units that belong to the same parent companies) or to outside companies as well, as in the case
of Shell Services International or Southern California Edison (The Conference Board, 1998).
This is the main variable that differentiates between companies that adopt an introverted
approach to SS focused on cost-cutting and companies that adopt a customer-centric model
focused on service improvement and revenue generation.
Furthermore, besides obvious cost and revenue implications, the decision has also
strategic consequences. If providing specialized services to outside companies may generate
additional revenue, in the long run it may also distract the SSO from focusing on its major
client and create provide competitors with access to specific capabilities.

13
2.4.2 Offshoring
Confronted with increasing competition from overseas firms, European and US firms
increasingly offshore their operations to countries that offer significant labor cost advantages
(Farrell, 2004). Initially developed in the manufacturing sector, this trend is gradually
permeating the service sector, particularly with the diffusion of offshore call centers.
However, in spite of the advantages that it may provide (Venkatraman, 2004) some
analysts question the value of the offshoring option (McKinsey, 2004). Lower variable costs
have often to be traded off against the lack of specific capabilities at the local level, which
then translates into poor customer service and a diminished ability to innovate and seize
revenue-generating opportunities.
As a result, we expect the degree of offshoring to be one of the variables that best
distinguish between cost-focused and customer-centric SSOs: cost-concerned companies
typically consider offshoring a more useful option than customer-centric organizations, which
prefer to locate SS centers closer to their core operations.
2.4.3 Outsourcing
This variable measures the extent to which the SS organization operates independently
of the parent company. It reflects the evolution of SS organizational forms observed by Quinn
et al. (2000): from a basic model fully integrated to the main organization to one based on
partial or full separation from the parent company (which is typically the last step before a
complete outsourcing of services to outside firms). The Bywater study (2001) reports close to
half of the centers to be under one of the categories: third party owned business unit,
independent business unit, or stand-alone division. To fully capture the different dimensions
along which the shared service organization can achieve independence we account for
whether this is run as an independent business unit and also as a separate legal entity. Based
14
on our earlier categorization, one can expect SS centers run as independent business units or
separate legal entities to reflect a customer-centric and revenue-oriented approach.
2.4.4 SS Concentration
The tension between local adaptation and global integration typically faced by
multinational or transnational organizations has been discussed in the literature (Goshal and
Noria 1990). In SS practice we find examples like ABB Group, operating 36 shared service
centers in 17 countries (Quinn et al. 2000), as well as a larger group of companies that run one
center for all of their operations (more than 80% in the Bywater, 2001 sample). Accordingly
this variable accounts for the degree of local adaptation displayed by the SS organization:
firms that choose to operate large SS organizations located in a single country obviously
privilege a cost-cutting model that privileges standardization and resource optimization,
whereas companies that prefer to manage a network of small SS centers established in many
different countries emphasize local adaptation.
2.4.5 Commitment
It accounts for the extent to which the SS adopter deploys an appropriate amount of
resources to support the SS organization. According to a manager at Weyerhaeuser (the
Conference Board, 1998), people have to believe that you are in it for the long run, and this
can be demonstrated by the processes, organizational structure, and human resources that you
invest in. This view is supported in practice by SSOs like that of BP Amoco’s with 8000 staff
and services worth $1.4 billion (Quinn et al., 2000). This variable attempts to characterize the
commitment displayed by a firm towards its SSO. We expect firms with customer-centric
revenue-oriented SSOs to exhibit higher commitment, which will be manifested by higher
levels of investment.
15
2.4.6 Type of service monitoring mechanisms
This variable defines the type of mechanisms that the SSO uses to guarantee the desired
level of service quality. It clearly distinguishes between companies that establish a shared
service organization with a cost-cutting priority in mind, and those that consider it as a
business opportunity. We expect that companies that establish SS organizations to cut costs
need to enforce service quality by means of contractual mechanisms such as service level
agreements. Conversely, we expect companies that consider SS as a revenue generating
opportunity to rely on market mechanisms to achieve the necessary service quality standards.
In the Bywater sample composed of both North American and European firms (Bywater,
2001), twenty four percent of the companies report having service level agreements.
3 METHODOLOGY AND ANALYTICAL ISSUES
3.1 Overall analytical approach
Consistent with (Bensaou and Venkatraman, 1995), we applied a six-step approach to
uncover configurations and to test their descriptive and predictive validity. As a first step,
after developing the conceptual model described in the previous section we operationalized
the 11 taxonomic variables used in the analysis. In steps 2 and 3 we followed the multi-tiered
cluster analysis approach suggested by Hambrick (1983) to derive the configurations of fit
between SS needs and SS capabilities. Accordingly, the clustering procedure was first applied
to environmental variables outside management control (i.e. SS needs). Second, it was applied
to specific decision variables under management control (i.e. SS capabilities) to identify
companies that develop similar capabilities, within each specific subgroup with homogeneous
needs. Together the two substeps help identify homogeneous clusters of firms that display
both similar SS needs and similar SS capabilities. In step 4 we assessed the descriptive
validity of the configurations. This was achieved first by verifying whether the proposed
clustering had any statistical discriminating power and then by interpreting the characteristics
16
of each cluster with respect to the variables that contribute the most to discriminate across
groups. In step 5 we refined the interpretation of the clusters by identifying three general
dimensions that underlie the 11 taxonomic variables. Finally, in step 6 we assessed predictive
validity by examining whether the clustering structure explains observed performance
differences across firms.
3.2 Sample selection and data collection
The data necessary to test the model were collected in collaboration with Citigroup,
which conducts an annual survey to monitor the status of Shared Service Organizations in
Europe. The data collection was subcontracted to an independent research firm and included
three steps. The fist step consisted in the selection of a random sample of European firms in
the manufacturing and service sector. The second step consisted in the identification of a
subsample of firms that had a shared services organization among those initially selected.
Finally, as a third step a set of 30-minute interviews were conducted between January and
February 2002 with the manager responsible for decisions related to the strategic development
of the company’s European SSO in each of the firms selected. In the interview, the name of
the survey sponsor was disclosed to the interviewees as well as the research nature of the
project. Conversely, to protect the confidentiality of the information, neither the name of the
interviewee nor that of the company were disclosed to Citigroup and to the authors of this
study. At the end of the process 139 completed interviews were made available to the authors
and retained for statistical analysis.
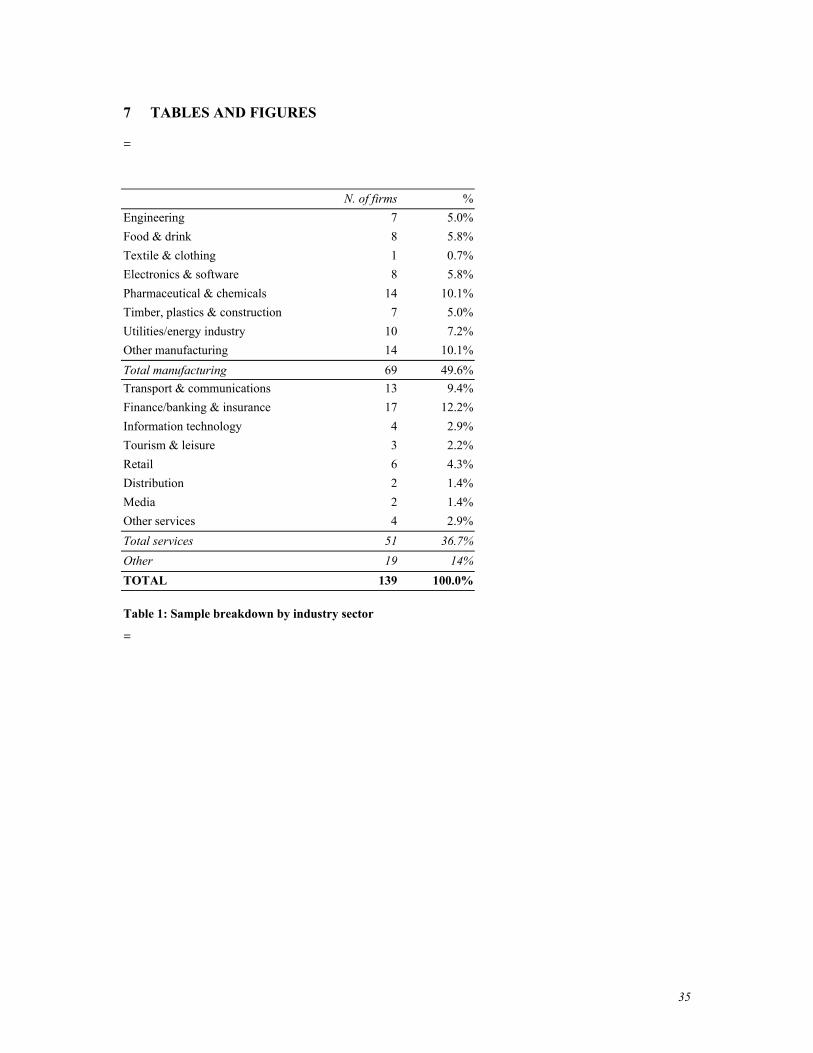
Table 1 – which displays the sample demographics and breakdown by industry sector -
suggests that the sample is fairly well balanced between manufacturing and service
companies. The two industries most represented are pharmaceutical and chemicals (for the
manufacturing sector) and finance, banking & insurance for the service sector. Not
surprisingly the sample is heavily biased towards large firms (average turnover is around
17
45000 $M), given that the development of SSOs is typically considered as a viable option
only by companies above a certain size.
----------------------------------
Table 1 ABOUT HERE
----------------------------------
3.3 Operationalization of variables
3.3.1 SS needs.
The four constructs that define SS needs have been operationalized as follows. The
degree of environmental heterogeneity is measured by means of the number of countries in
which the firm has operations. The type of technological environment is characterized by
means of an indicator that accounts for the number of macro-functions supported by an ERP
system. Size is measured by means of two variables: turnover (in M$) and number of
employees. Finally to measure dynamism we followed the well-established procedure
proposed by Dess and Beard (1984) and computed this variable as the dispersion about a
trendline of a set of representative industry variables - after controlling for absolute industry
size. For any given sector j we proceeded as follows: first, from public databases we collected
yearly data aggregated at the 2-digit SIC code level on 3 representative industry variables
(sales, total employment, value added) from 1996 to 2003. Second, for every SIC code j we
regressed each of the three variables over time: yj = aj + bj*year + ε, (where y = sales, total
employment, value added). Finally, we computed the degree of dynamism for sector j as the
average of the standard errors of the three regressions divided by the mean of the dependent
variable of interest.

18
3.3.2 SS capabilities.
The six constructs that define SS strategy have been operationalized as follows. The
degree of outward orientation is measured as the total number of functions (among those
supported by SS) that are also offered to outside firms. The degree of offshoring is computed
as the number of countries in which the companies have established SS organizations without
also having core operations divided by the total number of countries in which the company is
established. To account for outsourcing inclination we used an indicator that takes the value
of 0, 1 or 2 depending on whether the SSO is fully integrated, run as either an independent
business unit or a separate legal entity, or both. SS concentration is measured by the number
of countries in which the firm has an SS organization divided by the total number of countries
in which the firm has operations. Commitment is measured in terms of SS investments per
employee (i.e. investments allocated to the SSO divided by the total number of employees in
the parent company). Finally, the type of service monitoring mechanism is assessed by
considering the number of service types for which the SSO has established a service level
agreement (SLA) with its internal or external customers.
Table 2 displays summary statistics and correlation among variables.
----------------------------------
Table 2 ABOUT HERE
----------------------------------
4 ANALYSIS AND DISCUSSION OF RESULTS
4.1 The four configurations of SS organizations
=The configurations of SS organizations were uncovered by applying cluster analysis and
following the recommendations in Punj and Stewart (1983) and Ketchen and Shook (1996),
i.e.: use of standardized variables to limit the spurious influence of the different scale to

19
measure constructs and use of Euclidean distance as similarity measure. The clusters were
established by means of the SAS FASTCLUS algorithm. The procedure, which uses a k-
means model to compute cluster centers (i.e. the cluster centers are computed as the means of
the observations assigned to each cluster when the algorithm is run to complete convergence)
is recommended for large data sets with more than 100 observations. As the initialization
method used by FASTCLUS makes it sensitive to outliers, we run the procedure in two steps.
The first step was used to identify 15 outliers that were eliminated from the sample. In the
second step we rerun the algorithm selecting seeds from the high frequency clusters in the
previous analysis.
The optimal number of clusters in each of the two applications of the clustering
algorithm (one to the variables defining environmental characteristics and two to the variables
defining SS strategies) was selected based on two criteria (Miller and Roth, 1994). Fist we
looked for pronounced increases in the tightness of the clusters as measured by the pseudo R2
and F statistics. Second we conducted a multivariate test of overall significance using the
Wilk’s lambda criterion and the associated F statistics to make sure that the hypothesis that
the clusters were equal across the taxonomic variables could be rejected.
The application of this procedure uncovered 2 clusters at each stage of the analysis
thereby suggesting the existence of 4 configurations of fit between environmental needs and
SS strategies, composed, respectively, of 62, 31, 15 and 16 firms. We proposed the following
denomination for the four clusters: i) business-minded optimizers ii) cost watchers; iii)
focused adopters; iv) immature service providers.
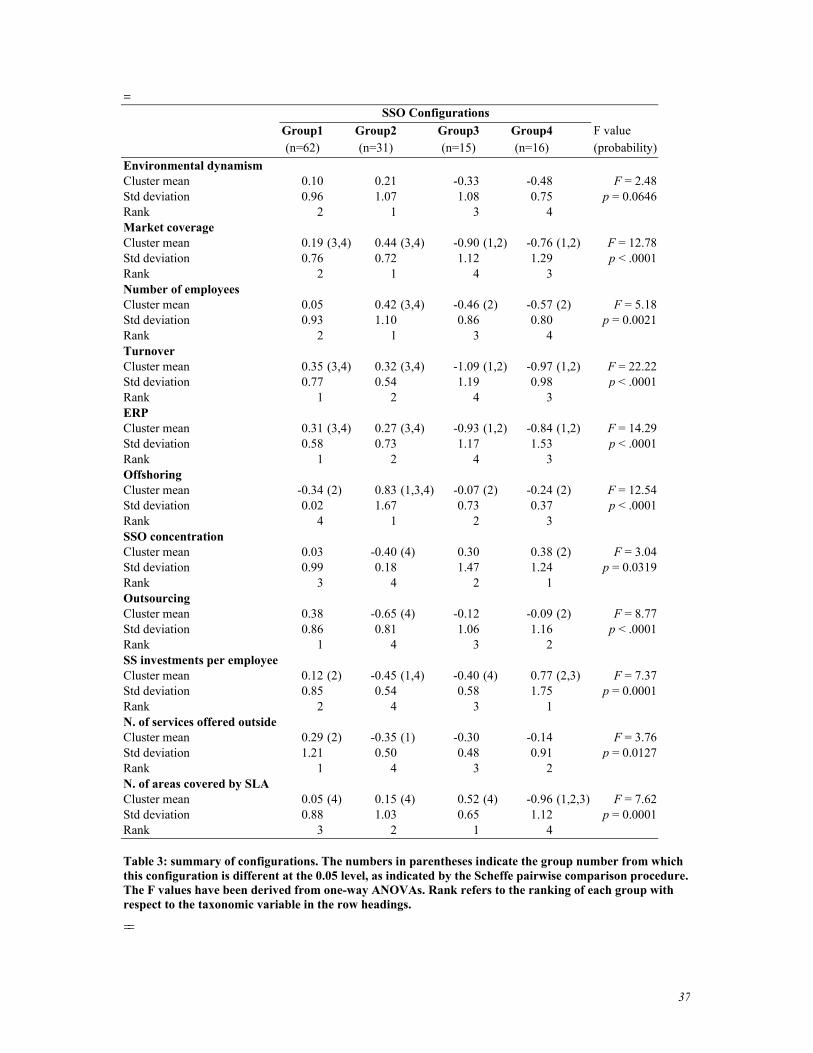
To test “whether the configurational approach and the analytical procedure employed
have any statistical power to distinguish among [the uncovered configurations]” (Bensaou et
al. 1995, p.1480) we performed a series of one-way comparisons among the four clusters for
all the 11 variables included in the model. Table 3 reports the results of this exercise and
20
suggests that all the variables included (with the sole exception of environmental dynamism)
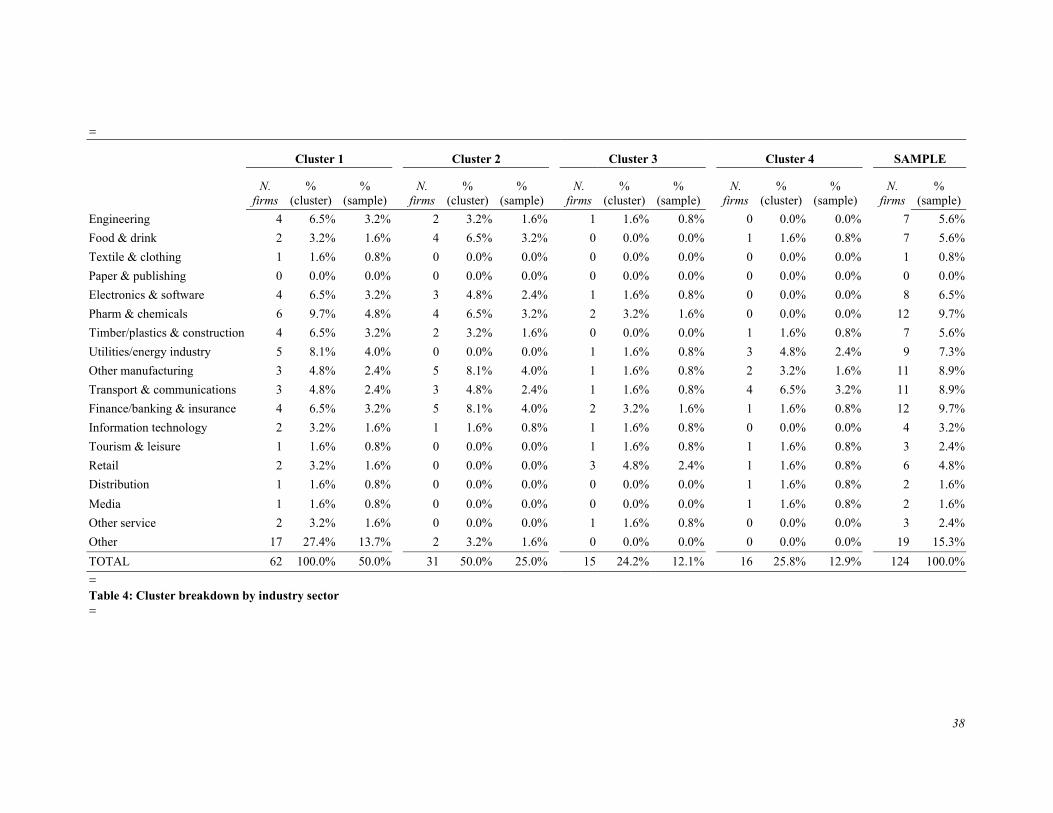
strongly discriminate among groups (at p < 0.05 with a Scheffe contrast). Table 4 provides
information about the cluster breakdown by industry sector. To interpret the configurations
through the lens of our theoretical framework we analyzed the four clusters based on the
variables for which the observed differences across groups are statistically significant at the
.05 level or less.
----------------------------------
Table 3 ABOUT HERE
----------------------------------
4.1.1 Configuration 1: Business-minded optimizers
These are medium to large multinational companies that have well streamlined processes as
demonstrated by their extensive use of ERP packages (most ERP adopters profit from the
implementation of this software to undertake an extensive re-engineering of their processes).
These firms operate in dynamic environments and invest quite heavily in their SSOs. For the
most part their SSOs are run as independent businesses, offering some of their services
externally as well. The fact that business-minded optimizers make little use of SLAs
reinforces the fact that for these SSOs the market controls and provides incentives for service
levels. As a result, there is no need for internal quality control mechanisms such as SLA. The
SSO exhibits relatively dispersed operations with low concentration. Also, these firms do not
rely on offshoring, which is consistent with a well-established, business-minded SSO that
displays little concern for cost reduction.=
4.1.2 Configuration 2: Cost watchers
Like the radical optimizers, these are large multinationals that operate in dynamic
environments. Many of their business functions are also supported by ERP systems,
suggesting the existence of streamlined processes. However these firms have a radically

21
different SS model characterized by low SS investments and by the fact that the SSO is run as
an internal cost center. Services are not offered externally, and are monitored with an
extensive use of SLAs to guarantee acceptable quality levels. These companies tend to
extensively offshore their SSOs. However, the low level of SSO concentration indicates that
operations are offshored to multiple locations, a practice also known as multishoring.
4.1.3 Configuration 3: Focused adopters
This configuration consists of relatively small organizations run locally. Business
functions are for the most part not supported by ERP. SS are consolidated in a few locations.
The SSO is run internally, with little propensity to offer services outside. The fact that SS
investments are kept to a minimum while there is some offshoring suggests a cost conscious
approach to SS. Finally, firms in this cluster have SLAs in a larger number of functions than
any other group, indicating the importance given to service quality.
4.1.4 Configuration 4: Immature service providers
These are small local firms operating in low-dynamism environments that make little
use of integrated information systems. Their SSOs are also well consolidated. In these
respects they resemble the focused adopters. However their SSO is run very differently. First,
these firms exhibit high commitment in their SSO, as demonstrated by their aggressive
investments. Second, the SSO is externally oriented, once again motivated by market forces.
Third, the SSO is run as an independent business that offers services outside the firm as well.
Finally these firms do not use SLAs to control quality, and have little interest in offshoring.
----------------------------------
Table 4 ABOUT HERE
----------------------------------
22
4.2 Analysis of underlying dimensions
The 11 taxons used to characterize the SS organizations successfully uncovered four
distinct configurations. However, as some of these taxonomic variables are correlated, we
decided to extend our analysis by applying a dimension-reduction technique to examine
whether the 11 taxons revealed any underlying structure. To this end, we applied multiple
group discriminant analysis using each of the four configurations (coded into 4-1 = 3
dummies) as a criterion variable and the 11 taxonomic variables as predictors (Miller and
Roth, 1994). The analysis was conducted by means of the SAS CANDISC procedure
(Canonical discriminant analysis), which is a dimension-reduction technique related to
principal component analysis and canonical correlation. Given a classification variable and
several quantitative variables, the CANDISC procedure derives canonical variables (or
functions), i.e. linear combinations of the quantitative variables that summarize between-class
variation in much the same way that principal components summarize total variation.
The results (Table 5) revealed the existence of three canonical functions with significant
canonical correlations using Rao’s (1973) approximate F statistics (R1 = 0.825 with p <.0001;
R2 = 0.699 with p <.0001 and R3 = 0.484 with p = 0.0003). F statistics for Wilk’s lambda
also indicates a significant overall multivariate relationship (F = 0.125 with p < .0001).
The canonical loadings and the standardized canonical coefficients (also displayed in Table 5)
can be used to interpret the underlying canonical functions. Canonical structure loadings
represent the correlation of the original variables with un underlying unknown dimension and
can be interpreted like factor loadings in principal component analysis. Canonical coefficients
are analogous to beta weights in a regression and can be used to predict cluster membership.
----------------------------------
Table 5 ABOUT HERE
----------------------------------

23
Based on canonical loadings larger than ±0.30, we interpret the first canonical function
to be “operating scale” to reflect the fact that the largest correlates with this functions are the
variables that reflect internal size (turnover and number of employees) geographical
dispersion (market coverage) and technological infrastructure. The fact that the variable
technological infrastructure loads highly on this function is consistent with our interpretation,
as extensive use of ERP packages in multiple functions is typical of large organizations that
badly need this technology to streamline operations and simplify processes.
We name the second function “marketplace mentality”. The fact that outsourcing,
investments per employee, and outward orientation are all positively correlated with this
function whereas offshoring is negatively associated with it suggests that firms that score high
along this dimension perceive SS as a revenue-generating opportunity and extensively rely on
market mechanisms to capitalize on it. Conversely firms that do not have a marketplace
mentality run their SSOs as an internal function aimed at controlling costs.
Finally we call the third canonical function “incubation model” because it reflects the
approach followed by parent organization to support the growth of the SSO from its infancy
to its full maturity. Based on the fact that use of SLA is positive correlated with this function
whereas investments per employee is inversely associated with it, we identify two antithetical
incubation models. Firms that choose to maximize their investments in the SSO without
requiring an SLA to guarantee quality standards clearly follow a “nurturing” approach as they
provide the SSO with enough resources to develop following market needs, without forcing it
to deliver specific results. Conversely firms that limit their investments in SSOs and that need
to rely on formal SLAs to guarantee quality are representative of a “monitoring” model to SS
development, which is somehow similar to the command and control approach to managing
human resources.
24
The four configurations that emerged from our analysis can be revisited under the light
of the three canonical functions. Diverse SS adopters have a large operating scale, have a high
marketplace mentality and follow a nurturing incubation model. Cost watchers also operate
on a large scale but have a low marketplace mentality and prefer a monitoring incubation
model. So do focused adopters, which conversely have a small operating scale. Finally,
immature service providers also operate at a small scale but have a high marketplace
mentality and prefer a nurturing incubation model.
It is also interesting to interpret the three canonical functions in relation to our initial
conceptualization of fit between environmental and strategic variables. The analysis clearly
suggests that environmental needs are best represented by a single underlying dimension that
reflects the scale of operations. Conversely, the fact that the variables defining the SS
implementation model load on two distinct functions indicates that the dichotomy between
introspective and extroverted SSOs suggested by the Bywater (2001) and Citigroup (2002)
studies is somewhat a partial view of a more complex reality.
4.3 Predictive validity
To assess the external validity of the proposed classification against an external criterion
(Ketchen and Shook, 1996) we conducted a series of one-way analyses of variance using a
new set of measures as independent variables and the cluster membership as the explanatory
variable. To take fully into account the fact that the benefits of a shared services organization
may be observed and evaluated at different levels, we examined performance differences
along five distinct dimensions, namely: i) savings per employee in the overall organization; ii)
savings per employee in the SS organization; iii) savings per dollar invested; iv) scope of SS
benefits (i.e. number of areas in which the firms reported benefits after the implementation of
SS); and v) proportion of beneficiaries (i.e. number of employees that benefit from SS divided
by the total number of employees in the company). The first three measures are clearly
25
relevant to companies that implement SS to improve efficiency and minimize costs. The
fourth and especially the fifth indicator are more general and are often used as proxies to
assess the performance of customer-oriented SS organizations.
Finally, to rule out the possibility that the observed performance differences across
groups could be due to a different stage of “maturity” of the different SS organizations
examined, we also included the average age of the SS organization (i.e. measured as the
number of months elapsed since its establishment) as a sixth criterion variable.
Table 6 displays the results of a pairwise comparison among the four clusters with
respect to the six criterion variables retained. The results confirm that the configurational
analysis offers some useful insights to explain the differences observed across groups of
adopters, as we found highly significant differences across the four configurations (the F-
values range between F = 5.50 with p = 0.001 for the variable proportion of beneficiaries and
F = 2.35 with p = 0.076 for the variable savings per employee). Also, they highlight that non-
negligible performance differences exist across configurations, although the magnitude is
different in the five cases retained. Conversely the analysis confirms that no statistically
significant differences can be observed across clusters with respect to their level of maturity
(F = 0.33 with p = 0.80).
----------------------------------
Table 6 ABOUT HERE
----------------------------------
When we look at the results from Table 6, we observe that focused adopters have the
highest overall performance. Firms in this cluster not only outperform immature service
providers with similar environmental needs, but also do better than the firms with large
operating scale in Clusters 1 and 2 on some dimensions. In particular, this cluster ranks first
on saving related variables and second in terms of the proportion of beneficiaries. The fact
26
that the variable on scope of SS benefits is ranked fourth suggests that companies in this
cluster experience benefits along fewer dimensions. We would expect these to be primarily
cost, and service to some extent. It is frequently stated by SS managers that cost savings are
the first benefit to be observed in SSO implementations. Though not significant, the SSOs in
this cluster exhibit the highest maturity in terms of age, which seems to be consistent with this
claim. The success of focused adopters seems to lie in their focus on cost cutting, while
ensuring acceptable service levels with extensive SLAs. They differ from cost watchers in
that they have lower diversity and size, and higher concentration of their SSO, potentially
making it easier to focus.
Immature service providers are similar in operating scale to focused adopters. However
their performance on cost related measures is lower than focused adopters. This is not
surprising, given that these firms do not focus on cost cutting as much. A larger scope of
benefits is reported by these companies. Providing services and generating revenue is a higher
priority for these firms. Consistent with this, they nurture their SSO, and exhibit a
marketplace mentality. Like focused adopters, these firms have high concentration in their
SSOs along with a high propagation of services within the organization. We thus observe a
pattern, wherein the highly consolidated SSO of small operating scale firms leads to an
efficient SS operation, despite differences in management approach. The small operating scale
enables better consolidation, which in turn leads to higher SS effectiveness in terms of the
beneficiaries in the organization. Overall, the problem with firms in this cluster seems to be
that they lack the necessary size or diversity to benefit from their investment, or suffer from
an immature marketplace orientation in a company where processes haven’t been sufficiently
streamlined and taken under control. Indeed, these are the youngest firms among the four
clusters (though not significantly so). This view is confirmed to some extent upon comparison
27
to the business-minded optimizers that follow a similar SS model though have radically
different SS needs.
Overall, the companies in the business-minded optimizers cluster tend to follow the
focused adopters in terms of performance. Hence, among the large operating scale firms,
business-minded optimizers outperform the cost watchers. Their savings are somewhat more
than the latter, however they report SS benefits in fewer areas. This could imply that they are
more focused, but it could also be a consequence of not reporting benefits in areas like
process standardization since this has already been achieved. Like the immature service
providers, firms in this cluster adopt a high marketplace mentality, nurture their SSO, and
consequently do not prefer to offshore their SS. Their superior performance suggests that
investments into shared service organizations exhibit increasing returns to scale. Given their
diverse needs, their SSOs tend to be spread out in many countries. Compared to the focused
adopters and immature service providers both the business-minded optimizers and cost
watchers have lower proportion of beneficiaries. This is consistent with our earlier
observation on firm operating scale, SSO concentration and SSO penetration. Larger
multinational firms have a harder time consolidating their SS, thus employ more people
relative to the overall firm size than smaller local firms.
Finally we have firms in the cost watchers cluster with the highest diversity and size in
terms of number of employees. These firms are characterized by their significantly higher
propensity to offshore their SS operations compared to all others. The multishoring results in
the SSO with the worst ratio of SSO employees to total number of employees. While their
internal SSO that is closely monitored by SLAs seems to lag behind the business-minded
optimizers in terms of cost savings, these firms report the highest scope in SS benefits. Since
their SS model is one that emphasizes cost containment, this seems to show that these firms
are still struggling on many dimensions like process standardization, service, and costs, and as

28
a result can report benefits on several dimensions. Their size and diversity, and potentially
immaturity are resulting in inferior performance compared to a focused adopter firm. Indeed,
a regression exploring the direct relationship between SSO age (maturity) and the incubation
model provides support for the thought that younger SSOs need more investment and
nurturing. The correlation between function3 and age is found to be 0.217 and it is significant
almost at the 1% level (p=0.0154). Thus we find that complexity exhibits decreasing returns
to scale. Another possible explanation is that offshoring such a complex operation to SS in
multiple countries, and then managing this complex SSO leads to the lower performance
demonstrated by firms in this cluster.
5 CONCLUSIONS
The analysis has identified four dominant SSO configurations. These can be described
via three functions: operating scale, market mentality, and incubation model. Environmental
needs are captured by the operating scale function, and SS capabilities by the market
mentality and incubation model functions. The configurations provide a rich description of
firm and SSO characteristics in each cluster, thus improving the common uni-dimensional
view of SSOs. The results provide partial support for the fit model proposed. The following
conclusions can be drawn (Figure 2).
SS needs dictate the appropriate SS model. Firms treating their SS as a cost center and
adopting a monitoring based incubation model can perform quite well in small local firms that
haven’t necessarily deployed integrated information technology. On the other hand, this
approach seems to become too complex for firms with large operating scale, which offshore
their SSO, and savings suffer as a consequence. The model that sets up the SSO as an
independent business, focuses on revenues, and invests heavily, does not need SLAs to ensure
service and benefits from large operating scale. Incentives are better aligned and the firm
overcomes the problem of controlling a complex organization. The superior performance
29
compared to smaller firms may be a result of maturity in terms of processes in such
organizations, or the fact that there is more room for savings in large diverse organizations.
Thus, unlike the common argument that suggests the superiority of a high market mentality
we find that this is contingent on the environmental needs of the SSO. Similarly, we find no
significant support for the common argument that as SSOs mature, they shift to a market
oriented model.
SSOs of small local firms with centers in only a few countries, require fewer employees
relative to the total number of employees in the firm. This suggests that such firms have more
efficient SS operations compared to their highly complex multinational counterparts. Our
results also demonstrate that in the sample, only about a quarter of the firms have a strong
interest in offshoring. These are large multinational companies that do not outsource their
SSO, but offshore it to a large number of different locations. This strategy seems to penalize
firms in this cluster on the performance measures being considered. It seems that keeping the
SSO in-house, multishoring, and adopting a monitoring type incubation model is not
appropriate given the environmental needs of such firms. Albeit not significant, the offshoring
seen in the focused adopters seems to provide a lower complexity setting where this strategy
results in success. It would be an interesting topic of future research to test the hypothesis
that complexity hurts the performance of this type of offshoring strategy.
Our results need to be interpreted in light of the following caveat. Our data did not
contain information that would allow us to evaluate more revenue and / or service oriented
performance measures. Such data could have shown us more precisely how each
configuration rates on performance, and may have illustrated a tradeoff between savings and
other performance metrics in some parts. This remains as the most important issue for future
research.
30
To our knowledge, this is among the first academic studies on shared service
organizations. Introducing structures of SSOs as a research topic is an important contribution
of this paper. Given the significance of this topic to practitioners, we believe that it merits
further inquiry.
----------------------------------
Figure 2 ABOUT HERE
----------------------------------
=
6 REFERENCES
Aldrich H.J., 1979. “Organizations and Environments”. Englewood Cliffs, NJ. Prentice Hall.
Allen, B.R. and A.C. Boynton, 1991. “Information Architecture: In Search of Efficient Flexibility”. MIS Quarterly, vol. 15, no. 4.
Aragon-Correa J.A. and S. Sharma, 2003. “A Contingent Resource-Based View of Proactive Corporate Environmental Strategy”. Academy of Management Review , vol. 28, no.1, pp. 71-88.
Atuahene-Gima, K. and A. Ko, 2001. “An empirical investigation of the effect of market orientation alignment on product innovation”. Organization Science, vol.12, no.1.
Bharadwaj, A.S., 2000. “A Resource-Based Perspective on Information Technology Capability and Firm Performance: An Empirical Investigation”. MIS Quarterly, vol. 24, no. 1.
Bensaou, M. and Venkatraman N.V. 1995. “Configurations of Interorganizational Relationships: A Comparison between US and Japanese firms,” Management Science, vol. 41, no. 9, pp. 1471-1492.
Boyer, K.K., Ward, P.T., Leong, G.K., 1996. “Approaches to the factory of the future: An empirical taxonomy,” Journal of Operations Management, vol. 14, no. 4, pp. 297-313.
Boyer, K.K., Bozarth, C., McDermott, C. (Eds.), 2000. “Configurations in Operations Management: Taxonomies and Typologies,” Journal of Operations Management, vol. 18, no. 6 (Special issue).
Brown, C.V., 1994. “Organization designs for the management of end-user computing: Reexamining the contingencies”. Journal of Management Information Systems, vol.10, no.4.
31
Brown, C.V. and S.L. Magill, 1998. “Reconceptualizing the Context-Design Issue for the Information Systems Function”. Organization Science, vol.9, no.2.
Bywater 2001 study: Research Briefings, Realising the potential of shared services: internal outsourcing.
Carrillo, J.E. and C. Gaimon, 2000. “Improving Manufacturing Performance Through Process Change and Knowledge Creation”. Management Science, vol. 46, no. 2.
Child, J., 1972. “Organizational Structure, Environment and Performance: the Role of Strategic Choice”. Sociology, 6 pp.1-22.
The Citigroup Business Services Annual Survey of European Shared Services , 2002.
Connell, R., 1996. “Corporate Strategies: Learning to Share,” The Journal of Business Strategy, vol. 17, no. 2, pp. 55-58.
Dennis, D. and Meredith, J., 2000. “An Empirical Analysis of Process Industry Transformation Systems,” Management Science, vol. 46, no. 8, pp. 1085-1099.
Davenport, T.H., 2000. “Mission Critical. Realizing the Promise of Enterprise Systems”. Harvard Business School Press, Boston, MA.
Dess, G.G. and Beard, D.W., 1984. “Dimensions of Organizational Task Environment. Administrative Science Quarterly”. Vol 29, pp. 52-73
Diaz, M.C., Machuca, J.A.D., Alvarez-Gil, M.C., 2003. “A view of developing patterns of investment in AMT through empirical taxonomies: new evidence,” Journal of Operations Management, vol. 21, no. 5, pp. 577:606.
Duncan, R.B., 1972. “Characteristics of Organizational Environments and Perceived Environmental Uncertainty”. Administrative Science Quarterly. vol. 17, no. 3, pp. 317-327.
Duray, R., Ward, P.T., Milligan, G.B. Berry, W.L., 2000. “Approaches to mass customization: configurations and empirical validation,” Journal of Operations Management, vol. 18, no. 6, pp. 605-625.
The Economist Intelligence Unit (EIU) Research Report 1998 by Marcie Krempel: Shared Services: A new business architecture for Europe (written in cooperation with Baker & McKinzie, The Chase Manhattan Bank, KPMG, PeopleSoft)
Eisenhardt, K.M. and J.A. Martin, 2000. “Dynamic Capabilities, What Are they?” Strategic Management Journal, vol. 21, no. 10-11.
Farrell, D., 2004. “Beyond Offshoring: Assess Your Company's Global Potential”. Harvard Business Review. vol.82, 12; p. 82.
Fine, C., 1998. “Clockspeed”. Perseus Books, Boston, MA.
Fisher, M.L., 1997. “What is the right supply chain for your product?” Harvard Business Review, vol. 75, no. 2.
32
Goshal, S. and N. Nohria, 1990. “Requisite Complexity: Organizing Headquarters-Subsidiary Relations in MNS's”. INSEAD Working Paper, 90/74/SM.
Goold, M, Pettifer, D. and Young, D., 2001. “Redesigning the corporate center,” European Management Journal, vol. 19, no. 1, pp. 83-91.
Hambrick, D.C., 1984. “Taxonomic Approaches to Studying Strategy: Some Conceptual and Methodological Issues,” Journal of Management, vol. 10, no. 1, pp. 27-41.
Hatten, K.J. and Hatten, M.L., 1985. “Some Empirical Insights for Strategic Marketers: The Case of Beer,” in Thomas H. and D.M. Gardner (Eds.), Strategic Marketing and Management, Wiley, Chicester and New York.
Inkpen, A.C. and A. Dinur, 1998. “Knowledge Management Processes and International Joint Ventures”. Organization Science, vol. 9, no. 4.
Jonsson, P., 2000. “Towards an holistic understanding of disruptions in Operations Management,” Journal of Operations Management, vol. 18, no. 6, pp. 701-718.
Kathuria, R., 2000. “Competitive priorities and managerial performance: a taxonomy of small manufacturers,” Journal of Operations Management, vol. 18, no. 6, pp. 627-641.
Keller, R.T., J.W. Slocum, and G.I. Susman, 1974. “Uncertainty and Type of Management System in Continuous Process Organizations”. The Academy of Management Journal, vol. 17 no. 1.
Ketchen, D.J. and C. Shook, 1996. “The Application of Cluster Analysis in Strategic Management Research: An analysis and Critique”. Strategic Management Journal, vol. 17 pp.441-458.
Lapré, M.A., A.S. Mukherjee, and L.N. Van Wassenhove, 2000. “Behind the learning curve: linking learning activities to waste reduction”. Management Science, vol. 46, no. 5.
Lawrence, P. R. and J. W. Lorsch, 1967. “Organization and Environment; Managing Differentiation and Integration”. Graduate School of Business Administration, Harvard University, Boston MA.
Lee, J-N, Shaila, M.M., Kim, Y-M., 2004. “IT Outsourcing Strategies: Universalistic, Contingency, and Configurational Explanations of Success”, Information Systems Research, vol. 15, no. 2, pp. 110-132.
Masini, A. 2003. “The ERP Paradox: An Empirical Investigation of the Impact of Enterprise Systems on Operational Effectiveness”. Ph.D. dissertation. INSEAD, Fontainebleau.
McKinsey, 2004. “When offshore manufacturing doesn't make sense”. The McKinsey Quarterly. New York: 2004. Issue 4, pp.1.
Meyer, A., Tsui, A. and Kinings C.R., 1998. “Configural Approaches to Organizational Analysis” Academy of Management Journal, vol. 36, pp. 1175-1195.
Milgrom, P. and J. Roberts, 1990. “The economics of modern manufacturing: technology, strategy and organizations”. American Economic Review, vol. 80, no. 3.
33
Miller, D., 1981. “Toward a New Contingency Approach: The search for Organizational Gestalts”. Journal of Management Studies, vol. 18, pp. 1-27.
Miller, D., 1986. “Configurations of Strategy and Structure: Toward a Synthesis,” Strategic Management Journal, vol. 7, pp. 233-249.
Miller, D., 1987. “The Genesis of Configurations,” Academy of Management Review, vol. 12, no. 4, pp. 686-701.
Miller, D., 1980. “Organizational Configurations: Cohesion, Change and Prediction” Human Relations, vol. 43, pp. 771-789.
Miller, D. and Friesen, P.H. , 1977. “Strategy Making in Context: Ten Empirical Archetypes,” Journal of Management Studies, vol. 14, pp. 259-280.
Miller, J.G. and Roth, A.V., 1994. “A Taxonomy of Manufacturing Strategies, Management Science, vol. 40, no. 3, pp. 285-304.
Pisano, G., 1994. “Knowledge, Integration and the Locus of Learning”. Strategic Management Journal, Vol 15, pp.85-100.
Punj, G. and D.W. Stewart, 1983. Cluster Analysis in Marketing Research: Review and Suggestions for Applications . Journal of Marketing Research, vol. 20, pp.134-148.
Quinn, B., Cooke, R., and Kris, A., 2000. Shared Services: Mining for corporate gold, Financial Times Prentice-Hall, Great Britain.
Rao, C.R., 1973. “Linear Statistical Inference”, New York: John Wiley & Sons, Inc.
Segars, A.H. and Grover, V., 1999. “Profiles of Information Systems Planning,” Information Systems Research, vol. 10, no. 3, pp. 199-232
Stratman J.K. and A.V. Roth, 2002. “Enterprise Resource Planning competence constructs: two-stage multi-item scale development and validation”. Decision Sciences, vol. 33, no. 4, pp. 601-628.
Tan J.J. and R.J. Litschert, 1994. “Environment-strategy relationship and its performance implications. An Empirical Analysis of the Chinese Electronics Industry”. Strategic Management J., vol. 15, pp. 1-20.
Thompson, J.D., 1967. “Organizations in Action”. McGraw-Hill, New York.
Tidd, J. and F. Hull, 2002. “Organizing for service innovation: best practice or configurations? » Working Paper. SPRU.
Verma, R., Young, S.T., 2000. “Configurations of low-contact services,” Journal of Operations Management, vol. 18, no. 6, pp. 643-661.
Venkatraman, N., 1989. “The Concept of Fit in Strategy Research: Toward Verbal and Statistical Correspondence,” Academy of Management Review, vol. 14, pp. 423-444.

34
Venkatraman, N., 2004. “Offshoring Without Guilt”. MIT Sloan Management Review. Spring 2004. Vol. 45, 3, p. 14.
Yeung A.C.L., Chan L.Y., Lee T.S., 2003. “An empirical taxonomy for quality management systems: a study of the Hong Kong electronics industry,” Journal of Operations Management, vol. 21, no. 1, pp. 45-62
Zollo, M. and S. Winter, 2001. “Deliberate learning and the evolution of dynamic capabilities”. Organization Science, vol. 13, no. 3.
35
7 TABLES AND FIGURES
=
N. of firms %Engineering 7 5.0%Food & drink 8 5.8%Textile & clothing 1 0.7%Electronics & software 8 5.8%Pharmaceutical & chemicals 14 10.1%Timber, plastics & construction 7 5.0%Utilities/energy industry 10 7.2%Other manufacturing 14 10.1%Total manufacturing 69 49.6%Transport & communications 13 9.4%Finance/banking & insurance 17 12.2%Information technology 4 2.9%Tourism & leisure 3 2.2%Retail 6 4.3%Distribution 2 1.4%Media 2 1.4%Other services 4 2.9%Total services 51 36.7%Other 19 14%TOTAL 139 100.0%
Table 1: Sample breakdown by industry sector
=

36
= 1 2 3 4 5 6 7 8 9 10Environmental dynamism - Market coverage 0.18 (0.05) Number of employees -0.20 0.03 (0.03) (0.71) Turnover 0.05 0.17 0.27 (0.57) (0.06) (0.00) Technological infrastructure 0.14 0.19 0.21 0.21 (0.11) (0.04) (0.02) (0.02) Offshoring -0.05 0.15 0.10 0.03 0.00
(0.61) (0.09) (0.26) (0.71) (0.96) SSO concentration -0.07 -0.46 0.07 -0.03 0.02 -0.11
(0.44) <(0001) (0.41) (0.76) (0.79) (0.23) Outsourcing -0.19 -0.11 -0.09 0.03 0.01 -0.08 0.23
(0.03) (0.20) (0.34) (0.78) (0.89) (0.36) (0.01) SS investments per employee -0.01 -0.16 -0.47 -0.11 -0.07 -0.14 -0.09 0.12
(0.88) (0.08) (<.0001) (0.23) (0.46) (0.12) (0.35) (0.18)N. of services offered outside 0.08 0.11 -0.10 0.01 0.07 -0.12 -0.12 -0.11 0.13
(0.40) (0.23) (0.29) (0.92) (0.43) (0.20) (0.19) (0.22) (0.16)N. of areas covered by SLA -0.16 0.08 0.05 0.04 0.19 0.09 -0.14 0.12 -0.04 -0.02
(0.08) (0.40) (0.61) (0.64) (0.04) (0.34) (0.12) (0.17) (0.65) (0.81)
Table 2: Correlations among taxonomic variables
37
= SSO Configurations Group1 Group2 Group3 Group4 F value (n=62) (n=31) (n=15) (n=16) (probability)
Environmental dynamism Cluster mean 0.10 0.21 -0.33 -0.48 F = 2.48Std deviation 0.96 1.07 1.08 0.75 p = 0.0646Rank 2 1 3 4 Market coverage Cluster mean 0.19 (3,4) 0.44 (3,4) -0.90 (1,2) -0.76 (1,2) F = 12.78Std deviation 0.76 0.72 1.12 1.29 p < .0001Rank 2 1 4 3 Number of employees Cluster mean 0.05 0.42 (3,4) -0.46 (2) -0.57 (2) F = 5.18Std deviation 0.93 1.10 0.86 0.80 p = 0.0021Rank 2 1 3 4 Turnover Cluster mean 0.35 (3,4) 0.32 (3,4) -1.09 (1,2) -0.97 (1,2) F = 22.22Std deviation 0.77 0.54 1.19 0.98 p < .0001Rank 1 2 4 3 ERP Cluster mean 0.31 (3,4) 0.27 (3,4) -0.93 (1,2) -0.84 (1,2) F = 14.29Std deviation 0.58 0.73 1.17 1.53 p < .0001Rank 1 2 4 3 Offshoring Cluster mean -0.34 (2) 0.83 (1,3,4) -0.07 (2) -0.24 (2) F = 12.54Std deviation 0.02 1.67 0.73 0.37 p < .0001Rank 4 1 2 3 SSO concentration Cluster mean 0.03 -0.40 (4) 0.30 0.38 (2) F = 3.04Std deviation 0.99 0.18 1.47 1.24 p = 0.0319Rank 3 4 2 1 Outsourcing Cluster mean 0.38 -0.65 (4) -0.12 -0.09 (2) F = 8.77Std deviation 0.86 0.81 1.06 1.16 p < .0001Rank 1 4 3 2 SS investments per employee Cluster mean 0.12 (2) -0.45 (1,4) -0.40 (4) 0.77 (2,3) F = 7.37Std deviation 0.85 0.54 0.58 1.75 p = 0.0001Rank 2 4 3 1 N. of services offered outside Cluster mean 0.29 (2) -0.35 (1) -0.30 -0.14 F = 3.76Std deviation 1.21 0.50 0.48 0.91 p = 0.0127Rank 1 4 3 2 N. of areas covered by SLA Cluster mean 0.05 (4) 0.15 (4) 0.52 (4) -0.96 (1,2,3) F = 7.62Std deviation 0.88 1.03 0.65 1.12 p = 0.0001Rank 3 2 1 4
Table 3: summary of configurations. The numbers in parentheses indicate the group number from which this configuration is different at the 0.05 level, as indicated by the Scheffe pairwise comparison procedure. The F values have been derived from one-way ANOVAs. Rank refers to the ranking of each group with respect to the taxonomic variable in the row headings.
==
38
=
Cluster 1 Cluster 2 Cluster 3 Cluster 4 SAMPLE
N.
firms %
(cluster)%
(sample)N.
firms%
(cluster)%
(sample)N.
firms%
(cluster) %
(sample)N.
firms%
(cluster)%
(sample)N.
firms%
(sample)Engineering 4 6.5% 3.2% 2 3.2% 1.6% 1 1.6% 0.8% 0 0.0% 0.0% 7 5.6%Food & drink 2 3.2% 1.6% 4 6.5% 3.2% 0 0.0% 0.0% 1 1.6% 0.8% 7 5.6%Textile & clothing 1 1.6% 0.8% 0 0.0% 0.0% 0 0.0% 0.0% 0 0.0% 0.0% 1 0.8%Paper & publishing 0 0.0% 0.0% 0 0.0% 0.0% 0 0.0% 0.0% 0 0.0% 0.0% 0 0.0%Electronics & software 4 6.5% 3.2% 3 4.8% 2.4% 1 1.6% 0.8% 0 0.0% 0.0% 8 6.5%Pharm & chemicals 6 9.7% 4.8% 4 6.5% 3.2% 2 3.2% 1.6% 0 0.0% 0.0% 12 9.7%Timber/plastics & construction 4 6.5% 3.2% 2 3.2% 1.6% 0 0.0% 0.0% 1 1.6% 0.8% 7 5.6%Utilities/energy industry 5 8.1% 4.0% 0 0.0% 0.0% 1 1.6% 0.8% 3 4.8% 2.4% 9 7.3%Other manufacturing 3 4.8% 2.4% 5 8.1% 4.0% 1 1.6% 0.8% 2 3.2% 1.6% 11 8.9%Transport & communications 3 4.8% 2.4% 3 4.8% 2.4% 1 1.6% 0.8% 4 6.5% 3.2% 11 8.9%Finance/banking & insurance 4 6.5% 3.2% 5 8.1% 4.0% 2 3.2% 1.6% 1 1.6% 0.8% 12 9.7%Information technology 2 3.2% 1.6% 1 1.6% 0.8% 1 1.6% 0.8% 0 0.0% 0.0% 4 3.2%Tourism & leisure 1 1.6% 0.8% 0 0.0% 0.0% 1 1.6% 0.8% 1 1.6% 0.8% 3 2.4%Retail 2 3.2% 1.6% 0 0.0% 0.0% 3 4.8% 2.4% 1 1.6% 0.8% 6 4.8%Distribution 1 1.6% 0.8% 0 0.0% 0.0% 0 0.0% 0.0% 1 1.6% 0.8% 2 1.6%Media 1 1.6% 0.8% 0 0.0% 0.0% 0 0.0% 0.0% 1 1.6% 0.8% 2 1.6%Other service 2 3.2% 1.6% 0 0.0% 0.0% 1 1.6% 0.8% 0 0.0% 0.0% 3 2.4%Other 17 27.4% 13.7% 2 3.2% 1.6% 0 0.0% 0.0% 0 0.0% 0.0% 19 15.3%TOTAL 62 100.0% 50.0% 31 50.0% 25.0% 15 24.2% 12.1% 16 25.8% 12.9% 124 100.0%=Table 4: Cluster breakdown by industry sector =
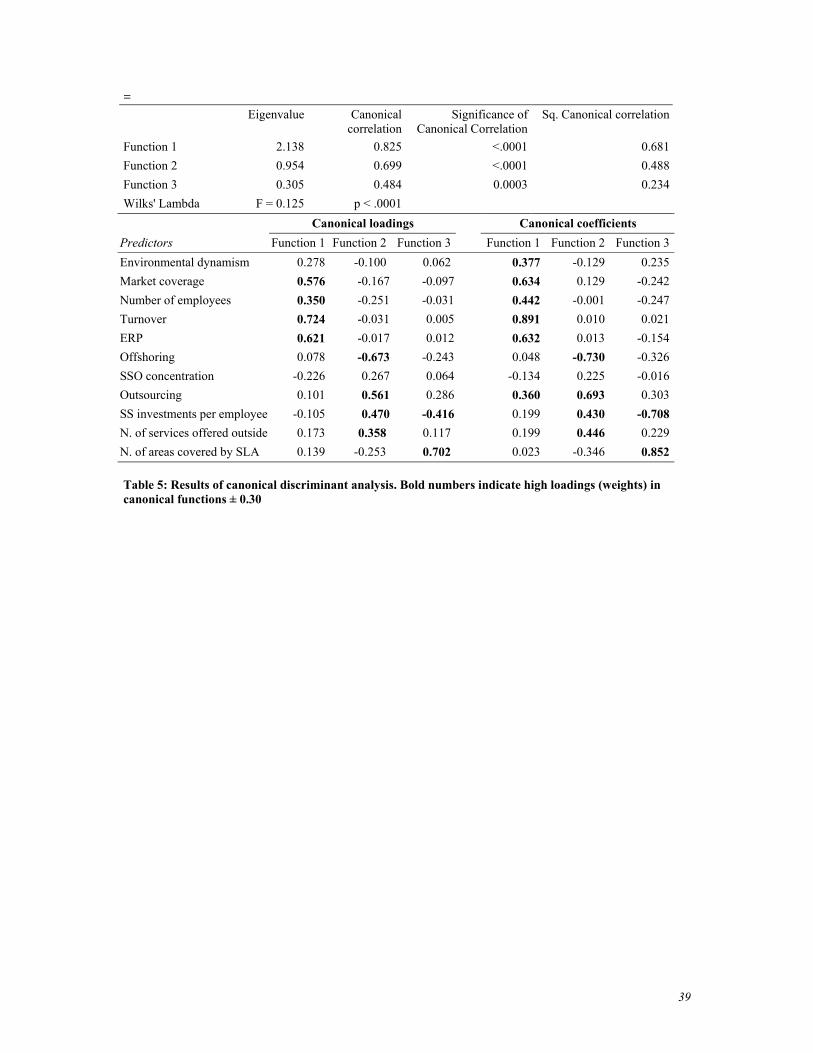
39
= Eigenvalue Canonical
correlationSignificance of
Canonical CorrelationSq. Canonical correlation
Function 1 2.138 0.825 <.0001 0.681Function 2 0.954 0.699 <.0001 0.488Function 3 0.305 0.484 0.0003 0.234Wilks' Lambda F = 0.125 p < .0001
Canonical loadings Canonical coefficients Predictors Function 1 Function 2 Function 3 Function 1 Function 2 Function 3Environmental dynamism 0.278 -0.100 0.062 0.377 -0.129 0.235Market coverage 0.576 -0.167 -0.097 0.634 0.129 -0.242Number of employees 0.350 -0.251 -0.031 0.442 -0.001 -0.247Turnover 0.724 -0.031 0.005 0.891 0.010 0.021ERP 0.621 -0.017 0.012 0.632 0.013 -0.154Offshoring 0.078 -0.673 -0.243 0.048 -0.730 -0.326SSO concentration -0.226 0.267 0.064 -0.134 0.225 -0.016Outsourcing 0.101 0.561 0.286 0.360 0.693 0.303SS investments per employee -0.105 0.470 -0.416 0.199 0.430 -0.708N. of services offered outside 0.173 0.358 0.117 0.199 0.446 0.229N. of areas covered by SLA 0.139 -0.253 0.702 0.023 -0.346 0.852
Table 5: Results of canonical discriminant analysis. Bold numbers indicate high loadings (weights) in canonical functions ± 0.30

40
SSO Configurations Group1 Group2 Group3 Group4 F value (n=62) (n=31) (n=15) (n=16) (probability)
Scope of SS benefits Cluster mean -0.15 (2) 0.45 (1) -0.21 -0.09 F = 3.020 Std deviation 0.89 1.25 0.63 0.96 p = 0.033 Rank 3 1 4 2
Savings per employee Cluster mean 0.01 -0.24 (3) 0.57 (2) -0.09 F = 2.350 Std deviation 0.56 0.44 1.63 1.90 p = 0.076 Rank 2 4 1 3
Savings per SS investment Cluster mean -0.10 (3) -0.10 (3) 0.81 (1,2,4) -0.20 (3) F = 4.100 Std deviation 0.82 0.63 1.96 0.57 p = 0.008 Rank 2 3 1 4
Savings / SS size Cluster mean -0.04 -0.04 0.59 (4) -0.33 (3) F = 2.450 Std deviation 0.84 1.05 1.57 0.62 p = 0.067 Rank 2 3 1 4
Proportion of beneficiaries Cluster mean -0.15 (3,4) -0.29 (3,4) 0.57 (1,2) 0.61 (1,2) F = 5.500 Std deviation 0.82 0.88 1.18 1.27 p = 0.001 Rank 3 4 2 1
SS experience Cluster mean 0.04 -0.03 0.11 -0.21 0.330 Std deviation 0.93 1.00 1.22 1.11 0.802 Rank 2 3 1 4
Table 6: Predictive validity: SSO performance by group. As in table 3, the numbers in parentheses indicate the group number from which this configuration is different at the 0.05 level as indicated by the Scheffe pairwise comparison procedure. The F values have been derived from one-way ANOVAs.
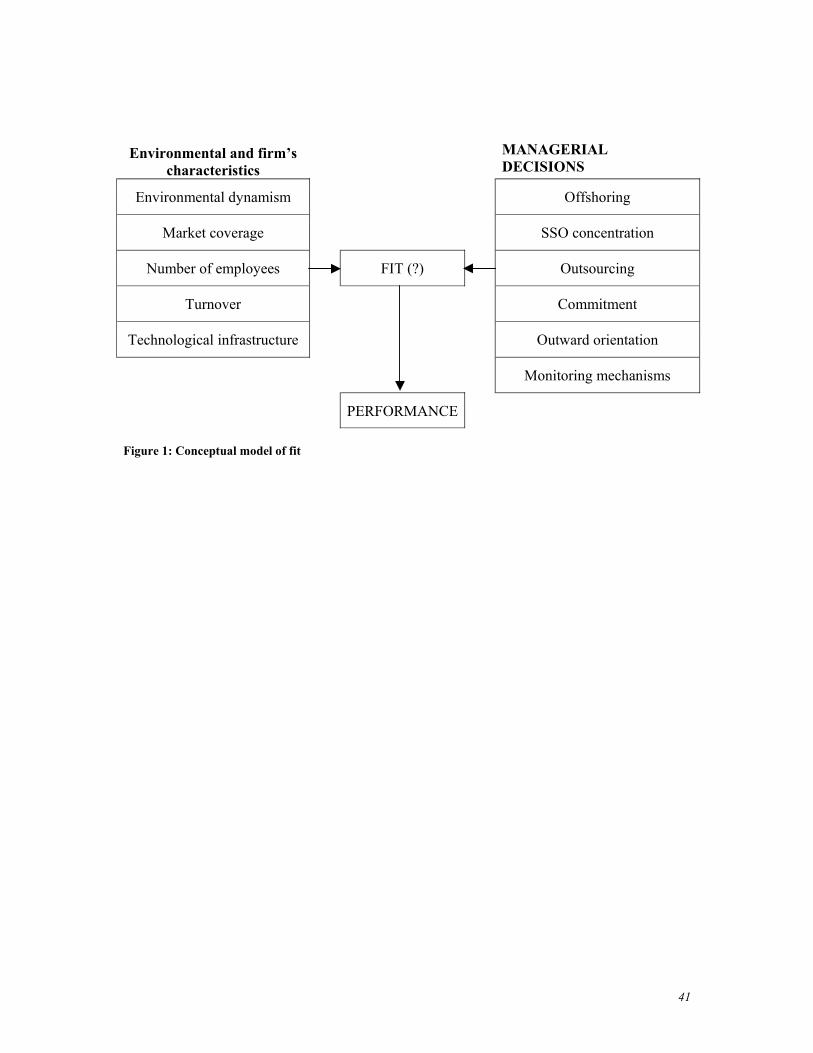
41
Environmental and firm’s characteristics
MANAGERIAL DECISIONS
Environmental dynamism Offshoring
Market coverage SSO concentration
Number of employees FIT (?) Outsourcing
Turnover Commitment
Technological infrastructure Outward orientation
Monitoring mechanisms
PERFORMANCE
Figure 1: Conceptual model of fit
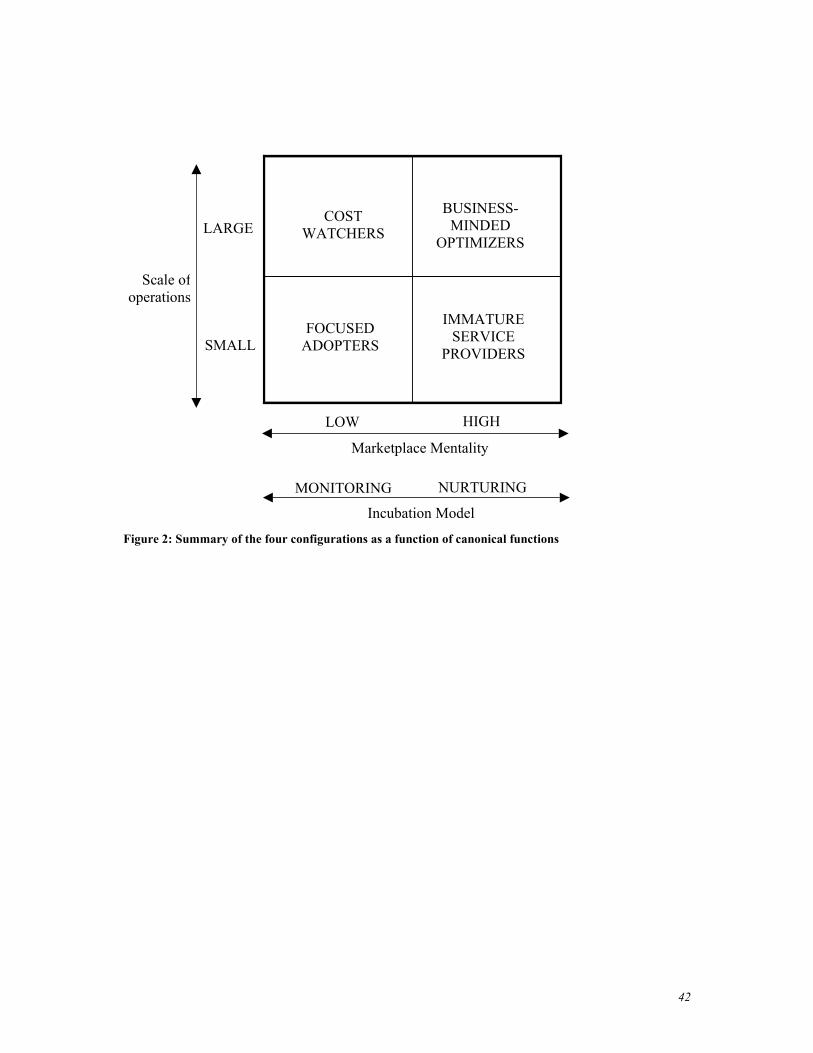
42
Figure 2: Summary of the four configurations as a function of canonical functions
Marketplace Mentality
LOW HIGH
Scale ofoperations
LARGE
SMALL
Incubation Model
MONITORING NURTURING
BUSINESS-MINDED
OPTIMIZERS
COST WATCHERS
FOCUSED ADOPTERS
IMMATURE SERVICE
PROVIDERS