Embed Size (px)
Citation preview

December 2020
Effective policy options for green cities
With evidence from case studies
The completion of this report would not have been possible without generous donor support from the TaiwanBusiness-EBRD Technical Cooperation Fund
The groundwork for this publication and the digital tool was undertaken by the Arup Group and much appreciation goes to the team led by Stephen Cook and Dima Zogheib The report also benefited from contributions and valuable guidance from Sebastian Kriticos (International Growth Centre) Dan Dowling (PricewaterhouseCoopers) İnan İzci (Arguumlden Governance Academy) and Wolfgang Teubner (ICLEI ndash Local Governments for Sustainability)
Many departments and individuals across the EBRD contributed to the document and helped shape its content Among them were Ian Jennings Roland Ramusch and David Tyler from the Sustainable Infrastructure team as well as Nigel Jollands from the Bankrsquos Energy Efficiency and Climate Change team
The development of the report and digital tool was coordinated and supervised under the leadership of Kjetil Tvedt Marcel Schlobach Jinrui Liu Russell Bishop and Mara Solomon of the EBRDrsquos Economics Policy and Governance (EPG) Department Eva Bernard and Theresa Niederle from the EPG team provided valuable input on the inclusion dimensions of the urban policies discussed Editorial multimedia and production guidance was provided by Lidia Creech Dermot Doorly Cathy Goudie and Dan Kelly in the Communications Department
Acknowledgements
Supported by
Contents
Foreword 07
Executive summary 09
01 Introduction 13
02 Urban development trends and regional context
21 Transformation in cities22 Beyond green cities other relevant concepts
18
03 Sector-based policy options
31 Mobility and transport32 Land planning green space and biodiversity33 Energy and buildings34 Water and wastewater 35 Solid waste
28
04 Cross-cutting policy options
41 Governance42 Finance
74
05 Case studies 90
References 189
Abbreviations and acronyms 200
Case studies
Title of case study Related policy options
Integrated urban mobility Burgas Bulgaria
bull Parking policiesbull Road-user chargesbull Planning and regulation of public transport servicesbull Pro-cycling policies
92
Integrated multi-modal transport Strasbourg France
bull Pedestrian-oriented and car-restrictive policiesbull Planning and regulation of public transport servicesbull Pro-cycling policies
94
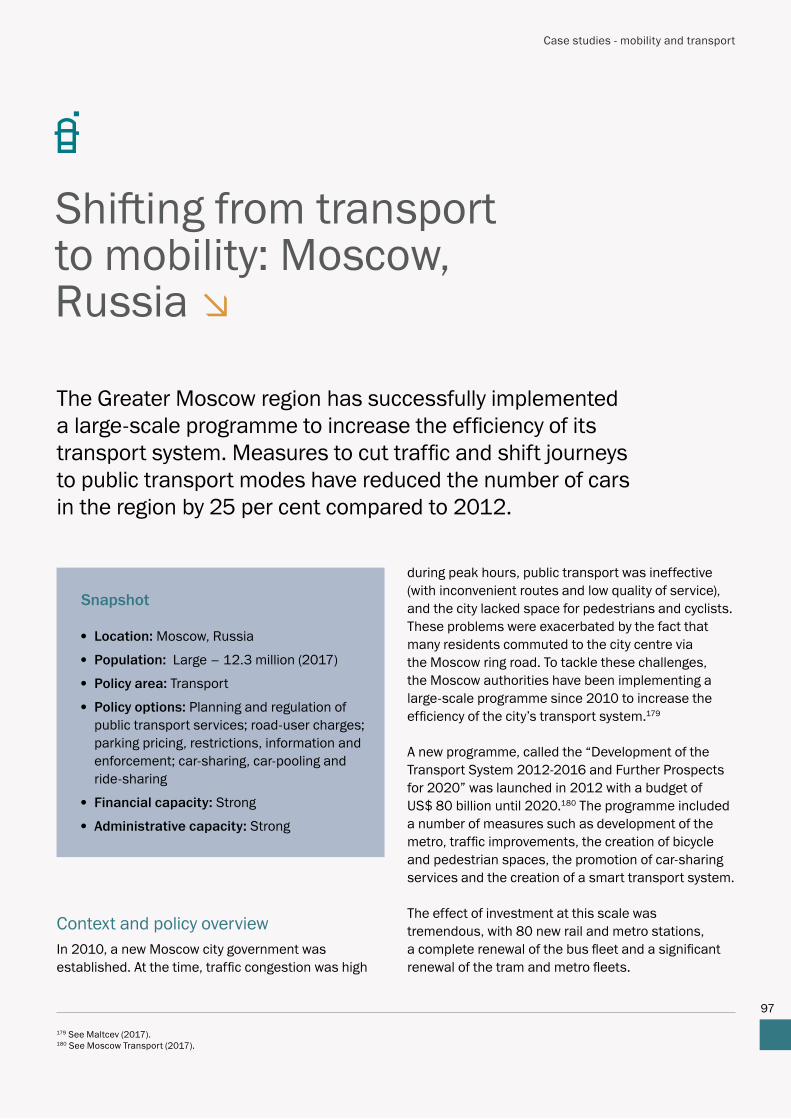
Shifting from transport to mobility Moscow Russia
bull Parking policiesbull Road-user chargesbull Planning and regulation of public transport servicesbull Car-sharing and car-pooling policies
97
Incentives to use public and active transport Freiburg Germany
bull Pedestrian-oriented and car-restrictive policies bull Planning and regulation of public transport services bull Pro-cycling policies
100
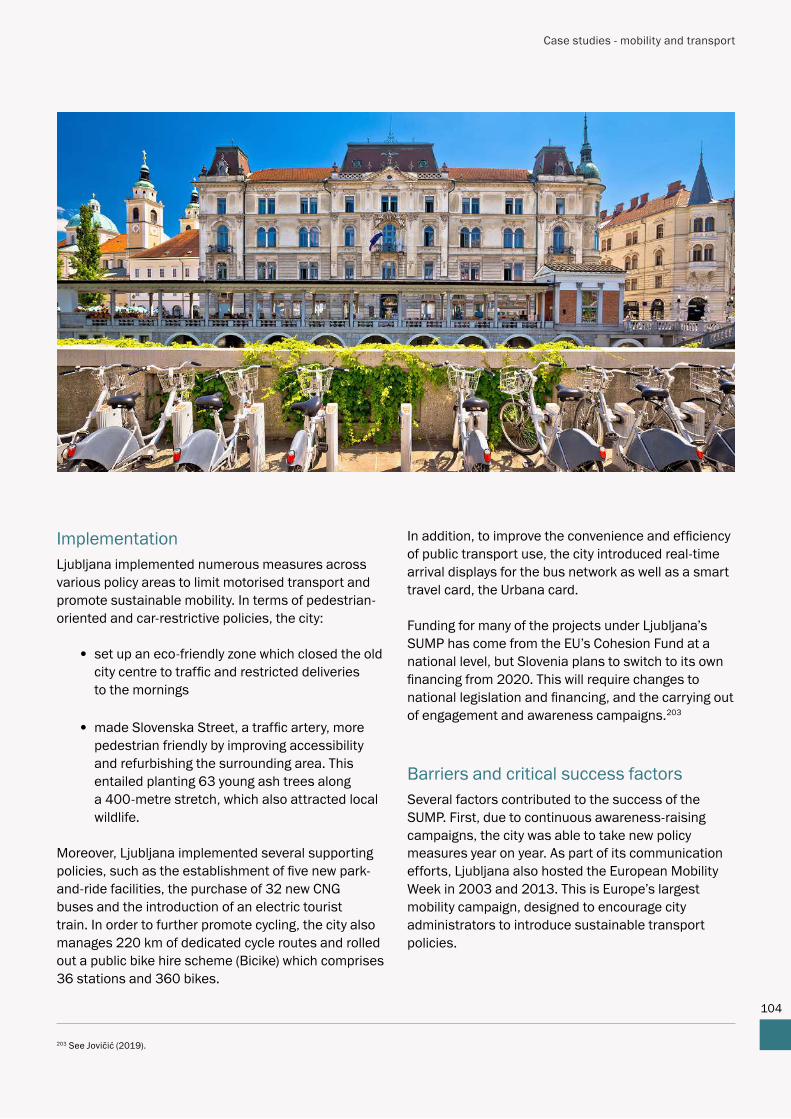
Pedestrianisation and car-free zones Ljubljana Slovenia
bull Pedestrian-oriented and car-restrictive policiesbull Pro-cycling policies
103
Promotion of active transport Lund Sweden
bull Pedestrian-oriented and car-restrictive policiesbull Pro-cycling policies
106
Cycling strategy Copenhagen Denmark
bull Pedestrian-oriented and car-restrictive policiesbull Pro-cycling policies
109
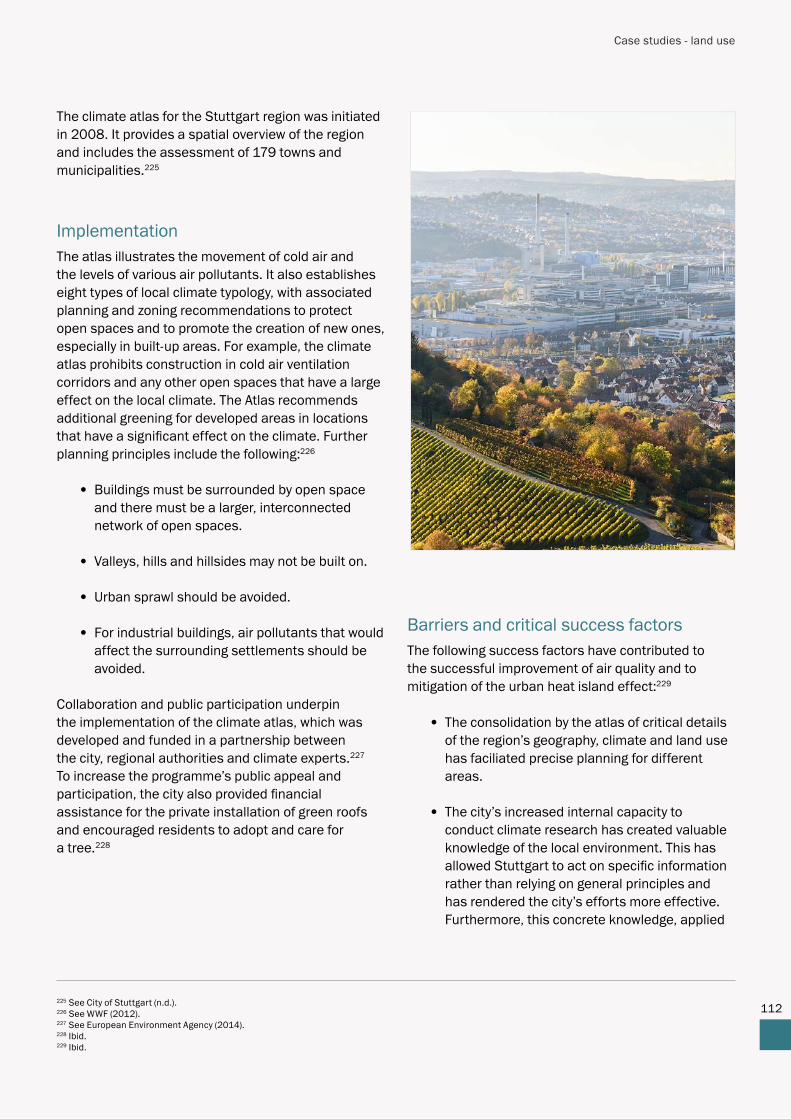
Green ventilation corridors Stuttgart Germany
bull Promotion of green spaces and biodiversity 111
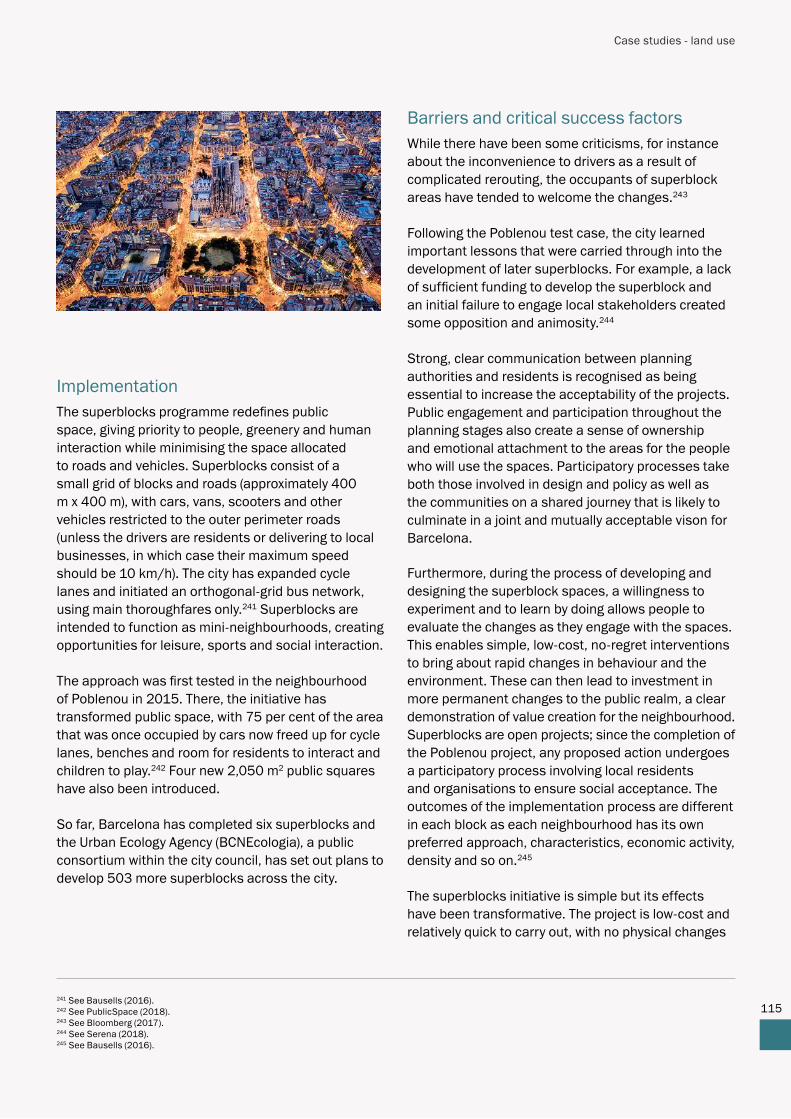
Urban planning with superblocks Barcelona Spain
bull Development of compact citiesbull Promotion of mixed-use areas and transit-oriented
developmentbull Promotion of green spaces and biodiversity
114
Urban regeneration and renewal Roubaix France
bull Promotion of mixed-use areas and transit-oriented development
bull Promotion of community-based land use planning
117
Density bonusing and development Toronto Canada
bull Development of compact cities 120
Policy areas
Transport92
Water140
Solid waste156
Energy and buildings 122
Land use111
Governance175
Finance184
Energy manager obligation Italy bull Support of energy performance contracts 122
Energy performance contracting Berlin Germany
bull Improved energy performance for public buildingsbull Support of energy performance contracts
125
Solar City Seoul Seoul South Korea
bull Improved energy building codes and labellingbull Promotion of renewable electricity generation
128
Carbon reduction reporting programme Tokyo Japan
bull Support of energy performance contracts 131
District heating and cooling Tartu Estonia
bull Decarbonisation of district heating supply 134
Sustainable eco-districts Malmouml Sweden
bull Improved energy building codes and labellingbull Promotion of renewable electricity generation
137
Private contracting in the water sector Yerevan Armenia
bull Regulation and contracting of service providers 140
Micro private-sector participation Madaba Jordan
bull Regulation and contracting of service providersbull Reform and strengthening of water utilitiesbull Effective tariff reforms and price signals
143
Management of water demand Drakenstein South Africa
bull Promotion of resource-efficient utilitiesbull Effective tariff reforms and price signalsbull Awareness campaigns for households and industry
146
Water and wastewater recycling Chennai India
bull Regulation and contracting of service providersbull Reform and strengthening of water utility firmsbull Effective tariff reforms and price signals
149
Water-saving programme Zaragoza Spain
bull Effective tariff reforms and price signalsbull Awareness campaigns for households and industry
151
Public-private partnership agreement Bucharest Romania
bull Regulation and contracting of service providersbull Reform and strengthening of water utilitiesbull Effective tariff reforms and price signals
154
Industrial symbiosis programme Cape Town South Africa
bull Information strategies for residents and industrybull Formalisation of informal waste collection
156
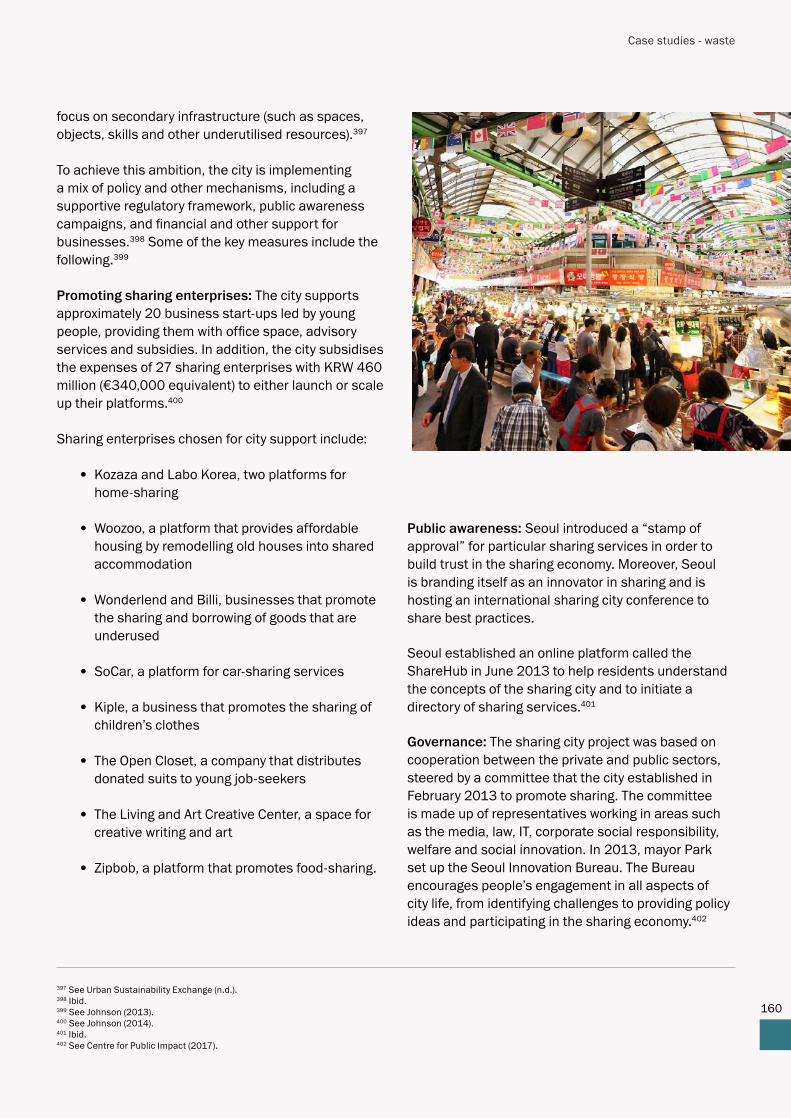
Sharing city project Seoul South Korea
bull Information strategies for residents and industrybull Promotion of sharing and reuse of products
159
Reduce reuse recycle Yokohama Japan
bull Information strategies for residents and industry 163
Zero-waste strategy Ljubljana Slovenia
bull Effective price signals and fundingbull Information strategies for residents and industrybull Waste sorting and treatment to encourage recycling
166
Policy areas
Transport92
Water140
Solid waste156
Energy and buildings 122
Land use111
Governance175
Finance182
Zero-waste strategy Parma Italy bull Effective price signals and fundingbull Information strategies for residents and industrybull Waste sorting and treatment to encourage recycling
169
Formalisation of informal waste pickers Belo Horizonte Brazil
bull Formalisation of informal waste collectorsbull Improvement of waste collection services
172
Political and fiscal decentralisation Poland
bull Political and fiscal decentralisation 175
Smart city performance monitoring Austria Vienna
bull Improved transparency and accountability 177
Co-designing and co-creating urban solutions Cluj-Napoca Romania
bull Effective stakeholder participation 180
Land Value Capture Bogotaacute Colombia
bull Improved revenue and financial autonomy 182
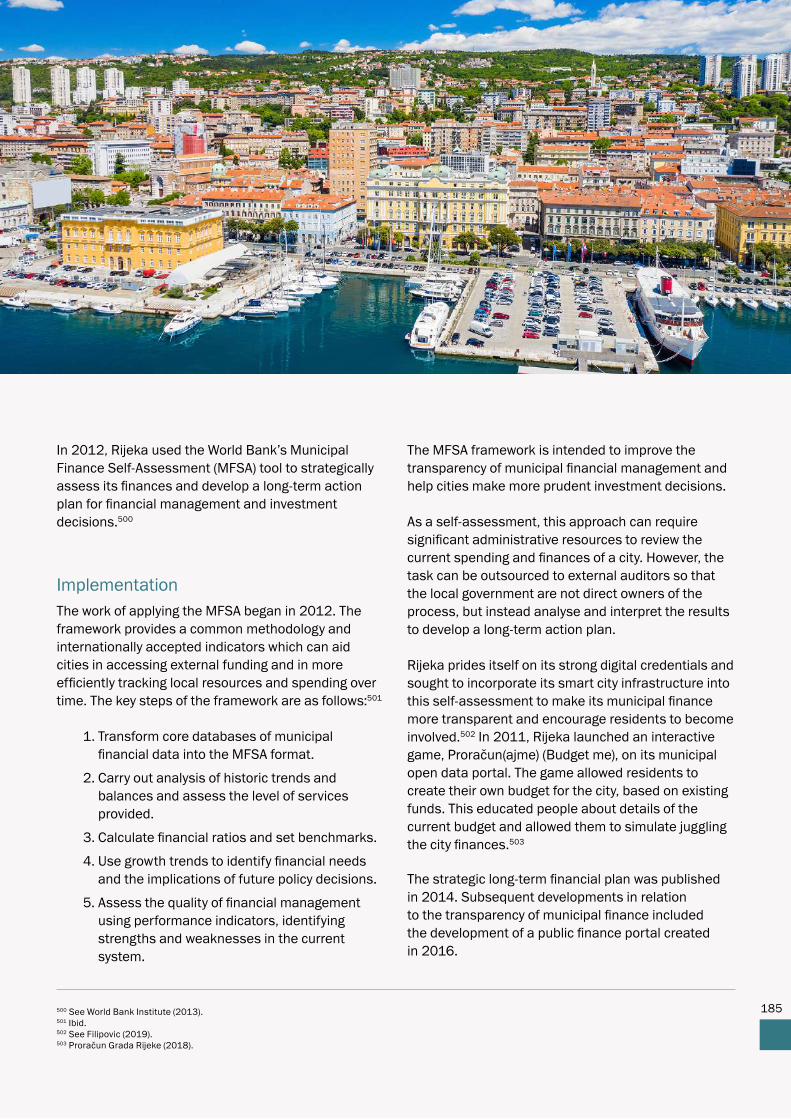
Diagnosis framework for municipal finance Rijeka Croatia
bull Improved financial accountability and transparency 184
Climate Fund Melbourne Australia bull Improved revenue and financial autonomy 187
Policy areas
Transport92
Water140
Solid waste156
Energy and buildings 122
Land use111
Governance175
Finance182
7
Maintaining economic growth while creating sustainable cities for all is the biggest urban challenge that countries face today More than half of the worldrsquos population lives in cities and that share is projected to reach 68 per cent by 2050 Cities and metropolitan areas are engines of economic growth contributing about 80 per cent of global GDP However they
also account for about 60 per cent of global carbon emissions and more than 70 per cent of energy use1 2 Today many cities struggle with environmental degradation inadequate urban infrastructure and traffic congestionsup3 These challenges will become only more pressing if the pace and pattern of urbanisation continues
Foreword
This report presents impactful urban policy options and case studies that can help cities accelerate their green agendas A digital tool for specific policies and case studies will accompany the final version of this document ndash see wwwebrdgreencitiescom
sup1 See United Nations (2018) sup2 See United Nations (nd)sup3 See United Nations Environment Programme (2019)
Foreword
8
Against this backdrop the EBRD launched its Green Cities Framework in 2016 to systematically promote sustainable urban development across the Bankrsquos regions Today EBRD Green Cities is our largest investment programme covering 44 cities in 22 countries with more than euro15 billion committed by the EBRD and multiple donors for investments and technical support Recently as cities have been at the forefront of the Covid-19 crisis the programme has become even more important supporting our partner cities as they ldquobuild back betterrdquo from the pandemic
While investments in sustainable infrastructure are crucial complementary policy reforms also play a vital role in helping to achieve systemic impact However through our work with EBRD Green Cities we have noticed the lack of a cross-sectoral overview of green urban policy options that could guide municipal authorities and relevant stakeholders in the selection design and implementation of effective policies This report aims to develop such an overview and contribute to a shared vision of the role and opportunities of city-led policy initiatives and programmes It seeks to raise awareness of the potentially impactful role of policy initiatives of how they interact with other urban policies and in particular how policies can enhance and complement the environmental benefits of municipal investment programmes
While this publication was produced in the context of EBRD Green Cities and all policies and case studies have been selected and presented with the EBRD regions in mind itis highly relevant for any city seeking green solutions regardless of its location The policy options and case studies detailed in this document are structured around seven policy areas with each policy option and case study presented in a brief and hands-on manner The content aims to be practical and accessible to a wide range of
stakeholders including those with limited technical or policymaking experience
The process of drafting this report was complex The main challenge was the integrated nature of urban policies and the multiple benefits (and costs) that one policy may create directly and indirectly for different stakeholders In this complex landscape of activities and outcomes it is sometimes difficult to structure and categorise policies and benefits in a simple way without losing too much of the true picture Fortunately we are not the first institution to compile a structured overview of urban policies In drafting this report we benefited greatly from the support and expertise of a wide range of external partners as well as from the knowledge and help of many teams across the EBRD A detailed list of contributors is available in the acknowledgement section at the front of this report
As the content of this report and its accompanying digital tool will be shared and explored among policymakers stakeholders and other interested parties the EBRD expects to collect a rich set of feedback and suggestions that it will incorporate and build on We hope that this will be reflected in an even richer set of policy options and case studies in future In addition we aim to further emphasise aspects of smart inclusive and resilient urban development ndash as well as their interaction with green urban policies ndash in future updates to the digital tool and this report We look forward to intensifying our work with partners around urban policies and hope that this report serves as an important step in this direction
Elisabetta Falcetti Director Sector Economics and Policy EBRD
ldquoToday EBRD Green Cities is our largest investment programme covering 44 cities in 22 countries with more than euro15 billion mobilised by the EBRD and multiple donors for investments and technical supportrdquo
Elisabetta Falcetti
9
1 IntroductionWith the pace of urbanisation accelerating globally it is almost impossible to discuss the opportunities and challenges of sustainable development without reflecting on the role and impact of cities
On the one hand cities are powerhouses of economic growth generating more than 80 per cent of global GDP On the other hand they also account for about 70 per cent of energy use and 60 per cent of greenhouse gas emissions4 5
Given the transformative power of cities ndash for better or for worse ndash sustainable urban development has moved to the centre of the global development agenda This is most prominently reflected in Goal 11 of the United Nations (UN) Sustainable Development Goals (SDGs) which seeks to ldquomake cities and human settlements inclusive safe resilient and sustainablerdquo by 20306
However not only has more attention been given to cities lately but the way of looking at cities and urban development has also changed over the years Whereas the focus was previously on economically efficient cities often linked to car-based urban planning today the idea of a green and people-centric urban development dominates
In this view residents are seen both as important users of urban spaces and services and also as important guardians of accountability ensuring well-governed and inclusive urban development In addition there is a growing recognition that cities do not merely provide close proximity between the workforce and fixed places of employment but also represent dynamic arenas for interaction between the working and resident populations which are increasingly embedded in a digitalised environment
Given all of these issues it is becoming clear that sustainable urban development should
be pursued through a systematic and holistic approach Such an approach must go beyond cross-sectoral planning and coordination to combine and integrate investment programmes with well-defined policy frameworks and put residents at the centre An inclusive and participatory approach to sustainable urban development is vital to ensure the participation of residents and guarantee that all interests including those of marginalised groups are considered when developing implementing and maintaining urban solutions
In response to this awareness in 2016 the EBRD developed its Green Cities Framework in order to promote sustainable urban development across the Bankrsquos regions in a systematic and holistic manner EBRD Green Cities is now the largest investment programme of the Bank with more than euro15 billion mobilised from the EBRD and external donors for investment and technical support and more than 40 cities signed up to date The programme seeks to help cities identify and address their key environmental challenges through evidence-based diagnostics and an inclusive planning process ndash followed by the preparation and implementation of priority investments and policy initiatives
2 Content of this reportIn light of the importance of well-defined and inclusive policy initiatives as part of any agenda for sustainable urban development this report presents impactful urban policy options and related case studies relevant to cities pursuing an agenda of this kind
The report structures these policy options and case studies around seven policy areas ndash five sector-specific areas (urban transport land planning energy efficiency and buildings water and wastewater solid waste) and two cross-sectoral or enabling policy areas (governance and financing) Within each policy area the main five to ten policy options are presented in
Executive summary
4 See United Nations (nd)5 See World Bank Group (2020)6 See UN (2020)
Executive summary
10
terms of their resource implications benefits and risks necessary conditions typical implementation challenges or expected opposition and critical success criteria The listed policy options are backed by relevant case studies from cities located within and outside the EBRD regions These case studies have been selected on the basis of a multi-criteria analysis which ranked them in terms of their characteristics such as replicability transparency community buy-in and so on
This report provides a useful and practical source of references for a wide range of urban stakeholders and interested parties and promotes a shared understanding of the possibilities and likely implications of various policy initiatives The policy options and case studies are concise7 This report does not aim to provide support on how to identify environmental shortcomings in a city Rather it assumes that the shortcomings have been identified prior to using this knowledge product However readers can use the menu of policy options to guide any form of gap analysis undertaken by cities seeking to accelerate their green agenda8
The report content is oriented towards the cities in the EBRD regions taking part in the Green Cities programme ndash a practical framework that aims to help cities prioritise and implement investments and urban policies Hence for the purposes of this publication policies are understood as being most non-investment activities that target the lsquogreeningrsquo of cities that municipal authorities can implement or influence within five years and that can generate material impact within five to ten years Consequently this report does not cover high-level strategic policies or visionary plans more suitable for central governments Instead it focuses on tactical and operational policy options that fall within municipal control and influence Among others these options include planning regulation incentives funding and financing skills development capacity-building and monitoring as well as attitude campaigns awareness-raising and information programmes
3 The main issues in each of the seven policy areasUrban transport Cities across the region face high levels of air pollution due to growing car ownership and insufficient vehicle standards compounded by a lack of attractive public and active modes of transport Relevant green transport policies include those that aim to restrict car use on the one hand and to promote public and active mobility on the other Furthermore cities can promote cleaner vehicles including through the electrification of urban transport
Land use and biodiversity Some cities in the EBRD regions face uncontrolled population growth and urban sprawl Other cities may be more stagnant while suffering from a legacy of poor availability of recreational and green infrastructure and from limited biodiversity Potential policies to tackle these challenges include the development of compact cities the promotion of mixed-use areas and transit-oriented urban development the promotion of green spaces and the encouragement of community-based land-use planning
Energy efficiency and buildings Many economies in which the EBRD invests share a legacy of buildings characterised by poor energy efficiency and high electricity and heat consumption commonly linked to fossil fuels Policies to address these issues cover initiatives that promote energy-efficient buildings ensure better price signals and more energy-conscious consumption and help decarbonise the provision of heat and electricity
Water sector In the EBRD regions cities experience high levels of ldquonon-revenuerdquo water use water pollution and the overuse of water resources as well as significant climatic stresses which are bound to increase Policies aimed at the supply side focus on water utilities and include the regulation and contracting of public and private service providers the reform and strengthening of water utility firms and the promotion of resource-efficient utilities Policies that target water users include effective tariff reforms and price signals as well as awareness campaigns for households and industry
7 A digital tool for easy access to specific policies and case studies accompanies this report and is available at wwwebrdgreencitiescom8 For guidance on how to identify and map a cityrsquos environmental challenges through an evidence-based and holistic process readers may explore the methodology for a Green City Action Plan as outlined at wwwebrdgreencitiescom
Executive summary
11
Solid waste sector Inadequate management of municipal and industrial waste is common among these cities leading to contamination of land and groundwater as well as failure to support a lsquocircular economyrsquo model Policies in this area focus on how cities can ensure more effective governance and buy-in as well as on targeted initiatives to increase recycling and recovery rates Here the policy instruments include improved planning accountability structures price signals and funding combined with information strategies for residents and businesses and the formalisation of informal waste-collection services
Governance The legacy of poor local governance and low administrative and financial capacity across cities in these regions is detrimental to the implementation of the green urban policies mentioned above Policies that can be implemented to improve governance among local governments include political and fiscal decentralisation improved transparency and accountability enhanced integration and coordination across government bodies strong stakeholder consultation processes and the building of awareness and engagement among a diversity of interest groups ndash some of which may face disproportionate barriers to economic opportunities
Finance Financial constraints are widespread within cities in the EBRD regions This is often due to declining populations or a lack of creditworthiness and limited access to financing which can hinder the delivery of public services Policies to improve the financial health and autonomy of cities include initiatives to upgrade their financial planning and management boost revenue collection and enhance accountability and transparency all of which can help to enhance a cityrsquos creditworthiness and financial autonomy
4 Other key messagesUrbanisation patterns differ significantly across the EBRD regions The EBRD operates in 38 economies across three continents (see Table 1 for details) Across the EBRD regions which include economies as far east as Mongolia and as far west as Morocco population patterns and urban trends differ significantly Economies in the southern and eastern Mediterranean region Central Asia and Turkey generally have young and growing populations paired
with increasing levels of urbanisation In contrast the countries in central eastern and south-eastern Europe tend to have ageing stagnating or shrinking populations with the majority of cities experiencing a decline in population
The EBRD regions also share a legacy of minimal decentralisation and immature private-sector participation The centralised top-down structure in many economies has led to inadequate local accountability procedures and hence poor governance It has also limited capacity and expertise among local authorities and inhibited trust in local administrations and buy-in and engagement among the populace Among the former socialist economies in the EBRD regions there is also a legacy of poor price signals and a limited role for commercial solutions leading to continued resource inefficiencies and an immature involvement of the private sector As a result poor operational and environmental performance and a lack of people-centric urban development remains widespread in many of these regions
Decentralisation is important and should be facilitated by local capacity-building Cities that want to pursue an ambitious green agenda should be empowered to take initiatives and make their own decisions Cities must also be able to incorporate feedback from local community representatives and city authorities should be held accountable by the local population That said central governments tend to be reluctant to transfer decision-making and financial powers to regional and municipal authorities in particular where local capacity is weak Cities should help to encourage and prepare for the decentralisation process by strengthening their procedures capacity and expertise
Effective private-sector solutions require mature city administrations Deeper private-sector involvement can offer innovative solutions relevant expertise and better contractual arrangements However many local authorities in the EBRD regions have limited capacity and experience with effective private sector contracting Such administrative capacity and experience takes time to acquire Therefore in the absence of robust administrative experience a gradual build-up of capacity is recommended
Despite their differences many cities face similar environmental challenges and policy needs All cities are unique in their economic social and
Executive summary
12
political composition and urban policies must be tailored to each case Nevertheless cities often face similar environmental challenges and the relevant policy solutions often entail significant similarities This report appreciates these similarities while recognising the main differences between the typologies of cities in different regions
The most successful cities plan a mix of policies and investments Standalone policies and investments often fail to fully benefit from the synergies of optimal coordination and sequencing of interrelated policies investments and the involvement of residents While this may sound obvious developing a shared vision and a coordinated effort can be difficult in a city where departments work in lsquosilosrsquo
Inclusive urban development has numerous critical benefits The co-development of urban solutions may be difficult where there is a weak culture of active involvement by residents Nevertheless (i) many cities have been able to cut costs and improve quality by proactively involving their residents and their varied interest groups ndash despite the upfront costs linked to such initiatives This involvement should include marginalised groups and women in particular Moreover (ii) inclusive urban development is better at
addressing inequality issues experienced by women and marginalised groups and (iii) a broad supporter base for a specific green or inclusive urban agenda makes it more sustainable as it is harder for new or existing political or administrative authorities to divert from the initial plan
There are many impactful policy options that have moderate implications for a city budget However many of these options which may include active regulation and pricing of the behaviour of commercial users and residents can be politically costly and may thus be better introduced as part of a policy mix Other policy options may not be financially costly but may involve comprehensive private-sector participation and therefore require institutional capacity-building
Long-term shared visions are necessary to ensure effective and sustainable urban development While the policy options presented in this report have a short to medium-term timeframe a clear long-term political vision which may seek to pursue gradual change over time is required as a foundation for sustainable urban development
13
14
Introduction
01
15
The European Bank for Reconstruction and Development (the EBRD or the Bank) has developed a new strategic approach to addressing urban environmental challenges in the economies where it invests the EBRD Green Cities Framework With a volume of euro15 billion it is one of the Bankrsquos largest investment programmes and a flagship product EBRD Green Cities seeks to help cities identify and prioritise environmental challenges and address them through targeted investments services and policy instruments in a strategic and holistic manner The programme was initiated at the end of 2016 and now covers more than 40 cities in the EBRD regions
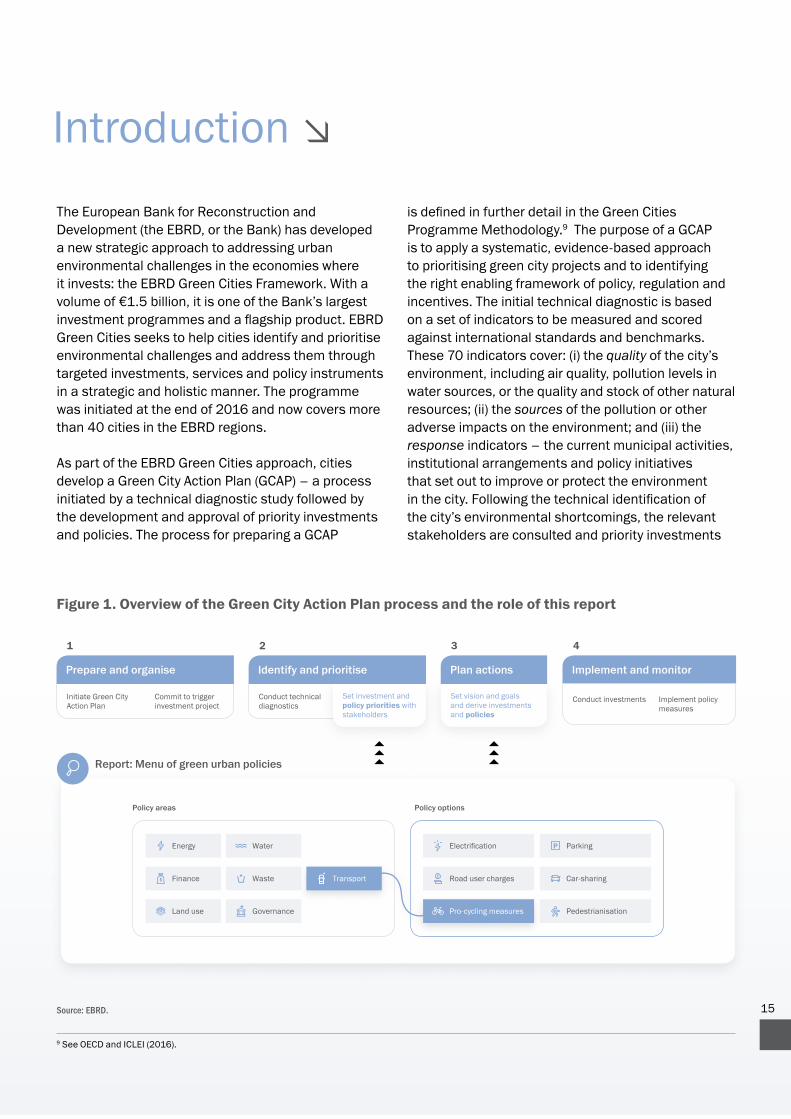
As part of the EBRD Green Cities approach cities develop a Green City Action Plan (GCAP) ndash a process initiated by a technical diagnostic study followed by the development and approval of priority investments and policies The process for preparing a GCAP
is defined in further detail in the Green Cities Programme Methodology9 The purpose of a GCAP is to apply a systematic evidence-based approach to prioritising green city projects and to identifying the right enabling framework of policy regulation and incentives The initial technical diagnostic is based on a set of indicators to be measured and scored against international standards and benchmarks These 70 indicators cover (i) the quality of the cityrsquos environment including air quality pollution levels in water sources or the quality and stock of other natural resources (ii) the sources of the pollution or other adverse impacts on the environment and (iii) the response indicators ndash the current municipal activities institutional arrangements and policy initiatives that set out to improve or protect the environment in the city Following the technical identification of the cityrsquos environmental shortcomings the relevant stakeholders are consulted and priority investments
Introduction
9 See OECD and ICLEI (2016)
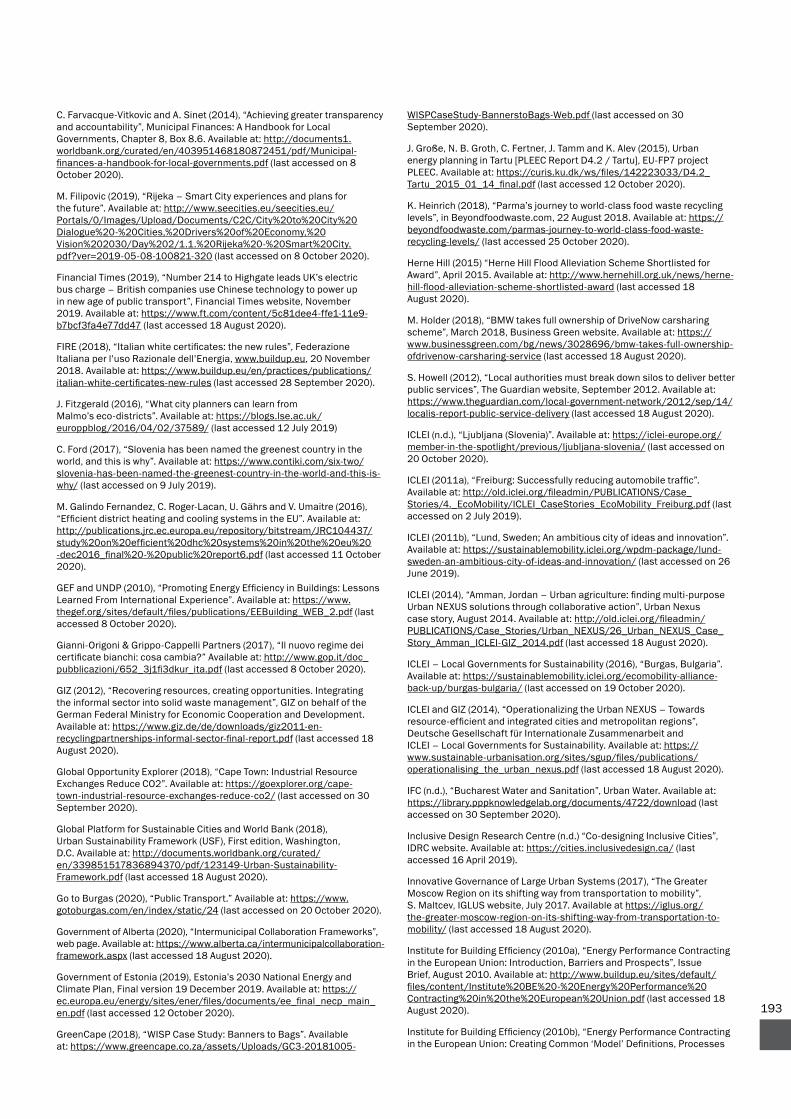
Figure 1 Overview of the Green City Action Plan process and the role of this report
Source EBRD
1 2 3 4
Initiate Green City Action Plan
Commit to trigger investment project
Prepare and organise Implement and monitor
Conduct technical diagnostics
Set investment and policy priorities with stakeholders
Identify and prioritise
Set vision and goals and derive investments and policies
Plan actions
Report Menu of green urban policies
Energy Electrification Parking
Pro-cycling measures Pedestrianisation
Road user charges Car-sharing
Water
Finance Waste Transport
Land use Governance
P
Policy areas Policy options
Conduct investments Implement policy measures
Introduction
and policies are identified and developed to address these challenges
In order to support the recommendations that emerge from the development of a GCAP and to further strengthen policy discussions in cities participating in the Green Cities programme the EBRD has developed a knowledge product in the form of this report It presents policy options and practical case studies that can be effective in mitigating reducing and addressing the environmental challenges that cities face
Menu of policy options and case studies
The policy options in this report (see Figure 2) are structured around seven areas ndash five sector-specific areas (transport water solid waste land use and energy) and two cross-sectoral or lsquoenablingrsquo areas (governance and finance) Within each policy area the main five to ten policy options are presented in terms of their resource implications benefits and risks and necessary conditions as well as key implementation challenges and critical success criteria In line with the market-oriented mandate of the EBRD the policy descriptions also include ways to unlock or integrate private sector participation The policy options (or policy instruments) are further backed and illustrated by relevant practical case studies10
Selection of policy options and case studies Combining top-down and bottom-up approaches
The policy options and case studies presented in this report were selected through the combination of a bottom-up and a top-down approach The top-down approach relates to extensive desk research and literature reviews The structuring of the policy options and case studies derives from the seven policy areas for each of which the report outlines the most relevant environmental challenges and targets
The bottom-up approach is based on the development of a long list of potential case studies and the policies they represent All of the potential case studies were assessed in terms of the kind of policies and cities they covered and through a comprehensive evaluation based on criteria such as impact effectiveness political acceptability transparency or replicability
To evaluate the relevance of potential policies necessary metadata about each policy and case study were collected To enable future users to understand and use them effectively a number of policy characteristics were drawn up from academic literature and international organisations for example from the OECD11 Similarly for the case studies a list of policy evaluation criteria such as effectiveness and administrative viability was developed to assess the
10 A guided and user-friendly path to the relevant content of this knowledge product is also available through a digital tool at ebrdgreencitiescom11 See OECD (ndb)
Figure 2 Structure of the policy areas policy options and case studies
Source EBRD
Energy CopenhagenElectrification Parking
Pro-cycling measures Pedestrianisation
Road user charges Car-sharing
Water Strasbourg
Finance FreiburgWaste LjubljanaTransport
Land Use LundGovernance Burgas
P
Policy areas Policy options Case studies
16
Introduction
17
policy delivery policy outcomes and impacts such that cities can take these examples and apply the policies that have been used most effectively12
This suite of policy options should also relate to the range of characteristics of cities where the EBRD Green Cities programme is being implemented The assessment of city characteristics provides an insight into whether a city has the right conditions to ensure the success of a specific policy To some extent the current GCAP methodology already carries out such an approach through the political framework reports which include a preliminary review of policy finance and governance to develop a project-prioritisation matrix
Objectives and limitations of this report
The objective of this report is to help guide and stimulate the policy discussions taking place in cities ndash in the EBRD regions and beyond ndash that are aiming to accelerate their green agenda The report aims to promote a shared understanding of the possibilities and likely implications of various policy initiatives and provide practical advice on their delivery in combination with relevant investment programmes The intention is to create a practical and concise reference point for a wide range of urban stakeholders and interested parties While this knowledge product does not seek to provide detailed instructions on how to plan and implement specific policies it aims to offer useful guidance on what to expect and to consider supported by practical case studies and lessons learned
The reportrsquos content is oriented towards cities in the EBRD regions taking part in the Green Cities programme As a consequence the menu of policy options and case studies is limited in the following ways
bull The policy options presented here are primarily relevant to cities and do not cover high-level strategic policies or visionary plans that are more suitable for central governments Instead the focus is on tactical and operational policy options that fall within municipal control and influence
bull This report emphasises effective policy options rather than green investments to address environmental challenges It covers options that can be pursued and implemented within a five-year period in a process that is primarily city-driven The policy options lead to material impact in the medium term in other words five to ten years For example a parking policy that may influence the urban transport sector within a few years would be included as a policy option rather than a strategic pursuit of a compact urban design that would take decades to achieve material results
bull This report does not provide support on how to identify environmental shortcomings in a given city Rather it assumes that the environmental shortcomings have been identified prior to using this knowledge product For guidance on how to identify and map a cityrsquos environmental challenges through an evidence-based and holistic process the reader may explore the GCAP methodology outlined at wwwebrdgreencitiescom
Overall relevant public policies should be understood here as meaning most non-investment activities that target the greening of cities and that municipal authorities can implement or influence and expect to generate impact within three to eight years Among other activities these include planning and monitoring regulation incentives funding and financing skills development and capacity-building as well as awareness-raising attitude campaigns and information programmes This report also presents new technical solutions but with an emphasis on policies that enable such new solutions to be applied
12 Note that quantitative ex-post evaluations of individual policies are rarely possible The causal linking of a policy with an outcome is prevented by the scale and timescale of impact and the presence in a real city of innumerable confounding factors The exceptions to this occur when a policy of major significance is implemented (for example the London congestion charge) Nevertheless policy impact can be judged through a combination of quantitative data anecdotal information research across multiple locations and information from those whom a policy has targeted This caution should be reflected in the language used to document a policy evaluation
18
19
Urban development trends and regional context
21 Transformation in cities
22 Beyond green cities other relevant city concepts
02
20
21 Transformation in cities
Demographic trends in the EBRD regionsPatterns of population growth and composition differ significantly across the EBRD regions which include economies as far east as Mongolia and as far west as Morocco (see Table 1 for details) Economies in the southern and eastern Mediterranean region and
Central Asia have young and growing populations while in central eastern and south-eastern Europe populations are declining
As documented in the EBRDrsquos Transition Report 2018-19 Central Asia the southern and eastern Mediterranean and Turkey currently find themselves in the early stages of their demographic transition ndash with large increasingly young populations
Urban developmenttrends and regional context
Policy considerations must recognise the priorities and needs of different types of cities which can vary considerably in their size geography and history
Region Economies
Central Asia Kazakhstan Kyrgyz Republic Mongolia Tajikistan Turkmenistan Uzbekistan
Central Europe and the Baltic states
Croatia Estonia Hungary Latvia Lithuania Poland Slovak Republic Slovenia
Eastern Europe and the Caucasus
Armenia Azerbaijan Belarus Georgia Moldova Ukraine
South-eastern Europe Albania Bosnia and Herzegovina Bulgaria Cyprus Greece Kosovo Montenegro North Macedonia Romania Serbia
Southern and eastern Mediterranean
Egypt Jordan Lebanon Morocco Tunisia West Bank and Gaza
Other Russia Turkey
Table 1 Economies where the EBRD invests
Source EBRD
Urban development trends and regional context
21
In contrast the demographic transformation in central eastern and south-eastern Europe is much more advanced compared to the emerging markets in Asia Latin America and parts of the Middle East and Africa Populations in emerging Europe are growing more slowly or even shrinking and ageing at approximately the same rate as the populations of advanced European economies due to a combination of modest birth rates and continued improvements in life expectancy often exacerbated by the emigration of young people to other EU countries For instance from 1992-2015 the population of eastern Europe shrank by 18 million (around 6 per cent) with the trend accelerating as a number of countries joined the European Union which gave workers the ability to travel freely to other nations within the bloc13 In contrast southern European countries have observed an increase in emigration despite high unemployment rates persisting after the 2008 global financial crisis with net migration up to +013 per cent14 It is worth noting that this trend of emigration from eastern European countries has slowed in recent years These countries have experienced the highest levels of
return migration in Europe leading to a stabilisation of net migration at -023 per cent of population per year as economic conditions have strengthened
Urbanisation trends in the EBRD regions
There is a global trend of increasing urbanisation with 55 per cent of the worldrsquos population today living in urban areas and this proportion expected to increase to 68 per cent by 205015 Over the past 25 years the EBRD regions have experienced on average a steady process of urbanisation with more than 60 per cent of the population living in urban areas today16 However within the EBRD regions there are significant variations from country to country ranging from 27 per cent of the population living in urban areas in Tajikistan to over 90 per cent in Jordan (see Figure 2)
Source World Development Indicators urban population (percentage of total population) (httpsdataworldbankorgindicatorspurbtotlinzs) and EBRD staff calculations as presented in the report Creating Liveable Cities Regional Perspectives)17
100
90
80
70
60
50
40
30
20
10
0
Tajik
ista
n
Kyr
gyz
Rep
ublic
Mol
dova
Egyp
t
Bos
nia
and
Her
zego
vina
Uzb
ekis
tan
Turk
men
ista
n
Slov
ak R
epub
lic
Rom
ania
Slov
enia
Azer
baija
n
Serb
ia
Croa
tia
Kaz
akhs
tan
Nor
th M
aced
onia
Geo
rgia
Alba
nia
Pola
nd
Mor
occo
Arm
enia
Mon
tene
gro
Cypr
us
Lith
uani
a
Latv
ia
Mon
golia
Tuni
sia
Esto
nia
Ukr
aine
Hun
gary
Rus
sia
Turk
ey
Bul
garia
Wes
t Ban
k an
d G
aza
Bel
arus
Gre
ece
Leba
non
Jord
an
Figure 2 Share of urban population to total population 2017 (per cent)
13 See The Economist (2017) 14 See Batsaikhan et al (2018) 15 See UN (2018a) 16 Urban areas are often defined as settlements with populations of more than 5000 inhabitants although national statistical definitions vary Other criteria may include population density type of economic activity physical characteristics level of infrastructure or a combination of these and other criteria See Deuskar (2015) 17 See AfDB et al (2019)
Urban development trends and regional context
22
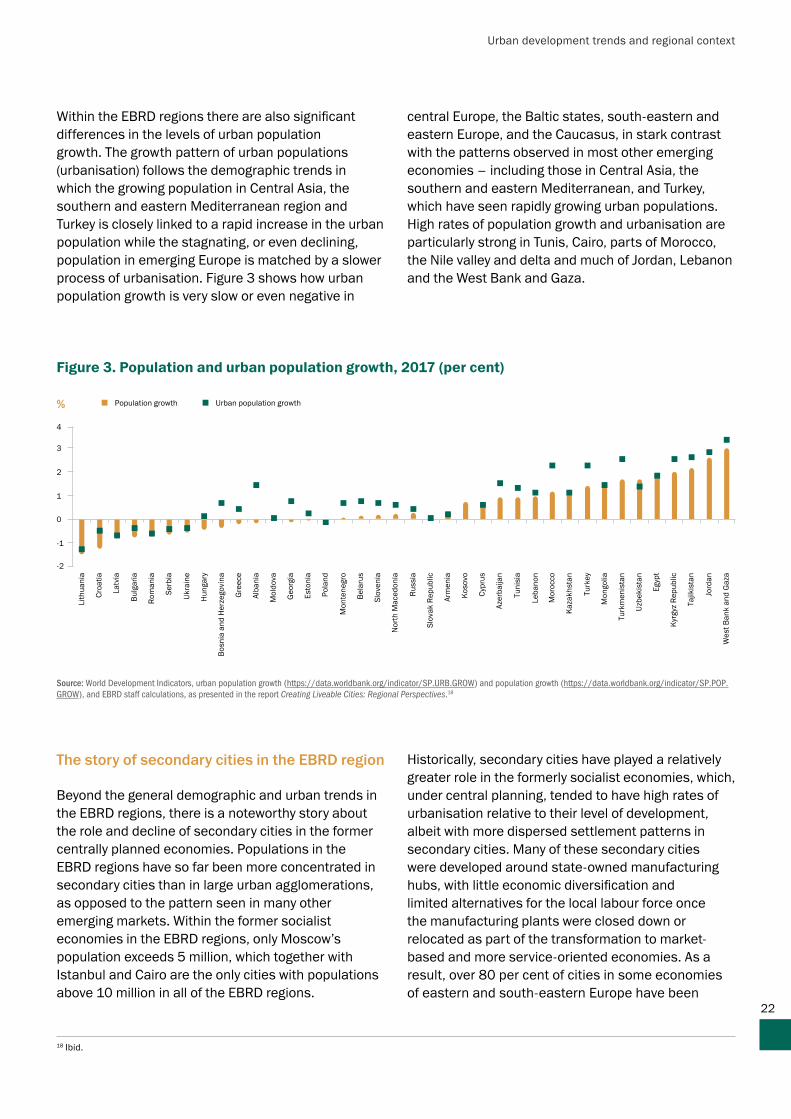
Within the EBRD regions there are also significant differences in the levels of urban population growth The growth pattern of urban populations (urbanisation) follows the demographic trends in which the growing population in Central Asia the southern and eastern Mediterranean region and Turkey is closely linked to a rapid increase in the urban population while the stagnating or even declining population in emerging Europe is matched by a slower process of urbanisation Figure 3 shows how urban population growth is very slow or even negative in
central Europe the Baltic states south-eastern and eastern Europe and the Caucasus in stark contrast with the patterns observed in most other emerging economies ndash including those in Central Asia the southern and eastern Mediterranean and Turkey which have seen rapidly growing urban populations High rates of population growth and urbanisation are particularly strong in Tunis Cairo parts of Morocco the Nile valley and delta and much of Jordan Lebanon and the West Bank and Gaza
The story of secondary cities in the EBRD region
Beyond the general demographic and urban trends in the EBRD regions there is a noteworthy story about the role and decline of secondary cities in the former centrally planned economies Populations in the EBRD regions have so far been more concentrated in secondary cities than in large urban agglomerations as opposed to the pattern seen in many other emerging markets Within the former socialist economies in the EBRD regions only Moscowrsquos population exceeds 5 million which together with Istanbul and Cairo are the only cities with populations above 10 million in all of the EBRD regions
Historically secondary cities have played a relatively greater role in the formerly socialist economies which under central planning tended to have high rates of urbanisation relative to their level of development albeit with more dispersed settlement patterns in secondary cities Many of these secondary cities were developed around state-owned manufacturing hubs with little economic diversification and limited alternatives for the local labour force once the manufacturing plants were closed down or relocated as part of the transformation to market-based and more service-oriented economies As a result over 80 per cent of cities in some economies of eastern and south-eastern Europe have been
4
3
2
1
0
-1
-2
Lith
uani
a
Croa
tia
Latv
ia
Bul
garia
Rom
ania
Serb
ia
Ukr
aine
Hun
gary
Bos
nia
and
Her
zego
vina
Gre
ece
Alba
nia
Mol
dova
Geo
rgia
Esto
nia
Pola
nd
Mon
tene
gro
Bel
arus
Slov
enia
Nor
th M
aced
onia
Rus
sia
Slov
ak R
epub
lic
Arm
enia
Kos
ovo
Cypr
us
Azer
baija
n
Tuni
sia
Leba
non
Mor
occo
Kaz
akhs
tan
Turk
ey
Mon
golia
Turk
men
ista
n
Uzb
ekis
tan
Egyp
t
Kyr
gyz
Rep
ublic
Tajik
ista
n
Jord
an
Wes
t Ban
k an
d G
aza
Population growth Urban population growth
Source World Development Indicators urban population growth (httpsdataworldbankorgindicatorSPURBGROW) and population growth (httpsdataworldbankorgindicatorSPPOPGROW) and EBRD staff calculations as presented in the report Creating Liveable Cities Regional Perspectives18
Figure 3 Population and urban population growth 2017 (per cent)
18 Ibid
Urban development trends and regional context
23
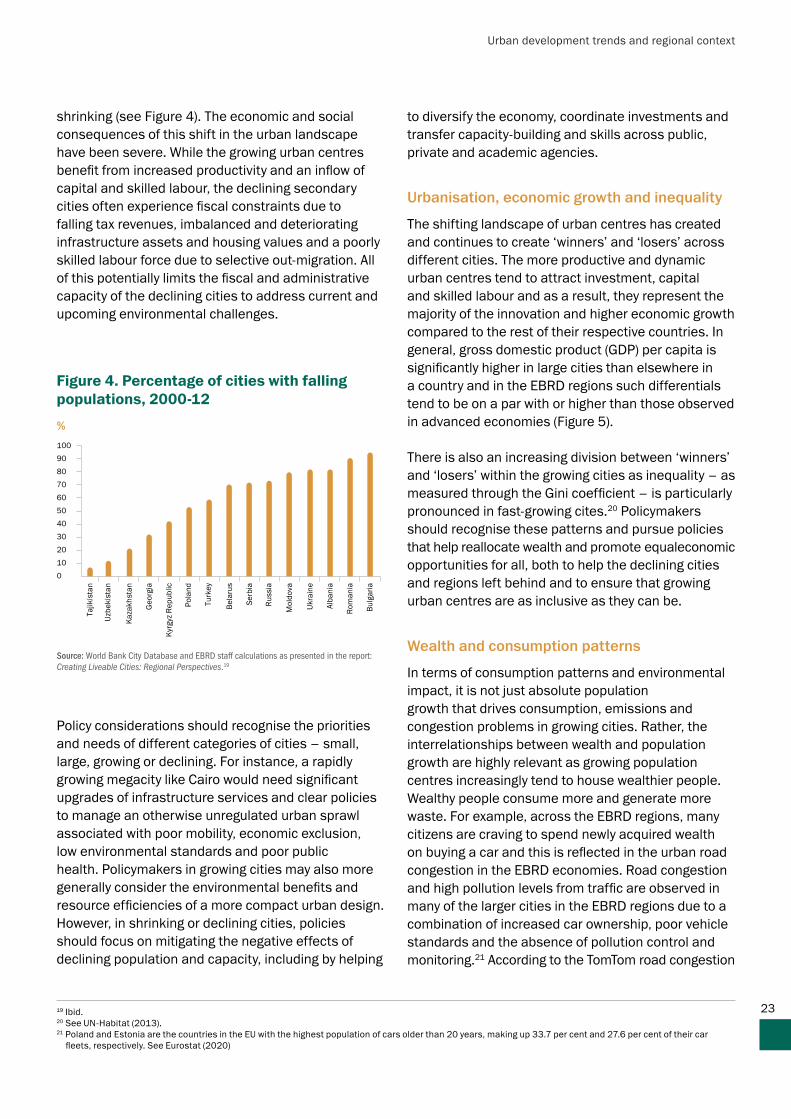
Figure 4 Percentage of cities with falling populations 2000-12
shrinking (see Figure 4) The economic and social consequences of this shift in the urban landscape have been severe While the growing urban centres benefit from increased productivity and an inflow of capital and skilled labour the declining secondary cities often experience fiscal constraints due to falling tax revenues imbalanced and deteriorating infrastructure assets and housing values and a poorly skilled labour force due to selective out-migration All of this potentially limits the fiscal and administrative capacity of the declining cities to address current and upcoming environmental challenges
Policy considerations should recognise the priorities and needs of different categories of cities ndash small large growing or declining For instance a rapidly growing megacity like Cairo would need significant upgrades of infrastructure services and clear policies to manage an otherwise unregulated urban sprawl associated with poor mobility economic exclusion low environmental standards and poor public health Policymakers in growing cities may also more generally consider the environmental benefits and resource efficiencies of a more compact urban design However in shrinking or declining cities policies should focus on mitigating the negative effects of declining population and capacity including by helping
to diversify the economy coordinate investments and transfer capacity-building and skills across public private and academic agencies
Urbanisation economic growth and inequality
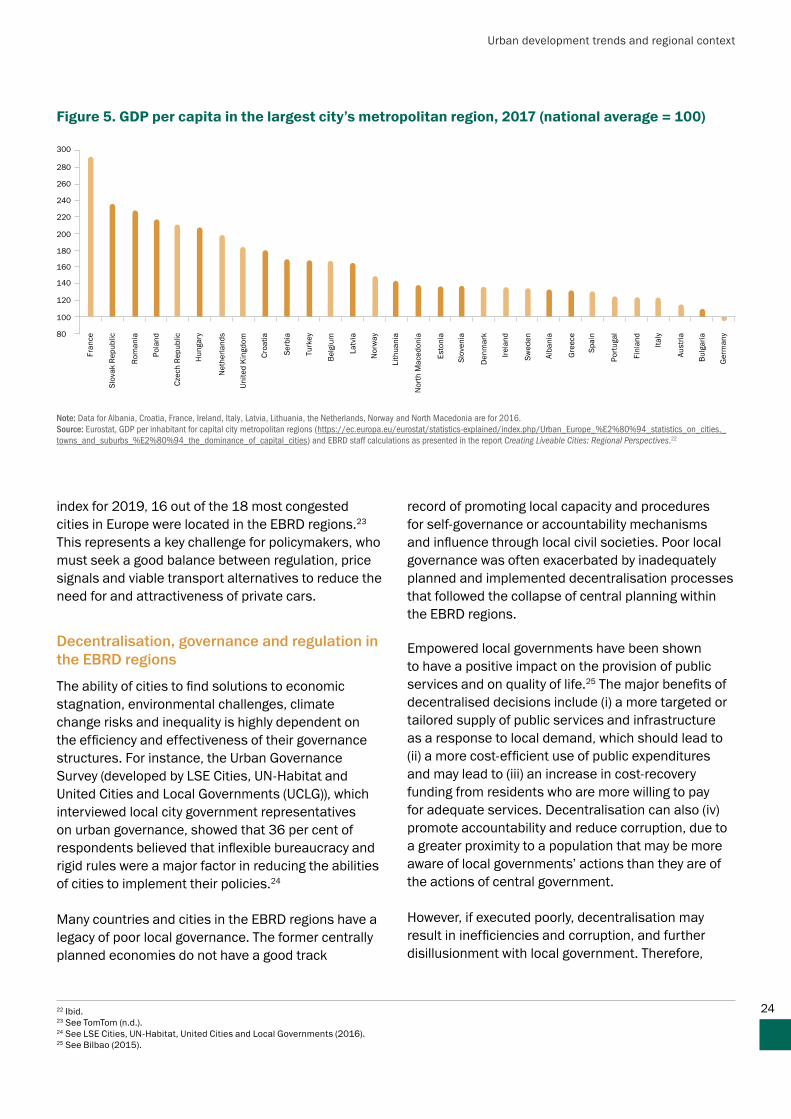
The shifting landscape of urban centres has created and continues to create lsquowinnersrsquo and lsquolosersrsquo across different cities The more productive and dynamic urban centres tend to attract investment capital and skilled labour and as a result they represent the majority of the innovation and higher economic growth compared to the rest of their respective countries In general gross domestic product (GDP) per capita is significantly higher in large cities than elsewhere in a country and in the EBRD regions such differentials tend to be on a par with or higher than those observed in advanced economies (Figure 5)
There is also an increasing division between lsquowinnersrsquo and lsquolosersrsquo within the growing cities as inequality ndash as measured through the Gini coefficient ndash is particularly pronounced in fast-growing cites20 Policymakers should recognise these patterns and pursue policies that help reallocate wealth and promote equaleconomic opportunities for all both to help the declining cities and regions left behind and to ensure that growing urban centres are as inclusive as they can be
Wealth and consumption patterns
In terms of consumption patterns and environmental impact it is not just absolute population growth that drives consumption emissions and congestion problems in growing cities Rather the interrelationships between wealth and population growth are highly relevant as growing population centres increasingly tend to house wealthier people Wealthy people consume more and generate more waste For example across the EBRD regions many citizens are craving to spend newly acquired wealth on buying a car and this is reflected in the urban road congestion in the EBRD economies Road congestion and high pollution levels from traffic are observed in many of the larger cities in the EBRD regions due to a combination of increased car ownership poor vehicle standards and the absence of pollution control and monitoring21 According to the TomTom road congestion
19 Ibid20 See UN-Habitat (2013)21 Poland and Estonia are the countries in the EU with the highest population of cars older than 20 years making up 337 per cent and 276 per cent of their car fleets respectively See Eurostat (2020)
100
90
80
70
60
50
40
30
20
10
0
Tajik
ista
n
Uzb
ekis
tan
Kaz
akhs
tan
Geo
rgia
Kyr
gyz
Rep
ublic
Pola
nd
Turk
ey
Bel
arus
Serb
ia
Rus
sia
Mol
dova
Ukr
aine
Alba
nia
Rom
ania
Bul
garia
Source World Bank City Database and EBRD staff calculations as presented in the report Creating Liveable Cities Regional Perspectives19
Urban development trends and regional context
24
index for 2019 16 out of the 18 most congested cities in Europe were located in the EBRD regions23 This represents a key challenge for policymakers who must seek a good balance between regulation price signals and viable transport alternatives to reduce the need for and attractiveness of private cars
Decentralisation governance and regulation in the EBRD regions
The ability of cities to find solutions to economic stagnation environmental challenges climate change risks and inequality is highly dependent on the efficiency and effectiveness of their governance structures For instance the Urban Governance Survey (developed by LSE Cities UN-Habitat and United Cities and Local Governments (UCLG)) which interviewed local city government representatives on urban governance showed that 36 per cent of respondents believed that inflexible bureaucracy and rigid rules were a major factor in reducing the abilities of cities to implement their policies24
Many countries and cities in the EBRD regions have a legacy of poor local governance The former centrally planned economies do not have a good track
record of promoting local capacity and procedures for self-governance or accountability mechanisms and influence through local civil societies Poor local governance was often exacerbated by inadequately planned and implemented decentralisation processes that followed the collapse of central planning within the EBRD regions
Empowered local governments have been shown to have a positive impact on the provision of public services and on quality of life25 The major benefits of decentralised decisions include (i) a more targeted or tailored supply of public services and infrastructure as a response to local demand which should lead to (ii) a more cost-efficient use of public expenditures and may lead to (iii) an increase in cost-recovery funding from residents who are more willing to pay for adequate services Decentralisation can also (iv) promote accountability and reduce corruption due to a greater proximity to a population that may be more aware of local governmentsrsquo actions than they are of the actions of central government
However if executed poorly decentralisation may result in inefficiencies and corruption and further disillusionment with local government Therefore
Note Data for Albania Croatia France Ireland Italy Latvia Lithuania the Netherlands Norway and North Macedonia are for 2016Source Eurostat GDP per inhabitant for capital city metropolitan regions (httpseceuropaeueurostatstatistics-explainedindexphpUrban_Europe_E28094_statistics_on_cities_towns_and_suburbs_E28094_the_dominance_of_capital_cities) and EBRD staff calculations as presented in the report Creating Liveable Cities Regional Perspectives22
Figure 5 GDP per capita in the largest cityrsquos metropolitan region 2017 (national average = 100)
300
280
260
240
220
200
180
160
140
120
100
80
Fran
ce
Slov
ak R
epub
lic
Rom
ania
Pola
nd
Czec
h R
epub
lic
Hun
gary
Net
herla
nds
Uni
ted
Kin
gdom
Croa
tia
Serb
ia
Turk
ey
Bel
gium
Latv
ia
Nor
way
Lith
uani
a
Nor
th M
aced
onia
Esto
nia
Slov
enia
Den
mar
k
Irela
nd
Swed
en
Alba
nia
Gre
ece
Spai
n
Port
ugal
Finl
and
Italy
Aust
ria
Bul
garia
Ger
man
y
22 Ibid23 See TomTom (nd)24 See LSE Cities UN-Habitat United Cities and Local Governments (2016) 25 See Bilbao (2015)
Urban development trends and regional context
25
for the abovementioned benefits to materialise it is important that (a) decisions (and not only operational obligations) are transferred to local authorities (b) local authorities have sufficient financial and institutional capacity and procedures in place and (c) the decentralisation promotes engagement and enables residents to hold institutions to account for delivering policies in a transparent manner
Unfortunately the decentralisation processes in many of the economies where the EBRD invests are still incomplete with the capacity resources procedures and political autonomy of local authorities remaining inadequate The process of developing a strong culture and presence of civil society has also proven to be a long and challenging journey in many cities This too has hampered the way local communities are able to influence urban development and hold its local decision-makers accountable
Conclusion
Urban development and regulation has been reoriented in many parts of the world over the past few decades from an earlier focus on production and productivity with less emphasis on environmental and human wellbeing to a stage where the environment and its residents increasingly take priority While this reorientation first started among the more advanced OECD economies in the 1970s and 1980s the centrally planned economies in the EBRD regions began the process later These economies also had a more rigid approach to management based on a top-down command structure As a consequence many municipalities in the EBRD regions have less experience with rich and complex policy programmes that combine comprehensive stakeholder dialogue processes and the involvement of local community members in urban development Such programmes encompass effective price signals economic incentives strict transparency principles and information- and trust-building efforts between residents and local authorities
Taking these observations into account makes it clear that the regions require a combination of green and inclusive urban development To achieve this a rich and comprehensive policy mix is needed in many places
where the interdependence of different policies and the synergies between investment programmes and policy initiatives would need to be carefully considered and debated This report aims to contribute to the debate
22 Beyond green cities other relevant conceptsFigure 6 captures some of the many terms and concepts being used to refer to programmes and objectives of modern progressive cities While this report focuses on green urban policies ndash targeting environmental and climatic challenges ndash it touches on these other concepts where relevant
Smart cities are those that prioritise the development of digital infrastructure connectivity to facilitate the growth and curation of human capital The increase in the innovative capacity of smart cities enables them to maintain their industrial competitiveness26
But interconnected digital solutions are not just for the powerhouse cities of the Global North Santiagorsquos Chilecon Valley for example is being heralded as a prime example of an open smart district in South America27 Its growth of digital start-ups can be attributed in part to the countryrsquos pro-immigrant policy designed to welcome innovators from the United States of America The capital also boasts the most advanced public transit system in South America and is making plans to accommodate rapid growth in the use of electric vehicles charged by the smart grid28
This demonstrates the role that smart cities can also play in driving a green agenda For instance data can be used to effectively manage the roll-out of electric vehicles and optimise vehicle-to-grid energy balancing which can reduce energy consumption as it mitigates against the lsquopeak-troughrsquo energy-demand profile of cities
However these ambitions for technological revolution have not been well received in all cities with some communities seeing the approach as pandering to outside interests rather than addressing local concerns29 For example international firms that are
26 See Trujillo and Parilla (2016) 27 See The Economist (2012) 28 See Marshall (2016)29 See Wattenbarger (2018)
Urban development trends and regional context
26
vocal about the transition to smart cities include the likes of IBM and Siemens The smart city concept is applied and supported by initiatives such as the Smart Cities Prosperity Fund Programme and the EUrsquos Digital Cities Challenge and many cities are seeking to pursue a smart urban development agenda
Circular cities are a relatively new phenomenon based on well-established schools of thought around functional service economies and natural capital These are cities that seek to harmonise economic development with environmental conservation Some of the key sectors that are thought to benefit most from this approach include waste and textiles and transport and food production The principles of a circular economy can be integrated into planning policy for example compact city development as demonstrated by Curitiba a city in Brazil which implemented this development strategy 30 years ago The strategy entailed mixed-use development and densification along five bus rapid transit (BRT)
corridors This has been reported to help improve land-use issues increase public transport use and reduce congestion30
Strengthening the resilience of a city is a priority for many governments and their citizens and circular and smart cities can help in this endeavour A resilient city is one that is able to strengthen its response recovery and adaptive capacity not just to physical but also to social and economic shocks and stresses These may include high unemployment endemic violence or floods One such global organisation supporting cities to develop resilience strategies is 100 Resilient Cities which works to enable cities to structure their approach and pathway to a more resilient future It has outlined seven key qualities that characterise a resilient city reflective resourceful robust redundant flexible inclusive and integrated31
30 See EMF (2019)31 See 100 Resilient Cities (nd)
Source Arup Group
Figure 6 Other concepts used for city programmes and objectives
Circularcities
Smartcities
Concepts
Resilientcities
Healthycities
Inclusivecities
Urban development trends and regional context
27
Specific actions that cities are taking to become more resilient include the development of green corridors as promoted in Atlanta which has dedicated 400 acres of green space along the BeltLine Westside Trail This master plan has sought to address the racial inequity in access to green space in the area while also seeking to minimise health issues caused by frequent flooding with sewage-contaminated water32 33
Inclusiveness is a key element of resilient cities as documented by Jan Gehl in his book Cities for People It is also a focus of work for organisations such as the World Bank and the Asian Development Bank
The concept of healthy cities focuses on promoting health via the political agenda through institutional change capacity-building and innovation Creating healthier urban settings supports the health and wellbeing of the people that use them The WHO European Healthy Cities Network is a group of European cities that has been working towards this agenda for the past 30 years and forms part of a wider network of 1400 municipalities34 When health is used as a lens through which to examine city sectors it can generate other sustainable urban improvements for example shifts towards active mobility that can not only reduce the risk of respiratory disease but also decrease emissions of air pollutants reduce congestion and injuries and free up green space35
Inclusive cities are those that can provide services infrastructure and access for all residents regardless of gender sexual orientation race age or ability36 The international community has widely acknowledged the importance of creating inclusive cities to improve peoplersquos lives with Sustainable Development Goal 11 calling for ldquoinclusive safe resilient and sustainablerdquo cities37 While urbanisation creates the conditions to facilitate opportunities for a better life for residents for example through access to larger and more diverse economic markets the expansion of cities can also increase inequality and exclusion especially of the poor and vulnerable38 Developing inclusive cities
is an ongoing and dynamic challenge that requires city governments businesses and residents to work together Inclusion encompasses various complex factors such as economic inclusion social inclusion and spatial inclusion39 Recognising that each of these closely related dimensions need to be addressed will enable cities to break cycles of marginalisation exclusion and inequality
32 See Kahn (2017) 33 See 100 Resilient Cities (2018)34 See WHO (nd)35 See WHO and UN Environment (2017) 36 See Misra (2016) 37 See UN (2020) 38 See Asian Development Bank (2011) 39 See World Bank (nd)
ldquoInclusive cities are those that can provide services infrastructure and access for all residents regardless of gender sexual orientation race age or abilityrdquo
28
29
Sector-based policy options
31 Mobility and transport
32 Land planning green space and biodiversity
33 Energy and buildings
34 Water and wastewater
35 Solid waste
03
30
This section discusses the sector-based policy options available to cities to support sustainable urban development and green city investments It is divided into the sectors of mobility and transport land use energy and buildings water and wastewater and solid waste
31 Mobility and transportTransport accounts for a quarter of global carbon dioxide emissions and is responsible for harmful air pollutants that negatively impact the health of city residents From an environmental perspective the main policy objective with regard to the transport sector today is to cap or reduce the use of private cars and increase the share of public and active mobility (such as cycling or walking) Policy objectives may further seek to promote cleaner public and private vehicles ndash ideally with zero emissions Together with land planning related policies may also seek to reduce the need for motorised mobility or transport
Policy measures in the transport sector can be divided roughly into (i) demand-side measures aimed at influencing travel decisions and (ii) supply-side measures seeking to provide a credible alternative to private cars Among the demand-side measures are policies aimed at making cars ndash in particular those that release the most CO2 and nitrogen monoxide ndash less attractive (for example parking policies or road-user charges but also attitude campaigns and the pedestrianisation of selected streets) Among the supply-side measures are policies and initiatives aimed at providing well-planned sustainable and
attractive public transport services as well as policies that seek to increase the modal share of active mobility options
Both demand-side and supply-side measures have been inadequate throughout the EBRD regions partly due to (i) low administrative capacity in cities (ii) weak enforcement and (iii) a low revenue base These shortcomings must be addressed as part of an effective policy mix aimed at tackling the main environmental challenges linked to the urban transport sector
A selection of such urban transport and mobility policies includes the following
Car-restrictive policies
1 Parking policies ndash including pricing restrictions information and enforcement
2 Road-user charges ndash including congestion charges and low emission zones
3 Pedestrian-oriented and car-restrictive policies
4 Car-sharing car-pooling and ride-sharing
Promotion of public and active mobility
5 Planning and regulation of public transport services
6 Pro-cycling policies
Promotion of cleaner vehicles
7 Electrification of urban transport
Sector-based policy options
Cities can choose from a wide range of policy options to address urban environmental challenges ndash some options are sector-specific while others cover multiple sectors
Sector-based policy options
31
T1 Parking policiesSummary
The primary environmental objective of parking policies is to make parking and the use of private cars less attractive in order to promote a shift towards public and active mobility Restrictive parking policies cover several types of intervention including the pricing of parking and the limitation or relocation of available parking spaces An active use of parking regulation can be an effective deterrent to the use of private cars with a limited or even a positive impact on the city budget Parking policies can also help promote the use of electric or low-emission cars and effective use of parking facilities may be supported by appropriate information systems Furthermore real-estate developers can be obliged to provide off-street parking solutions when needed However parking policies only succeed in cities with credible enforcement capacity and good public transport services as a viable alternative to private cars
Description
Effective parking regulation requires consistent urban coverage pricing and enforcement One such approach is the introduction of parking zones where each zone often labelled with different colour codes represents different price levels ndash from highly priced and often time-limited parking in the centre to cheaper and less restricted parking in zones further from the centre More sophisticated parking schemes may include parking fees linked to the vehicle emission levels at the time of car registration or dedicated parking and charging facilities for electric cars
Workplace levies may also be considered as part of a cityrsquos parking policies This measure imposes taxes on companies for each parking space they provide to employees and may also have a significant positive effect on the cityrsquos revenue For example in Nottingham in the United Kingdom money raised from the workplace levy has helped fund extensions to the existing tram system and the redevelopment of Nottinghamrsquos railway station
Restrictive parking policies may include the reduction or relocation of available parking spaces which can be coordinated with other transport solutions
For example the removal of on-street parking spaces frees up space that can be repurposed for other needs such as dedicated bus lanes widened pavements or cycle lanes Hamburg implemented this approach in 1976 and Zuumlrich in 199640 Parking solutions may also be tailored to public transport schemes through parking (lsquopark-and-ridersquo) facilities located next to key transit stations
Resource implications and key requirements
Introducing regulated parking fees for the first time involves some coordination with land planning and traffic planning It requires adequate marking of dedicated parking spaces and related signposts It also requires a reliable and user-friendly payment solution of the kind that are increasingly based on payments through mobile phones rather than the more traditional pay-and-display solutions Operating the system also requires good control and enforcement mechanisms Lastly significant legislative changes might be needed in order to regulate private car-parking facilities
Introducing additional parking fees or time limits on existing parking spaces may require little investment or additional control and enforcement costs for the city The removal of parking spaces is not financially costly either However the removal of on-street parking may be combined with other arrangements such as the construction and operation of off-street parking garages or park-and-ride facilities which may require significant resources and coordination among city designers and planners in relation to other policy areas
Potential private-sector participation
The private sector can play an effective role in setting up and operating parking payment and control schemes Here cities can consider both availability payments (for a system that works) and performance payments (for revenues collected) For example private contractors can help improve parking control and revenue collection through a well-defined and well-managed parking service contract At the same time the private sector can play a constructive role in the financing construction and operation of off-street parking garages and lsquopark and ridersquo facilities
40 See Push-Pull Parking (2015)
Sector-based policy options
32
In addition real-estate developers can be obliged to provide off-street parking solutions as part of their development permits
Implementation obstacles and solutions
A radical change to parking fees or parking availability requires a new mindset and acceptance from the public It also needs adequate control procedures and enforcement capacity Therefore recommendations may include the gradual introduction (both in terms of coverage and price levels) of parking fees This enables a gradual change in peoplersquos attitudes and a gradual building of the necessary operational and enforcement capacity Furthermore both the pricing and the relocation of parking facilities can play a constructive role in a policy mix together with other lsquoshiftrsquo measures As car owners see parking fees as a burden such interventions are more readily accepted when they appear together with improved public transport services as a viable alternative to private cars
Time-limited parking facilities prevent specific user groups such as workers or selected residents from using those facilities The removal of on-street parking may further upset many potential beneficiaries of such facilities ndash including business communities workers
and selected residents and like parking fees policies that limit parking may face less opposition when combined with improved public transport services or other measures as part of a policy mix
Parking restrictions that support the general demand for public transport services while also providing carefully planned relocation of parking facilities close to key transit stations (park-and-ride facilities) can have a particularly strong impact on the shift from cars to public urban transport Removal of parking spaces also provides a great opportunity to reallocate scarce urban space to dedicated bus lanes bicycle lanes or even trees and green spaces
Comparison with other policy options
When comparing an active use of parking pricing to road-user charging (see policy option T2) it is worth noting that many of the benefits can be quite similar Parking policies are often quicker and less complicated to implement and represent lower investment costs compared to the introduction of a new congestion charging solution Removal of parking facilities may provide good opportunities to reallocate scarce urban space to public and active mobility
Sector-based policy options
33
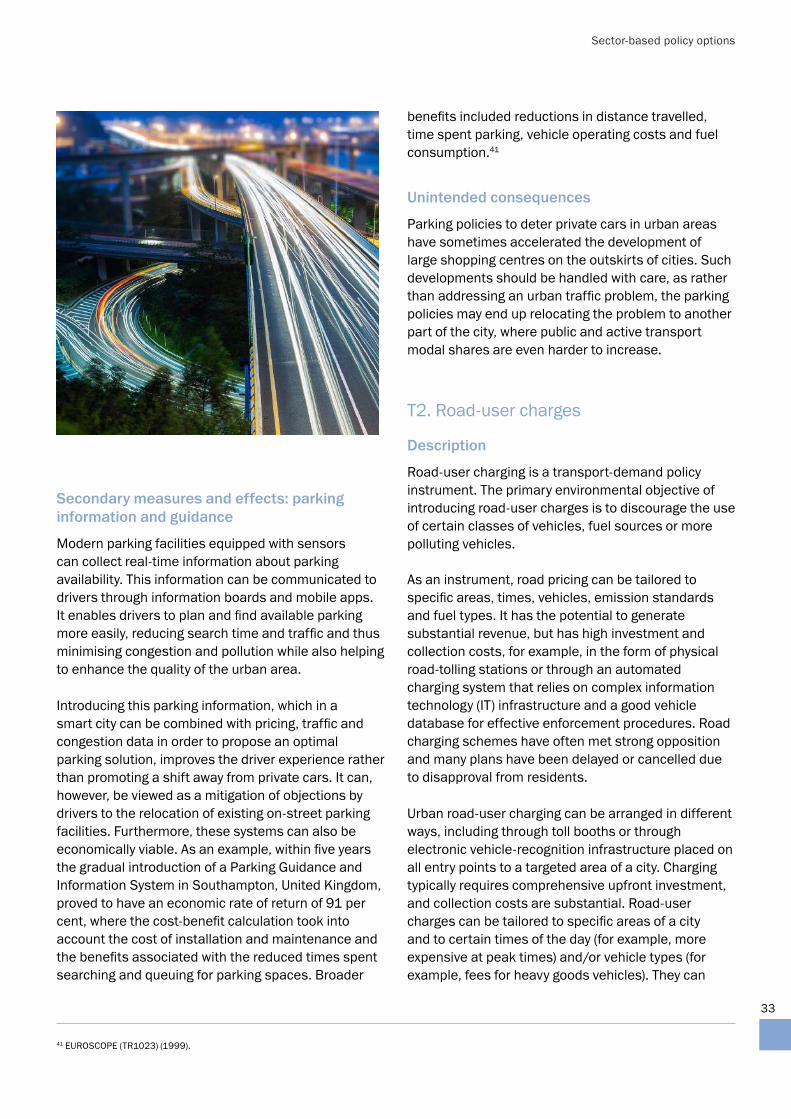
Secondary measures and effects parking information and guidance
Modern parking facilities equipped with sensors can collect real-time information about parking availability This information can be communicated to drivers through information boards and mobile apps It enables drivers to plan and find available parking more easily reducing search time and traffic and thus minimising congestion and pollution while also helping to enhance the quality of the urban area
Introducing this parking information which in a smart city can be combined with pricing traffic and congestion data in order to propose an optimal parking solution improves the driver experience rather than promoting a shift away from private cars It can however be viewed as a mitigation of objections by drivers to the relocation of existing on-street parking facilities Furthermore these systems can also be economically viable As an example within five years the gradual introduction of a Parking Guidance and Information System in Southampton United Kingdom proved to have an economic rate of return of 91 per cent where the cost-benefit calculation took into account the cost of installation and maintenance and the benefits associated with the reduced times spent searching and queuing for parking spaces Broader
benefits included reductions in distance travelled time spent parking vehicle operating costs and fuel consumption41
Unintended consequences
Parking policies to deter private cars in urban areas have sometimes accelerated the development of large shopping centres on the outskirts of cities Such developments should be handled with care as rather than addressing an urban traffic problem the parking policies may end up relocating the problem to another part of the city where public and active transport modal shares are even harder to increase
T2 Road-user charges
Description
Road-user charging is a transport-demand policy instrument The primary environmental objective of introducing road-user charges is to discourage the use of certain classes of vehicles fuel sources or more polluting vehicles
As an instrument road pricing can be tailored to specific areas times vehicles emission standards and fuel types It has the potential to generate substantial revenue but has high investment and collection costs for example in the form of physical road-tolling stations or through an automated charging system that relies on complex information technology (IT) infrastructure and a good vehicle database for effective enforcement procedures Road charging schemes have often met strong opposition and many plans have been delayed or cancelled due to disapproval from residents
Urban road-user charging can be arranged in different ways including through toll booths or through electronic vehicle-recognition infrastructure placed on all entry points to a targeted area of a city Charging typically requires comprehensive upfront investment and collection costs are substantial Road-user charges can be tailored to specific areas of a city and to certain times of the day (for example more expensive at peak times) andor vehicle types (for example fees for heavy goods vehicles) They can
41 EUROSCOPE (TR1023) (1999)
Sector-based policy options
34
also be tailored to vehicle emission levels at the time of vehicle registration and are sometimes used to promote low or ultra-low emission zones
In terms of relevant case studies Singaporersquos Electronic Road Pricing scheme was one of the first and most complex The scheme was launched in 1998 and covers selected expressways arterial roads and three restricted zones The toll is applied to all vehicles and varies by time of day and direction of travel
The London Congestion Charge was introduced in 2003 and works with a flat daily charge for driving a vehicle within the charging zone The charge helped reduce traffic in Londonrsquos city centre by 39 per cent between 2002 and 2014 In 2019 the city launched its Ultra-Low Emission Zone which includes more stringent emissions standards
Stockholmrsquos congestion charge was introduced in 2006 and is designed as a barrier scheme in which a payment is required for each entry through the barrier and is dependent on the time of day A study of congestion pricing in Stockholm between 2006 and 2010 found that in the absence of congestion pricing Stockholmrsquos ldquoair would have been five to ten percent more polluted between 2006 and 2010 and young children would have suffered 45 percent more asthma attacksrdquo42
Resource implications and key requirements
While there is no clear-cut way of narrowing down the resources needed to introduce a road-pricing measure it is generally a costly solution that requires strong administrative capacity It may require complex IT infrastructure a good vehicle database for enforcement and significant changes to legal and organisational frameworks For example in 2015 Transport for Londonrsquos collection cost was pound85 million representing one-third of total fee collection ndash with a congestion charge of pound1150 per day
In cities where no dependable licence plate database exists and there is no legislation enabling congestion charging this step might be the greatest bottleneck in the entire process The relationship between the national legislative framework and regional or city
legislative structures is also important in that cities or regional areas may be able to enact their own laws or they may have to rely on national laws being applied in their geographical areas
Implementation obstacles and solutions
Despite evidence of impact the public has repeatedly rejected proposed road-user charges For example in Manchester and New York in 2008 and Copenhagen in 2012 tolling schemes were rejected by public referendums Public acceptability requires an incremental introduction of fee levels It also requires consultation and feedback from the public in designing the policy and robust awareness campaigns with evidence of improvement in terms of traffic congestion public transport and road networks43 Furthermore the vision of the policy should be part of an overall traffic plan including improvements in public transport funded by the road pricing revenue In London and Oslo resistance to congestion and toll charges was partly overcome by transparently linking these fees with public investment
Comprehensive congestion charging remains suitable for large cities with a congestion problem in their city centres but is rarely a recommended solution for small to medium-sized cities due to the administrative and financial burden For small to medium-sized cities parking measures are much more effective but may need to be combined with charges for goods vehicles
Comparison with other policy options
Effective use of restrictive parking policies has many of the same benefits as road-user charges However parking policies are often significantly easier to implement and can be introduced in a more gradual fashion
T3 Pedestrian-friendly policies
Description
Pedestrianising roads or city centres can be seen as a demand-side measure aimed at regulating and influencing travel decisions When combined with
42 See Rogers (2017)43 See Collier et al (2019)
Sector-based policy options
35
good solutions for public and active mobility it can be an effective policy to reduce traffic and improve local air quality In addition car-free roads can promote more vibrant and enjoyable urban spaces A large number of European towns and cities have made parts of their centres car-free since the early 1960s This approach is often accompanied by car parking facilities on the edge of the pedestrianised zone and is sometimes combined with park-and-ride schemes or cycle lanes to facilitate public and active transport to the pedestrianised centre Most pedestrianised zones allow delivery trucks at certain times of the day
Pedestrian-oriented policies can be more or less restrictive or ambitious in terms of the area the time and the vehicle classifications that are subject to restricted access It can involve complete pedestrianisation of a large area or it can be modest in its coverage or accept motorised vehicles at certain times There is also the opportunity to exempt certain vehicles from the ban for example public transport vehicles or the vehicles of selected residents business owners or disabled people The promotion of car-free days is another approach often aimed at raising awareness as much as regulating travel decisions
Resource implications and key requirements
Restricting car traffic for a given road has initially low financial and administrative implications However implementation costs and consequences with regard to shifts in traffic flow patterns will need to be considered Promoting active mobility may also require additional investment such as better street lighting
Implementation obstacles and solutions
The main resistance to car restrictions tends to come from local shopkeepers and to some extent from local residents and other businesses For instance policymakers should be aware that the pedestrianisation of city centres can cause surrounding property prices to increase significantly And while in almost all cases retail businesses also benefit this can lead to an inexorable rise in commercial rents too This means that pedestrianised retail centres risk becoming further homogenised
with only the most high-end independent shops able to operate The challenge for policymakers therefore is to implement pedestrianisation while minimising the negative effects of the gentrification that is likely to accompany it To this end the success factors of pedestrianisation schemes include a gradual approach coupled with public consultations This allows businesses to adapt to and influence the policy Transparency regular community engagement monitoring and evaluation are crucial to measuring the success of the scheme
The city centre of Nuremberg Germany has been gradually pedestrianised since the 1970s to address the decline in air quality When heavily congested roads were closed to cars traffic volumes fell by up to 25 per cent in the historic city centre while on nearby roads it increased between 4 and 19 per cent Over the following 10 years the area was transformed into an attractive pedestrian precinct buildings were renovated street furniture upgraded and art works introduced Public support for the pedestrianisation scheme has proved to be strong Proposals to reopen the centre to car traffic following a change in political leadership of the city in 1996 were not realised due to public objection44
T4 Planning and regulation of public transport services
Description
The degree of planning and regulation of urban transport services can vary from a liberal approach to a more structured and coordinated approach A liberal approach based on largely unregulated private bus and minibus services requires less administrative and financial capacity within the municipality and is flexible and responsive to most transport demand in cities
However a liberal approach tends to face coordination problems An effective pursuit of environmentally friendly and inclusive mobility requires adequate regulation of transport services on the back of a plan for sustainable urban mobility
44 See European Commission (nd)
Sector-based policy options
36
Effective transport services require professionalism predictability and accountability Improved performance of incumbent operators can be promoted by transforming municipal transport operators into separate legal and commercial entities or joint stock companies (JSCs) This helps to depoliticise the management of these operators To further professionalise the relationship between the company management and the city it is recommended to set up public service contracts (PSCs) between the municipality and the JSC ndash defining rights obligations and processes ndash to ensure predictability and accountability for all Improved transport services can also be promoted through well-regulated and well-procured private service contracts
The benefits of a well-planned and regulated transport sector include better resource efficiency through synergies between transport modes including private cars bicycles and various public transport services Better regulation and coordination can further facilitate integrated multi-journey ticketing covering journeys that include a variety of transport modes It also enables the introduction of an electronic ticketing solution electronic vehicle monitoring and transport management which allows for real-time information systems All this improves user experience and increases the popularity of public transport services
Resource implications and key requirements
Setting up a strong integrated urban transport regulator takes time It requires adequate capacity to
plan contract procure and monitor services Effective contracting and transparent funding of regulated services also require shifting the control of cash flow from the operators to the transport authority
Of the different solutions it is worth noting that electronic transport management includes operation of the necessary IT infrastructure and control room In Moscow which has a population of 123 million the creation of an intelligent transport system had an overall budget of US$ 17 billion from 2012-2045 Electronic ticketing and real-time information systems may also require significant investment in ticket machines validators information boards and IT infrastructure
Potential private-sector participation
Increased administrative planning and coordination does not imply a crowding-out of private operators Regulated bus services can be effectively procured contracted to private operators and monitored by a dedicated authority The introduction operation and maintenance of electronic ticketing systems electronic vehicle monitoring or real-time information services can also be effectively financed implemented and operated by private contractors For example the city of Belgrade contracted out the supply financing and operation of an electronic vehicle (bus) monitoring and ticketing solution including ticket sales and ticket control in return for 83 per cent of the ticket revenues collected For the city the outcome was a more than 10 per cent revenue increase in the first year of operation implying a net rise in municipal revenue better vehicle monitoring under the PSCs and lower costs of ticket sales without any material capital expenditure46
Implementation obstacles and solutions
Effective regulation of the urban transport sector may upset public and private operators alike One challenge is the formalisation of unregulated minibus services for which moderate adjustments to licencing requirements may be a first step Effective regulation may involve the unbundling of a transport authority that has in the past provided services and regulated the sector It may also involve account separation
45 See Innovative Governance of Large Urban Systems (2017) 46 See Tica et al (2012)
ldquoEffective transport services require professionalism predictability and accountability The performance of incumbent operators can be improved by transforming municipal transport operators into separate legal and commercial entities or joint stock companiesrdquo
Sector-based policy options
37
and further unbundling of different transport modes or operators to ensure transparency and well-defined service contracts for each mode and operator A gradual approach may be needed here as both managers and related unions may oppose such moves towards transparency and future competition for related transport markets
Effective contracting and the transparent funding of regulated services require shifting the control of cash flow from the operators to the transport authority This implies a change of mindset and may have to be introduced gradually through one transport mode at a time on the back of a well-defined and well-funded public service contract for the relevant operators
T5 Electrification of urban transport
Description
Electric vehicles have zero tailpipe emissions and where renewable electricity generation is on the rise can be effective in reducing greenhouse gas emissions Policies promoting the electrification of the transport sector include the introduction of battery-powered electric buses and the promotion of trams and trolleybuses ndash with or without in-motion charging solutions This also includes policies promoting individual electric vehicles including private cars and light commercial vehicles Key policies promoting private electric vehicles include the use of road-user charges in favour of electric vehicles (see policy option T2) parking policies in favour of electric vehicles (see policy option T1) access to bus lanes for electric vehicles and the roll-out of convenient charging infrastructure
Resource implications and key requirements
A shift to electric buses brings about fundamental changes to the operating model ndash and the economics These changes include significant upfront investment in charging and maintenance facilities and higher costs for the purchase of rolling stock They also include important negotiations with the energy sector to ensure sufficient capacity on the local grid and optimal electricity prices for overnight or day-time charging Personnel will also be affected
and many staff will require retraining and redeployment Drivers will need to adapt to new driving techniques and protocols for recharging and battery management while the maintenance of buses and charging infrastructure will change to the extent that these may be outsourced as part of supply-operate-maintain contracts
Overall lower fuel and maintenance costs are associated with electric buses compared to diesel buses but as the relevant market segments are less settled the pricing of these activities is subject to some uncertainties A less radical approach is the expansion of tram or trolleybus networks as this represents less of a change compared to the existing model in operation Here one increasingly relevant hybrid solution involves trolleybuses with battery capacity and in-motion charging using existing or new trolley wires for battery charging This approach which is mostly relevant for cities with an existing trolleybus service enables the buses to operate temporarily outside the network of overhead wires with moderate battery capacity installed
Policies aimed at the electrification of private vehicles may include revision to a current road-user charge to parking regulation or the access of electric cars to bus lanes which may not have huge resource implications The installation of charging stations at selected parking places however represents a significant investment cost In concrete terms in 2015 the cost of single-port non-residential electric-vehicle supply equipment (EVSE) unit ranged from US$ 300-1500 for Level 1 US$ 400-6500 for Level 2 and US$ 10000-40000 for direct current (DC fast charging while the installation costs varied greatly from site to site with a ballpark cost range of US$ 0-3000 for Level 1 US$ 600-12700 for Level 2 and US$ 4000-51000 for DC fast charging47 In light of this local initiatives aimed at promoting private electric vehicles will only work well when combined with national policies that support the use of electric and low-emission cars
47 See Smith and Castellano (2015)
Sector-based policy options
38
Implementation obstacles and solutions
Electrification of bus services requires considerable investments in fleets maintenance and charging infrastructure and thus significant capital expenditure The cost of electric buses can be double the price of their diesel equivalents and charging stations are also expensive ndash they cost about US$ 50000 for a standard depot-based version used for overnight charging48 Nevertheless several cities have introduced electrification of bus services on a small scale on the back of a clear green vision for the relevant city and with some financial support from national or international entities It has also been suggested that electric buses have lower operating costs in the long term and are easier to maintain For example in the case of Stockholm evidence suggests that lower fuel costs for electric buses can balance the high investment costs incurred in building charging infrastructure while achieving in the bus fleet a reduction of up to 51 per cent in emissions and up to 34 per cent in energy use49 In addition to financial barriers the current state of technology can be an issue For instance during early tests in Belo Horizonte in Brazil electric buses had trouble getting over steep hills with full passenger loads50
T6 Pro-cycling policies
Description
Cycling generates no emissions or noise requires less road and parking space compared to cars and is a more economical and healthier form of mobility compared to motorised transport51 Policies to encourage cycling include pro-cycling infrastructure pro-cycling regulation and pro-cycling subsidies A modal shift to cycling can be further promoted by awareness and attitude campaigns
Pro-cycling infrastructure includes the introduction of segregated cycle lanes and the introduction of convenient and theft-preventing parking facilities as well as bike-sharing facilities Pro-cycling regulation can be seen as an effort to modify road use and traffic patterns in favour of cycling for example introducing two-way cycling in one-way streets or introducing advanced-stop boxes in front of cars at traffic lights Such regulation can also include work towards a reduction or calming of traffic
Pro-cycling subsidies may fall primarily within the sphere of national policies However municipal fiscal measures may include local tax benefits to install cycle-friendly infrastructure such as bicycle parking at work Local governments can also demonstrate their support for cycling through cycle-friendly public procurement procedures which may include purchasing electric bicycles or electric cargo bikes instead of light commercial vehicles for services such as postal deliveries
Resource implications and key requirements
The design and construction of segregated cycle lanes may be costly but moderate alterations to existing road infrastructure such as painted lanes on the side of roads are more affordable for a city budget A different issue arises from the potential need to reallocate scarce urban road space to safe cycling infrastructure by removing on-street car parking facilities or by introducing one-way streets From 2010-14 the city of Copenhagen allocated euro80 million to the implementation of its bicycle strategy The cycling infrastructure in Copenhagen is extensive and includes
48 See Financial Times (2019) 49 See Xylia et al (2017) 50 See Marshal (2019) 51 See CIVITAS (2009)
Sector-based policy options
39
a network of segregated bike paths bicycle traffic lights separated coloured bike paths where cars and bikes share road space and bicycle parking
Pro-cycling policies can be administratively demanding due to the need to create a cycling code and implement new regulations for non-road infrastructure provision such as bicycle parking Policy measures that involve re-regulation of traffic patterns can also be technically demanding and may necessitate new capacities within the local administration Bike sharing is not cheap but with good sponsorship arrangements it can represent a minimal burden for the city budget
Potential private-sector participation
The private sector is involved through the provision and sponsorship of bike-sharing schemes and companies may be further involved in providing bicycle parking facilities and cycling incentives as part of their human resources policies or remuneration policies Non-governmental organisations (NGOs) can also play an important role in rolling out information about cycling initiatives such as bike-sharing schemes
Implementation obstacles and solutions
Reallocation of scarce urban road space away from cars and buses will naturally meet resistance and compromises will have to be made As in many policy options a gradual introduction of pilot cases combined with clear communication and ideas for the city-wide and global benefits of a shift towards active mobility must make up a core part of a pro-cycling strategy This can include supporting cycling organisations working with stakeholders and developing marketing and education programmes ndash in which NGOs can also play a role
In many cities bicycle theft is a growing problem and should be addressed through supportive measures An important aspect of reducing bicycle theft is to involve multiple actors Municipalities should make safe parking spaces available and launch campaigns to inform bicycle owners about locks as well as introduce registration systems for bicycles or more advanced systems such as chips
T7 Car-sharing car-pooling and ride-sharing
Description
Reducing the number of car trips is a way to alleviate traffic with the aim of reducing pollution and greenhouse gas (GHG) emissions freeing up space for pedestrians and cyclists reducing journey times and increasing productivity Trip reduction may be promoted through several measures including (i) car-sharing which is the practice of renting a car from a prominent service provider and having ownership of the car for a limited time (ii) car-pooling in which a group of people travel together using their private vehicles especially for commuting taking the trips in turn and (iii) ride-sharing a car service in which a person uses a smartphone app to book a ride in a privately owned vehicle52 Some cities promote car-sharing services in the form of self-service cars in a similar form to cycle-sharing schemes (for example Share Now)
Car-sharing is not a predominantly public-centred policy but public authority bodies can facilitate or provide incentives for car-sharing programmes and it can be seen as a phasing policy before the introduction of full congestion charging or pedestrianisation
Resource implications and key requirements
Car-sharing can have a low administrative and technical burden and although it could have an associated financial burden if incentives are offered to individuals or companies to operate there are significant savings to be obtained through reducing the number of cars on the road Congestion is estimated to cost the EU economy euro100 billion annually with a US study indicating that if car-sharing schemes were widely adopted vehicle numbers could be reduced by one-third in specific scenarios53
Potential private-sector participation
To develop and implement a successful car-sharing programme local authorities must work with a wide mix of stakeholders including regional transport authorities regulatory bodies businesses and
52 See Barber (2016) 53 See Transport and Environment (2017)
Sector-based policy options
40
multiple local government bodies Local authorities may have to invest or require businesses to invest in online platforms to facilitate easy connection between users and vehicles Self-service schemes are normally administrated by the private sector
Implementation obstacles and solutions
The first barriers to car-sharing are the reluctance of potential users to adopt car-sharing services and a strong desire for car ownership and use In order to overcome these barriers it is important to generate awareness and change aspirations from single car ownership to the use of connected transport modes through robust awareness campaigns and user behaviours
There is a risk that car-sharing may have a limited impact on reducing car use in a city and further infrastructure for cars may have to be provided that is specific to self-service sharing schemes Moreover the effect of ride-hailing apps on congestion is contested They could reduce traffic by encouraging people to leave their cars at home or they could increase the number of vehicles on the road if people switch away from public transport or forms of active mobility
In the case of sharing schemes it is also important to provide procedures for checking driving licences and to have appropriate insurance procedures in place to ensure safety for women in particular
A further challenge relates to private vehicle restrictions that pose a threat to car-sharing Exemptions from such policies could be a solution to promote car-sharing
It is difficult to generate a large user base to reach a certain operational scale for self-service car-sharing schemes and it has been found that competition from taxis that are competitively priced can reduce the use of car-sharing services54 Paris is an example of a city with an electric scheme Autolib which closed in 2018 and offers some lessons to other cities The service had to compete with a minicab service suffered from
poor maintenance by users and the vehicles became places of shelter for drug users Due to decreasing use of the service the operating company went into debt
In order to be successful it is important that the operators of car-sharing schemes understand the context and regulation of the cities in which they plan to launch DriveNow an alternative car-sharing scheme has seen significantly more uptake with one million registered users across multiple cities55 However the firm has had to abandon business in Stockholm due to high congestion charging and parking costs56
Ride-sharing apps such as Uber have encountered resistance from the public due to their employment practices leading to bans on taxi and ridesharing apps in some countries and cities Solutions to this issue can include labour law reforms for self-employed workers and the enactment of regulation on installing mandatory meters Furthermore such apps require a strong and reliable mobile network with reasonable cost for data use Economies in the southern and eastern Mediterranean region have particularly weak data networks with Jordan Lebanon Morocco and Tunisia all in the lowest third of countries globally for overall data speeds57
Elsewhere the Los Angeles Metro is working alongside car-sharing company Getaround to provide an affordable and ldquohassle-freerdquo car-sharing service at more than 25 Metro transit park-and-ride lots58
Comparison with other policy options
Car-sharing does not yield the same benefits of transitioning to active or public transport but can still be successful in reducing congestion and air pollution and can lessen the risk of low public acceptability that can be associated with car-free zones or congestion charging Car-sharing is not intended to replace other traffic management policies but rather to complement them
54 See ITDP (2015) 55 See Holder (2018) 56 See Rolander (2018) 57 See Opensignal (2017) 58 See Metro (2019)
Sector-based policy options
41
32 Land planning green space and biodiversity Land planning should sit at the centre of any urban development programme From an environmental perspective land planning seeks to protect and promote green and liveable spaces promote resource efficiency and minimise any conflicts linked to the use of scarce urban space It also seeks to regulate the development and use of buildings and infrastructure Effective land planning is a necessity for the development of other infrastructure services in a city Therefore one should normally see close coordination between land planning and sector-specific developments ndash including infrastructure services linked to transport water energy and waste
Over the past decades urban design and planning have in many places shifted away from a car-enabling development that focused primarily on productivity to a more people-oriented development with greater emphasis on environmental aspects and the wellbeing of the population As a consequence there has also been a shift to a more community-based planning process in which active participation by residents increasingly influences the land-use priorities of a city
From an environmental and wellbeing perspective some key strategic principles for land use include the following
1 Development of compact cities
2 Promotion of mixed-use areas and transit-oriented development
3 Promotion of green spaces and biodiversity
4 Promotion of community-based land-use planning
These strategic principles or policy options are
described in further detail in Sections L1-L4
L1 Development of compact cities
Description
Compact cities have many environmental benefits when compared to sprawling areas of low density The benefits include a reduced dependence on cars (hence lowering emissions) a smaller energy consumption due to dense development better and more cost-efficient public transport services and increased overall accessibility through public and active mobility Resource efficiency is further promoted through the reuse of infrastructure and previously developed land on the back of regeneration of urban areas
Policies of urban compaction involve the promotion of urban regeneration the revitalisation of town
Sector-based policy options
42
centres restraint on development in rural areas and higher-density real-estate development The promotion of compact cities is further linked to mixed-use development and the concentration of urban development at public transport connection points (see policy option L2)
One way of promoting more compact urban development is to restrain development in rural or peripheral areas of the city Such development can be controlled through the approval process of planning applications and through effective control and enforcement of any illegal developments
Other ways of promoting compact urban development include support for urban regeneration and higher-density real-estate development Urban regeneration would normally involve private developers getting involved in brownfield redevelopment projects This would normally work best when there is a clear partnership between private developers and the municipal authorities and where the municipality among others commits to providing strategic visions adequate infrastructure and transport services Private developers tend to welcome higher-density real-estate development and building permits can include obligations to undertake additional investments linked to the decontamination of brownfield sites or to the construction of green or public spaces for the benefit of the wider area
Resource implications and key requirements
Building restrictions at the periphery of a city require effective control and enforcement of building permits In cities where illegal construction activities are widespread significant resources and effort must be put in place to regulate the informal sector However building restrictions offer revenue-generation opportunities for city authorities For example Toronto has secured over US$ 350 million through its density-bonusing policies and in-kind benefits seem likely to have doubled the total value of revenues59 Normally restraining urban sprawl would not require significant capital investments by a city On the contrary the containment of urban sprawl should lead to less demand for expanded infrastructure networks and related services
Urban regeneration and the construction of high-density real estate require massive investment programmes However such investments are primarily provided by private developers and city authorities may only be obliged to finance-related infrastructure upgrades Nevertheless the necessary municipal investments may not be trivial and should be carefully considered before embarking on a large-scale urban regeneration programme City authorities must also be ready to provide comprehensive planning documents and feasibility studies as well as carrying parts of the site preparation costs and development risks linked to issues such as requirements to decontaminate sites prior to their development
Potential private sector participation
While the city authority may sit in the driving seat in terms of restraining urban sprawl the private sector will normally be financing and ndash to a large extent ndash driving any urban regeneration efforts and real-estate development
Implementation obstacles and possible solutions
Controlling urban sprawl may meet substantial resistance from developers and local residents One way to help build a public consensus and clarify the regulation can be to build a greenbelt around the city This however may require the city to acquire land to relocate people and to manage the landscaping and maintenance of the greenbelt In Tirana Albaniarsquos capital the Donate a Tree initiative has surpassed its target and triggered donations by residents companies and international organisations60
59 See Institute on Municipal Finance and Governance (2013) 60 See Sustainable Cities Platform (nd)
Sector-based policy options
43
Urban regeneration projects require substantial buy-in from local residents and private developers who may have differing interests For example the city of Roubaix in France has followed a market-led approach to urban renewal while integrating the issues of social exclusion housing renewal and economic and cultural development into its regeneration policies61 Comprehensive stakeholder engagement is therefore crucial and to incentivise private-sector participation the municipal authorities must be able to provide strategic visions and comprehensive planning documents This provision needs to be combined with a clear commitment to providing the necessary transport solutions and perhaps risk-sharing arrangements linked to issues such as requirements to decontaminate sites prior to their development
L2 Promotion of mixed-use areas and transit-oriented development
Description
Mixed-use development where housing jobs commerce and leisure are in close proximity is considered to yield significant economic and social benefits compared to more traditional separately zoned cities in other words those in which residential areas sit adrift from commercial areas First mixed-use areas require less transport for their inhabitants who will travel shorter distances between private and public activities In addition the shorter transport distances within a mixed-use area may also help promote active mobility rather than motorised transport As a consequence significant time-saving and environmental benefits are expected to follow a shift towards mixed-use urban development ndash time saving that can be used for leisure or for productive work For example a doubling of job and living density has been shown to increase economic productivity by 2 to 4 per cent62 Economies that are less transport-dependent can also be more inclusive for individuals who otherwise would not be able to afford the transport cost required to access job markets education or other services
The environmental benefits can be further enhanced if mixed-use areas are developed in line with transit- oriented urban development which refers to centres of social and commercial activities that are located at public transport connection points Such a combination of mixed-use areas and transit-oriented development can accelerate the use of clean transport systems and further rebalance the use of the streets in favour of pedestrianisation and active mobility where cars are prevented from undermining communal life
Land-use zoning is a concept used to support transit-oriented and mixed-use development In this context zoning policies are those that designate an area to a certain use and are often supported by a regulatory framework to ensure that developers abide by the recommendations and future developments do not threaten the ambitions set out in the policy They are particularly successful where there are areas of vacant land for example brownfield areas like old industrial sites or other areas where the policy is not in direct contradiction to existing developments
Resource implications and key requirements
Shifting to mixed-use and transit-oriented urban development requires significant resources in terms of planning and regulation and it has to be pursued in close coordination with various city departments including the cityrsquos transport planners It takes many years and requires close cooperation with multiple stakeholders and a constructive partnership with private developers In Clerkenwell in London mixed-use areas have been developed as a consistent policy for more than 20 years after the concept of mixed-use development emerged in national planning policy guidance63
Potential private-sector participation
In general the associated real-estate development will be financed and constructed by private developers Good planning coordination and contracting with private developers and businesses is therefore important
61See URBED and the Joseph Rowntree Foundation (2006) 62 See Bloomberg Citylab (2012b) 63 See VivaCity2020 Cities Institute LondonMet (nd)
Sector-based policy options
44
Implementation obstacles and solutions
Like other forms of urban regeneration projects promoting mixed-use areas on the back of a transit-oriented development will require coordination among several city departments as well as the buy-in of local residents and private developers who may have differing interests Such multi-stakeholder complexity may prevent or delay the implementation of mixed-use strategies Comprehensive stakeholder engagement will be crucial and clear municipal commitments to strategic visions together with improved infrastructure and public transport services may be needed
L3 Promotion of green spaces
Description
A wide range of benefits are associated with the provision of accessible urban green spaces and waterways First access to green spaces and waterways has a positive impact on the mental wellbeing of the population Second green spaces have direct environmental benefits They can help improve air quality and even regulate the air temperature of a city Furthermore they can reduce flood risks as vegetated surfaces are well equipped to absorb and store water Lastly green spaces can help boost biodiversity In order to promote the benefits of green spaces policies and initiatives should aim (i) to promote more green space (ii) to improve the value of the green spaces and (iii) to facilitate better accessibility for all to green spaces infrastructure and waterways
It may be necessary to extend the amount of green space through a combination of protective measures for existing green spaces and a proactive conversion or restoration of urban space and building surfaces into new vegetated areas Protective regulation includes rules monitoring and enforcement to protect green spaces from being lost to new built structures For example in Stuttgart Germany green areas are protected by local urban zoning and planning regulations These are supported by a Climate Atlas created to guide the location of green spaces to facilitate cooling and airing of the city64 These protective measures would normally be carried out by municipal authorities although local communities and NGOs may undertake some of the monitoring functions
Transformation of urban brownfield areas and building surfaces into vegetated land will however require close cooperation with private developers and landlords Opportunities here include ways to integrate green or blue urban space development such as the obligation to develop pocket parks or to clean up waterways as part of brownfield redevelopment projects Other measures aimed at increasing the amount of green space include community-based initiatives to increase the development of pocket parks gardens and farming activities on available urban land For example urban agriculture policies in Amman Jordan have initiated the greening of more than 300 rooftops and of around 4000 school and home gardens65
An increase in the number of green urban spaces can also be achieved through the promotion of green roofs Green roofs (or walls) have many of the same environmental benefits as traditional parks and gardens including decreased surface-water run-off preventing flooding during heavy rainfall improved local air quality decreased local air temperature and the promotion of local biodiversity Green roofs can be introduced on public buildings They can also be introduced on private buildings through subsidies or through planning approvals for new construction or renovation In addition green roofs can be promoted through better information and awareness campaigns For example Toronto in Canada has introduced an ambitious green roof policy requiring
64 See European Environment Agency (2014) 65 See ICLEI (2014)
Sector-based policy options
45
buildings above a certain height to have a certain percentage of green roofs66
Beyond the amount of vegetated land the quality and the value of green infrastructure also matter Green spaces can increase their value through proper landscaping and maintenance Turning green spaces into multifunctional areas is another way of increasing their value which again can generate new revenue streams to fund landscaping and maintenance For example urban green spaces can be rented out for specific events and parks can be designed as flood barriers reducing flood risks or the need to spend resources on alternative flood-protection measures Examples of this are the jointly funded flood alleviation schemes on parks in London UK For example through joint funding from Southwark Council the Environment Agency and Thames Water schemes delivered surface-water flood protection for over 100 homes at risk and brought investment and improvements to several parks and sports grounds67
Improved accessibility is another way to ensure the benefits of green spaces in a city Therefore urban planning should always consider how new or amended network infrastructure and built environment can improve current or restored green or blue infrastructure
Resource implication and key requirements
It requires a significant number of resources to construct improve and maintain green spaces and urban waterways For example in Hamburg Germany the estimated costs for the installation of 300 square metres of green roofs is estimated at euro9500 compared to euro3000 for grey roofs68 Green roofs have higher maintenance costs but reduced rainwater fees and a longer roof lifetime led to similar overall costs over 40 years Therefore recognising the multifunctional potential and additional revenue streams for urban green spaces can help mobilise significant funds to the sector With an adequate mix of incentives regulation and information campaigns private developers and property owners can be encouraged to contribute to the greening of cities
Implementation obstacles and solutions
Acquiring resources may be the biggest obstacle to an effective urban green space policy Therefore professional management of green and blue assets is important with visions and skills to mobilise funding and contributions from private sector and voluntary organisations To address this issue a number of local authorities in the UK are considering transferring their management of green spaces from the public sector to private and charitable sectors69 It has been argued here that one single charitable body at armrsquos length from the government can present a more compelling case for support to corporate sponsors private donors and charitable trusts as well as attracting new volunteers In terms of the untapped opportunity to benefit from volunteering a UK survey found that nearly 70 per cent of young people wanted to volunteer to help create better green spaces in their community but only 7 per cent said they currently do70
L4 Promotion of participatory land-use planning
Description
Community-based land planning and participatory design for public urban spaces refer to a collaborative
66 See Bloomberg Citylab (2012a) 67 See Herne Hill (2015)68 See Climate ADAPT (2019)69 See National Lottery Heritage Fund (2014)70 See BBC News (2016)
ldquoBeyond the amount of vegetated land the quality and the value of green infrastructure also matter Green spaces can increase their value through proper landscaping and maintenance Turning green spaces into multifunctional areas is another way of increasing their valuerdquo
Sector-based policy options
46
approach to planning and design between urban planners government authorities businesses and the local community This approach goes beyond traditional stakeholder consultation and instead invites members of the local community to propose solutions and new ideas It may relate to a specific project but can also be used for the development and testing of a wider strategic plan Such approaches are becoming increasingly popular as authorities recognise the diverse natures of the communities they govern and that traditional fixed standards and design criteria do not take into account the varying needs of residents71
The use of participatory land planning and design is expected to ensure the improved liveability of city areas and it is likely to improve the public acceptability of development proposals by demonstrating transparency in the design approach ensuring greater inclusivity and community ownership of the final design72
Resource implications and key requirements
A number of frameworks for public co-design have been developed by academic and research institutions These can be replicated across cities with a variety of contexts and characteristics For example the Adaptive Governance Lab at the School of Architecture at University of Limerick has developed a lsquoDesigning with Communitiesrsquo framework which emerged after five years of practice73
The existence of already well-designed approaches can reduce the administrative burden on cities although participation in design of this nature requires multidisciplinary teams to facilitate the process74 Such teams must be appropriately trained in this type of engagement as the use of appropriate language in a specific context and with specific groups is key to successful communication with stakeholders Therefore local government authorities may require capacity-building or working alongside external experts In Barcelona such a community-based approach to urban planning and design is being pursued to promote ldquoSuperblocksrdquo whose overall
programme has a budget of US$ 124 million from 2014-19 This shows that it is not necessary to invest in large infrastructure solutions to improve the lives of city residents75
Implementation obstacles and solutions
Co-design of urban spaces can be a slower and more time-consuming process than other stakeholder engagement processes but if considered early on in the design approach it can be significantly rewarding
Delivering workshops or interactions with community members that facilitate co-design requires trained professionals who understand the complexities risks and potential conflicts arising through such intense involvement of local groups who may not have an in-depth knowledge of planning approaches Using the co-design of urban spaces as a tool for stakeholder engagement can also build up the expectations of stakeholders as to their influence or impact on the project which can be particularly challenging to manage for groups that have a high level of interest in the project Therefore at the beginning of any session or period of engagement it is important to lay out the expectations and potential outcomes to the groups being engaged This is where a pre-prepared engagement plan can assist in identifying the opportunities outcomes and risks ahead of time
33 Energy and buildingsIn the EBRD regions there is a legacy of buildings with poor energy efficiency and high electricity and heat consumption as well as widespread use of fossil fuels for electricity and heat generation For instance nearly half of the housing stock in central and eastern European countries was constructed between 1960 and 1990 During this time new housing construction was primarily pre-fabricated large-scale multi-family housing blocks built with little or no consideration of energy efficiency76 Furthermore the use of solid fuels
71 See Inclusive Design Research Centre (nd) 72 See David et al (2012) 73 See Webb et al (2018)74 See Aguilar (2015)75 See C40 Cities (2018) 76 See UN-Habitat (2017)
Sector-based policy options
47
for heating remains common in some cities in the EBRD regions and this has also been a major source of local air pollution
These environmental challenges are linked to several structural problems and shortcomings Partly these challenges are linked to the legacy of low electricity and heat prices and the lack of consumption-based billing all of which limit incentives to reduce heat consumption or to invest in energy-efficient buildings They are also partly linked to low administrative and financial capacity in the cities which hampers the ability to invest in regulate and promote energy efficiency measures or renewable energy generation at the city level The financial constraints are often further increased by a lack of creditworthiness and by limited access to financing for local public and private entities in the EBRD regions
There is an increasing awareness of and a growing effort to achieve an energy-efficient building stock and a decarbonised energy sector following both national and local commitments to the Sustainable Development Goals and the Paris Agreement Among the policy efforts to reduce GHGs and pollution from urban electricity and heating consumption are (i) ways to encourage investment in energy-efficient buildings (ii) ways to ensure more energy-conscious consumption patterns and (iii) ways to decarbonise the provision of heat and electricity Key policy options can be presented according to the following list
Policies to encourage energy-efficient buildings
1 Improved energy performance for public buildings
2 Improved energy codes and labelling for buildings
3 Policies and support for energy performance contracts
4 Financial incentives and access to capital for energy-efficient renovation
Policies to ensure more energy-conscious consumption
5 Pricing metering and billing of heat and electricity
Policies to decarbonise heat and electricity provision
6 Decarbonisation of district heating supply
7 Renewable electricity generation
E1 Improved energy performance for public buildings
Description
Increased energy efficiency of municipal buildings can have a direct and significant effect on the energy consumption and the related emissions and expenditures of a city It can also have an indirect impact through the demonstration effect and potential for raising awareness of energy efficiency benefits among the wider public
One way to encourage improved energy performance of municipal buildings is to require higher energy standards for new public buildings For example for countries subject to the EUrsquos Energy Efficiency Directive all new buildings occupied and owned by public authorities must now be ldquonearly zero-energy buildingsrdquo77 This EU Directive also sets mandatory requirements for municipal purchases and new rental agreements Public procurement of low-energy buildings however can only address some of the problems as long as the main energy efficiency challenges derive from the existing building stock In such cases improved energy performance should also be pursued through effective refurbishment of the municipal building stock
Setting up a municipal energy agency has proven to be a cost-effective way to identify and refurbish public buildings For example the Berlin Energy Agency
77 See European Commission (2020)
Sector-based policy options
48
a public-private partnership was founded in 1992 and has since launched energy efficiency retrofits in more than 1300 public buildings and 500 private properties78 The size of a municipal energy agency can be scaled from a one-officer position to a larger unit with extended expertise Similarly the role of an energy agency can be scaled from only assessing and ranking the public buildings with the greatest energy-saving potential to also cover extensive procurement and implementation support together with training and awareness-raising activities among decision-makers and occupants of public buildings
Resource implications and key requirements
Public procurement of low-energy buildings will typically imply higher investment costs and lower operating costs and can be economically justified in the long term For cities with a population larger than 50000 setting up an energy agency has proven to pay for itself through the energy and cost savings the agency helps to achieve However highly subsidised energy prices would not favour energy-efficient constructions or refurbishments and it is important that countries with large energy subsidies seek to reduce them
Implementation obstacles and solutions
Complacency among city officials and limited financial capacity may prevent an effective pursuit of energy-efficient public buildings Increased public disclosure of the energy performance of different city
departments combined with the inclusion of energy consumption in key performance indicators (KPIs) for various city managers may provide good incentives and raise awareness of the benefits of improved energy efficiency Private-sector involvement through PPP-style energy performance contracts (see policy option E3) has also proven to be an effective way to finance and implement energy efficiency measures This approach has for instance been deployed in Berlin under the Energy Saving Partnerships using energy performance contracting
E2 Improved energy building codes and labelling
Description
A building code sets out minimum requirements and standards for buildings and covers various aspects of health safety and welfare ndash including energy performance Relevant building energy codes typically consider lighting walls and roofs glazing heating ventilation and air conditioning Building energy codes can vary in their degree of ambition and for nearly zero-energy buildings one would typically incorporate sensors to automatically control lighting and water use as well as centralised energy control systems to monitor and dynamically minimise energy use79 Effective implementation of building codes requires adequate approval and verification procedures where the construction or major alteration of buildings must
78 See Berliner Energie Agentur (2006)79 See Coins Global (2015)
Sector-based policy options
49
conform to the code to obtain planning permission usually from a local council
Building energy codes are often supplemented with building certification labelling or information disclosure programmes An energy certification and labelling process helps to ensure that the energy performance of a building is above a certain threshold and communicated to customers in an effective way Certifications and labelling can be mandatory or voluntary Mandatory certification can be used to ensure compliance with building codes and enable better enforcement Energy certificates can further inform prospective owners and tenants about the performance of specific buildings and systems and may offer recommendations on how to improve energy performance Certification further raises awareness about energy efficiency and energy expenditures with the potential to gradually ensure that a more efficient building stock is being demanded and subsequently supplied Voluntary certification can be used if sellers or landlords want to distinguish themselves from their competitors This allows them to inform consumers and help prospective purchasers to anticipate energy costs and therefore increase the demand for energy-efficient buildings80
While building energy codes may be driven by national authorities local authorities have significant influence over implementation by means of the planning permission stage Local authorities can also help promote energy efficiency standards through local requirements for information-sharing and through mandatory energy labelling of private and public buildings Furthermore municipal authorities can also facilitate information-sharing platforms and standards for voluntary energy-labelling schemes
Resource implication and key requirements
As building energy codes become more sophisticated they require additional expertise and continued efforts to develop and apply them as part of building permitting Developing or revising a building energy code for local use may not require an excessive amount of resources National templates can also be developed for more easy application at the local level
However effective implementation and enforcement of a building energy code requires city officials or accredited professionals to sign off on plans and the finalisation of building works ndash and this requires significant resources The costs of verification and reporting can be passed on to private building sellers and buyers
Due to the substantial upfront costs it may be a solution to combine tighter building energy codes with financial incentives as well as certification and labelling to improve consumer awareness and support enforcement Tighter building codes may also be combined with expedited review of the permitting process and density or height bonuses if buildings meet particular sustainability criteria For example Mexico Cityrsquos Sustainable Buildings Certification Programme a voluntary programme reflecting various levels of sustainability performance offers a number of incentives including property tax reduction and attractive financial schemes to cover the cost of building upgrades as well as expedited processing of construction permitting81 And lastly in countries or cities with a flawed construction permit system and a large informal construction sector it is important to dedicate resources to effectively manage the construction sector
Potential private-sector participation
Building-code verification tasks can be carried out by accredited private professionals (who should lose their accreditation in cases of misconduct) They do however require careful consideration regarding which bodies can provide accreditation in order to avoid one or more business associations managing this process in a monopolistic and non-transparent manner
Local governments can work with commercial banks to provide financial incentives therefore shifting the financial burden from the public to the private sector One example is Frederikshavn in Denmark which developed specific soft loans for the energy renovation of housing to meet its climate change targets A new product was developed by the municipality in agreement with local banks featuring a longer maturity period and lower interest rates relative to typical market conditions
80 See Broekhoff et al (2018)81 See C40 Cities (2017)
Sector-based policy options
50
Implementation obstacles and solutions
A tightened building energy code represents increased investment costs for owners of existing and new property An extended information disclosure and labelling programme for existing buildings also requires more involvement and buy-in from property owners Under such scenarios it is natural that many stakeholders either oppose compliance or fail to contribute to the necessary arrangements It should also be noted that a large number of stakeholders will need to develop adequate understanding and capacity ndash including stakeholders such as real-estate developers architects engineers interior designers regulators inspectors subcontractors manufacturers of building materials and others
Given these challenges a gradual introduction of tighter building energy codes is recommended along with a gradual rollout of extended labelling and information disclosure programmes These should be combined with effective enforcement A gradual approach can be pursued through a step-by-step increase in the required standards and required activities ndash which should be announced years ahead of implementation A gradual approach can also be pursued by introducing higher energy-performance and reporting standards first as voluntary measures before making them mandatory Successful implementation of building energy efficiency codes can take many years to achieve
Denmark was one of the first countries to introduce nationwide energy efficiency standards for buildings The energy requirements in the Danish Building Regulations for new buildings have been tightened using a step-by-step approach preparing the Danish industry for future requirements almost 10 years in advance Moreover the new requirements are introduced as voluntary energy classes before they become mandatory
E3 Policies and support for energy performance contracting
Description
Energy performance contracting (EPC) is a form of packaged financing and capital works where financial savings from energy conservation measures are used to fund the cost of the measures82 EPC involves an energy service company (ESCO) that provides various services including finances and guaranteed energy savings The ESCO has a stake in energy savings for the client which leads to accountable energy and carbon savings The ESCO may be required to absorb some of the lost savings if savings do not materialise as expected which commercially incentivises ESCOs to complete optimal investments83
The attraction of EPC is that it enables end-users to secure energy-saving investments without drawing on capital or balance sheet payments The private ESCO companies provide the financing and so reduce the debt burden of the municipal authorities Eurostat confirmed that EPC investments are off balance sheet for public clients and provided a related guide for practitioners84 There are some examples of policymakers embracing this opportunity for public-sector energy efficiency investments having obtained Eurostatrsquos clarification for example in the Slovak Republic85 There is also evidence that specific investment costs are lower while energy savings are higher when applying EPC rather than regular public procurement of projects86
82 See World Energy Council and Arup (2016) 83 See Institute for Building Efficiency (2010b) 84 See Eurostat and EIB (2018) 85 See Ministry of Finance of the Slovak Republic (nd) 86 See Staničić (2018)
Sector-based policy options
51
The ESCO is the economic owner of the asset and bears most of the risks and rewards of the investment The ESCO is also responsible for the proper operation of the installed equipment and bears the maintenance and refurbishment risks87 It stays involved in the measurement and verification process for the energy savings during the repayment period ESCOs and energy performance contracting are mostly found in the public sector and to a lesser extent in the industrial and commercial building sectors
EPC policy instruments can include (i) the promotion of energy performance contracting through awareness-raising (ii) the removal of legal barriers to the use of innovative financial instruments (iii) the preparation of sample contracts and procedures (iv) the provision of expert support primarily to the public sector for preparing energy performance and supply projects contracts and evaluating the projects results and (v) the establishment of a qualified energy services provider scheme
Resource implications and key requirements
EPC requires sufficient technical capacity and often necessitates capacity-building due to the extent to which it differs from traditional public procurement processes Additional efforts will be needed in market sounding and preparation of EPC To enable EPC to take place it is important that the municipal budget law allows city authorities to sign medium-term to long-term service contracts Depending on the length of the EPC contract duration a stable reliable economic and political system and rule of law
are prerequisites For instance in Slovenia contract durations of up to 20 years are common
Potential private-sector participation
EPC involves the private sector directly through the creation of a market for ESCOs including a wide range of possible contractors such as engineering companies utility firms and equipment providers Furthermore ESCO structures are alongside PPPs one of the few financial structures that would allow the introduction of more private-sector finance into energy efficiency investments than the mere debt capacity of ESCO clients would allow thereby helping to bridge the existing finance gap88
Implementation obstacles and solutions
A lack of awareness in both the private and public sectors is often the first barrier to EPC This can be tackled through capacity-building A lack of resources to prepare related EPC tenders in the public sector is another barrier This can be improved through information provision and through providing technical support in procuring EPC projects
Prohibitive public budget and procurement regulations are another barrier For example in many European countries budgetary restrictions imposing lending limits on local governments leave capital-strapped administrations little room to pay for the upfront costs of performance contracting89 Regulatory reforms can be used to treat EPC investments as off-balance-sheet (no new public debt) and the aforementioned Eurostat clarification should give EU member states and accession candidates sufficient confidence Furthermore extending the contract duration is required too with deep building-retrofit projects in Slovenia for example having EPC contract durations of 20 years Public procurement regulation may also need to be reformed to include lifecycle cost analysis and functional tenders that use energy efficiency criteria as selection criteria in public procurement contracts and leave the technical solutions up to the contractor
Financing constraints are yet another barrier Credit markets remain constrained and lending institutions
87 See Šerić (2017)88 See European Commission (2018)89 See Institute for Building Efficiency (2010a)
Sector-based policy options
52
may be unwilling to offer energy performance contract financing despite provisions to guarantee ESCO performance Smaller ESCOs that are new on the market lack the creditworthiness required by banks As a response governments can provide guarantee schemes for energy efficiency loans provided to ESCOs An alternative solution is to create a project pipeline which investment banks such as the EBRD can then fund
However it is more than the availability of debt that prevents ESCO market development it is the limited borrowing capacity of ESCOs that limit the capacity to finance many deep-retrofit EPC projects with 20-year contract durations The solution to this is the sale of receivables of ESCOs to financiers that can understand price and accept the 20-year limited-recourse finance risk Supporting the development of such innovative financial (forfeiting) instruments through risk-sharing or other support mechanisms could be part of the policy mix backed by local authorities
The Czech Republic provides a good example of the development of a market for EPCs There facilitating has become an indispensable part of EPC projects in the public sector In addition competitive bidding has been developed into a standardised procedure which increases the quality of EPC projects for clients The European Code of Conduct for Energy Performance Contracting has been widely used and complies with the actual practice in the country
E4 Financial incentives and access to capital for energy-efficient renovation
Description
Central and local governments can provide financial incentives such as green mortgages and tax exemptions to developers or new building owners in order to encourage energy-efficient design and construction This can be used in parallel to certification and labelling
Financial incentives can be provided to encourage lsquoable to payrsquo households to retrofit their homes Some of the measures that governments can deploy include
supplier obligations grants and tax incentives Energy efficiency programmes can also be designed to leverage private capital for example through revolving loan funds or other financing structures in order to enable and incentivise green renovation of residential and commercial buildings
For instance Frederikshavn in Denmark developed specific soft loans for the energy renovation of housing to meet its climate change targets90 A new product was created by the municipality in agreement with local banks featuring a longer maturity period and lower interest rates relative to typical market conditions No funds are assigned to the financing schemes by the municipality Rather soft loans are provided by the partner banks that bear all the risk The partner banks run a creditworthiness check of homeowners decide who gets a loan and under which conditions In other cases public funds can be set up to provide favourable funding for energy renovation of private buildings through direct loans or through risk-sharing facilities for private banks
Resource implications and key requirements
Providing financial incentives will require budgetary commitments and may be administratively demanding for the local government Significant technical capacity will also be required to identify how incentives should be configured and applied Incentives can be targeted at lower income brackets of the population to address social equity concerns associated with energy poverty
Potential private-sector participation
Local governments can work with commercial banks to provide financial incentives thereby shifting the financial burden from the public to the private sector
Implementation challenges and possible solutions
The provision of direct financial support is financially demanding on local governments and can be targeted at fuel-poor homes It is good practice to undertake a comprehensive cost and benefit analysis of retrofitting to zero carbon for all households that are in fuel poverty and to provide targeted funding to
90 See Energy Cities (2016)
Sector-based policy options
53
these homes91 One of the first programmes to tackle energy poverty was the Warm Front programme in the United Kingdom 23 million households received assistance from the scheme Grants were on offer for improvements such as loft insulation cavity wall insulation and heating system improvements92
It is important to address market failures that prevent potentially cost-effective investments in buildings One such problem is the split incentives between owners and tenants where property owners may be reluctant to invest in energy efficiency if the main beneficiary is a non-contributing tenant The EURONET 5050 MAX project is an example of how this challenge can be successfully addressed for public buildings93
The success factors associated with energy efficiency measures include gaining and maintaining consumer trust an effective communication and marketing strategy training and qualification schemes to ensure that worker qualifications keep pace with the technical complexity of buildings and the targeting of trigger points such as household renovations or sales94 The provision of financial incentives and favourable financing should only come after energy efficiency building codes have been enacted and adequate enforcement and compliance mechanisms are in place for building construction and retrofits
E5 Pricing metering and billing of heat and electricity
Description
The EBRD regions have a legacy of subsidised electricity and heat tariffs along with normative billing rather than consumption-based billing Normative billing occurs when for example monthly heating bills are based on the size of an apartment rather than on the actual heating consumed However correct price signals are necessary to promote prudent energy consumption and to incentivise energy efficiency investments Today tariff reforms remain a key challenge in many of the economies where the EBRD invests
Good price signals depend on decent price-setting as well as good metering and billing mechanisms Price-setting should reflect all costs including environmental or climate-related costs In addition to an adequate price level it is also important that tariffs are set and adjusted in a predictable manner so that related investments can be undertaken without unnecessary risks of price volatility To ensure this the heat and electricity tariffs should be devised using a formula-based methodology and approved by an independent and capable regulator To this end the city authorities could help to set up or improve both the relevant methodology and the regulatory authorities While electricity tariffs often fall outside municipal control district heating (DH) and cooling tariffs are normally under the control or influence of local authorities
Effective metering billing and bill collection are also important to ensure correct price signals for electricity and heat consumption Electricity metering and billing can have different degrees of sophistication ndash from plain mechanical readers to digital meters with real-time information on consumption and expenditures combined with differentiated tariffs for day- and night-time consumption More sophisticated metering and tariff structures can help promote a more prudent and cost-efficient consumption pattern for example running washing machines at night when electricity tariffs and grid capacity are more favourable An even higher degree of lsquosmartnessrsquo includes metering and tariff arrangements that record reversed energy flow back to the grid This form of smart metering can help promote the installation of renewable energy solutions ndash such as solar panels on buildings as surplus energy production can then be sold back to the grid and further reduce the energy bill for the relevant buildings
District heating metering generally lags behind electricity metering in accuracy and sophistication and normative billing is widespread The technical challenges associated with DH metering are often largely due to old infrastructure that was not intended for individual metering However as new generations of heat allocators can be used as an alternative to heat meters the opportunity to achieve accurate
91 See National Assembly for Wales (2018)92 See UK Parliament (2013)93 See EURONET 5050 MAX (2020) 94 See Committee on Climate Change (2016)
Sector-based policy options
54
consumption-based billing of DH use is there This will have significant impacts on consumption patterns and incentives to invest in energy-efficient refurbishment of buildings
Utility sector pricing reforms are needed to accompany the installation of apartment-level metering technologies Kazakhstan is currently undergoing a smart heat-meter programme95 while a number of cities in Europe such as Tartu Estonia and Copenhagen Denmark have installed these systems
Resource implications and key requirements
There are significant investment costs linked to the installation and upgrading of meters For example fourth-generation apartment-level heat-cost allocators for metering with remote reading and control needed to introduce consumption-based heat billing cost around euro40 per allocator One allocator is needed for each radiator in an apartment96 The costs of a smart metering roll-out are largely borne by energy suppliers predominantly through funding the installation and purchase cost of meters (about euro110 per household) and through funding the national smart metering communications infrastructure Installation of meters in private properties also requires access to the properties Here cooperation with the property owners may require significant resources for the relevant implementation agencies Introducing smart meters that enable bidirectional energy flows would further require the development of a smart grid and necessary capacity within energy distribution companies that are able to implement such net metering arrangements To encourage the buy-in and cooperation of private companies and property owners some subsidy schemes may be needed which again represents additional resource requirements for the city or the authorities promoting this policy
A cost-benefit analysis by the UK government found that costs related to smart meters are expected to be around pound670 million per year whereas the benefits are calculated at pound19 billion per year on average Overall the UK government estimates that from
2028 the programme will be delivering net benefits of around pound12 billion per year97
Implementation obstacles and solutions
Increased electricity and heat tariffs often imply affordability constraints for low-income households It has been argued that this problem can be addressed most effectively through targeted support for the poor rather than by providing universal energy or heat subsidies to the population Installation of meters in private properties also requires access to the properties and necessary cooperation with the property owners To support this process a combination of information campaigns stakeholder consultation and price incentives to change metering arrangements has proven effective
E6 Decarbonisation of district heating supply
Description
District heating (DH) systems can reduce their carbon emissions through improving efficiency in the system or by switching to new fuel sources or new heat sources Efficiency in the DH system may be achieved by rescaling the size of the DH network as some DH systems are oversized or by upgrading old boilers and leaking heat pipes District heating systems can be further decarbonised by switching away from fossil fuels to renewable sources and by capturing new sources of surplus heat
Whenever DH systems are based on carbon-intensive fuel sources such as coal or heavy fuel oil the potential carbon reduction is significant For example in Bosnia and Herzegovina several district heating operators have replaced heavy fuel oil heat boilers with biomass boilers This has not only reduced carbon emissions it has also reduced fuel expenditure and helped generate local jobs by developing local markets for the supply of sustainably sourced biomass98
95 See EBRD (2017) 96 See EBRD (2018b) 97 See UK Department for Business Energy and Industrial Strategy (2019)98 See UN Environment Programme (2017)
Sector-based policy options
55
Actively capturing the heat surplus from other economic activities is another way to decarbonise the district heating sector Historically heating systems have often been fuelled by surplus heat or heat waste from industrial processes or from electricity generation However as some manufacturing industries close down and new technologies and new industries emerge new opportunities for potential heat sources may appear Some of these heat sources may need a lsquotop-uprsquo to bring the final temperature in line with a commercially required heat supply but such heat sources may include surplus heat from data centres shopping malls or wastewater treatment plants
Resource implications and requirements
All the abovementioned ways to decarbonise the DH supply require significant upfront investment However these measures are expected to considerably reduce operating costs and can therefore be economically justified in the long term For example the city of Banja Luka in Bosnia and Herzegovina has developed a feasibility study to improve its district heating system which has attracted interest from the EBRD in providing an investment package of euro15 million for new biomass boilers network upgrades and other efficiency measures These are expected to reconnect 80 per cent of disconnected users to the district heating network within four years and reduce fuel consumption by 27 per cent thus reducing emissions by 20000 tonnes of CO2 per year and leading to euro45 million in fuel savings99 100
Potential private-sector participation
Many of the proposed investments and solutions can be provided through PPP-style contracts or energy performance contracts Under these contracts private energy servicing companies (ESCOs) make the necessary investments which they also finance while being remunerated based on the energy efficiency achieved during a fixed operating period Energy performance contracts have been demonstrated to be an efficient way of addressing investment needs providing operational efficiency without adding an additional debt burden to municipal accounts (see policy option E3)
Implementation obstacles and possible solutions
High upfront investment costs and a potential reluctance of some decision-makers to change may hamper support for the proposed decarbonisation measures One possible solution is the use of private-sector contracting or energy performance contracting where the debt burden and performance risks are allocated to private contractors
E7 Promotion of renewable electricity generation
Description
Public and private actors can help increase the local production of renewable energy and thus help reduce the carbon footprint of a city The public sector can lead the way by seeking to install and apply renewable energy solutions wherever economically justified This can include (i) the introduction of solarphotovoltaic panels for existing and new public buildings or other built structures (ii) the use of solar panels to fuel public installations such as street lights or ticketing machines and (iii) an active use of biomass or biogas solutions for energy purposes For example this can include gas capture from solid waste or wastewater facilities The benefits of such installations are not only their reduction of energy consumption and the related carbon emissions and energy expenditure but also that they raise awareness and underpin other initiatives aimed at encouraging private actors to install renewable energy solutions
Another possible policy instrument to encourage private actors to install renewable energy solutions is the cityrsquos control over planning permits for new buildings and for large building alterations For example a city can insist on specific renewable energy components being included as a condition of obtaining building works permits Alternatively the city can as a minimum require that renewable energy alternatives are analysed when project proposals are being developed Another measure could be to include solar panel mandates for certain parts of the building stock For example Seoul has introduced solar mandates for
99 See CTCN (2015)100 See EBRD (2018a)
Sector-based policy options
56
new multiple-unit dwellings and commercial buildings to accelerate the deployment of solar panels101
While solar panels can be introduced for self-consumption purposes this can be further incentivised if it is combined with smart meters or net metering mechanisms This approach could include further incentives through favourable feed-in tariffs for the energy sold back to the grid by private households or private companies
Setting up a municipal energy agency has also proven to be a cost-effective way to promote renewable energy in a city For example the city of Barcelona has set up the Barcelona Energy Agency to meet its environmental and energy commitments The agency currently supplies 20000 users in public and private buildings with renewable energy102
Resource implications and key requirements
Even though the costs of solar technology have been falling rapidly financing often remains the biggest challenge to implementing a municipal solar plan Cities have a range of business model options to overcome this barrier distinguished by who owns the asset the city itself or a third-party investor103 Cities must weigh up these financing and ownership options taking into account upfront capital costs and expected payback over the lifetime of the installation National and local regulations including on whether third-party ownership is permissible at all will determine the type of possible financing structures Similarly there are significant investment costs linked to the installation and upgrading of meters (see policy option E5)
Implementation challenges and possible solutions
As outlined above significant investment costs are often the biggest barrier to cities embracing solar solutions To overcome these barriers cities can either pursue a direct or a third-party ownership strategy with regard to the solar assets In the direct ownership model the city purchases the solar system using its own funds grants from national or regional government or by borrowing money using
municipal bonds The benefits of such a model are that direct ownership allows the city to have full control over the benefits of solar However the city is dependent on the upfront capital being available or the financial legal and political ability to issue bonds In most cases the city also shoulders the full risk of constructing and operating the solar system Direct ownership can be a cityrsquos only option if the regulatory framework necessary to enable more elaborate business models is not in place
In the third-party ownership model the city government enters into a contractual agreement with a private developer who provides the upfront investment for the solar system These models can allow the city to install solar power with no upfront capital costs and no impact on their balance sheets Third-party ownership models are better suited to larger scale projects because the legal and due diligence costs for investors can be high The two core models of third-party ownership are power purchase agreements or lease arrangements104
Upgrading electricity meters also requires significant investment costs as well as widespread cooperation from private property owners who may be unwilling to cooperate Therefore these policy measures may be most successful when combined with subsidy schemes and favourable price signals such as subsidised feed-in tariffs for electricity thus channelling electricity back to the grid from private businesses and private property owners Predictability is very important in order to encourage private actors to invest in renewable energy solutions Hence city authorities should consider ways to increase predictability through risk-sharing arrangements or guarantee mechanisms The city should also clearly define its commitment to the renewable energy agenda as part of its stakeholder consultation process and public awareness campaigns
101 See Seoul Metropolitan Government (2017)102 See Barcelona Energia (2019) 103 See C40 Cities (2019) 104 Ibid
Sector-based policy options
57
34 Water and wastewaterFrom an environmental perspective the main objectives of water sector policies are to prevent pollution and to encourage resource efficiency in the sector Furthermore water policies should also enable quality water services to be provided in a sustainable manner Pollution generated in the water sector primarily derives from untreated wastewater and to some extent from emissions related to energy use in the sector Resource efficiency can therefore be related to water efficiency including reuse of wastewater as well as energy efficiency in the sector
Water utilities sit at the centre of this but industries businesses and residents also play important roles as do water users and producers of wastewater Starting with the water utility the relevant policies are to ensure that the utility firm has enough resources and the capacity to make necessary investments as well as to provide good services in a sustainable manner It is also important to ensure a predictable institutional framework with clear rules and incentives for the water utilities to make the right decisions Therefore policy reforms should aim to ensure that the utility firm is well regulated and controlled on the back of robust institutional capacity and adequate information
Regarding water users such as industries businesses and households an effective control of water use and wastewater pollution is critical Policies should also provide price signals incentives and support for water-efficient behaviour and awareness among the different user groups Sustainable supply and use of water and wastewater services must be built on the back of a sector plan that carefully assesses future water sources and water needs as well as investment needs Such a plan should also carefully consider the sequence of reforms and investment programmes In particular tariff reforms should be introduced at an early stage to detect any reduced demand and to better scale the necessary investments in water and wastewater treatment capacity
Potential water policy options relevant for green cities include the following
Policies targeting water and wastewater utilities
1 Regulation and contracting of public and private service providers
2 Reform and strengthening of water utilities
3 Promotion of resource-efficient utilities
Policies targeting water users
4 Effective tariff reforms and price signals
5 Awareness campaigns for households and industry
W1 Regulation and contracting of public and private service providers
Description
While municipal water utilities are subject to national rules and regulation the governance of the water sector also relies on municipal authorities playing an active role On the one hand city authorities are needed to ensure proper supervision and enforcement of national rules ndash for example through local monitoring control and enforcement On the other hand city authorities should also play an important role as the owners of the municipal water utilities This governance function can be supported by a well-defined public service contract (PSC) specifying the rights and obligations of the city and the water utility firm Furthermore in the case of extended private-sector involvement the city should play an important role in procuring and supervising any private-service providers
A well-defined PSC between the city and the water utility can help ensure clear and transparent governance of that utility when it is owned by a municipality ndash the utility should have been converted into a separate legal and commercial entity Such contracts should clearly define the rights and obligations of both the water utility and the respective city authorities It should also specify procedures and methodologies for business planning and approvals for budget- and tariff-setting and for performance assessment and reporting The aim is that
Sector-based policy options
58
a well-defined service contract will provide predictability and clear accountability for both the water utility and for its municipal owner
Resource implications and key requirements
Efforts and additional capacity may be needed to design and supervise a well-defined service contract between city authorities and the water operators Drafting a PSC can sometimes benefit from contract templates or examples from other cities or international institutions With some external support and technical assistance a service contract can in many cases be concluded within six to nine months For example in Bucharest the concession contract between the municipality and Vivendi Universal was signed in March 2000 and became effective in November 2000 But effective application of the service contract requires more time as there may be a need for a change of mindset among the city authorities and the utility management
Potential private-sector participation
Water and wastewater services can be provided through different forms of private-sector participation ndash from the outsourcing of non-core activities to management contracts or full-scale concession contracts
Outsourcing contracts may cover a targeted area of activities such as meter reading and bill collection More comprehensive private-sector involvement can come in the form of a management contract under which a private contractor works alongside or fully replaces the existing utility management The benefit of a management contract is that a private contractor brings in expertise and may also be less subject to politicised pressure once a contract with clearly defined objectives and performance-based remuneration has been signed Even more comprehensive private-sector involvement could come in the form of a concession contract often referred to as a PPP contract which transfers funding construction and operational obligations to the private contractor It can also transfer the full operational and revenue collection risks to the private sector
The preparation and monitoring of a concession contract requires significant resources and administrative capacity within the respective city authorities It also requires a robust legal framework A full-scale concession contract for a water utility should thus only be recommended in cities that benefit from good information about current operations and infrastructure assets and that further benefit from a well-developed legal framework and a strong administrative and procurement capacity
Implementation obstacles and possible solutions
The introduction of a public service contract implies a more formalised relationship between the city authority or administration and the water utility management This requires a change of mindset and more transparent processes which some stakeholders may find unnecessary
The introduction of deeper private-sector participation in the form of comprehensive management contracts or a full-scale concession contract requires significant preparation and institutional capacity within the city administration Therefore for cities with limited experience of private-sector contracting it may be beneficial to pursue a step-by-step approach where smaller and less complex contracts are introduced first followed gradually by deeper private-sector involvement For instance the Armenian water authority has introduced the private sector in a gradual manner over more than 10 years by first introducing management contracts
Sector-based policy options
59
and then transferring revenue risks and later investment obligations to the private sector105
W2 Reform and strengthening of water utilities
Description
Converting a municipal water utility from an administrative unit into a separate legal entity with clearly defined objectives and targets can help make the utility and its management focus on its operational and financial deliverables ndash and thereby help to depoliticise and professionalise the planning and management of the utility Such corporatisation into a joint stock company (JSC) may also enable better and more transparent governance of the water services following the introduction of an arms-length distance between the utility management and its municipal owner
The operational and financial performance of a water utility can be further improved through targeted capacity-building and restructuring of their utility Such efforts typically involve the development and implementation of a corporate development programme (CDP) A CDP would typically start off with a diagnostic followed by clear recommendations and actions aimed at addressing any identified shortcomings linked to capacity systems or processes within the utility and its operations
Resource implications and key requirements
Converting a municipal water utility into a JSC requires a significant legal effort and there is a need for clear political buy-in However it is in principle a one-off event and it does not require significant physical investment
In contrast building necessary capacity within the city administration and their water utility is a process that can take several years It requires the utility to develop capacity to manage and plan its assets and future investment needs This may require the utility to invest in better information management systems and to improve its accounting procedures External technical
assistance may be an effective way to start the process and developing a CDP and a twinning agreement with a more experienced water utility may also be a good starting point
Implementation obstacles and solutions
Converting a water utility into a separate legal and commercial entity may imply a mayorrsquos loss of control over daily operations at the water utility Therefore there may be political resistance to this structure To provide the city administration with sufficient comfort regarding future control and supervision of the water company a well-defined PSC can be developed and signed between the water company and its municipal owner
Building necessary capacity is normally not controversial However any company restructuring aimed at improving efficiency that implies labour reforms may lead to opposition from political authorities and from the utility staff Targeted retraining and relocation of staff combined with natural attrition as a way to increase labour productivity may be needed to avoid overly severe social impact and political opposition For example in Madaba Jordan the first phase of the contract was seen as the basis for re-engineering of the business processes and entailed the implementation of the necessary systems as well as staff training106
W3 Promotion of resource-efficient utilities
Description
There is a range of solutions that utilities can explore in order to improve resource efficiency or capture the value of various by-products As a traditional approach utilities can reduce water losses or energy consumption through targeted investments and the maintenance of distribution networks and related pumping equipment To ensure well-targeted investments and timely maintenance an asset management approach may be recommended A mature asset management approach is based on having a good inventory and on planning procedures
105 See Marin et al (2017)106 See Sustainable Water Integrated Management (SWIM) Support Mechanism (2013)
Sector-based policy options
60
in which investments and maintenance works are planned in a predictable and forward-looking manner This approach requires good data collection and analysis by the utilities and a long-term commitment and budgeting from the city authorities
Water utility companies can also be encouraged to explore more innovative solutions For instance water efficiency can be pursued through better utilisation of waste streams such as treated wastewatergrey water or better harvesting of water through sustainable urban drainage solutions ndash solutions that may have to be restructured to better prepare for future risks of flooding The carbon footprint of water and wastewater services can be further reduced by including forms of energy generation as part of their operation One way to do this is to exploit the hydropower potential and install a turbine inside the water pipes transporting water down from a reservoir through gravitation Energy can also be generated through the capture of biogas at wastewater treatment plants Lastly solar and wind power solutions can be located in wastewater treatment plants in order to cover some of the energy needs of the sector
Another by-product of the wastewater treatment process is sludge Increased wastewater service provision for instance to address a sanitation shortfall or to meet higher regulations will generate more wastewater sludge The capacity of sanitary landfills to receive such sludge may be limited and the impact of the EUrsquos Landfill Directive is likely to drive further reductions in these types of outlet As a consequence alternative solutions for effective management and disposal of wastewater sludge may be increasingly important in a many cities Sludge re-use for landscaping or agriculture is one option Other options include co-composting with green waste or using sludge in combination with other waste or fuel sources for power generation
Resource implications and key requirements
Most of the energy and water efficiency solutions presented here require significant investment Therefore long and predictable contracts with clear revenue streams may be needed For example for renewable energy production to be made sufficiently
attractive any renewable energy subsidies on the energy market should be made available This may require connections to the electricity grid and bilateral power purchasing agreements may need to be negotiated and signed Consequently a water utility firm may need to develop additional capacity and procedures for arrangements in the energy market Commercial sludge management may also require predictable offtake agreements with relevant stakeholders There may also be legal limitations on where the utility firm can dispose of wastewater sludge
The Bangkok Metropolitan Administration has enacted by-laws requiring the installation of a wastewater treatment facility for new housing developments with more than 10 detached houses and for all industries and businesses Septic sludge is treated in order to be used as fertiliser in the cityrsquos public parks surrounding green areas and farmland The administration also aims to produce compost with a mix of natural rice straw and the dewatered sludge from the 12 wastewater treatment plants to be used as manure107
Potential private-sector participation
Many of the necessary investments in resource efficiency can be provided through PPP-style contracts whereby a private energy servicing company finances constructs and operates the relevant installation in return for a performance-related remuneration
In Aqaba Jordan the Aqaba Water Company has made large investments in sewers and wastewater treatment Currently 90 per cent of the cityrsquos wastewater is collected and treated with 69 per cent of wastewater reused and 100 per cent of energy recovered The capital investment is paid off by the sale of reclaimed water under a PPP contract to hotels and other commercial offtakers108
There is also an important role for the private sector as offtakers of grey water and processed wastewater sludge For example selected companies may be interested in reusing treated wastewater for industrial purposes and farmers or forestry companies may also wish to use wastewater sludge
107 See The International Water Association (2018) 108 Ibid
Sector-based policy options
61
Implementation obstacles and possible solutions
Financial risks as well as legal and environmental uncertainties may prevent the pursuit of some of the solutions outlined above To address such obstacles it may be helpful to run comprehensive stakeholder engagement sessions It may also be advisable to run adequate market testing to explore the opportunities for obtaining predictable and long-term offtake agreements with relevant stakeholders
W4 Effective tariff reforms and price signals
Description
There is a legacy of subsidised water and wastewater tariffs in the EBRD regions ndash in particular for households There is also a legacy of fixed monthly billing rather than consumption-based billing Correct price signals are necessary to promote prudent water consumption ndash and tariff reforms remain a key challenge in many of the economies where the EBRD invests
Good price signals require correct price-setting as well as good metering and billing mechanisms Price-setting should reflect all costs of extracting treating transporting and disposing of water and wastewater In water-scarce areas water tariffs should go beyond covering production and distribution costs and also reflect the foregone benefits of farmers for example whose productivity losses may be higher than the regular water tariff
In addition to an adequate price level it is also important that tariffs are set and adjusted in a predictable manner This is to make sure that related investments made by businesses and others can be undertaken without unnecessary risks of price volatility To this end the water tariffs should be developed using a formula-based methodology and approved by an independent and capable regulator In the absence of a national water regulator the city authorities can help set up or improve both the relevant methodology and a local regulatory authority
Effective metering billing and bill collection are also important to ensure true price signals for water use Therefore effective tariff reforms should include
programmes aimed at installing or upgrading individual water meters whenever this is needed
Resource implications and key requirements
Setting up the institutional capacity and operating a well-defined water tariff methodology is not too costly but it may require strong political will to introduce tariff reforms that could be unpopular What is costly however is the installation or upgrading of water meters Installation of meters in private properties may also require access to the properties and significant resources and cooperation with property owners will be needed to roll out new or improved water meters
Implementation obstacles and solutions
Increased water tariffs will generally be unpopular and often difficult for low-income households to afford The affordability problem should however be addressed through targeted support for the poor and not by providing subsidised water to the whole population Installation of meters in private properties also requires access to the properties and cooperation with the property owners To support this process a combination of information campaigns stakeholder consultation and price incentives to change metering arrangements would be recommended A gradual adjustment in tariffs over several years may also be needed to obtain acceptance among the wider population
W5 Awareness campaigns for households and industry
Description
Information campaigns at the household level can trigger behavioural changes in consumption Different types of information can be communicated to promote water-saving initiatives and activities This includes information about
bull devices for household appliances to monitor water use such as for showers or washing machines
bull technical advice that offers water-saving tips for example spending less time in the shower
Sector-based policy options
62
bull norm-based information communicating practical household experiences as before-and-after examples for instance
bull benchmarking data comparing the performance of a household against its neighbours
bull informing residents of the potential impacts of localised drought and flooding
This information can also be conveyed in different ways Whereas providing information through public advertisement campaigns is one option information can also be provided in combination with water-saving competitions or similar interactive ways of raising awareness Attitude campaigns targeting children in schools and pre-schools who then start lsquopolicingrsquo their parents have also proven to be effective
In Spain the Zaragoza Water Saving City programme ran a broad media campaign which was extended to schools Discounts were offered on water-efficient products and this initiated voluntary commitments by residents and businesses109 A ldquo50 Good Practicesrdquo guide was also developed that provided businesses with a reference model for identifying effective methods of improving water efficiency
Resource implications and key requirements
This policy option is a relatively low-cost and proactive approach compared to more reactive network investments However it requires substantial efforts to reach the majority of households in particular if children are to be convinced and there should be an administrative commitment to the policy to generate long-term behavioural changes
Potential private-sector participation
Public or private water utility firms may have an incentive to influence water consumption patterns ndash in particular when infrastructure or water sources are stressed Utility firms often provide awareness campaigns through external non-profit organisations and through school teachers when education campaigns target school children
Implementation obstacles and solutions
A lack of municipal resources or committed city officials may prevent effective attitude campaigns from taking place To overcome this problem one solution may be to team up with local NGOs and schools in order to benefit from their resources and enthusiasm to promote public awareness and attitude campaigns including for school children Another ally could be the local water utility company as it may have an incentive to influence water consumption patterns ndash in particular when infrastructure or water sources are stressed
35 Solid wasteThe environmental objective of the waste management sector is first of all to ensure pollution control preventing the diffusion of waste and pollution into soil and water as well as the emission of GHGs into the atmosphere This in turn protects and improves the environment human health nature and public spaces and further mitigates the risks of climate change Second the waste management sector also seeks to reduce landfilling while promoting value extraction and resource efficiency
Pollution control (stage 1) can be achieved by ensuring proper collection and delivery of waste to be disposed of at sanitary landfills and further by the closure and decontamination of informal and non-compliant dumpsites The reduction of landfilling and the promotion of value capture or resource efficiency can be realised by moving up the so-called waste hierarchy (see Figure 8) either through energy recovery (stage 2) recycling (3) reuse (4) or the reduction (5) of generated waste
While the objectives may be clear the waste sector is complex from a technical perspective with multiple steps and processes required to take place for different waste streams in a carefully integrated manner The sector is also complex from a policy perspective Multiple formal and informal stakeholders and multiple laws seek to regulate influence and operate within the sector Regulations include among
109 See 2030 Water Resources Group (2013)
Sector-based policy options
63
1
2
3
4
5
others the application of land air and water pollution directives as well as the obligations of national regional and municipal authorities Other factors include land planning and the obligations and rights of commercial and residential entities The sector also relies heavily on the behaviour and buy-in of the public
Poor waste management has been a widespread problem in most of the economies where the EBRD invests Substandard planning inadequate funding and limited know-how have led to poor performance and low environmental standards Not only have poor planning and inadequate funding prevented the necessary investments and services from taking place inadequate and unpredictable funding has also weakened accountability among the various operators and authorities in the sector For example an underpaid waste collection company will lsquounderstandablyrsquo cut down on the collection frequency or coverage and thus not provide the agreed service level making plans and targets less meaningful Lastly poor waste management services lead to a poor waste management culture and may hamper buy-in from residents and the relevant public and private institutions
When seeking to improve the waste management sector it is important to keep in mind that effective waste management is expensive often comprising 20-50 per cent of municipal budgets110 Overall it is not a profitable sector even after taking into account revenues from the sale of recyclables refuse-derived fuels or energy Therefore adequate funding for both investments and operations must be in place at all times while improving the performance of the sector In addition due to the complexity of the sector changes should be introduced incrementally without oversized interventions in line with the administrative capacity and with public support and willingness to contribute to an improved waste management system
To help address the pollution challenges and gradually move up the waste hierarchy requires multiple technical and policy-related solutions ndash including policies that target good planning adequate funding effective accountability and effective change in attitudes among residents businesses and public authorities Some of the main policy options or building blocks are presented below covering initiatives (i) to ensure effective governance and buy-in from various stakeholders and (ii) to move up the waste hierarchy
Ensuring effective governance and buy-in
1 Establishment of a waste management strategy action plan and administrative capacity
2 Effective price signals and funding
3 Information strategies for residents and businesses
4 Formalisation of informal services
Moving up the waste hierarchy
5 Improvement of waste collection
6 Waste sorting and treatment to encourage recycling and energy recovery
7 Promotion of sharing and reuse of products
Source EBRD
Figure 8 The waste hierarchy
110 See World Bank (2019)
Waste prevention
Preparation for reuseSt
ages
1-5
Recycling
Other recovery
Disposal
Sector-based policy options
64
SW1 Establishment of a waste management strategy action plan and administrative capacity
Description
In terms of waste management an important first step is to develop a waste strategy and an action plan at the city level If national or international (in other words EU-level) waste strategy or policy and related institutions exist this should be taken into account and strategies should be aligned In the absence of national plans and regulation local solutions can still be planned at the city level Given the complexity of the waste sector it is important that local waste strategies and action plans have holistic views in the pursuit of an integrated waste management structure covering all the technical and practical steps This includes the question of how to provide the infrastructure necessary to manage different waste streams such as mixed municipal waste recyclables hazardous waste construction and demolition waste organic waste and medical waste It further includes how to select collection or delivery solutions in terms of lsquobringrsquo systems or residential waste (kerbside) collection systems bin types volumes collection frequencies and so on If seeking to promote separation and collection of recyclables careful planning is needed to make the process as convenient as possible for residents
While a waste strategy may set up general objectives responsibilities and resource implications an action plan is more detailed and includes practical steps with details targets and timelines for the implementation of different solutions A waste plan should also clarify the capacity needed and responsibilities related to the provision of information awareness campaigns and monitoring systems Both the waste strategy and the action plan should cover all the formal processes of waste collection transportation treatment and final disposal ndash and may also include ways to better internalise the informal operators when relevant An action plan should also articulate the roles of the public sector versus any private sector investments or operations Moreover as the sector seeks to move up its waste hierarchy additional and more sophisticated efforts
need to be planned incentivised coordinated and enforced
At an early stage it is important to build adequate capacity and know-how within the city administration in order to plan operate contract and monitor waste management activities Considerable technical expertise is required to design a strategy or an action plan within the national context and based on local needs and conditions Enforcement and reporting mechanisms are also necessary to ensure continued implementation and compliance While some regulatory capacity and know-how can be provided by central authorities the local administration should be expected to plan secure financing contract supervise monitor and enforce the waste management activities in the city
Resource implications and key requirements
While the planning itself does not require significant financial or human resources it needs sufficient know-how which initially may need to come from the central government or other external knowledge providers As the planning process evolves and the implementation and the related investments and operations start the resources needed for a competent management and governance of the sector grow For example in Ljubljana in Slovenia the public waste management company Snaga Ljubljana has been working on planning and administrating the process for 10 years in order to move the sector towards EU compliance ndash in other words full collection disposal in sanitary landfills and the closure of non-compliant dumpsites111 In September 2014 Ljubljana became the first European capital to commit to becoming a zero-waste city112
Potential private-sector participation
Planning and regulation should be led by public institutions and relevant authorities However where there is a clear lack of know-how private knowledge providers may be helpful when developing strategies and action plans for a cityrsquos waste management sector To this end numerous international consultancy firms offer specialist services related to
111 See Zero Waste Europe (nd)112 See European Commission (2019)
Sector-based policy options
65
the development of waste management strategies that comply with international standards
Implementation obstacles and solutions
The implementation of an ambitious waste management strategy and action plan entails a number of challenges Significant resistance can be expected from existing and well-connected operators providing suboptimal services Informal waste management activities may lose out with political and social implications and adequate buy-in and commitment from the public may be difficult to achieve Implementation therefore requires strong political commitment and support combined with comprehensive awareness campaigns and education In addition as a city seeks to move up the waste hierarchy it requires an ever-wider spectrum of stakeholder engagement For example moving up the waste hierarchy may involve stronger commitment to waste-sorting at source by residents more standardised use of materials by producers or a sector-wide commitment to introducing nationwide deposit schemes for cans and bottles It may also require changing the awareness and behaviour of citizens and the establishment of permanent communication and education about source-separation of recyclables and various forms of waste reduction This work creates an understanding of the entire lifecycle of products as well as the feasibility of recycling and the repair of products While these steps higher up in the waste hierarchy are ambitious measures one may look at the way Tirana introduced compulsory payments for plastic bags provided by local shops Alternatively one can look at cities such as Parma in northern Italy or Ljubljana in Slovenia where significant improvements have taken place on the back of a mix of policy measures113
SW2 Effective price signals and funding
Description
Adequate pricing of waste-related activities can positively influence behaviour (in other words lead to a reduction of waste) and ensure more sustainable funding of the sector Cities have various possible
pricing mechanisms and measures at their disposal that are outlined below
Fist city authorities can introduce pricing (pay-as-you-throw) on the waste delivered by ndash or collected from ndash households businesses and industry Pay-as-you-throw schemes can be set up for businesses and households as a charge for waste bags for different waste streams However with the exception of the most law-abiding and well-monitored societies this solution can easily trigger illegal waste dumping and a fixed cost-reflective fee for municipal waste collection is normally a more feasible funding scheme
Second the city can normally set tipping fees at the landfill To help reduce landfilling and to incentivise waste sorting at source differentiated gate fees for sorted and mixed waste at the landfill can be introduced This requires weight-based tipping fees and increased control
Third cities can introduce pricing requirements and subsidies on certain products such as disposable and reusable grocery shopping bags and they can promote the introduction of deposit return schemes for products such as beverage containers In San Francisco the checkout bag ordinance that was extended to cover all retail stores in 2012 and all food establishments in 2013 has led to a 72 per cent reduction in plastic bag use since 2010114
Lastly another pricing mechanism incentivising recycling is the introduction of deposit return schemes for products such as beverage containers This can be introduced for selected outdoor bars or it can include the setting-up of machine-based schemes where individuals are rewarded for returning beverage containers for example in the case of the Veolia-linked pilot in London115 Moreover while not a direct charging mechanism cities can install and inform their residents about public drinking-water taps as a free alternative to buying new plastic water bottles
Resource implication and requirement
A pay-as-you-throw scheme requires significant administrative and operational resources as well as substantial monitoring and enforcement efforts
113 See Pietzsch et al (2017) 114 See SF Environment (2019)115 See White (2019)
Sector-based policy options
66
66
It also requires a relatively law-abiding culture ndash otherwise this approach may lead to unmanageable levels of illegal dumping
Cost-reflective tipping fees do not require excessive investments or operating costs However differentiated gate fees for different waste streams will require some additional control and penalty procedures
The introduction of payment for disposable products such as grocery plastic bags does not imply large costs for a city administration but substantial efforts linked to public communication are likely
Potential private-sector participation
Introducing payments or deposit return schemes for certain disposable products requires close cooperation with the private sector For instance in Scotland neither the Scottish government nor Zero Waste Scotland will run the scheme That is the job of the scheme administrator(s) which is expected to be an industry-led privately owned and not-for-profit private-sector enterprise Typically the administrator(s) of the scheme will be responsible for its day-to-day management In the case of Scotland the Deposit Return Scheme for bottles and cans creates new obligations for drinks producers and most of them are likely to nominate a scheme administrator to fulfil these on their behalf116 The service will be funded partly by small fees paid by producers with the size of those fees based on the number of drinks containers that producers put on the market For retailers and hospitality firms who will collect returned cans and empty bottles their main contact will be the scheme administrator For deposits that firms (the
`return points) refund the administrator will provide reimbursement and pay the handling fee
Implementation obstacles and solutions
Requesting payment and fees for something that used to be free of charge is never popular However comprehensive awareness-raising campaigns in cooperation with affected business communities and relevant NGOs can ensure acceptance and buy-in from the relevant population and businesses
SW3 Information strategies for residents and businesses
Description
Waste prevention depends on a shift in the attitudes and behaviour of residents and businesses This can be encouraged through various informational measures Drawing public attention to waste prevention is a fundamental step in nudging behavioural change towards more sustainable consumption and waste management practices Such informational strategies aim to change consumer behaviour encouraging informed decisions on reducing waste generation and improved separate collection of different waste streams This can lead to a number of benefits including reductions in GHG emissions environmental pollution and the use of materials Moreover waste prevention leads to cost reduction as collection and transport costs landfill volume and clean-up costs are all lower
In addition it is important to inform the public how the current systems work or how source-separation works and to communicate the cityrsquos plans and achievements For instance a new sanitary landfill will lead to tariff increases but only a few neighbours might see improvements ndash thus the city needs to communicate this too in order to improve acceptance of increased tariffs
A number of information strategies can be used including awareness campaigns information on waste prevention techniques training programmes for local authorities and eco-labelling Effective awareness campaigns often focus on a specific waste stream
116 See Zero Waste Scotland (2020)
Introducing payments or deposit return schemes for certain disposable products requires close cooperation with the private sector
Sector-based policy options
67
and provide easy-to-follow practical advice on waste-prevention actions Campaigns may choose to focus on visible actions such as the use of canvas bags instead of plastic bags the implementation of home composting the use of no-junk-mail stickers and the repair and recycling of clothing117 Specific methods for information dissemination include online information portals geared towards consumers online tools facilitating the calculation and tracking of data on waste and the development of waste prevention plans
Resource implications and key requirements
Education campaigns can be administratively demanding due to the need to provide information on waste prevention techniques for specific users such as households businesses and organisations In addition the campaigns demand substantial budgetary resources with leading waste authorities in Europe having invested significant resources into awareness generation of at least euro5 per resident118 For this reason it is important that the financing of campaigns is stable At the same time waste prevention also saves a city money ndash for instance if food waste is recycled instead of disposed of in a landfill ndash and awareness campaigns could therefore have a positive effect on a cityrsquos budget Campaigns can be tailor-made for specific waste streams and target groups using different media
Potential private-sector participation
Although campaigns are often conducted at the national level several cities have also been proactive in launching their own campaigns While the private sector is rarely involved it is common for awareness campaigns to be provided through external non-profit organisations and through school teachers when education campaigns target school children A specific measure for awareness-raising is the establishment of a network of waste advisers These are volunteers or employees trained in waste prevention and management who support residents in reducing and correctly separating at source the waste generated in households Leading waste organisations in Europe have put in place one waste adviser per 20000 residents
Implementation obstacles and solutions
It is important that messages are tailor-made for well-defined target audiences and delivered consistently through a range of complementary measures Other success factors include cooperation between the local authority and the stakeholders involved in providing the campaign such as waste charities school teachers and waste advisers The quality of preparation and implementation of the campaign is important and can be based on previous studies and recommendations from stakeholders Campaign continuity and well-developed materials are equally important for a successful campaign as well as recognition of the campaign at the national level119 It is also crucial to monitor the impact of particular campaigns on key performance indicators
Successful examples of campaigns in the UK targeted towards consumers include the Love Food Hate Waste campaign the Recycle Now campaign the Love Your Clothes campaign and the Real Nappies campaign Examples in other countries include campaigns for tap water instead of bottled water in Portugal and Italy and the Stop Pub campaign in France Furthermore Vienna is promoting lifestyles geared towards services and culture rather than products Successful examples of informational tools include Eunaofaccedilolixocom in Portugal which suggests waste prevention techniques for different types of household room the WRAP Waste Prevention toolkit and WasteCap a non-profit network in the USA
Comparison with other policy options
Information strategies are a necessary step towards inducing behaviour change and therefore any waste prevention policy will implicitly require information strategies Awareness campaigns must be delivered in conjunction with the right tools to support organisations in managing their waste together with an efficient separate waste-collection system and promotional measures for waste reuse and repair
117 See European Commission Directorate ndash General Environment (2012)118 See Dri et al (2018)119 See Regions4recycling (2014)
Sector-based policy options
68
SW4 Formalisation of informal waste collectors
Description
Many economies in the EBRD regions are affected by a number of financial technical and efficiency-related problems in their waste sector that have caused poor waste management practices and sometimes a lack of any formal practices This situation has led individuals groups and micro-enterprises to perform informal collection and recycling generating income through collection fees and by selling the extracted valuable materials Informal workers perform their activities under inadequate and uncontrolled conditions putting themselves at risk of occupational injury and disease120 Their work is further characterised by low entry barriers low organisation levels and irregular income
The integration of the informal sector into formal solid waste management systems can help reduce overall system costs support the local industry by providing low-cost materials and create new jobs Furthermore it can reduce negative environmental and climate impacts from solid waste management through improved resource recovery and reduced disposal Lastly it can help to generate income and improve working conditions for poor populations who often lack other economic opportunities
Recognising the role of the informal waste sector several governments have implemented various formalisation measures to address the social problems linked to the sector There are three main types of approaches to the formal and legal recognition of informal waste collectors
(i) Formalisation based on organising informal waste workers in associations and cooperatives which establish contracts or cooperation agreements for performing waste collection and recycling services The sustainability of such models can be ensured through waste policy and regulation changes proposing a combination of sources of revenue
(ii) Formalisation based on organising recyclers in community-based organisations or micro and
small enterprises These are mostly covered by waste collection fees paid by users and from selling recycled materials The role of the municipality is minor in such cases mostly supporting through awareness-raising and equipment provision
(iii) Formalisation based on integrating recyclers as workers for the formal waste management sector by recruiting them to perform collection or recycling at facilities
Several factors are critical for the successful integration of the informal sector including deploying a mix of approaches and establishing stable organisational structures Cooperatives small enterprises and networks in numerous countries show that these organisations were the first step to get informal workers out of social marginalisation improving their economic efficiency and thus their position in the economic value chain They also made partnerships with municipalities and other stakeholders possible121
Resource implications and key requirements
The integration of the informal waste sector demands substantial administrative resources to coordinate their formalisation into a formal sector or through associations and community organisations
Potential private-sector participation
Partnerships in the private sector between formal and informal actors become more and more important Many private enterprises perceive the opportunities stemming from the use of waste as a (material or energy) resource and recognise that partnerships with the informal sector can improve the value chains related to sourcing materials from waste The private sector can for instance be responsible for providing training and empowerment of waste workers as well as implementing occupational safety practices Furthermore it can also help assess and document the waste management system and expand the capital base of the sector And lastly the private sector may need to be involved to formally recruit informal waste collectors
120 See Wilson et al (2006)121 See GIZ (2012)
Sector-based policy options
69
Implementation obstacles and solutions
Not all attempts at formalisation have been successful due to the existence of barriers which have prevented the implementation of such attempts as well as a lack of understanding of these barriers and the measures that may enable formalisation122
For instance formalisation reduces waste pickersrsquo ability to enter and exit the waste management economy and research shows that waste pickers value that flexibility Hence formalisation efforts by government have often been unsuccessful exposing the limitations of the governmentrsquos ability to regulate and monitor the actions of those in the sector123 Governments should therefore seek to provide economic support through financial incentives diversification of services and appropriate payment schemes The formation of partnerships and stakeholder involvement are key and can involve the formation of cooperatives and associations Funding should also be provided for waste infrastructure to provide adequate sorting and storage spaces It is also best practice to train and empower informal workers and include them in formalised waste activities
For instance the city of Cairo pursued a policy of the privatisation of municipal solid waste collection as part of various World Bank initiatives to improve the conditions in the city However this has been seen as threatening the sustainability of garbage collectorsrsquo communities as well as new claims on and the commodification of Cairorsquos waste materials to the detriment of effective collection124
Integration of informal workers into the formal sector has been successfully used in Austria and Hungary as the preferred option Recent waste policies and legal frameworks of countries such as Brazil and Peru have included recycling associations and cooperatives in separate collection and recycling programmes Colombia has introduced a 3R (reduce reuse recycle) waste hierarchy and enabled the participation of marginalised groups in a bidding process Countries such as India and the Philippines have also recognised the need to involve informal waste collectors
SW5 Improvement of waste collection services
Description
Three components are needed to rectify a poor waste collection system (i) infrastructure or equipment (ii) good collection services and (iii) adequate contribution by waste generators ndash in other words households institutions and businesses Furthermore in the economies where the EBRD invests there is often no full lsquocollection service coverage ratersquo meaning that not all households have access to frequent waste collection services Hence typically in addition to replacing worn-out collection infrastructure cities also seek to extend collection services to the whole city
Infrastructure investments (in other words bins containers collection points vehicles and perhaps transfer stations) and related maintenance will have to be well planned and financed and cover collection systems for different waste streams For instance container-based lsquobringrsquo systems can be used for construction and demolition waste whereas residential waste (kerbside) collection systems are feasible for municipal waste with clearly defined bin types volumes collection frequencies and so on Adequate maintenance also includes cleaning repair and replacement of broken equipment for which responsibilities must be clearly defined
A good collection service implies adequate coverage of all locations and adequate frequency and capacity as well as the provision of collection services in a predictable and resource-efficient manner
Effective waste collection systems rely on sufficient contributions from households institutions businesses and industry Different waste streams must be delivered as planned placed in the right containers and bins which must be made easily available and looked after In order to ensure that residents and other stakeholders are committed and contribute to the collection process effective information and attitude campaigns may be needed Such campaigns can be pursued through a combination of different forms but one effective way is
122 See Aparcana (2017) 123 See Linder (2019) 124 See Fahmi and Sutton (2010)
Sector-based policy options
70
to educate children through schools and kindergartens who later lsquopolicersquo their parents and carers
Resource implications and key requirements
Waste collection services are costly as they imply capital costs for equipment and vehicles and significant operating costs for fuel and operating staff
The logistics and efforts needed to put in place adequate infrastructure can be substantial depending on how radical the changes to the collection system are Sometimes it can mean bins containers and new or additional collection vehicles only At other times it may also include the acquisition or construction of new collection points and transfer stations to streamline some of the processes For example Ljubljana invested euro421291 in its door-to-door system to be able to provide bins and vehicles servicing an urban population of 400000 in the municipality of Ljubljana and 10 bordering municipalities The annual running costs for the door-to-door system were estimated to be euro984 per tonne125
Potential private-sector participation
Private collection companies contracted through international competitive tenders can provide useful expertise and cost-efficient waste collection solutions Private contracts can also help introduce better contractual arrangements and help depoliticise and professionalise the collection services with clearly defined rights obligations processes performance targets and incentive-based revenues By requiring private collection companies to undertake awareness and attitude campaigns incentives are further aligned given that successful attitude campaigns and increased buy-in from inhabitants will benefit the collection company Some of the financing for vehicles and other equipment can also be provided by private collection companies although this does not bring down the overall costs for the waste collection services There may be benefits to splitting a city into more than one collection area or contract for comparative and competitive reasons Private collection contracts should cover multiple years (five or more) in order for companies to be considered creditworthy and to benefit from their awareness and attitude campaigns
Implementation obstacles and solutions
Significant resistance can be expected from existing and well-connected operators providing suboptimal collection services Informal waste collection activities may also lose out with political and social implications There may also be significant objections from residents and businesses groups that may have to change their efforts and pay a higher waste collection fee in order to make a new collection system work Therefore strong political commitment combined with comprehensive awareness campaigns education and a wide spectrum of stakeholder engagement are necessary By aligning incentives for private collection companies to also undertake awareness-raising campaigns the effort required to improve commitment and buy-in from various stakeholders will be increased
SW6 Waste sorting and treatment to encourage recycling and energy recovery
Description
Important steps to reduce landfilling include sorting and treatment of waste These are also necessary steps to capture economic value from produced waste Waste sorting is a prerequisite for specialised disposal of hazardous waste and for recycling It is also the first step of treatment processes aiming to convert waste into fuel for energy purposes
Waste can be sorted after its arrival at a landfill a transfer station or a waste treatment plant However waste sorting has proven to be most cost efficient when it is combined with pre-sorting at source by households and businesses ndash for example through kerbside collection schemes or recycling yards with multiple bins for recyclables and other waste streams such as paper glass metal garden waste food waste and residual waste However it should be noted that waste sorting aimed at promoting recycling is only economically justified when the general waste stream is sufficiently rich in recyclables As a general rule the share of recyclables in the general waste stream tends to increase in line with GDP per capita
125 See European Commission (2014)
Sector-based policy options
71
Further treatment of non-recycled waste includes the biological treatment of residual waste or anaerobic digestion of food waste Both treatment processes require large investments and aim to convert waste into refuse-derived fuel (RDF) As recyclables and RDFs are sold through pre-agreed contracts or through relevant markets it is important to secure reliable access to such markets and contracts prior to large investments in sorting and treatment solutions
Resource implications and key requirements
Separation of waste is costly Pre-sorting of waste at source implies additional costs for equipment and vehicles able to deal with pre-sorted material It also implies additional capital energy and staff costs linked to the extra mechanical or manual sorting processes As a general rule one can assume that recycling of household segregated waste is almost never a profitable activity despite the revenues from the sale of recyclables However recovering recyclables from industry and institutions is easier to operate and less costly and may generate profit for the operators
Waste treatment facilities are large investments and require predictable waste streams and offtake agreements for many years
Potential private-sector participation
Experienced private collection companies contracted through international competitive tenders can provide
useful expertise and cost-efficient waste sorting and collection solutions Private contracts can also help introduce better contractual arrangements and depoliticise and professionalise collection services with clearly defined rights obligations processes performance targets and incentive-based revenues Requiring private collection companies to undertake awareness and attitude campaigns can be a way to further align the incentives ndash as successful attitude campaigns and increased buy-in from residents and businesses benefit the collection company Some of the financing for vehicles and other equipment can also be provided by private collection firms although this will not bring down the overall costs of waste sorting and collection Private contracts for the promotion and collection of pre-sorted waste should cover multiple years (five or more) in order for companies to be considered creditworthy and to benefit from their information and attitude campaigns
The financing construction and operation of waste treatment plants have proven to be done effectively by private contractors through PPP-style arrangements However risk mitigation through long-term agreements covering waste delivery and offtake of refuse-derived fuel plays an important role
Implementation obstacles and solutions
Formalised waste separation at source may come into conflict with informal waste collection activities and may have political and social implications Waste sorting may also be met with objections from
Sector-based policy options
72
residents and businesses who may have to change their behaviour and potentially encounter higher collection fees To address this targeted awareness campaigns comprehensive stakeholder engagement and strong political commitment are necessary By incentivising private collection companies to also undertake awareness-raising campaigns one may accelerate the effort needed to improve sorting and the overall buy-in from various stakeholders
Unintended effects
Waste-to-energy solutions can come into conflict with efforts aimed at recycling or waste minimisation as large investment in waste treatment facilities requires large volumes of waste preferably with a high calorific value sometimes found in recyclables EU directives are increasingly ambitious in terms of recycling and waste minimisation and it is important that waste-to-energy solutions are aligned with these targets for all EU and EU candidate countries
SW7 Promotion of sharing and reuse of products
Description
The sharing and reuse of products can also cut down the overall use of resources as these are cost-effective ways to reduce waste generation and landfilling This approach can provide a number of benefits including reductions in environmental pollution material consumption and the need for additional landfills It can also provide employment opportunities in secondary markets and increase societal cohesion through the promotion of a sharing culture In addition to environmental benefits sharing can create a sense of community among strangers thus facilitating trust and social inclusion It can also supplement supply in periods of peak demand for instance a tourist location can benefit from a sharing platform through which multiple owners make accommodation available during peak season rather than turning to additional construction126
These approaches include both sharing among individuals and communities as well as among city
governments In the former category the sharing economy has entered nearly all urban spheres and includes solutions related to mobility and transport (for example Uber and Zipcar) spaces (for example Airbnb and WeWork) skills and talent (for example Upwork and Fiverr) financing (for example Zopa and Kickstarter) health (for example CrowdMed) utilities (for example Gridmates and Vandebron) food (for example VizEat) and learning (for example Coursera) With regard to the latter category cities can also leverage the potential of the sharing economy in municipal goods municipal spaces civic assets municipal services and the skills and talent of city residents An example related to municipal services is the Intermunicipal Collaboration Framework in Alberta Canada127
126 See World Economic Forum (2017) 127 See Government of Alberta (2020)
Sector-based policy options
73
73
Policies supporting these sharing approaches both among individuals and among city administrations include the provision of physical and IT-based infrastructure that is necessary for product sharing and for second-hand markets to take place Policies also include initiatives aimed at raising awareness and changing peoplersquos mindsets Today various city governments have institutionalised sharing practices through innovation offices (Seoul and Amsterdam) working groups (Vienna) a task force (Denver) or similar institutions dedicated to advocacy awareness and furthering the agenda of sharing in cities
Resource implications and key requirements
Reuse and sharing of products are primarily a result of market-based solutions which may need only modest provision of interventions or resources by the city authorities For example a sharing-based economy is increasingly being promoted in some areas such as through car and bike-sharing schemes on the back of increased digitalisation and the development of user-friendly apps where the private sector plays a key role Moreover it is possible to further increase the awareness and popularity of second-hand products through the involvement of NGOs community-based initiatives and the availability of infrastructure-facilitating second-hand markets
This is also a field of resource efficiency and waste minimisation and promotional measures can place a substantial administrative burden on the local administration which would need to engage with various stakeholders to coordinate promotional action Depending on the nature of the promotional strategies the measures may also necessitate significant financial and technical resources
Potential private-sector participation
As outlined above solutions related to the reuse of products are primarily driven by the private sector or charities City governments can also take on a combination of roles depending on the socioeconomic environment in the city An example is the Sharing City Seoul project which is being implemented based on cooperation between the private and public sectors steered by the Sharing Promotion Committee The initiative has certified
50 sharing projects that provide people with an alternative to owning things they rarely use and has given grants to a number of these projects
Implementation obstacles and solutions
Peoplersquos mindset may be the biggest obstacle to the development of an economy based on more sharing and reuse of products Identity is often linked to the products (for example cars) a person owns and second-hand products may be viewed as something for the poor A gradual process supported by community-based and city-supported awareness campaigns may be the most effective way forward
In Belgium Ghentrsquos Foodsavers platform operated by the city brings together food leftovers from the wholesale market and local retailers and redistributes them to food banks social restaurants and social supermarkets Another successful initiative is the Restorestje a local version of a leftover container It is distributed to restaurants for free in order to encourage them to use it Campaigns have managed to change peoplersquos behaviour and encouraged them to take their leftovers home128
In general not all aspects of sharing-economy models are positive Cities have faced challenges in creating policy and regulatory frameworks protecting consumers avoiding unfair competition modernising outdated taxation laws and assuring social equality For instance while sharing can bring social and environmental benefits sharing models can also result in excess supply One example of this is in China where companies like MoBike (bike-sharing) have created a surplus of bikes at rental stations rather than improving the use of existing assets in the belief that a large inventory will help them to dominate an extremely competitive market
It is therefore crucial for cities to establish trust and reputation in sharing platforms ensure the safety and security of data and people and be cautious about social inequalities that can potentially be caused by the sharing economy
128 See RUAF Foundation (nd)
74
75
Cross-cuttingpolicy options
41 Governance
42 Finance
04
76
Local governments often struggle to undertake environmental action due to several constraints including limited political power low levels of institutional capacity low levels of stakeholder integration low levels of multi-level government cooperation limited fiscal power poor financial management and lack of access to finance129 Cities need strong institutional environments that allow their local governments to function more efficiently flexibly and competitively to achieve an ambitious green city agenda
Local governments around the world are also increasingly responsible for providing and coordinating services across the sectors of transport energy buildings waste water and land use These require heavy infrastructure investment and may have substantial administrative and budgetary implications Local governments are also responsible for managing social sectors such as health education and public safety which have significant operating costs130 It is therefore important for local governments to explore the ways in which they can improve their governance and financial responsibility
While the policy options presented in this chapter may not target green objectives directly they are critical for enabling cities to pursue their green agendas in a sustainable and efficient manner The continuous improvement of the institutional environment of cities can make policy implementation more effective enabling the transition to prosperous cities in which sustainability is integrated into the different facets of
public- and private-sector decision-making A strong institutional environment comprises aspects such as (i) the devolution of powers to local governments (ii) sufficient multi-level government coordination (iii) capacity and expertise of all actors so they can play their roles effectively (iv) participation of relevant stakeholders including residents and representatives from various groups (women young people the elderly migrants people with disabilities and so on) (v) financial transfers from central government and (vi) accountable management and transparent use of public resources The enabling environment may be divided into two cross-cutting policy areas namely governance and finance
41 GovernanceEconomies and cities in the EBRD regions have a legacy of poor governance which was further exacerbated after the poorly planned decentralisation that followed the collapse of centrally planned regimes City governments in these regions tend to lack strong administrative authority political autonomy skills resources technologies and capacity to play an active role in city planning management and development This has led to a limited ability to coordinate public infrastructure and service provision at the local level as well as to weak procedures
Cross-cutting policy options
Strong institutional structures and reliable financial mechanisms are required for cities to pursue their green agendas effectively
129 See Sustainable Development Solutions Network (2016)130 See UN-Habitat (2009)
Cross-cutting policy options
77
a culture of insufficient observation and the criticism of city governments by the public
Local governments may explore the following selection of policy options perhaps in combination with each other as a policy mix
1 Political and fiscal decentralisation
2 Improved transparency and accountability
3 Enhanced integration across government bodies
4 Effective stakeholder participation
5 Capacity-building
These can bring a number of benefits beyond environmental improvements including better social cohesion and inclusion improved political involvement and a stronger ability to successfully change behaviours with a long-term view to generating sustainable development
G1 Political and fiscal decentralisation
Description
Empowered local governments have been shown to have a positive impact on the provision of public services and quality of life131 The major benefits of decentralised decisions include (i) a more targeted or tailored supply of public services and infrastructure in response to local demand which should lead to (ii) a more cost-efficient use of public expenditure and may (iii) increase cost-recovery funding from residents who are more willing to pay for adequate services Decentralisation can also (iv) promote accountability and reduce corruption due to proximity to the population which may be more aware of local governmentsrsquo actions than those of the central government
However if poorly implemented decentralisation may result in inefficiencies and corruption and further disillusionment with the government Therefore for the abovementioned benefits to materialise it is important that (a) decisions (and not only operational obligations) are transferred to local authorities (b) local authorities have sufficient financial and institutional capacity and procedures in place and (c) the decentralisation promotes engagement and enables people to hold institutions to account for delivering policies in a transparent way
The transfer of political or decision-making powers (point (a) above) would primarily be a central government choice The same is true for the decision to transfer parts of the central budget or collected taxes to local authorities in order to improve their fiscal capacity (point b) However ensuring adequate funding is also a task for the local authorities and so is the building of institutional capacity and procedures These enable good governance to promote the populationrsquos ability to engage with and hold institutions to account for delivering policies in a transparent way (point c) For example in terms of fundraising decentralised governments may be responsible for raising their own revenue and setting their own taxes That should further improve accountability and responsibility at a local level There is also evidence that taxes are easier to collect when people can see that they are being used for local purposes132 Beyond setting local business personal or property taxes local revenues can also come from increased fees for licences or permits or from higher tariffs for utility services These options are discussed further under the policy area for local financing (see Section F1)
Resource implications and key requirements
Key requirements for effective decentralisation include central government support and a meaningful local democracy that can inform the local decision-makers and hold them accountable for delivering policies It is also instrumental to have adequate capacity and procedures in place before any transfer of political and fiscal powers in order to minimise uncertainties and confusion during the decentralisation process Significant resources are needed to ensure adequate institutional capacity and
131 See Bilbao (2015)132 McKinsey amp Company (2013)
Cross-cutting policy options
78
procedures ndash and further resources will be needed to ensure peoplersquos engagement to further deliver results For instance in Poland the reform of public administration demanded effective legislative and operational work monitoring of the implementation evaluation of the effects of the reforms and engagement with civil society and local residents about the reform133
Implementation obstacles and solutions
A decentralisation process may meet opposition at central and local levels Central authorities may be reluctant to give away powers and may be concerned about the ability of local authorities to assume new responsibilities and powers Local authorities also may be reluctant to take on responsibilities and powers that they are not familiar with In both cases it may be argued that uncertainty and limited capacity are the key sources of the problem While limited capacity can be addressed through capacity-building programmes uncertainties for both central and local stakeholders can be mitigated by a gradual transfer of powers for example first transferring a prescribed service delivery before greater powers to define and organise service obligations and later giving extended local powers to plan invest and finance local infrastructure and related services Uncertainties can also be mitigated through a careful sequencing of capacity-building and the promotion of local stakeholdersrsquo understanding of tasks and processes before powers are decentralised Close cooperation and the transfer of skills between central and local authorities are also important to mitigate uncertainties and risks during the transfer process
Lastly while decentralisation can help strengthen accountability and improve performance and decisions by bringing government closer to people it can also present risks of corruption and poor performance Local officials may have greater vested interests based on family friendship and business ties that can influence decision-making and local institutions designed to hold local public officials to account are not always adequate
G2 Improved transparency and accountability
Description
When transparency and accountability are put at the heart of local governance systems the risk of corruption is reduced and incentives to perform well can be strengthened Central authorities can promote accountability incentives through a top-down approach However transparency and accountability should also be promoted through a bottom-up approach where residents can participate in and influence city policy design and implementation as well as hold local officials to account for their decisions and the performance of local institutions
Transparency can be promoted through mutually reinforcing strategies that include (i) ensuring access to information (ii) enhancing ethics professionalism and integrity and (iii) conducting regular assessment and monitoring
A well-organised record management system that contains accurate and easily accessible information about municipal rules decisions plans public spending and financial management can be developed and it is advisable to disclose documents of general interest through user-friendly reports and online presentations Information should cover rules and procedures related to the hiring and administration of staff calls for tenders procurement and monitoring of contract execution Further information relates to how the law requires that local governments be subject to regular and independent financial and organisational audits within a specific timeframe E-government is a commonly used tool for local governments to disseminate information and interact with their citizens
Moreover the transparency of a local government is contingent on the strength of its legal infrastructure which regulates the behaviour of city officials and promotes ethics and integrity Such legal infrastructure may include laws on conflict of interest on disclosure of income and assets and on whistleblower protection and transparent procurement In addition to legal measures a municipal code of ethics could be established thoroughly communicated with city
133 See Kulesza (nd)
Cross-cutting policy options
79
officials and effectively implemented Municipalities should also consider designating an independent agency that has the authority to interpret and enforce the code
As for assessment and monitoring the key objective is to inform the public about the activities and performance of the local government and its departments In order to incentivise good performance the government should conduct annual public reporting about municipal services These services should be measured against agreed targets and against the performance levels of previous years Other useful tools for assessment and monitoring include the Municipal Checklist the Urban Corruption Survey and Report Cards developed jointly by Transparency International and UN-Habitat134
In order to further bolster accountability well-resourced institutions designed to ensure adequate structures for checks and balances should be promoted and civic oversight and control should be encouraged One way to promote better accountability within municipal operations is to transform municipal services such as water supply district heating or public transport into separate legal and commercial companies Such public companies can then be further governed by a well-defined public service contract to be signed between the municipality and the municipal company A public service contract refers here to a contract that sets out rights and obligations for both parties including performance targets planning processes and procedures for approval of revenues and tariff adjustments It also sets out the role of the municipality and limits on its ability to interfere in operational decisions The objective of such contracts is to ensure transparency predictability and accountability for both sides
Another institutional innovation to improve accountability is the complaints and ombudsmanrsquos office which allows people to address their grievances and complaints about government bureaucracies This option is additional to existing channels such as the judiciary or internal complaints procedures The ombudsman is an independent organisation that receives and investigates allegations of maladministration The office of the Northern Ireland
Ombudsman for example deals with complaints from people who claim injustice due to maladministration The Ombudsman is entirely independent of the Northern Ireland Assembly and the Northern Ireland Executive All complaints are treated in confidence and the services are provided to citizens free of charge
Resource implications and key requirements
The improvement of transparency and accountability requires substantial administrative capacity as well as some financial and technical resources However it also enables cities to make efficiency gains once processes are in place For example Vienna introduced an information management system as part of the initiative Smart City Wien that was also used for effective public disclosure of performance monitoring The success of the programme was facilitated by its integration within the cityrsquos overall planning framework and by giving the entire municipal authority access to the system135 For tools like e-Government to have a meaningful impact computer literacy should be reasonably widespread and access to the internet for local residents must be ensured
Implementation obstacles and solutions
People and institutions may oppose significant transparency as it is more comfortable to not be held to account The publicised data may also be perceived as unreliable which again may hamper the benefits of a transparency initiative Part of the problem is
134 See Transparency International and UN-Habitat (2004)135 See Department MA 18 ndash Urban Development and Planning (2018)
Cross-cutting policy options
80
connected to trust This relates both to trust among the data providers that accurate reporting will not lead to harsh penalties or public outcry and no reward and trust among the data consumers that the reported information is correct or intended to be correct
In such cases it may be necessary to introduce transparent reporting gradually One example of this is the water sector in a country in south-eastern Europe Here the central government initiated compulsory performance reporting and benchmarking for the water utilities This initiative failed as the water utilities misreported performance levels in fear of being penalised for any reported underperformance Following this failure a voluntary performance benchmarking initiative was initiated among the leading water utility firms Performance data was collected and shared during workshops but the identity of the utilities reporting their performance levels was hidden behind a number (for example utility number 1 number 2 number 3) Following some successful workshops the firms no longer saw the need to hide their identities and were happy to replace the numbers with the real utility names Later fear of the central government and the sector regulator also vanished and these institutions were invited to participate in performance benchmarking workshops and to see the accurately reported data that the central government had not been able to obtain in the first attempt
G3 Enhanced integration across government bodies
Description
The enabling environment for city governments is influenced by multiple levels of governance Integration in government refers to the coordination between multiple departments or public-sector organisations in providing a public service or programme Such integration is essential to develop a shared long-term vision for economic development across government bodies and sectors and to ensure effective delivery of public services Collaboration has a number of benefits including the provision of more comprehensive services at the local level promotion
of joint cultural and economic development strengthened relationships between local and national governments improved local governance through modelling and information exchange opportunities for integrated planning increased access to a skills knowledge and services better use of available technology and better use of capital and other assets136
An integrated approach to urban planning emphasises the social economic and environmental dimensions of sustainable development by
(i) aligning vertical development priorities across different levels of government
(ii) encouraging horizontal coordination between departments and public-sector institutions
(iii) promoting intermunicipal or territorial coordination
Working in partnership with higher levels of government is required to improve the governance of local governments Vertical coordination across different levels of government may be achieved through representative institutions at the central government level working with local governments to offer capacity development and cooperation Special purpose vehicles ndash partnerships formed for joint project planning and implementation ndash can also be used In addition central governments may provide vertical funds which are funds earmarked for programmatic planning For example in France the Agence de lrsquoEnvironnement et de la Maicirctrise de lrsquoEnergie an inter-ministerial agency focused on environmental and energy research and policy has developed a funding programme to assist municipal areas with the development of a Bilan Carbone emissions inventory137
Horizontal and cross-sectoral coordination between departments and public-sector institutions is a necessary approach to dealing with public problems effectively138 This may be achieved through informal cooperation or local government directives Cross-sectoral departments such as planning and statistics departments can be allocated the responsibility of facilitating multi-sectoral cooperation Lastly shared
136 See Institute of Public Administration (2012) 137 See Corfee-Morlot et al (2009)138 See Howell (2012)
Cross-cutting policy options
81
digital platforms such as GIS-based platforms should be made accessible to all departments to foster a culture of open data and information sharing
Intermunicipal or territorial coordination can be facilitated through intermunicipal agencies that provide coordination among municipal organisations often called strategic alliances Sectoral governance boards support service delivery across municipal borders to ensure fair cost distribution and service efficiencies The benefit of this approach is that it achieves the advantages of amalgamation such as economies of scale streamlined business processes and improved service delivery while preserving local democracy An example of such coordinating bodies can be found in the Romanian water sector where regional water utilities servicing several municipalities are governed by inter-community development associations representing all the relevant municipalities
Resource implications and key requirements
Integration among government bodies demands a certain level of administrative human and IT-related resources Technical resources may be necessary when a government body needs to integrate functions or processes that they did not previously use Integration necessitates limited financial resources although this depends on the specific integration package It also provides opportunities for cost-sharing among administrations For example Alba Iulia a city of 74000 people in Romania introduced a pilot smart city project in 2018 developed jointly with the national government and more than 20 private companies The open data platform under construction will provide useful data to aid decision-making and foster evidence-based analysis139
Implementation obstacles and solutions
A major barrier to government integration is the tendency to think in a lsquosilorsquo approach which is difficult to break out of140 There are several other barriers to cooperation such as an emphasis on the status quo processes that bring everyone together
but reinforce silos processes that set similar goals and use the same data and decision-making driven by quests for funding141
The success of integration depends on high levels of commitment and resource-sharing Successful cooperation strategies need to be based on an understanding of the collaboration cycle strong leadership capacities an understanding of the balances between risks and rewards a culture of innovation and an emphasis on the desired outcomes and impacts142 Collaborating parties should take a design approach to cross-sector collaboration and should adopt flexible structures143
It is important to start change management efforts early in the process of planning and implementation To this end during the planning stage it is advisable to develop a thorough plan for change management Lastly a phased approach to government integration can be more manageable than a direct cutover approach
A practical form of integrated governance framework is illustrated by the Urban Nexus a concept developed by ICLEI - Local Governments for Sustainability (ICLEI) in cooperation with Deutsche Gesellschaft fuumlr Internationale Zusammenarbeit (GIZ) At a variety of scales this framework integrates services across systems sectors social relations and behaviours For example the city of Hanover in Germany used the framework to guide the integrated planning and construction process of the environmentally friendly district Kronsberg improving the provision of affordable housing and social cohesion in the metropolitan area144
G4 Effective stakeholder participation
Description
Effective stakeholder participation should be an underlying principle for most municipal activities It can enable different forms of collaborative governance and help improve decision-making implementation
139 See Sustainable Cities (2018) 140 See OECD (nda) 141 See Norris-Tirrell and Clay (2010) 142 See Institute of Public Administration (2012) 143 See Bryson et al (2015)144 See ICLEI and GIZ (2014)
Cross-cutting policy options
82
and monitoring at the local level It can cover a wide range of activities and may involve governmental bodies the private sector residents interest groups NGOs and more
For instance at an early phase of a potential investment project residents and other interested groups can help inform the city about their needs and concerns even before concrete proposals have been developed Stakeholders can at a later stage respond to ideas or discuss solutions proposed by the municipality by developers or by other organisations such as industries or NGOs A city administration can also invite its population to provide their own suggestions in response to certain challenges or development goals for example through the co-design of public spaces (see policy option L4) Effective monitoring of municipal services and assets can be undertaken by city residents or NGOs for example by online reporting on the quality of their local road network Residents and NGOs can also play an important role as volunteers or implementing agencies for attitude campaigns for example by informing school children about the benefits of recycling and waste separation
A transparent integrated and inclusive process to engage a wide range of stakeholders helps align different perspectives altering traditional political dynamics145 It helps strengthen relationships and
increases the sense of ownership of city strategies and plans among residents It can also improve the quality acceptance and effectiveness of project implementation and produce better social cohesion and urban planning outcomes146 It is thus important to engage a wide range of stakeholders and particularly groups that are less likely to be able to participate in standard engagement activities such as women young people the elderly ethnic minorities migrants disabled people LGBTQ+ people and so on Cities should ensure the participation of these groups in discussions
Resource implications and key requirements
Improving the participation and inclusion of stakeholders demands substantial administrative capacities and may necessitate technical capacity-building in public stakeholder engagement Success factors related to stakeholder participation include a stakeholder engagement strategy for policymaking which understands the needs priorities and interests and seeks participation from key stakeholders Cities also need to develop effective communication keeping stakeholders informed and motivated to participate
Monitoring of the number of stakeholders involved in decision-making activities and the presence of mechanisms that encourage community engagement also support effective stakeholder participation processes Collaborative governance is therefore closely linked to the development of open governance systems open platform databases and shared information systems government resource-sharing research and development activities and innovation and technology transfer
As part of a national road connectivity initiative the city of Tirana in Albania introduced an online app for reporting sections of road that need repair and also offered public information on the time it takes to address the reported need for repair147 The setting-up and operation of this system had cost implications but in return the city achieved road surveillance for lsquofreersquo
145 See UCLG and World Bank (2009) 146 See Global Platform for Sustainable Cities and World Bank (2018) 147 See World Bank (2018)
Cross-cutting policy options
83
Cluj-Napoca in Romania initiated the Innovation and Civic Imagination Centre to support the co-design and co-creation of urban solutions within the local community In 2019 two major debates were held one in support of a master plan for a large-scale development area while the other focused on EU cohesion policy The organisation of meetings and workshops that take place at the centre costs the municipal budget euro10000-euro15000 per month148
Implementation obstacles and solutions
Active public participation may require a certain culture and an active civil society that may not be present in many cities in the EBRD regions This form of democratic development can be fostered however through the education system and also by introducing feedback loops that do not require the capacity of effective civil society units Tiranarsquos online app for reporting road defects is an example of a user-friendly feedback system
Several cities have incorporated civil society into their urban planning and implementation process Cities including Surabaya (Indonesia) and Ghent (Belgium) have seen improved outcomes Ouagadougou (Burkina Faso) and Douala (Cameroon) also represent impressive examples of cities that have improved development initiatives through an inclusive and participatory approach Ongoing advocacy and open dialogues were key to encouraging citizens to engage in a city strategy Consensus and cooperation in establishing and acting on the strategy contributed to institutional confidence and unlocked financial opportunities149
Satildeo Paulo (Brazil) has made a considerable effort to include residents in the development of the municipalityrsquos Open Government Partnership local action plan Satildeo Paulo has also made efforts to encourage large-scale public participation in the development of a new master plan for the city with more than 25000 people attending 114 public hearings Between these hearings and the cityrsquos online crowdsourcing platform Satildeo Paulorsquos inhabitants have contributed over 10000 ideas
to improve the city and therefore the environment around them150
G5 Capacity-building
Description
Capacity-building is the process through which individuals and organisations can obtain strengthen and maintain the capabilities to set and achieve their goals151 Capacity-building is important for local governments as they adopt increasingly sophisticated policies management practices and an integrated planning culture
There are three broad types of capability that should be recognised (i) institutional or organisational capacity refers to the policies structures process rules and procedures that allow local governments to operate and provide leadership in their jurisdiction (ii) human capacity refers to the experience tools and knowledge mastered by the employees of local governments which enable them to identify analyse and respond to peoplersquos needs ensure their implementation and assess their impact and (iii) societal capacity refers to the empowerment of the community NGOs and city residents including those that face disproportionate barriers to economic opportunities to inform and hold local governments and administrations accountable for the services they offer and the good management of the community
Human capacity-building focuses on strengthening different types of abilities and skills within local governance Organisational skills are associated with efficiency in programme and project management tax collection and procurement processes and municipal finance management Technical skills target particular areas of expertise in specific sectors such as urban planning water and sanitation engineering waste management and transport engineering Behavioural skills have to do with cultural shifts and changes in attitude among all stakeholders including residents such as for encouraging multi-level cooperation or waste prevention152 Incorporating digital technologies
148 See Euro Cities (2019) 149 See UN-Habitat (2009)150 See WRI (2016)151 See UNDP (2009) 152 See Sustainable Development Solutions Network (2016)
Cross-cutting policy options
84
can further ease administrative burdens promote greater cooperation between stakeholders and allow for more oversight and transparency in operations
A number of potential activities are aimed at promoting well-targeted capacity-building within a public administration Initial diagnostics should help identify relevant shortcomings in capacity Legal stipulations can require capacity-development plans andor budget allocations for all implementation programmes Regular staff-training programmes or requirements for continued learning can be put in place among public-sector employees Project partnerships with higher levels of government public or private organisations academic institutions and civil society groups can also involve capacity-building Moreover external expert consultants from private organisations or academic institutions with sectoral or technical expertise can provide skills that are required for a specified period of time as opposed to training internal staff
Resource implications and key requirements
Capacity-building demands substantial administrative budgetary and technical resources It is a long-term process and should be represented in annual budgets and administrative commitments
Implementation obstacles and solutions
Budget constraints may be a key implementation obstacle but clearly defined needs and plans with well-defined objectives and performance indicators may help mobilise funding and support from central governments international networks or organisations or NGOs
Learning from the experiences and outcomes of initiatives by other cities or local governments for example by joining coalitions of cities is another way to build capacity A successful example of cooperation among municipalities and regions is the Network of Towns and Cities towards Sustainability created in 1997 by the Barcelona Provincial Council It allows municipalities to exchange knowledge and pool resources A particular success has been the working group on the Covenant of Mayors which along with other support from the Barcelona Provincial Council
has meant that most municipalities have now drawn up local-level sustainable energy action plans153
42 FinanceCity governments must harness their financial reserves effectively to deliver the necessary services and infrastructure that meet the needs of their residents The ability to collect manage and invest these resources through appropriate financial mechanisms determines a cityrsquos fiscal sustainability Examples of unsustainable approaches include high levels of debt or other liabilities which can divert funds from policy investments or corruption and mismanagement of funds The following policy options or policy objectives are discussed below
1 Improved revenue and financial autonomy
2 Improved accountability and transparency
3 Improved creditworthiness
4 Financial incentives or financial support schemes for green investments
This section explores the policies or approaches that city governments can take to address these points and strengthen their financial credentials so that they can finance the necessary projects to become a green and sustainable city
F1 Improved revenue and financial autonomy
Description
It is generally desirable for local governments to have the opportunity to raise their own revenue and set their own taxes This is also a good way of achieving accountability and responsibility at a local level
153 See European Union (2017)
Cross-cutting policy options
85
In addition there is evidence suggesting that taxes are easier to collect when people can see that they are being used for local purposes To ensure a degree of political and financial autonomy it is important that local revenues go beyond the bare minimum needed to cover the municipalityrsquos allocated service obligations so that surplus funds can be used to finance investments or services at the discretion of the city administration If a city relies too heavily on the national government the city may be restricted in the way it spends funding the extent of the spending and the time it takes to use it This in turn will affect the delivery of policies and programmes Fundraising instruments or mechanisms that ensure adequate local revenues include (i) taxes and transfers (ii) administrative or commercial fees and (iii) land-value capture
Taxes and transfers The opportunity to raise or receive tax revenues depends on the fiscal decentralisation in the country and primarily falls outside of the control of the local government Such tax revenues are typically linked to local property sales and business taxes or local personal taxes It also includes ldquosharingrdquo taxes between the nation and the region in the form of budgetary transfers from the national budget to local administrations
Local administrative or commercial revenues This represents funding that local authorities can influence to a larger degree regardless of the countryrsquos fiscal decentralisation This normally happens through the way fees are set and the rigour with which they are collected Administrative fees could include building permits or licensing for a wide range of activities such as operating certain business premises or motor vehicles Municipal commercial revenues may include fees or tariffs for municipal services such as water waste heating and parking services or revenues from the letting out or sale of public land and public real-estate to private entities Cost-reflective and consumption-based heat and water bills not only provide sustainable funding for the sector but also promote resource efficiency Therefore it may be recommended to move utility services towards proper metering and fully cost-reflective tariffs while providing targeted support for low-income households (see policy option E4)
Local administrative and commercial revenues account for just over one-fifth of revenues in Sofia Bulgaria with 16 per cent of the annual budget in 2018 coming from municipal fees and 6 per cent from fines and penalties income from asset ownership and sale of non-financial assets Other key sources of revenue include 20 per cent in property and other taxes 28 per cent in intergovernmental transfers and 21 per cent in EU funding154
Land-value capture There is a strong link between public investments for example in transport and economic growth and property values with new transport services such as train and metro stations typically increasing the accessibility attractiveness and value of their surrounding areas The benefits of public investment can therefore often be substantially captured by private individuals as an unearned windfall gain This problem in combination with public funding constraints has led to the development of a variety of lsquoland-value capturersquo mechanisms in order to transfer some private financial benefits back to the public sector These mechanisms may include
1 Direct development The city transport authority makes direct purchases of land surrounding planned new transit stations and develops the land directly or in partnership with the private sector making commercial returns through subsequent sale or lease (shops commercial units flats and so on) Examples include Network Rail station development programmes such as Londonrsquos Kings Cross St Pancras or the Hong Kong Metro This approach involves little complexity ndash it can be implemented by the city or transport authority directly ndash and is less controversial than some other mechanisms that may require imposing taxes on developers and existing businesses and residents However it may require significant upfront investment and financial risk for the city
2 Negotiated payments from developers The city authority secures payments from local developers to fund infrastructure improvements associated with specific large developments for example the agreement between London and the Battersea Power Station developers to partly fund the Northern Line extension This approach also involves little complexity ndash it can be
154 See Sofia Municipality (2018)
Cross-cutting policy options
86
implemented through direct negotiation between the city or transport authority and developers seeking planning consent
3 Zonal or city-wide tax increment A zonal tax increment is a tax uplift or levy imposed by the transport authority and local government on commercial andor residential properties set to benefit within a specified area around the site to capture part of the windfall gains accruing to property owners This increment could be applied to various taxes for example business rates council tax or stamp duty This approach is more complex as it is likely to require legal or tax reform and central political support for the increases in tax Focusing on areas of benefit may reduce objections ndash but requires difficult decisions over boundaries A city-wide tax increment avoids the boundary question and has the potential to raise very large sums to support strategic infrastructure investment but may not provide sufficient targeting of areas that gain the most benefit (see for example the Community Infrastructure Levy for Crossrail in London)
Resource implications and key requirements
Setting and raising local tax revenues whether as part of general taxes or as a form of land-value capture requires adequate fiscal decentralisation and sufficient administrative capacity This requires time and the development of significant resources Increasing and collecting administrative fees for permits or end-user tariffs for utility services is less complex but requires political will and enforcement capacity
Implementation obstacles and solutions
Fiscal decentralisation may be hampered by a lack of local administrative capacity and processes Therefore ensuring adequate local capacity and procedures is often an important first step While fiscal decentralisation may take a long time to implement local authorities can improve their financial position by raising funds through increased fees and commercial revenues This also gives the local authorities the opportunity to experience and demonstrate their capacity to plan budget and operate municipal infrastructure and can subsequently help increase confidence among local and central authorities that further fiscal decentralisation is feasible
F2 Improved financial accountability and transparency
Description
The financial management of a municipality should ensure accountability and transparency This can improve the confidence of and support from central governments the international community civil society and local and international businesses ndash which in turn can lead to greater receipt of public and private funds Accurate financial management can also enable better insight into which groups benefit most from the municipal budget including various marginalised groups Strong fiscal accountability and transparency are also likely to reduce or prevent corruption thus leading to more efficient spending of public resources Robust public financial management can also improve a cityrsquos creditworthiness and enable better access to commercial debt and capital markets Municipalities can take several steps to enhance their financial accountability and transparency including (i) ensuring that they apply accrual accounting in order to provide an accurate financial picture which is then used to make fiscal and budgetary decisions (ii) ensuring that well-defined systems are in place with clearly defined auditing and control functions (iii) publishing municipal financial statements regularly and (iv) using any financial information combined with data analytics to identify inefficiencies mismanagement or fraudulent behaviour
Resource implications and key requirements
Accrual accounting goes beyond reporting on cash coming in and going out It also looks at assets and liabilities to provide a more complete and accurate picture of the financial position of a municipality Preparation of accrual accounting requires the identification and valuing of all municipal assets and liabilities Such inventory requires significant resources In addition substantial resources and time
ldquoStrong fiscal accountability and transparency are also likely to reduce or prevent corruption thus leading to more efficient spending of public resourcesrdquo
Cross-cutting policy options
87
are needed for the development of the necessary IT systems for accounting purposes data analytics and information management For example over the course of five years together with the World Bank Rijeka in Croatia planned and transformed its financial management and accounting system to one based on transparent accrual accounting and improved accountability155
Implementation obstacles and solutions
Lack of local technical administrative or financial capacity may prevent necessary improvements to municipal financial management There may also be vested interests that do not want increased transparency These obstacles or challenges may be addressed through adequate capacity-building programmes and well-defined action plans aimed at improving governance structures with clearly defined auditing and control functions
Belize has identified a need to address fiscal accountability as one factor that could contribute to improvements in municipal management Despite beginning the process of decentralisation in the 1990s there has since been little impact as local authorities do not have the technical administrative or financial capacity to manage funds and powers effectively The World Bank worked alongside the Belize government to leverage grant resources from the Public-Private Infrastructure Advisory Facility (PPIAF) to support capacity-building around fiscal management Key activities included conducting a diagnosis of fiscal conditions training practitioners in financial management revenue collection use of financial management software and designing a new accounting approach that included balance sheets156
This case of Belize demonstrates the absence of basic accounting procedures in many countries and cities and the importance of supporting policies for example information and capacity-building (see policy option G5) to support improvements in fiscal accountability
In Cape Town South Africa despite significant efforts to decentralise powers to local authorities poor sector budgeting is significantly limiting urban development decisions Current reporting of spending
is ineffective (often done in a highly technical manner) resident participation occurs after decision-making and there is no clear public framework that outlines the process of spending decisions This in turn leads to a lack of trust in the local authority and further lowers public participation To address this the Development Action Group convened a number of civic organisations to discuss a range of issues but all were centred on the absence of accountability From this measure two civic coalitions were created These held workshops and developed resolutions to improve accountability while encouraging greater civic participation via their web-based platform This case in Cape Town demonstrates the importance of stakeholder engagement as well as the value of providing a platform for local people to query and challenge public fiscal spending as well as bridging key knowledge gaps157
F3 Improved creditworthiness
Description
Creditworthiness is essentially an opinion by third parties mainly lenders on whether debt service payments will be made fully and on time A lender that has confidence in the long-term financial strength of the borrower and in the ability and willingness of the municipality to pay its obligations in full and on time will regard that municipality as creditworthy
In order to attract private financing cities must demonstrate that they are a viable investment proposal that they are able to effectively manage their own finances and are transparent in this process Improving the creditworthiness or the credit rating of a city is a gradual process partly limited by factors external to the city such as the wealth and credit rating of the national authorities However there are measures a city can take to strengthen its creditworthiness
155 See World Bank Institute (2013) 156 World Bank (2017) 157 See Kumar and Fester (2019)
Cross-cutting policy options
88
A city seeking to improve its creditworthiness should focus on improving conditions in the following five broad categories
bull economic conditions for example municipal income levels and economic diversification
bull financial management including transparency administrative capacity professional management of debt and liquidity
bull budgetary performance or operating balance
bull budgetary flexibility for example own-source revenues
bull current level of debt debt servicing requirements and other liabilities
While some of these dimensions are difficult to change in the short term a city may develop a creditworthiness action plan as a start This allows the city to set a current baseline and realistic ambitions and aims as well as identify problematic and priority areas that need to be addressed Key areas may include managing expenditure developing a pipeline of public infrastructure projects to be funded and undertaking its own lsquoshadowrsquo credit rating assessment
An official municipal credit rating issued by a well-recognised rating agency has several benefits Beyond improving access to private financing it represents and guides a process aimed at improving the financial management of a municipality This also provides valuable information to the benefit of central authorities and potential donors It also further enhances the accountability of the city management as it clearly shows the financial rigour of the municipality
Resource implications and key requirements
A creditworthiness enhancement programme is not difficult to develop but is challenging to implement It is also important to remember that improving the creditworthiness or the credit rating of a city is a gradual process For example Zaprešić in Croatia
has worked to improve its creditworthiness since the establishment of a local treasury system in 2012 The city was assessed in 2016 as having a low credit risk with a high level of budget liquidity and has been placed in the top 5 per cent of exceptionally transparent local budgets in Croatia158 159
In Uganda Kampalarsquos improvements in municipal revenue can be attributed to the work undertaken by local authorities since 2012 to improve its creditworthiness delivered through a city-wide strategic plan Despite the citys growing economy Kampala has faced significant financial problems including poor revenue collection weak governance and reliance on government transfers This limited the cityrsquos ability to invest in improving its local services and implementing infrastructure projects In light of this situation a strategic plan was developed to strengthen the governance and service delivery The plan identified key areas to target including human resource development better record management and stronger monitoring processes
To improve its administrative capacity the city received assistance from the World Bank and PPIAF enabling the Kampala authorities to develop more robust accounting approaches The plan was extremely successful and in one year Kampala managed to increase its revenues by 86 per cent However as identified creditworthiness is a continuum this requires continuous effort and commitment to financial management
Implementation obstacles and solutions
Pursuing a credit rating can be an administratively and technically challenging task as it requires addressing any gaps or weaknesses in financial management Cities can seek support from the national level or through the capacity-building programmes of international organisations for example the C40 Cities Finance Facility Incorporating a resourcing timeline into a creditworthiness action plan allows cities to effectively manage their staff and budgets for this process
External factors may include an unstable wider economy and as the national assessment forms an
158 See World Bank Group and Government of Austria (2018)159 See City of Zaprešić Finance and Budgeting Department (nd)
Cross-cutting policy options
89
89
element of a credit rating this may impact a cityrsquos ability to obtain private finance Improving these external factors can be beyond the remit of a city However active stakeholder engagement with the national government and other surrounding cities or municipalities can enable the sharing of best practice and improvement of wider conditions
F4 Financial incentives or financial support schemes for green investments
Description
Local governments can help provide financial incentives and funding in support of green investments Such support schemes can include targeted subsidy schemes like the Seoul solar panel programme It can further include the setting-up of municipally owned or funded green banks or the setting-up of investment funds (for example the Melbourne green investment fund) that can provide green loans or dedicated risk-sharing facilities for private banks Local authorities may also work with local banks in order to facilitate green lending solutions with little or no financial contribution from the city
One example is Frederikshavn Denmark which developed specific soft loans for the energy renovation of housing to meet its climate change targets A new product was developed by the municipality in agreement with local banks featuring lower interest rates and a longer maturity period relative to typical market conditions The municipality does not allocate any funds to the financing scheme Instead soft loans are provided by the partner banks that bear all the risk They run a creditworthiness check of homeowners to decide who gets a loan and under what conditions
Resource implications and key requirements
Providing financial incentives will require budgetary commitments and may be administratively demanding for the local government Significant technical capacity will also be required to identify how to configure and apply incentives Incentives can target lower income brackets of the population to address
social equity concerns associated with energy poverty Both the central and local policy frameworks need to accommodate the setting-up of incentive and funding schemes by local authorities
Potential private-sector participation
Local governments can work with commercial banks to provide financial incentives therefore sharing or shifting the financial burden from the public to the private sector
Implementation obstacles and solutions
The provision of direct financial support is financially demanding for local governments and can target fuel-poor homes It is good practice to undertake a comprehensive cost and benefit analysis of retrofitting to zero carbon for all households that are in fuel poverty and provide targeted funding for these homes160 One of the first programmes to tackle energy poverty was the Warm Front programme in the United Kingdom A total of 23 million households received assistance from the scheme Grants were offered for improvements such as loft insulation cavity wall insulation and heating system improvements161
The success factors associated with energy efficiency measures include gaining and maintaining consumer trust an effective communication and marketing strategy training and qualification schemes to ensure that worker qualifications keep pace with the technical complexity of buildings and the targeting of trigger points such as household renovations or sales162
The provision of financial incentives and favourable financing should only come after energy efficiency building codes have been enacted and adequate enforcement and compliance mechanisms are in place for building construction and retrofits
160 See National Assembly for Wales (2018) 161 See UK Parliament (2013)162 See Committee on Climate Change (2016)
Case studies - mobility and transport
90
Case studies - mobility and transport
91
05
Case studies
Case studies - mobility and transport
92
Integrated urban mobility Burgas Bulgaria
Burgas has sought to reverse a legacy of car-centric urban transport through a cohesive policy on mobility A rapid transit bus system integrated transport management greater accessibility and lower costs for using public transport are among the measures introduced
Snapshot
bull Location Burgas Bulgaria
bull Population Small ndash 202000 (2017)
bull Policy area Transport
bull Policy options Parking pricing restrictions information and enforcement pedestrian-oriented and car-restrictive policies pro-cycling policies planning and regulation of public transport services
bull Financial capacity Limited
bull Administrative capacity Strengthening
Context and policy overviewBurgas is easily accessible by car and connected by two highways to other cities Consequently private vehicles are the most popular form of transport in 2016 58 per cent of city residents used a personal
car and 37 per cent used public transport)163 However the municipality of Burgas recognised the adverse environmental and social impacts of this system and introduced policies to address them including a Sustainable Urban Mobility Plan (SUMP) for the period 2014-20 The city engaged stakeholders to contribute to the SUMP and considered three scenarios The chosen approach called for the city to (i) develop a dense network of high-speed bus lanes (ii) increase the use of public transport and (iii) boost the number of bicycle parking areas and lanes164
ImplementationThe municipality introduced a number of measures under its Integrated Urban Transport Project In 2015 the city began implementing a project to create an intelligent transport system that would improve the safety efficiency and convenience of the public transport network The plan included integrated ticketing and video surveillance of the network165
First in 2018 commuters obtained real-time access to information on buses and trolley buses
163 See ICLEI ndash Local Governments for Sustainability (2016)164 See Stoyanova (2014)165 See ICLEI ndash Local Governments for Sustainability (2016)
Case studies - mobility and transport
93
166 See Go to Burgas (2020)167 See EcoMobility SHIFT (nd)168 Ibid 169 Ibid 170 See EcoMobility SHIFT (nd)171 Ibid 172 See ICLEI ndash Local Governments for Sustainability (2016)173 See Braun (2017)
The electronic boards at bus stops were also made more informative
Second the city rolled out modern buses and smart intersections This included the introduction of 60 new buses running on compressed natural gas (CNG) and diesel to operate over the improved transport infrastructure The new vehicles replaced the cityrsquos oldest buses greatly improving the service and its reliability with reduced emissions and maintenance costs and more attractive public transport166
Third Burgas introduced paid parking charges in central areas of the city It also restricted the access of cars to the main administrative area and market converting those parts of the city to a pedestrianised zone A ldquoring and riderdquo service was provided for disabled individuals and for children167
Lastly the city constructed a complete cycling network adding 20 km to the scheme already in place and introduced a public bike-sharing scheme
To enable the implementation of these measures Burgas has sought to increase its administrative capacity including systematic policy planning targeted funding and the participation of residents The city set aside euro60 million from its municipal budget to implement the programme and obtained funding from international bodies such as the EBRD In addition the local public transport company has its own budget and receives contributions from the national government168
Public transport is free for certain groups (for instance individuals over 65 children people with disabilities) This measure cost the city euro2 million in 2012 and therefore it was imperative to obtain funding from other sources169
Results and lessons learnedThe Integrated Urban Transport Project achieved the following outcomes
bull The ring-and-ride support scheme was used more than 20000 times in its first year170
bull The ike-sharing scheme has had more than 5000 subscription contracts with daily users171
bull The city has seem reductions in air pollution and GHG emissions related to the modal shift in the transport sector
Despite these success stories Burgas remains a predominantly car-centric city In 2016 more than half of all journeys were made in private vehicles while cycling represented just 3 per cent of the modal share172 In order to foster a local cycling culture Burgas is planning campaigns including the Bike2Work scheme173
Links to similar initiativesFreiburg integrated mobility policies Lund eco-mobility policies Strasbourg integrated multi-modal transport
Case studies - mobility and transport
94
Snapshot
bull Location Strasbourg France
bull Population Small ndash 277000 (2015)
bull Economy Service economy
bull Policy area Transport
bull Policy options Pedestrian-oriented and car-restrictive policies pro-cycling policies planning and regulation of public transport services
bull Financial capacity Strong
bull Administrative capacity Strong
Context and policy overviewIn Strasbourg during the 1980s the growing use of private vehicles was increasing congestion air and
noise pollution as well as the number of accidents174 In the 1990s cross-border traffic with Germany was an additional problem given that Strasbourg sits on the busiest road link between Baden and Alsace In 1990 approximately 240000 vehicles per day were present in the city centre This congestion was exacerbated during the peak holiday seasons when visitors flocked to Strasbourg to see its historic buildings and monuments175
To address these issues Strasbourgrsquos Urban Mobility Plan also known as the first plan de circulation176 laid out initial ambitions for reducing the use of private vehicles The main aim was to build two new tramlines that would serve the city centre To facilitate this engineering project Strasbourg implemented a number of transit-oriented policies These included
bull a trial-period extension of the traffic-free precinct in Central Strasbourg ndash which was later made permanent
Integrated multi-modal transport Strasbourg France
Driven by a longstanding ambition to improve air quality Strasbourg has been removing private vehicles from the city centre while facilitating the uptake of active and public transport The city has achieved this through a mix of policy options detailed in its Urban Mobility Plan
174 See European Commission (nd)175 Ibid 176 See Strasbourgeu eurometropole (2015)
Case studies - mobility and transport
95
bull limited or altered vehicular access to the city centre for example by only allowing access through a number of loops rather than through direct connections between one district and another
bull increased fees for inner-city parking
bull the introduction of cyclist-only or pedestrian-only zones
bull the introduction of park-and-ride sites alongside tramway lines to facilitate transit-oriented development and better connectivity
The main goals of the approach were to
bull invest in transport to encourage economic development and trade in the city
bull regenerate Strasbourg to increase the quality of life and protect the environment
bull provide equal services to communities improving social cohesion
bull produce a multi-modal and coordinated system which would decrease the number of private cars in the city
ImplementationThe policy approach was guided by the Urban Transportation Planning Document (PDU) which covers Strasbourgrsquos transport policies for 10-15 years as required by national law to address air quality issues The guidance document is seen as a tool for encouraging local authorities to integrate their transport policies into broader city planning policy
Three private consultancy firms developed the PDU Its eventual adoption required ratification from all municipalities in Greater Strasbourg (CUS) the CUS Council the regional and national governments and civic organisations The tramway department and the Compagnie des Transports Strasbourgeois were responsible for assessing and reviewing the progress of the plan and its impact
These institutions acted as major levers for the policyrsquos implementation and financing CUS had significant governance powers as the organising authority achieved through devolution from the national level The state implemented structures to allow local authorities to manage mass transit services This currently enables CUS to coordinate transit with urban planning processes and service provision
The main sources of funding for public transport systems are the national government regional and local authorities The local authority supplies financing through a transport tax the versement de transport which places a levy of 1 per cent on private wages paid within the Greater Strasbourg area177 Although the tax does not provide full financing for all the projects it is of benefit The system cost euro97 million which worked out at a reasonable industry cost Most parking measures are delivered through public-private partnerships between the city and businesses
Barriers and critical success factorsThe mayoral contest held before the implementation of this plan centred on urban planning changes The winner Catherine Trautmann was strongly motivated to carry out the plan and to recruit a more diverse team of professionals into the public bodies tasked with delivering the programme
There was strong opposition to the scheme particularly from businesses operating in the city centre who believed that the policies would result in a loss of income Moreover they were concerned that works to install the trams would restrict access even further These negative sentiments resulted in the creation of an opposition campaign However the local authority worked hard to develop an engaging communications strategy that would allay peoplersquos fears
The new mayor brought the political vision required to make the plan acceptable among residents Her campaign was built on transforming the cityrsquos transport system and despite opposition she continued to pursue this goal throughout her term
177 See The Princersquos Foundation for the Built Environment (nd)
Case studies - mobility and transport
96
Due to this opposition Strasbourg undertook an extensive consultation process with local residents businesses and associations There was also an accompanying awareness-raising campaign by the city authorities and transport operator The campaign sought to shift entrenched travel behaviours and was supported through a communications strategy with a city symbol (Bruno the bear) to add a face to the campaign
Strasbourg established a phone line to deal with complaints more efficiently and personally The communications strategy also provided regular updates to residents keeping the community involved
Furthermore the city provided landscaping to improve the quality of the environment along routes through social housing projects This work helped to gain support for the transport plan
Results and lessons learnedThe overall PDU programme generated 30 jointly developed managed and funded projects 15 of which focused exclusively on improved environmental protection
Following the implementation of policies outlined in the Urban Mobility Plan by 2000 the number of vehicles in the city centre had fallen by 16 per cent178 to a third less than the figure that would have been expected on the basis of population growth Strasbourg achieved this success despite an overall increase in traffic volumes across the municipality However this traffic reduction in the city centre may have resulted in a transfer of traffic to surrounding roads
Nevertheless data for the tramlines do indicate that more people shifted to using public transport During its first year Tramline A carried 68000 passengers a day potentially contributing to a 17 per cent reduction in traffic entering the area
Furthermore contrary to initial expectations pedestrianisation increased property values and trading figures as the quality of life increased And by 2015 125 jobs had been created across these projects
Strasbourgrsquos Urban Mobility Plan offers lessons for other cities that hope to implement similar initiatives First building an engaging and relatable communications strategy is key to driving change particularly if a programme faces fierce opposition Second this strategy should involve extensive stakeholder engagement while tailoring the communications to the chosen audience In particular the benefits for each group must be made clear and communicated Third any communications strategy must not be a one-off but rather a continuous dialogue
Links to similar initiativesLjubljana car-free zone Seoul transit-oriented development
178 See European Commission (nd)
Case studies - mobility and transport
97
Shifting from transport to mobility Moscow Russia
The Greater Moscow region has successfully implemented a large-scale programme to increase the efficiency of its transport system Measures to cut traffic and shift journeys to public transport modes have reduced the number of cars in the region by 25 per cent compared to 2012
179 See Maltcev (2017)180 See Moscow Transport (2017)
Snapshot
bull Location Moscow Russia
bull Population Large ndash 123 million (2017)
bull Policy area Transport
bull Policy options Planning and regulation of public transport services road-user charges parking pricing restrictions information and enforcement car-sharing car-pooling and ride-sharing
bull Financial capacity Strong
bull Administrative capacity Strong
Context and policy overview In 2010 a new Moscow city government was established At the time traffic congestion was high
during peak hours public transport was ineffective (with inconvenient routes and low quality of service) and the city lacked space for pedestrians and cyclists These problems were exacerbated by the fact that many residents commuted to the city centre via the Moscow ring road To tackle these challenges the Moscow authorities have been implementing a large-scale programme since 2010 to increase the efficiency of the cityrsquos transport system179
A new programme called the ldquoDevelopment of the Transport System 2012-2016 and Further Prospects for 2020rdquo was launched in 2012 with a budget of US$ 80 billion until 2020180 The programme included a number of measures such as development of the metro traffic improvements the creation of bicycle and pedestrian spaces the promotion of car-sharing services and the creation of a smart transport system
The effect of investment at this scale was tremendous with 80 new rail and metro stations a complete renewal of the bus fleet and a significant renewal of the tram and metro fleets
Case studies - mobility and transport
98
181 See Maltcev (2017)182 See Liksutov (2018b)
ImplementationThrough the programme the construction of new metro stations was intensified (18 new stations came into operation between 2010 and 2016) Furthermore an electronic travel card the Troika was introduced It uses payment methods such as Apple Pay and works on all public transport in Moscow Some 249 additional kilometres of road lanes were designated for public transport and 75 per cent of the public transport fleet was renewed
The city government reduced private car use in the centre of Moscow by building parking places near metro stations Heavy goods vehicles were restricted from entering the city centre between 6am and 10pm alleviating congestion Car-sharing businesses were also set up The city introduced an intelligent transport system (ITS) with a budget of US$ 17 billion for the period 2012-20 Digitisation has played a key role in updating Moscowrsquos transport network Public transport operators use mobile applications to provide route-planning options for passengers and by 2018 80 per cent of all taxi bookings were made via smartphones181
Barriers and critical success factorsThe city transport department recognised that one of the main challenges with regard to the uptake of public transport is the difficulty of competing with the comfort of private cars To tackle this issue the department has been upgrading its own fleet purchasing more than 8000 new vehicles and 1600 new metro train cars (all manufactured domestically) By the end of 2017 37 per cent of all metro carriages were new along with 90 per cent of the aboveground transport fleet Today public transport is more accessible with 98 per cent of aboveground vehicles suitable for use by disabled passengers Electronic ticketing systems a successful city bike hire system (the volume of journeys made using this system doubled between 2015 and 2017) bus lanes CCTV to improve passenger safety and regulation of the taxi industry have also played key roles
The introduction in 2013 of the Troika transport card ndash which allows seamless transfers between all types of aboveground public transport ndash has been a further success with more than 85 per cent of trips being paid for through this system 182 More recently the city
Case studies - mobility and transport
99
has also introduced contactless payment through mobile phone payment systems183
Moscow has been using data and technology to provide a better service and to gain more insights from transport customers and other residents In 2020 the city launched an online portal for capturing feedback to help inform priorities for the next investment cycle184
Overall political will has been key in enabling Moscow to improve the efficiency of its transport system Sergey Sobyanin the mayor appointed in 2010 made upgrading the Moscow transport network one of his key priorities In addition the transport programme tackled the issues holistically seeking to improve parking road infrastructure public transport infrastructure and the ITS185
Results and lessons learned
bull Commuter traffic in the Greater Moscow region increased by 600 million trips or 12 per cent between 2010 and 2016 Over the same period the city saw a 37 per cent increase in the percentage of economically active residents using public transport186
bull Travel time from the ring road to the centre has fallen by 20 minutes over the past 10 years187
bull The improvement in traffic speeds benefited non-drivers as well average dwell times were halved for public transport passengers and reduced by more than a quarter for taxi passengers188
bull Moscow became a TomTom Traffic Index Parking award winner in 2016 when the
average time spent searching for a parking space had been reduced by 65 per cent In the 2013 version of the TomTom Traffic Index Moscow traffic ranked as the worst in the world but by the 2017 edition it was in sixth place27 Based on these achievements in 2016 Moscow won an International Transport Award from the International Transport Forum for tackling traffic congestion190
The experience of Moscow offers lessons for other cities seeking to upgrade their transport systems Above all the cityrsquos experience shows that public transport must be safe reliable and convenient in order to be a credible alternative to private vehicles
Links to similar initiativesRotterdam customer-centric public transport Seoul demand-side policies for transit-oriented development Paris public transport integration Tallinn subsidised public transport
183 See Liksutov (2020)184 Ibid185 See Maltcev (2017)186 Ibid187 See Liksutov (2020)188 See Maltcev (2017)189 See TomTom (2020)190 See International Transport Forum (2016)
Case studies - mobility and transport
100
Snapshot
bull Location Freiburg Germany
bull Population Small ndash 227000 (2017)
bull Policy area Transport
bull Policy options Pedestrian-oriented and car-restrictive policies pro-cycling policies planning and regulation of public transport services
bull Financial capacity Strong
bull Administrative capacity Strong
Context and policy overviewFreiburg is a city in which public transport and bicycles are the prevailing methods of transport
From the 1950s to the 1970s Freiburg saw an increase in private transport However in 1969 with its First Transport Plan Freiburg switched away from policies focusing on private transport to ones that took a more holistic view of the urban community In the early 1970s this change saw the planning of an integrated cycling network and a new car-free pedestrian zone in the centre of the old town191 Moreover faced with traffic congestion city officials decided to maintain and develop rather than remove their tram system
In the 1980s Freiburg introduced traffic-calming zones to all residential neighbourhoods to discourage the use of cars in residential areas For instance parking schemes were introduced with limited long-term parking and increased parking fees Neighbourhood associations backed this policy
Implementation The city has ensured that the tram is a convenient mode of transport for residents The tram system is
Incentives to use public and active transport Freiburg Germany
In a quest to cut traffic congestion and environmental pollution Freiburg has sought to reduce the cityrsquos reliance on cars by better integrating affordable and convenient alternatives such as walking and cycling Today more than one-third of residents do not own a car
191 See Buchler and Pucher (2011)
Case studies - mobility and transport
101
constantly being extended with new lines built and existing ones prolonged as needed This has resulted in 65 per cent of Freiburg residents having a tram stop within 300 metres of their home192 Affordability has been another concern for the city which chose to combine affordable public transport charges with a mobility card model in the 1980s
Freiburg has doubled the use of bicycles since the 1980s thanks to a number of pro-cycling policies The average annual budget for bicycle facilities has been euro836000 since 1976193 In 2011 bikes accounted for 27 per cent of all journeys194 The city has more than 400 km of well-connected cycle routes with more than 9000 cycle parking spaces in the centre of Freiburg and at bike-and-ride locations at bus and tram stops
The city also recognised the importance of having an integrated mass transit system throughout the urban area Using planning and design it created a ldquocity of short distancesrdquo enabling high levels of public transport use cycling and walking Investment in the transit system and measures to encourage cycle use were coupled with restrictions on car use through road design and traffic and parking management measures195
New developments such as Rieselfeld and Vauban were developed around tram lines and both districts limited car access and parking All streets were traffic calmed at 30 km per hour or less and were well connected to Freiburgrsquos cycle network and tram system In Vauban more than 70 per cent of households do not own a car Car owners have to purchase a parking space in a multistorey car park on the outskirts of the development costing US$ 25000 plus a monthly service charge196
Resource implicationsNeither of these developments required a contribution from the city budget Both were designed to be self-financing plans with costs being covered by income received from selling serviced plots of land to
cooperatives individuals and small builders Freiburg also has a betterment levy which allows the city authorities to access one-third of the increase in value on the sale of open land197
The city was able to realise its ambitions to control car use partly due to changes in federal government funding reforms in the 1970s During this period municipal governments were given greater autonomy to direct transport funding as they wished The state of Baden-Wuerttemberg also funded the initial trial of Freiburgrsquos flat-rate monthly travel tickets198
192 Ibid 193 See Whitelegg (2014)194 See ICLEI (2011)195 See World Habitat Awards (2013)196 See Buchler and Pucher (2011)197 See World Habitat Awards (2013)198 See Buchler and Pucher (2011)
Case studies - mobility and transport
102
199 Ibid 200 See ICLEI (2011)
Overall the cityrsquos policies have had the effect of shifting the relative costs of car ownership and use compared to those of public and active transport modes199
Barriers and critical success factorsThe plan faced initial resistance from many residents especially those who lived in the suburbs Developers also had a negative response to Freiburgrsquos approach demanding fewer restrictions on how they developed the city These problems were overcome by the city having a clear strategic direction with good communication and engagement with local communities Moreover an increase in service levels and modes of public transport contributed to reducing the percentage of private transport
Citizen participation has been a critical element of the cityrsquos transport planning since the 1970s and was a significant driver in the shaping of Vauban into a car-free neighbourhood Freiburg developed its land-use plan in collaboration with the community with 900 participants
Results and lessons learnedThe city successfully reduced the prominence of cars while increasing the use of sustainable transport modes More specifically it achieved the following impacts200
bull Freiburg has the lowest car density of any city in Germany (423 per 1000 people) Annual car trips have hardly increased over the last 15 years even while the total number of trips of all forms has increased by 30 per cent
bull In the 1990s the use of public transport doubled with 200000 residents using the four tram lines and 26 bus lines
bull The total number of cycling trips each year has nearly doubled
Freiburg is internationally recognised to be a leading green and sustainable city Its successful transition to sustainable modes of transport offers valuable lessons for other municipalities and cities globally First public acceptance of car-restrictive measures is closely linked to the cost and quality of the alternatives provided Residents are more likely to substitute their car ride for a tram journey if the tram is reliable clean and affordable Second active stakeholder engagement is important in order to overcome (and even prevent) opposition to sustainable transport policies Residents businesses and civil society groups must be given a voice and listened to Third the availability of national funding ndash for example to subsidise ticket prices for a limited period of time ndash can help to introduce new services and limit the costs for city authorities
Links to similar initiativesBologna eco-mobility policies Lund eco-mobility policies Strasbourg integrated multi-modal transport
Case studies - mobility and transport
103
Snapshot
bull Country Slovenia
bull Population Small ndash 287000 (2015)
bull Policy area Transport
bull Policy options Pedestrian-oriented and car-restrictive policies pro-cycling policies
bull Financial capacity Strengthening
bull Administrative capacity Strong
Context and policy overviewBetween 2002 and 2012 Ljubljana experienced a 52 per cent increase in car use while also witnessing a 23 per cent decline in the use of public transport
In 2011 the modal share of public transport stood at just 13 per cent while cars accounted for 67 per cent
To reverse this trend Ljubljana adopted a new Sustainable Mobility Plan (SUMP) in 2012 The plan sought to limit personal motor vehicle traffic and instead give greater priority to pedestrians cyclists and public transport201
When introducing the plan the city set itself concrete targets to increase walking by 20 per cent cycling by 40 per cent and bus journeys by 50 per cent all the while reducing car journeys by 20 per cent For 2020 the modal split envisioned was one-third public transport one-third non-motorised mobility and one-third private vehicles202
To achieve these targets the SUMP proposed a broad mixture of policy measures that are outlined below
Pedestrianisation and car-free zones Ljubljana Slovenia
In 2012 Ljubljana adopted a plan to restrict private motorised transport and promote sustainable forms of mobility By introducing new technology improving public spaces and upgrading the bus network the city achieved a significant increase in public transport use and greater uptake of walking and cycling
201 See European Union (2015) 202 See Civitas (2013)
Case studies - mobility and transport
104
203 See Jovičić (2019)
ImplementationLjubljana implemented numerous measures across various policy areas to limit motorised transport and promote sustainable mobility In terms of pedestrian-oriented and car-restrictive policies the city
bull set up an eco-friendly zone which closed the old city centre to traffic and restricted deliveries to the mornings
bull made Slovenska Street a traffic artery more pedestrian friendly by improving accessibility and refurbishing the surrounding area This entailed planting 63 young ash trees along a 400-metre stretch which also attracted local wildlife
Moreover Ljubljana implemented several supporting policies such as the establishment of five new park-and-ride facilities the purchase of 32 new CNG buses and the introduction of an electric tourist train In order to further promote cycling the city also manages 220 km of dedicated cycle routes and rolled out a public bike hire scheme (Bicike) which comprises 36 stations and 360 bikes
In addition to improve the convenience and efficiency of public transport use the city introduced real-time arrival displays for the bus network as well as a smart travel card the Urbana card
Funding for many of the projects under Ljubljanarsquos SUMP has come from the EUrsquos Cohesion Fund at a national level but Slovenia plans to switch to its own financing from 2020 This will require changes to national legislation and financing and the carrying out of engagement and awareness campaigns203
Barriers and critical success factorsSeveral factors contributed to the success of the SUMP First due to continuous awareness-raising campaigns the city was able to take new policy measures year on year As part of its communication efforts Ljubljana also hosted the European Mobility Week in 2003 and 2013 This is Europersquos largest mobility campaign designed to encourage city administrators to introduce sustainable transport policies
Case studies - mobility and transport
105204 See CityLab (2016) 205 See Istenič (2016) 206 See City of Ljubljana (2020)207 See ICLEI (nd)208 Ibid
Second the mild climate and the flat topography of the city make it ideal for cycling all year round This has helped Ljubljanarsquos bike-sharing scheme to succeed
Third from a political point of view mayor Zoran Janković chose to implement the bigger more controversial changes such as banning cars from the city centre within his first year of office This meant that the inconveniences associated with the implementation of the SUMP would be over early on and residents and initial critics could experience the benefits of cleaner air safer streets and quieter public spaces by the time the next election campaign came around204 This strategy showed success Mr Janković has since been re-elected three times
Results and lessons learnedThrough the implementation of its SUMP Ljubljana achieved a significant uptake in public transport and active mobility options
With regard to public transport the city saw
bull an 185 per cent increase in public transport use between 2010 and 2014
bull 17 per cent more city bus users since 2011
bull a 34 per cent increase in journeys on regional buses between 2013 and 2014
Moreover 98 per cent of city residents think that the shared bike scheme is a positive idea and it has seen close to three million journeys in its first four years of implementation
Ljubljana has also successfully transformed from a car-friendly to a pedestrian-friendly city in turn bringing down pollution levels Through the SUMP
bull pedestrian surfaces were increased by 620 per cent through closing the city centre (100000 m2) to all motorised vehicles205
bull the city centre is now used for cultural social and sporting events throughout the year The renovation of Slovenska Street reduced black carbon levels by 70 per cent and PM 25 levels by 58 per cent while the concentrations on surrounding streets have not increased206
In recognition of all the above results the city received the bronze Access City Award from the European Union in 2015 The award identified Ljubljana as one of Europersquos leading cities in terms of accessibility to public spaces and public transport207
These impacts also had a direct positive effect on peoplersquos wellbeing In 2015 the European survey on quality of life (Eurobarometer) found that 92 per cent of Ljubljana residents were very satisfied or satisfied with the quality of life in the city208
The success stories in Ljubljana clearly offer valuable lessons for other cities First Ljubljana did not take an isolated approach to combat rising numbers of private vehicles and the associated detrimental environmental effects Instead it implemented a balanced mixture of policy measures to achieve a modal shift Second it can be beneficial for politicians to implement controversial measures early on so that the positive impacts of initiatives are visible by the time the next elections are due
Links to similar initiativesCopenhagen active transport policies Lund eco-mobility policies Freiburg active transport policies
Case studies - mobility and transport
106
Snapshot
bull Location Lund Sweden
bull Population Small ndash 92000 (2018)
bull Economy Service economy
bull Policy area Transport
bull Policy options Pedestrian-oriented and car-restrictive policies pro-cycling policies
bull Financial capacity Strong
bull Administrative capacity Strong
bull Other Supportive national policy
Context and policy overviewIn 2017 just two years after the Paris Agreement Sweden committed to becoming carbon neutral by 2045209 one of the first countries in the world to commit to such a target Overall environmental awareness has grown rapidly in Sweden since the
1970s and this has also been reflected in Lundrsquos environmental policy
In 1999 the city developed a new Environmental Code which streamlined all previous environmental acts and included concepts such as the polluter-pays principle210 Since the 1970s the city has been implementing a series of hard and soft measures to improve transport management in particular
Today the city has a well-developed transport plan (LundaMaTs) which it has further developed to consider wider environmental economic and social sustainability (LundaMaTs II) The long-term ambition of this plan is to encourage the use of active transport (walking cycling and public transport) while also reducing the use of private vehicles
All measures have been supported by suitable levels of funding as well as a highly engaged motivated and well-educated population211
Promotion of active transport Lund Sweden
Over the last 10 years Lund has implemented a series of pro-cycling and pedestrian-friendly transport policies leading to a decrease in car use and a rise in the uptake of active transport options
209 See UNFCC (2017) 210 See Baltic Environment and Energy (2007) 211 See CiViTAS (2009)
Case studies - mobility and transport
107
Implementation The small size of Lund (2575 kmsup2) lends itself to active transport and with significant green space the city is an attractive environment for pedestrians212 The measures taken to facilitate the LundaMaTs transport plan were a broad mixture including rezoning the establishment of partnerships education and awareness campaigns the redesigning of outdoor spaces and pro-cycling measures
Rezoning The city initially carried out a series of rezoning measures including closing several streets and squares to vehicular traffic and limiting bus traffic to certain times of the day
Redesigning outdoor spaces The city recognised that the uptake of walking could be even greater for both disabled groups and non-disabled groups if Lund improved accessibility and made the cityrsquos open spaces safer with lighting through project proposals that could be included in a pedestrian management plan
Pro-cycling measures At the start of the programme cycling was already popular across the city and Lund is recognised as one of the most popular places to cycle in Europe The municipality undertook a mixture of policies to further capitalise on this popularity including
bull improvements to cycling infrastructure
bull bicycle traffic safety campaigns
bull establishing partnerships with the public and private sectors
In particular the infrastructure programme facilitated the construction of 260 km of high-quality bike lanes more than 5500 cycle parking spaces and multistorey parking and bike storage facilities with servicing at the central train station213
Partnerships Partnerships between public and private institutions and transport and traffic companies have been established in Lund
The city has supported these measures to improve active transport through
bull an online service that allows residents to compare different modes of transport in terms of their cost time environmental impact and health benefits It is an open-source service that enables users to contribute and has therefore become a co-produced map
bull measures to improve the public transit system The bus system is coordinated across the region and provides frequent local services connecting 400 bus stops over 11 lines The train system from neighbouring Denmark is similarly unified under one ticketing system
212 See ICLEI (2011) 213 See CiViTAS (2009)
Case studies - mobility and transport
108
Lund has had significant municipal and national government funding for the measures mainly due to the wider national ambitions of Sweden The level of annual funding for active transport in Lund is difficult to estimate However a basic budget equivalent to approximately GBP 300000 is spent on maintenance Projects to improve provision are additional costs ndash for example the equivalent of GBP 2 million for the creation of tunnels and an investment of more than GBP 71 million between 1998 and 2005 as part of the LundaMaTs programme214 One source states that funding has varied between GBP 15 million and GBP 5 million215
Results and lessons learnedThe LundaMaTs programme consisted of a mixture of policies implemented over a decade which allowed the city to adjust to the changes to spread out the costs and to create long-term behavioural shifts among residents
In 2011 43 per cent of all trips in Lund were taken by bicycle and in the preceding decade there was no increase in car use In fact in 2010 there was a measured drop of 2 per cent in the kilometres travelled annually by car compared with the levels seen in the previous year216
Moreover improvements in accessible design led to a halving of the number of deaths and injuries from
traffic accidents The city aims to have no deaths and injuries in the future
Looking ahead the already well-connected bus network will be further supported by the introduction of a tram network that is due to open in December 2020217 to facilitate faster public transport greater capacity and an environmentally cleaner system
The experience of Lund shows that a balanced and well-thought-out mixture of policies implemented over a longer period can help to facilitate behavioural change among residents and to address funding constraints
Links to similar initiativesAmsterdam mobility plan European Commission report on cycling Copenhagen cycling strategy
214 See Warren (2010) 215 See Transport for London (2014)216 See ICLEI (2011)217 See Railway Gazette (2020)
Case studies - mobility and transport
109
Snapshot
bull Location Copenhagen Denmark
bull Population Large ndash 602000 (2017)
bull Policy area Transport
bull Policy options Pedestrian-oriented and car-restrictive policies pro-cycling policies
bull Financial capacity Strong
bull Administrative capacity Strong
Context and policy overview Like many other cities in Europe Copenhagen experienced a major rise in private car ownership and use from 1945 to 1975 This brought about a corresponding decrease in bicycle use and an increase in levels of traffic and pollution
However in the 1970s a number of factors including the oil crisis led the city government to prioritise cycling in Copenhagen218219
This strategy entailed various planning infrastructure and financing measures and has helped Copenhagen to attain the status of being one of the worldrsquos leading cycling hubs
ImplementationAs part of its plan to be CO2 neutral by 2025 Copenhagen has set itself the goal of becoming the worldrsquos best city for cycling To achieve this it has deployed a policy mix of planning infrastructure and financing measures
Planning measures Bicycle planning is now an integrated feature of urban development and urban governance in Copenhagen The city has developed various policy planning and strategy documents addressing different aspects of cycling through targets implementation and funding The most important documents include
Cycling strategy Copenhagen Denmark
Copenhagen achieved a shift from being an increasingly car-centric city in the 1970s to one in which cycling is now becoming the norm for most inhabitants While cycling in Denmark has decreased by 30 per cent since 1998 in Copenhagen it has risen by 30 per cent
218 See Urban Sustainability Exchange (nd)219 See Ruggieri (2017)
Case studies - mobility and transport
110
220 See Urban Sustainability Exchange (nd)221 See The City of Copenhagen Technical and Environmental Administration Traffic Department (2011)
bull the Copenhagen Cycle Policy (2002-12)
bull the Copenhagen Transport and Environment Plan 2004
bull the Copenhagen Bicycle Strategy (2011-25)
bull the Copenhagen Cycle Priority Plan (2006-16)
Infrastructure measures There is a large amount of cycling infrastructure in Copenhagen aimed at improving the safety and convenience of cycling through a network of segregated bike paths dedicated bicycle traffic lights separated coloured bike paths where cars and bikes share road space and parking for bicycles and cargo bikes Cargo bikes are used for transporting children and shopping and are often an alternative to car ownership
Financing measures Copenhagen allocated euro80 million to implement its bicycle strategies and infrastructure between 2010 and 2014220
Barriers and critical success factorsThe main barrier to establishing Copenhagen as a bicycle-friendly city was the rise of private car use from the 1950s onwards To improve the situation the city integrated cycling into its planning and policy ensuring that there were sufficient resources to support the policies Copenhagen has also promoted a culture of cycling which has been central to the success of the strategy
A critical success factor has been the single Technical and Environmental Administration within the city government as it enables a ldquoone-stop shoprdquo approach to urban and transport planning The administration works collaboratively with an open work culture reducing conflict between urban and transport planning
Results and lessons learnedCopenhagen successfully managed an urban transformation process from being a car-centric city in the 1970s to becoming a global role model for bicycle-
oriented planning Through a variety of measures the city achieved impressive results221
bull The number of daily bicycle trips increased from 110000 in 1970 to 150000 in 2015 (a 36 per cent modal share) Copenhagen plans to increase this further to 240000 by 2025
bull Since 1998 the city has seen a 30 per cent increase in total kilometres cycled and a more than 33 per cent rise in cyclingrsquos modal share for work or educational trips
bull Bicycles are increasingly used even for trips with heavy shopping or children and 17 per cent of households have a cargo bike
bull The bicycle is now the most popular form of transport for Copenhagenrsquos commuters
Today cities around the world look to Copenhagen for guidance and inspiration when it comes to designing and implementing pro-cycling policies The lessons learned from Copenhagen can be summarised under two areas governance and political leadership and commitment
Governance Copenhagen has successfully reduced and minimised conflicts between urban and transport planning by taking an integrated approach across departments and agencies
Political leadership and commitment In Copenhagen cycling is increasingly the norm for the majority of residents Promoting a culture of cycling and supporting that with sufficient resourcing and planning commitments has been crucial to this success
Links to similar initiativesMuenster policy to promote cycling Burgas cycling measures Utrecht cycling city of the Netherlands
Case studies - land use
111
Snapshot
bull Location Stuttgart Germany
bull Population Large ndash 628000 (2016)
bull Economy Service economy
bull Policy area Land use
bull Policy option Promotion of green spaces and biodiversity
bull Financial capacity Strong
bull Administrative capacity Strong
Context and policy overviewStuttgartrsquos geography and economic base heavily influence its air quality A mild local climate low wind speeds and a valley basin location combined with industrial activity and high traffic volumes all contribute to poor air quality222
Climate projections for the period 2071-2100 predict a 2ordmC increase in mean annual temperatures for the
city And projections for heat waves ndash defined as temperatures exceeding 30degC ndash suggest that heat stress will be a significant issue with more than half of the Greater Stuttgart area experiencing at least 30 days of heat stress by 2100 Low-lying areas could experience more than 60 days significantly increasing the risk to local people223 Moreover ongoing development of valley slopes surrounding the city hinders air flow exacerbating poor air quality and the urban heat island effect
Stuttgart has a decades-long legacy of climate mapping air-quality data collection and local climate assessment began in the 1930s As air quality worsened into the 1970s the city began a more focused campaign to address this problem224
Adapting to climate change and mitigating its effects remains a political priority The city adopted its first climate change mitigation strategy in 1997 and has since supplemented this with an adaptation strategy adopted in 2012
The main goal of these strategies is to improve air quality and reduce the urban heat island effect by channelling flows of cool air via ventilation corridors from the hills towards urban areas in the valley basin
Green ventilation corridors Stuttgart Germany
Stuttgart developed a climate atlas that maps temperatures and cool air flows in and around the city This information helps develop planning and zoning regulations to both protect open spaces and incorporate new ones into dense urban areas
222 See WWF (2012) 223 See European Environment Agency (2014)224 See WWF (2012)
Case studies - land use
112
The climate atlas for the Stuttgart region was initiated in 2008 It provides a spatial overview of the region and includes the assessment of 179 towns and municipalities225
ImplementationThe atlas illustrates the movement of cold air and the levels of various air pollutants It also establishes eight types of local climate typology with associated planning and zoning recommendations to protect open spaces and to promote the creation of new ones especially in built-up areas For example the climate atlas prohibits construction in cold air ventilation corridors and any other open spaces that have a large effect on the local climate The Atlas recommends additional greening for developed areas in locations that have a significant effect on the climate Further planning principles include the following226
bull Buildings must be surrounded by open space and there must be a larger interconnected network of open spaces
bull Valleys hills and hillsides may not be built on
bull Urban sprawl should be avoided
bull For industrial buildings air pollutants that would affect the surrounding settlements should be avoided
Collaboration and public participation underpin the implementation of the climate atlas which was developed and funded in a partnership between the city regional authorities and climate experts227 To increase the programmersquos public appeal and participation the city also provided financial assistance for the private installation of green roofs and encouraged residents to adopt and care for a tree228
Barriers and critical success factors The following success factors have contributed to the successful improvement of air quality and to mitigation of the urban heat island effect229
bull The consolidation by the atlas of critical details of the regionrsquos geography climate and land use has faciliated precise planning for different areas
bull The cityrsquos increased internal capacity to conduct climate research has created valuable knowledge of the local environment This has allowed Stuttgart to act on specific information rather than relying on general principles and has rendered the cityrsquos efforts more effective Furthermore this concrete knowledge applied
225 See City of Stuttgart (nd)226 See WWF (2012)227 See European Environment Agency (2014)228 Ibid 229 Ibid
Case studies - land use
113
over decades has enabled Stuttgart to regulate development and land use to intentionally create a region-wide system of air flows
bull The atlas has shown that existing regulations (such as the German building code) can also be used to further promote climate-related planning recommendations
bull The partnership between the Office for Environmental Protection and the City Planning and Renewal team in Stuttgart has meant that the recommended green infrastructure solutions were implemented through spatial planning and development control
Results and lessons learnedHaving initiated subsidies for green roofs since 1986 Stuttgart now mandates them on new developments As a result the green roof market has had a significant boost230 Stuttgart is now a leader in the field with more than 300000 m2 of green roofs More than 60 per cent of Stuttgartrsquos land area is green open space In addition at 39 per cent of the total land area the city has the highest percentage of protected land of any city in Germany These green spaces include 5000 ha of forested land 65000 park trees and 35000 street trees Through a concerted strategy in place since the 1970s the city has integrated green areas into a large green corridor People can now travel from the royal gardens in the city centre to forests at the edge of Stuttgart exclusively via green spaces231
Recent changes to the climate atlas prohibit development in ventilation corridors and on the hills surrounding the city Plans set out in the cityrsquos 2010 Land Use Plan to develop more than 60 ha of these areas have now been halted in order to protect green spaces232
Using financial support provided by the city about 60000 m2 of green roofs have been installed and nearly 500 trees have been paired with citizens in a tree adoption programme These volunteers water the
trees report on pest infestations and remove fallen leaves branches and dog excrement233
The climate atlas concept has been replicated in other cities across Germany and internationally For example Berlin has developed an environmental atlas and Kobe Japan has created an environmental atlas to inform measures that support air circulation from the sea during the day and from the mountains during the night234
Links to similar initiativesTirana green belt policy Novi Sad green living concept Hamburg green roof strategy Liverpool mapping green infrastructure Antwerp green tool
230 See Mees (2014)231 See European Environment Agency (2014)232 See WWF (2012)233 See European Environment Agency (2014)234 See WWF (2012)
Case studies - land use
114
Snapshot
bull Location Barcelona Spain
bull Population Large ndash 16 million (2016)
bull Policy area Land use
bull Policy options Development of compact cities promotion of mixed-use areas and transit-oriented development promotion of green spaces and biodiversity community-based land planning
bull Financial capacity Strong
bull Administrative capacity Strong
Context and policy overview The municipality of Barcelonarsquos ldquoCitizen Commitment to Sustainability 2012-2022 ndash Compromiacutes 22rdquo agenda promotes engagement and collaboration to create a more liveable and sustainable city More than
800 local organisations have signed the document235 One of the aims of the Commitment is to place the individual at the centre of decision-making in city planning with an increased focus on small-scale interventions236 The ldquoLetrsquos fill the streets with liferdquo programme was initiated to prioritise access to public space for people rather than vehicles The programme centres around public participation237
Barcelonarsquos Climate Plan 2018-2030 builds on the Commitmentrsquos aims with ldquosuperblocksrdquo seen as a means of fulfilling the planrsquos goal to increase green space and cut GHG emissions238
The cityrsquos 2013-18 Barcelona Urban Mobility Plan (UMP) also sought ldquoto promote positive communal relations between people as well as social cohesion wellbeing and public healthrdquo and promoted superblocks239 Moreover the new Urban Mobility Plan 2019-2024 includes plans to significantly expand the superblocks programme across the entire city240
Urban planning with superblocks Barcelona Spain
The municipality of Barcelona in partnership with the Urban Ecology Agency developed the innovative ldquosuperblocksrdquo project to address local challenges such as air pollution noise traffic road accidents health issues and a lack of green space
235 See Ajuntament de Barcelona (nda)236 See Energy Cities (2016)237 See Ajuntament de Barcelona (ndb)238 See Ajuntament de Barcelona (ndc)239 See Ajuntament de Barcelona (ndd)240 See Ajuntament de Barcelona (nde)
Case studies - land use
115
ImplementationThe superblocks programme redefines public space giving priority to people greenery and human interaction while minimising the space allocated to roads and vehicles Superblocks consist of a small grid of blocks and roads (approximately 400 m x 400 m) with cars vans scooters and other vehicles restricted to the outer perimeter roads (unless the drivers are residents or delivering to local businesses in which case their maximum speed should be 10 kmh) The city has expanded cycle lanes and initiated an orthogonal-grid bus network using main thoroughfares only241 Superblocks are intended to function as mini-neighbourhoods creating opportunities for leisure sports and social interaction
The approach was first tested in the neighbourhood of Poblenou in 2015 There the initiative has transformed public space with 75 per cent of the area that was once occupied by cars now freed up for cycle lanes benches and room for residents to interact and children to play242 Four new 2050 m2 public squares have also been introduced
So far Barcelona has completed six superblocks and the Urban Ecology Agency (BCNEcologia) a public consortium within the city council has set out plans to develop 503 more superblocks across the city
Barriers and critical success factorsWhile there have been some criticisms for instance about the inconvenience to drivers as a result of complicated rerouting the occupants of superblock areas have tended to welcome the changes243
Following the Poblenou test case the city learned important lessons that were carried through into the development of later superblocks For example a lack of sufficient funding to develop the superblock and an initial failure to engage local stakeholders created some opposition and animosity244
Strong clear communication between planning authorities and residents is recognised as being essential to increase the acceptability of the projects Public engagement and participation throughout the planning stages also create a sense of ownership and emotional attachment to the areas for the people who will use the spaces Participatory processes take both those involved in design and policy as well as the communities on a shared journey that is likely to culminate in a joint and mutually acceptable vison for Barcelona
Furthermore during the process of developing and designing the superblock spaces a willingness to experiment and to learn by doing allows people to evaluate the changes as they engage with the spaces This enables simple low-cost no-regret interventions to bring about rapid changes in behaviour and the environment These can then lead to investment in more permanent changes to the public realm a clear demonstration of value creation for the neighbourhood Superblocks are open projects since the completion of the Poblenou project any proposed action undergoes a participatory process involving local residents and organisations to ensure social acceptance The outcomes of the implementation process are different in each block as each neighbourhood has its own preferred approach characteristics economic activity density and so on245
The superblocks initiative is simple but its effects have been transformative The project is low-cost and relatively quick to carry out with no physical changes
241 See Bausells (2016)242 See PublicSpace (2018)243 See Bloomberg (2017)244 See Serena (2018)245 See Bausells (2016)
Case studies - land use
116246 See C40 Cities (2016b)247 Ibid 248 See Publicspace (2018)249 See C40 Cities (2016b)250 See Mueller (2020)
required and with a strong dialogue between city authorities and residents being the major driver of success
Results and lessons learned
bull Building on the initial experiment in Poblenou the municipality has now created superblocks in five pilot neighbourhoods with plans for many more Through these projects the city hopes to achieve emission reductions of between 20 per cent and 75 per cent
bull The superblocks initiative is part of the cityrsquos Urban Mobility Plan which aims to decrease traffic by 21 per cent while extending car-free spaces and providing 300 km of bicycle lanes In the Poblenou superblock vehicle numbers on the inner streets have fallen by 58 per cent while traffic around the periphery has increased by only 26 per cent More than 300 benches have been installed and 212 new trees planted
bull The project has increased the amount of green space by 1 m2 per capita reduced the heat island effect and noise pollution and improved air quality
bull The superblocks provide car-free places that are safer and more enjoyable for children and older people These areas also foster social interaction sports and cultural activities and expand opportunities for small businesses
bull Quality of life has improved in the city making Barcelona a more attractive destination for business and tourism
bull The initiative is scalable and could be applied to new developments as well as to regeneration projects
bull A recent study found that if all 503 of the proposed superblocks were implemented almost 700 premature deaths could be prevented annually (mainly due to reduced pollution levels) and life expectancy could be increased by almost 200 days per resident These outcomes could result in economic savings of euro17 billion a year
The experience of superblocks in Barcelona has shown that initial opposition to such projects must be expected but can be overcome through strong engagement and communication tailored to the specific circumstances of a neighbourhood
Links to similar initiativesAmman 2025 from master plan to strategic initiative Transformation of Tiranarsquos New Bazaar Beijing low-carbon zoning policies
Case studies - land use
117
Snapshot
bull Location Roubaix France
bull Population Small ndash 96000 (2015)
bull Economy Service economy
bull Policy area Land use
bull Policy options Promotion of mixed-used areas and transit-oriented development promotion of community-based land use planning
bull Financial capacity Strong
bull Administrative capacity Strong
Context and policy overview Together with the Lorraine region Nord-Pas de Calais was a cradle of the industrial revolution in France While coal mining and steel industries developed in the region Roubaix ndash one of the four major cities in Nord-Pas de Calais ndash built its industrial prosperity on textile manufacturing However in the early 1970s the
textile industry fell into crisis and 50000 jobs were lost in Roubaix and the surrounding areas251
The decline of the cityrsquos textile industry created a host of interlinking challenges including unemployment low skill levels urban decay housing market collapse poverty inequality violence and racism252 As a way to tackle these issues and attract the middle classes back to the city Roubaix identified a series of strategic objectives253
bull recovery from deindustrialisation by encouraging the growth of new sectors
bull revitalisation of the rundown city centre and rebuilding of a retail offer
bull addressing the need for better more affordable housing for residents and attracting new residents and
bull ensuring that investment and economic development benefit existing residents especially by providing training and new employment opportunities
Urban regeneration and renewal Roubaix France
The city of Roubaix has successfully followed a market-led approach to urban renewal which integrates issues such as social inclusion housing renewal and economic and cultural development
251 See Cadell et al (2008)252 See Rousseau (2009)253 See Colomb (2007)
Case studies - land use
118
Reneacute Vandierendonck was elected mayor of Roubaix in 1994 with a political mandate to revitalise the city centre The mayorrsquos strategy was implemented in a changing political and economic context Lille Metropolitan Authority (LMCU) ndash an intercommunal cooperative body with investment-related responsibilities transferred from its 87 individual member municipalities ndash started to play a strategic role in developing a vision for economic development and urban regeneration LMCU also initiated a series of long-term agreements with the mayors of the regionrsquos four big cities which led to the emergence of a consensus and a grouping together of budgets254
The resulting strategy Ville Renouveleacutee (ldquorenewed cityrdquo) includes a spatial plan for metropolitan Roubaix and aims to reverse urban decline and create value for residents and investors The concept became one of the key objectives of the 1997 strategic plan for the Lille metropolitan region and also informed French national urban policy255
ImplementationRegeneration of the city centre was planned across five key areas256
bull creating secure and successful public spaces which enhance the architectural legacy of Roubaix
bull improving the retail offer and establishing the city centre as a commercial destination
bull designating zones including enterprise zones to channel economic development into strategic areas
bull launching a cultural strategy to promote Roubaix as a cultural destination
bull renewing the cityrsquos housing stock
Improvements to the public realm were designed to entice investment businesses and shoppers to the
city centre These actions included (i) regenerating the main central square and its civic buildings (ii) regenerating public spaces and streets while respecting the local architectural and industrial heritage (iii) regenerating the Canal de Roubaix (iv) promoting the painting of faccedilades in bright colours to break up the grey industrial image of the city and (v) improving safety for instance through additional policing and CCTV257
To improve the city centrersquos retail offer the city council established a small core of commercial opportunities through improvements to the streetscape design improvements in public transport interchanges for the metro tram and bus financial and technical support such as tax exemptions for people interested in opening retail shops and grant to support the refurbishment of buildings Two large retail outlet centres were also opened on the outskirts of the city The designation of Roubaix as a Zone Franche Urbaine (tax-exempt enterprise zone) in 1997 brought tax-break incentives and helped promote business and job creation These measures helped to spread the benefits of the renewal programme across the city and its communities258
Barriers and critical success factorsKey to the success of Roubaixrsquos regeneration was the strong city-regional relationship in which political cooperation developed in the early 1990s Beginning in 1994 with the mayoral tenure of Reneacute Vandierendonck collaboration increased between the city and the LMCU The regeneration benefited from outstanding civic leadership and vision both at the city-regional level and at the level of the city of Roubaix itself The sharing of budgets between the regions also facilitated more collaborative opportunities The regeneration process in Roubaix was also heavily influenced by the fact that the various urban social and economic regeneration elements were carried out in parallel within a concentrated period of change It was the synergy between these elements that made the process a real success259
254 See Cadell et al (2008)255 See Colomb (2007)256 Ibid257 Ibid258 Ibid259 See Colomb (2007)
Case studies - land use
119
Investment in the public realm housing and communities as well as job creation and business incentives also increased the desirability of the city and attracted people to return there to live and work The cityrsquos cultural policy also helped to enhance Roubaixrsquos image enabling the celebration of its cultural and social history while creating a dynamic modern environment and attracting younger wealthier people and even tourists
Resource implicationsRoubaix has been used as an experimental area for all urban policy initiatives taken by successive local governments across the country since the birth of urban policy in the early 1980s This has created a relatively complex combination of schemes and funding but has also meant that the city has used all possible programmes While the city had a weak tax base it was able to tap into substantial funding from the central government and the LMCU One of the challenges for the Lille city-region has been leveraging funding from many different levels (for instance EU national and local levels) to finance a clear and coherent approach to metropolitan regeneration
Results and lessons learnedThe strategy has brought meaningful improvements in the public realm to central Roubaix from quality infrastructure such as housing unified paving street furniture cleanliness and coloured facades to jobs skills and business opportunities The middle classes have returned to the city the property market has recovered and the cityrsquos image has been transformed
Roubaix now has a standardised system to conserve and refurbish industrial buildings that date from the industrial revolution Alongside the improved public realm these initiatives have supported the re-emergence of retailing in the town centre
Today Roubaix has many important cultural amenities including La Piscine museum which saw the cityrsquos old public swimming pool converted into
an internationally known cultural venue thanks to an innovative regeneration programme260
Local leaders have also crafted a strategy for cultural regeneration against great odds The Ministry of Culture awarded Roubaix the title of Ville drsquoArt et drsquoHistoire only one of 59 cities to earn the title Similarly a range of factors including a better nationwide economic climate the impact of the tax-exempt zone and improved links between economic development and local employment has cut unemployment from 33 per cent in the 1980s to 22 per cent in 2005261
Furthermore people have moved to Roubaix and invested there As central Lille became more expensive Roubaixrsquos improved city centre became more appealing not least thanks to its proximity ndash only 20 minutes away by metro train following the completion of a new line The many renewal strategies featured in the programme have also benefited vulnerable groups in particular in terms of local employment opportunities262
Links to similar initiativesRotterdam urban regeneration Gothenburg urban regeneration Christchurch urban regeneration
260 See Guardian (2008)261 See Colomb (2007)262 See Cadell et al (2008)
Case studies - land use
120
Snapshot
bull Country Toronto Canada
bull Population Large ndash 29 million (2017)
bull Policy area Land use
bull Policy option Development of compact cities
bull Financial capacity Strong
bull Administrative capacity Strong
Context and policy overviewA strong development market in Toronto has led to a spate of high-rise construction especially residential condominiums and office buildings With the establishment of a protected greenbelt area rising land values a buoyant real estate market and population and employment growth developers have a strong incentive to build projects that are taller and
denser than those preferred by local government and city residents
To address this issue bonusing in relation to height and density has become an important tool in Torontorsquos urban planning over the past twenty years According to Section 37 of the Ontario Planning Act of 1990 developers are allowed to propose a new building larger than would be permitted by existing land controls in exchange for the delivery of community benefits263
The provisions of Section 37 usually apply to developments if they have a gross floor area exceeding 10000 m2 and if the applicant proposes to exceed the permitted density by 1500 m2 or more andor increase the permitted height of the building264
ImplementationCity leaders and planners use density bonuses to entice private developers to create public benefits
Density bonusing and development Toronto Canada
Toronto has applied density bonusing to secure community benefits in exchange for approval to build taller and denser buildings Parking improvements public art and funds for new daycare facilities and affordable housing are among these benefits
263 See Pantale (2014)264 Ibid
Case studies - land use
121
265 See City of Toronto (nd)266 Ibid267 See Moore (2013)268 See Lehrer and Pantalone (2018)269 See RE Millward amp Associates Ltd (2013)270 See Moore (2013)
This has been particularly useful in situations where development will create additional demand on infrastructure or the public realm and where there is a lack of public resources to make improvements Torontorsquos regular use of Section 37 has provided funds for open spaces public art affordable housing and childcare facilities265
Developers and city planning staff negotiate Section 37 benefits on a case-by-case basis Once the planning team has completed its review the application for development goes for consideration by the community council This period includes public consultation and the opportunity to formally register comments about the development and related Section 37 benefits If approved by the community council the application goes to the city council to render a final decision Once approved the Section 37 benefits are ldquosecuredrdquo and the city enters into a formal agreement with the applicant266
Given that restrictive frameworks may hinder development and community-building potential in a city the negotiation process under Section 37 has remained flexible in order to react to changing market demand and community needs
Developers can provide the Section 37 benefits through in-kind or cash-in-lieu methods The city has discretion regarding how to spend cash-in-lieu contributions Toronto secured around 850 Section 37 benefits in the period from 2009 to 2014 Some 55 per cent of these were in-kind contributions and 45 per cent were cash in lieu
Barriers and critical success factorsIn contrast to many other tools of municipal finance Section 37 benefits bring benefits primarily to the area affected by the development As a result the ldquodensity for benefit agreementsrdquo (DBAs) are heavily concentrated in the parts of Toronto that have had substantial development activity especially the downtown core Hence the number of benefits has been disproportionately high in wards with the most
DBAs which has led to an uneven distribution of policy outcomes
Since its inception the bonusing policy has experienced controversy and criticism from various actors in Toronto Points of criticism have included the allegedly inconsistent application of the policy disagreement over how funds should be spent the tendency to engender poor planning decisions and a negotiation process that has little public oversight267 Critics also note that the community benefits that the policy seeks have not been achieved in proportion to the developments created and their associated externalities268
To tackle these points the city council adopted a protocol for negotiating Section 37 community benefits through which it encouraged consultation with a variety of stakeholders during the assessment of community benefits Consultations would be held with elected representatives city council staff and the local community and decisions would be supported by evidence of community needs from previous studies269
Results and lessons learned270
bull Over a 15-year period Section 37 agreements generated more than euro220 million in benefits for Toronto
bull The range of benefits secured through the Section 37 process varied widely and included community facilities parks road improvement schemes public transport projects and arts and cultural facilities
Links to similar initiativesLondon density development Vancouver density bonusing New York inclusionary zoning
Case studies - energy and buildings
122
Energy manager obligation and white certificate scheme Italy
Since 2005 Italy has operated a market-based incentive scheme for energy efficiency interventions This ldquowhite certificaterdquo system has delivered substantial savings in the use of electricity and heat
Snapshot
bull Location Italy (nationwide)
bull Population 592 million (2019)
bull Policy area Energy and buildings
bull Policy options Industrial regulations and information to report on energy performance fiscal incentives for efficiency related to machinery and materials in industries
bull Financial capacity Limited
bull Administrative capacity Strengthening
Context and policy overview271
In the 1990s the industrial sector was responsible for approximately one-third of Italyrsquos energy consumption Initially the government responded by introducing rules requiring certain industrial firms and public sector organisations to nominate an energy manager
For industrial companies this rule applied if their energy consumption exceeded 10000 tonnes of oil equivalent (toe) per year and for public sector organisations the threshold was set at more than 1000 toe per year
While the new energy managers were effective in raising awareness of potential savings from energy efficiency industries and public bodies were not required to act in response to this newfound awareness The situation changed in 2005 when Italy introduced a market mechanism for energy efficiency investment called the Titoli di Efficienza Energetica (TEEs or ldquowhite certificatesrdquo) The TEE scheme obliged electricity and gas utilities with more than 50000 customers to reach specific targets in terms of primary energy savings The utilities could choose to deliver energy efficiency measures themselves or to purchase white certificates earned by other scheme participants as a result of energy efficiency savings The pool of scheme participants includes all those organisations that had been required to appoint an energy manager under the earlier scheme as well as other organisations with energy management systems in place This arrangement created a larger
271 See Thomas et al (2014)
Case studies - energy and buildings
123
pool of certificate ldquosellersrdquo which the utility firms could access to reduce the overall cost of their compliance It also ensured that energy managers with the required know-how were in place in every participating organisation272
The scheme involves a 12-month baseline monitoring period prior to the proposal of eligible measures and a 12-month post-completion monitoring and verification period before a firm or organisation submits an application for a TEE certificate
Implementation and challenges273
At first the scheme had a price cap of euro100 per TEE and more than 80 per cent of the energy efficiency savings were in the residential sector274 In 2012 the government introduced a durability coefficient ldquotaurdquo that allowed up to 336 TEEs to be earned per toe saved Subsequently the euro100 per TEE cap was removed and the scheme was able to leverage greater investment275
In 2013 Italy introduced a measure that prevented technologies that had previously benefited from other national support mechanisms from receiving support under the TEE scheme In 2017 the durability coefficient was abolished as it incentivised projects with a long technical life and other incentives were introduced The durability cofficient was replaced by a rule allowing scheme participants to front-load the attributable savings to the first half of the projectrsquos useful lifecycle276
In 2018 further modifications were made to increase the supply of certificates and to address concerns about fraud and the complexity of the scheme These modifications included changes to the assessment of additionality a two-year increase in the designated useful life of measures277 an expansion of the project eligibility criteria the creation of new pre-approved standardised solutions the flexibility to spread compliance across scheme years and the setting of a new definition of cumulativeness278
Barriers and critical success factorsTo increase overall energy efficiency savings and diversify measures away from the residential sector (which dominated the early years of the scheme) incentives were increased for industrial sector investments These included awarding a higher ratio of certificates to industry and removing the price cap for industrial sector savings which had resulted in higher market prices (euro427 per TEE in February 2018 for instance)279
272 Ibid273 See Energy Systems Catapult (2018) 274 See Di Santo (2018)275 See Qualenergiait (2017)276 See Gianni-Origoni amp Grippo-Cappelli Partners (2017)277 Ibid278 See FIRE Federazione Italiana per luso Razionale dellEnergia (2018)279 See Energy Systems Catapult (2018)
Case studies - energy and buildings
124
280 Ibid281 See Di Santo et al (2018) 282 Ibid283 See Di Santo et al (2018)284 See Energy Systems Catapult (2018)285 Ibid286 See Di Santo et al (2018)
Industrial sector energy efficiency was also supported by the EU Emissions Trading Scheme (ETS) but under this scheme the carbon price was not sufficient to drive significant investment in the sector However the white certificate scheme was able to supplement the EU ETS and achieve higher rates of investment and savings280 Regular modifications to the scheme were essential to its continuing reliability and effectiveness although these have at times created uncertainty and complexity281
Extensive data collection by the public Italian energy services operator GSE has helped to create a valuable database for assessment and for comparison with other schemes Furthermore strict monitoring and verification procedures have helped to identify and reduce fraud in the system
Defining the appropriate target that parties are required to meet is essential to the attractiveness and effectiveness of the scheme The wrong target could create low prices and make the scheme less attractive to voluntary members or create high prices for end-users and the potential for fraud282
Outcomes and impacts
bull The scheme has resulted in cumulative additional energy savings of 256 million toe and annual savings of around 2 million additional toe and 6 million tonnes of CO2283
bull Certifications under the scheme were initially dominated by the residential sector which accounted for 70 per cent of certified projects in the period 2011-12 By 2017 the industrial sector represented 54 per cent of projects due to the increase in
industry-focused incentives while the household sectorrsquos share fell to around 14 per cent284
bull In total 5807831 TEEs were certified by 2017 with total primary energy savings calculated at 192 Mtoe Most of those savings (55 per cent) came from cuts in primary energy use (natural gas) and a further 26 per cent from reduced electricity consumption285
Additional benefits of the scheme include the creation of around 11000 full-time equivalent direct and indirect jobs as well as a significant increase in knowledge about good practices in industrial energy efficiency across the energy industry286
Links to similar initiativesIrish large industry energy network Tokyo cap-and-trade programme White certificates in France
Case studies - energy and buildings
125
Energy performance contracting Berlin Germany
The Berlin Energy Agency initiated energy saving partnerships in 1996 to implement energy performance contracting and improve energy efficiency in public buildings using the established German ESCO market
Snapshot
bull Location Berlin Germany
bull Population Large ndash 35 million (2016)
bull Policy area Energy
bull Policy options Improved energy performance for public buildings policies and support for energy performance contracts
bull Financial capacity Strong
bull Administrative capacity Strong
Context and policy overviewIn the early 1990s the Federal State of Berlin faced a tight budget and a lack of financial resources Energy-related costs were high (approximately euro255 million per year) and there was potential for average savings of around 30 per cent287
In 1994 the Berlin Senatersquos Department for Health Environment and Consumer Protection set a CO2
emissions reduction target by 2010 it aimed to decrease CO2 emissions across all sectors by 25 per cent relative to the levels seen in 1990 Moreover the Department introduced an updated Climate Protection Concept which set a CO2 emissions reduction target of 40 per cent by 2020 relative to the 1990 levels
In this context the Berlin Energy Saving Partnership approach was initiated in 1996 by the Berlin Energy Agency (BEA) and the Federal State of Berlin The approach provides a framework for the project management of retrofits and tender preparation for renovation works guaranteeing energy consumption reductions that are based on energy performance contracting (EPC)288
BEA is a public-private partnership between the government of the federal state of Berlin the development bank KfW Bankengruppe and private stakeholders BEA acts as the independent project manager facilitating and managing the process from baseline to contract negotiation289
287 See Berliner Energieagentur (2006) 288 Ibid289 See Citynvest (2015)
Case studies - energy and buildings
126
ImplementationThe necessary investments are made by a private energy service company (ESCO) the contractor and refinanced by the energy costs saved The contracting authority may combine a selection of its building stock into a so-called ldquobuilding poolrdquo which can be comprised of town halls schools swimming pools or administrative and service buildings BEA plays the role of project aggregator bringing together a number of buildings from four to as many as 150 which are then classified as a pool via an EPC tender This consolidation of buildings into packages encourages interest from multiple competent ESCOs and ensures good levels of competition and expertise
Since 1996 BEA has successfully launched and supervised 26 energy saving partnerships covering more than 1400 public buildings and more than 500 private properties in Berlin alone Contractors have so far invested in excess of euro50 million in energy retrofits Energy saving measures have included the renewal and optimisation of building energy and ventilation control systems the replacement of gas boilers and the installation of combined heat and power systems The Berlin Energy Agency accompanies energy saving partnerships from the conception of a project to the realisation of the energy performance contract and is also responsible for the monitoring process290
The energy contracting model is well established in Germany The public sector remains an important client group for EPC with significant ongoing potential for projects The overall market size for energy contracting has been estimated at more than euro4 billion with energy performance contracting representing around 15 per cent of this market The general suitability of public buildings is high due to stable patterns of use openness to longer contract durations (more than 10 years) and extensive experience of EPC in the German market At the same time the percentage of EPC projects in the private sector is growing with a strong focus on hospitals and healthcare but also significant activity in the services sector and industry EPC is less common in the residential sector due to a number of barriers such as the lack of a legislative framework the complexity of tenure and uncertainty with regard to estimating energy reductions291
Barriers and critical success factorsGermany has enjoyed a high level of political commitment to ESCO and energy efficiency projects The country has one of the most mature ESCO markets in Europe However the general legal framework for energy performance contracting in residential buildings is currently not very supportive292
290 See Berliner Energieagentur (nd b)291 See Boza-Kiss et al (2017)292 See Berliner Energieagentur (2019)
Case studies - energy and buildings
127293 See GEF and UNDP (2010) 294 See Berliner Energieagentur (2006)295 See Citynvest (2015)296 Ibid
Financing for projects is available including risk mitigation instruments which are backed by appropriate due diligence procedures and standardised processes With 50 per cent funding from the Federal State of Berlin BEA is able to make financially attractive offers to property owners BEA also helps to raise awareness among customers ESCOs energy auditors and so on
Moreover the energy saving partnership is not limited to large building complexes The grouping of smaller projects into pools means that transaction costs are reduced293
Berlin has considered developing an Energy Saving Partnership Plus concept aiming to extend partnerships to include building renovation and insulation measures such as heat insulation and window replacement Furthermore Berlinrsquos Energy Saving Partnership model has been transferred to other local authorities due to its low impact on the public balance sheet and its moderate staffing requirements294
Results and lessons learnedThe Energy Saving Partnership has proven to be a successful model for reducing energy consumption and improving efficiency in the cityrsquos public buildings Outcomes include the following
bull Over the first fifteen years of the programme the average annual investment was euro35 million which supported energy efficiency measures in an average of nearly 100 buildings per year295
bull The scheme delivered an average of 26 per cent savings in energy costs for building owners with some individual schemes achieving savings as high as 40 per cent296
The Berlin experience demonstrates the potential of energy performance contracting to delivery substantial energy savings However it also highlights the challenges faced by municipalities seeking to deliver energy efficiency investments without additional financial support from a higher-tier authority
Links to similar initiativesStuttgart ESCO market Czech Republic ESCO market Slovenia ESCO market European ESCO market
Case studies - energy and buildings
128
Snapshot
bull Location Seoul South Korea
bull Population Large ndash 99 million (2018)
bull Policy area Energy and buildings
bull Policy options Policies promoting renewable electricity generation improved building energy codes and labelling financial incentives or financial support schemes for green investments
bull Financial capacity Strong
bull Administrative capacity Strong
Context and policy overviewFollowing the Fukushima nuclear disaster of 2011 the Seoul Metropolitan Government (SMG) launched a two-stage ldquoOne Less Nuclear Power Plantrdquo initiative in 2012 with the aim of reducing energy consumption and increasing renewable energy production Through
the first phase which ran from 2012 to 2014 SMG reduced energy demand by 2 million tonnes of oil equivalent (toe) corresponding to the annual generation capacity of one nuclear plant
The second stage of the initiative targeted the transition of around 4 million toe of energy to renewables As part of these efforts in November 2017 SMG developed the 2022 Solar City Seoul plan to accelerate solar installations
Through this plan SMG has strived to expand the citywide deployment of solar energy units on public buildings By 2022 it hopes that solar panels will generate a total of 243 MW across all suitable public buildings and land in Seoul297 In addition to the work on municipal buildings SMG plans to expand the residential solar market by adding 551 MW of solar capacity to one million households including 540000 apartment balconies 90000 rental homes and 370000 buildings Other initiatives such as solar landmarks and smart energy districts are to increase the target to 1 GW298
Solar City Seoul Seoul South Korea
Seoulrsquos metropolitan government plans to deploy 1 GW of solar photovoltaic power for residential and municipal buildings By 2022 every public building and one million homes in the city are set to be solar-powered thanks to the Solar City Seoul project
297 See The Korea Times (2018)298 See Seoul Metropolitan Government (2017)
Case studies - energy and buildings
129
ImplementationSMG provides a number of incentives to households to facilitate the uptake of solar energy For instance it was the first municipality in South Korea to pay a city-level subsidy for small solar power plants with an output of 50 kW or less since the nationwide feed-in tariff was abolished in 2011 due to the related fiscal burden Subsidies are in place for the installation of mini-solar panels reducing the upfront cost by 80 per cent In addition SMG launched the Energy Self-reliant Village programme in 2012 attempting to inspire a shared vision of energy self-sufficiency in urban and rurual communities
Furthermore in 2015 SMG set up a government-backed fund called the Solar Power Generation Citizensrsquo Fund for solar projects Residents of Seoul can subscribe to the fund to earn a guaranteed annual return of 4 per cent Land rental concessions are also available to solar power cooperatives installing photovoltaic (PV) systems in unused spaces
that are leased from SMG at low rental rates299 In addition since 2018 newly built public apartments have been required to install a mini PV facility and existing apartments have continued to receive an installation subsidy
In order to promote the concepts developed for Seoul SMG plans to create solar energy landmarks and special solar energy districts that it can market as tourist attractions SMG also plans to transform Magok a western neighbourhood of the city into a smart energy district by promoting an urban energy paradigm in cooperation with Korearsquos major energy firms Moreover SMG has launched various information and training campaigns to promote solar energy
bull The Sunshine City Seoul campaign was developed during the first stage of the One Less Nuclear Plant programme
bull The Seoul Solar Map was developed to show the potential capacity for solar power in buildings and houses
bull Seoul organised school campaigns in which students were selected to be leaders in energy-saving and volunteering activities
bull The city established the Seoul Energy Dream Centre that would achieve 100 per cent energy self-sufficiency and serve as a learning centre for students and other residents
bull The Seoul Solar Expo which took place in August 2018 and was free to attend invited solar energy companies to exhibit and held a solar design competition along with various hands-on events300
Lastly in 2018 SMG set up support centres called Seoul Solar Centres which provide one-stop services for installation and maintenance Free consulting services will be provided as well as a School for Energy Start-ups which will provide training for people who want to set up a solar energy business301
299 See LEGCO (2017) 300 See Seoul Metropolitan Government (2018b)301 See Seoul Metropolitan Government (2018a)
Case studies - energy and buildings
130
Barriers and critical success factorsVarious factors have made the solar city plan a success including the following
bull The topping up and subsequent replacement of national subsidies with alternative sources of finance (such as subsidies and grants rental concessions for cooperatives) have incentivised the deployment of solar plants in residential buildings
bull The identification of sites suitable for solar plants such as public landmarks parking lots villages and districts in cooperation with energy companies has promoted Seoul as a role model for other cities and supported tourism
bull SMG has introduced solar mandates for new multiple-unit dwellings and commercial buildings helping to accelerate the deployment of solar panels
bull SMG has visibly demonstrated the cityrsquos commitment to renewable energy It has provided information for residents through a range of mechanisms such as school programmes expos design competitions support centres and training for start-ups all of which have supported residential solar PV installations
Results and lessons learnedCurrently 127 public buildings in Seoul have a total installed capacity of 38 MW 17 infrastructural facilities have a combined capacity of 38 MW 43 schools have a joint capacity of 18 MW and 12 MW of capacity has been installed on public parking lots In addition as of September 2018 a total of 161000 households had installed the PV facilities thereby generating a total of 210 MW annually
Including the new supply of 52 MW of solar power installed in 2018 and a total installation capacity of 210 MW the Solar City Seoul project has generated 237805 MWh of annual energy It has also reduced
greenhouse gases by 109 tonnes of CO2 and fine particulate matter by 276 tonnes This means that by the end of 2022 the cityrsquos capacity will need to be raised by a further 760 MW approximately in order to meet the projectrsquos 1 GW target
In 2019 Seoul was selected as the winner in the renewable energy category of the annual C40 Cities Bloomberg Philanthropies Awards in particular due to its efforts to become a global solar city
Links to similar initiativesToronto coal phase-out Porto Alegre local renewables Bristol smart energy policy
Case studies - energy and buildings
131
Snapshot
bull Location Tokyo Japan
bull Population Large ndash 135 million (2015)
bull Economy Service economy
bull Policy area Energy and buildings
bull Policy option Policies and support for energy performance contracts
bull Financial capacity Strong
bull Administrative capacity Strong
Context and policy overview302
Commercial and residential buildings in Tokyo accounted for more than 72 per cent of the cityrsquos CO2 emissions in 2013 This was primarily as a result of the high number of small to medium-sized commercial and industrial facilities (around 660000) that are concentrated in the city
The Tokyo Metropolitan Government (TMG) has set an interim GHG emissions reduction target of 30 per cent by 2030 which has subsequently been accelerated in the cityrsquos Environmental Masterplan to 38 per cent by 2030
Against this backdrop the programme of Carbon Reduction Reporting for Small and Medium Entities (CRR) was launched in 2010 with two core objectives
bull encouraging the owners and tenants of small to medium-sized commercial and industrial facilities to monitor their annual CO2 emissions
bull providing policymakers with data on the building stock and providing this back to building owners and the market
These goals are pursued by mandating for facility owners the submission of an annual report outlining CO2 emissions for the previous fiscal year Additional qualitative information on planned and implemented emissions reduction measures must also be submitted
Carbon reduction reporting programme Tokyo Japan
Tokyorsquos carbon reduction reporting programme mandates the reporting of CO2 emissions for small and medium-sized facilities which account for 60 per cent of total CO2 emissions in the cityrsquos industrial and commercial sectors
302 See C40 Cities (2017)
Case studies - energy and buildings
132
There is no single GHG emissions reduction target for the programme Instead reporting entities are encouraged to set individual emissions reduction targets Reports are publicly disclosed on the TMG website
The CRR contains both a mandatory and a voluntary component Reporting occurs as a regulatory obligation and as a voluntary measure to monitor CO2 emissions and allows facility owners to compare their performance to that of their peers
Implementation The CRR was launched in 2010 The scheme is based on the Tokyo Carbon Reduction Reporting Programme for existing large facilities which ran from 2002 to 2005 That programme was superseded by the mandatory cap-and-trade system also launched in 2010 The core metric by which facilities monitor and report their annual CO2 emissions is carbon intensity (kgCO2msup2)303
The CRR seeks to target owners of the roughly 660000 facilities in the metropolitan area For these facilities the threshold for mandatory reporting has been set at between 30 litres and 15 million litres of crude oil equivalent The reporting requirement also applies to businesses that own or operate multiple facilities with a total consumption exceeding 3000 million litres of crude oil equivalent Facilities with a consumption higher than this level are expected to participate in the citywide cap-and-trade programme304
In 2012 a low-carbon benchmark component was added after it became apparent that merely reporting would not be sufficient to motivate facility owners and tenants to reduce their energy consumption Benchmarks allow owners to determine how their facility currently performs relative to the mean performance of other buildings of the same type Later a Carbon Report Card initiative was added to enable prospective tenants to compare the energy and CO2 emissions performance of buildings305
The CRR provides a variety of incentives to both encourage participation in the programme and spur implementation of retrofitting measures
bull A programme participation certificate ndash the so-called PR Sheet ndash has proved to be a major incentive for voluntary participation
bull Small and medium-sized leased buildings that report consistently for more than three years and perform better than the average CO2 intensity benchmarks can earn the label ldquoLow Carbon Model Buildingrdquo
bull Advice and training on low-energy strategies is provided through free energy audits in-company training sessions with expert trainers and industry-specific courses on energy saving measures
bull Subsidies for energy saving equipment are available including a green leasing scheme and tax incentives for energy saving initiatives306
Improvements in emission reductions have not been uniformly significant across all building types For instance schools universities and entertainment venues have achieved significantly lower reductions
The programme has been notable in attracting many voluntary submissions This has improved the validity of the resulting industry benchmarks Approximately 93 per cent of CO2 emissions in reporting facilities are related to electricity use hence most emission reductions can be attributed to a decrease in electricity consumption Emission reductions observed over the period 2010-13 are largely attributable to the rationing of electricity caused by the closure of the Fukushima power plant However emissions have not rebounded since the full restoration of power supplies It should be noted that the increase in the carbon intensity of electricity has been largely due to the shift from nuclear to gas and coal307
303 See Nishida (2013)304 See Tokyo Metropolitan Government (2018)305 Ibid306 Ibid307 See C40 Cities (2017)
Case studies - energy and buildings
133308 Ibid 309 Ibid 310 See C40 Cities (2017)311 Ibid
The CRR used multiple strategies to increase the educational value of data collected through annual reports and thus to motivate enterprises to pursue improved energy efficiency308
bull The low-carbon benchmarks provide building owners and tenants with an overview of how their facility is performing compared to industry averages
bull The Carbon Report Card aims to encourage facility owners to improve their annual benchmark performance and to use report cards as green building labels
bull A series of tailored energy efficiency handbooks were provided to key industry leaders and aimed at facility supervisors in 27 types of business
The TMG has created several partnerships with key industry stakeholders to enable the recruitment of reporting institutions It has also reached out to corporate real estate agencies to secure their cooperation in raising tenantsrsquo awareness of CRR
Data verification is carried out by TMG including checks on previous energy consumption levels and CO2 emission reports (to check for anomalies year on year) Reporting organisations are contacted when errors are identified and data problems are rectified Additional verification is also carried out before the reports are made publicly available309
Barriers and critical success factorsLandlords have faced challenges in obtaining the relevant energy data from tenants to comply with reporting requirements This was addressed by a rule change allowing the publication of only CO2 emissions intensity (not of actual consumption) and allowing building owners to provide estimates where actual data was not readily available
TMG officials were unable to achieve widespread disclosure of energy consumption data due to industry
resistance Public disclosure of energy consumption figures would deliver a more positive and meaningful message than data on CO2 emissions
Despite the strategies taken to increase awareness and participation a 2015 survey of 1149 small and medium-sized enteprises found very low levels of awareness about some of the additional initiatives related to the CRR Officials have also encountered challenges in engaging corporate tenants with energy efficiency issues In addition many recommendations provided in free energy audits are not implemented due to the splitting of incentives between owners and tenants TMG officials have collaborated with real estate agencies to conduct tenant seminars on CRR participation and effective energy efficiency measures310
Results and lessons learned311
bull The number of organisations participating in the voluntary reporting scheme grew by 60 per cent over the five years from 2010 to 2015
bull Over a five-year period the companies reporting achieved an average CO2 emissions reduction of 13 per cent and cut energy use by 18 per cent
bull The reports provide a valuable database of energy efficiency measures being taken by SMEs For example they identify high penetration levels in terms of low-energy lighting water saving devices and cooling-loss reduction for refrigerated food displays Reports cover both physical measures and behaviour change initiatives
Links to similar initiativesTokyo cap-and-trade programme Carbon disclosure project
Case studies - energy and buildings
134
Snapshot
bull Location Tartu Estonia
bull Population Small ndash 101000 (2000)
bull Economy Industrial economy
bull Policy area Energy and buildings
bull Policy option Decarbonisation of district heating supply
bull Financial capacity Strong
bull Administrative capacity Strong
Context and policy overviewEstoniarsquos energy system is dominated by the use of shale oil for electricity while heating is provided by a mix of sources including local biomass and imported fossil fuels312 Meanwhile around 45 per cent of heating demand is met through district heating networks313
The country is committed to reducing carbon emissions through its adopted National Energy and Climate Plan 2030 The plan includes a commitment to reduce carbon emissions by 70 per cent by 2030 relative to a 1990 baseline and to ensure that renewables account for 42 per cent of final energy consumption314 Meanwhile the National Development Plan of the Energy Sector sets a target for 80 per cent of heat to be derived from renewable sources by 2030315
The city of Tartu is served by a fity-year old district heating network and a five-year old district cooling network The privatised network serves around 75000 customers and is owned and operated by Fortum Tartu The city and the network operator have carried out multiple innovations to improve energy efficiency air quality carbon emissions and customer satisfaction316
ImplementationTartursquos district heating system was established in 1967 and owned first by the state and then by the municipality Originally powered by gas and oil the network was converted in 1995 to use biomass
District heating and cooling Tartu Estonia
Tartu Estoniarsquos second-largest city has managed to upgrade its old district heating network and turn it into a world-class system that uses local renewable energy sources
312 See Groszlige et al (2015)313 See Government of Estonia (2017)314 Ibid 315 Ibid316 See Raud (2019)
Case studies - energy and buildings
135
and peat with financing from the World Bank and the EBRD In 2000 the system was privatised and then acquired by Fortum Tartu in 2004 The privatisation provided the network with access to much-needed capital to carry out a systemwide renewal and to support network expansion317
The municipal government has supported the district heating network through its planning policies and through securing funding for smart city innovation The first urban development master plan for Tartu was established in 1999 and focused on sustainable development It included an integrated district heating zone to improve air quality and customer satisfaction levels The city council raised awareness in support of the district heating system through public campaigns The plan mandated that all new and renovated buildings in the designated districted heating zones should connect to the heating network unless their heat consumption was less than 40 kWhmsup2 per year Meanwhile a smart city project financed by Horizon 2020 helped to target investment to retrofit energy-inefficient homes and connect them to the heating network318
Fortum Tartu has implemented a number of business and operational innovations to sustain the performance and financial stability of the company These include319
bull vertical integration and diversification allowing the firm to become a biomass fuel producer and supplier
bull development of a new biomass combined-heat-and-power plant
bull growth through the expansion and acquisition of a nearby heating network operator
bull development of a low-carbon district cooling network partially supplied from the Emajotildegi River which runs through the centre of the city
Most recently Fortum Tartu has participated in a low-temperature innovation pilot which has demonstrated the potential to reduce system flow temperatures from a peak of 105degC to as low as 60degC achieving a significant reduction in losses and creating the potential to capture low-grade heat from industrial and other local sources of waste heat320
Barriers and critical success factorsA number of success factors have enabled Tartu to develop and sustain its district heating and cooling system321
317 See Galindo Fernandez et al (2015)318 Ibid 319 Ibid 320 See Raud (2020)321 See Galindo Fernandez et al (2015)
Case studies - energy and buildings
136
322 See ERRee (2020)323 See Galindo Fernandez et al (2015)
bull Privatisation has enabled the city to access investment capital and international know-how to renew and expand its district heating network and diversify operations to include district cooling and a fuel supply business
bull A strong national policy framework for district heating clarifies roles for effective operations while pricing market regulations enable the operator to maintain a financially sustainable business
bull The local policy framework integrates development planning and energy planning to encourage higher density development and to connect new developments to the heating network
A culture of partnership and innovation has characterised the relationship with the city supported by multiple EU investment and research programmes This culture will be critical to supporting the cityrsquos recently announced goal of reducing its carbon emissions by 40 per cent by 2030 relative to 2010 and of becoming carbon neutral by 2050322
Results and lessons learned
bull The district heating network supplies around 50 per cent of the cityrsquos buildings and 75 per cent of its residents
bull The price of district heating is lower than the national average
bull The network has reduced its carbon footprint to 102gMWh per year323
Links to similar initiativesVancouver district heating system Copenhagen district heating and cooling system Paris Saclay smart district heating and cooling system
Case studies - energy and buildings
137
Sustainable eco-districts Malmouml Sweden
Malmouml has regenerated its urban area by converting disused sites such as former shipyards and other heavy industry zones into sustainable low-carbon districts
324 See Fitzgerald (2016)325 See Smedby (2015)
Snapshot
bull Location Malmouml Sweden
bull Population Medium-sized ndash 316000 (2018)
bull Policy area Energy and buildings
bull Policy options Improved codes for building energy and better labelling policies promoting renewable energy generation
bull Financial capacity Strong
bull Administrative capacity Strong
Context and policy overviewIn the late 1980s and early 1990s Malmoumlrsquos industrial centre lost one-third of its jobs but today the city is a vibrant and sustainable urban area The heart of this transformation is Western Harbour an eco-district and regeneration zone The area was developed as a testbed in the cityrsquos ambitious plans to become climate-neutral by 2020 and to run entirely on renewable energy by 2030 The mayor envisioned using the eco-district concept as a model for future sustainable urban development throughout the city
And with a blank slate ndash a restored brownfield site ndashplanners could integrate all aspects of Malmoumlrsquos sustainability approach into the eco-district324
In Sweden the energy performance of buildings is regulated at the national level However Malmouml has developed several policy instruments to meet the cityrsquos climate and sustainability goals One example of these instruments is the ldquoDeveloper Dialoguerdquo which involves different stakeholders in the planning process Malmouml has also worked with the city of Lund to set sustainability requirements that exceed national regulations for new building developments It has achieved this through a voluntary programme called MBP South in which developers can choose between three levels of ambition325
ImplementationThe objective for the Western Harbour eco-district was to reduce energy consumption to 105 kWhmsup2 This is equivalent to half the energy consumption of Malmoumlrsquos current housing stock and below the nationally required levels for new construction
City planners invited a variety of stakeholders including architects developers and construction companies to submit development plans and hold
Case studies - energy and buildings
138
326 See Kanters and Wall (2018)327 See Fitzgerald (2016)
discussions to establish building sustainability standards for Western Harbour Building standards were established for energy materials systems technology acoustics and noise green space and biodiversity moisture control and the indoor environment326
In the second phase of the project participatory planning ndash which goes beyond conventional stakeholder consultation processes ndash was used to bring parties together to shape the approach to energy efficiency The process involved a combination of site visits and workshops and cooperative design processes to set standards for new buildings
Sustainable urban mobility was another key policy objective for the district with a combination of car restrictions and measures to support walking and cycling The district boasts a 40 per cent modal share for cycle-based journeys to work
Following the development of Western Harbour the eco-district concept was replicated in the planning of further projects through Developer Dialogues These are held to enhance the sustainability profile of prospective eco-districts Malmoumlrsquos city planners applied the eco-district approach to redevelop lower income neighbourhoods such as Rosengaringrd a social housing area with a history of significant social conflict This project aimed to demonstrate how a troubled neighbourhood can be redeveloped with a focus on environmental sustainability and increased social and economic integration with the rest of the city327
Barriers and critical success factorsIn Malmouml political ambition and leadership is strong and goals are set at a high level The city departments cooperate with each other as well as with developers universities and other organisations Malmouml is committed to and has been working towards sustainability for a long time
Experimentation supported by cross-departmental collaboration and dialogue with developers has been key to promoting innovation in planning For example project managers from the environment and planning
departments meet on a regular basis to discuss the delivery of more integrated projects
The fact that the city owns most of the land means that it has considerable power to impose standards on developers Swedish cities also benefit from significant national and EU funding to support climate action
In terms of programme design MBP South gives building developers a choice between three different levels of ambition In contrast similar sustainability programmes in Sweden set only one level of requirements Moreover administration of the
Case studies - energy and buildings
139
programme has been efficient due to the relatively large size of the municipality and the fact that it developed the programme jointly with another municipality
Results and lessons learnedMalmouml has been successful in reducing energy consumption cutting GHG emissions and making the urban area more liveable for residents
bull The city lowered energy consumption from 72 kWhm2 to 65 kWhm2 for a development using MBP South without the Developer Dialogue and to 56 kWhm2 for a development using MBP South with the Developer Dialogue
bull Due to Malmoumlrsquos action and the decline of the shipbuilding industry per capita GHG emissions have fallen to 34 tonnes per year (compared to 56 tonnes in Sweden as a whole and 176 tonnes in the United States of America in 2010)
bull The eco-districts have contributed to economic growth social innovation and inclusion in the city making Malmouml an attractive place to live
While external factors such as funding opportunities and land ownership by the city were favourable to Malmouml much of the cityrsquos success is thanks to effective urban planning and these lessons can be applied anywhere The experience in Malmouml demonstrates that experimentation is key to innovation in planning It also shows that the formalisation of learning across departments can ensure that a city addresses obstacles to cooperation and institutionalises good practices
Links to similar initiativesPortland eco-districts Ulaanbaatar eco-districts
Case studies - water
140
Snapshot
bull Location Yerevan Armenia
bull Population Large ndash 11 million (2016)
bull Policy area Water
bull Policy option Regulation and contracting of public and private service providers
bull Financial capacity Strengthening
bull Administrative capacity Strengthening
Context and policy overview In recent years Armenia has seen major achievements in relation to water resource management to which the private sector has made significant contributions Previously Armenia had lagged behind European countries in terms of the non-revenue water ratios water accessibility and supply328
Yerevan the capital of Armenia is the largest and most populous city in the country In the 1990s Yerevanrsquos water utility company the Yerevan Water and Sewerage Enterprise (YWSE) struggled financially and had a poor water system which was unable to supply water efficiently to city residents Fee collections were only around 20 per cent and revenue did not cover operational and maintenance expenses The majority of customers (80 per cent) connected to the network could only access tap water for between 2 and 8 hours a day Meanwhile approximately 72 per cent of water in the network was lost through identified leakages across the system329
ImplementationIn 2000 the government of Armenia sought private input via a competitive tender to improve the provision of water services Through the tendering process the government commissioned Acea Spa Utility (Acea) a joint venture led by an Italian water operator to run the water utility system for five years330 The appointment was designed to bring in private sector expertise
Private contracting in the water sector Yerevan Armenia
Yerevanrsquos water utility signed a five-year performance-based management contract with private operator Acea Over the contract period water supply collection rates and energy efficiency improved
328 See World Bank (2018)329 See Energy Sector Management Assistance Program (2011a)330 See Eiweida and Tokhmakhyan (2011b)
Case studies - water
141
331 Ibid332 See Eiweida and Tokhmakhyan (2011b)
to handle the water distribution network efficiently An investment fund was created by the government and the World Bank in order to manage Acearsquos capital investment for water utility services With the aim of enhancing the water utility system Acea created a programme to repair leaks increased the gravity-fed water supply fixed pumping stations introduced meters and stabilised water pressure across the networks of three districts These developments cost US$ 24 million and strengthened the water network across Yerevan
There are differing degrees of private-sector participation (PSP) in the water sector These can include minor outsourcing of non-core activities or private concession contracts where investment obligations and revenue risks are fully transferred to private operators The performance-based contract introduced in Yerevan represented a moderate first step in terms of increased PSP with only minor risks transferred to private contractors which are linked to performance incentives However it was a first step that brought sector expertise and well-defined performance incentives into the cityrsquos water services It also helped to build capacity and experience of private contracting for the relevant water authorities This experience later paved the way for wider and deeper PSP in the Armenian water sector
Barriers and critical success factorsPolitical support and commitment by policymakers helped the public-private partnership (PPP) with Acea to succeed Both the government and the operator demonstrated a willingness to resolve issues and agree on common benefits PPPs are a way to resolve some water sector challenges but are not the only tool that policymakers have In order to benefit from the private sector policymakers need to create a business environment that facilitates private-sector involvement with a reasonable legal and regulatory framework331
In Yerevan several measures were taken to ensure strong results These included performance targets incentive mechanisms and an efficient selection process for procuring a contractor Government and
city officials together with Acea discussed progress and challenges to ensure that appropriate measures were taken
A key lesson learned from the project was the importance of obtaining an accurate baseline for system performance before setting contractual performance targets The projectrsquos failure to meet targets for non-revenue water ratios was linked to the use of inaccurate baseline values332
A significant part of the projectrsquos success was the joint effort by the government and Acea to gain public acceptance for the work This entailed early improvements to services before the introduction of tariff increases
Case studies - water
142
Results and lessons learnedYerevanrsquos experience is an example of a well-implemented PPP scheme using performance-based contract incentives It demonstrates that these delivery models can produce positive outcomes for cities if appropriately structured with an effective statutory framework in place More specifically between 2000 and 2004 Yerevan achieved the following improvements333
bull a significant increase in access to water with the availability of water increasing from 6 to 18 hours per day
bull an increase in fee collection from 20 to 80 per cent
bull a fall in electricity consumption by 30 per cent exceeding the initial target of 20 per cent
bull a stronger focus on sustainability improving the resilience of the network
bull a stronger financial performance due to reductions in energy use and water losses and a dramatic improvement in collection rates
bull a 10-year contract between the government and Veolia a French water company following the success of the project
The cityrsquos experience also illustrates the importance of transparent and predictable regulation as well as contract implementation by a competent public authority These are necessary not only to avoid disputes but also to ensure good bidding processes with strong competition between serious and competent companies that fully understand what they are bidding for and feel comfortable with the regulatory environment
Lastly Yerevanrsquos experience with performance-based management contracting demonstrates the need to have realistic expectations about the scale and pace
of reforms in the water sector Sustainable changes to a system require time to take effect
Links to similar initiativesAmman private-sector participation in the waste sector Iasi water tariffs and governance improvements Kirklees performance contracting in the waste sector
333 See International Bank for Reconstruction and Development and World Bank (2017)
Case studies - water
143
Snapshot
bull Location Madaba Jordan
bull Population Small ndash 105000 (2018)
bull Economy Service economy
bull Policy area Water
bull Policy options Regulation and contracting of public and private service providers reform and strengthening of water utilities effective tariff reforms and price signals
bull Financial capacity Limited
bull Administrative capacity Limited
Context and policy overviewHigh levels of population growth in combination with climate change and droughts had a strong impact on Jordanrsquos water supply in the 1990s and early 2000s334
Despite investment in the countryrsquos water sector the reduction in the percentage of non-revenue water (NRW) was disappointing The Ministry of Water and Irrigation documented national NRW rates as high as 66 per cent with only a slight improvement over time from 46 per cent in 2005 to 44 per cent in 2010 This NRW rate was due to both physical and administrative losses Old water pipelines pipe bursts poor service connections illegal tapping and incorrect water meter readings were just some of the reasons for the losses335
In addition the Water Authority of Jordan (WAJ) had experienced multiple challenges in service delivery and business administration Application processes and billing were often found to be incorrect and overall customer management was inefficient and unsatisfactory336
In 2004 the Ministry of Water and Irrigation proposed a set of policy measures to manage the NRW including a micro approach to private-sector participation This option was proposed to achieve
Micro private-sector participation Madaba Jordan
The administration of Madaba implemented a micro approach to private-sector participation to reduce the percentage of non-revenue water The contract addressed billing illegal use and the replacement and resealing of water meters In the seventh quarter the water system reached break-even
334 See Al-Karablieh and Salman (2016)335 See Baghdali et al (2013)336 Ibid
Case studies - water
144
service improvements in Jordan across the operation and management of the water network It was seen as a complementary approach that would prepare for more PSP schemes across the distribution of water services in Jordan
The WAJ defined its targets around improving financial performance through better management of water and wastewater stronger collection rates and improvements to customer service and management
ImplementationThe micro-PSP approach was implemented in Madaba from 2005 to 2011 The ministry chose Madaba as the city had a small customer base limiting complexity Households accounted for 94 per cent of this base while only 6 per cent of customers were industrial consumers In addition proximity to Amman would enable easier cooperation with WAJ headquarters and facilitate general transactions and logistics Moreover there was strong interest in the micro-PSP approach from local stakeholders337
A bidding process was set up for the micro PSP to manage billing and revenue collection and thus reduce the NRW ratio A workshop was arranged
to raise awareness and to give bidders as much information as possible The services that were expected of bidders included managing billing and revenue collection using a tool based on geographical information systems implementing a system for customer management and operating a database for the sewerage network in the region338
The contract specification included details of the required activities and levels of performance and was divided into two parts The first part considered the business processes of the company During this first stage business processes were to be updated to ensure use of the necessary systems and equipment The staff would also receive training The second part of the contract covered performance management In this stage the private company would carry out meter readings billing collection and customer service including inspections339
Under the contract terms the private company received a portion of the extra revenue collected each year in order to incentivise performance The contract also had clearly defined targets and indicators The Project Management Unit of the WAJ monitored the performance of the winning contractor Engicon an engineering consultancy firm
337 Rabi (2013)338 See Baghdali et al (2013)339 Ibid
Case studies - water
145
Barriers and critical success factorsThe micro-PSP project in Madaba was considered to be a success and it was scaled up and extended for three more years This enabled smaller local companies to participate in Madabarsquos water resource management bringing cash flow into the sector and saving water across the city The project has also influenced water and wastewater systems in other regions across the Middle East and the Gulf States Nevertheless Madaba experienced some challenges
bull It took more than two and a half years to start the programme
bull There was a reliance on external funding
bull A major concern was the availability of local private companies to take on key tasks outsourced by the WAJ340
Strong long-term results for the project depended on an integrated approach that ensured capacity-building to sustain a competitive local market in water services
Results and lessons learnedThe micro-PSP experience in Madaba yielded several results and key lessons On a general level micro-PSP effectively reduced costs and created a local market in which private companies could compete to provide important services across the water sector
The project brought a significant reduction in NRW through efforts in billing collection of water fees and the fixing of water meters By 2011 billed amounts had increased by 175 per cent relative to the level seen in 2005 There were nearly 3000 reported cases of illegal water use between 2006 and 2011 Over the same period more than 22000 water meters were resealed and 14000 replaced341
In 2008 the total annual additional income achieved reached approximately euro2 million (excluding tariff increases or revenues from new customers) This represented a significant increase compared to total revenue of less than euro12 million in 2005 In fact
cash collections doubled across the period 2005-08 After one year the additional income from the project exceeded the cost of the investment This helped to strengthen the overall financial performance of the WAJ342
Compared to large-scale PSP models the micro-PSP scheme requires less funding and the preparatory phase tends to be shorter (although detailed preparation may be necessary where local capacity is limited) In the case of Madaba the scheme managed to monitor control and assess reduction levels through incentives capacity-building and awareness-raising343
These results and the new customer service arrangements built confidence in the system This was a crucial step towards gaining public acceptance and trust which contributed to a fall in the illegal consumption of water
Links to similar initiativesIasi water tariff and governance improvement Singapore water metering and billing Johannesburg reduction of water losses
340 See Baghdali et al (2013)341 Ibid 342 Ibid343 See Rabi (2013)
Case studies - water
146
Snapshot
bull Location Drakenstein South Africa
bull Population Small ndash 224000 (2015)
bull Economy Service economy
bull Policy area Water
bull Policy options Effective tariff reforms and price signals awareness campaigns for households and industry promotion of resource-efficient utilities
bull Financial capacity Strengthening
bull Administrative capacity Strengthening
Context and policy overview The Drakenstein municipality in South Africarsquos Western Cape province had long experienced water shortages These peaked in 1999 when the water supply could no longer meet demand which was growing at 35 per cent a year This pressure was predominantly due to the high ratio of non-revenue
water (NRW) at 33 per cent of total supply Approximately 90 per cent of the municipalityrsquos water had to be purchased from the city of Cape Town while Drakenstein derived only 10 per cent from its own sources344
Following the 1999 water crisis the municipality had to take remedial measures While Drakenstein faced a great challenge the crisis was also a major opportunity to strengthen the municipalityrsquos water resource management The remedial measures focused on reducing water imports by cutting consumption and minimising wastage
A water demand management programme was introduced to address the crisis The scheme aimed to reduce the high percentage of NRW reduce the level of daily demand and conserve water345
More specifically the programme focused on six main targets
bull decreasing the high proportion of non-revenue water
bull stabilising water pressure
Management of water demand Drakenstein South Africa
A programme of water demand management in Drakenstein achieved a two-thirds reduction in the percentage of non-revenue water over two years boosting municipal revenue
344 See Drakenstein Municipality (2013) 345 See 2030 Water Resources Group (2015)
Case studies - water
147
bull managing average daily demand
bull strengthening financial performance by boosting fee collection
bull improving service to residents and other consumers
bull conserving water
ImplementationThe programme included wide-ranging interventions such as
bull improving the master plan for the reticulation network through hydraulic modelling
bull metering abstraction points and properties
bull supplying water at a low cost while imposing penalties on heavy users through tariffs
bull advertising water scarcity to raise public awareness including the promotion of water-saving devices and plumbing repairs
bull improving leaks and making repairs across the network infrastructure
bull developing a pressure management system
Identifying water leaks across the reticulation network was an important step in reducing water loss This was complemented by an ambitious policy to repair all leaks within an hour of their identification resulting in one of South Africarsquos lowest levels of physical water leakages Poor-quality pipes were replaced with high-quality equivalents and stainless-steel fittings reducing the number of pipe bursts
Works were also carried out on advanced management of pressure The pressure management installations included work on valves pipes chambers and controllers Seven pressure reduction valves that ranged from 100 mm to 300 mm in diameter were equipped with flow-modulated electronic controllers in order to achieve advanced pressure reduction
The works totalled around US$ 500000 but within five months that cost had been covered by the savings achieved
Barriers and critical success factorsThe project gained a high level of support within the community This was partly due to the creation of local jobs through the use of labour-based construction methods in conjunction with extensive local stakeholder engagement
Moreover in order to create a reliable collection and storage system for water the municipality introduced a water treatment programme This enabled a steady supply of water in the region regardless of season and rainfall A feasibility study that examined Drakensteinrsquos water supply management proposed the development of a water treatment plant for the Paarl Mountain dam because a related network for distribution had already been established The study also proved that significant savings could be made by creating a water treatment plant instead of buying water from Cape Town346
346 See AVK International (nd)
Case studies - water
148
Results and lessons learnedDrakenstein achieved its targets for water demand management Overall the municipality now ranks among the best in South Africa with regard to efficient use of water347
The unacceptably high level of non-revenue water was cut from 33 per cent to just 11 per cent over a period of 12 years boosting municipal revenue The combination of a new block tariff structure and reduced spending on water purchases from the city of Cape Town increased the net revenue and outweighed the costs of previous measures taken despite a decrease in the volume of water sold to consumers348
Water demand decreased from 17800000 msup3year to 11900000 msup3year This resulted in significant
savings on water purchases from suppliers and the fulfilment of targets for water conservation349
Notably the performance indicator for physical leakage (ILI) had decreased to below two by 2012 making it one of the lowest levels in South Africa and demonstrating the impressive water savings that all of Drakensteinrsquos interventions had achieved Across the 12-year period of the project total savings exceeded euro70 million No single intervention resulted in this outcome Instead it was the combined effect of many smaller interventions that brought eventual success This has also been the case in the majority of other municipalities in South Africa350
Links to similar initiativesSingapore water metering and billing Johannesburg reduction of water losses Madaba micro private-sector participation
347 See Drakenstein Municipality (2013)348 See 2030 Water Resources Group (2015)349 Ibid 350 Ibid
Case studies - water
149
Snapshot
bull Location Chennai India
bull Population Large ndash 7 million (2011)
bull Policy area Water
bull Policy options Regulation and contracting of public and private service providers reform and strengthening of water utilities effective tariff reforms and price signal
bull Financial capacity Limited
bull Administrative capacity Strengthening
Context and policy overviewThe city of Chennai in southern India has been experiencing water scarcity due to rapid population growth and a rising demand for energy following higher levels of economic activity This water crisis presented the Chennai Metropolitan Water Supply and Sewerage Board (CMWSSB) with the challenges of supplying water efficiently to residents while also ensuring that the local economy and industry were not compromised351
Over several years city officials passed a set of regulations and bylaws to stabilise and manage water sourcing and use These aimed to ensure maximum reuse of water and to see that wastewater met the safe quality standards required by the city The new regulatory framework was complemented by partnerships between the private sector and governmental agencies in order to promote innovation
The water crisis peaked in June 2019 when Chennai declared ldquoDay Zerordquo marking the depletion of water across all of the cityrsquos four main reservoirs Water was being tankered (or transported via train) from unregulated sources at high costs and to the detriment of rural farming communities352
ImplementationIn order to address the rising scarcity of water changes to legislation were made over many years leading up to 2019 The CMWSSB implemented a water reuse plan and the Greater Chennai Corporation set up a bylaw covering compulsory recycling of wastewater that applied to all stakeholders including government authorities the private sector and citizens These rules stated that all developers should include wastewater recycling in their designs that water should go through organic filtration for
Water and wastewater recycling Chennai India
Rapid population and economic growth have caused increasing water scarcity in Chennai In response the city has taken measures to accelerate the reuse of water and wastewater
351 See International Water Association (2018)352 See Trivedi and Chertock (2019)
Case studies - water
150
353 See International Water Association (2019)354 See Raghavan (2019)355 See International Water Association (2019)356 Ibid 357 See Natarajan (2020)358 See Alam et al (2019) 359 See Raghavan S (2019) 360 See International Water Association (2018)
groundwater recharge (except water from toilets which would go through the sewerage network) and that toilet flushing should use recycled water In 2002 the CMWSSB implemented a rainwater harvesting programme under which new or renewed water and sewerage connections had to include systems for harvesting rainwater353 Chennai is one of the first cities in India to have educated residents on the importance on rainwater harvesting354
Another priority area for the city has been energy efficiency In 2010 CMWSSB commissioned six sewage treatment plants The plants capture and use biogas to power most of their electricity demand355
Another priority has been zero discharge Industries and manufacturers are now under legislation that requires them to achieve zero liquid discharge from their operations Wastewater should not be discharged and should be treated for reuse For example the CMWSSB treats wastewater and sells it to major industries across the city356
Since ldquoDay Zerordquo the CMWSSB has committed to a variety of further measures to reduce the risk of future water crisis events including357
bull reuse of wastewater by expanding the number of treatment plants in Chennai
bull decentralisation of water sources with a focus on smaller lakes
bull an increase in the number of water supply schemes reducing reliance on tankers
bull the provision of sewer connections to new areas
bull the collection of sewage from areas where there is no underground sewerage network
bull monitoring of groundwater levels
bull GIS mapping of the water supply network
bull engaging manual scavengers in other work
bull upgrading the CMWSSB quality assurance laboratory
Results and lessons learnedIntegrated water resource management is necessary to achieve long-term resilience as a single intervention would be too simplistic358
bull Through mandatory rainwater harvesting Chennai has improved its water quality and groundwater levels have increased significantly359
bull Chennai has met 15 per cent of its water demand through water recycling while 8 per cent of treated wastewater is sold to industries Moreover some 40 per cent of domestic water demand in newly built houses is met through wastewater reuse360
bull Improvements to sewerage networks as a resulting of reduced pressure due to more rainwater harvesting and in situ wastewater reuse systems have saved water across the network
bull Electricity imports and GHG emissions have fallen due to the use of biogas for energy production The public-private partnership scheme has reduced dependence on the electricity grid by approximately 77 per cent
bull Innovation in wastewater treatment has been incentivised as new markets in this area have been created
Links to similar initiativesDurban water recycling Aqaba wastewater reuse Namibia wastewater reclamation
Case studies - water
151
Snapshot
bull Location Zaragoza Spain
bull Population Large ndash 663000 (2016)
bull Policy area Water
bull Policy options Awareness campaigns for households and industry effective tariff reforms and price signals
bull Financial capacity Strong
bull Administrative capacity Strong
Context and policy overviewZaragoza is located in the north of Spain It is a semi-dry area with moderate average rainfall (314 mm a year) In the 1990s a severe drought made the cityrsquos water shortages a distinct problem sparking public concern and political controversy361
In 1996 the NGO Fundacioacuten Ecologiacutea y Desarollo and the municipality jointly set up the Zaragoza Water Saving City programme to tackle water scarcityThe aim was to change wasteful behaviour and increase
efficient use of water The programme set an ambitious target of reducing domestic water consumption This included saving one million m3 of water a target that the programme successfully achieved within a year362
Water shortages in an urban context can be challenging to overcome However this project addressed shortages through financial incentives educational campaigns and multiple partnerships which secured funding from a variety of sources
ImplementationThe water-saving project comprised a wide range of measures
Media campaign In order to increase public awareness of the project Zaragoza ran a broad media campaign It featured advertisements on TV radio and public transport in addition to information on leaflets and posters The campaign achieved a high level of public awareness about the project
Educational outreach The programme used education to make people conscious of their own domestic water use and to prompt more efficient use of water and related technologies This outreach
Water-saving programme Zaragoza Spain
In 1996 the city of Zaragoza introduced a water efficiency programme to address water scarcity The programme included awareness-raising campaigns financial incentives and voluntary commitments by residents and businesses
361 See 2030 Water Resources Group (2015)362 See Kassam (2014)
Case studies - water
152
was later extended to schools to ensure that children understood the principles of efficient water use and why it is important to reduce water wastage By April 1998 168 educational establishments 428 teachers and 70000 students had participated directly in the campaigns educational programme363 The cost of the media campaign and educational outreach was around euro25 million between 2002 and 2010 The second part of the water saving project included a ldquo50 Good Practicesrdquo guide The guide identified measures for efficient water use by businesses covering water-related technology and behaviours in the cityrsquos green spaces buildings and industry364
Economic incentives The regional government gave discounts of 20 to 25 per cent to citizens purchasing water-efficient products In 2002 the Zaragoza city council also offered economic incentives for households to reduce their water consumption Residents who reduced their water use by 40 per cent or more in the first year of the scheme were entitled to a 10 per cent discount on their water bill A 10 per cent reduction in water consumption was also expected in the following years Water bills were redesigned to show clearly how each householdrsquos consumption compared to the levels in previous months365
Partnerships In order to ensure a range of options for customers the water-saving project partnered with businesses and companies that sold water-related technologies and products This allowed consumers to choose water-efficient products for their homes including for bathrooms and kitchens
Tariff reform Water tariffs have the ability to make water consumption fairer and more responsive to demand Revenues can be used to cover indirect costs in the water cycle and the direct costs of providing services366 In this case the following measures were under taken
bull the establishment of fair costs for consumers that correspond to the resulting benefits and services
bull a reasonably priced and accessible provision of water services to maintain affordability for vulnerable households
bull incentives for smart and efficient water use including financial incentives such as discounts on water bills tied to a reduction in household water consumption and higher rates for excessive water consumption
Infrastructure upgrade The programme also required significant upgrades to the water infrastructure in order to minimise leakages Approximately 16 per cent of the 1200 km pipeline network required upgrading The city also initiated pressure management controls and maintenance of leaking storage tanks in order to limit water loss367
Barriers and critical success factors368
The most significant factor contributing to the projectrsquos success was the change in consumer behaviour following effective public awareness campaigns and engagement Instead of promoting generic water-saving messages specific user groups were targeted with awareness-raising activities directly relevant to their business or lifestyle
363 See Edo et al (1998)364 See 2030 Water Resources Group (2015)365 Ibid 366 See SWITCH (2014)367 Ibid 368 Ibid
Case studies - water
153
The establishment of a central coordination unit also contributed to the success of the campaign The Zaragoza Water Commission ensured that there was a coherent approach to smart and efficient implementation and monitoring
A network of 50 volunteer ldquoaccomplicesrdquo was set up and free audits were offered to these non-residential water users to help implement water-saving measures This group included for instance a hospital a fish supplier and a swimming pool operator Subsequently as soon as positive results came in case studies of their success stories were circulated to other businesses369
Policy commitments and the supportive city council made the cityrsquos achievement possible through an increase in the available funding opportunities This also contributed to civic pride The authorities led by example providing a reliable efficient water and wastewater service
Results and lessons learnedOverall the Zaragoza project significantly reduced water use and enabled smart behaviour in relation to water consumption It achieved the following outcomes
bull The city decreased water use by almost 30 per cent within a 15-year period despite a 12 per cent increase in population over the same time frame Daily water consumption per capita fell from around 150 litres in 1997 to 99 litres in 2012370
bull The campaign enlisted 140 businesses selling technologies that minimised water consumption in homes This enabled consumers to purchase products that were more water efficient For instance one bathroom retailer reported a 58 per cent rise in sales of automatic taps371
bull After the first phase of the project had been completed 72 per cent of residents were aware of water-saving measures compared to 40 per cent before the project started
bull Water system performance improved with pipe burst events reduced by more than 50 per cent and losses by more than 40 per cent
The experience in Zaragoza shows that encouraging public participation and targeting specific sectors are valuable measures when implementing awareness campaigns Strong political commitment is also important The municipal strategic plan identified stakeholder engagement and public participation as important to managing the cityrsquos water consumption
Links to similar initiativesSingapore water demand management Beaufort West water demand management Nevada water conservation programme
369 See Kassam (2014)370 Ibid 371 See 2030 Water Resources Group (2015)
Case studies - water
154
Snapshot
bull Location Bucharest Romania
bull Population Large ndash 18 million (2011)
bull Policy area Water
bull Policy option Regulation and contracting of public and private service providers reform and strengthening of water utilities effective tariff reforms and price signals
bull Financial capacity Strengthening
bull Administrative capacity Limited
Context and policy overview In Bucharest water losses were very high (around 50 per cent) in the 1990s and the city had low levels of fee collection because the metering system was inadequate Relative to EU quality standards improvements were required and the commercial model and tariff structure in place at the time
did not allow EU funds to be made available for capital investment372
In 1996 following World Bank recommendations Bucharest initated a tender process to privatise the cityrsquos water and sanitation system This resulted in a 25-year concession agreement between Apa Nova a subsidiary of the French firm Vivendi (now Veolia) and the Bucharest municipality for the management of the system In 2000 Apa Nova won the tender to manage the Bucharest water concession including the development of the Crivina plant The contract included operations and the provision of clean water and sanitation while ownership of the water system remained with the municipality
The private-sector participation approach gave control of management and investments to a private company and linked its remuneration to efficiency gains and operational performance The municipality expected that this would lead to significant improvements in Apa Novarsquos capital and operating efficiency and a higher standard of service In addition the municipality hoped to see expertise from international practices in management and operations transferred to Apa Novarsquos local staff373
Public-private partnership agreement Bucharest Romania
Bucharest introduced new capital improvements to the water sector through a PPP agreement which has led to efficiency gains and better operational performance of the cityrsquos water distribution network
372 See Water Time (2005)373 See Islam (2012)
Case studies - water
155
ImplementationIn one of the first PPPs in the local water sector the private contractor was selected through international competitive tendering organised by the municipality of Bucharest with the support of the International Finance Corporation (IFC) The agreement provided a 25-year contract for Apa Nova to deliver US$ 1 billion worth of investments in existing and new treatment plants and in network renewal374
The contract included targets for key performance indicators in relation to water quality completion of new infrastructure and customer service Although the contractor had operational control over the network and the authority to deploy resources to meet these KPIs the municipality retained ownership of the infrastructure and the power to veto certain decisions375
The agreement helped create a source of capital to support an upgrade and extension of the Bucharest water system The partnership agreement required the private partner to provide financial resources to upgrade the system and part of the project included the upgrading of the Crivina plant The Crivina project had already started 10 years earlier but the municipality lacked the financial resources and expertise to complete it To finance the project Apa Nova and the city of Bucharest applied for an EBRD loan which offered better terms than other commercial sources of capital376
This PPP model offers a degree of stability and risk- and profit-sharing In 2000 the PPP environment in Romania was uncertain and the classical nature of the model used in Bucharest may therefore have been beneficial to the city377
Results and lessons learnedThe PPP contract was beneficial to both parties Bucharest was able attract financial resources to upgrade and improve the quality of its water system
and accessed the necessary expertise to do this Meanwhile Apa Nova also benefited with profits of euro24 million in 2006378
Overall the project improved the cityrsquos water distribution network and saw the completion of the Crivina potable water treatment plant on the outskirts of Bucharest
Key metrics for the period 2002-06 included
bull a 44 per cent reduction in losses379
bull a 50 per cent decrease in demand380
bull a 21 per cent increase in customer satisfaction (from 46 per cent to 67 per cent)381
Moreover the competitive nature of the contract its 25-year duration and the controlled pricing mean that as a result of this concession consumers in Bucharest have one of the lowest tariffs for water and sanitation in Europe382
Links to similar initiativesSingapore water demand management Johannesburg water supply efficiency Jeddah leakage reduction
374 See World Bank (2016)375 Ibid 376 Ibid377 See Islam (2012)378 See World Bank (2014) 379 See IFC (nd) 380 Ibid381 See World Bank (2014) 382 Ibid
Case studies - waste
156
Snapshot
bull Location Cape Town South Africa
bull Population Large ndash 37 million (2011)
bull Policy area Waste
bull Policy options Regulation and information to encourage the reuse of materials and the reformulation of processes incentives for waste recycling by industries information strategies for residents and businesses
bull Financial capacity Strong
bull Administrative capacity Strong
Context and policy overviewDespite its rich and diverse resource base South Africa relies heavily on fossil fuels has high rates of landfill use and suffers water scarcity In Cape Town the Western Cape industrial symbiosis programme
(WISP) seeks to address these issues by providing a free facilitation service that promotes the reuse and recycling of industrial waste The programme covers materials water energy staffing and expertise and other assets Its overarching aim is to contribute to the circular economy384 385
The sharing of resources enables businesses to reduce costs and boost profits improve operational efficiency introduce new revenue streams learn from one another operate more sustainably and divert waste from landfills
The WISP was inspired by the UKrsquos national industrial symbiosis programme (NISP) which successfully proved that reutilising underused resources across industrial and commercial waste improved the environmental impact of companies386
ImplementationThe WISP was set up by the Western Cape government and delivered by the non-profit organisation GreenCape with technical support from the city
Industrial symbiosis programme Cape Town South Africa
The Western Cape industrial symbiosis programme connects local companies to facilitate the reuse of resources such as water energy and materials383
383 See Western Cape Government (nd)384 See Global Opportunity Explorer (2018)385 See African Circular Cities Alliance (nd)386 See Western Cape Government (nd)
Case studies - waste
157
387 Ibid 388 See C40 Cities and Climate KIC (2018)389 See C40 Cities (2017) 390 Ibid 391 See GreenCape (2018) 392 See OrsquoCarroll et al (2016)
of Cape Town and financial support from other partners387 GreenCape seeks widespread adoption of green economy solutions The WISP helps to engage local businesses improving their understanding of the content and potential uses of waste streams which in turn helps to identify underutilised resources388
Connections were made between nearly 500 participating companies via workshops led by the city and GreenCape and through the use of an online database SYNERGietrade389 When connections are made between firms the WISP supports the exchange of resources and the communication between the relevant actors Feedback to the WISP is encouraged in order to improve matching and to ensure strong social environmental and financial impacts for all parties involved Emission savings that result from the scheme are calculated using an international standard carbon calculator that has been developed for the purposes of the programme390
By way of example the WISP successfully matched the marketing company Scan Display with the specialist manufacturing firm Sealand Gear This helped the former to avoid disposing of single-use conference display stands and banners instead
diverting them to Sealand Gear which used the products to make bags and clothing The long-term relationship between these two firms helped to avoid two tonnes of landfill waste and delivered financial savings to both companies Sealand Gear saved ZAR 270000 (euro14000) per year on raw materials and Scan Display saved ZAR 900 (euro50) per year in landfill gate fees391
Barriers and critical success factorsDespite its overall success the project faced challenges including regulatory issues (the reuse or recycling of waste materials for instance) the cost of transport and logistics services a lack of demand for secondary materials and additional capital investments It also faced a difficult enterprise development process and lack of large-scale solutions for dealing with waste composite materials bio-waste textiles and wood392
Factors that helped to overcome these issues and make the project successful include GreenCapersquos reputation as a reliable and trusted NGO with no hidden agendas the use of partnerships to tap into
Case studies - waste
158
393 Ibid 394 See C40 Cities and Climate-KIC (2018)
networks and the contribution made by International Synergies a firm whose experience in industrial symbiosis helped to demonstrate the value of this approach
Government funding was also instrumental in facilitating the development of the free-to-use WISP service393
Results and lessons learnedThe WISP operates across several industries allowing greater scope for the reuse of materials and delivering a range of benefits such as
bull 27000 tonnes of waste diverted from landfill thus saving 45000 tonnes of greenhouse gas emissions over a five-year period
bull income and savings and private-sector investments totalling ZAR 43 million (euro28 million equivalent)
bull the direct creation of 25 jobs and a further 118 indirect jobs
The programme has also inspired and influenced other industrial symbiosis programmes across South Africarsquos provinces including in KwaZulu Natal and Gauteng The WISP is seeking further expansion394
Links to similar initiativesYokohama 3R Dream Plan Malmo industrial symbiosis Kristiansand green business competition
Case studies - waste
159
Snapshot
bull Country South Korea
bull Population Large ndash 97 million (2017)
bull Policy area Waste
bull Policy options Establishment of a waste management plan and administrative capacity promotion of sharing and reuse of products information strategies for residents and businesses
bull Financial capacity Strong
bull Administrative capacity Strong
Context and policy overviewInitiated in 2012 and funded by the city the Sharing City Seoul programme seeks to develop a sharing economy covering infrastructure business public resources data and digital services395
Overpopulation urbanisation and a high population density in Seoul have exacerbated challenges in relation to housing transport air pollution and access to resources The Sharing City Seoul project was initiated to tackle these challenges and facilitate growth without further exploiting resources or adding pressure to infrastructure and services
The aims of the project include396
bull supporting job creation and increasing prosperity across the city
bull reducing waste and excess consumption and improving sustainability across businesses and organisations and
bull improving community spirit by increasing trust between people
ImplementationSeoul is seeking to move away from its conventional policy of building primary infrastructure (such as roads schools and so on) towards an innovative
Sharing city project Seoul South Korea
Seoul declared itself a ldquosharing cityrdquo in 2012 and began applying the concept of the sharing economy to its urban policies This minimised the waste of resources while generating economic opportunities and better relationships between city residents
395 See Johnson (2013)396 Ibid
Case studies - waste
160
focus on secondary infrastructure (such as spaces objects skills and other underutilised resources)397
To achieve this ambition the city is implementing a mix of policy and other mechanisms including a supportive regulatory framework public awareness campaigns and financial and other support for businesses398 Some of the key measures include the following399
Promoting sharing enterprises The city supports approximately 20 business start-ups led by young people providing them with office space advisory services and subsidies In addition the city subsidises the expenses of 27 sharing enterprises with KRW 460 million (euro340000 equivalent) to either launch or scale up their platforms400
Sharing enterprises chosen for city support include
bull Kozaza and Labo Korea two platforms for home-sharing
bull Woozoo a platform that provides affordable housing by remodelling old houses into shared accommodation
bull Wonderlend and Billi businesses that promote the sharing and borrowing of goods that are underused
bull SoCar a platform for car-sharing services
bull Kiple a business that promotes the sharing of childrenrsquos clothes
bull The Open Closet a company that distributes donated suits to young job-seekers
bull The Living and Art Creative Center a space for creative writing and art
bull Zipbob a platform that promotes food-sharing
Public awareness Seoul introduced a ldquostamp of approvalrdquo for particular sharing services in order to build trust in the sharing economy Moreover Seoul is branding itself as an innovator in sharing and is hosting an international sharing city conference to share best practices
Seoul established an online platform called the ShareHub in June 2013 to help residents understand the concepts of the sharing city and to initiate a directory of sharing services401
Governance The sharing city project was based on cooperation between the private and public sectors steered by a committee that the city established in February 2013 to promote sharing The committee is made up of representatives working in areas such as the media law IT corporate social responsibility welfare and social innovation In 2013 mayor Park set up the Seoul Innovation Bureau The Bureau encourages peoplersquos engagement in all aspects of city life from identifying challenges to providing policy ideas and participating in the sharing economy402
397 See Urban Sustainability Exchange (nd)398 Ibid 399 See Johnson (2013)400 See Johnson (2014)401 Ibid402 See Centre for Public Impact (2017)
Case studies - waste
161
Other measures Seoul established a car-sharing service with a fleet of around 500 cars and a selection of parking lots and municipal buildings were opened to the public during off-peak times To tackle the growing need for housing the city created a system to connect older people who had spare rooms with students in need of accommodation Shared bookshelves and ldquolibrariesrdquo of tools were also set up in communities across Seoul403
The city works closely with private companies to develop public-private partnerships and finance the programme
Barriers and critical success factorsThe Seoul metropolitan government is the driving force behind the cityrsquos circular economy The mayorrsquos Seoul Innovation Bureau facilitates the sharing model by means of financial and other support for businesses start-ups and communities It is well resourced and funded with 58 staff members and an annual budget of euro55 million404
Stakeholder engagement is at the heart of the sharing economy Strong communication and alignment between the Bureau the mayor private sector partners and communities is an important success factor The mayorrsquos office has arranged more than 6000 workshops resulting in input from 600000 residents with many of these insights since developed into policies and projects For example following a popular suggestion on Twitter the city used mobile phone data to modify the night-bus timetable to meet passenger demand405
In addition to top-down support from the metropolitan government and the mayor the programmersquos success can also be attributed to the cityrsquos encouragement and support for a grassroots resident-driven approach to sharing opportunities Official support is available for tech start-ups and other organisations focused on enabling more sharing However the city acts as a partner and facilitator for these emerging initiatives rather than dictating how they should function406
403 See Johnson (2013)404 See Centre for Public Impact (2017)405 Ibid406 See Johnson (2014)
Case studies - waste
162407 See Centre for Public Impact (2017)408 See Park (2016)409 Ibid410 Ibid411 See Johnson (2013)
The city also records the growth of sharing initiatives and the number of residents attending events and contributing to sharing policies and ideas both online and offline407
While some people were initially sceptical about this new sharing process presentation meetings organised by the city have helped residents to better understand the logic and potential benefits of the approach
Public assurance from the metropolitan government in terms of laws and systems to promote sharing has also been key in helping to generate an ecosystem of start-up companies Taxation in particular has been a sensitive matter and the insurance system for the sharing economy is not yet complete Regulation and laws that stand in the way of sharing activities are continuously reviewed by the city so that amendments can be made by the relevant departments
Results and lessons learned
bull By 2016 the initiative had certified 50 sharing projects and given grants to a number of these Certified projects range from local car-sharing company SoCar to websites like Billiji that help people share things with their neighbours One of the best results of the project is the increasing participation of residents
bull Some individual successes illustrate the scale of the projectrsquos impact the car-sharing enterprises Green Car and SoCar have more than 400000 members the Moducompany platform has shared 2000 parking spaces that are underused during the daytime and childrenrsquos clothing company Kiple has shared eight million items of clothing408
bull Moreover Seoul has opened up almost 800 public buildings for public meetings and events when they are not in use ShareHub has organised a sizeable campaign of public engagement and education with conferences seminars reports and a book
bull The metropolitan government has concluded that these sharing policies have had a positive effect on the economy equivalent to around KRW 48 billion (euro36 million equivalent)409
bull The city government plans to expand the programme and estimates that this could save city residents a total of KRW 12 billion (euro9 million) a year and the city administration KRW 118 trillion (euro900 million) with more than 1200 new jobs and CO2 savings of 30000 tonnes over the course of the expanded programme410
The sharing city project in Seoul has influenced other South Korean cities such as Gwangju and Busan which have implemented sharing activities based on the success of the initiative411 They have taken particular inspiration from Seoulrsquos distinct approach which combines top-down and bottom-up measures
Links to similar initiativesSan Francisco zero waste city Berlin circular city Oslo integrated waste-management strategy
Case studies - waste
163
Snapshot
bull Location Yokohama Japan
bull Population Large ndash 37 million (2015)
bull Policy area Waste
bull Policy options Regulation and information to encourage the reuse of materials and the reformulation of processes incentives for industries to recycle waste information strategies for residents and businesses
bull Financial capacity Strong
bull Administrative capacity Strong
Context and policy overviewIn the late 1990s Yokohama faced a significant challenge with waste generation exceeding the cityrsquos waste treatment capacity In response it proposed a long-term plan in January 2003 called the Yokohama G30 Plan which aimed to facilitate recycling and curb waste production Specifically the plan sought
to reduce waste by 30 per cent by 2010 relative to a baseline of 16 million tonnes of waste in 2001412
Building on the success of this plan a subsequent project was developed in 2010 The 3R Dream Plan aimed to ldquoreduce garbage while continuing the separation and recycling of garbage to deal with global warming and to reduce CO2 emissions [and] to realise [a] comfortable and liveable city where garbage is controlled by pursuing safe secure and stable garbage processingrdquo 413
The Yokohama 3R Dream Plan also demonstrated how manufacturers can produce items using recycled and recyclable materials and encourages the sale of eco-products and services to help avoid and reduce the import use and waste of resources It supported participation by residents through briefings and through campaigns at the many waste collection points and train stations414
Reduce reuse recycle Yokohama Japan
Yokohamarsquos 3R Dream Plan encourages behavioural change and facilitates coordination between residents businesses and the city government to increase recycling and reduce waste
412 See Tokyo Development Learning Centre (2017)413 See C40 Cities (2016a)414 See C40 Cities (2016b)
Case studies - waste
164415 See Tokyo Development Learning Centre (2017)416 Ibid 417 Ibid 418 See C40 Cities (2016b)419 See Tokyo Development Learning Centre (2017)
Implementation The G30 plan gave residents considerable responsibility for separating waste at source and bringing it to designated collection points The city expanded the system to require separation into 10 different categories of waste each to be placed in clear plastic bags for easy identification by waste operatives415 The new plan was supported by extensive education campaigns to raise public awareness of waste management The campaign included more than 1000 seminars for residents on waste reduction and segregation along with numerous events at railway stations and local waste collection sites Citizen volunteers ndash so-called ldquogarbage guardiansrdquo ndash were appointed to promote sorting measures416
The 3R Dream Plan promoted better waste management by ensuring secure and efficient processing and disposal of waste It also sought to encourage collaboration between government agencies businesses and residents in order to achieve Yokohamarsquos vision of becoming a sustainable city For instance the city worked with producers to design products that create less waste and to implement ldquotake backrdquo schemes for the refurbishment or recycling of products that have reached the end of their lifecycle417
Barriers and critical success factorsThe scheme aimed to reduce waste while supporting the cityrsquos economic development Its success was heavily influenced by the participatory environment created between government industry businesses and consumers418
The involvement of residents and companies was critical in Yokohama for the establishment of effective waste management even without the deployment of new technology or investment Education also played an important role ensuring that residents became involved in waste management activities
Results and lessons learnedYokohama achieved the following outcomes through its implementation of the G30 plan and the 3R Dream Plan
bull Yokohama saved approximately euro900 million in capital expenditure by avoiding the construction of two new incineration plants and euro25 million in avoided operational expenditure The new system of recycling was expected to cost approximately euro20 million a year resulting in significant savings for the city 419
Case studies - waste
165
bull By 2015 Yokohama had reduced waste by 45 per cent from a peak of 161 million tonnes in 2001 achieving this success while the cityrsquos population grew by 170000 people over the same period Another marker of success is that by 2005 the G30 plan had already reduced waste by 30 per cent reaching its target five years ahead of schedule420
bull The city experienced a significant reduction in GHG emissions from waste disposal Between 2003 and 2013 waste-related emissions fell by 10 per cent which equates to more than 29000 tonnes of CO2 saved per year421
bull The 3R Dream Plan set a target of reducing waste-related GHG emissions by 59 per cent by 2025 relative to a 2009 baseline422
bull Yokohama aims to cut more than 141000 tonnes of CO2 emissions by 2025 relative to the level in 2009 423
In terms of lessons learned the experience of Yokohama is appealing because it did not require large investment or new technologies to reduce waste In fact the efforts produced new business opportunities in the recycling industry The Yokohama example also shows that the involvement of residents and companies is critical for effective waste management
As landfill capacities fall and environmental regulations tighten many cities are aiming to reduce and avoid waste The experience in Yokohama thus reminds policymakers of the importance of engaging businesses and communities in the increasing drive towards a circular economy
Links to similar initiativesCape Town industrial symbiosis Malmo industrial symbiosis Kristiansand green business competition
420 See C40 Cities (2015)421 Ibid422 Ibid423 See C40 Cities (2016a)
Case studies - waste
166
Snapshot
bull Location Ljubljana Slovenia
bull Population Small ndash 279000 (2016)
bull Economy Service economy
bull Policy area Waste
bull Policy options Establishment of a waste management plan and administrative capacity effective price signals and funding information strategies and funding improvement in waste collection waste sorting and treatment to encourage recycling and energy recovery
bull Financial capacity Strong
bull Administrative capacity Strong
bull Other Supportive national policy
Context and policy overview Slovenia is well recognised as a country that promotes sustainability and green growth In 2016 it became the first to receive a Green Destinations award while Ljubljana was honoured as the European Green Capital424 Waste management played an important role in these awards Indeed Ljubljana has been a leader in its approach to managing urban waste and developing a local circular economy
In September 2014 Ljubljana became the first European capital to commit to zero waste425 The zero-waste strategy encompassed various pillars426
bull expanding separate collection of waste streams at household level
bull collecting residual waste less frequently while maintaining the collection frequency of separate waste categories
bull encouraging residents and businesses to generate less waste
Zero-waste strategy Ljubljana Slovenia
In 2004 nearly all of Ljubljanarsquos municipal waste was sent to landfill However over the last decade the city has seen a tenfold increase in separate collection of reusable and recyclable materials almost eliminating waste disposal to landfill
424 See Ford (2017)425 See European Commission (2019)426 See Oblak (2019)
Case studies - waste
167
The strategy had ambitious targets to achieve 78 per cent separate collection by 2025 (from 60 per cent in 2014) and to reduce the generation of residual waste to 60 kg per capita by 2025 (from 150 kg per capita in 2014)427
The zero-waste scheme is fully operated by Snaga Ljubljana the largest Slovenian municipal waste management company The firm manages waste for Ljubljanarsquos 400000 residents in addition to the inhabitants of 10 neighbouring municipalities428
Under the scheme fees for waste management services are based on the pay-as-you-throw (PAYT) principle in which households pay according to the amount of waste they generate The charges are linked to container sizes and the frequency of collection The average monthly cost per household is euro8 which is among the lowest in Slovenia and the wider region429
ImplementationIn 2002 the city introduced the collection of glass paper and packaging in separate container stands In 2006 it began household collection of biodegradable
waste some 17 years ahead of the implementation deadline set by the EU Waste Framework Directive (200898EC) for separate collection of bio-waste430 In 2012 Snaga replaced neighbourhood and roadside containers for paper and packaging with a door-to-door collection system431
While door-to-door collection of separated recyclable and biodegradable waste was being increased the cityrsquos waste operator began reducing the frequency with which it collected residual waste For single-household dwellings collection of residual waste was reduced to once every three weeks In multi-apartment buildings the collection was weekly while other streams were collected more frequently432
In spite of a significant communication effort by Snaga the public and media initially resisted the changes Rates of separation were low leading to overflowing containers of residual waste However Snaga stuck to the policy and ramped up its communications including arranging a field trip to demonstrate how much of the residual waste in the bins could actually be placed into the more frequently collected waste streams Behaviour gradually changed in response to the new system and by late 2013 the rate of separate waste collection had reached 55 per cent433 A survey
427 Ibid428 See LGB (nd)429 See Snaga Ljubljana (2018)430 See Dakskobler (2019)431 See Oblak (2019)432 Ibid 433 Ibid
Case studies - waste
168
in 2016 indicated high satisfaction rates with the cityrsquos waste system among residents and businesses alike (albeit the results were based on a very small sample size)434
Snaga uses multiple channels to communicate with residents about costs and performance including through its website and social media accounts Users can also set up a free SMS reminder to notify them when waste will be collected
In addition to its household collection system the city operates a reuse centre and two household waste recycling centres for other reusable or recyclable materials These are well used They contribute to overall waste reduction and heighten awareness of waste with a survey reporting that some 70 per cent of residents think about how to ensure the reuse of goods that they no longer need435 Building on this success Snaga plans to construct 10 smaller centres in denser areas436
For its treatment solution the city opted to pursue a mechanical and biological treatment approach instead of the mass incineration of residual waste The Regional Centre for Waste Management (RCERO Ljubljana) opened in 2016 and currently processes almost a quarter of Sloveniarsquos waste The facility produces its own heat and electricity through biogas derived from the processing The facility achieves reuse recycling or energy recovery for nearly all the materials it receives with less than 5 per cent going to landfill437
Barriers and critical success factorsThe key to Ljubljanarsquos success proved to be political support good management and communication and a commitment to constantly increasing zero-waste goals
The introduction of door-to-door collection contributed most to the increase in recycling rates Snagarsquos communication strategy was also critical in helping to overcome initial opposition to the zero-waste strategy through media outreach and stakeholder engagement The example of Ljubljana also shows
how important it is to adjust communication strategies and messages as circumstances change
Results and lessons learnedLjubljana had previously lagged behind the rest of Europe in terms of the recycling and reuse of municipal solid waste Over a 10-year period the city boosted recycling rates from 29 per cent to 68 per cent and cut waste generation to around 358 kg per capita (compared with an EU average of 486 kg per capita) Among EU capital cities Ljubljana managed to achieve the highest share of separately collected waste while keeping waste management costs to a minimum438
Ljubljana became the European Green Capital in 2016 an award based on its environmental record Among the five finalists Ljubljana was the only city without a waste incineration plant or plans to build one Instead it focused on alternative solutions including a comprehensive waste management plan working towards the development of a zero-waste society
Links to similar initiativesSan Francisco zero waste by 2020 Flanders waste management Vancouver zero waste by 2040
434 See Petek (2016)435 See Oblack (2019)436 See Dakskobler (2019)437 See Oblak (2019)438 Ibid
Case studies - waste
169
Snapshot
bull Location Parma Italy
bull Population Small ndash 194000 (2017)
bull Economy Service economy
bull Policy area Waste
bull Policy options Establishment of a waste management plan and administrative capacity effective price signals and funding information strategies and funding improvement of waste collection waste sorting and treatment to encourage recycling and energy recovery
bull Financial capacity Strong
bull Administrative capacity Strong
Context and policy overviewParma is a relatively small city located in northern Italyrsquos Emilia-Romagna region In 2014 the city occupied a dubious position as the countryrsquos most
waste-producing city with 636 kg of municipal waste produced per person (compared with an EU average of around 480 kg per capita)439 Around 50 per cent of municipal waste was collected separately for reuse and recycling and the other half was incinerated or landfilled Door-to-door collection of separate waste streams was very limited with most recycling taking place through collection containers440
Waste became a major point of debate in the 2012 municipal elections Responding to public pressure and to leadership within the city council the city began a series of changes to its collection regime The new system made it easier for residents to separate out their recyclable waste from residual waste and created financial incentives to reduce waste and increase recycling Public engagement and consultation were also integral to the process
ImplementationThe first step was to replace collection containers with door-to-door collection of separate waste streams Parma started this programme in the historical centre and extended door-to-door collection across the city
Zero-waste strategy Parma Italy
Parma dramatically increased the collection of biodegradable and recyclable material in only four years after launching its zero-waste policy in 2012 This success was due to strong political will effective communication and a pricing strategy to set the right incentives
439 See Zero Waste Europe (2016)440 See Heinrich (2018)
Case studies - waste
170
district by district Within 18 months door-to-door collection had been extended to all districts for food waste paper packaging and residual waste Collection frequency varies by material with bio-waste collected more than once per week and residual waste collected weekly (or less frequently in some areas)
The new system was scheduled according to location and population density Waste collection in the city centre occurrs during the night (to avoid blocking streets and causing a nuisance to the night-time economy) while collection in residential areas took place during the mornings Roadside containers were installed for the collection of garden waste and glass
Parma faced a high cost of disposal (euro170 per tonne for its new incinerator) and so the city used a pricing approach to reduce its residual waste stream and lower the overall costs of the system The cityrsquos pay-as-you-throw scheme has a two-part fee structure based on the waste that each household generates The first part is a fixed cost based on the size of the property and household Additional allowances are available for households with children younger than 30 months to account for the additional waste from nappies The fixed cost covers a minimum number of collections per household and also the costs of management and enforcement Additional removals of residual waste beyond the fixed number incur a cost per bag or bin441
Households can earn additional lsquoeco-pointsrsquo for sorting and disposing of electronic hazardous and medical waste in the appropriate way Eco-points are worth a discount of euro015 on the following yearrsquos waste bill up to a maximum discount of euro20442
Households also receive a 12 per cent discount on their bill for home composting443
Parma also introduced lsquoeco-stationsrsquo and lsquoeco-wagonsrsquo to complement the door-to-door collection system and provide flexibility Eco-stations are small kiosks open 24 hours a day where people can recycle their waste outside of the main door-to-door collection hours Recyclables are free to deposit while residual waste incurs a fee Kiosks have eight windows where
recyclables and residual waste can be left accessible with a user card which is also used to collect eco-points for depositing recyclables Eco-wagons are located in the city centre and support the other waste collection services The system operates like a bus service with routes and stations to enable people to bring out their waste at the appropriate time
Barriers and critical success factorsA communication campaign targeting local residents was essential to the success of the new waste system in Parma This included awareness-raising in public squares information sent to peoplersquos homes a specially created hotline and a competition between schools to reduce waste
Residents were concerned that waste collection would not be frequent enough so the eco-stations gave them the option of bringing their extra waste for disposal444 The flexibility of the system increased its acceptability and peoplersquos willingness to support the new approach445
Illegal dumping and fraud were also concerns ahead of the transition Residents are protected through the use of RFID tags in each bag so they are only charged for their own waste The city also installed CCTV
441 Ibid 442 See 2020 Collectors Project (2020)443 See Zero Waste Europe (2016)444 See Heinrich (2018)445 See 2020 Collectors Project (2020)
Case studies - waste
171
cameras at eco-stations and created an app for residents to report illegal dumping Overall rates of illegal dumping were low at around 500 g per capita per year446
Results and lessons learnedThe new system dramatically reduced residual waste and increased the collection of recyclable and biodegradable materials As of 2018 Parma had achieved the following capture rates447
bull paper 81 per cent
bull plastic 69 per cent
bull metal 33 per cent
bull glass 93 per cent
bull composite material 36 per cent
Meanwhile kerbside collection of bio-waste collection nearly doubled from 50 kg to 100 kg per capita per year between 2011 and 2015 while the fraction of impurities fell from 8 per cent to 3 per cent448
Typical costs for households rose in the early years as investments were made in both capital and operations However as the system settled in and savings were captured by reducing disposal costs the cost for customers began to fall After a peak in 2013 typical costs in 2016 were at a similar level to those seen in 2010 before the new system was implemented (around euro250 a year for a three-person household) In effect the city is delivering much better outcomes for the same cost as the old system449
The success in Parma helped the adoption of targets in Emilia-Romagna which exceed national and EU requirements including a 25 per cent reduction of total waste 73 per cent separate collection and 70 per cent effective recycling This system incentivised
cities to achieve the best performance while penalising those lagging behind Through this regional system of incentives Parma has received euro710000 for its reduction of residual waste450
Links to similar initiativesLjubljana zero-waste city San Francisco zero waste by 2020 Flanders waste management
446 See Heinrich (2018)447 See 2020 Collectors Project (2020)448 See Ricci (2020)449 See Heinrich (2018)450 See Zero Waste Europe (2016)
Case studies - waste
172
Snapshot
bull Location Belo Horizonte Brazil
bull Population Large ndash 25 million (2015)
bull Policy area Waste
bull Policy options Formalisation of informal services improvement of waste collection
bull Financial capacity Limited
bull Administrative capacity Strengthening
Context and policy overview451
Belo Horizonte is a large middle-income city in the Brazilian state of Minas Gerais The cityrsquos population has grown rapidly from around 35 million in 1990 to around 6 million today
Waste management has been a key challenge for Belo Horizonte as the city has grown In the mid-20th century much of its waste went to an open dumpsite which was scavenged for valuable materials by catadores waste pickers living on the margins of society The city stopped this practice when the dumpsite was closed and replaced with a sanitary landfill in the early 1970s The waste pickers continued to operate but were marginalised and persecuted by the authorities responsible for urban sanitation In response the catadores made use of 1988 legislation to form a workersrsquo cooperative called the Association of Collectors of Paper Cardboard and Recyclable Material (ASMARE)452
In the 1990s the city developed a flexible and integrated system of solid waste management which incorporated the waste pickers into a formalised relationship with the cityrsquos waste authority SLU and the wider waste and recycling ecosystem According to Aurora Pederzoli SLU Chief of Special Programmes ldquoOur solid waste management model is based on
Formalisation of informal waste pickers Belo Horizonte Brazil
Belo Horizonte Brazilrsquos third-largest city began to address its waste management issues in the 1970s with a new sanitary landfill However it took a new formalised relationship with catadores ndash informal waste pickers ndash to deliver a truly integrated solid waste management system
451 See Centre for Public Impact (2016)452 See Magni and Guumlnther (2014)
Case studies - waste
173
a concept of social inclusion and income and job generationrdquo453
ImplementationThe cityrsquos adversarial relationship with waste pickers began to change when the Pastoral de Rua of the Archdiocese of Belo Horizonte engaged with the cooperative to understand their needs and aims The Pastoral mediated negotiations with the city to develop a plan for the waste management system which had the support of all participants ndash the city the waste authority ASMARE and other waste businesses454
Belo Horizontersquos environmental plan for recovery and recycling of civil construction waste was initiated in 1993 to provide a mixed system of waste collection and drop-off sites with selective waste-sorting carried out by the waste pickers455 The city introduced weekly kerbside collection of paper metal glass and plastic and established collection sites for households not served by kerbside collection Waste from both streams was sent to the cooperative warehouses for the sorting and recovery of recyclable materials456
In 2003 the city set up a citizenrsquos forum to facilitate greater dialogue on waste issues The purpose of the forum was both to review progress and to expand the system to include other workersrsquo cooperatives457
In 2011 the state government introduced a lsquorecycling bonusrsquo a financial incentive for the waste pickers Payments are made on the basis of the quality and value of the recyclable raw materials The payment provides an additional source of income for these workers but also provides an incentive to the cooperatives to innovate to improve the quality of recyclates and to improve business management practices458
Barriers and critical success factorsThe cityrsquos successful approach was preceded by a long period of dispute and acrimony with waste pickers
Intensive communication and sustained political support for the new integrated system were therefore essential to overcome the legacy of mistrust between different actors in the cityrsquos waste system Belo Horizonte used creative communication approaches including carnival parades theatre dance and music to change public attitudes to the waste pickers and their positive contributions to the cityrsquos environmental quality
The legal framework limited the cityrsquos ability to reform the waste system These issues were addressed over time including through a change at city level to assign the rights to cooperatives to collect and sell recyclable raw materials At the federal level in 2001 waste collecting was classified as a professional occupation459
453 See LSE Cities ICLEI and GGGI (2013)454 See Magni and Guumlnther (2014)455 See Sabatino (2017)456 See Centre for Public Impact (2016)457 See Sabatino (2017)458 See Dias (2016)459 See Sabatino (2017)
Case studies - waste
174460 See Centre for Public Impact (2016)461 Ibid 462 See Colombijn and Morbidini (2017)463 See Centre for Public Impact (2016)464 See LSE Cities ICLEI and GGGI (2013)
Results and lessons learnedThe achievements and positive change in Belo Horizontersquos waste management have proved to be a model for other Brazilian cities Key outcomes included the following
bull By 2012 the cityrsquos formal waste management system was serving 95 per cent of the urban population and at least 70 per cent of favelas with 93 per cent of residual waste being disposed of in sanitary landfills460
bull Some 3000 waste workers are supported by the system and together with the municipal waste management system they had collectively recycled up to 20000 tonnes by 2012
bull Working conditions for waste collectors improved significantly with the introduction of a monthly minimum wage of euro270461 The cooperatives provide the workers with a degree of security462
bull Skills development and training were delivered through a Municipal Waste and Citizenship Forum which was supported by municipal funding and additional support of euro125000 from Caixa Bank463
bull Recycling outcomes were relatively low with recycling rates remaining below 10 per cent as of 2008464
Links to similar initiativesBangalore informal waste pickers Four strategies to integrate waste pickers Waste pickers and cities
Case studies - governance
175
Snapshot
bull Location Poland
bull Population 378 million countrywide (2019)
bull Policy area Governance
bull Policy option Political and fiscal decentralisation
bull Financial capacity Strengthening
bull Administrative capacity Strengthening
Context and policy overviewDecentralisation in Poland began soon after the collapse of the Soviet Union The early reforms devolved various central government functions including some revenue-raising authority to existing municipalities In 1999 the country implemented structural reforms of provincial and local government which saw further devolution of powers to counties
and municipalities bringing public services closer to people and making local government in Poland more accountable to its electorate465
Most of the interaction between citizens and public services occurs at the local level and in Poland local governments have a good reputation466 This success was achieved through reforms to administration and by strengthening the capacities of cities and regions467 To implement reform changes were made to legislation and the operation of public administration The implementation process was monitored and evaluated and the public were kept informed468
ImplementationFundamental changes were required to the structure of central and local systems including to legislation staffing and organisation It was also necessary to address issues regarding the ownership of public infrastructure and services
Initially the state established new institutions including new offices for the different levels of public
Political and fiscal decentralisation Poland
Decentralisation in Poland has been successful leading to increased local revenue and improved service delivery Most interaction between citizens and public administration now occurs at the level of local governments the most trusted institutions in the country
465 See World Bank Group (2017) 466 See Laszek and Trzeciakowski (2018) 467 See European Association for Local Democracy (2016) 468 See Kulesza (nd)
Case studies - governance
176
469 See demosEuropa ndash Centre for European Strategy (2015) 470 See Szescilo and Kulesza (2012) 471 See World Bank Group (2017)472 See Schiffbauer and Varela (2019) 473 See Szescilo (nd) 474 See Laszek and Trzeciakowski (2018)475 Ibid
administration followed by a sharing of assets and staff between these institutions Next a list of public institutions was created and passed to territorial self-governments to allow them to take over the running of these assets
In terms of sequencing Polandrsquos series of political and fiscal reforms since 1990 have been delivered through at least three different approaches469 Between 1989 and 1991 the ldquoshock-therapyrdquo technique was used to create rapid change in the economic system In 1997 a ldquobig bangrdquo approach was employed to implement four major structural reforms within a year More recently the preferred approach has been incremental making important decisions in separate stages Of these three approaches the 1997 reforms in particular towards a three-tier system of local and regional self-government enabled local communities and society as a whole to take a greater stake in the countryrsquos development Delegating responsiblity for public tasks led to stronger local government470 Municipalities therefore have a high level of autonomy within the Polish system although they must act within the law
Barriers and critical success factorsPoland used a gradual programme of reform to increase transparency and accountability allowing the changes to become effective and the country to absorb large EU funds efficiently471 Initially reforms focused on institutions that did not fit with the new market economy context These efforts were followed by steady action to enable the institutions that had been retained to evolve in response to the growing sophistication of Polandrsquos market economy The shared goal of EU accession also spurred political support for the reform of institutions472
While public expenditure has been decentralised local government has limited control over taxes473 Control over expenditure and revenue alike is important for local government to succeed474
There can be friction between local and national tiers of government when the degree of autonomy is not established in advance It is clear that detailed and well-communicated legislation is key to success
Results and lessons learned
bull Local government has been effective without large regional disparities
bull Service delivery improved because local governments were able to implement centrally designed policies and they had greater accountability
bull Increased accountability allowed local governments to boost their revenue while also benefiting from dependable intergovernmental transfers and large amounts of EU funds
bull Poland has become more resilient to economic downturns
bull In a recent survey local governments ranked as the most trusted public institutions in Poland475
Links to similar initiativesUnited Kingdom decentralisation Colombia decentralisation Finland decentralisation
Case studies - governance
177
Snapshot
bull Location Vienna Austria
bull Population Large ndash 19 million (2019)
bull Economy Service economy
bull Policy area Governance
bull Policy option Improving transparency and accountability
bull Financial capacity Strong
bull Administrative capacity Strong
Context and policy overviewVienna is regularly ranked as the city that offers the worldrsquos best quality of life476 It also has a tradition of strong governance and engagement with residents in constructive participatory dialogue
While Viennarsquos employment rates and average incomes are high the region and the city face
environmental challenges including pollution of the Danube River due to unsustainable development along its banks and increasing air pollution due to private transport477
Against this background in June 2014 Viennarsquos city council adopted the Smart City Wien Framework Strategy (SCWFS) a comprehensive scaffold for developing effective responses to climate change including radical conservation of resources and productive use of new technology Projects that have emerged from the strategy include for instance an initiative for e-car-sharing478 The strategy was updated in 2019 to incorporate the UN Sustainable Development Goals and to reflect the increased urgency of addressing climate change479
There was concern that such a complex long-term framework would develop actions that would be left by the wayside among the daily pressing agendas of local government Therefore the city council required the municipal administration to undertake a periodic monitoring programme and to verify at regular intervals that the frameworkrsquos objectives were being met480 This monitoring was intended to serve as a performance management tool for policymakers
Smart city performance monitoring Austria Vienna
Vienna has developed a comprehensive programme to monitor the impact and key objectives of its Smart City Wien Framework Strategy These include resource conservation innovation and improvements in quality of life
476 See Mercer (2015) 477 See WWF (nd) 478 Ibid479 See Brandl and Zielinska (2020) 480 See Municipal Department MA 18 ndash Urban Development and Planning (2018)
Case studies - governance
178
and to support the city in implementing and updating the strategy
Vienna recognised that to back this monitoring process and make the strategy more transparent the city would need to establish a central data platform This had to cover the entirety of the municipal administration and ensure access for residents and the exchange of information In this way it would involve all of the main stakeholders in the implementation of the SCWFS
Two principles were defined for the monitoring approach First there would be extensive cooperation across city departments and associated organisations to maximise support and ownership The second key principle was to minimise the data collection workload for participants and to focus on analysing the existing data pool and reporting structure
ImplementationVienna created the SCWFS in 2013 following two years of stakeholder engagement and the City Council Resolution of 2014 which first stipulated the need for a monitoring process
The initial step was to conduct an extensive exploratory project to establish a methodology for monitoring that would reflect the objectives of the SCWFS The first monitoring process took place in 2017 as part of an EU-funded project and consisted of
bull monitoring objectives by evaluating them individually based on an extensive set of indicators
bull carrying out overall monitoring of the Frameworkrsquos results
One-third of the objectives could be measured quantitatively However the remaining objectives posed greater challenges as their measurement required extensive qualitative descriptions In these cases individual indicators were grouped together making it possible to assess a subject area in more general terms
Some of the indicators used by the city were found to require greater precision before they could provide a more comprehensive picture although Vienna recognises that evaluation of indicators should be an ongoing process
The monitoring is a resource-heavy and time-consuming process exacerbated by the absence of a central overview of the cityrsquos data Indeed centralised access to the Viennarsquos data pools has been identified as an area for future improvement This could be achieved through further improvement to the online reporting tool already in place and by providing access for the entire municipal authority
An additional evaluation is expected to take place in order to make the process more routine
The monitoring programmersquos key success factor was its integration of evaluation with the strategic performance management cycle for the overall framework This ensured that the findings could be fed back in more effectively
The division of tasks across a multitude of stakeholders according to their areas of expertise (data provision for instance) was supported by academic institutions This approach ensured ownership and reduced the administrative burden on local government
Results and lessons learnedThe cityrsquos monitoring process involved particpants from across the municipality and stakeholder organisations These organisations took different roles in the process from reporting on goals to providing objective evaluation and data This illustrates the methodologyrsquos effective approach of engaging a multitude of stakeholders thus creating ownership of the framework481
One feature of Viennarsquos implementation framework is the Smart City Agency which is responsible for coordinating activities under the framework482 An agency of this kind is a key ingredient in the successful implementation of smart city strategies483
481 See Municipal Department MA 18 ndash Urban Development and Planning (2018)482 See Urban Innovation Vienna (2020) 483 See SmartCities World (2019)
Case studies - governance
179
The monitoring provided evidence-based findings on progress against individual objectives and showed where the city needed to make further progress For example the assessment identified that Viennarsquos CO2 reduction target for 2030 had almost been achieved just one year after the framework was launched Although this was a positive finding the monitoring also identified persistent social disadvantages in access to green space Some measured outcomes of the SCWFS as detailed in the 2017 monitoring report include
bull a reduction in per capita GHG emissions of 33 per cent in 2014 relative to a 1990 baseline (this is a headline goal with the reduction of GHG emissions being the strategyrsquos prime objective)
bull a fall in per capita energy consumption since 2005 of around 14 per cent
bull growth in the share of renewable energy from 121 per cent in 2010 to 195 per cent in 2015
Using the monitoring framework to not only report achievements but to put these in the context of progress against an eventual target ensures a long-term view and identifies the scale of further actions required For example the 2017 monitoring report identified successes and good progress against some targets but also areas of stagnation or poor performance for instance
bull levels of car traffic have stagnated since 2013 and Vienna is not on track to meet its objectives to shift to other modes of transport
bull similar stagnation or fluctuation in the trends for environmental indicators in buildings and in the water and waste sectors suggests that efforts are required to remain on track or get back on track
The accountability offered by a monitoring process has been shown to have a tangible impact on the fulfilment of a cityrsquos strategy Moreover in Vienna the data collection necessary to complete the monitoring and evaluation in a smart way was built on existing databases and enabled the creation of a new online reporting tool
Links to similar initiatives Alba Iulia smart city City of York performance management Utrecht and the UN SDGs
Case studies - governance
180
Snapshot
bull Location Cluj-Napoca Romania
bull Population Medium-sized ndash 303000 (2012)
bull Policy area Governance
bull Policy option Effective stakeholder participation
bull Financial capacity Strengthening
Context and policy overview484
Over the last decade Cluj-Napoca has been the only growing city in Romania Its evolving cultural life has transformed Cluj-Napoca into a vibrant European city with a multicultural environment that attracts tourists and businesses The city received the European Youth Capital title in 2015 a year in which it organised a range of cultural events Cluj-Napoca is home to the Paintbrush Factory an industrial facility that was
converted into a cultural space and is one of the countryrsquos most notable artistic projects485 In short the city has gained its place as a centre of culture and innovation
In 2017 Cluj-Napoca established the Civic Imagination and Innovation Centre (CIIC) offering residents the opportunity to take part in shaping their city and community The inauguration of the CIIC was marked with a debate to identify solutions for the regeneration of a local park Local government representatives residents specialists and academics meet at the CIIC to collaborate on transforming the city
The CIIC is led by public administration It has no permanent location and functions by collaborating with the community The centre is funded by the municipal budget costing the city euro10000-euro15000 n month486
Co-designing and co-creating urban solutions Cluj-Napoca Romania
Cluj-Napoca established a centre for civic innovation and imagination to encourage debate and collaboration among community representatives and city stakeholders about urban projects
484 See ROCK (2019) 485 See ASEF CULTURE360 (2011)486 See Innovation and Civic Imagination Centre ndash CIIC (2019)
Case studies - governance
181
ImplementationThe CIIC has revamped the cityrsquos method for designing and developing large-scale urban intervention projects Debates focus on an array of themes such as urban and public spaces and museums
In 2018 the centre hosted the third Romanian national workshop on the ldquoAttractive Danuberdquo The worshoprsquos overall objective was to identify at a national level measurable indicators of the attractiveness of a region (for the purposes of investment in tourism and business) However the workshop held in Cluj focused specifically on bringing the discussion towards local problems and solutions487 Attendance was broad ranging from various levels of government to interest groups academics and businesses The Territorial Attractiveness Monitoring Platform (TAMP) an open online platform that maximises accessibility was introduced at the event and received good feedback This workshop alongside other national workshops in the series yielded recommendations from a diverse range of 35 organisations to include 86 draft Territorial Attractiveness indicators within the TAMP tool488
Early 2019 saw two further debates one on an urban plan for a large-scale development area (Sopor) and a citizen panel focused on EU Cohesion Policy
Barriers and critical success factors Having clear objectives for meetings and communications was important in Cluj-Napoca to ensure that people understood the purpose of these events It was also important to assign a manager who would be in charge of analysing the information collected
Using a multidisciplinary approach CIIC events elicited a number of viewpoints which allowed a story to be told and engaged the community Where there were socio-cultural differences the CIIC used facilitators to resolve clashes and address the local dynamics Local communities had the opportunity to learn about the process of urban development and planning
In addition communication about government intentions and an inclusive dialogue that
accommodated differing points of view were important for promoting public participation Furthermore the centre offered capacity-building for stakeholder engagement to local communities helping them to understand the planning and urban development process step by step
Results and lessons learnedThe centre has enabled the creation of levers such as public debates oriented towards addressing urban problems and bridging the gap between three key groups the city administration experts and residents
Two years after CIICrsquos inauguration residents are more aware of the opportunities they have to participate and feel empowered to take part in the urban planning and development The move has enabled more innovation and new ideas allowing the community to become involved and to have more interaction with the changes to their city
The success of the CIIC shows that active engagement of residents in urban planning does not need to come at a very high cost Moreover the experience in Cluj-Napoca demonstrates the importance of setting clear objectives and expectations with regard to facilitating debates between residents and policymakers
Links to similar initiativesSkopje innovation lab Bologna civic collaboration Lyon citizen participation Satildeo Paulo civic participation
487 See UrbaSofia (2018) 488 See Interreg Danube Transnational Programme (2018)
Case studies - finance
182
Snapshot
bull Location Bogotaacute Colombia
bull Population Large ndash 71 million (2018)
bull Policy area Finance
bull Policy option Improved revenue and financial autonomy
bull Financial capacity Strengthening
bull Administrative capacity Strengthening
Context and policy overviewLegislation authorising the use of a betterment levy known as the contribucioacuten de valorizacioacuten is common in Latin American countries This form of levy is often opposed because it can be complex and resource intensive However in Colombia the betterment levy has been used regularly to raise revenue to fund public works489 490
ImplementationThe amount of the betterment levy is set to the lowest value among the following three factors
bull the cost of the project
bull the value that the project creates
bull the affordability of the levy (whether property owners can afford to pay the levy)
Bogotaacute has been innovative in its use of the levy For example the city applied it across a package of road projects and other infrastructure upgrades491
The Urban Development Institute (Instituto de Desarrollo Urbano or IDU) is responsible for administering the betterment levy in Bogotaacute The IDU also selects the infrastructure upgrades that the levy will finance All affected properties are subject to the levy which is calculated by multiplying different benefit factors
The IDU defines the ldquoareas of influencerdquo that will benefit from the levy This definition is based on a propertyrsquos proximity and access to a project and hence to benefits (such as an increase in land value) The IDU endeavours to maximise the number of properties within this area in order to lower the average burden of the levy on individual properties The benefits for an area could include for instance
bull better road layouts leading to increased mobility and transit speeds shorter transit
Land-value capture Bogotaacute Colombia
Bogotaacute has applied a form of ldquobetterment levyrdquo to finance road and other infrastructure upgrade projects around the whole city
489 See World Bank (2009)490 See Borrero Ochoa (2011)491 Ibid
Case studies - finance
183
times lower operating costs and a better quality of life
bull better public spaces
bull stimulation of new commercial activity
bull increased real estate value
bull better integration of the area into the city structure
bull regeneration
In Bogotaacute the betterment levies are no longer tied specifically to incremental changes in land value492
Barriers and critical success factorsInitial criticism emerged in relation to the cost of implementing the levy system for infrastructure projects (particularly the cost of administration) and in relation to the calculation of land value gains which were not measured directly and were therefore found to be inaccurate To address the criticism and reduce the burden on those paying the levy city authorities had an incentive to underestimate the cost of infrastructure projects which led to underfunding of infrastructure The authorities also focused schemes in wealthier areas where landowners could pay more easily As a result infrastructure improvements were unequally distributed across Bogotaacute493
Creating trust is an essential component of the success of betterment levies This trust must be built largely on affordability the equitable distribution of benefits the promotion of social value and participation by city residents in the process and its implementation494
In Bogotaacute public resistance to the betterment levy has since been tempered by spreading public works improvements across the entire urban area In addition the city has given residents the option to pay the levy over five years minimising the financial impact on each property owner This has enabled
Bogotaacute to use valorizacioacuten payments to repay the short-term debt used to fund construction
Results and lessons learned
bull In the period 1997-2007 Bogotaacute financed 217 public works projects through the contribucioacuten de valorizacioacuten These projects were located throughout the city and primarily consisted of bridge and road projects and improvements to drainage495
bull Over the same period the city used the levy to finance more than US$ 1 billion of municipal public works496
Links to similar initiativesChina and India value capture via land sale Satildeo Paulo sale of development rights Istanbul municipal and state land sales
492 Ibid 493 See World Bank (2009)494 See Borrero Ochoa (2011)495 See World Bank (2009)496 See Blanco et al (2017)
Case studies - finance
184
Snapshot
bull Location Rijeka Croatia
bull Population Small ndash 128000 (2011)
bull Policy area Finance
bull Policy option Improved accountability and transparency
bull Financial capacity Strengthening
bull Administrative capacity Strong
Context and policy overviewRijeka is a port city in Croatia comprised of 34 municipal entities and a population of 130000497 It is one of the smallest and most densely populated cities in Croatia In recent decades Rijeka has grown steadily intensifying environmental challenges such
as transport pollution light pollution and wastewater treatment498
The city undertook several investments in the early 2000s to address these challenges including funding 13 buses and 8 minibuses that run on CNG and establishing Croatiarsquos first CNG filling station However in order to facilitate these investments Rijeka needed to assess its financial position and improve the financial management of the municipality499
The strategic objectives of the city were
bull to attract global investment through the development of the Rijeka Gateway project
bull to develop a competitive economy based on knowledge and new technology and
bull to strengthen social inclusion through the implementation of capital investment projects
Diagnosis framework for municipal finance Rijeka Croatia
Rijeka has successfully implemented the World Bankrsquos Municipal Finance Self-Assessment framework to evaluate the cityrsquos financial health and identify specific actions that will improve its public spending and mobilisation of funding
497 See Croatian Bureau of Statistics (2012)498 See World Bank Institute (2013)499 See Environmental Local Authorities InterBalkan Network (nd)
Case studies - finance
185
In 2012 Rijeka used the World Bankrsquos Municipal Finance Self-Assessment (MFSA) tool to strategically assess its finances and develop a long-term action plan for financial management and investment decisions500
ImplementationThe work of applying the MFSA began in 2012 The framework provides a common methodology and internationally accepted indicators which can aid cities in accessing external funding and in more efficiently tracking local resources and spending over time The key steps of the framework are as follows501
1 Transform core databases of municipal financial data into the MFSA format
2 Carry out analysis of historic trends and balances and assess the level of services provided
3 Calculate financial ratios and set benchmarks
4 Use growth trends to identify financial needs and the implications of future policy decisions
5 Assess the quality of financial management using performance indicators identifying strengths and weaknesses in the current system
The MFSA framework is intended to improve the transparency of municipal financial management and help cities make more prudent investment decisions
As a self-assessment this approach can require significant administrative resources to review the current spending and finances of a city However the task can be outsourced to external auditors so that the local government are not direct owners of the process but instead analyse and interpret the results to develop a long-term action plan
Rijeka prides itself on its strong digital credentials and sought to incorporate its smart city infrastructure into this self-assessment to make its municipal finance more transparent and encourage residents to become involved502 In 2011 Rijeka launched an interactive game Proračun(ajme) (Budget me) on its municipal open data portal The game allowed residents to create their own budget for the city based on existing funds This educated people about details of the current budget and allowed them to simulate juggling the city finances503
The strategic long-term financial plan was published in 2014 Subsequent developments in relation to the transparency of municipal finance included the development of a public finance portal created in 2016
500 See World Bank Institute (2013)501 Ibid 502 See Filipovic (2019) 503 Proračun Grada Rijeke (2018)
Case studies - finance
186
The self-assessment revealed that between 2008 and 2012 Rijekarsquos average annual decrease in revenue was 29 per cent and the debt burden increased significantly These findings along with the financial ratio analysis indicated that the cityrsquos fiscal autonomy was weak These trends reflected the economic crisis of 2008 and falling GDP at the national level504
This assessment enabled the city to identify its need to finance capital expenditure through the national government or private financing which it could achieve by strengthening municipal financial transparency and accountability The procedures and benchmarking established by the MFSA assist in this process
The framework has a number of unique features that differentiate it from normal practices It can promote accountability in local administration by focusing on self-assessment by municipal staff which also enables them to more effectively identify the most realistic actions to place in their improvement plan505
City officials are also actively encouraged to share their findings with other cities to promote learning and visibility in the use of public funds An example of this approach was the UPP Technical Workshop on Municipal Finance and Urban Audit held in 2018 with 40 participants from cities in Albanian and North Macedonia506
Results and lessons learnedBy using the MFSA approach Rijeka developed an action plan to improve its finances The main objectives of this multi-year planning and capital investment programme were507
bull to provide a stronger revenue foundation for the city with more robust local tax collection
bull to increase the autonomy and flexibility of financial operations
bull to improve financial management and build capacity and financial literacy within the city council
The MFSA tool not only helped Rijeka to identify these key objectives but also enabled the city to meet these goals in the future by providing a key framework for tracking spending through the use of financial ratio analysis which creates municipal finance benchmarks for internal purposes
Links to similar initiativesZaprešić creditworthiness Kolkata creditworthiness Istanbul land asset management
504 See World Bank Institute (2013)505 See Farvacque-Vitkovic and Sinet (2014)506 See SEE Cities (2018)507 See World Bank (2013)
Case studies - finance
187
Snapshot
bull Country Melbourne Australia
bull Population Large ndash 48 million (2017)
bull Policy area Finance
bull Policy option Municipal funding support for green investments
bull Financial capacity Strong
bull Administrative capacity Strong
Context and policy overviewIn 2003 the city of Melbourne set out a roadmap to achieve net zero emissions by 2020508 The Sustainable Melbourne Fund (SMF) was established concurrently with the roadmap preparation in order to provide financial support to businesses implementing projects that have an environmental benefit These projects include everything from solar waste and
water solutions to more innovative and complex measures such as waste to energy projects509
The SMF furthers the city councilrsquos sustainability goals ensuring that the activities it funds create financial social and environmental benefits
In 2016 the fund was valued at AUD 156 million including an initial investment of AUD 5 million in equity and a further AUD 10 million debt facility510 This success led to national expansion of the programme In 2019 the fund was recapitalised and expanded across Australia with increased investment becoming the Sustainable Australia Fund511
The fund allows both tenants and property owners of small and medium-sized enterprises (SMEs) to obtain up to 100 per cent finance with repayments made through the local council (often through property rates) This enables a business to get an immediate boost to its profits through a reduction in energy bills while property owners benefit from capital growth to their building Loans of up to AUD 500000 are provided for individual projects that deliver environmental and economic benefits512
Climate Fund Melbourne Australia
The Sustainable Melbourne Fund allows both tenants and property owners of small and medium-sized enterprises to obtain 100 per cent finance for renewable-energy and energy-efficiency projects with repayments made through council rates
508 See City of Melbourne (2008)509 See City of Melbourne (nd)510 See C40 Cities (2016)511 See Sustainable Australia Fund (2020)512 See City of Melbourne (2020)
Case studies - finance
188
513 See Sustainable Australia Fund (2020)514 See C40 Cities (2016)515 See Better Building Finance (nd)516 See C40 Cities (2016)517 Ibid 518 Ibid
ImplementationA key component of the SMF programme involves financing packages that are designed to overcome the hurdle of owners lacking credit The Environmental Upgrade Finance (EUF) for instance is a flagship product developed for the programme and administered by the SMF
The EUF is an agreement between parties ndash the owner of the building a financial institution and the city of Melbourne The financial institution lends money to the building owner and the city uses rates andor taxes to collect the loan repayments and return these funds to the lender The loans are specially designed to include fixed interest rates and repayment periods of up to 20 years Importantly the charge is fixed to the building and can be passed on to the next owner if the building is sold513
As a further option retrofitting costs (in other words the loan) can be shared between the owner and the tenant as a way of overcoming the split-incentive dilemma whereby the owner pays for an upgrade and the tenants benefit from lower energy expenses514 The SMF also developed a simple application process for SMEs that does not require consent or approval from the existing financiers of the properties
Barriers and critical success factorsDeveloping new products and services of this type requires a sound understanding of where market gaps exist The SMF studied the market produced novel revenue models went beyond the simpler goal of stimulating economic activity in the sustainability sector and created scalable products and services
When a city operates a climate fund it can require substantial resources Frequently the city will also depend on partner organisations to help in particular technical or specialist areas such as creating communications and sales strategies For example the SMF partnered with ClimateWorks Australia to create the Better Building Finance website515
Communications and public relations are also critical in the creation of climate funds It is also vital to sell as much of the financial package as possible516
Results and lessons learned
bull The SMF has directly invested more than AUD 169 million (US$ 125 million equivalent) in building retrofits district or neighbourhood innovations renewable energy systems software technology and lighting solutions517
bull Cumulatively these investments have led to GHG reductions that exceed 245000 tonnes The SMF reinvests the returns and co-finances projects with other banks Altogether this work has resulted in more than AUD 26 million (US$ 192 million) of projects in energy efficiency and renewable energy518
Councils can play a key role as facilitators between tenants property owners and financial institutions Melbourne has demonstrated a role for councils in developing new financial products and services that meet the needs of disparate groups The council found that the SMFrsquos administrator role in environmental upgrade agreements was cost effective and aligned with the preferences of the industryrsquos key actors
Links to similar initiativesMelbourne renewable energy aggregated power purchase agreement San Francisco investment grant Mexico City green bond
189
AfDB ADB EBRD and IDB (2019) Creating Liveable Cities Regional Perspectives ADB Manila Available at httpswwwadborgsitesdefaultfilespublication531126livable-cities-main-reportpdf (last accessed 18 August 2020)
M F Alam S S Guntoju and A Sikka (2019) ldquoChennai Water crisis a wake-up call for Indian citiesrdquo Down to Earth Available at httpswwwdowntoearthorginblogwaterchennai-water-crisis-a-wake-up-call-for-indian-cities-66024 (last accessed on 29 September 2020)
E Al-Karablieh and A Salman (2016) ldquoWater Resources Use and Management in Jordan ndash a Focus on Groundwaterrdquo IWMI Project Report 11 Available at httpsgw-menaiwmiorgwp-contentuploadssites3201704Rep11-Water-resources-use-and-management-in-Jordan-a-focus-on-groundwaterpdf (last accessed on 29 September 2020)
African Circular Cities Alliance (nd) ldquoSouth Africa Case Studiesrdquo ACCA Available at httpsafriccaorgcase-studiesSouthAfrica (last accessed on 24 September 2020)
M P G Aguilar (2015) ldquoParticipatory Design for Public Urban Spacesrdquo Global Compact Cities Programme website Available at httpscitiesprogrammeorgwp-contentuploads201910participatory_design-report_webpdf (last accessed 18 August 2020)
Ajuntament de Barcelona (nda) ldquoCitizen Commitment to Sustainability ndash a More Sustainable Barcelonardquo Available at httpsajuntamentbarcelonacatecologiaurbanaenwhat-we-do-and-whypublic-commitmentcitizen-engagement-network (last accessed on 29 September 2020)
Ajuntament de Barcelona (ndb) ldquoSuperblocks - lsquoLetrsquos fill the streets with lifersquordquo Available at httpsajuntamentbarcelonacatecologiaurbanaenbodies-involvedcitizen-participationsuperblocks (last accessed on 29 September 2020)
Ajuntament de Barcelona (ndc) ldquoA road map to combat climate changerdquo Available at httpswwwbarcelonacatbarcelona-pel-climaennoticiaa-road-map-to-combat-climate-change_646065 (last accessed on 29 September 2020)
Ajuntament de Barcelona (ndd) ldquoUrban Mobility Plan (2013-2018)rdquo Available at httpsajuntamentbarcelonacatecologiaurbanaenwhat-we-do-and-whyactive-and-sustainable-mobilityurban-mobility-plan (last accessed on 29 September 2020)
Ajuntament de Barcelona (nde) ldquoNew Urban Mobility Plan for 2019-2024rdquo Available at httpswwwbarcelonacatmobilitatennews-and-documentsnew-urban-mobility-plan-2019-2024 (last accessed on 29 September 2020)
S Aparcana (2017) ldquoApproaches to formalization of the informal waste sector into municipal solid waste management systems in low- and middle-income countries Review of barriers and success factorsrdquo Waste Management Vol 61 pp 593-607
ASEF CULTURE360 (2011) ldquoThe Paintbrush Factoryrdquo Available at httpsculture360aseforgresourcespaintbrush-factory (last accessed on 6 August 2019)
Asian Development Bank (2011) Inclusive Cities Urban Development Series Manila Available at httpswwwadborgpublicationsinclusivecities (last accessed 18 August 2020)
AVK International (nd) ldquoExcessive leakage reduction in Drakensteinrdquo Available at httpswwwavkvalveseuencaseswater-casesleakage-reduction-drakenstein (last accessed on 5 August 2019)
R L Baghdali T Yino M Nasereddin and L Nadifi (2013) ldquoDocumentation of best practices in non-revenue water management in selected Mediterranean countriesrdquo Available at httpwwwswim-smeufilesBest_Practices_in_non-revenue_water_EN_Finalpdf (last accessed on 29 September 2020)
Baltic Environment and Energy (2007) ldquoSwedish Environmental Policies History and present regulationsrdquo Available at httpwwwubcwheeleudownloadphpattachmentsarticles607Swedish20environmental20policypdf (last accessed on 20 October 2020)
L Barber (2016) ldquoCarsharing carpooling ridesharinghellipwhatrsquos the differencerdquo 12 May 2016 Liftshare website Available at httpblogliftsharecomliftsharecarsharing-carpooling-ridesharing-whats-thedifference (last accessed 18 August 2020)
Barcelona Energia (2019) ldquoNuestra Actividadrdquo Barcelona Energia web page Available at httpswwwbarcelonaenergiacatesnuestraactividad (last accessed 18 August 2020)
U Batsaikhan Z Darvas and I Goncalves Raposo (2018) People on the move migration and mobility in the European Union Blueprint Series 28 Bruegel Brussels Available at httpbruegelorgwp-contentuploads201801People_on_the_move_ONLINEpdf (last accessed 18 August 2020)
M Bausells (2016) ldquoSuperblocks to the rescue Barcelonarsquos plan to give streets back to residentsrdquo The Guardian 17 May 2016 Available at httpswwwtheguardiancomcities2016may17superblocks-rescue-barcelona-spain-plan-give-streets-back-residents (last accessed on 29 September 2020)
BBC (2009) ldquoThe city where bicycles dominaterdquo Available at httpnewsbbccouk1hiengland8393475stm (last accessed on 20 October 2020)
BBC News (2016) ldquoYoung people urged for park-life viewsrdquo M Kinver September 2016 BBC website Available at httpswwwbbccouknewsscience-environment-37505850 (last accessed 18 August 2020)
Berliner Energieagentur (nda) ldquoEnergy Saving Partnership A Berlin Success Modelrdquo Available at httpseceuropaeuenergyintelligentprojectssitesiee-projectsfilesprojectsdocumentseesi_good_practices_from_berlin_enpdf (last accessed 8 October 2020)
Berliner Energieagentur (ndb) ldquoBerliner Energiesparpartnerschaftenrdquo Berliner-e-agenturde Available at httpswwwberliner-e-agenturdeennode154 (last accessed 8 October 2020)
Berliner Energieagentur (2006) ldquoPerformance Contracting A Berlin Success Modelrdquo Berlin Senate Department of Urban Development Available at httpswwwberliner-e-agenturdesitesdefaultfiles2018-09broschuereenergiesparpartnerschaftenpdf (last accessed 12 July 2019)
Berliner Energieagentur (2019) ldquoMarket Report on the German EPC Marketrdquo Available at httpsguarantee-projecteudewp-contentuploadssites2201612guarantEE_Market_Report_Germanypdf (last accessed 11 October 2020)
Better Building Finance (nd) website Available at httpsbetterbuildingfinancecomau (last accessed on 8 October 2020)
J R Bilbao (2015) ldquoWhat is the Territorial Approach to Local Developmentrdquo Capacity4Dev knowledge sharing platform Available at httpseuropaeucapacity4devarticlewhat-territorial-approach-localdevelopment (last accessed 18 August 2020)
A G Blanco M Nancy Moreno D M Vetter and M F Vetter for Inter-American Development Bank (2017) ldquoThe Potential of Land Value Capture for financing urban projects methodological considerations and case studiesrdquo Available at httpspublicationsiadborgpublicationsenglishdocumentThe-Potential-of-Land-Value-Capture-for-Financing-Urban-Projects-Methodological-Considerations-and-Case-Studiespdf (last accessed on 8 October 2020)
References
190
Bloomberg (2017) ldquoBarcelonarsquos Car-Taming lsquoSuperblocksrsquo Meet Resistancerdquo Available at httpswwwbloombergcomnewsarticles2017-01-20barcelona-s-superblocks-expand-but-face-protests (last accessed on 29 September 2020)
Bloomberg Citylab (2012a) ldquoWhat Cities Can Learn From Torontorsquos Green Roof Policyrdquo Available at httpswwwcitylabcomdesign201204what-cities-can-learn-torontos-green-roof-policy1846 (last accessed 18 August 2020)
Bloomberg Citylab (2012b) ldquoWhy Denser Cities Are Smarter and More Productiverdquo 10 December 2012 RFlorida Available at httpswwwbloombergcomnewsarticles2012-12-10why-denser-citiesare-smarter-and-more-productivetargetText=Specifically2C20doubling20density20productivityof20two20to20four20percentamptargetText=It20thus20goes20well20beyondperformance20of20individual20industrial20sectors (last accessed 18 August 2020)
O Borrero Ochoa (2011) ldquoBetterment Levy in Colombia Relevance Procedures and Social Acceptabilityrdquo Available at httpswwwlincolninstedusitesdefaultfilespubfiles1899_1213_LLA110404pdf (last accessed on 6 August 2019)
A Bortoleto A and K Hanaki (2006) ldquoAnalysis of Waste Prevention Policies Applied at the Solid Waste Management in Belo Horizonte Brazilrdquo Available at httpswwwiswaorguploadstx_iswaknowledgebase543801_Paperpdf (last accessed on 25 October 2020)
B Boza-Kiss P Bertoldi and M Economidou (2017) Energy Service Companies in the EU Status review and recommendations for further market development with a focus on Energy Performance Contracting European Commission Joint Research Centre Available at httpspublicationsjrceceuropaeurepositorybitstreamJRC106624kjna28716ennpdf (last accessed 11 October 2020)
J Brandl and I Zielinska (2020) ldquoReviewing the Smart City Vienna Framework Strategyrsquos Potential as an Eco-Social Policy in the Context of Quality of Work and Socio-Ecological Transformationrdquo Sustainability 2020 Vol 12 (3) 859 Available at httpsdoiorg103390su12030859 (last accessed 24 September 2020)
M Braun (2017) ldquoBike Sharing System in Burgas (Bulgaria)rdquo Available at httpswwweltisorgdiscovercase-studiesbike-sharing-system-burgas-bulgaria (last accessed on 20 October 2020)
D Broekhoff G Piggott and P Erickson (2018) Building Thriving Low-Carbon Cities An Overview of Policy Options for National Governmentsrdquo Coalition for Urban Transitions London and Washington DC Available at httpsurbantransitionsglobalenpublicationbuilding-thriving-lowcarbon-cities-an-overview-of-policy-options-for-national-governments (last accessed 18 August 2020)
J M Bryson B C Crosby and M Middleton Stone (2015) ldquoDesigning and Implementing Cross-Sector Collaborations Needed and Challengingrdquo Public Administration Review Vol 75 (5) pp 647-663 Available at httpswwwhhhumnedusiteshhhumnedufilesdesigning_and_implementing_cross-sector_collaborations_needed_and_challengingpdf_0pdf (last accessed 18 August 2020)
R Buchler and J Pucher (2011) ldquoSustainable Transport in Freiburg Lessons from Germanyrsquos Environmental Capitalrdquo Available at httpswwwtandfonlinecomdoiabs10108015568311003650531 (last accessed on 20 October 2020)
C Cadell N Falk and F King (2008) ldquoRegeneration in European cities making connectionsrdquo Joseph Rowntree Foundation 7 April 2008 Available at httpswwwjrforgukreportregeneration-european-cities-making-connections (last accessed on 29 September 2020)
Centre for Public Impact (2016) ldquoIntegrated solid waste management in Belo Horizonte Brazilrdquo Available at httpswwwcentreforpublicimpactorgcase-studyintegrated-waste-management-brazil (last accessed on 3 July 2019)
Centre for Public Impact (2017) ldquoThe Seoul Innovation Bureau and its ldquoSharing Cityrdquo initiativerdquo Available at httpswwwcentreforpublicimpactorgcase-studyseoul-innovation-bureau (last accessed on 30 September 2020)
C40 Cities (2015) ldquoYokohama - Yokohama 3R Dream Planrdquo Available at httpswwwc40orgawards2015-awardsprofiles59 (last accessed on 1 October 2020)
C40 Cities (2016a) ldquoCase Study C40 Good Practice Guides Yokohama - 3R Dream Planrdquo Available at httpswwwc40orgcase_studiesc40-good-practice-guides-yokohama-3r-dream-plan (last accessed on 1 October 2020)
C40 Cities (2016b) ldquoC40 Good Practice Guides Melbourne ndash Sustainable Melbourne Fundrdquo Available at httpswwwc40orgcase_studiesc40-good-practice-guides-melbourne-sustainable-melbourne-fund (last accessed on 8 October 2020)
C40 Cities (2016c) ldquoCities 100 Barcelona - Redefining City Blocks to Tackle Traffic-Related Emissionsrdquo Available at httpswwwc40orgcase_studiescities100-barcelona-redefining-city-blocks-to-tackle-traffic-related-emissions (last accessed on 29 September 2020)
C40 Cities (2016d) ldquoCities 100 City Solutions for an Urbanizing Worldrdquo Available at httpsissuucomsustainiadocscities100_2016_final_small (last accessed on 29 September 2020)
C40 Cities (2016e) ldquoGood Practice Guide Waste to Resourcesrdquo Available at httpc40-production-imagess3amazonawscomother_uploadsimages554_W2R_UPDATED_EC_15316originalpdf1458040149 (last accessed on 1 October 2020)
C40 Cities (2017a) ldquoCase Study Cities 100 Cape Town - Industrial Resource Exchanges Reduce CO2rdquo Available at httpswwwc40orgcase_studiescities100-cape-town-industrial-resource-exchanges-reduce-co2 (last accessed on 30 September 2020)
C40 Cities (2017b) ldquoUrban Efficiency II Mexico City ndash Sustainable Buildings Certification Programrdquo case study February 2017 Available at httpswwwc40orgcase_studiesurban-efficiency-2-sustainable-buildingscertification-program (last accessed 18 August 2020)
C40 Cities (2017c) ldquoUrban Efficiency II Seven Innovative City Programmes for Existing Building Energy Efficiencyrdquo Available at httpsissuucomc40citiesdocsurbanefficiencyii_final_hi_res__1_ (last accessed 8 October 2020)
C40 Cities (2018) ldquoThe implementation of the Superblocks programme in Barcelona Filling our streets with liferdquo March 2018 C40 Cities website Available at httpswwwc40orgcase_studiesbarcelona-superblocks (last accessed 18 August 2020)
C40 Cities (2019) ldquoHow to install solar panels on city-owned property and lead by examplerdquo Available at httpswwwc40knowledgehuborgsarticleHow-to-install-solar-panels-on-city-owned-property-and-lead-byexamplelanguage=en_US (last accessed 18 August 2020)
C40 Cities and Climate-KIC (2018) ldquoMunicipality-led circular economy case studiesrdquo Available at httpswwwc40orgresearchesmunicipality-led-circular-economy (last accessed on 12 October 2020)
CityLab (2016) ldquoHow Ljubljana Turned Itself Into Europes lsquoGreen Capitalrsquordquo Available at httpswwwcitylabcomdesign201602how-ljubljana-turned-itself-into-europes-green-capital458934 (last accessed on 19 July 2019)
Citynvest (2015) ldquoBerlin Energy Saving Partnershipsrdquo Available at httpcitynvesteusitesdefaultfileslibrary-documentsModel202_Berlin20Energy20Saving20Partnerships_finalpdf (last accessed 11 October 2020)
City of Copenhagen Technical and Environmental Administration Traffic Department (2011) ldquoThe City of Copenhagenrsquos Bicycle Strategy 2011-2025rdquo Available at httpswwweltisorgsitesdefaultfilescase-studiesdocumentscopenhagens_cycling_strategypdf (last accessed on 16 July 2019)
City of Zaprešić Finance and Budgeting Department (2018) ldquoThe City of Zaprešić Experience in the Application of MFSA ndash Action Planrdquo Available at httpwwwseecitieseuseecitieseuPortals0ImagesUploadDocumentsCity20to20City20dialogue20Skopje202017City20of2020Zapresicpdfver=2018-01-10-084851-633 (last accessed 18 August 2020)
191
City of Ljubljana (2020) ldquoTransport and mobilityrdquo in Ljubljanasi Available at httpswwwljubljanasienljubljana-for-youtransport-in-ljubljana (last accessed 20 October 2020)
City of Melbourne (nd) ldquoSustainable Melbourne Fundrdquo Available at httpwwwmelbournevicgovaubusinesssustainable-businessPagessustainable-melbourne-fundaspx (last accessed on 8 October 2020)
City of Melbourne (2008) ldquoZero Net Emissions by 2020 Update 2008rdquo Available at httpswwwmelbournevicgovauSiteCollectionDocumentszero-net-emissions-2008pdf
City of Stuttgart Office for Environmental Protection (nd) ldquoClimate Atlas of the Region of Stuttgart (2008)rdquo Available at httpswwwstadtklima-stuttgartdeindexphpclimate_climate_atlas_2008 (last accessed on 20 October 2020)
City of Toronto (nd) ldquoSection 37 An Essential Tool for Building Healthier Neighbourhoodsrdquo Available at httpswwwtorontocacity-governmentplanning-developmentofficial-plan-guidelinessection-37-benefits (last accessed on 29 September 2020)
CIVITAS (2009a) ldquoLundrdquo Available at httpscivitaseucontentlund (last accessed on 20 October 2020)
CIVITAS (2009b) ldquoSmart choices for cities Cycling in the Cityrdquo CIVITAS WIKI Policy Analysis Series Available at httpscivitaseusitesdefaultfilesciv_pol-09_m_webpdf (last accessed 18 August 2020)
CIVITAS (2013) ldquoUpdate of the sustainable urban transport planrdquo in Civitaseu Available at httpscivitaseumeasureupdate-sustainable-urban-transport-plan (last accessed 20 October 2020)
Climate ADAPT (2019) ldquoFour pillars to Hamburgrsquos Green Roof Strategy financial incentive dialogue regulation and science (2016)rdquo Available at httpsclimate-adapteeaeuropaeumetadatacase-studiesfour-pillarsto-hamburg2019s-green-roof-strategy-financial-incentive-dialogueregulation-and-sciencecost_benefit_anchor (last accessed 18 August 2020)
Coins Global (2015) ldquoNet Zero Energy Buildings (NZEBs) Building the Futurerdquo February 2015 Available at httpswwwcoins-globalcomstoragedocumentsEmerging-Technologies-for-the-Built-Environmen-Net-Zero-Energy-Buildingspdf (last accessed 18 August 2020)
P Collier E Glaser A Venables M Blake and P Manwaring (2019) ldquoAccess to opportunity policy decisions for enhancing urban mobilityrdquo IGC Cities that Work Policy Framing Paper Available at httpswwwtheigcorgwp-contentuploads201805access-to-opportunity-3-march1pdf (last accessed 18 August 2020)
C Colomb (2007) Making Connections Transforming People and Places in Europe Case Study of Roubaix Lille URBED and the Joseph Rowntree Foundation 29 June 2006 updated December 2007 Available at httpurbedcoopsitesdefaultfilesCase20Study20of20Roubaix20Lillepdf (last accessed on 29 September 2020)
F Colombijn and M Morbidini (2017) ldquoPros and cons of the formation of waste-pickersrsquo cooperatives a comparison between Brazil and Indonesiardquo from Decision 44 91ndash101 Available at httpslinkspringercomarticle101007s40622-017-0149-5 (last accessed on 2 October 2020)
Committee on Climate Change (2016) ldquoNext Steps for UK Heat Policyrdquo Available at httpswwwthecccorgukpublicationnext-steps-for-ukheat-policy (last accessed 18 August 2020)
Copenhagen Resource Institute and Bipro (2014) ldquoCapital factsheet on separate collectionrdquo Available at httpswwwmunicipalwasteeuropeeusitesdefaultfilesSI20Ljubljana20Capital20factsheetpdf (last accessed on 9 July 2019)
J Corfee-Morlot L Khamal Chaoui MG Donovan I Cochran A Robert and PJ Teasdale (2009) ldquoCities Climate Change and Multilevel Governancerdquo OECD Environmental Working Papers No 14 OECD Available at httpswwwoecdorgenvcc44242293pdf (last accessed 18 August 2020)
Croatian Bureau of Statistics (2012) Population by Ethnicity by TownsMunicipalities 2011 Census County of Primorje-Gorski kotar Available at httpswwwdzshrEngcensusescensus2011resultshtm
E01_01_04e01_01_04_zup08html (last accessed on 8 October 2020)
CTCN (2015) ldquoRehabilitation and Modernization of the district heating (DH) system in the City of Banja Lukardquo Climate Technology Centre and Network August 2015 Available at httpswwwctc-norgtechnical-assistanceprojectsrehabilitation-and-modernization-district-heating-dh-systemcity-banja (last accessed 18 August 2020)
L Dakskobler (2019) ldquoFrom no recycling to zero waste how Ljubljana rethought its rubbishrdquo The Guardian May 2019 Available at httpswwwtheguardiancomcities2019may23zero-recycling-to-zero-waste-how-ljubljana-rethought-its-rubbish (last accessed 25 September 2020)
S David AG Sabiescu and L Cantoni (2013) ldquoCo-design with communities A reflection on the literaturerdquo November 2013 Conference paper IDIA 2013 Bangkok Available at httpswwwresearchgatenetpublication257998124_Co-design_with_communities_A_reflection_on_the_literature (last accessed 18 August 2020)
demosEuropa ndash Centre for European Strategy (2015) ldquoPoland as a Global Development Partner Towards Polandrsquos Global Engagementrdquo World Bank Washington DC Available at httppubdocsworldbankorgen228061435014173462Poland-Global-engagementpdf (last accessed 15 October 2020)
Department MA 18 ndash Urban Development and Planning (2018) ldquoMonitoring Report 2017 Smart City Wien Framework Strategyrdquo City of Vienna Urban Development and Planning Available at httpswwwwiengvatstadtentwicklungstudienpdfb008520pdf (last accessed 18 August 2020)
C Deuskar (2015) ldquoWhat does ldquourbanrdquo meanrdquo World Bank Blog June 2015 Available at httpsblogsworldbankorgsustainablecitieswhatdoes-urban-mean (last accessed 18 August 2020)
S M Dias (2016) ldquoWaste pickers and cities Environment amp Urbanisationrdquo from Environment and Urbanization Vol 28 No 2 October 2016 Available at httpsjournalssagepubcomdoipdf1011770956247816657302 (last accessed on 3 July 2019)
D Di Santo (2018) ldquoWhite certificates in Italy what happened what to expectrdquo Bolzano 4 October 2018 Available at httpblogfire-italiaorgwp-contentuploads2018112018-10-white-certificatepdf (last accessed 11 October 2020)
D Di Santo L De Chicchis and E Biele (2018) ldquoWhite certificates in Italy lessons learnt over 12 years of evaluationrdquo from 2018 International Energy Policy and Programme Evaluation Conference Vienna Austria Available at httpswwwdariodisantocomwp-contentuploads2018072018-DiSanto_paper_vienna-IEPPECpdf (last accessed 28 September 2020)
Drakenstein Municipality (2013) ldquoDrakenstein Water Demand Management Programme ndash A resounding successrdquo Available at httpsshowmecozapaarlnewsdrakenstein-water-demand-management-programme-a-resounding-success (last accessed on 29 September 2020)
M Dri P Canfora I Antonopoulos and P Gaudillat (2018) Best environmental management practice for the waste management sector JRC Science Policy Report Publications Office of the European Union Available at httpseceuropaeujrcenpublicationeur-scientific-andtechnical-research-reportsbest-environmental-management-practicewaste-management-sector (last accessed 18 August 2020)
EBRD (2017) ldquoEBRD to fund installation of heat meters in Kazakhstanrdquo S Pyrkalo EBRD website February 2017 Available at httpswwwebrdcomnews2017ebrd-to-fund-installation-of-heat-meters-in-kazakhstan-html (last accessed 18 August 2020)
EBRD (2018a) ldquoGreen Cities Framework ndash Banja Luka District Heatingrdquo project summary document Available at httpswwwebrdcomwork-with-usprojectspsdgrcf-banja-luka-district-heatinghtml (last accessed 18 August 2020)
EBRD (2018b) ldquoMaking district heating happen empowering users through fair meteringrdquo policy paper Available at httpswwwebrdcomdocumentsadminmaking-district-heating-happen-empowering-usersthrough-fair-meteringpdf (last accessed 18 August 2020)
192
EBRD (2019) ldquoFast-growing EBRD Green Citiesrdquo news page Available at httpswwwebrdcomnews2019fastgrowing-ebrd-green-cities-signsup-its-25th-city-html (last accessed 18 August 2020)
EcoMobility SHIFT (nd) ldquoBurgasrdquo Available at httpseceuropaeuenergyintelligentprojectssitesiee-projectsfilesprojectsdocumentsecomobility_shift_ecomobility_shift_case_study_burgas_bg_enpdf (last accessed on 20 October 2020)
The Economist (2012) ldquoThe lure of Chilecon Valleyrdquo The Economist website Available at httpswwweconomistcombusiness20121013the-lure-of-chilecon-valley (last accessed 18 August 2020)
The Economist (2017) ldquoEastern Europersquos wave of emigration may have crestedrdquo The Economist website Available at httpswwweconomistcomeurope20170826eastern-europes-wave-of-emigration-mayhave-crested (last accessed 18 August 2020)
V Edo J Barrio M Allende and M Garcia Nart (1998) ldquoZaragoza Saving Water City (Spain)rdquo Available at httphabitataqupmesbpesonu98bp439enhtml (last accessed on 23 October 2020)
E Eiweida and Z Tokhmakhyan (2011b) ldquoPublic-Private Partnerships Enhances Water Utilityrsquos Performance in Armeniardquo Knowledge Brief issue no 44 Available at httpdocumentsworldbankorgcurateden920781468029671050Public-private-partnership-enhances-water-utilitys-performance-in-Armenia (last accessed on 28 September 2020)
EMF (2019) ldquoPlanning for Compact Connected Citiesrdquo Ellen MacArthur Foundation Available at httpswwwellenmacarthurfoundationorgassetsdownloads1_Buildings_Planning_Mar19pdf (last accessed 18 August 2020)
Energy Cities (2016a) ldquoFrederikshavn Denmark Mobilising savings sleeping on citizens bank accountsrdquo the European association of cities in energy transition January 2016 Available at httpsenergy-citieseufrederikshavn-denmark-mobilising-savings-sleeping-on-citizens-bankaccounts (last accessed 18 August 2020)
Energy Cities (2016b) ldquoldquoSuperblocksrdquo free up to 92 of public space in Barcelonardquo Available at httpenergy-citieseubest-practicesuperblocks-free-up-to-92-of-public-space-in-barcelona (last accessed on 29 September 2020)
Energy Sector Management Assistance Program (ESMAP) (2011a) ldquoGood practices in city energy efficiency Yerevan Armenia ndash Water and Sewerage Management Contractrdquo Energy Efficient Cities Initiative Available at httpswwwesmaporgsitesdefaultfilesesmap-filesArmenia_Yerevan_Water_Case_Studypdf (last accessed on 28 September 2020)
Environmental Local Authorities InterBalkan Network (nd) ldquoThe municipality of Rijeka Croatiardquo Available at httpselaineupartnersrijeka-croatia (last accessed on 22 May 2019)
ERRee (2020) ldquoCity of Tartu seeking to reduce CO2 emissions by 40 percent by 2030rdquo ERRee News 1 September 2020 Available at httpsnewserree1129902city-of-tartu-seeking-to-reduce-co2-emissions-by-40-percent-by-2030 (last accessed 12 October 2020)
Energy Systems Catapult (2018) ldquoItalian Energy Efficiency White Certificate Schemerdquo Available at httpsescatapultorgukwp-contentuploads201810Italy-White-Certificate-Scheme-Case-Study-FINALpdf (last accessed 28 September 2020)
Euro Cities (2019) ldquoCluj-Napoca Romania ndash Imagine the future of the city Innovation and Civic Imagination Centre ndash CIICrdquo Available at httpnwseurocitieseuMediaShellmedia2019_ROCK_CaseStudiesBooklet_Clujpdf (last accessed 18 August 2020)
EURONET 5050 MAX (nd) EURONET 5050 MAX website Available at httpwwweuronet50-50maxeuen (last accessed 18 August 2020)
European Association for Local Democracy (2016) ldquoDecentralised cooperation an added value for Eastern Partnership Countriesrdquo Available at httpseuropeanmovementeuwp-contentuploads201602139-Paper_EaP_IssueNo1_AVpdf (last accessed 15 October 2020)
European Commission (nda) ldquoLjubljana becomes the first EU capital to adopt Zero Waste Goalrdquo news page Available at httpeceuropaeuenvironmenteuropeangreencapitalljubljana-zero-waste-goal (last accessed 18 August 2020)
European Commission (ndb) ldquoReclaiming city streets for people Chaos or quality of liferdquo EC Directorate-General for the Environment Available at httpeceuropaeuenvironmentpubspdfstreets_peoplepdf (last accessed on 2 July 2019)
European Commission (2014) ldquoCapital factsheet ndash LlubjlanaSloveniardquo Part of EC study ldquoAssessment of separate collection schemes in the 28 capitals of the EUrdquo Municipal Waste Europe website Available at httpswwwmunicipalwasteeuropeeusitesdefaultfilesSI20Ljubljana20Capital20factsheetpdf (last accessed 18 August 2020)
European Commission (2018) ldquoFinancing a Sustainable European Economy ndash Final Report 2018 by the High-Level Expert Group on Sustainable Financerdquo p 7 Available at httpseceuropaeuinfositesinfofiles180131-sustainable-finance-final-report_enpdf (last accessed 18 August 2020)
European Commission (2019) ldquoLjubljana becomes the first EU capital to adopt Zero Waste Goalrdquo Available at httpeceuropaeuenvironmenteuropeangreencapitalljubljana-zero-waste-goal (last accessed on 9 July 2019)
European Commission (2020) Nearly Zero Energy Buildings European Commission website Available at httpseceuropaeuenergytopicsenergy-efficiencyenergy-efficient-buildingsnearly-zero-energy-buildings_en (last accessed 14 April 2020)
European Commission Directorate ndash General Environment (2012) ldquoPreparing a Waste Prevention Programme Guidance documentrdquo October 2012 Available at httpeceuropaeuenvironmentwastepreventionpdfWaste20prevention20guidelinespdf (last accessed 18 August 2020)
European Environment Agency (2014) ldquoStuttgart combating the heat island effect and poor air quality with green ventilation corridors (2014)rdquo case study Climate Adapt website Available at httpsclimate-adapteeaeuropaeumetadatacase-studiesstuttgart-combating-the-heat-islandeffect-and-poor-air-quality-with-green-ventilation-corridors (last accessed 18 August 2020)
European Union (2015) ldquoLjubljana European Green Capital 2016rdquo Available at httpeceuropaeuenvironmenteuropeangreencapitalwp-contentuploads201302ljubljana_european_green_capital_2016pdf (last accessed on 2 July 2019)
European Union (2017) Effective multi-level environmental governance for a better implementation of EU environment legislation Study European Committee of the Regions Available at httpscoreuropaeuenengagestudiesDocumentsEnvironmental-governancepdf (last accessed 18 August 2020)
European Union (2018) Directive of the European Parliament and of the Council amending Directive 200898EC on waste Reference PE-CONS 1118 27 April 2018 Available at httpsdataconsiliumeuropaeudocdocumentPE-11-2018-INITenpdf (last accessed on 25 October 2020)
EUROSCOPE (TR1023) (1999) Evaluation Results and Comparative Assessment Available at httpwwwitsleedsacukprojectskonsultprivatelevel2instrumentsinstrument040l2_040chtm (last accessed 18 August 2020)
Eurostat (2020) ldquoPassenger Cars in the EUrdquo web page Available at httpseceuropaeueurostatstatistics-explainedindexphpPassenger_cars_in_the_EUHighest_share_of_passenger_cars_over_20_years_old_in_Poland (last accessed 18 August 2020)
Eurostat and EIB (2018) ldquoA Guide to the Statistical Treatment of Energy Performance Contractsrdquo May 2018 Available at httpseceuropaeueurostatwebgovernment-finance-statisticsmethodologyguidance-onaccounting-rules (last accessed 18 August 2020)
W Fahmi and K Sutton (2010) ldquoCairorsquos Contested Garbage Sustainable Solid Waste Management and the Zabaleenrsquos Right to the Cityrdquo Sustainability Vol 2 (6) pp 1765-1783 Available at httpswwwmdpicom2071-1050261765 (last accessed 18 August 2020)
193
C Farvacque-Vitkovic and A Sinet (2014) ldquoAchieving greater transparency and accountabilityrdquo Municipal Finances A Handbook for Local Governments Chapter 8 Box 86 Available at httpdocuments1worldbankorgcurateden403951468180872451pdfMunicipal-finances-a-handbook-for-local-governmentspdf (last accessed on 8 October 2020)
M Filipovic (2019) ldquoRijeka ndash Smart City experiences and plans for the futurerdquo Available at httpwwwseecitieseuseecitieseuPortals0ImagesUploadDocumentsC2CCity20to20City20Dialogue20-20Cities20Drivers20of20Economy20Vision202030Day2021120Rijeka20-20Smart20Citypdfver=2019-05-08-100821-320 (last accessed on 8 October 2020)
Financial Times (2019) ldquoNumber 214 to Highgate leads UKrsquos electric bus charge ndash British companies use Chinese technology to power up in new age of public transportrdquo Financial Times website November 2019 Available at httpswwwftcomcontent5c81dee4-ffe1-11e9-b7bcf3fa4e77dd47 (last accessed 18 August 2020)
FIRE (2018) ldquoItalian white certificates the new rulesrdquo Federazione Italiana per luso Razionale dellEnergia wwwbuildupeu 20 November 2018 Available at httpswwwbuildupeuenpracticespublicationsitalian-white-certificates-new-rules (last accessed 28 September 2020)
J Fitzgerald (2016) ldquoWhat city planners can learn from Malmorsquos eco-districtsrdquo Available at httpsblogslseacukeuroppblog2016040237589 (last accessed 12 July 2019)
C Ford (2017) ldquoSlovenia has been named the greenest country in the world and this is whyrdquo Available at httpswwwcontikicomsix-twoslovenia-has-been-named-the-greenest-country-in-the-world-and-this-is-why (last accessed on 9 July 2019)
M Galindo Fernandez C Roger-Lacan U Gaumlhrs and V Umaitre (2016) ldquoEfficient district heating and cooling systems in the EUrdquo Available at httppublicationsjrceceuropaeurepositorybitstreamJRC104437study20on20efficient20dhc20systems20in20the20eu20-dec2016_final20-20public20report6pdf (last accessed 11 October 2020)
GEF and UNDP (2010) ldquoPromoting Energy Efficiency in Buildings Lessons Learned From International Experiencerdquo Available at httpswwwthegeforgsitesdefaultfilespublicationsEEBuilding_WEB_2pdf (last accessed 8 October 2020)
Gianni-Origoni amp Grippo-Cappelli Partners (2017) ldquoIl nuovo regime dei certificate bianchi cosa cambiardquo Available at httpwwwgopitdoc_pubblicazioni652_3j1fi3dkur_itapdf (last accessed 8 October 2020)
GIZ (2012) ldquoRecovering resources creating opportunities Integrating the informal sector into solid waste managementrdquo GIZ on behalf of the German Federal Ministry for Economic Cooperation and Development Available at httpswwwgizdededownloadsgiz2011-en-recyclingpartnerships-informal-sector-final-reportpdf (last accessed 18 August 2020)
Global Opportunity Explorer (2018) ldquoCape Town Industrial Resource Exchanges Reduce CO2rdquo Available at httpsgoexplorerorgcape-town-industrial-resource-exchanges-reduce-co2 (last accessed on 30 September 2020)
Global Platform for Sustainable Cities and World Bank (2018) Urban Sustainability Framework (USF) First edition Washington DC Available at httpdocumentsworldbankorgcurateden339851517836894370pdf123149-Urban-Sustainability-Frameworkpdf (last accessed 18 August 2020)
Go to Burgas (2020) ldquoPublic Transportrdquo Available at httpswwwgotoburgascomenindexstatic24 (last accessed on 20 October 2020)
Government of Alberta (2020) ldquoIntermunicipal Collaboration Frameworksrdquo web page Available at httpswwwalbertacaintermunicipalcollaboration-frameworkaspx (last accessed 18 August 2020)
Government of Estonia (2019) Estoniarsquos 2030 National Energy and Climate Plan Final version 19 December 2019 Available at httpseceuropaeuenergysitesenerfilesdocumentsee_final_necp_main_enpdf (last accessed 12 October 2020)
GreenCape (2018) ldquoWISP Case Study Banners to Bagsrdquo Available at httpswwwgreencapecozaassetsUploadsGC3-20181005-
WISPCaseStudy-BannerstoBags-Webpdf (last accessed on 30 September 2020)
J Groszlige N B Groth C Fertner J Tamm and K Alev (2015) Urban energy planning in Tartu [PLEEC Report D42 Tartu] EU-FP7 project PLEEC Available at httpscuriskudkwsfiles142223033D42_Tartu_2015_01_14_finalpdf (last accessed 12 October 2020)
K Heinrich (2018) ldquoParmarsquos journey to world-class food waste recycling levelsrdquo in Beyondfoodwastecom 22 August 2018 Available at httpsbeyondfoodwastecomparmas-journey-to-world-class-food-waste-recycling-levels (last accessed 25 October 2020)
Herne Hill (2015) ldquoHerne Hill Flood Alleviation Scheme Shortlisted for Awardrdquo April 2015 Available at httpwwwhernehillorguknewsherne-hill-flood-alleviation-scheme-shortlisted-award (last accessed 18 August 2020)
M Holder (2018) ldquoBMW takes full ownership of DriveNow carsharing schemerdquo March 2018 Business Green website Available at httpswwwbusinessgreencombgnews3028696bmw-takes-full-ownership-ofdrivenow-carsharing-service (last accessed 18 August 2020)
S Howell (2012) ldquoLocal authorities must break down silos to deliver better public servicesrdquo The Guardian website September 2012 Available at httpswwwtheguardiancomlocal-government-network2012sep14localis-report-public-service-delivery (last accessed 18 August 2020)
ICLEI (nd) ldquoLjubljana (Slovenia)rdquo Available at httpsiclei-europeorgmember-in-the-spotlightpreviousljubljana-slovenia (last accessed on 20 October 2020)
ICLEI (2011a) ldquoFreiburg Successfully reducing automobile trafficrdquo Available at httpoldicleiorgfileadminPUBLICATIONSCase_Stories4_EcoMobilityICLEI_CaseStories_EcoMobility_Freiburgpdf (last accessed on 2 July 2019)
ICLEI (2011b) ldquoLund Sweden An ambitious city of ideas and innovationrdquo Available at httpssustainablemobilityicleiorgwpdm-packagelund-sweden-an-ambitious-city-of-ideas-and-innovation (last accessed on 26 June 2019)
ICLEI (2014) ldquoAmman Jordan ndash Urban agriculture finding multi-purpose Urban NEXUS solutions through collaborative actionrdquo Urban Nexus case story August 2014 Available at httpoldicleiorgfileadminPUBLICATIONSCase_StoriesUrban_NEXUS26_Urban_NEXUS_Case_Story_Amman_ICLEI-GIZ_2014pdf (last accessed 18 August 2020)
ICLEI ndash Local Governments for Sustainability (2016) ldquoBurgas Bulgariardquo Available at httpssustainablemobilityicleiorgecomobility-alliance-back-upburgas-bulgaria (last accessed on 19 October 2020)
ICLEI and GIZ (2014) ldquoOperationalizing the Urban NEXUS ndash Towards resource-efficient and integrated cities and metropolitan regionsrdquo Deutsche Gesellschaft fuumlr Internationale Zusammenarbeit and ICLEI ndash Local Governments for Sustainability Available at httpswwwsustainable-urbanisationorgsitessgupfilespublicationsoperationalising_the_urban_nexuspdf (last accessed 18 August 2020)
IFC (nd) ldquoBucharest Water and Sanitationrdquo Urban Water Available at httpslibrarypppknowledgelaborgdocuments4722download (last accessed on 30 September 2020)
Inclusive Design Research Centre (nd) ldquoCo-designing Inclusive Citiesrdquo IDRC website Available at httpscitiesinclusivedesignca (last accessed 16 April 2019)
Innovative Governance of Large Urban Systems (2017) ldquoThe Greater Moscow Region on its shifting way from transportation to mobilityrdquo S Maltcev IGLUS website July 2017 Available at httpsiglusorgthe-greater-moscow-region-on-its-shifting-way-from-transportation-to-mobility (last accessed 18 August 2020)
Institute for Building Efficiency (2010a) ldquoEnergy Performance Contracting in the European Union Introduction Barriers and Prospectsrdquo Issue Brief August 2010 Available at httpwwwbuildupeusitesdefaultfilescontentInstitute20BE20-20Energy20Performance20Contracting20in20the20European20Unionpdf (last accessed 18 August 2020)
Institute for Building Efficiency (2010b) ldquoEnergy Performance Contracting in the European Union Creating Common lsquoModelrsquo Definitions Processes
194
and Contractsrdquo Issue Brief September 2010 Available at httpwwwbuildupeusitesdefaultfilescontentInstitute20BE-Energy20Performance20Contracting20in20the20EU-20Common20models20definitions2C20Contracts2C20Processespdf (last accessed 18 August 2020)
ITDP (2015) ldquoWhatrsquos Stopping Carsharing 4 Challenges Holding Emerging Markets Backrdquo December 2015 Institute for Transportation and Development Policy Available at httpswwwitdporg20151217whats-stoppingcarsharing-4-challenges-holding-emerging-markets-back (last accessed 18 August 2020)
Institute of Public Administration (2012) ldquoStrategic collaboration in local governmentrdquo Local Government research Series Report no 2 January 2012 Available at httpswwwipaie_fileUploadDocumentsStrategicCollaborationpdf (last accessed 18 August 2020)
Institute on Municipal Finance and Governance (2013) ldquoTrading Density for Benefits Toronto and Vancouver Comparedrdquo Munk School of Global Affairs IMFG Papers on Municipal Finance and Governance No 13 Available at httpsmunkschoolutorontocaimfguploads220imfg_no_13_moorer3_online_finalpdf (last accessed 18 August 2020)
International Bank for Reconstruction and Development and World Bank (2017) ldquoRepublic of Armenia Support to Armeniarsquos Second-Generation Water PPPsrdquo Available at httpsppiaforgdocuments5694download (last accessed on 28 September 2020)
International Transport Forum (2016) ldquoMoscow wins international transport award for tackling traffic gridlockrdquo Available at httpswwwitf-oecdorgmoscow-wins-international-transport-award-tackling-traffic-gridlock (last accessed on 20 October 2020)
International Water Association (2018) Wastewater Report 2018 The Reuse Opportunity Available at httpwwwiwa-networkorgwp-contentuploads201802OFID-Wastewater-report-2018pdf (last accessed on 8 August 2019)
Interreg Danube Transnational Programme (2018) ldquoSummary of all the ATTRACTIVE DANUBE National Workshopsrdquo Available at wwwinterreg-danubeeunews-and-eventsproject-news2322 (last accessed on 16 October 2020)
M Islam (2012) ldquoKey Factors and Readiness Perception Indicators Appraisal Public-Private Partnership in Infrastructure Development Project in Bangladeshrdquo Available at httpscoreacukdownloadpdf61803306pdf (last accessed on 26 October 2020)
S Istenič (2016) ldquoReviving Public Spaces through Cycling and Gardening Ljubljana ndash European Green Capital 2016rdquo in Etnološka tribina Godišnjak Hrvatskog etnološkog društva Vol 46 No 39 2016 Available at httpswwwresearchgatenetpublication311863407_Reviving_Public_Spaces_through_Cycling_and_Gardening_Ljubljana_-_European_Green_Capital_2016 (last accessed 20 October 2020)
C Johnson (2014) ldquoSharing City Seoul A Model for the Worldrdquo Available at httpswwwshareablenetsharing-city-seoul-a-model-for-the-world (last accessed on 30 September 2020)
B Jovičić (2019) ldquoSEE parliamentarians visit Ljubljana ndash European Green Capital and regional leader in sustainable urban mobilityrdquo Available at httpswwwtransformative-mobilityorgnewssee-parliamentarians-visit-ljubljana-european-green-capital-and-regional-leader-in-sustainable-urban-mobility (last accessed on 20 October 2020)
M Kahn (2017) ldquoConstruction begins on Atlantarsquos Proctor Creek Greenwayrdquo Curbed Atlanta website August 2017 Available at httpsatlantacurbedcom201782116176662proctor-creek-greenwayphase-one-construction-starts (last accessed 18 August 2020)
J Kanters and M Wall (2018) ldquoExperiences from the urban planning process of a solar neighbourhood in Malmouml Sweden Urban Planning and Transport Researchrdquo Available at httpswwwtandfonlinecomdoipdf1010802165002020181478323 (last accessed 8 October 2020)
A Kassam (2014) ldquoSmarter urban water how Spainrsquos Zaragoza learned to use lessrdquo The Guardian Available at httpswwwtheguardiancomlifeandstyle2014jul30zaragoza-smarter-urban-water-zaragoza-spain-learned-to-use-less (last accessed on 29 September 2020)
The Korea Times (2018) ldquoSeoul to generate 1 GW of energy from solar by 2022rdquo Korea Times 26 November 2018 Available at httpm
koreatimescokrpagesarticleaspnewsIdx=259295 (last accessed 22 July 2019)
M Kulesza (nd) ldquoMethods and Techniques of Managing Decentralization Reforms in CEE Countries The Polish Experiencerdquo Pennsylvania State University Available at httpciteseerxistpsueduviewdocdownloaddoi=10111118460amprep=rep1amptype=pdf (last accessed 18 August 2020)
A Kumar and R Fester (2019) ldquoFiscal Futures Is there a Space for Better Fiscal Accountability in South Africarsquos Metropolitan Municipalitiesrdquo International Budget Partnership website March 2019 Available at httpswwwinternationalbudgetorg201903fiscal-futures-is-therespace-for-better-fiscal-accountability-in-south-africas-metropolitanmunicipalities (last accessed 18 August 2020)
A Laszek and R Trzeciakowski (2018) ldquoState Decentralization in Poland Has Been Successful but There is Still Room for Improvementrdquo Available at http4libertyeuwp-contentuploads201811ALEKSANDER-C581ASZEK-RAFAC581-TRZECIAKOWSKI_STATE-DECENTRALIZATION-IN-POLAND-HASpdf (last accessed 9 August 2019)
LEGCO (2017) ldquoFeed-in tariff for solar power in selected placesrdquo Available at httpswwwlegcogovhkresearch-publicationsenglish1718in04-feed-in-tariff-for-solar-power-in-selected-places-20180117-epdf (last accessed 22 July 2019)
U Lehrer and P Pantalone (2018) ldquoThe sky is not the limit Negotiating height and density in Torontorsquos condominium boomrdquo from Spaces of Urban Politics pp 85-95 Available at httpswwwresearchgatenetpublication326547999_The_sky_is_not_the_limit_Negotiating_height_and_density_in_Toronto27s_condominium_boom (last accessed on 29 September 2020)
LGB (nd) ldquoSNAGA Development and maintenance of a geospatial information system for service managementrdquo Available at httpswwwlgbsienprojectssnaga (last accessed on 1 October 2020)
M Liksutov (2018a) ldquoModernising Moscow How the Russian capital is transforming its transport servicesrdquo Intelligent Transport 4 October 2018 Available at httpswwwintelligenttransportcomtransport-articles72221moscow-public-transport-network (last accessed on 19 October 2020)
M Liksutov (2018b) ldquoBuilding Smart Transport in Moscowrdquo Interview by McKinsey Available at httpswwwmckinseycomindustriescapital-projects-and-infrastructureour-insightsbuilding-smart-transport-in-moscow (last accessed on 19 July 2019)
M Liksutov (2020) ldquoCity Snapshot Mobility in Moscowrdquo Intelligent Transport 28 January 2020 Available at httpswwwintelligenttransportcomtransport-articles95256city-snapshot-mobility-in-moscow (last accessed on 20 October 2020)
A Linder (2019) ldquoThe formalisation of South African waste pickers in a globalised recycling economyrdquo lecture May 2019 Available at httpswwwlawoxacukeventsformalisation-south-african-waste-pickersglobalised-recycling-economy (last accessed 18 August 2020)
LSE Cities ICLEI and GGGI (2013) Going Green How cities are leading the next economy Available at httpswwwlseacukcitiespublicationsresearch-reportsGoing-Green-How-cities-are-leading-the-next-economy (last accessed on 25 October 2020)
LSE Cities UN-Habitat and United Cities and Local Governments (2016) ldquoHow cities are governed Building a local database for current models of urban governancerdquo Available at httpsurbangovernancenet (last accessed 18 August 2020)
A Magni and W Guumlnther (2014) ldquoCooperatives of waste pickers as an alternative to social exclusion and its relationship with the homeless populationrdquo in Sauacutede e Sociedade vol 23 no1 Satildeo Paulo Jan-Mar 2014 Available at httpswwwscielobrscielophppid=S0104-12902014000100146ampscript=sci_arttextamptlng=en (last accessed on 25 October 2020)
S Maltcev (2017) ldquoThe Greater Moscow Region on its shifting way from transportation to mobilityrdquo Igluscom 9 July 2017 Available at httpsiglusorgthe-greater-moscow-region-on-its-shifting-way-from-transportation-to-mobility (last accessed on 20 October 2020)
195
P Marin M Dambudzo and A Andreasyan (2017) Review of Armeniarsquos Experience with Water Public-Private Partnerships World Bank Group Washington DC Available at httpdocumentsworldbankorgcurateden117301510813106522pdfReview-of-Armenia-s-experience-withwater-public-private-partnershipspdf (last accessed 18 August 2020)
A Marshal (2019) ldquoWhy electric buses havenrsquot taken over the world ndash yetrdquo Wired June 2019 Available at httpswwwwiredcomstoryelectricbuses-havent-taken-over-world (last accessed 18 August 2020)
C Marshall (2016) ldquoWhere is the worldrsquos most hi-tech city (And itrsquos not San Francisco)rdquo The Guardian website October 2016 Available at httpswwwtheguardiancomcities2016oct19where-world-most-hi-tech-city-not-san-francisco (last accessed 18 August 2020)
McKinsey amp Company (2013) ldquoTen quick steps to unlocking tax-revenue collection in rapidly growing marketsrdquo July 2013 Available at httpswwwmckinseycomindustriespublic-sectorour-insightsten-quicksteps-to-unlocking-tax-revenue-collection-in-rapidly-growing-markets (last accessed 18 August 2020)
H Mees (2014) ldquoEntire cities could benefit from green roofsrdquo Delta RotterdamUtrecht University Available at httpsdspacelibraryuunlbitstreamhandle1874306732websitepdfsequence=1ampisAllowed=y (last accessed on 15 July 2020)
Metro (2019) ldquoMetro partners with Getaround to offer car sharing at 27 transit stationsrdquo metronet website page February 2019 The Source blog Available at httpsthesourcemetronet20190207metro-partnerswith-getaround-to-offer-car-sharing-at-27-transit-stations (last accessed 5 May 2019)
RE Millward amp Associates Ltd (2013) ldquoSecuring Cultural Benefits Approaches to the Use of Section 37 for Arts and Culture Facilitiesrdquo Available at httpswwwtorontocalegdocsmmis2013edbgrdbackgroundfile-62975pdf (last accessed on 15 July 2019)
Ministry of Finance of the Slovak Republic (nd) ldquoPlatobny mechanizmus vychadzajuci zo Vzorovej zmluvy o energetickej efektivnosti s garantovanou usporou energierdquo Available at httpswwwmhsrskuploadsfilesCqkpdgoUpdf (last accessed 18 August 2020)
T Misra (2016) ldquoHow to Build Inclusive Citiesrdquo Bloomberg CityLab June 2016 Available at httpswwwcitylabcomequity201606how-tobuild-inclusive-cities487322 (last accessed 18 August 2020)
A Moore (2013) for Institute on Municipal Finance and Governance ldquoTrading Density for Benefits Toronto and Vancouver Comparedrdquo Available at httpsmunkschoolutorontocaimfguploads220imfg_no_13_moorer3_online_finalpdf (last accessed on 15 July 2019)
Moscow Transport (2017) ldquoMoscow Transport strategy main goals and achievementsrdquo Available at httpswwwuneceorgfileadminDAMtransdoc2017wp52_5Sept2017_Ms_Maltsevapdf (last accessed on 19 October 2020)
N Mueller D Rojas-Rueda H Khreis M Cirach D Andreacutes J Ballester X Bartoll C Daher A Deluca C Echave C Milagrave S Maacuterquez J Palou K Peacuterez C Tonne M Stevenson S Rueda and M Nieuwenhuijsen (2020) ldquoChanging the urban design of cities for health The superblock modelrdquo Environment International Vol 134 Available at httpswwwsciencedirectcomsciencearticlepiiS0160412019315223 (last accessed on 29 September 2020)
Municipal Department MA 18 ndash Urban Development and Planning (2018) Monitoring Report 2017 Smart City Wien Framework Strategy Available at httpswwwwiengvatstadtentwicklungstudienpdfb008520pdf (last accessed 16 October 2020)
A Natarajan (2020) ldquoMetro Waterrsquos 10 big promises for Chennai citizens in 2020rdquo Available at httpschennaicitizenmattersinmetro-water-promises-for-chennai-2020-13822 (last accessed on 29 October 2020)
National Assembly for Wales (2018) ldquoLow Carbon Housing the Challengerdquo Climate Change Environment and Rural Affairs Committee August 2018 Available at httpswwwassemblywaleslaid20documentscrld11711cr-ld11711-epdf (last accessed 18 August 2020)
National Lottery Heritage Fund (2014) ldquoPublic parks under threatrdquo June 2014 Heritage Fund website Available at httpswwwheritagefundorguknewspublic-parks-under-threat (last accessed 18 August 2020)
Y Nishida (2013) ldquoEnergy Efficiency in Buildings Policy and Programs in Policy and Programs in Tokyordquo Available at httpswwweu-japaneusiteseu-japaneufilesNishidapdf (last accessed 11 October 2020)
D Norris-Tirrell and JA Clay (2010) Strategic Collaboration in Public and Nonprofit Administration ndash A Practice-Based Approach to Solving Shared Problems Routledge Abingdon and New York Available at httpswwwroutledgecomStrategic-Collaboration-in-Public-and-Nonprofit-Administration-A-Practice-BasedNorris-Tirrell-Claypbook9781420088755 (last accessed on 26 November 2020)
E Oblak (2019) ldquoThe story of Ljubljana Case studyrdquo Available at httpszerowasteeuropeeudownloadscase-study-5-ljubljana-2 (last accessed on 1 October 2020)
S OrsquoCarroll J Wallace C Pineo L Basson J Woodcock R Daniel and C Mouton (2016) ldquoThe Western Cape Industrial Symbiosis Programme (WISP) An Innovative Approach to Resource Efficiency and Waste Minimisation for South African Businessesrdquo from Proceedings of the 20th WasteCon Conference 6-10 October 2014 Somerset West Cape Town Available at httpswww3smediacozainfrastructurenewswp-contentuploadssites4201601Oe28099Carroll-S-et-al-80pdf (last accessed on 30 September 2020)
OECD (nda) ldquoBreaking out of silos Joining up policy locallyrdquo F Froy OECD website Available at httpwwwoecdorgregionalleed43056251pdf (last accessed 18 August 2020)
OECD (ndb) ldquoMixes of policy instrumentsrdquo OECD website Available at httpwwwoecdorgenvtools-evaluationmixesofpolicyinstrumentshtm (last accessed 18 August 2020)
OECD and ICLEI (2016) ldquoGreen Cities Programme Methodologyrdquo Final Report May 2016 Available at httpswwwebrdgreencitiescomassetsUploadsPDF436b87ef46Green-City-Action-Plan-Methodology-Englishpdf (last accessed 18 August 2020)
100 Resilient Cities (nd) 100 Resilient Cities website Available at httpswww100resilientcitiesorg (last accessed 18 August 2020)
100 Resilient Cities (2018) ldquoAtlantarsquos Proctor Creek Greenway delivers multiple co-benefits from a single interventionrdquo Available at httpswww100resilientcitiesorgatlantas-proctor-creek-greenway-deliversmultiple-co-benefits-from-a-single-intervention (last accessed 18 August 2020)
Opensignal (2017) ldquoGlobal State of Mobile Networks (February 2017)rdquo Opensignal website Available at httpswwwopensignalcomreports201702global-state-of-the-mobile-network (last accessed 18 August 2020)
P Pantale (2014) ldquoDensity Bonusing and Development in Torontordquo Available at httpsfesyorkucawp-contentuploads201810Peter-Pantalone-Major-Research-Paper-FINALpdf (last accessed on 15 July 2019)
J Park (2016) ldquoHow the citizens of Seoul benefit from a sharing culture and an enhanced listening policyrdquo Available at httpssocialinnovationexchangeorginsightshow-citizens-seoul-benefit-sharing-culture-and-enhanced-listening-policy (last accessed on 30 September 2020)
Parma Futuro Smart (2020a) ldquoPesatura rifiuti smartrdquo in parmafuturosmartcomuneparmait Available at httpparmafuturosmartcomuneparmaitprogettisistemi-smart-per-pesatura-rifiuti (last accessed on 25 October 2020)
I Petek (2016) ldquoLjubljana Sloveniardquo in IMPACTPAPERECEU Available at httpsimpactpapereceuenfacts-figurescase-studiesljubljana-slovenia (last accessed 25 October 2020)
N Pietzsch JL Duarte Ribeiro J Fleith de Medeiros (2017) ldquoBenefits challenges and critical factors of success for Zero Waste A systematic literature reviewrdquo Waste Management Vol 67 pp 324-353
The Princersquos Foundation for the Built Environment (nd) ldquoStrasbourg Regaining the public realmrdquo Available at httpswwwacademiaedu23526879Strasbourg_Regaining_the_public_realm (last accessed on 19 October 2020)
196
Proračun Grada Rijeke (2018) ldquoProracun(ajme)rdquo Available at httpswwwvojko-obersnelcomhrproracunaj-me2018 (last accessed 15 October 2020)
PublicSpace (2018) ldquoPoblenou ldquoSuperblockrdquo Barcelona (Spain) 2018rdquo Available at httpswwwpublicspaceorgworks-projectk081-poblenou-s-superblock (last accessed on 29 September 2020)
Push-Pull Parking (2015) ldquoCatalogue on Case Studies for Parking Management Solutionsrdquo push-pull-parkingeu Available at httpwwweltisorgsitesdefaultfilestrainingmaterialspp_pm_catalogue_01062015_finalpdf (last accessed 18 August 2020)
Qualenergiait (2017) ldquoPrezzo die TEE alle stells lsquoeffetto Governo e GSErsquordquo Available at httpswwwqualenergiaitarticoli20170316-prezzo-dei-tee-alle-stelle-effetto-governo-e-gse (last accessed 8 October 2020)
S Raghavan (2019) ldquoThe success and failure of Water management in Chennairdquo Future Directions Available at httpswwwfuturedirectionsorgaupublicationthe-success-and-failure-of-water-management-in-chennai (last accessed on 29 September 2020)
Railway Gazette (2020) ldquoLund tramway gets revised launch daterdquo Available at railwaygazettecomprojects-and-planninglund-tramway-gets-revised-launch-date55881article (last accessed on 20 October 2020)
A Rabi (2013) ldquoReview and Analysis of Private Sector Participation Modalities in Water Service Delivery with Emphasis on the Southern Mediterranean Regionrdquo Available at httpwwwswim-smeuindexphpenresourcescategory76-assessments-en (last accessed on 29 September 2020)
M Raud (2020) ldquoLow temperature heating project in Tarturdquo in RELaTEDProjecteu Available at httpwwwrelatedprojecteuwp-contentuploads202004RELaTED-moreinfo-Fortum-Tartu-v2pdf (last accessed 12 October 2020)
Regions4recycling (2014) ldquoGood practice Tallinn Waste awareness educational campaigns for children and adultsrdquo Available at httpdocplayernet22211005-Good-practice-tallinn-waste-awarenesseducational-campaigns-for-children-and-adults-june-2014html (last accessed 18 August 2020)
M Ricci (2020) ldquoFood waste collection and recycling in Italyrdquo webinar presentation for the Bio-based and Biodegradable Industries Association 14 May 2020 Available at httpsbbiaorgukwp-contentuploads202006RICCI-BBIA-FW-Collection-IT-Webinar-2020-0514pdf (last accessed 25 October 2020)
ROCK (2019) ldquoCluj-Napoca Romania Imagine the future of the cityrdquo Participatory Approaches and Social Inclusion in Cultural Heritage Regeneration and Optimisation of Cultural Heritage in Creative and Knowledge Cities Horizon 2020 programme July 2019 Available at httpsinddadobecomview4c399cc1-0836-488c-83d4-fe21588c819b (last accessed 16 October 2020)
N Rogers (2017) ldquoDriving Fee Rolls Back Asthma Attacks in Stockholmrdquo Inside Science website February 2017 Available at httpswwwinsidescienceorgnewsdriving-fee-rolls-back-asthma-attacks-stockholm (last accessed 18 August 2020)
N Rolander (2018) ldquoBMWrsquos DriveNow Car-Sharing Services Bite the Dust in Stockholmrdquo July 2018 Bloomberg website Available at httpswwwbloombergcomnewsarticles2018-07-18bmw-s-drivenow-car-sharingservice-bites-the-dust-in-stockholm (last accessed 18 August 2020)
M Rousseau (2009) ldquoRe-imaging the City Centre for the Middle Classes Regeneration Gentrification and Symbolic Policies in lsquoLoser Citiesrsquordquo in International Journal of Urban and Regional Research Vol 33 (3) September 2009 pp 770-880 Available at httpsonlinelibrarywileycomdoiepdf101111j1468-2427200900889x (last accessed on 21st October 2020)
RUAF Foundation (2016) ldquoFrom strategies to operational goals for the Gent en Garderdquo Available at httpsruaforgassets201911Gent-en-Gardepdf (last accessed 18 August 2020)
G Ruggieri (2017) ldquoThe State of Art of Copenhagenrsquos Cycling Infrastructure and Possible Application in Other Urban Contextsrdquo Available at httpswwwpolitesipolimiitbitstream1058913415812017_04_RUGGIERIpdf (last accessed on 16 July 2019)
C Sabatino (2017) ldquoSolid Waste Management Systems through Social Inclusion The case of Belo Horizonte Brazilrdquo Available at httpwwwglobaldeliveryinitiativeorglibrarycase-studiessolid-waste-management-systems-through-social-inclusion-case-belo-horizonte (last accessed on 25 October 2020)
M Schiffbauer and G Varela (2019) ldquoMacro and Micro Features of Successful Economic Convergence The Case of Polandrdquo Available at httpdocuments1worldbankorgcurateden704781547133350911pdf133617-MTI-Discussion-Paper-11-Fixedpdf (last accessed 10 August 2019)
SEE Cities (2018) ldquoUPP Technical Workshop on Municipal Finance and Urban Auditrdquo Available at httpwwwseecitieseuseecitieseuUAitemid84amid549 (last accessed on 8 October 2020)
Seoul Metropolitan Government (2017) ldquoOne in three houses in Seoul to have photovoltaic facilityrdquo November 2017 Available at httpenglishseoulgokrone-three-houses-seoul-photovoltaic-facility (last accessed 18 August 2020)
Seoul Metropolitan Government (2018a) ldquolsquoSolar Cityrsquo Seoulrsquos future energy to be promoted at Seoul Solar Expordquo Available at httpenglishseoulgokrsolar-city-seouls-future-energy-to-be-promoted-at-seoul-solar-expo (last accessed 22 July 2019)
Seoul Metropolitan Government (2018b) ldquoSeoul Energy Corporation has launched Seoul Solar Centers in 5 regionsrdquo Available at httpenglishseoulgokrseoul-energy-corporation-launched-seoul-solar-centers-5-regions-providing-support-installment-post-m (last accessed 22 July 2019)
A Serena A Tob-Ogu and A Genovese (2018) ldquoTransitioning Urban Consolidation Centres initiatives in successful operations A Collection of EU case experiencesrdquo The University of Sheffield Available at httpwwwprosfeteuPROSFETwp-contentuploads201805Transitioning-Urban-Consolidation-Centres-initiatives-in-successful-operationspdf (last accessed on 29 September 2020)
I Šerić (2017) ldquoThe EPC market in Croatia and the new Eurostat rules on EPC accountingrdquo European Union November 2017 Available at httpseceuropaeuenergysitesenerfilesdocuments018_1b_ivan_seric_seif_milan_16-11-17pdf (last accessed 18 August 2020)
SF Environment (2019) ldquoCheckout Bag Charge and Recyclable or Compostable Pre-Checkout Bag Ordinancerdquo San Francisco Department of the Environment Available at httpssfenvironmentorgcheckout-bagordinance (last accessed 18 August 2020)
Shareable (2013) ldquoIs Seoul the Next Great Sharing Cityrdquo Available at httpswwwshareablenetis-seoul-the-next-great-sharing-city (last accessed on 25 September 2020)
SmartCities World (2019) ldquoVienna ranked top for smart city strategyrdquo SmartCitiesWorldnet 14 March 2019 Available at httpswwwsmartcitiesworldnetnewsnewsvienna-ranked-top-for-smart-city-strategy-3965 (last accessed 24 September 2020)
N Smedby (2015) ldquoAssessing local governance experiments for building energy efficiency ndash the case of Malmouml Swedenrdquo Available at httpsjournalssagepubcomdoipdf1011770263774X15614176 (last accessed 12 July 2019)
M Smith and J Castellano (2015) ldquoCosts associated with nonresidential electric vehicle supply equipment Factors to consider in the implementation of electric vehicle charging stationsrdquo US Department of Energy Available at httpstridtrborgview1377403 (last accessed 18 August 2020)
Snaga Ljubljana (2018) ldquoSnaga Ljubljana the biggest Slovenian waste management companyrdquo Available at httpsissuucomsnaga4docssnaga_ljubljana_eng (last accessed on 9 July 2019)
Sofia Municipality (2018) ldquoSofia Municipal Budgetrdquo February 2018 Available at httpswwwsofiabgwebsofia-municipalitystart-asset_publisherHMYVGw6PDFKhcontentthe-budget-of-sofia-is-now-uploaded-to-the-open-data-portalinheritRedirect=false (last accessed 18 August 2020)
D Staničić (2019) Jožef Stefan Institute Energy Efficiency Centre presentation 28 March 2019 slide 3
197
Z Stoyanova (2014) ldquoSustainable Urban Mobility Plan of Burgas 2014 ndash 2020rdquo Available at httpwwwsoutheast-europenetdocumentcmtid=842 (last accessed on 19 October 2020)
Strasbourg Eurometropole (2015) ldquo20 years of active policy supporting mobility within Strasbourg Eurometropolerdquo Available at Strasbourgeu eurometropole (2015) (last accessed on 19 October 2020)
Sustainable Australia Fund (2020) ldquoAbout usrdquo Available at httpssustainableaustraliafundcomauwho-we-are (last accessed on 8 October 2020)
Sustainable Cities (nd) ldquoOrbital Forest a Balance Between the City and Nature Rediscoveredrdquo Sustainable Cities website Available at httpwwwsustainablecitieseutransformative-actionsdatabasec=searchampaction_id=eu2ii6rw (last accessed 18 August 2020)
Sustainable Cities (2018) ldquoAlba Iulia Smart City Pilot Projectrdquo Sustainable Cities website Available at httpwwwsustainablecitieseutransformative-actions-databasec=searchampaction_id=ixgrulm3 (last accessed 18 August 2020)
Sustainable Development Solutions Network (2016) ldquoGetting Started with the SDGs in Citiesrdquo Available at httpsresourcesunsdsnorggettingstarted-with-the-sdgs-in-cities (last accessed 18 August 2020)
Sustainable Water Integrated Management (SWIM) Support Mechanism (2013) ldquoDocumentation of best practices in non-revenue water management in selected Mediterranean countriesrdquo European Union-funded project February 2013 Available at httpwwwswim-smeufilesBest_Practices_in_non-revenue_water_EN_Finalpdf (last accessed 18 August 2020)
SWITCH (Sustainable Water Management Improves Tomorrow Cities Health) project (2014) ldquoZaragoza combining awareness raising and financial measures to ensure water efficiencyrdquo Available at httpsclimate-adapteeaeuropaeumetadatacase-studieszaragoza-combining-awareness-raising-and-financial-measures-to-enhance-water-efficiency (last accessed on 8 August 2019)
D Szescilo (nd) ldquoStrengthening fiscal capacities for subnational public investment The case of Polandrdquo Available at httpwwwoecdorgregionalregional-policyStrengthening-Fiscal-Capacities-Poland-ENGpdf (last accessed 9 August 2019)
D Szescilo and M Kulesza (2012) ldquoLocal Government in Polandrdquo Local Government in the Member States of the European Union A Comparative Legal Perspective Madrid Available at httpswwwresearchgatenetpublication283568884_Local_government_in_Poland (last accessed 15 October 2020)
S Thomas et al (2014) Energy Efficiency Watch Energy Efficiency Policies in Europe Case Study Energy Manager Obligation and White Certificate Scheme ndash Italy Available at httpwwwfedareneorgwp-contentuploads201603Case_Study_Manager_White-Certificates_Italy_finalpdf (last accessed 10 October 2020)
S M Tica P Živanović S Bajčetić S Gavrilović and S Filipović (2012) ldquoOrganization and Management of Complex Interoperable Tariff and Fare Collection Systems-Example of the City of Belgraderdquo Proceedings of the International Conference on Traffic and Transport Engineering p 259 Belgrade Available at httpsbibirbhrdatoteka629846ICTTE_Belgrade_2012_Proceedingspdfpage=268 (last accessed 18 August 2020)
Tokyo Development Learning Centre (2017) ldquoAddressing Solid Waste Management through the 3R Approachrdquo Available at httpsprogrammeworldwaterweekorgContentProposalResourcesPDF2017pdf-2017-7137-5-Japan20Project20Brief_Yokohama3RPDF (last accessed on 1 October 2020)
Tokyo Metropolitan Government (2018) ldquoTokyo Carbon Reporting Program for SMFsrdquo Available at httpwwwkankyometrotokyojpenclimatetokyo_carbonhtml (last accessed 10 October 2020)
TomTom (nd) ldquoTraffic Index 2019rdquo TomTom website Available at httpswwwtomtomcomen_gbtraffic-indexranking (last accessed 18 August 2020)
TomTom (2020) ldquoMoscow region (oblast) trafficrdquo Available at httpswwwtomtomcomen_gbtraffic-indexmoscow-traffic (last accessed on 20 October 2020)
Transparency International and UN-Habitat (2004) ldquoTools to Support Transparency in Local Governancerdquo March 2004 Urban Governance Toolkit Series Available at httpswwwtransparencyorgenpublicationstools-to-support-transparency-in-local-governance (last accessed 23 August 2020)
Transport and Environment (2017) ldquoDoes sharing cars really reduce car userdquo June 2017 briefing note Available at httpswwwtransportenvironmentorgsitestefilespublicationsDoes-sharing-carsreally-reduce-car-use-June202017pdf (last accessed 18 August 2020)
Transport for London (2014) ldquoInternational Cycling Infrastructure Best Practice Study Appendix ndash City Summariesrdquo Available at httpcontenttflgovukinternational-cycling-infrastructure-best-practice-study-appendixpdf (last accessed on 20 October 2020)
A Trivedi and M Chertock (2019) ldquoResponding to Day Zero Equitably Water Crisis Lessons from Cape Town and Chennairdquo Available at httpswwwwriorgblog201910responding-day-zero-equitably-water-crisis-lessons-cape-town-and-chennai (last accessed on 23 October 2020)
J L Trujillo and J Parilla (2016) ldquoRedefining Global Cities ndash The Seven Types of Global Metro Economiesrdquo Global Cities Initiative The Brookings Institution Available at httpswwwbrookingseduresearchredefiningglobal-cities (last accessed 18 August 2020)
2020 Collectors Project (2020) ldquoCase Study Parma Italyrdquo Available at httpswwwcollectors2020euwp-contentuploads202008Case_Integration_Summary_Parmapdf (last accessed on 2 October 2020)
2030 Water Resources Group (2013) ldquoManaging Water Use in Scarce Environments A Catalogue of Case Studiesrdquo August 2013 Available at httpswwwwaterscarcitysolutionsorgwp-contentuploads201508WRG-Managing-Water-Scarcity-Cataloguepdf (last accessed 18 August 2020)
2030 Water Resources Group (2015) ldquoManaging Water Use in Scarce Environments A Catalogue of Case Studiesrdquo Available at httpswwwwaterscarcitysolutionsorgwp-contentuploads201508WRG-Managing-Water-Scarcity-Cataloguepdf (last accessed on 29 September 2020)
UCLG and World Bank (2009) ldquoDecentralization and Local Democracy in the World First Global Report by United Cities and Local Governments 2008rdquo Available at httpsopenknowledgeworldbankorghandle109862609 (last accessed 18 August 2020)
UK Department for Business Energy and Industrial Strategy (2019) ldquoSmart Meter Roll-Out Cost-Benefit Analysis (2019)rdquo September 2019 Available at httpsassetspublishingservicegovukgovernmentuploadssystemuploadsattachment_datafile831716smart-meter-roll-out-cost-benefit-analysis-2019pdf (last accessed 18 August 2020)
UK Parliament (2013) ldquoWarm Front Schemerdquo Commons Research Briefing SN06231 House of Commons Library August 2013 Available at httpsresearchbriefingsparliamentukResearchBriefingSummarySN06231 (last accessed 18 August 2020)
UN (nd) ldquoCities and Pollution contribute to climate changerdquo Available at httpswwwunorgenclimatechangecitiespollutionshtml~text=Cities20are20major20contributors20tocent20of20the20Earths20surface (last accessed 19 August 2020)
UN (2018a) ldquo68 per cent of the world population projected to live in urban areas by 2050 says UNrdquo Available at httpswwwunorgdevelopmentdesaennewspopulation2018-revision-of-world-urbanizationprospectshtml (last accessed 18 August 2020)
UN (2018b) World Urbanization Prospects The 2018 Revision Department of Economic and Social Affairs New York Available at httpspopulationunorgwupPublicationsFilesWUP2018-Reportpdf (last accessed 18 August 2020)
UN (2020) ldquoGoal 11 Make cities inclusive safe resilient and sustainablerdquo Available at httpswwwunorgsustainabledevelopmentcities (last accessed 18 August 2020)
198
UNDP (2009) Capacity Development A UNDP Primer United Nations Development Programme New York
UN Environment Programme (2017) ldquoWinter is coming for fossil fuel heating in Banja Lukardquo November 2017 Available at httpswwwunenvironmentorgnews-and-storiespress-releasewinter-comingfossil-fuel-heating-banja-luka (last accessed 18 August 2020)
UN Environment Programme (2019) ldquoSustainable Citiesrdquo Available at httpswwwunenvironmentorgregionsasia-and-pacificregionalinitiativessupporting-resource-efficiencysustainable-cities (last accessed 18 August 2020)
UNFCC (2017) ldquoSweden Plans to Be Carbon Neutral by 2045rdquo Available at httpsunfcccintnewssweden-plans-to-be-carbon-neutral-by-2045 (last accessed on 26 June 2019)
UN-Habitat (2009) International Guidelines on Decentralization and Access to Basic Services for All United Nations Human Settlements Programme Nairobi Available at httpsunhabitatorgsitesdefaultfilesdownload-manager-filesInternational20Guidelines20on20Decentralization20and20Access20to20Basic20Services20for20allpdf (last accessed 18 August 2020)
UN-Habitat (2013) State of the Worldrsquos Cities 20122013 Prosperity of Cities United Nations Human Settlements Programme Nairobi (last accessed 18 August 2020)
UN-Habitat (2017) ldquoHow to improve residential energy efficiency in South Eastern Europe and CISrdquo Policy Discussion Brief for national governments and international organizations April 2017 Available at httpswwwhabitatorgsitesdefaultfilesHow20to20improve20REE_policy20brief_FINAL_0pdf (last accessed 18 August 2020)
Urban Innovation Vienna (2020) ldquoSmart City Agencyrdquo Available at httpswwwurbaninnovationatenSmart-City-Agency (last accessed 24 September 2020)
Urban Sustainability Exchange (nda) ldquoThe City of Copenhagenrsquos Bicycle Strategyrdquo Available at httpsusemetropolisorgcase-studiescycling-in-copenhagencasestudydetail (last accessed on 16 July 2019)
Urban sustainability exchange (ndb) ldquoThe Sharing City Seoul Projectrdquo Available at httpsusemetropolisorgcase-studiesthe-sharing-city-seoul-project (last accessed on 21 October 2020)
UrbaSofia (2018) Results of the ATTRACTIVE DANUBE 3rd National Workshop Available at httpsurbasofiaeuenresults-of-the-attractive-danube-3rd-national-workshop (last accessed on 16 October 2020)
URBED and the Joseph Rowntree Foundation (2006) ldquoMaking Connections Transforming People and Places in Europe Case Study of Roubaix Lille (France)rdquo updated December 2007 Available at httpurbedcoopsitesdefaultfilesCase20Study20of20Roubaix20Lillepdf (last accessed 18 August 2020)
VivaCity2020 Cities Institute LondonMet (nd) ldquoThe Generation of Diversity Mixed Use and Urban Sustainability Clerkenwell (L B Islington) Case Studyrdquo Available at httpwwwvivacity2020coukMembersVivaCity20WP220Case20Study20Clerkenwellpdf (last accessed 18 August 2020)
J Warren (2010) ldquoCivilising the Streets How strong leadership can deliver high quality of life and vibrant public spacesrdquo Available at httptransformscotlandorgukwpwp-contentuploads201412Civilising-the-Streetspdf (last accessed on 20 October 2020)
Water Time (2005) ldquoBucharestrdquo Available at httpwwwwatertimenetwt_cs_cit_ncrhtmlRomania (last accessed on 29 September 2020)
M Wattenbarger (2018) ldquoThe Mexican town that refused to become a smart cityrdquo The Guardian website October 2016 Available at httpswwwtheguardiancomcities2018oct16the-mexican-town-that-refused-to-become-a-smart-city (last accessed 18 August 2020)
R Webb G Avram J Buron Garcia and A Joyce (2018) ldquoTransforming Cities by Designing with Communitiesrdquo The Hackable City pp 95-117 M de Lange and M de Waal (eds) Springer Link
Western Cape Government (nd) ldquoWestern Cape Industrial Symbiosis Programmerdquo Available at httpswwwwesterncapegovza110greenprojectswestern-cape-industrial-symbiosis-programme (last accessed on 24 September 2020)
M White (2019) ldquoVeolia and Leon trial deposit return scheme in Londonrdquo FoodBev Media website page March 2019 Available at httpswwwfoodbevcomnewsveolia-and-leon-trial-deposit-return-scheme-inlondon (last accessed 18 August 2020)
J Whitelegg (2014) ldquoCycles of change three bike-friendly European cities with lessons for the UKrdquo Available at httpswwwtheguardiancomlocal-government-network2014jan29cycling-rates-european-cities-lessons-for-uk (last accessed on 20 October 2020)
WHO (nd) ldquoWHO European Healthy Cities Networkrdquo World Health Organization Regional Office for Europe website Available at httpwwweurowhointenhealth-topicsenvironment-and-healthurban-healthwho-european-healthy-cities-network (last accessed 11 April 2019)
WHO and UN Environment (2017) ldquoCities Transport health and environmentrdquo Available at httpwwweurowhoint__dataassetspdf_file0019341128Fact-Sheet-1-City-Transport-health-and-environmentpdfua=1 (last accessed 11 April 2019)
K Willsher (2018) ldquoFrancersquos art deco jewel is reborn to make an even bigger splashrdquo The Guardian 21 October 2018 Available at httpswwwtheguardiancomartanddesign2018oct21france-art-deco-jewel-swimming-pool-art-gallery-reopens (last accessed on 30th September 2020)
D C Wilson C Velis and C Cheeseman (2006) ldquoRole of informal sector recycling in waste management in developing countriesrdquo Habitat International Vol 30 (4) pp 797-808
World Bank (nd) ldquoInclusive Citiesrdquo World Bank website page Available at httpswwwworldbankorgentopicinclusive-cities (last accessed 24 May 2019)
World Bank (2009) ldquoUnlocking Land Values to Finance Urban Infrastructurerdquo Available at httpdocumentsworldbankorgcurateden723411468139800644pdf461290PUB0Box3101OFFICIAL0USE0ONLY1pdf (last accessed on 6 August 2019)
World Bank (2013) ldquoCity of Rijeka MFSA summary 2013rdquo Available at httppubdocsworldbankorgen366021438191576243City-of-Rijeka-MFSA-summary-24-12-2013pdf (last accessed on 8 October 2020)
World Bank (2014) ldquoOvercoming constraints in the financing of infrastructurerdquo Available at httpwwwg20utorontoca2014WBG_IIWG_Success_Stories_Overcoming_Constraints_to_the_Financing_of_Infrastructurepdf (last accessed on 30 September 2020)
The World Bank (2016) ldquoPPI Project Summary Romania Bucharest ndash Concession Agreement for Water and Sanitation Servicesrdquo Available at httpspppworldbankorgpublic-private-partnershipppi-project-summary-romania-bucharest-concession-agreement-water-and-sanitation-services (last accessed on 29 September 2020)
World Bank (2017) ldquoImproving Local Governance in Belizersquos Municipalitiesrdquo Results Briefs Available at httpswwwworldbankorgenresults20171020improving-local-governance-in-belizesmunicipalities (last accessed 18 August 2020)
World Bank (2018) ldquoArmenia - Municipal Water Projectrdquo Independent Evaluation Group Project Performance Assessment Report 127226 Available at httpsiegworldbankgrouporgsitesdefaultfilesDatareportsppar_armeniawaterpdf (last accessed on 28 September 2020)
World Bank (2019) ldquoSolid Waste Managementrdquo Brief September 2019 Available at httpswwwworldbankorgentopicurbandevelopmentbriefsolid-waste-management (last accessed 18 August 2020)
World Bank Group (2017) ldquoLessons from Poland Insights for Poland A Sustainable and Inclusive Transition to High Income Statusrdquo World Bank Washington DC Available at httpsopenknowledgeworldbankorghandle1098628960 (last accessed 15 October 2020)
World Bank Group (2018) ldquoProject Appraisal Document on a Proposed Loan in the Amount of US$ 50 Million to the Republic of Albania for
199
a Regional and Local Roads Connectivity Projectrdquo Available at httpdocumentsworldbankorgcurateden133741523301183905pdfAlbania-Roads-Project-Appraisal-Document-PAD-Revised-04052018pdf (last accessed 18 August 2020)
World Bank Group (2020) ldquoUrban Development ndash Overviewrdquo Available at httpswwwworldbankorgentopicurbandevelopmentoverview (last accessed 18 August 2020)
World Bank Group and Government of Austria (2018) ldquoUrban Partnership Program (UPP) Improving Local Government Capacityrdquo Available at httpdocumentsworldbankorgcurateden613241525861852694pdfMFSA-Booklet-City-data-sheets-022018pdf (last accessed 18 August 2020)
World Bank Institute (2013) ldquoImproving Local Governments Capacity The Experience of Municipal Finances Self-Assessment (MFSA) in South-East Europerdquo Available at httpwwwseecitieseuPortals0ImagesStoriesPublicationsMFSA20-20onlinepdf (last accessed 18 August 2020)
World Economic Forum (2017) ldquoCollaboration in Cities From Sharing to lsquoSharing Economyrsquordquo White paper December 2017 Available at httpwww3weforumorgdocsWhite_Paper_Collaboration_in_Cities_report_2017pdf (last accessed 18 August 2020)
World Energy Council and Arup (2016) ldquoPerspective input into the World Energy Council Scenarios lsquoInnovating Urban Energyrsquordquo October 2016 Available at httpswwwarupcomperspectivespublicationsresearchsectionperspective-input-into-the-world-energy-council-scenariosinnovating-urban-energy (last accessed 18 August 2020)
World Habitat Awards (2013) ldquo30 Years of Planning Continuity in Freiburg Germanyrdquo Available at httpswwwworld-habitatorgworld-habitat-awardswinners-and-finalists30-years-of-planning-continuity-in-freiburg-germany (last accessed on 20 October 2020)
WRI (2016) ldquoLocalizing Open Government Reformsrdquo World Resources Institute website December 2016 Available at httpswwwwriorgblog201612localizing-open-government-reforms (last accessed 18 August 2020)
WWF (nd) ldquoAustriardquo Available at httpswwfpandaorgget_involvedlive_greentravelon_vacationeco_tipsaustria (last accessed 4 June 2019)
WWF (2012) ldquoStuttgart green corridorsrdquo Available at httpwwfpandaorg204461Stuttgart-green-corridors (last accessed on 15 July 2020)
M Xylia S Leduc P Patrizio F Kraxner and S Silveira (2017) ldquoLocating charging infrastructure for electric buses in Stockholmrdquo Transportation Research Part C Emerging Technologies Vol 78 pp 183-200 Available at httpswwwresearchgatenetpublication315066457_Locating_charging_infrastructure_for_electric_buses_in_Stockholm (last accessed 18 August 2020)
Zero Waste Europe (2016) ldquoThe Story of Parmardquo Available at httpssmartnetniuaorgsitesdefaultfilesresourcescs7-parma-webpdf (last accessed on 2 October 2020)
Zero Waste Europe (2019) ldquoThe story of Ljubljana Case study 5rdquo Available at httpszerowasteeuropeeudownloadscase-study-5-ljubljana-2 (last accessed 18 August 2020)
Zero Waste Scotland (nd) ldquoScheme Administratorsrdquo Zero Waste Scotland website page Available at httpsdepositreturnschemezerowastescotlandorgukscheme-administrators (last accessed 18 August 2020)
200
Abbreviations and acronyms
AfDB African Development Bank
ADB Asian Development Bank
CDP corporate development programme
CEE central and eastern Europe
CTCN Climate Technology Centre and Network
DH district heating
the EBRD the Bank European Bank for Reconstruction and Development
EIB European Investment Bank
EPC energy performance contracting
ESCO energy service company
EVSE electric vehicle supply equipment
EU European Union
GCAP Green City Action Plan
GDP gross domestic product
GHG greenhouse gas
GIZ Deutsche Gesellschaft fuumlr Internationale Zusammenarbeit
ICLEI ICLEI - Local Governments for Sustainability
IDB Inter-American Development Bank
ITDP Institute for Transportation and Development Policy
IT information technology
JSC joint stock company
OECD Organisation for Economic Co-operation and Development
LCV light commercial vehicle
LSE London School of Economics and Political Science
NGO non-governmental organisation
PM particulate matter
PPP public-private partnership
PSC public service contract
SEE south-eastern Europe
SEMED southern and eastern Mediterranean
UCLG United Cities and Local Governments
UN United Nations
UNDP United Nations Development Programme
WHO World Health Organization
201
The contents of this publication reflect the opinions of individual authors and do not necessarily reflect the views of the EBRD
Terms names and images used in this report to refer to geographical or other territories political and economic groupings and units do not constitute and should not be construed as constituting an express or implied position endorsement acceptance or expression of opinion by the European Bank for Reconstruction and Development or its members concerning the status of any country territory grouping and unit or delimitation of its borders or sovereignty
copy European Bank for Reconstruction and Development One Exchange Square London EC2A 2JN United Kingdom wwwebrdcom
All rights reserved No part of this publication may be reproduced or transmitted in any form or by any means including photocopying and recording without the written permission of the copyright holder Such written permission must also be obtained before any part of this publication is stored in a retrieval system of any nature
Photography copy EBRD and iStockphoto
Designed and produced by Pimclick and the EBRD
1272 Effective policy options for green cities

The completion of this report would not have been possible without generous donor support from the TaiwanBusiness-EBRD Technical Cooperation Fund
The groundwork for this publication and the digital tool was undertaken by the Arup Group and much appreciation goes to the team led by Stephen Cook and Dima Zogheib The report also benefited from contributions and valuable guidance from Sebastian Kriticos (International Growth Centre) Dan Dowling (PricewaterhouseCoopers) İnan İzci (Arguumlden Governance Academy) and Wolfgang Teubner (ICLEI ndash Local Governments for Sustainability)
Many departments and individuals across the EBRD contributed to the document and helped shape its content Among them were Ian Jennings Roland Ramusch and David Tyler from the Sustainable Infrastructure team as well as Nigel Jollands from the Bankrsquos Energy Efficiency and Climate Change team
The development of the report and digital tool was coordinated and supervised under the leadership of Kjetil Tvedt Marcel Schlobach Jinrui Liu Russell Bishop and Mara Solomon of the EBRDrsquos Economics Policy and Governance (EPG) Department Eva Bernard and Theresa Niederle from the EPG team provided valuable input on the inclusion dimensions of the urban policies discussed Editorial multimedia and production guidance was provided by Lidia Creech Dermot Doorly Cathy Goudie and Dan Kelly in the Communications Department
Acknowledgements
Supported by
Contents
Foreword 07
Executive summary 09
01 Introduction 13
02 Urban development trends and regional context
21 Transformation in cities22 Beyond green cities other relevant concepts
18
03 Sector-based policy options
31 Mobility and transport32 Land planning green space and biodiversity33 Energy and buildings34 Water and wastewater 35 Solid waste
28
04 Cross-cutting policy options
41 Governance42 Finance
74
05 Case studies 90
References 189
Abbreviations and acronyms 200
Case studies
Title of case study Related policy options
Integrated urban mobility Burgas Bulgaria
bull Parking policiesbull Road-user chargesbull Planning and regulation of public transport servicesbull Pro-cycling policies
92
Integrated multi-modal transport Strasbourg France
bull Pedestrian-oriented and car-restrictive policiesbull Planning and regulation of public transport servicesbull Pro-cycling policies
94
Shifting from transport to mobility Moscow Russia
bull Parking policiesbull Road-user chargesbull Planning and regulation of public transport servicesbull Car-sharing and car-pooling policies
97
Incentives to use public and active transport Freiburg Germany
bull Pedestrian-oriented and car-restrictive policies bull Planning and regulation of public transport services bull Pro-cycling policies
100
Pedestrianisation and car-free zones Ljubljana Slovenia
bull Pedestrian-oriented and car-restrictive policiesbull Pro-cycling policies
103
Promotion of active transport Lund Sweden
bull Pedestrian-oriented and car-restrictive policiesbull Pro-cycling policies
106
Cycling strategy Copenhagen Denmark
bull Pedestrian-oriented and car-restrictive policiesbull Pro-cycling policies
109
Green ventilation corridors Stuttgart Germany
bull Promotion of green spaces and biodiversity 111
Urban planning with superblocks Barcelona Spain
bull Development of compact citiesbull Promotion of mixed-use areas and transit-oriented
developmentbull Promotion of green spaces and biodiversity
114
Urban regeneration and renewal Roubaix France
bull Promotion of mixed-use areas and transit-oriented development
bull Promotion of community-based land use planning
117
Density bonusing and development Toronto Canada
bull Development of compact cities 120
Policy areas
Transport92
Water140
Solid waste156
Energy and buildings 122
Land use111
Governance175
Finance184
Energy manager obligation Italy bull Support of energy performance contracts 122
Energy performance contracting Berlin Germany
bull Improved energy performance for public buildingsbull Support of energy performance contracts
125
Solar City Seoul Seoul South Korea
bull Improved energy building codes and labellingbull Promotion of renewable electricity generation
128
Carbon reduction reporting programme Tokyo Japan
bull Support of energy performance contracts 131
District heating and cooling Tartu Estonia
bull Decarbonisation of district heating supply 134
Sustainable eco-districts Malmouml Sweden
bull Improved energy building codes and labellingbull Promotion of renewable electricity generation
137
Private contracting in the water sector Yerevan Armenia
bull Regulation and contracting of service providers 140
Micro private-sector participation Madaba Jordan
bull Regulation and contracting of service providersbull Reform and strengthening of water utilitiesbull Effective tariff reforms and price signals
143
Management of water demand Drakenstein South Africa
bull Promotion of resource-efficient utilitiesbull Effective tariff reforms and price signalsbull Awareness campaigns for households and industry
146
Water and wastewater recycling Chennai India
bull Regulation and contracting of service providersbull Reform and strengthening of water utility firmsbull Effective tariff reforms and price signals
149
Water-saving programme Zaragoza Spain
bull Effective tariff reforms and price signalsbull Awareness campaigns for households and industry
151
Public-private partnership agreement Bucharest Romania
bull Regulation and contracting of service providersbull Reform and strengthening of water utilitiesbull Effective tariff reforms and price signals
154
Industrial symbiosis programme Cape Town South Africa
bull Information strategies for residents and industrybull Formalisation of informal waste collection
156
Sharing city project Seoul South Korea
bull Information strategies for residents and industrybull Promotion of sharing and reuse of products
159
Reduce reuse recycle Yokohama Japan
bull Information strategies for residents and industry 163
Zero-waste strategy Ljubljana Slovenia
bull Effective price signals and fundingbull Information strategies for residents and industrybull Waste sorting and treatment to encourage recycling
166
Policy areas
Transport92
Water140
Solid waste156
Energy and buildings 122
Land use111
Governance175
Finance182
Zero-waste strategy Parma Italy bull Effective price signals and fundingbull Information strategies for residents and industrybull Waste sorting and treatment to encourage recycling
169
Formalisation of informal waste pickers Belo Horizonte Brazil
bull Formalisation of informal waste collectorsbull Improvement of waste collection services
172
Political and fiscal decentralisation Poland
bull Political and fiscal decentralisation 175
Smart city performance monitoring Austria Vienna
bull Improved transparency and accountability 177
Co-designing and co-creating urban solutions Cluj-Napoca Romania
bull Effective stakeholder participation 180
Land Value Capture Bogotaacute Colombia
bull Improved revenue and financial autonomy 182
Diagnosis framework for municipal finance Rijeka Croatia
bull Improved financial accountability and transparency 184
Climate Fund Melbourne Australia bull Improved revenue and financial autonomy 187
Policy areas
Transport92
Water140
Solid waste156
Energy and buildings 122
Land use111
Governance175
Finance182
7
Maintaining economic growth while creating sustainable cities for all is the biggest urban challenge that countries face today More than half of the worldrsquos population lives in cities and that share is projected to reach 68 per cent by 2050 Cities and metropolitan areas are engines of economic growth contributing about 80 per cent of global GDP However they
also account for about 60 per cent of global carbon emissions and more than 70 per cent of energy use1 2 Today many cities struggle with environmental degradation inadequate urban infrastructure and traffic congestionsup3 These challenges will become only more pressing if the pace and pattern of urbanisation continues
Foreword
This report presents impactful urban policy options and case studies that can help cities accelerate their green agendas A digital tool for specific policies and case studies will accompany the final version of this document ndash see wwwebrdgreencitiescom
sup1 See United Nations (2018) sup2 See United Nations (nd)sup3 See United Nations Environment Programme (2019)
Foreword
8
Against this backdrop the EBRD launched its Green Cities Framework in 2016 to systematically promote sustainable urban development across the Bankrsquos regions Today EBRD Green Cities is our largest investment programme covering 44 cities in 22 countries with more than euro15 billion committed by the EBRD and multiple donors for investments and technical support Recently as cities have been at the forefront of the Covid-19 crisis the programme has become even more important supporting our partner cities as they ldquobuild back betterrdquo from the pandemic
While investments in sustainable infrastructure are crucial complementary policy reforms also play a vital role in helping to achieve systemic impact However through our work with EBRD Green Cities we have noticed the lack of a cross-sectoral overview of green urban policy options that could guide municipal authorities and relevant stakeholders in the selection design and implementation of effective policies This report aims to develop such an overview and contribute to a shared vision of the role and opportunities of city-led policy initiatives and programmes It seeks to raise awareness of the potentially impactful role of policy initiatives of how they interact with other urban policies and in particular how policies can enhance and complement the environmental benefits of municipal investment programmes
While this publication was produced in the context of EBRD Green Cities and all policies and case studies have been selected and presented with the EBRD regions in mind itis highly relevant for any city seeking green solutions regardless of its location The policy options and case studies detailed in this document are structured around seven policy areas with each policy option and case study presented in a brief and hands-on manner The content aims to be practical and accessible to a wide range of
stakeholders including those with limited technical or policymaking experience
The process of drafting this report was complex The main challenge was the integrated nature of urban policies and the multiple benefits (and costs) that one policy may create directly and indirectly for different stakeholders In this complex landscape of activities and outcomes it is sometimes difficult to structure and categorise policies and benefits in a simple way without losing too much of the true picture Fortunately we are not the first institution to compile a structured overview of urban policies In drafting this report we benefited greatly from the support and expertise of a wide range of external partners as well as from the knowledge and help of many teams across the EBRD A detailed list of contributors is available in the acknowledgement section at the front of this report
As the content of this report and its accompanying digital tool will be shared and explored among policymakers stakeholders and other interested parties the EBRD expects to collect a rich set of feedback and suggestions that it will incorporate and build on We hope that this will be reflected in an even richer set of policy options and case studies in future In addition we aim to further emphasise aspects of smart inclusive and resilient urban development ndash as well as their interaction with green urban policies ndash in future updates to the digital tool and this report We look forward to intensifying our work with partners around urban policies and hope that this report serves as an important step in this direction
Elisabetta Falcetti Director Sector Economics and Policy EBRD
ldquoToday EBRD Green Cities is our largest investment programme covering 44 cities in 22 countries with more than euro15 billion mobilised by the EBRD and multiple donors for investments and technical supportrdquo
Elisabetta Falcetti
9
1 IntroductionWith the pace of urbanisation accelerating globally it is almost impossible to discuss the opportunities and challenges of sustainable development without reflecting on the role and impact of cities
On the one hand cities are powerhouses of economic growth generating more than 80 per cent of global GDP On the other hand they also account for about 70 per cent of energy use and 60 per cent of greenhouse gas emissions4 5
Given the transformative power of cities ndash for better or for worse ndash sustainable urban development has moved to the centre of the global development agenda This is most prominently reflected in Goal 11 of the United Nations (UN) Sustainable Development Goals (SDGs) which seeks to ldquomake cities and human settlements inclusive safe resilient and sustainablerdquo by 20306
However not only has more attention been given to cities lately but the way of looking at cities and urban development has also changed over the years Whereas the focus was previously on economically efficient cities often linked to car-based urban planning today the idea of a green and people-centric urban development dominates
In this view residents are seen both as important users of urban spaces and services and also as important guardians of accountability ensuring well-governed and inclusive urban development In addition there is a growing recognition that cities do not merely provide close proximity between the workforce and fixed places of employment but also represent dynamic arenas for interaction between the working and resident populations which are increasingly embedded in a digitalised environment
Given all of these issues it is becoming clear that sustainable urban development should
be pursued through a systematic and holistic approach Such an approach must go beyond cross-sectoral planning and coordination to combine and integrate investment programmes with well-defined policy frameworks and put residents at the centre An inclusive and participatory approach to sustainable urban development is vital to ensure the participation of residents and guarantee that all interests including those of marginalised groups are considered when developing implementing and maintaining urban solutions
In response to this awareness in 2016 the EBRD developed its Green Cities Framework in order to promote sustainable urban development across the Bankrsquos regions in a systematic and holistic manner EBRD Green Cities is now the largest investment programme of the Bank with more than euro15 billion mobilised from the EBRD and external donors for investment and technical support and more than 40 cities signed up to date The programme seeks to help cities identify and address their key environmental challenges through evidence-based diagnostics and an inclusive planning process ndash followed by the preparation and implementation of priority investments and policy initiatives
2 Content of this reportIn light of the importance of well-defined and inclusive policy initiatives as part of any agenda for sustainable urban development this report presents impactful urban policy options and related case studies relevant to cities pursuing an agenda of this kind
The report structures these policy options and case studies around seven policy areas ndash five sector-specific areas (urban transport land planning energy efficiency and buildings water and wastewater solid waste) and two cross-sectoral or enabling policy areas (governance and financing) Within each policy area the main five to ten policy options are presented in
Executive summary
4 See United Nations (nd)5 See World Bank Group (2020)6 See UN (2020)
Executive summary
10
terms of their resource implications benefits and risks necessary conditions typical implementation challenges or expected opposition and critical success criteria The listed policy options are backed by relevant case studies from cities located within and outside the EBRD regions These case studies have been selected on the basis of a multi-criteria analysis which ranked them in terms of their characteristics such as replicability transparency community buy-in and so on
This report provides a useful and practical source of references for a wide range of urban stakeholders and interested parties and promotes a shared understanding of the possibilities and likely implications of various policy initiatives The policy options and case studies are concise7 This report does not aim to provide support on how to identify environmental shortcomings in a city Rather it assumes that the shortcomings have been identified prior to using this knowledge product However readers can use the menu of policy options to guide any form of gap analysis undertaken by cities seeking to accelerate their green agenda8
The report content is oriented towards the cities in the EBRD regions taking part in the Green Cities programme ndash a practical framework that aims to help cities prioritise and implement investments and urban policies Hence for the purposes of this publication policies are understood as being most non-investment activities that target the lsquogreeningrsquo of cities that municipal authorities can implement or influence within five years and that can generate material impact within five to ten years Consequently this report does not cover high-level strategic policies or visionary plans more suitable for central governments Instead it focuses on tactical and operational policy options that fall within municipal control and influence Among others these options include planning regulation incentives funding and financing skills development capacity-building and monitoring as well as attitude campaigns awareness-raising and information programmes
3 The main issues in each of the seven policy areasUrban transport Cities across the region face high levels of air pollution due to growing car ownership and insufficient vehicle standards compounded by a lack of attractive public and active modes of transport Relevant green transport policies include those that aim to restrict car use on the one hand and to promote public and active mobility on the other Furthermore cities can promote cleaner vehicles including through the electrification of urban transport
Land use and biodiversity Some cities in the EBRD regions face uncontrolled population growth and urban sprawl Other cities may be more stagnant while suffering from a legacy of poor availability of recreational and green infrastructure and from limited biodiversity Potential policies to tackle these challenges include the development of compact cities the promotion of mixed-use areas and transit-oriented urban development the promotion of green spaces and the encouragement of community-based land-use planning
Energy efficiency and buildings Many economies in which the EBRD invests share a legacy of buildings characterised by poor energy efficiency and high electricity and heat consumption commonly linked to fossil fuels Policies to address these issues cover initiatives that promote energy-efficient buildings ensure better price signals and more energy-conscious consumption and help decarbonise the provision of heat and electricity
Water sector In the EBRD regions cities experience high levels of ldquonon-revenuerdquo water use water pollution and the overuse of water resources as well as significant climatic stresses which are bound to increase Policies aimed at the supply side focus on water utilities and include the regulation and contracting of public and private service providers the reform and strengthening of water utility firms and the promotion of resource-efficient utilities Policies that target water users include effective tariff reforms and price signals as well as awareness campaigns for households and industry
7 A digital tool for easy access to specific policies and case studies accompanies this report and is available at wwwebrdgreencitiescom8 For guidance on how to identify and map a cityrsquos environmental challenges through an evidence-based and holistic process readers may explore the methodology for a Green City Action Plan as outlined at wwwebrdgreencitiescom
Executive summary
11
Solid waste sector Inadequate management of municipal and industrial waste is common among these cities leading to contamination of land and groundwater as well as failure to support a lsquocircular economyrsquo model Policies in this area focus on how cities can ensure more effective governance and buy-in as well as on targeted initiatives to increase recycling and recovery rates Here the policy instruments include improved planning accountability structures price signals and funding combined with information strategies for residents and businesses and the formalisation of informal waste-collection services
Governance The legacy of poor local governance and low administrative and financial capacity across cities in these regions is detrimental to the implementation of the green urban policies mentioned above Policies that can be implemented to improve governance among local governments include political and fiscal decentralisation improved transparency and accountability enhanced integration and coordination across government bodies strong stakeholder consultation processes and the building of awareness and engagement among a diversity of interest groups ndash some of which may face disproportionate barriers to economic opportunities
Finance Financial constraints are widespread within cities in the EBRD regions This is often due to declining populations or a lack of creditworthiness and limited access to financing which can hinder the delivery of public services Policies to improve the financial health and autonomy of cities include initiatives to upgrade their financial planning and management boost revenue collection and enhance accountability and transparency all of which can help to enhance a cityrsquos creditworthiness and financial autonomy
4 Other key messagesUrbanisation patterns differ significantly across the EBRD regions The EBRD operates in 38 economies across three continents (see Table 1 for details) Across the EBRD regions which include economies as far east as Mongolia and as far west as Morocco population patterns and urban trends differ significantly Economies in the southern and eastern Mediterranean region Central Asia and Turkey generally have young and growing populations paired
with increasing levels of urbanisation In contrast the countries in central eastern and south-eastern Europe tend to have ageing stagnating or shrinking populations with the majority of cities experiencing a decline in population
The EBRD regions also share a legacy of minimal decentralisation and immature private-sector participation The centralised top-down structure in many economies has led to inadequate local accountability procedures and hence poor governance It has also limited capacity and expertise among local authorities and inhibited trust in local administrations and buy-in and engagement among the populace Among the former socialist economies in the EBRD regions there is also a legacy of poor price signals and a limited role for commercial solutions leading to continued resource inefficiencies and an immature involvement of the private sector As a result poor operational and environmental performance and a lack of people-centric urban development remains widespread in many of these regions
Decentralisation is important and should be facilitated by local capacity-building Cities that want to pursue an ambitious green agenda should be empowered to take initiatives and make their own decisions Cities must also be able to incorporate feedback from local community representatives and city authorities should be held accountable by the local population That said central governments tend to be reluctant to transfer decision-making and financial powers to regional and municipal authorities in particular where local capacity is weak Cities should help to encourage and prepare for the decentralisation process by strengthening their procedures capacity and expertise
Effective private-sector solutions require mature city administrations Deeper private-sector involvement can offer innovative solutions relevant expertise and better contractual arrangements However many local authorities in the EBRD regions have limited capacity and experience with effective private sector contracting Such administrative capacity and experience takes time to acquire Therefore in the absence of robust administrative experience a gradual build-up of capacity is recommended
Despite their differences many cities face similar environmental challenges and policy needs All cities are unique in their economic social and
Executive summary
12
political composition and urban policies must be tailored to each case Nevertheless cities often face similar environmental challenges and the relevant policy solutions often entail significant similarities This report appreciates these similarities while recognising the main differences between the typologies of cities in different regions
The most successful cities plan a mix of policies and investments Standalone policies and investments often fail to fully benefit from the synergies of optimal coordination and sequencing of interrelated policies investments and the involvement of residents While this may sound obvious developing a shared vision and a coordinated effort can be difficult in a city where departments work in lsquosilosrsquo
Inclusive urban development has numerous critical benefits The co-development of urban solutions may be difficult where there is a weak culture of active involvement by residents Nevertheless (i) many cities have been able to cut costs and improve quality by proactively involving their residents and their varied interest groups ndash despite the upfront costs linked to such initiatives This involvement should include marginalised groups and women in particular Moreover (ii) inclusive urban development is better at
addressing inequality issues experienced by women and marginalised groups and (iii) a broad supporter base for a specific green or inclusive urban agenda makes it more sustainable as it is harder for new or existing political or administrative authorities to divert from the initial plan
There are many impactful policy options that have moderate implications for a city budget However many of these options which may include active regulation and pricing of the behaviour of commercial users and residents can be politically costly and may thus be better introduced as part of a policy mix Other policy options may not be financially costly but may involve comprehensive private-sector participation and therefore require institutional capacity-building
Long-term shared visions are necessary to ensure effective and sustainable urban development While the policy options presented in this report have a short to medium-term timeframe a clear long-term political vision which may seek to pursue gradual change over time is required as a foundation for sustainable urban development
13
14
Introduction
01
15
The European Bank for Reconstruction and Development (the EBRD or the Bank) has developed a new strategic approach to addressing urban environmental challenges in the economies where it invests the EBRD Green Cities Framework With a volume of euro15 billion it is one of the Bankrsquos largest investment programmes and a flagship product EBRD Green Cities seeks to help cities identify and prioritise environmental challenges and address them through targeted investments services and policy instruments in a strategic and holistic manner The programme was initiated at the end of 2016 and now covers more than 40 cities in the EBRD regions
As part of the EBRD Green Cities approach cities develop a Green City Action Plan (GCAP) ndash a process initiated by a technical diagnostic study followed by the development and approval of priority investments and policies The process for preparing a GCAP
is defined in further detail in the Green Cities Programme Methodology9 The purpose of a GCAP is to apply a systematic evidence-based approach to prioritising green city projects and to identifying the right enabling framework of policy regulation and incentives The initial technical diagnostic is based on a set of indicators to be measured and scored against international standards and benchmarks These 70 indicators cover (i) the quality of the cityrsquos environment including air quality pollution levels in water sources or the quality and stock of other natural resources (ii) the sources of the pollution or other adverse impacts on the environment and (iii) the response indicators ndash the current municipal activities institutional arrangements and policy initiatives that set out to improve or protect the environment in the city Following the technical identification of the cityrsquos environmental shortcomings the relevant stakeholders are consulted and priority investments
Introduction
9 See OECD and ICLEI (2016)
Figure 1 Overview of the Green City Action Plan process and the role of this report
Source EBRD
1 2 3 4
Initiate Green City Action Plan
Commit to trigger investment project
Prepare and organise Implement and monitor
Conduct technical diagnostics
Set investment and policy priorities with stakeholders
Identify and prioritise
Set vision and goals and derive investments and policies
Plan actions
Report Menu of green urban policies
Energy Electrification Parking
Pro-cycling measures Pedestrianisation
Road user charges Car-sharing
Water
Finance Waste Transport
Land use Governance
P
Policy areas Policy options
Conduct investments Implement policy measures
Introduction
and policies are identified and developed to address these challenges
In order to support the recommendations that emerge from the development of a GCAP and to further strengthen policy discussions in cities participating in the Green Cities programme the EBRD has developed a knowledge product in the form of this report It presents policy options and practical case studies that can be effective in mitigating reducing and addressing the environmental challenges that cities face
Menu of policy options and case studies
The policy options in this report (see Figure 2) are structured around seven areas ndash five sector-specific areas (transport water solid waste land use and energy) and two cross-sectoral or lsquoenablingrsquo areas (governance and finance) Within each policy area the main five to ten policy options are presented in terms of their resource implications benefits and risks and necessary conditions as well as key implementation challenges and critical success criteria In line with the market-oriented mandate of the EBRD the policy descriptions also include ways to unlock or integrate private sector participation The policy options (or policy instruments) are further backed and illustrated by relevant practical case studies10
Selection of policy options and case studies Combining top-down and bottom-up approaches
The policy options and case studies presented in this report were selected through the combination of a bottom-up and a top-down approach The top-down approach relates to extensive desk research and literature reviews The structuring of the policy options and case studies derives from the seven policy areas for each of which the report outlines the most relevant environmental challenges and targets
The bottom-up approach is based on the development of a long list of potential case studies and the policies they represent All of the potential case studies were assessed in terms of the kind of policies and cities they covered and through a comprehensive evaluation based on criteria such as impact effectiveness political acceptability transparency or replicability
To evaluate the relevance of potential policies necessary metadata about each policy and case study were collected To enable future users to understand and use them effectively a number of policy characteristics were drawn up from academic literature and international organisations for example from the OECD11 Similarly for the case studies a list of policy evaluation criteria such as effectiveness and administrative viability was developed to assess the
10 A guided and user-friendly path to the relevant content of this knowledge product is also available through a digital tool at ebrdgreencitiescom11 See OECD (ndb)
Figure 2 Structure of the policy areas policy options and case studies
Source EBRD
Energy CopenhagenElectrification Parking
Pro-cycling measures Pedestrianisation
Road user charges Car-sharing
Water Strasbourg
Finance FreiburgWaste LjubljanaTransport
Land Use LundGovernance Burgas
P
Policy areas Policy options Case studies
16
Introduction
17
policy delivery policy outcomes and impacts such that cities can take these examples and apply the policies that have been used most effectively12
This suite of policy options should also relate to the range of characteristics of cities where the EBRD Green Cities programme is being implemented The assessment of city characteristics provides an insight into whether a city has the right conditions to ensure the success of a specific policy To some extent the current GCAP methodology already carries out such an approach through the political framework reports which include a preliminary review of policy finance and governance to develop a project-prioritisation matrix
Objectives and limitations of this report
The objective of this report is to help guide and stimulate the policy discussions taking place in cities ndash in the EBRD regions and beyond ndash that are aiming to accelerate their green agenda The report aims to promote a shared understanding of the possibilities and likely implications of various policy initiatives and provide practical advice on their delivery in combination with relevant investment programmes The intention is to create a practical and concise reference point for a wide range of urban stakeholders and interested parties While this knowledge product does not seek to provide detailed instructions on how to plan and implement specific policies it aims to offer useful guidance on what to expect and to consider supported by practical case studies and lessons learned
The reportrsquos content is oriented towards cities in the EBRD regions taking part in the Green Cities programme As a consequence the menu of policy options and case studies is limited in the following ways
bull The policy options presented here are primarily relevant to cities and do not cover high-level strategic policies or visionary plans that are more suitable for central governments Instead the focus is on tactical and operational policy options that fall within municipal control and influence
bull This report emphasises effective policy options rather than green investments to address environmental challenges It covers options that can be pursued and implemented within a five-year period in a process that is primarily city-driven The policy options lead to material impact in the medium term in other words five to ten years For example a parking policy that may influence the urban transport sector within a few years would be included as a policy option rather than a strategic pursuit of a compact urban design that would take decades to achieve material results
bull This report does not provide support on how to identify environmental shortcomings in a given city Rather it assumes that the environmental shortcomings have been identified prior to using this knowledge product For guidance on how to identify and map a cityrsquos environmental challenges through an evidence-based and holistic process the reader may explore the GCAP methodology outlined at wwwebrdgreencitiescom
Overall relevant public policies should be understood here as meaning most non-investment activities that target the greening of cities and that municipal authorities can implement or influence and expect to generate impact within three to eight years Among other activities these include planning and monitoring regulation incentives funding and financing skills development and capacity-building as well as awareness-raising attitude campaigns and information programmes This report also presents new technical solutions but with an emphasis on policies that enable such new solutions to be applied
12 Note that quantitative ex-post evaluations of individual policies are rarely possible The causal linking of a policy with an outcome is prevented by the scale and timescale of impact and the presence in a real city of innumerable confounding factors The exceptions to this occur when a policy of major significance is implemented (for example the London congestion charge) Nevertheless policy impact can be judged through a combination of quantitative data anecdotal information research across multiple locations and information from those whom a policy has targeted This caution should be reflected in the language used to document a policy evaluation
18
19
Urban development trends and regional context
21 Transformation in cities
22 Beyond green cities other relevant city concepts
02
20
21 Transformation in cities
Demographic trends in the EBRD regionsPatterns of population growth and composition differ significantly across the EBRD regions which include economies as far east as Mongolia and as far west as Morocco (see Table 1 for details) Economies in the southern and eastern Mediterranean region and
Central Asia have young and growing populations while in central eastern and south-eastern Europe populations are declining
As documented in the EBRDrsquos Transition Report 2018-19 Central Asia the southern and eastern Mediterranean and Turkey currently find themselves in the early stages of their demographic transition ndash with large increasingly young populations
Urban developmenttrends and regional context
Policy considerations must recognise the priorities and needs of different types of cities which can vary considerably in their size geography and history
Region Economies
Central Asia Kazakhstan Kyrgyz Republic Mongolia Tajikistan Turkmenistan Uzbekistan
Central Europe and the Baltic states
Croatia Estonia Hungary Latvia Lithuania Poland Slovak Republic Slovenia
Eastern Europe and the Caucasus
Armenia Azerbaijan Belarus Georgia Moldova Ukraine
South-eastern Europe Albania Bosnia and Herzegovina Bulgaria Cyprus Greece Kosovo Montenegro North Macedonia Romania Serbia
Southern and eastern Mediterranean
Egypt Jordan Lebanon Morocco Tunisia West Bank and Gaza
Other Russia Turkey
Table 1 Economies where the EBRD invests
Source EBRD
Urban development trends and regional context
21
In contrast the demographic transformation in central eastern and south-eastern Europe is much more advanced compared to the emerging markets in Asia Latin America and parts of the Middle East and Africa Populations in emerging Europe are growing more slowly or even shrinking and ageing at approximately the same rate as the populations of advanced European economies due to a combination of modest birth rates and continued improvements in life expectancy often exacerbated by the emigration of young people to other EU countries For instance from 1992-2015 the population of eastern Europe shrank by 18 million (around 6 per cent) with the trend accelerating as a number of countries joined the European Union which gave workers the ability to travel freely to other nations within the bloc13 In contrast southern European countries have observed an increase in emigration despite high unemployment rates persisting after the 2008 global financial crisis with net migration up to +013 per cent14 It is worth noting that this trend of emigration from eastern European countries has slowed in recent years These countries have experienced the highest levels of
return migration in Europe leading to a stabilisation of net migration at -023 per cent of population per year as economic conditions have strengthened
Urbanisation trends in the EBRD regions
There is a global trend of increasing urbanisation with 55 per cent of the worldrsquos population today living in urban areas and this proportion expected to increase to 68 per cent by 205015 Over the past 25 years the EBRD regions have experienced on average a steady process of urbanisation with more than 60 per cent of the population living in urban areas today16 However within the EBRD regions there are significant variations from country to country ranging from 27 per cent of the population living in urban areas in Tajikistan to over 90 per cent in Jordan (see Figure 2)
Source World Development Indicators urban population (percentage of total population) (httpsdataworldbankorgindicatorspurbtotlinzs) and EBRD staff calculations as presented in the report Creating Liveable Cities Regional Perspectives)17
100
90
80
70
60
50
40
30
20
10
0
Tajik
ista
n
Kyr
gyz
Rep
ublic
Mol
dova
Egyp
t
Bos
nia
and
Her
zego
vina
Uzb
ekis
tan
Turk
men
ista
n
Slov
ak R
epub
lic
Rom
ania
Slov
enia
Azer
baija
n
Serb
ia
Croa
tia
Kaz
akhs
tan
Nor
th M
aced
onia
Geo
rgia
Alba
nia
Pola
nd
Mor
occo
Arm
enia
Mon
tene
gro
Cypr
us
Lith
uani
a
Latv
ia
Mon
golia
Tuni
sia
Esto
nia
Ukr
aine
Hun
gary
Rus
sia
Turk
ey
Bul
garia
Wes
t Ban
k an
d G
aza
Bel
arus
Gre
ece
Leba
non
Jord
an
Figure 2 Share of urban population to total population 2017 (per cent)
13 See The Economist (2017) 14 See Batsaikhan et al (2018) 15 See UN (2018a) 16 Urban areas are often defined as settlements with populations of more than 5000 inhabitants although national statistical definitions vary Other criteria may include population density type of economic activity physical characteristics level of infrastructure or a combination of these and other criteria See Deuskar (2015) 17 See AfDB et al (2019)
Urban development trends and regional context
22
Within the EBRD regions there are also significant differences in the levels of urban population growth The growth pattern of urban populations (urbanisation) follows the demographic trends in which the growing population in Central Asia the southern and eastern Mediterranean region and Turkey is closely linked to a rapid increase in the urban population while the stagnating or even declining population in emerging Europe is matched by a slower process of urbanisation Figure 3 shows how urban population growth is very slow or even negative in
central Europe the Baltic states south-eastern and eastern Europe and the Caucasus in stark contrast with the patterns observed in most other emerging economies ndash including those in Central Asia the southern and eastern Mediterranean and Turkey which have seen rapidly growing urban populations High rates of population growth and urbanisation are particularly strong in Tunis Cairo parts of Morocco the Nile valley and delta and much of Jordan Lebanon and the West Bank and Gaza
The story of secondary cities in the EBRD region
Beyond the general demographic and urban trends in the EBRD regions there is a noteworthy story about the role and decline of secondary cities in the former centrally planned economies Populations in the EBRD regions have so far been more concentrated in secondary cities than in large urban agglomerations as opposed to the pattern seen in many other emerging markets Within the former socialist economies in the EBRD regions only Moscowrsquos population exceeds 5 million which together with Istanbul and Cairo are the only cities with populations above 10 million in all of the EBRD regions
Historically secondary cities have played a relatively greater role in the formerly socialist economies which under central planning tended to have high rates of urbanisation relative to their level of development albeit with more dispersed settlement patterns in secondary cities Many of these secondary cities were developed around state-owned manufacturing hubs with little economic diversification and limited alternatives for the local labour force once the manufacturing plants were closed down or relocated as part of the transformation to market-based and more service-oriented economies As a result over 80 per cent of cities in some economies of eastern and south-eastern Europe have been
4
3
2
1
0
-1
-2
Lith
uani
a
Croa
tia
Latv
ia
Bul
garia
Rom
ania
Serb
ia
Ukr
aine
Hun
gary
Bos
nia
and
Her
zego
vina
Gre
ece
Alba
nia
Mol
dova
Geo
rgia
Esto
nia
Pola
nd
Mon
tene
gro
Bel
arus
Slov
enia
Nor
th M
aced
onia
Rus
sia
Slov
ak R
epub
lic
Arm
enia
Kos
ovo
Cypr
us
Azer
baija
n
Tuni
sia
Leba
non
Mor
occo
Kaz
akhs
tan
Turk
ey
Mon
golia
Turk
men
ista
n
Uzb
ekis
tan
Egyp
t
Kyr
gyz
Rep
ublic
Tajik
ista
n
Jord
an
Wes
t Ban
k an
d G
aza
Population growth Urban population growth
Source World Development Indicators urban population growth (httpsdataworldbankorgindicatorSPURBGROW) and population growth (httpsdataworldbankorgindicatorSPPOPGROW) and EBRD staff calculations as presented in the report Creating Liveable Cities Regional Perspectives18
Figure 3 Population and urban population growth 2017 (per cent)
18 Ibid
Urban development trends and regional context
23
Figure 4 Percentage of cities with falling populations 2000-12
shrinking (see Figure 4) The economic and social consequences of this shift in the urban landscape have been severe While the growing urban centres benefit from increased productivity and an inflow of capital and skilled labour the declining secondary cities often experience fiscal constraints due to falling tax revenues imbalanced and deteriorating infrastructure assets and housing values and a poorly skilled labour force due to selective out-migration All of this potentially limits the fiscal and administrative capacity of the declining cities to address current and upcoming environmental challenges
Policy considerations should recognise the priorities and needs of different categories of cities ndash small large growing or declining For instance a rapidly growing megacity like Cairo would need significant upgrades of infrastructure services and clear policies to manage an otherwise unregulated urban sprawl associated with poor mobility economic exclusion low environmental standards and poor public health Policymakers in growing cities may also more generally consider the environmental benefits and resource efficiencies of a more compact urban design However in shrinking or declining cities policies should focus on mitigating the negative effects of declining population and capacity including by helping
to diversify the economy coordinate investments and transfer capacity-building and skills across public private and academic agencies
Urbanisation economic growth and inequality
The shifting landscape of urban centres has created and continues to create lsquowinnersrsquo and lsquolosersrsquo across different cities The more productive and dynamic urban centres tend to attract investment capital and skilled labour and as a result they represent the majority of the innovation and higher economic growth compared to the rest of their respective countries In general gross domestic product (GDP) per capita is significantly higher in large cities than elsewhere in a country and in the EBRD regions such differentials tend to be on a par with or higher than those observed in advanced economies (Figure 5)
There is also an increasing division between lsquowinnersrsquo and lsquolosersrsquo within the growing cities as inequality ndash as measured through the Gini coefficient ndash is particularly pronounced in fast-growing cites20 Policymakers should recognise these patterns and pursue policies that help reallocate wealth and promote equaleconomic opportunities for all both to help the declining cities and regions left behind and to ensure that growing urban centres are as inclusive as they can be
Wealth and consumption patterns
In terms of consumption patterns and environmental impact it is not just absolute population growth that drives consumption emissions and congestion problems in growing cities Rather the interrelationships between wealth and population growth are highly relevant as growing population centres increasingly tend to house wealthier people Wealthy people consume more and generate more waste For example across the EBRD regions many citizens are craving to spend newly acquired wealth on buying a car and this is reflected in the urban road congestion in the EBRD economies Road congestion and high pollution levels from traffic are observed in many of the larger cities in the EBRD regions due to a combination of increased car ownership poor vehicle standards and the absence of pollution control and monitoring21 According to the TomTom road congestion
19 Ibid20 See UN-Habitat (2013)21 Poland and Estonia are the countries in the EU with the highest population of cars older than 20 years making up 337 per cent and 276 per cent of their car fleets respectively See Eurostat (2020)
100
90
80
70
60
50
40
30
20
10
0
Tajik
ista
n
Uzb
ekis
tan
Kaz
akhs
tan
Geo
rgia
Kyr
gyz
Rep
ublic
Pola
nd
Turk
ey
Bel
arus
Serb
ia
Rus
sia
Mol
dova
Ukr
aine
Alba
nia
Rom
ania
Bul
garia
Source World Bank City Database and EBRD staff calculations as presented in the report Creating Liveable Cities Regional Perspectives19
Urban development trends and regional context
24
index for 2019 16 out of the 18 most congested cities in Europe were located in the EBRD regions23 This represents a key challenge for policymakers who must seek a good balance between regulation price signals and viable transport alternatives to reduce the need for and attractiveness of private cars
Decentralisation governance and regulation in the EBRD regions
The ability of cities to find solutions to economic stagnation environmental challenges climate change risks and inequality is highly dependent on the efficiency and effectiveness of their governance structures For instance the Urban Governance Survey (developed by LSE Cities UN-Habitat and United Cities and Local Governments (UCLG)) which interviewed local city government representatives on urban governance showed that 36 per cent of respondents believed that inflexible bureaucracy and rigid rules were a major factor in reducing the abilities of cities to implement their policies24
Many countries and cities in the EBRD regions have a legacy of poor local governance The former centrally planned economies do not have a good track
record of promoting local capacity and procedures for self-governance or accountability mechanisms and influence through local civil societies Poor local governance was often exacerbated by inadequately planned and implemented decentralisation processes that followed the collapse of central planning within the EBRD regions
Empowered local governments have been shown to have a positive impact on the provision of public services and on quality of life25 The major benefits of decentralised decisions include (i) a more targeted or tailored supply of public services and infrastructure as a response to local demand which should lead to (ii) a more cost-efficient use of public expenditures and may lead to (iii) an increase in cost-recovery funding from residents who are more willing to pay for adequate services Decentralisation can also (iv) promote accountability and reduce corruption due to a greater proximity to a population that may be more aware of local governmentsrsquo actions than they are of the actions of central government
However if executed poorly decentralisation may result in inefficiencies and corruption and further disillusionment with local government Therefore
Note Data for Albania Croatia France Ireland Italy Latvia Lithuania the Netherlands Norway and North Macedonia are for 2016Source Eurostat GDP per inhabitant for capital city metropolitan regions (httpseceuropaeueurostatstatistics-explainedindexphpUrban_Europe_E28094_statistics_on_cities_towns_and_suburbs_E28094_the_dominance_of_capital_cities) and EBRD staff calculations as presented in the report Creating Liveable Cities Regional Perspectives22
Figure 5 GDP per capita in the largest cityrsquos metropolitan region 2017 (national average = 100)
300
280
260
240
220
200
180
160
140
120
100
80
Fran
ce
Slov
ak R
epub
lic
Rom
ania
Pola
nd
Czec
h R
epub
lic
Hun
gary
Net
herla
nds
Uni
ted
Kin
gdom
Croa
tia
Serb
ia
Turk
ey
Bel
gium
Latv
ia
Nor
way
Lith
uani
a
Nor
th M
aced
onia
Esto
nia
Slov
enia
Den
mar
k
Irela
nd
Swed
en
Alba
nia
Gre
ece
Spai
n
Port
ugal
Finl
and
Italy
Aust
ria
Bul
garia
Ger
man
y
22 Ibid23 See TomTom (nd)24 See LSE Cities UN-Habitat United Cities and Local Governments (2016) 25 See Bilbao (2015)
Urban development trends and regional context
25
for the abovementioned benefits to materialise it is important that (a) decisions (and not only operational obligations) are transferred to local authorities (b) local authorities have sufficient financial and institutional capacity and procedures in place and (c) the decentralisation promotes engagement and enables residents to hold institutions to account for delivering policies in a transparent manner
Unfortunately the decentralisation processes in many of the economies where the EBRD invests are still incomplete with the capacity resources procedures and political autonomy of local authorities remaining inadequate The process of developing a strong culture and presence of civil society has also proven to be a long and challenging journey in many cities This too has hampered the way local communities are able to influence urban development and hold its local decision-makers accountable
Conclusion
Urban development and regulation has been reoriented in many parts of the world over the past few decades from an earlier focus on production and productivity with less emphasis on environmental and human wellbeing to a stage where the environment and its residents increasingly take priority While this reorientation first started among the more advanced OECD economies in the 1970s and 1980s the centrally planned economies in the EBRD regions began the process later These economies also had a more rigid approach to management based on a top-down command structure As a consequence many municipalities in the EBRD regions have less experience with rich and complex policy programmes that combine comprehensive stakeholder dialogue processes and the involvement of local community members in urban development Such programmes encompass effective price signals economic incentives strict transparency principles and information- and trust-building efforts between residents and local authorities
Taking these observations into account makes it clear that the regions require a combination of green and inclusive urban development To achieve this a rich and comprehensive policy mix is needed in many places
where the interdependence of different policies and the synergies between investment programmes and policy initiatives would need to be carefully considered and debated This report aims to contribute to the debate
22 Beyond green cities other relevant conceptsFigure 6 captures some of the many terms and concepts being used to refer to programmes and objectives of modern progressive cities While this report focuses on green urban policies ndash targeting environmental and climatic challenges ndash it touches on these other concepts where relevant
Smart cities are those that prioritise the development of digital infrastructure connectivity to facilitate the growth and curation of human capital The increase in the innovative capacity of smart cities enables them to maintain their industrial competitiveness26
But interconnected digital solutions are not just for the powerhouse cities of the Global North Santiagorsquos Chilecon Valley for example is being heralded as a prime example of an open smart district in South America27 Its growth of digital start-ups can be attributed in part to the countryrsquos pro-immigrant policy designed to welcome innovators from the United States of America The capital also boasts the most advanced public transit system in South America and is making plans to accommodate rapid growth in the use of electric vehicles charged by the smart grid28
This demonstrates the role that smart cities can also play in driving a green agenda For instance data can be used to effectively manage the roll-out of electric vehicles and optimise vehicle-to-grid energy balancing which can reduce energy consumption as it mitigates against the lsquopeak-troughrsquo energy-demand profile of cities
However these ambitions for technological revolution have not been well received in all cities with some communities seeing the approach as pandering to outside interests rather than addressing local concerns29 For example international firms that are
26 See Trujillo and Parilla (2016) 27 See The Economist (2012) 28 See Marshall (2016)29 See Wattenbarger (2018)
Urban development trends and regional context
26
vocal about the transition to smart cities include the likes of IBM and Siemens The smart city concept is applied and supported by initiatives such as the Smart Cities Prosperity Fund Programme and the EUrsquos Digital Cities Challenge and many cities are seeking to pursue a smart urban development agenda
Circular cities are a relatively new phenomenon based on well-established schools of thought around functional service economies and natural capital These are cities that seek to harmonise economic development with environmental conservation Some of the key sectors that are thought to benefit most from this approach include waste and textiles and transport and food production The principles of a circular economy can be integrated into planning policy for example compact city development as demonstrated by Curitiba a city in Brazil which implemented this development strategy 30 years ago The strategy entailed mixed-use development and densification along five bus rapid transit (BRT)
corridors This has been reported to help improve land-use issues increase public transport use and reduce congestion30
Strengthening the resilience of a city is a priority for many governments and their citizens and circular and smart cities can help in this endeavour A resilient city is one that is able to strengthen its response recovery and adaptive capacity not just to physical but also to social and economic shocks and stresses These may include high unemployment endemic violence or floods One such global organisation supporting cities to develop resilience strategies is 100 Resilient Cities which works to enable cities to structure their approach and pathway to a more resilient future It has outlined seven key qualities that characterise a resilient city reflective resourceful robust redundant flexible inclusive and integrated31
30 See EMF (2019)31 See 100 Resilient Cities (nd)
Source Arup Group
Figure 6 Other concepts used for city programmes and objectives
Circularcities
Smartcities
Concepts
Resilientcities
Healthycities
Inclusivecities
Urban development trends and regional context
27
Specific actions that cities are taking to become more resilient include the development of green corridors as promoted in Atlanta which has dedicated 400 acres of green space along the BeltLine Westside Trail This master plan has sought to address the racial inequity in access to green space in the area while also seeking to minimise health issues caused by frequent flooding with sewage-contaminated water32 33
Inclusiveness is a key element of resilient cities as documented by Jan Gehl in his book Cities for People It is also a focus of work for organisations such as the World Bank and the Asian Development Bank
The concept of healthy cities focuses on promoting health via the political agenda through institutional change capacity-building and innovation Creating healthier urban settings supports the health and wellbeing of the people that use them The WHO European Healthy Cities Network is a group of European cities that has been working towards this agenda for the past 30 years and forms part of a wider network of 1400 municipalities34 When health is used as a lens through which to examine city sectors it can generate other sustainable urban improvements for example shifts towards active mobility that can not only reduce the risk of respiratory disease but also decrease emissions of air pollutants reduce congestion and injuries and free up green space35
Inclusive cities are those that can provide services infrastructure and access for all residents regardless of gender sexual orientation race age or ability36 The international community has widely acknowledged the importance of creating inclusive cities to improve peoplersquos lives with Sustainable Development Goal 11 calling for ldquoinclusive safe resilient and sustainablerdquo cities37 While urbanisation creates the conditions to facilitate opportunities for a better life for residents for example through access to larger and more diverse economic markets the expansion of cities can also increase inequality and exclusion especially of the poor and vulnerable38 Developing inclusive cities
is an ongoing and dynamic challenge that requires city governments businesses and residents to work together Inclusion encompasses various complex factors such as economic inclusion social inclusion and spatial inclusion39 Recognising that each of these closely related dimensions need to be addressed will enable cities to break cycles of marginalisation exclusion and inequality
32 See Kahn (2017) 33 See 100 Resilient Cities (2018)34 See WHO (nd)35 See WHO and UN Environment (2017) 36 See Misra (2016) 37 See UN (2020) 38 See Asian Development Bank (2011) 39 See World Bank (nd)
ldquoInclusive cities are those that can provide services infrastructure and access for all residents regardless of gender sexual orientation race age or abilityrdquo
28
29
Sector-based policy options
31 Mobility and transport
32 Land planning green space and biodiversity
33 Energy and buildings
34 Water and wastewater
35 Solid waste
03
30
This section discusses the sector-based policy options available to cities to support sustainable urban development and green city investments It is divided into the sectors of mobility and transport land use energy and buildings water and wastewater and solid waste
31 Mobility and transportTransport accounts for a quarter of global carbon dioxide emissions and is responsible for harmful air pollutants that negatively impact the health of city residents From an environmental perspective the main policy objective with regard to the transport sector today is to cap or reduce the use of private cars and increase the share of public and active mobility (such as cycling or walking) Policy objectives may further seek to promote cleaner public and private vehicles ndash ideally with zero emissions Together with land planning related policies may also seek to reduce the need for motorised mobility or transport
Policy measures in the transport sector can be divided roughly into (i) demand-side measures aimed at influencing travel decisions and (ii) supply-side measures seeking to provide a credible alternative to private cars Among the demand-side measures are policies aimed at making cars ndash in particular those that release the most CO2 and nitrogen monoxide ndash less attractive (for example parking policies or road-user charges but also attitude campaigns and the pedestrianisation of selected streets) Among the supply-side measures are policies and initiatives aimed at providing well-planned sustainable and
attractive public transport services as well as policies that seek to increase the modal share of active mobility options
Both demand-side and supply-side measures have been inadequate throughout the EBRD regions partly due to (i) low administrative capacity in cities (ii) weak enforcement and (iii) a low revenue base These shortcomings must be addressed as part of an effective policy mix aimed at tackling the main environmental challenges linked to the urban transport sector
A selection of such urban transport and mobility policies includes the following
Car-restrictive policies
1 Parking policies ndash including pricing restrictions information and enforcement
2 Road-user charges ndash including congestion charges and low emission zones
3 Pedestrian-oriented and car-restrictive policies
4 Car-sharing car-pooling and ride-sharing
Promotion of public and active mobility
5 Planning and regulation of public transport services
6 Pro-cycling policies
Promotion of cleaner vehicles
7 Electrification of urban transport
Sector-based policy options
Cities can choose from a wide range of policy options to address urban environmental challenges ndash some options are sector-specific while others cover multiple sectors
Sector-based policy options
31
T1 Parking policiesSummary
The primary environmental objective of parking policies is to make parking and the use of private cars less attractive in order to promote a shift towards public and active mobility Restrictive parking policies cover several types of intervention including the pricing of parking and the limitation or relocation of available parking spaces An active use of parking regulation can be an effective deterrent to the use of private cars with a limited or even a positive impact on the city budget Parking policies can also help promote the use of electric or low-emission cars and effective use of parking facilities may be supported by appropriate information systems Furthermore real-estate developers can be obliged to provide off-street parking solutions when needed However parking policies only succeed in cities with credible enforcement capacity and good public transport services as a viable alternative to private cars
Description
Effective parking regulation requires consistent urban coverage pricing and enforcement One such approach is the introduction of parking zones where each zone often labelled with different colour codes represents different price levels ndash from highly priced and often time-limited parking in the centre to cheaper and less restricted parking in zones further from the centre More sophisticated parking schemes may include parking fees linked to the vehicle emission levels at the time of car registration or dedicated parking and charging facilities for electric cars
Workplace levies may also be considered as part of a cityrsquos parking policies This measure imposes taxes on companies for each parking space they provide to employees and may also have a significant positive effect on the cityrsquos revenue For example in Nottingham in the United Kingdom money raised from the workplace levy has helped fund extensions to the existing tram system and the redevelopment of Nottinghamrsquos railway station
Restrictive parking policies may include the reduction or relocation of available parking spaces which can be coordinated with other transport solutions
For example the removal of on-street parking spaces frees up space that can be repurposed for other needs such as dedicated bus lanes widened pavements or cycle lanes Hamburg implemented this approach in 1976 and Zuumlrich in 199640 Parking solutions may also be tailored to public transport schemes through parking (lsquopark-and-ridersquo) facilities located next to key transit stations
Resource implications and key requirements
Introducing regulated parking fees for the first time involves some coordination with land planning and traffic planning It requires adequate marking of dedicated parking spaces and related signposts It also requires a reliable and user-friendly payment solution of the kind that are increasingly based on payments through mobile phones rather than the more traditional pay-and-display solutions Operating the system also requires good control and enforcement mechanisms Lastly significant legislative changes might be needed in order to regulate private car-parking facilities
Introducing additional parking fees or time limits on existing parking spaces may require little investment or additional control and enforcement costs for the city The removal of parking spaces is not financially costly either However the removal of on-street parking may be combined with other arrangements such as the construction and operation of off-street parking garages or park-and-ride facilities which may require significant resources and coordination among city designers and planners in relation to other policy areas
Potential private-sector participation
The private sector can play an effective role in setting up and operating parking payment and control schemes Here cities can consider both availability payments (for a system that works) and performance payments (for revenues collected) For example private contractors can help improve parking control and revenue collection through a well-defined and well-managed parking service contract At the same time the private sector can play a constructive role in the financing construction and operation of off-street parking garages and lsquopark and ridersquo facilities
40 See Push-Pull Parking (2015)
Sector-based policy options
32
In addition real-estate developers can be obliged to provide off-street parking solutions as part of their development permits
Implementation obstacles and solutions
A radical change to parking fees or parking availability requires a new mindset and acceptance from the public It also needs adequate control procedures and enforcement capacity Therefore recommendations may include the gradual introduction (both in terms of coverage and price levels) of parking fees This enables a gradual change in peoplersquos attitudes and a gradual building of the necessary operational and enforcement capacity Furthermore both the pricing and the relocation of parking facilities can play a constructive role in a policy mix together with other lsquoshiftrsquo measures As car owners see parking fees as a burden such interventions are more readily accepted when they appear together with improved public transport services as a viable alternative to private cars
Time-limited parking facilities prevent specific user groups such as workers or selected residents from using those facilities The removal of on-street parking may further upset many potential beneficiaries of such facilities ndash including business communities workers
and selected residents and like parking fees policies that limit parking may face less opposition when combined with improved public transport services or other measures as part of a policy mix
Parking restrictions that support the general demand for public transport services while also providing carefully planned relocation of parking facilities close to key transit stations (park-and-ride facilities) can have a particularly strong impact on the shift from cars to public urban transport Removal of parking spaces also provides a great opportunity to reallocate scarce urban space to dedicated bus lanes bicycle lanes or even trees and green spaces
Comparison with other policy options
When comparing an active use of parking pricing to road-user charging (see policy option T2) it is worth noting that many of the benefits can be quite similar Parking policies are often quicker and less complicated to implement and represent lower investment costs compared to the introduction of a new congestion charging solution Removal of parking facilities may provide good opportunities to reallocate scarce urban space to public and active mobility
Sector-based policy options
33
Secondary measures and effects parking information and guidance
Modern parking facilities equipped with sensors can collect real-time information about parking availability This information can be communicated to drivers through information boards and mobile apps It enables drivers to plan and find available parking more easily reducing search time and traffic and thus minimising congestion and pollution while also helping to enhance the quality of the urban area
Introducing this parking information which in a smart city can be combined with pricing traffic and congestion data in order to propose an optimal parking solution improves the driver experience rather than promoting a shift away from private cars It can however be viewed as a mitigation of objections by drivers to the relocation of existing on-street parking facilities Furthermore these systems can also be economically viable As an example within five years the gradual introduction of a Parking Guidance and Information System in Southampton United Kingdom proved to have an economic rate of return of 91 per cent where the cost-benefit calculation took into account the cost of installation and maintenance and the benefits associated with the reduced times spent searching and queuing for parking spaces Broader
benefits included reductions in distance travelled time spent parking vehicle operating costs and fuel consumption41
Unintended consequences
Parking policies to deter private cars in urban areas have sometimes accelerated the development of large shopping centres on the outskirts of cities Such developments should be handled with care as rather than addressing an urban traffic problem the parking policies may end up relocating the problem to another part of the city where public and active transport modal shares are even harder to increase
T2 Road-user charges
Description
Road-user charging is a transport-demand policy instrument The primary environmental objective of introducing road-user charges is to discourage the use of certain classes of vehicles fuel sources or more polluting vehicles
As an instrument road pricing can be tailored to specific areas times vehicles emission standards and fuel types It has the potential to generate substantial revenue but has high investment and collection costs for example in the form of physical road-tolling stations or through an automated charging system that relies on complex information technology (IT) infrastructure and a good vehicle database for effective enforcement procedures Road charging schemes have often met strong opposition and many plans have been delayed or cancelled due to disapproval from residents
Urban road-user charging can be arranged in different ways including through toll booths or through electronic vehicle-recognition infrastructure placed on all entry points to a targeted area of a city Charging typically requires comprehensive upfront investment and collection costs are substantial Road-user charges can be tailored to specific areas of a city and to certain times of the day (for example more expensive at peak times) andor vehicle types (for example fees for heavy goods vehicles) They can
41 EUROSCOPE (TR1023) (1999)
Sector-based policy options
34
also be tailored to vehicle emission levels at the time of vehicle registration and are sometimes used to promote low or ultra-low emission zones
In terms of relevant case studies Singaporersquos Electronic Road Pricing scheme was one of the first and most complex The scheme was launched in 1998 and covers selected expressways arterial roads and three restricted zones The toll is applied to all vehicles and varies by time of day and direction of travel
The London Congestion Charge was introduced in 2003 and works with a flat daily charge for driving a vehicle within the charging zone The charge helped reduce traffic in Londonrsquos city centre by 39 per cent between 2002 and 2014 In 2019 the city launched its Ultra-Low Emission Zone which includes more stringent emissions standards
Stockholmrsquos congestion charge was introduced in 2006 and is designed as a barrier scheme in which a payment is required for each entry through the barrier and is dependent on the time of day A study of congestion pricing in Stockholm between 2006 and 2010 found that in the absence of congestion pricing Stockholmrsquos ldquoair would have been five to ten percent more polluted between 2006 and 2010 and young children would have suffered 45 percent more asthma attacksrdquo42
Resource implications and key requirements
While there is no clear-cut way of narrowing down the resources needed to introduce a road-pricing measure it is generally a costly solution that requires strong administrative capacity It may require complex IT infrastructure a good vehicle database for enforcement and significant changes to legal and organisational frameworks For example in 2015 Transport for Londonrsquos collection cost was pound85 million representing one-third of total fee collection ndash with a congestion charge of pound1150 per day
In cities where no dependable licence plate database exists and there is no legislation enabling congestion charging this step might be the greatest bottleneck in the entire process The relationship between the national legislative framework and regional or city
legislative structures is also important in that cities or regional areas may be able to enact their own laws or they may have to rely on national laws being applied in their geographical areas
Implementation obstacles and solutions
Despite evidence of impact the public has repeatedly rejected proposed road-user charges For example in Manchester and New York in 2008 and Copenhagen in 2012 tolling schemes were rejected by public referendums Public acceptability requires an incremental introduction of fee levels It also requires consultation and feedback from the public in designing the policy and robust awareness campaigns with evidence of improvement in terms of traffic congestion public transport and road networks43 Furthermore the vision of the policy should be part of an overall traffic plan including improvements in public transport funded by the road pricing revenue In London and Oslo resistance to congestion and toll charges was partly overcome by transparently linking these fees with public investment
Comprehensive congestion charging remains suitable for large cities with a congestion problem in their city centres but is rarely a recommended solution for small to medium-sized cities due to the administrative and financial burden For small to medium-sized cities parking measures are much more effective but may need to be combined with charges for goods vehicles
Comparison with other policy options
Effective use of restrictive parking policies has many of the same benefits as road-user charges However parking policies are often significantly easier to implement and can be introduced in a more gradual fashion
T3 Pedestrian-friendly policies
Description
Pedestrianising roads or city centres can be seen as a demand-side measure aimed at regulating and influencing travel decisions When combined with
42 See Rogers (2017)43 See Collier et al (2019)
Sector-based policy options
35
good solutions for public and active mobility it can be an effective policy to reduce traffic and improve local air quality In addition car-free roads can promote more vibrant and enjoyable urban spaces A large number of European towns and cities have made parts of their centres car-free since the early 1960s This approach is often accompanied by car parking facilities on the edge of the pedestrianised zone and is sometimes combined with park-and-ride schemes or cycle lanes to facilitate public and active transport to the pedestrianised centre Most pedestrianised zones allow delivery trucks at certain times of the day
Pedestrian-oriented policies can be more or less restrictive or ambitious in terms of the area the time and the vehicle classifications that are subject to restricted access It can involve complete pedestrianisation of a large area or it can be modest in its coverage or accept motorised vehicles at certain times There is also the opportunity to exempt certain vehicles from the ban for example public transport vehicles or the vehicles of selected residents business owners or disabled people The promotion of car-free days is another approach often aimed at raising awareness as much as regulating travel decisions
Resource implications and key requirements
Restricting car traffic for a given road has initially low financial and administrative implications However implementation costs and consequences with regard to shifts in traffic flow patterns will need to be considered Promoting active mobility may also require additional investment such as better street lighting
Implementation obstacles and solutions
The main resistance to car restrictions tends to come from local shopkeepers and to some extent from local residents and other businesses For instance policymakers should be aware that the pedestrianisation of city centres can cause surrounding property prices to increase significantly And while in almost all cases retail businesses also benefit this can lead to an inexorable rise in commercial rents too This means that pedestrianised retail centres risk becoming further homogenised
with only the most high-end independent shops able to operate The challenge for policymakers therefore is to implement pedestrianisation while minimising the negative effects of the gentrification that is likely to accompany it To this end the success factors of pedestrianisation schemes include a gradual approach coupled with public consultations This allows businesses to adapt to and influence the policy Transparency regular community engagement monitoring and evaluation are crucial to measuring the success of the scheme
The city centre of Nuremberg Germany has been gradually pedestrianised since the 1970s to address the decline in air quality When heavily congested roads were closed to cars traffic volumes fell by up to 25 per cent in the historic city centre while on nearby roads it increased between 4 and 19 per cent Over the following 10 years the area was transformed into an attractive pedestrian precinct buildings were renovated street furniture upgraded and art works introduced Public support for the pedestrianisation scheme has proved to be strong Proposals to reopen the centre to car traffic following a change in political leadership of the city in 1996 were not realised due to public objection44
T4 Planning and regulation of public transport services
Description
The degree of planning and regulation of urban transport services can vary from a liberal approach to a more structured and coordinated approach A liberal approach based on largely unregulated private bus and minibus services requires less administrative and financial capacity within the municipality and is flexible and responsive to most transport demand in cities
However a liberal approach tends to face coordination problems An effective pursuit of environmentally friendly and inclusive mobility requires adequate regulation of transport services on the back of a plan for sustainable urban mobility
44 See European Commission (nd)
Sector-based policy options
36
Effective transport services require professionalism predictability and accountability Improved performance of incumbent operators can be promoted by transforming municipal transport operators into separate legal and commercial entities or joint stock companies (JSCs) This helps to depoliticise the management of these operators To further professionalise the relationship between the company management and the city it is recommended to set up public service contracts (PSCs) between the municipality and the JSC ndash defining rights obligations and processes ndash to ensure predictability and accountability for all Improved transport services can also be promoted through well-regulated and well-procured private service contracts
The benefits of a well-planned and regulated transport sector include better resource efficiency through synergies between transport modes including private cars bicycles and various public transport services Better regulation and coordination can further facilitate integrated multi-journey ticketing covering journeys that include a variety of transport modes It also enables the introduction of an electronic ticketing solution electronic vehicle monitoring and transport management which allows for real-time information systems All this improves user experience and increases the popularity of public transport services
Resource implications and key requirements
Setting up a strong integrated urban transport regulator takes time It requires adequate capacity to
plan contract procure and monitor services Effective contracting and transparent funding of regulated services also require shifting the control of cash flow from the operators to the transport authority
Of the different solutions it is worth noting that electronic transport management includes operation of the necessary IT infrastructure and control room In Moscow which has a population of 123 million the creation of an intelligent transport system had an overall budget of US$ 17 billion from 2012-2045 Electronic ticketing and real-time information systems may also require significant investment in ticket machines validators information boards and IT infrastructure
Potential private-sector participation
Increased administrative planning and coordination does not imply a crowding-out of private operators Regulated bus services can be effectively procured contracted to private operators and monitored by a dedicated authority The introduction operation and maintenance of electronic ticketing systems electronic vehicle monitoring or real-time information services can also be effectively financed implemented and operated by private contractors For example the city of Belgrade contracted out the supply financing and operation of an electronic vehicle (bus) monitoring and ticketing solution including ticket sales and ticket control in return for 83 per cent of the ticket revenues collected For the city the outcome was a more than 10 per cent revenue increase in the first year of operation implying a net rise in municipal revenue better vehicle monitoring under the PSCs and lower costs of ticket sales without any material capital expenditure46
Implementation obstacles and solutions
Effective regulation of the urban transport sector may upset public and private operators alike One challenge is the formalisation of unregulated minibus services for which moderate adjustments to licencing requirements may be a first step Effective regulation may involve the unbundling of a transport authority that has in the past provided services and regulated the sector It may also involve account separation
45 See Innovative Governance of Large Urban Systems (2017) 46 See Tica et al (2012)
ldquoEffective transport services require professionalism predictability and accountability The performance of incumbent operators can be improved by transforming municipal transport operators into separate legal and commercial entities or joint stock companiesrdquo
Sector-based policy options
37
and further unbundling of different transport modes or operators to ensure transparency and well-defined service contracts for each mode and operator A gradual approach may be needed here as both managers and related unions may oppose such moves towards transparency and future competition for related transport markets
Effective contracting and the transparent funding of regulated services require shifting the control of cash flow from the operators to the transport authority This implies a change of mindset and may have to be introduced gradually through one transport mode at a time on the back of a well-defined and well-funded public service contract for the relevant operators
T5 Electrification of urban transport
Description
Electric vehicles have zero tailpipe emissions and where renewable electricity generation is on the rise can be effective in reducing greenhouse gas emissions Policies promoting the electrification of the transport sector include the introduction of battery-powered electric buses and the promotion of trams and trolleybuses ndash with or without in-motion charging solutions This also includes policies promoting individual electric vehicles including private cars and light commercial vehicles Key policies promoting private electric vehicles include the use of road-user charges in favour of electric vehicles (see policy option T2) parking policies in favour of electric vehicles (see policy option T1) access to bus lanes for electric vehicles and the roll-out of convenient charging infrastructure
Resource implications and key requirements
A shift to electric buses brings about fundamental changes to the operating model ndash and the economics These changes include significant upfront investment in charging and maintenance facilities and higher costs for the purchase of rolling stock They also include important negotiations with the energy sector to ensure sufficient capacity on the local grid and optimal electricity prices for overnight or day-time charging Personnel will also be affected
and many staff will require retraining and redeployment Drivers will need to adapt to new driving techniques and protocols for recharging and battery management while the maintenance of buses and charging infrastructure will change to the extent that these may be outsourced as part of supply-operate-maintain contracts
Overall lower fuel and maintenance costs are associated with electric buses compared to diesel buses but as the relevant market segments are less settled the pricing of these activities is subject to some uncertainties A less radical approach is the expansion of tram or trolleybus networks as this represents less of a change compared to the existing model in operation Here one increasingly relevant hybrid solution involves trolleybuses with battery capacity and in-motion charging using existing or new trolley wires for battery charging This approach which is mostly relevant for cities with an existing trolleybus service enables the buses to operate temporarily outside the network of overhead wires with moderate battery capacity installed
Policies aimed at the electrification of private vehicles may include revision to a current road-user charge to parking regulation or the access of electric cars to bus lanes which may not have huge resource implications The installation of charging stations at selected parking places however represents a significant investment cost In concrete terms in 2015 the cost of single-port non-residential electric-vehicle supply equipment (EVSE) unit ranged from US$ 300-1500 for Level 1 US$ 400-6500 for Level 2 and US$ 10000-40000 for direct current (DC fast charging while the installation costs varied greatly from site to site with a ballpark cost range of US$ 0-3000 for Level 1 US$ 600-12700 for Level 2 and US$ 4000-51000 for DC fast charging47 In light of this local initiatives aimed at promoting private electric vehicles will only work well when combined with national policies that support the use of electric and low-emission cars
47 See Smith and Castellano (2015)
Sector-based policy options
38
Implementation obstacles and solutions
Electrification of bus services requires considerable investments in fleets maintenance and charging infrastructure and thus significant capital expenditure The cost of electric buses can be double the price of their diesel equivalents and charging stations are also expensive ndash they cost about US$ 50000 for a standard depot-based version used for overnight charging48 Nevertheless several cities have introduced electrification of bus services on a small scale on the back of a clear green vision for the relevant city and with some financial support from national or international entities It has also been suggested that electric buses have lower operating costs in the long term and are easier to maintain For example in the case of Stockholm evidence suggests that lower fuel costs for electric buses can balance the high investment costs incurred in building charging infrastructure while achieving in the bus fleet a reduction of up to 51 per cent in emissions and up to 34 per cent in energy use49 In addition to financial barriers the current state of technology can be an issue For instance during early tests in Belo Horizonte in Brazil electric buses had trouble getting over steep hills with full passenger loads50
T6 Pro-cycling policies
Description
Cycling generates no emissions or noise requires less road and parking space compared to cars and is a more economical and healthier form of mobility compared to motorised transport51 Policies to encourage cycling include pro-cycling infrastructure pro-cycling regulation and pro-cycling subsidies A modal shift to cycling can be further promoted by awareness and attitude campaigns
Pro-cycling infrastructure includes the introduction of segregated cycle lanes and the introduction of convenient and theft-preventing parking facilities as well as bike-sharing facilities Pro-cycling regulation can be seen as an effort to modify road use and traffic patterns in favour of cycling for example introducing two-way cycling in one-way streets or introducing advanced-stop boxes in front of cars at traffic lights Such regulation can also include work towards a reduction or calming of traffic
Pro-cycling subsidies may fall primarily within the sphere of national policies However municipal fiscal measures may include local tax benefits to install cycle-friendly infrastructure such as bicycle parking at work Local governments can also demonstrate their support for cycling through cycle-friendly public procurement procedures which may include purchasing electric bicycles or electric cargo bikes instead of light commercial vehicles for services such as postal deliveries
Resource implications and key requirements
The design and construction of segregated cycle lanes may be costly but moderate alterations to existing road infrastructure such as painted lanes on the side of roads are more affordable for a city budget A different issue arises from the potential need to reallocate scarce urban road space to safe cycling infrastructure by removing on-street car parking facilities or by introducing one-way streets From 2010-14 the city of Copenhagen allocated euro80 million to the implementation of its bicycle strategy The cycling infrastructure in Copenhagen is extensive and includes
48 See Financial Times (2019) 49 See Xylia et al (2017) 50 See Marshal (2019) 51 See CIVITAS (2009)
Sector-based policy options
39
a network of segregated bike paths bicycle traffic lights separated coloured bike paths where cars and bikes share road space and bicycle parking
Pro-cycling policies can be administratively demanding due to the need to create a cycling code and implement new regulations for non-road infrastructure provision such as bicycle parking Policy measures that involve re-regulation of traffic patterns can also be technically demanding and may necessitate new capacities within the local administration Bike sharing is not cheap but with good sponsorship arrangements it can represent a minimal burden for the city budget
Potential private-sector participation
The private sector is involved through the provision and sponsorship of bike-sharing schemes and companies may be further involved in providing bicycle parking facilities and cycling incentives as part of their human resources policies or remuneration policies Non-governmental organisations (NGOs) can also play an important role in rolling out information about cycling initiatives such as bike-sharing schemes
Implementation obstacles and solutions
Reallocation of scarce urban road space away from cars and buses will naturally meet resistance and compromises will have to be made As in many policy options a gradual introduction of pilot cases combined with clear communication and ideas for the city-wide and global benefits of a shift towards active mobility must make up a core part of a pro-cycling strategy This can include supporting cycling organisations working with stakeholders and developing marketing and education programmes ndash in which NGOs can also play a role
In many cities bicycle theft is a growing problem and should be addressed through supportive measures An important aspect of reducing bicycle theft is to involve multiple actors Municipalities should make safe parking spaces available and launch campaigns to inform bicycle owners about locks as well as introduce registration systems for bicycles or more advanced systems such as chips
T7 Car-sharing car-pooling and ride-sharing
Description
Reducing the number of car trips is a way to alleviate traffic with the aim of reducing pollution and greenhouse gas (GHG) emissions freeing up space for pedestrians and cyclists reducing journey times and increasing productivity Trip reduction may be promoted through several measures including (i) car-sharing which is the practice of renting a car from a prominent service provider and having ownership of the car for a limited time (ii) car-pooling in which a group of people travel together using their private vehicles especially for commuting taking the trips in turn and (iii) ride-sharing a car service in which a person uses a smartphone app to book a ride in a privately owned vehicle52 Some cities promote car-sharing services in the form of self-service cars in a similar form to cycle-sharing schemes (for example Share Now)
Car-sharing is not a predominantly public-centred policy but public authority bodies can facilitate or provide incentives for car-sharing programmes and it can be seen as a phasing policy before the introduction of full congestion charging or pedestrianisation
Resource implications and key requirements
Car-sharing can have a low administrative and technical burden and although it could have an associated financial burden if incentives are offered to individuals or companies to operate there are significant savings to be obtained through reducing the number of cars on the road Congestion is estimated to cost the EU economy euro100 billion annually with a US study indicating that if car-sharing schemes were widely adopted vehicle numbers could be reduced by one-third in specific scenarios53
Potential private-sector participation
To develop and implement a successful car-sharing programme local authorities must work with a wide mix of stakeholders including regional transport authorities regulatory bodies businesses and
52 See Barber (2016) 53 See Transport and Environment (2017)
Sector-based policy options
40
multiple local government bodies Local authorities may have to invest or require businesses to invest in online platforms to facilitate easy connection between users and vehicles Self-service schemes are normally administrated by the private sector
Implementation obstacles and solutions
The first barriers to car-sharing are the reluctance of potential users to adopt car-sharing services and a strong desire for car ownership and use In order to overcome these barriers it is important to generate awareness and change aspirations from single car ownership to the use of connected transport modes through robust awareness campaigns and user behaviours
There is a risk that car-sharing may have a limited impact on reducing car use in a city and further infrastructure for cars may have to be provided that is specific to self-service sharing schemes Moreover the effect of ride-hailing apps on congestion is contested They could reduce traffic by encouraging people to leave their cars at home or they could increase the number of vehicles on the road if people switch away from public transport or forms of active mobility
In the case of sharing schemes it is also important to provide procedures for checking driving licences and to have appropriate insurance procedures in place to ensure safety for women in particular
A further challenge relates to private vehicle restrictions that pose a threat to car-sharing Exemptions from such policies could be a solution to promote car-sharing
It is difficult to generate a large user base to reach a certain operational scale for self-service car-sharing schemes and it has been found that competition from taxis that are competitively priced can reduce the use of car-sharing services54 Paris is an example of a city with an electric scheme Autolib which closed in 2018 and offers some lessons to other cities The service had to compete with a minicab service suffered from
poor maintenance by users and the vehicles became places of shelter for drug users Due to decreasing use of the service the operating company went into debt
In order to be successful it is important that the operators of car-sharing schemes understand the context and regulation of the cities in which they plan to launch DriveNow an alternative car-sharing scheme has seen significantly more uptake with one million registered users across multiple cities55 However the firm has had to abandon business in Stockholm due to high congestion charging and parking costs56
Ride-sharing apps such as Uber have encountered resistance from the public due to their employment practices leading to bans on taxi and ridesharing apps in some countries and cities Solutions to this issue can include labour law reforms for self-employed workers and the enactment of regulation on installing mandatory meters Furthermore such apps require a strong and reliable mobile network with reasonable cost for data use Economies in the southern and eastern Mediterranean region have particularly weak data networks with Jordan Lebanon Morocco and Tunisia all in the lowest third of countries globally for overall data speeds57
Elsewhere the Los Angeles Metro is working alongside car-sharing company Getaround to provide an affordable and ldquohassle-freerdquo car-sharing service at more than 25 Metro transit park-and-ride lots58
Comparison with other policy options
Car-sharing does not yield the same benefits of transitioning to active or public transport but can still be successful in reducing congestion and air pollution and can lessen the risk of low public acceptability that can be associated with car-free zones or congestion charging Car-sharing is not intended to replace other traffic management policies but rather to complement them
54 See ITDP (2015) 55 See Holder (2018) 56 See Rolander (2018) 57 See Opensignal (2017) 58 See Metro (2019)
Sector-based policy options
41
32 Land planning green space and biodiversity Land planning should sit at the centre of any urban development programme From an environmental perspective land planning seeks to protect and promote green and liveable spaces promote resource efficiency and minimise any conflicts linked to the use of scarce urban space It also seeks to regulate the development and use of buildings and infrastructure Effective land planning is a necessity for the development of other infrastructure services in a city Therefore one should normally see close coordination between land planning and sector-specific developments ndash including infrastructure services linked to transport water energy and waste
Over the past decades urban design and planning have in many places shifted away from a car-enabling development that focused primarily on productivity to a more people-oriented development with greater emphasis on environmental aspects and the wellbeing of the population As a consequence there has also been a shift to a more community-based planning process in which active participation by residents increasingly influences the land-use priorities of a city
From an environmental and wellbeing perspective some key strategic principles for land use include the following
1 Development of compact cities
2 Promotion of mixed-use areas and transit-oriented development
3 Promotion of green spaces and biodiversity
4 Promotion of community-based land-use planning
These strategic principles or policy options are
described in further detail in Sections L1-L4
L1 Development of compact cities
Description
Compact cities have many environmental benefits when compared to sprawling areas of low density The benefits include a reduced dependence on cars (hence lowering emissions) a smaller energy consumption due to dense development better and more cost-efficient public transport services and increased overall accessibility through public and active mobility Resource efficiency is further promoted through the reuse of infrastructure and previously developed land on the back of regeneration of urban areas
Policies of urban compaction involve the promotion of urban regeneration the revitalisation of town
Sector-based policy options
42
centres restraint on development in rural areas and higher-density real-estate development The promotion of compact cities is further linked to mixed-use development and the concentration of urban development at public transport connection points (see policy option L2)
One way of promoting more compact urban development is to restrain development in rural or peripheral areas of the city Such development can be controlled through the approval process of planning applications and through effective control and enforcement of any illegal developments
Other ways of promoting compact urban development include support for urban regeneration and higher-density real-estate development Urban regeneration would normally involve private developers getting involved in brownfield redevelopment projects This would normally work best when there is a clear partnership between private developers and the municipal authorities and where the municipality among others commits to providing strategic visions adequate infrastructure and transport services Private developers tend to welcome higher-density real-estate development and building permits can include obligations to undertake additional investments linked to the decontamination of brownfield sites or to the construction of green or public spaces for the benefit of the wider area
Resource implications and key requirements
Building restrictions at the periphery of a city require effective control and enforcement of building permits In cities where illegal construction activities are widespread significant resources and effort must be put in place to regulate the informal sector However building restrictions offer revenue-generation opportunities for city authorities For example Toronto has secured over US$ 350 million through its density-bonusing policies and in-kind benefits seem likely to have doubled the total value of revenues59 Normally restraining urban sprawl would not require significant capital investments by a city On the contrary the containment of urban sprawl should lead to less demand for expanded infrastructure networks and related services
Urban regeneration and the construction of high-density real estate require massive investment programmes However such investments are primarily provided by private developers and city authorities may only be obliged to finance-related infrastructure upgrades Nevertheless the necessary municipal investments may not be trivial and should be carefully considered before embarking on a large-scale urban regeneration programme City authorities must also be ready to provide comprehensive planning documents and feasibility studies as well as carrying parts of the site preparation costs and development risks linked to issues such as requirements to decontaminate sites prior to their development
Potential private sector participation
While the city authority may sit in the driving seat in terms of restraining urban sprawl the private sector will normally be financing and ndash to a large extent ndash driving any urban regeneration efforts and real-estate development
Implementation obstacles and possible solutions
Controlling urban sprawl may meet substantial resistance from developers and local residents One way to help build a public consensus and clarify the regulation can be to build a greenbelt around the city This however may require the city to acquire land to relocate people and to manage the landscaping and maintenance of the greenbelt In Tirana Albaniarsquos capital the Donate a Tree initiative has surpassed its target and triggered donations by residents companies and international organisations60
59 See Institute on Municipal Finance and Governance (2013) 60 See Sustainable Cities Platform (nd)
Sector-based policy options
43
Urban regeneration projects require substantial buy-in from local residents and private developers who may have differing interests For example the city of Roubaix in France has followed a market-led approach to urban renewal while integrating the issues of social exclusion housing renewal and economic and cultural development into its regeneration policies61 Comprehensive stakeholder engagement is therefore crucial and to incentivise private-sector participation the municipal authorities must be able to provide strategic visions and comprehensive planning documents This provision needs to be combined with a clear commitment to providing the necessary transport solutions and perhaps risk-sharing arrangements linked to issues such as requirements to decontaminate sites prior to their development
L2 Promotion of mixed-use areas and transit-oriented development
Description
Mixed-use development where housing jobs commerce and leisure are in close proximity is considered to yield significant economic and social benefits compared to more traditional separately zoned cities in other words those in which residential areas sit adrift from commercial areas First mixed-use areas require less transport for their inhabitants who will travel shorter distances between private and public activities In addition the shorter transport distances within a mixed-use area may also help promote active mobility rather than motorised transport As a consequence significant time-saving and environmental benefits are expected to follow a shift towards mixed-use urban development ndash time saving that can be used for leisure or for productive work For example a doubling of job and living density has been shown to increase economic productivity by 2 to 4 per cent62 Economies that are less transport-dependent can also be more inclusive for individuals who otherwise would not be able to afford the transport cost required to access job markets education or other services
The environmental benefits can be further enhanced if mixed-use areas are developed in line with transit- oriented urban development which refers to centres of social and commercial activities that are located at public transport connection points Such a combination of mixed-use areas and transit-oriented development can accelerate the use of clean transport systems and further rebalance the use of the streets in favour of pedestrianisation and active mobility where cars are prevented from undermining communal life
Land-use zoning is a concept used to support transit-oriented and mixed-use development In this context zoning policies are those that designate an area to a certain use and are often supported by a regulatory framework to ensure that developers abide by the recommendations and future developments do not threaten the ambitions set out in the policy They are particularly successful where there are areas of vacant land for example brownfield areas like old industrial sites or other areas where the policy is not in direct contradiction to existing developments
Resource implications and key requirements
Shifting to mixed-use and transit-oriented urban development requires significant resources in terms of planning and regulation and it has to be pursued in close coordination with various city departments including the cityrsquos transport planners It takes many years and requires close cooperation with multiple stakeholders and a constructive partnership with private developers In Clerkenwell in London mixed-use areas have been developed as a consistent policy for more than 20 years after the concept of mixed-use development emerged in national planning policy guidance63
Potential private-sector participation
In general the associated real-estate development will be financed and constructed by private developers Good planning coordination and contracting with private developers and businesses is therefore important
61See URBED and the Joseph Rowntree Foundation (2006) 62 See Bloomberg Citylab (2012b) 63 See VivaCity2020 Cities Institute LondonMet (nd)
Sector-based policy options
44
Implementation obstacles and solutions
Like other forms of urban regeneration projects promoting mixed-use areas on the back of a transit-oriented development will require coordination among several city departments as well as the buy-in of local residents and private developers who may have differing interests Such multi-stakeholder complexity may prevent or delay the implementation of mixed-use strategies Comprehensive stakeholder engagement will be crucial and clear municipal commitments to strategic visions together with improved infrastructure and public transport services may be needed
L3 Promotion of green spaces
Description
A wide range of benefits are associated with the provision of accessible urban green spaces and waterways First access to green spaces and waterways has a positive impact on the mental wellbeing of the population Second green spaces have direct environmental benefits They can help improve air quality and even regulate the air temperature of a city Furthermore they can reduce flood risks as vegetated surfaces are well equipped to absorb and store water Lastly green spaces can help boost biodiversity In order to promote the benefits of green spaces policies and initiatives should aim (i) to promote more green space (ii) to improve the value of the green spaces and (iii) to facilitate better accessibility for all to green spaces infrastructure and waterways
It may be necessary to extend the amount of green space through a combination of protective measures for existing green spaces and a proactive conversion or restoration of urban space and building surfaces into new vegetated areas Protective regulation includes rules monitoring and enforcement to protect green spaces from being lost to new built structures For example in Stuttgart Germany green areas are protected by local urban zoning and planning regulations These are supported by a Climate Atlas created to guide the location of green spaces to facilitate cooling and airing of the city64 These protective measures would normally be carried out by municipal authorities although local communities and NGOs may undertake some of the monitoring functions
Transformation of urban brownfield areas and building surfaces into vegetated land will however require close cooperation with private developers and landlords Opportunities here include ways to integrate green or blue urban space development such as the obligation to develop pocket parks or to clean up waterways as part of brownfield redevelopment projects Other measures aimed at increasing the amount of green space include community-based initiatives to increase the development of pocket parks gardens and farming activities on available urban land For example urban agriculture policies in Amman Jordan have initiated the greening of more than 300 rooftops and of around 4000 school and home gardens65
An increase in the number of green urban spaces can also be achieved through the promotion of green roofs Green roofs (or walls) have many of the same environmental benefits as traditional parks and gardens including decreased surface-water run-off preventing flooding during heavy rainfall improved local air quality decreased local air temperature and the promotion of local biodiversity Green roofs can be introduced on public buildings They can also be introduced on private buildings through subsidies or through planning approvals for new construction or renovation In addition green roofs can be promoted through better information and awareness campaigns For example Toronto in Canada has introduced an ambitious green roof policy requiring
64 See European Environment Agency (2014) 65 See ICLEI (2014)
Sector-based policy options
45
buildings above a certain height to have a certain percentage of green roofs66
Beyond the amount of vegetated land the quality and the value of green infrastructure also matter Green spaces can increase their value through proper landscaping and maintenance Turning green spaces into multifunctional areas is another way of increasing their value which again can generate new revenue streams to fund landscaping and maintenance For example urban green spaces can be rented out for specific events and parks can be designed as flood barriers reducing flood risks or the need to spend resources on alternative flood-protection measures Examples of this are the jointly funded flood alleviation schemes on parks in London UK For example through joint funding from Southwark Council the Environment Agency and Thames Water schemes delivered surface-water flood protection for over 100 homes at risk and brought investment and improvements to several parks and sports grounds67
Improved accessibility is another way to ensure the benefits of green spaces in a city Therefore urban planning should always consider how new or amended network infrastructure and built environment can improve current or restored green or blue infrastructure
Resource implication and key requirements
It requires a significant number of resources to construct improve and maintain green spaces and urban waterways For example in Hamburg Germany the estimated costs for the installation of 300 square metres of green roofs is estimated at euro9500 compared to euro3000 for grey roofs68 Green roofs have higher maintenance costs but reduced rainwater fees and a longer roof lifetime led to similar overall costs over 40 years Therefore recognising the multifunctional potential and additional revenue streams for urban green spaces can help mobilise significant funds to the sector With an adequate mix of incentives regulation and information campaigns private developers and property owners can be encouraged to contribute to the greening of cities
Implementation obstacles and solutions
Acquiring resources may be the biggest obstacle to an effective urban green space policy Therefore professional management of green and blue assets is important with visions and skills to mobilise funding and contributions from private sector and voluntary organisations To address this issue a number of local authorities in the UK are considering transferring their management of green spaces from the public sector to private and charitable sectors69 It has been argued here that one single charitable body at armrsquos length from the government can present a more compelling case for support to corporate sponsors private donors and charitable trusts as well as attracting new volunteers In terms of the untapped opportunity to benefit from volunteering a UK survey found that nearly 70 per cent of young people wanted to volunteer to help create better green spaces in their community but only 7 per cent said they currently do70
L4 Promotion of participatory land-use planning
Description
Community-based land planning and participatory design for public urban spaces refer to a collaborative
66 See Bloomberg Citylab (2012a) 67 See Herne Hill (2015)68 See Climate ADAPT (2019)69 See National Lottery Heritage Fund (2014)70 See BBC News (2016)
ldquoBeyond the amount of vegetated land the quality and the value of green infrastructure also matter Green spaces can increase their value through proper landscaping and maintenance Turning green spaces into multifunctional areas is another way of increasing their valuerdquo
Sector-based policy options
46
approach to planning and design between urban planners government authorities businesses and the local community This approach goes beyond traditional stakeholder consultation and instead invites members of the local community to propose solutions and new ideas It may relate to a specific project but can also be used for the development and testing of a wider strategic plan Such approaches are becoming increasingly popular as authorities recognise the diverse natures of the communities they govern and that traditional fixed standards and design criteria do not take into account the varying needs of residents71
The use of participatory land planning and design is expected to ensure the improved liveability of city areas and it is likely to improve the public acceptability of development proposals by demonstrating transparency in the design approach ensuring greater inclusivity and community ownership of the final design72
Resource implications and key requirements
A number of frameworks for public co-design have been developed by academic and research institutions These can be replicated across cities with a variety of contexts and characteristics For example the Adaptive Governance Lab at the School of Architecture at University of Limerick has developed a lsquoDesigning with Communitiesrsquo framework which emerged after five years of practice73
The existence of already well-designed approaches can reduce the administrative burden on cities although participation in design of this nature requires multidisciplinary teams to facilitate the process74 Such teams must be appropriately trained in this type of engagement as the use of appropriate language in a specific context and with specific groups is key to successful communication with stakeholders Therefore local government authorities may require capacity-building or working alongside external experts In Barcelona such a community-based approach to urban planning and design is being pursued to promote ldquoSuperblocksrdquo whose overall
programme has a budget of US$ 124 million from 2014-19 This shows that it is not necessary to invest in large infrastructure solutions to improve the lives of city residents75
Implementation obstacles and solutions
Co-design of urban spaces can be a slower and more time-consuming process than other stakeholder engagement processes but if considered early on in the design approach it can be significantly rewarding
Delivering workshops or interactions with community members that facilitate co-design requires trained professionals who understand the complexities risks and potential conflicts arising through such intense involvement of local groups who may not have an in-depth knowledge of planning approaches Using the co-design of urban spaces as a tool for stakeholder engagement can also build up the expectations of stakeholders as to their influence or impact on the project which can be particularly challenging to manage for groups that have a high level of interest in the project Therefore at the beginning of any session or period of engagement it is important to lay out the expectations and potential outcomes to the groups being engaged This is where a pre-prepared engagement plan can assist in identifying the opportunities outcomes and risks ahead of time
33 Energy and buildingsIn the EBRD regions there is a legacy of buildings with poor energy efficiency and high electricity and heat consumption as well as widespread use of fossil fuels for electricity and heat generation For instance nearly half of the housing stock in central and eastern European countries was constructed between 1960 and 1990 During this time new housing construction was primarily pre-fabricated large-scale multi-family housing blocks built with little or no consideration of energy efficiency76 Furthermore the use of solid fuels
71 See Inclusive Design Research Centre (nd) 72 See David et al (2012) 73 See Webb et al (2018)74 See Aguilar (2015)75 See C40 Cities (2018) 76 See UN-Habitat (2017)
Sector-based policy options
47
for heating remains common in some cities in the EBRD regions and this has also been a major source of local air pollution
These environmental challenges are linked to several structural problems and shortcomings Partly these challenges are linked to the legacy of low electricity and heat prices and the lack of consumption-based billing all of which limit incentives to reduce heat consumption or to invest in energy-efficient buildings They are also partly linked to low administrative and financial capacity in the cities which hampers the ability to invest in regulate and promote energy efficiency measures or renewable energy generation at the city level The financial constraints are often further increased by a lack of creditworthiness and by limited access to financing for local public and private entities in the EBRD regions
There is an increasing awareness of and a growing effort to achieve an energy-efficient building stock and a decarbonised energy sector following both national and local commitments to the Sustainable Development Goals and the Paris Agreement Among the policy efforts to reduce GHGs and pollution from urban electricity and heating consumption are (i) ways to encourage investment in energy-efficient buildings (ii) ways to ensure more energy-conscious consumption patterns and (iii) ways to decarbonise the provision of heat and electricity Key policy options can be presented according to the following list
Policies to encourage energy-efficient buildings
1 Improved energy performance for public buildings
2 Improved energy codes and labelling for buildings
3 Policies and support for energy performance contracts
4 Financial incentives and access to capital for energy-efficient renovation
Policies to ensure more energy-conscious consumption
5 Pricing metering and billing of heat and electricity
Policies to decarbonise heat and electricity provision
6 Decarbonisation of district heating supply
7 Renewable electricity generation
E1 Improved energy performance for public buildings
Description
Increased energy efficiency of municipal buildings can have a direct and significant effect on the energy consumption and the related emissions and expenditures of a city It can also have an indirect impact through the demonstration effect and potential for raising awareness of energy efficiency benefits among the wider public
One way to encourage improved energy performance of municipal buildings is to require higher energy standards for new public buildings For example for countries subject to the EUrsquos Energy Efficiency Directive all new buildings occupied and owned by public authorities must now be ldquonearly zero-energy buildingsrdquo77 This EU Directive also sets mandatory requirements for municipal purchases and new rental agreements Public procurement of low-energy buildings however can only address some of the problems as long as the main energy efficiency challenges derive from the existing building stock In such cases improved energy performance should also be pursued through effective refurbishment of the municipal building stock
Setting up a municipal energy agency has proven to be a cost-effective way to identify and refurbish public buildings For example the Berlin Energy Agency
77 See European Commission (2020)
Sector-based policy options
48
a public-private partnership was founded in 1992 and has since launched energy efficiency retrofits in more than 1300 public buildings and 500 private properties78 The size of a municipal energy agency can be scaled from a one-officer position to a larger unit with extended expertise Similarly the role of an energy agency can be scaled from only assessing and ranking the public buildings with the greatest energy-saving potential to also cover extensive procurement and implementation support together with training and awareness-raising activities among decision-makers and occupants of public buildings
Resource implications and key requirements
Public procurement of low-energy buildings will typically imply higher investment costs and lower operating costs and can be economically justified in the long term For cities with a population larger than 50000 setting up an energy agency has proven to pay for itself through the energy and cost savings the agency helps to achieve However highly subsidised energy prices would not favour energy-efficient constructions or refurbishments and it is important that countries with large energy subsidies seek to reduce them
Implementation obstacles and solutions
Complacency among city officials and limited financial capacity may prevent an effective pursuit of energy-efficient public buildings Increased public disclosure of the energy performance of different city
departments combined with the inclusion of energy consumption in key performance indicators (KPIs) for various city managers may provide good incentives and raise awareness of the benefits of improved energy efficiency Private-sector involvement through PPP-style energy performance contracts (see policy option E3) has also proven to be an effective way to finance and implement energy efficiency measures This approach has for instance been deployed in Berlin under the Energy Saving Partnerships using energy performance contracting
E2 Improved energy building codes and labelling
Description
A building code sets out minimum requirements and standards for buildings and covers various aspects of health safety and welfare ndash including energy performance Relevant building energy codes typically consider lighting walls and roofs glazing heating ventilation and air conditioning Building energy codes can vary in their degree of ambition and for nearly zero-energy buildings one would typically incorporate sensors to automatically control lighting and water use as well as centralised energy control systems to monitor and dynamically minimise energy use79 Effective implementation of building codes requires adequate approval and verification procedures where the construction or major alteration of buildings must
78 See Berliner Energie Agentur (2006)79 See Coins Global (2015)
Sector-based policy options
49
conform to the code to obtain planning permission usually from a local council
Building energy codes are often supplemented with building certification labelling or information disclosure programmes An energy certification and labelling process helps to ensure that the energy performance of a building is above a certain threshold and communicated to customers in an effective way Certifications and labelling can be mandatory or voluntary Mandatory certification can be used to ensure compliance with building codes and enable better enforcement Energy certificates can further inform prospective owners and tenants about the performance of specific buildings and systems and may offer recommendations on how to improve energy performance Certification further raises awareness about energy efficiency and energy expenditures with the potential to gradually ensure that a more efficient building stock is being demanded and subsequently supplied Voluntary certification can be used if sellers or landlords want to distinguish themselves from their competitors This allows them to inform consumers and help prospective purchasers to anticipate energy costs and therefore increase the demand for energy-efficient buildings80
While building energy codes may be driven by national authorities local authorities have significant influence over implementation by means of the planning permission stage Local authorities can also help promote energy efficiency standards through local requirements for information-sharing and through mandatory energy labelling of private and public buildings Furthermore municipal authorities can also facilitate information-sharing platforms and standards for voluntary energy-labelling schemes
Resource implication and key requirements
As building energy codes become more sophisticated they require additional expertise and continued efforts to develop and apply them as part of building permitting Developing or revising a building energy code for local use may not require an excessive amount of resources National templates can also be developed for more easy application at the local level
However effective implementation and enforcement of a building energy code requires city officials or accredited professionals to sign off on plans and the finalisation of building works ndash and this requires significant resources The costs of verification and reporting can be passed on to private building sellers and buyers
Due to the substantial upfront costs it may be a solution to combine tighter building energy codes with financial incentives as well as certification and labelling to improve consumer awareness and support enforcement Tighter building codes may also be combined with expedited review of the permitting process and density or height bonuses if buildings meet particular sustainability criteria For example Mexico Cityrsquos Sustainable Buildings Certification Programme a voluntary programme reflecting various levels of sustainability performance offers a number of incentives including property tax reduction and attractive financial schemes to cover the cost of building upgrades as well as expedited processing of construction permitting81 And lastly in countries or cities with a flawed construction permit system and a large informal construction sector it is important to dedicate resources to effectively manage the construction sector
Potential private-sector participation
Building-code verification tasks can be carried out by accredited private professionals (who should lose their accreditation in cases of misconduct) They do however require careful consideration regarding which bodies can provide accreditation in order to avoid one or more business associations managing this process in a monopolistic and non-transparent manner
Local governments can work with commercial banks to provide financial incentives therefore shifting the financial burden from the public to the private sector One example is Frederikshavn in Denmark which developed specific soft loans for the energy renovation of housing to meet its climate change targets A new product was developed by the municipality in agreement with local banks featuring a longer maturity period and lower interest rates relative to typical market conditions
80 See Broekhoff et al (2018)81 See C40 Cities (2017)
Sector-based policy options
50
Implementation obstacles and solutions
A tightened building energy code represents increased investment costs for owners of existing and new property An extended information disclosure and labelling programme for existing buildings also requires more involvement and buy-in from property owners Under such scenarios it is natural that many stakeholders either oppose compliance or fail to contribute to the necessary arrangements It should also be noted that a large number of stakeholders will need to develop adequate understanding and capacity ndash including stakeholders such as real-estate developers architects engineers interior designers regulators inspectors subcontractors manufacturers of building materials and others
Given these challenges a gradual introduction of tighter building energy codes is recommended along with a gradual rollout of extended labelling and information disclosure programmes These should be combined with effective enforcement A gradual approach can be pursued through a step-by-step increase in the required standards and required activities ndash which should be announced years ahead of implementation A gradual approach can also be pursued by introducing higher energy-performance and reporting standards first as voluntary measures before making them mandatory Successful implementation of building energy efficiency codes can take many years to achieve
Denmark was one of the first countries to introduce nationwide energy efficiency standards for buildings The energy requirements in the Danish Building Regulations for new buildings have been tightened using a step-by-step approach preparing the Danish industry for future requirements almost 10 years in advance Moreover the new requirements are introduced as voluntary energy classes before they become mandatory
E3 Policies and support for energy performance contracting
Description
Energy performance contracting (EPC) is a form of packaged financing and capital works where financial savings from energy conservation measures are used to fund the cost of the measures82 EPC involves an energy service company (ESCO) that provides various services including finances and guaranteed energy savings The ESCO has a stake in energy savings for the client which leads to accountable energy and carbon savings The ESCO may be required to absorb some of the lost savings if savings do not materialise as expected which commercially incentivises ESCOs to complete optimal investments83
The attraction of EPC is that it enables end-users to secure energy-saving investments without drawing on capital or balance sheet payments The private ESCO companies provide the financing and so reduce the debt burden of the municipal authorities Eurostat confirmed that EPC investments are off balance sheet for public clients and provided a related guide for practitioners84 There are some examples of policymakers embracing this opportunity for public-sector energy efficiency investments having obtained Eurostatrsquos clarification for example in the Slovak Republic85 There is also evidence that specific investment costs are lower while energy savings are higher when applying EPC rather than regular public procurement of projects86
82 See World Energy Council and Arup (2016) 83 See Institute for Building Efficiency (2010b) 84 See Eurostat and EIB (2018) 85 See Ministry of Finance of the Slovak Republic (nd) 86 See Staničić (2018)
Sector-based policy options
51
The ESCO is the economic owner of the asset and bears most of the risks and rewards of the investment The ESCO is also responsible for the proper operation of the installed equipment and bears the maintenance and refurbishment risks87 It stays involved in the measurement and verification process for the energy savings during the repayment period ESCOs and energy performance contracting are mostly found in the public sector and to a lesser extent in the industrial and commercial building sectors
EPC policy instruments can include (i) the promotion of energy performance contracting through awareness-raising (ii) the removal of legal barriers to the use of innovative financial instruments (iii) the preparation of sample contracts and procedures (iv) the provision of expert support primarily to the public sector for preparing energy performance and supply projects contracts and evaluating the projects results and (v) the establishment of a qualified energy services provider scheme
Resource implications and key requirements
EPC requires sufficient technical capacity and often necessitates capacity-building due to the extent to which it differs from traditional public procurement processes Additional efforts will be needed in market sounding and preparation of EPC To enable EPC to take place it is important that the municipal budget law allows city authorities to sign medium-term to long-term service contracts Depending on the length of the EPC contract duration a stable reliable economic and political system and rule of law
are prerequisites For instance in Slovenia contract durations of up to 20 years are common
Potential private-sector participation
EPC involves the private sector directly through the creation of a market for ESCOs including a wide range of possible contractors such as engineering companies utility firms and equipment providers Furthermore ESCO structures are alongside PPPs one of the few financial structures that would allow the introduction of more private-sector finance into energy efficiency investments than the mere debt capacity of ESCO clients would allow thereby helping to bridge the existing finance gap88
Implementation obstacles and solutions
A lack of awareness in both the private and public sectors is often the first barrier to EPC This can be tackled through capacity-building A lack of resources to prepare related EPC tenders in the public sector is another barrier This can be improved through information provision and through providing technical support in procuring EPC projects
Prohibitive public budget and procurement regulations are another barrier For example in many European countries budgetary restrictions imposing lending limits on local governments leave capital-strapped administrations little room to pay for the upfront costs of performance contracting89 Regulatory reforms can be used to treat EPC investments as off-balance-sheet (no new public debt) and the aforementioned Eurostat clarification should give EU member states and accession candidates sufficient confidence Furthermore extending the contract duration is required too with deep building-retrofit projects in Slovenia for example having EPC contract durations of 20 years Public procurement regulation may also need to be reformed to include lifecycle cost analysis and functional tenders that use energy efficiency criteria as selection criteria in public procurement contracts and leave the technical solutions up to the contractor
Financing constraints are yet another barrier Credit markets remain constrained and lending institutions
87 See Šerić (2017)88 See European Commission (2018)89 See Institute for Building Efficiency (2010a)
Sector-based policy options
52
may be unwilling to offer energy performance contract financing despite provisions to guarantee ESCO performance Smaller ESCOs that are new on the market lack the creditworthiness required by banks As a response governments can provide guarantee schemes for energy efficiency loans provided to ESCOs An alternative solution is to create a project pipeline which investment banks such as the EBRD can then fund
However it is more than the availability of debt that prevents ESCO market development it is the limited borrowing capacity of ESCOs that limit the capacity to finance many deep-retrofit EPC projects with 20-year contract durations The solution to this is the sale of receivables of ESCOs to financiers that can understand price and accept the 20-year limited-recourse finance risk Supporting the development of such innovative financial (forfeiting) instruments through risk-sharing or other support mechanisms could be part of the policy mix backed by local authorities
The Czech Republic provides a good example of the development of a market for EPCs There facilitating has become an indispensable part of EPC projects in the public sector In addition competitive bidding has been developed into a standardised procedure which increases the quality of EPC projects for clients The European Code of Conduct for Energy Performance Contracting has been widely used and complies with the actual practice in the country
E4 Financial incentives and access to capital for energy-efficient renovation
Description
Central and local governments can provide financial incentives such as green mortgages and tax exemptions to developers or new building owners in order to encourage energy-efficient design and construction This can be used in parallel to certification and labelling
Financial incentives can be provided to encourage lsquoable to payrsquo households to retrofit their homes Some of the measures that governments can deploy include
supplier obligations grants and tax incentives Energy efficiency programmes can also be designed to leverage private capital for example through revolving loan funds or other financing structures in order to enable and incentivise green renovation of residential and commercial buildings
For instance Frederikshavn in Denmark developed specific soft loans for the energy renovation of housing to meet its climate change targets90 A new product was created by the municipality in agreement with local banks featuring a longer maturity period and lower interest rates relative to typical market conditions No funds are assigned to the financing schemes by the municipality Rather soft loans are provided by the partner banks that bear all the risk The partner banks run a creditworthiness check of homeowners decide who gets a loan and under which conditions In other cases public funds can be set up to provide favourable funding for energy renovation of private buildings through direct loans or through risk-sharing facilities for private banks
Resource implications and key requirements
Providing financial incentives will require budgetary commitments and may be administratively demanding for the local government Significant technical capacity will also be required to identify how incentives should be configured and applied Incentives can be targeted at lower income brackets of the population to address social equity concerns associated with energy poverty
Potential private-sector participation
Local governments can work with commercial banks to provide financial incentives thereby shifting the financial burden from the public to the private sector
Implementation challenges and possible solutions
The provision of direct financial support is financially demanding on local governments and can be targeted at fuel-poor homes It is good practice to undertake a comprehensive cost and benefit analysis of retrofitting to zero carbon for all households that are in fuel poverty and to provide targeted funding to
90 See Energy Cities (2016)
Sector-based policy options
53
these homes91 One of the first programmes to tackle energy poverty was the Warm Front programme in the United Kingdom 23 million households received assistance from the scheme Grants were on offer for improvements such as loft insulation cavity wall insulation and heating system improvements92
It is important to address market failures that prevent potentially cost-effective investments in buildings One such problem is the split incentives between owners and tenants where property owners may be reluctant to invest in energy efficiency if the main beneficiary is a non-contributing tenant The EURONET 5050 MAX project is an example of how this challenge can be successfully addressed for public buildings93
The success factors associated with energy efficiency measures include gaining and maintaining consumer trust an effective communication and marketing strategy training and qualification schemes to ensure that worker qualifications keep pace with the technical complexity of buildings and the targeting of trigger points such as household renovations or sales94 The provision of financial incentives and favourable financing should only come after energy efficiency building codes have been enacted and adequate enforcement and compliance mechanisms are in place for building construction and retrofits
E5 Pricing metering and billing of heat and electricity
Description
The EBRD regions have a legacy of subsidised electricity and heat tariffs along with normative billing rather than consumption-based billing Normative billing occurs when for example monthly heating bills are based on the size of an apartment rather than on the actual heating consumed However correct price signals are necessary to promote prudent energy consumption and to incentivise energy efficiency investments Today tariff reforms remain a key challenge in many of the economies where the EBRD invests
Good price signals depend on decent price-setting as well as good metering and billing mechanisms Price-setting should reflect all costs including environmental or climate-related costs In addition to an adequate price level it is also important that tariffs are set and adjusted in a predictable manner so that related investments can be undertaken without unnecessary risks of price volatility To ensure this the heat and electricity tariffs should be devised using a formula-based methodology and approved by an independent and capable regulator To this end the city authorities could help to set up or improve both the relevant methodology and the regulatory authorities While electricity tariffs often fall outside municipal control district heating (DH) and cooling tariffs are normally under the control or influence of local authorities
Effective metering billing and bill collection are also important to ensure correct price signals for electricity and heat consumption Electricity metering and billing can have different degrees of sophistication ndash from plain mechanical readers to digital meters with real-time information on consumption and expenditures combined with differentiated tariffs for day- and night-time consumption More sophisticated metering and tariff structures can help promote a more prudent and cost-efficient consumption pattern for example running washing machines at night when electricity tariffs and grid capacity are more favourable An even higher degree of lsquosmartnessrsquo includes metering and tariff arrangements that record reversed energy flow back to the grid This form of smart metering can help promote the installation of renewable energy solutions ndash such as solar panels on buildings as surplus energy production can then be sold back to the grid and further reduce the energy bill for the relevant buildings
District heating metering generally lags behind electricity metering in accuracy and sophistication and normative billing is widespread The technical challenges associated with DH metering are often largely due to old infrastructure that was not intended for individual metering However as new generations of heat allocators can be used as an alternative to heat meters the opportunity to achieve accurate
91 See National Assembly for Wales (2018)92 See UK Parliament (2013)93 See EURONET 5050 MAX (2020) 94 See Committee on Climate Change (2016)
Sector-based policy options
54
consumption-based billing of DH use is there This will have significant impacts on consumption patterns and incentives to invest in energy-efficient refurbishment of buildings
Utility sector pricing reforms are needed to accompany the installation of apartment-level metering technologies Kazakhstan is currently undergoing a smart heat-meter programme95 while a number of cities in Europe such as Tartu Estonia and Copenhagen Denmark have installed these systems
Resource implications and key requirements
There are significant investment costs linked to the installation and upgrading of meters For example fourth-generation apartment-level heat-cost allocators for metering with remote reading and control needed to introduce consumption-based heat billing cost around euro40 per allocator One allocator is needed for each radiator in an apartment96 The costs of a smart metering roll-out are largely borne by energy suppliers predominantly through funding the installation and purchase cost of meters (about euro110 per household) and through funding the national smart metering communications infrastructure Installation of meters in private properties also requires access to the properties Here cooperation with the property owners may require significant resources for the relevant implementation agencies Introducing smart meters that enable bidirectional energy flows would further require the development of a smart grid and necessary capacity within energy distribution companies that are able to implement such net metering arrangements To encourage the buy-in and cooperation of private companies and property owners some subsidy schemes may be needed which again represents additional resource requirements for the city or the authorities promoting this policy
A cost-benefit analysis by the UK government found that costs related to smart meters are expected to be around pound670 million per year whereas the benefits are calculated at pound19 billion per year on average Overall the UK government estimates that from
2028 the programme will be delivering net benefits of around pound12 billion per year97
Implementation obstacles and solutions
Increased electricity and heat tariffs often imply affordability constraints for low-income households It has been argued that this problem can be addressed most effectively through targeted support for the poor rather than by providing universal energy or heat subsidies to the population Installation of meters in private properties also requires access to the properties and necessary cooperation with the property owners To support this process a combination of information campaigns stakeholder consultation and price incentives to change metering arrangements has proven effective
E6 Decarbonisation of district heating supply
Description
District heating (DH) systems can reduce their carbon emissions through improving efficiency in the system or by switching to new fuel sources or new heat sources Efficiency in the DH system may be achieved by rescaling the size of the DH network as some DH systems are oversized or by upgrading old boilers and leaking heat pipes District heating systems can be further decarbonised by switching away from fossil fuels to renewable sources and by capturing new sources of surplus heat
Whenever DH systems are based on carbon-intensive fuel sources such as coal or heavy fuel oil the potential carbon reduction is significant For example in Bosnia and Herzegovina several district heating operators have replaced heavy fuel oil heat boilers with biomass boilers This has not only reduced carbon emissions it has also reduced fuel expenditure and helped generate local jobs by developing local markets for the supply of sustainably sourced biomass98
95 See EBRD (2017) 96 See EBRD (2018b) 97 See UK Department for Business Energy and Industrial Strategy (2019)98 See UN Environment Programme (2017)
Sector-based policy options
55
Actively capturing the heat surplus from other economic activities is another way to decarbonise the district heating sector Historically heating systems have often been fuelled by surplus heat or heat waste from industrial processes or from electricity generation However as some manufacturing industries close down and new technologies and new industries emerge new opportunities for potential heat sources may appear Some of these heat sources may need a lsquotop-uprsquo to bring the final temperature in line with a commercially required heat supply but such heat sources may include surplus heat from data centres shopping malls or wastewater treatment plants
Resource implications and requirements
All the abovementioned ways to decarbonise the DH supply require significant upfront investment However these measures are expected to considerably reduce operating costs and can therefore be economically justified in the long term For example the city of Banja Luka in Bosnia and Herzegovina has developed a feasibility study to improve its district heating system which has attracted interest from the EBRD in providing an investment package of euro15 million for new biomass boilers network upgrades and other efficiency measures These are expected to reconnect 80 per cent of disconnected users to the district heating network within four years and reduce fuel consumption by 27 per cent thus reducing emissions by 20000 tonnes of CO2 per year and leading to euro45 million in fuel savings99 100
Potential private-sector participation
Many of the proposed investments and solutions can be provided through PPP-style contracts or energy performance contracts Under these contracts private energy servicing companies (ESCOs) make the necessary investments which they also finance while being remunerated based on the energy efficiency achieved during a fixed operating period Energy performance contracts have been demonstrated to be an efficient way of addressing investment needs providing operational efficiency without adding an additional debt burden to municipal accounts (see policy option E3)
Implementation obstacles and possible solutions
High upfront investment costs and a potential reluctance of some decision-makers to change may hamper support for the proposed decarbonisation measures One possible solution is the use of private-sector contracting or energy performance contracting where the debt burden and performance risks are allocated to private contractors
E7 Promotion of renewable electricity generation
Description
Public and private actors can help increase the local production of renewable energy and thus help reduce the carbon footprint of a city The public sector can lead the way by seeking to install and apply renewable energy solutions wherever economically justified This can include (i) the introduction of solarphotovoltaic panels for existing and new public buildings or other built structures (ii) the use of solar panels to fuel public installations such as street lights or ticketing machines and (iii) an active use of biomass or biogas solutions for energy purposes For example this can include gas capture from solid waste or wastewater facilities The benefits of such installations are not only their reduction of energy consumption and the related carbon emissions and energy expenditure but also that they raise awareness and underpin other initiatives aimed at encouraging private actors to install renewable energy solutions
Another possible policy instrument to encourage private actors to install renewable energy solutions is the cityrsquos control over planning permits for new buildings and for large building alterations For example a city can insist on specific renewable energy components being included as a condition of obtaining building works permits Alternatively the city can as a minimum require that renewable energy alternatives are analysed when project proposals are being developed Another measure could be to include solar panel mandates for certain parts of the building stock For example Seoul has introduced solar mandates for
99 See CTCN (2015)100 See EBRD (2018a)
Sector-based policy options
56
new multiple-unit dwellings and commercial buildings to accelerate the deployment of solar panels101
While solar panels can be introduced for self-consumption purposes this can be further incentivised if it is combined with smart meters or net metering mechanisms This approach could include further incentives through favourable feed-in tariffs for the energy sold back to the grid by private households or private companies
Setting up a municipal energy agency has also proven to be a cost-effective way to promote renewable energy in a city For example the city of Barcelona has set up the Barcelona Energy Agency to meet its environmental and energy commitments The agency currently supplies 20000 users in public and private buildings with renewable energy102
Resource implications and key requirements
Even though the costs of solar technology have been falling rapidly financing often remains the biggest challenge to implementing a municipal solar plan Cities have a range of business model options to overcome this barrier distinguished by who owns the asset the city itself or a third-party investor103 Cities must weigh up these financing and ownership options taking into account upfront capital costs and expected payback over the lifetime of the installation National and local regulations including on whether third-party ownership is permissible at all will determine the type of possible financing structures Similarly there are significant investment costs linked to the installation and upgrading of meters (see policy option E5)
Implementation challenges and possible solutions
As outlined above significant investment costs are often the biggest barrier to cities embracing solar solutions To overcome these barriers cities can either pursue a direct or a third-party ownership strategy with regard to the solar assets In the direct ownership model the city purchases the solar system using its own funds grants from national or regional government or by borrowing money using
municipal bonds The benefits of such a model are that direct ownership allows the city to have full control over the benefits of solar However the city is dependent on the upfront capital being available or the financial legal and political ability to issue bonds In most cases the city also shoulders the full risk of constructing and operating the solar system Direct ownership can be a cityrsquos only option if the regulatory framework necessary to enable more elaborate business models is not in place
In the third-party ownership model the city government enters into a contractual agreement with a private developer who provides the upfront investment for the solar system These models can allow the city to install solar power with no upfront capital costs and no impact on their balance sheets Third-party ownership models are better suited to larger scale projects because the legal and due diligence costs for investors can be high The two core models of third-party ownership are power purchase agreements or lease arrangements104
Upgrading electricity meters also requires significant investment costs as well as widespread cooperation from private property owners who may be unwilling to cooperate Therefore these policy measures may be most successful when combined with subsidy schemes and favourable price signals such as subsidised feed-in tariffs for electricity thus channelling electricity back to the grid from private businesses and private property owners Predictability is very important in order to encourage private actors to invest in renewable energy solutions Hence city authorities should consider ways to increase predictability through risk-sharing arrangements or guarantee mechanisms The city should also clearly define its commitment to the renewable energy agenda as part of its stakeholder consultation process and public awareness campaigns
101 See Seoul Metropolitan Government (2017)102 See Barcelona Energia (2019) 103 See C40 Cities (2019) 104 Ibid
Sector-based policy options
57
34 Water and wastewaterFrom an environmental perspective the main objectives of water sector policies are to prevent pollution and to encourage resource efficiency in the sector Furthermore water policies should also enable quality water services to be provided in a sustainable manner Pollution generated in the water sector primarily derives from untreated wastewater and to some extent from emissions related to energy use in the sector Resource efficiency can therefore be related to water efficiency including reuse of wastewater as well as energy efficiency in the sector
Water utilities sit at the centre of this but industries businesses and residents also play important roles as do water users and producers of wastewater Starting with the water utility the relevant policies are to ensure that the utility firm has enough resources and the capacity to make necessary investments as well as to provide good services in a sustainable manner It is also important to ensure a predictable institutional framework with clear rules and incentives for the water utilities to make the right decisions Therefore policy reforms should aim to ensure that the utility firm is well regulated and controlled on the back of robust institutional capacity and adequate information
Regarding water users such as industries businesses and households an effective control of water use and wastewater pollution is critical Policies should also provide price signals incentives and support for water-efficient behaviour and awareness among the different user groups Sustainable supply and use of water and wastewater services must be built on the back of a sector plan that carefully assesses future water sources and water needs as well as investment needs Such a plan should also carefully consider the sequence of reforms and investment programmes In particular tariff reforms should be introduced at an early stage to detect any reduced demand and to better scale the necessary investments in water and wastewater treatment capacity
Potential water policy options relevant for green cities include the following
Policies targeting water and wastewater utilities
1 Regulation and contracting of public and private service providers
2 Reform and strengthening of water utilities
3 Promotion of resource-efficient utilities
Policies targeting water users
4 Effective tariff reforms and price signals
5 Awareness campaigns for households and industry
W1 Regulation and contracting of public and private service providers
Description
While municipal water utilities are subject to national rules and regulation the governance of the water sector also relies on municipal authorities playing an active role On the one hand city authorities are needed to ensure proper supervision and enforcement of national rules ndash for example through local monitoring control and enforcement On the other hand city authorities should also play an important role as the owners of the municipal water utilities This governance function can be supported by a well-defined public service contract (PSC) specifying the rights and obligations of the city and the water utility firm Furthermore in the case of extended private-sector involvement the city should play an important role in procuring and supervising any private-service providers
A well-defined PSC between the city and the water utility can help ensure clear and transparent governance of that utility when it is owned by a municipality ndash the utility should have been converted into a separate legal and commercial entity Such contracts should clearly define the rights and obligations of both the water utility and the respective city authorities It should also specify procedures and methodologies for business planning and approvals for budget- and tariff-setting and for performance assessment and reporting The aim is that
Sector-based policy options
58
a well-defined service contract will provide predictability and clear accountability for both the water utility and for its municipal owner
Resource implications and key requirements
Efforts and additional capacity may be needed to design and supervise a well-defined service contract between city authorities and the water operators Drafting a PSC can sometimes benefit from contract templates or examples from other cities or international institutions With some external support and technical assistance a service contract can in many cases be concluded within six to nine months For example in Bucharest the concession contract between the municipality and Vivendi Universal was signed in March 2000 and became effective in November 2000 But effective application of the service contract requires more time as there may be a need for a change of mindset among the city authorities and the utility management
Potential private-sector participation
Water and wastewater services can be provided through different forms of private-sector participation ndash from the outsourcing of non-core activities to management contracts or full-scale concession contracts
Outsourcing contracts may cover a targeted area of activities such as meter reading and bill collection More comprehensive private-sector involvement can come in the form of a management contract under which a private contractor works alongside or fully replaces the existing utility management The benefit of a management contract is that a private contractor brings in expertise and may also be less subject to politicised pressure once a contract with clearly defined objectives and performance-based remuneration has been signed Even more comprehensive private-sector involvement could come in the form of a concession contract often referred to as a PPP contract which transfers funding construction and operational obligations to the private contractor It can also transfer the full operational and revenue collection risks to the private sector
The preparation and monitoring of a concession contract requires significant resources and administrative capacity within the respective city authorities It also requires a robust legal framework A full-scale concession contract for a water utility should thus only be recommended in cities that benefit from good information about current operations and infrastructure assets and that further benefit from a well-developed legal framework and a strong administrative and procurement capacity
Implementation obstacles and possible solutions
The introduction of a public service contract implies a more formalised relationship between the city authority or administration and the water utility management This requires a change of mindset and more transparent processes which some stakeholders may find unnecessary
The introduction of deeper private-sector participation in the form of comprehensive management contracts or a full-scale concession contract requires significant preparation and institutional capacity within the city administration Therefore for cities with limited experience of private-sector contracting it may be beneficial to pursue a step-by-step approach where smaller and less complex contracts are introduced first followed gradually by deeper private-sector involvement For instance the Armenian water authority has introduced the private sector in a gradual manner over more than 10 years by first introducing management contracts
Sector-based policy options
59
and then transferring revenue risks and later investment obligations to the private sector105
W2 Reform and strengthening of water utilities
Description
Converting a municipal water utility from an administrative unit into a separate legal entity with clearly defined objectives and targets can help make the utility and its management focus on its operational and financial deliverables ndash and thereby help to depoliticise and professionalise the planning and management of the utility Such corporatisation into a joint stock company (JSC) may also enable better and more transparent governance of the water services following the introduction of an arms-length distance between the utility management and its municipal owner
The operational and financial performance of a water utility can be further improved through targeted capacity-building and restructuring of their utility Such efforts typically involve the development and implementation of a corporate development programme (CDP) A CDP would typically start off with a diagnostic followed by clear recommendations and actions aimed at addressing any identified shortcomings linked to capacity systems or processes within the utility and its operations
Resource implications and key requirements
Converting a municipal water utility into a JSC requires a significant legal effort and there is a need for clear political buy-in However it is in principle a one-off event and it does not require significant physical investment
In contrast building necessary capacity within the city administration and their water utility is a process that can take several years It requires the utility to develop capacity to manage and plan its assets and future investment needs This may require the utility to invest in better information management systems and to improve its accounting procedures External technical
assistance may be an effective way to start the process and developing a CDP and a twinning agreement with a more experienced water utility may also be a good starting point
Implementation obstacles and solutions
Converting a water utility into a separate legal and commercial entity may imply a mayorrsquos loss of control over daily operations at the water utility Therefore there may be political resistance to this structure To provide the city administration with sufficient comfort regarding future control and supervision of the water company a well-defined PSC can be developed and signed between the water company and its municipal owner
Building necessary capacity is normally not controversial However any company restructuring aimed at improving efficiency that implies labour reforms may lead to opposition from political authorities and from the utility staff Targeted retraining and relocation of staff combined with natural attrition as a way to increase labour productivity may be needed to avoid overly severe social impact and political opposition For example in Madaba Jordan the first phase of the contract was seen as the basis for re-engineering of the business processes and entailed the implementation of the necessary systems as well as staff training106
W3 Promotion of resource-efficient utilities
Description
There is a range of solutions that utilities can explore in order to improve resource efficiency or capture the value of various by-products As a traditional approach utilities can reduce water losses or energy consumption through targeted investments and the maintenance of distribution networks and related pumping equipment To ensure well-targeted investments and timely maintenance an asset management approach may be recommended A mature asset management approach is based on having a good inventory and on planning procedures
105 See Marin et al (2017)106 See Sustainable Water Integrated Management (SWIM) Support Mechanism (2013)
Sector-based policy options
60
in which investments and maintenance works are planned in a predictable and forward-looking manner This approach requires good data collection and analysis by the utilities and a long-term commitment and budgeting from the city authorities
Water utility companies can also be encouraged to explore more innovative solutions For instance water efficiency can be pursued through better utilisation of waste streams such as treated wastewatergrey water or better harvesting of water through sustainable urban drainage solutions ndash solutions that may have to be restructured to better prepare for future risks of flooding The carbon footprint of water and wastewater services can be further reduced by including forms of energy generation as part of their operation One way to do this is to exploit the hydropower potential and install a turbine inside the water pipes transporting water down from a reservoir through gravitation Energy can also be generated through the capture of biogas at wastewater treatment plants Lastly solar and wind power solutions can be located in wastewater treatment plants in order to cover some of the energy needs of the sector
Another by-product of the wastewater treatment process is sludge Increased wastewater service provision for instance to address a sanitation shortfall or to meet higher regulations will generate more wastewater sludge The capacity of sanitary landfills to receive such sludge may be limited and the impact of the EUrsquos Landfill Directive is likely to drive further reductions in these types of outlet As a consequence alternative solutions for effective management and disposal of wastewater sludge may be increasingly important in a many cities Sludge re-use for landscaping or agriculture is one option Other options include co-composting with green waste or using sludge in combination with other waste or fuel sources for power generation
Resource implications and key requirements
Most of the energy and water efficiency solutions presented here require significant investment Therefore long and predictable contracts with clear revenue streams may be needed For example for renewable energy production to be made sufficiently
attractive any renewable energy subsidies on the energy market should be made available This may require connections to the electricity grid and bilateral power purchasing agreements may need to be negotiated and signed Consequently a water utility firm may need to develop additional capacity and procedures for arrangements in the energy market Commercial sludge management may also require predictable offtake agreements with relevant stakeholders There may also be legal limitations on where the utility firm can dispose of wastewater sludge
The Bangkok Metropolitan Administration has enacted by-laws requiring the installation of a wastewater treatment facility for new housing developments with more than 10 detached houses and for all industries and businesses Septic sludge is treated in order to be used as fertiliser in the cityrsquos public parks surrounding green areas and farmland The administration also aims to produce compost with a mix of natural rice straw and the dewatered sludge from the 12 wastewater treatment plants to be used as manure107
Potential private-sector participation
Many of the necessary investments in resource efficiency can be provided through PPP-style contracts whereby a private energy servicing company finances constructs and operates the relevant installation in return for a performance-related remuneration
In Aqaba Jordan the Aqaba Water Company has made large investments in sewers and wastewater treatment Currently 90 per cent of the cityrsquos wastewater is collected and treated with 69 per cent of wastewater reused and 100 per cent of energy recovered The capital investment is paid off by the sale of reclaimed water under a PPP contract to hotels and other commercial offtakers108
There is also an important role for the private sector as offtakers of grey water and processed wastewater sludge For example selected companies may be interested in reusing treated wastewater for industrial purposes and farmers or forestry companies may also wish to use wastewater sludge
107 See The International Water Association (2018) 108 Ibid
Sector-based policy options
61
Implementation obstacles and possible solutions
Financial risks as well as legal and environmental uncertainties may prevent the pursuit of some of the solutions outlined above To address such obstacles it may be helpful to run comprehensive stakeholder engagement sessions It may also be advisable to run adequate market testing to explore the opportunities for obtaining predictable and long-term offtake agreements with relevant stakeholders
W4 Effective tariff reforms and price signals
Description
There is a legacy of subsidised water and wastewater tariffs in the EBRD regions ndash in particular for households There is also a legacy of fixed monthly billing rather than consumption-based billing Correct price signals are necessary to promote prudent water consumption ndash and tariff reforms remain a key challenge in many of the economies where the EBRD invests
Good price signals require correct price-setting as well as good metering and billing mechanisms Price-setting should reflect all costs of extracting treating transporting and disposing of water and wastewater In water-scarce areas water tariffs should go beyond covering production and distribution costs and also reflect the foregone benefits of farmers for example whose productivity losses may be higher than the regular water tariff
In addition to an adequate price level it is also important that tariffs are set and adjusted in a predictable manner This is to make sure that related investments made by businesses and others can be undertaken without unnecessary risks of price volatility To this end the water tariffs should be developed using a formula-based methodology and approved by an independent and capable regulator In the absence of a national water regulator the city authorities can help set up or improve both the relevant methodology and a local regulatory authority
Effective metering billing and bill collection are also important to ensure true price signals for water use Therefore effective tariff reforms should include
programmes aimed at installing or upgrading individual water meters whenever this is needed
Resource implications and key requirements
Setting up the institutional capacity and operating a well-defined water tariff methodology is not too costly but it may require strong political will to introduce tariff reforms that could be unpopular What is costly however is the installation or upgrading of water meters Installation of meters in private properties may also require access to the properties and significant resources and cooperation with property owners will be needed to roll out new or improved water meters
Implementation obstacles and solutions
Increased water tariffs will generally be unpopular and often difficult for low-income households to afford The affordability problem should however be addressed through targeted support for the poor and not by providing subsidised water to the whole population Installation of meters in private properties also requires access to the properties and cooperation with the property owners To support this process a combination of information campaigns stakeholder consultation and price incentives to change metering arrangements would be recommended A gradual adjustment in tariffs over several years may also be needed to obtain acceptance among the wider population
W5 Awareness campaigns for households and industry
Description
Information campaigns at the household level can trigger behavioural changes in consumption Different types of information can be communicated to promote water-saving initiatives and activities This includes information about
bull devices for household appliances to monitor water use such as for showers or washing machines
bull technical advice that offers water-saving tips for example spending less time in the shower
Sector-based policy options
62
bull norm-based information communicating practical household experiences as before-and-after examples for instance
bull benchmarking data comparing the performance of a household against its neighbours
bull informing residents of the potential impacts of localised drought and flooding
This information can also be conveyed in different ways Whereas providing information through public advertisement campaigns is one option information can also be provided in combination with water-saving competitions or similar interactive ways of raising awareness Attitude campaigns targeting children in schools and pre-schools who then start lsquopolicingrsquo their parents have also proven to be effective
In Spain the Zaragoza Water Saving City programme ran a broad media campaign which was extended to schools Discounts were offered on water-efficient products and this initiated voluntary commitments by residents and businesses109 A ldquo50 Good Practicesrdquo guide was also developed that provided businesses with a reference model for identifying effective methods of improving water efficiency
Resource implications and key requirements
This policy option is a relatively low-cost and proactive approach compared to more reactive network investments However it requires substantial efforts to reach the majority of households in particular if children are to be convinced and there should be an administrative commitment to the policy to generate long-term behavioural changes
Potential private-sector participation
Public or private water utility firms may have an incentive to influence water consumption patterns ndash in particular when infrastructure or water sources are stressed Utility firms often provide awareness campaigns through external non-profit organisations and through school teachers when education campaigns target school children
Implementation obstacles and solutions
A lack of municipal resources or committed city officials may prevent effective attitude campaigns from taking place To overcome this problem one solution may be to team up with local NGOs and schools in order to benefit from their resources and enthusiasm to promote public awareness and attitude campaigns including for school children Another ally could be the local water utility company as it may have an incentive to influence water consumption patterns ndash in particular when infrastructure or water sources are stressed
35 Solid wasteThe environmental objective of the waste management sector is first of all to ensure pollution control preventing the diffusion of waste and pollution into soil and water as well as the emission of GHGs into the atmosphere This in turn protects and improves the environment human health nature and public spaces and further mitigates the risks of climate change Second the waste management sector also seeks to reduce landfilling while promoting value extraction and resource efficiency
Pollution control (stage 1) can be achieved by ensuring proper collection and delivery of waste to be disposed of at sanitary landfills and further by the closure and decontamination of informal and non-compliant dumpsites The reduction of landfilling and the promotion of value capture or resource efficiency can be realised by moving up the so-called waste hierarchy (see Figure 8) either through energy recovery (stage 2) recycling (3) reuse (4) or the reduction (5) of generated waste
While the objectives may be clear the waste sector is complex from a technical perspective with multiple steps and processes required to take place for different waste streams in a carefully integrated manner The sector is also complex from a policy perspective Multiple formal and informal stakeholders and multiple laws seek to regulate influence and operate within the sector Regulations include among
109 See 2030 Water Resources Group (2013)
Sector-based policy options
63
1
2
3
4
5
others the application of land air and water pollution directives as well as the obligations of national regional and municipal authorities Other factors include land planning and the obligations and rights of commercial and residential entities The sector also relies heavily on the behaviour and buy-in of the public
Poor waste management has been a widespread problem in most of the economies where the EBRD invests Substandard planning inadequate funding and limited know-how have led to poor performance and low environmental standards Not only have poor planning and inadequate funding prevented the necessary investments and services from taking place inadequate and unpredictable funding has also weakened accountability among the various operators and authorities in the sector For example an underpaid waste collection company will lsquounderstandablyrsquo cut down on the collection frequency or coverage and thus not provide the agreed service level making plans and targets less meaningful Lastly poor waste management services lead to a poor waste management culture and may hamper buy-in from residents and the relevant public and private institutions
When seeking to improve the waste management sector it is important to keep in mind that effective waste management is expensive often comprising 20-50 per cent of municipal budgets110 Overall it is not a profitable sector even after taking into account revenues from the sale of recyclables refuse-derived fuels or energy Therefore adequate funding for both investments and operations must be in place at all times while improving the performance of the sector In addition due to the complexity of the sector changes should be introduced incrementally without oversized interventions in line with the administrative capacity and with public support and willingness to contribute to an improved waste management system
To help address the pollution challenges and gradually move up the waste hierarchy requires multiple technical and policy-related solutions ndash including policies that target good planning adequate funding effective accountability and effective change in attitudes among residents businesses and public authorities Some of the main policy options or building blocks are presented below covering initiatives (i) to ensure effective governance and buy-in from various stakeholders and (ii) to move up the waste hierarchy
Ensuring effective governance and buy-in
1 Establishment of a waste management strategy action plan and administrative capacity
2 Effective price signals and funding
3 Information strategies for residents and businesses
4 Formalisation of informal services
Moving up the waste hierarchy
5 Improvement of waste collection
6 Waste sorting and treatment to encourage recycling and energy recovery
7 Promotion of sharing and reuse of products
Source EBRD
Figure 8 The waste hierarchy
110 See World Bank (2019)
Waste prevention
Preparation for reuseSt
ages
1-5
Recycling
Other recovery
Disposal
Sector-based policy options
64
SW1 Establishment of a waste management strategy action plan and administrative capacity
Description
In terms of waste management an important first step is to develop a waste strategy and an action plan at the city level If national or international (in other words EU-level) waste strategy or policy and related institutions exist this should be taken into account and strategies should be aligned In the absence of national plans and regulation local solutions can still be planned at the city level Given the complexity of the waste sector it is important that local waste strategies and action plans have holistic views in the pursuit of an integrated waste management structure covering all the technical and practical steps This includes the question of how to provide the infrastructure necessary to manage different waste streams such as mixed municipal waste recyclables hazardous waste construction and demolition waste organic waste and medical waste It further includes how to select collection or delivery solutions in terms of lsquobringrsquo systems or residential waste (kerbside) collection systems bin types volumes collection frequencies and so on If seeking to promote separation and collection of recyclables careful planning is needed to make the process as convenient as possible for residents
While a waste strategy may set up general objectives responsibilities and resource implications an action plan is more detailed and includes practical steps with details targets and timelines for the implementation of different solutions A waste plan should also clarify the capacity needed and responsibilities related to the provision of information awareness campaigns and monitoring systems Both the waste strategy and the action plan should cover all the formal processes of waste collection transportation treatment and final disposal ndash and may also include ways to better internalise the informal operators when relevant An action plan should also articulate the roles of the public sector versus any private sector investments or operations Moreover as the sector seeks to move up its waste hierarchy additional and more sophisticated efforts
need to be planned incentivised coordinated and enforced
At an early stage it is important to build adequate capacity and know-how within the city administration in order to plan operate contract and monitor waste management activities Considerable technical expertise is required to design a strategy or an action plan within the national context and based on local needs and conditions Enforcement and reporting mechanisms are also necessary to ensure continued implementation and compliance While some regulatory capacity and know-how can be provided by central authorities the local administration should be expected to plan secure financing contract supervise monitor and enforce the waste management activities in the city
Resource implications and key requirements
While the planning itself does not require significant financial or human resources it needs sufficient know-how which initially may need to come from the central government or other external knowledge providers As the planning process evolves and the implementation and the related investments and operations start the resources needed for a competent management and governance of the sector grow For example in Ljubljana in Slovenia the public waste management company Snaga Ljubljana has been working on planning and administrating the process for 10 years in order to move the sector towards EU compliance ndash in other words full collection disposal in sanitary landfills and the closure of non-compliant dumpsites111 In September 2014 Ljubljana became the first European capital to commit to becoming a zero-waste city112
Potential private-sector participation
Planning and regulation should be led by public institutions and relevant authorities However where there is a clear lack of know-how private knowledge providers may be helpful when developing strategies and action plans for a cityrsquos waste management sector To this end numerous international consultancy firms offer specialist services related to
111 See Zero Waste Europe (nd)112 See European Commission (2019)
Sector-based policy options
65
the development of waste management strategies that comply with international standards
Implementation obstacles and solutions
The implementation of an ambitious waste management strategy and action plan entails a number of challenges Significant resistance can be expected from existing and well-connected operators providing suboptimal services Informal waste management activities may lose out with political and social implications and adequate buy-in and commitment from the public may be difficult to achieve Implementation therefore requires strong political commitment and support combined with comprehensive awareness campaigns and education In addition as a city seeks to move up the waste hierarchy it requires an ever-wider spectrum of stakeholder engagement For example moving up the waste hierarchy may involve stronger commitment to waste-sorting at source by residents more standardised use of materials by producers or a sector-wide commitment to introducing nationwide deposit schemes for cans and bottles It may also require changing the awareness and behaviour of citizens and the establishment of permanent communication and education about source-separation of recyclables and various forms of waste reduction This work creates an understanding of the entire lifecycle of products as well as the feasibility of recycling and the repair of products While these steps higher up in the waste hierarchy are ambitious measures one may look at the way Tirana introduced compulsory payments for plastic bags provided by local shops Alternatively one can look at cities such as Parma in northern Italy or Ljubljana in Slovenia where significant improvements have taken place on the back of a mix of policy measures113
SW2 Effective price signals and funding
Description
Adequate pricing of waste-related activities can positively influence behaviour (in other words lead to a reduction of waste) and ensure more sustainable funding of the sector Cities have various possible
pricing mechanisms and measures at their disposal that are outlined below
Fist city authorities can introduce pricing (pay-as-you-throw) on the waste delivered by ndash or collected from ndash households businesses and industry Pay-as-you-throw schemes can be set up for businesses and households as a charge for waste bags for different waste streams However with the exception of the most law-abiding and well-monitored societies this solution can easily trigger illegal waste dumping and a fixed cost-reflective fee for municipal waste collection is normally a more feasible funding scheme
Second the city can normally set tipping fees at the landfill To help reduce landfilling and to incentivise waste sorting at source differentiated gate fees for sorted and mixed waste at the landfill can be introduced This requires weight-based tipping fees and increased control
Third cities can introduce pricing requirements and subsidies on certain products such as disposable and reusable grocery shopping bags and they can promote the introduction of deposit return schemes for products such as beverage containers In San Francisco the checkout bag ordinance that was extended to cover all retail stores in 2012 and all food establishments in 2013 has led to a 72 per cent reduction in plastic bag use since 2010114
Lastly another pricing mechanism incentivising recycling is the introduction of deposit return schemes for products such as beverage containers This can be introduced for selected outdoor bars or it can include the setting-up of machine-based schemes where individuals are rewarded for returning beverage containers for example in the case of the Veolia-linked pilot in London115 Moreover while not a direct charging mechanism cities can install and inform their residents about public drinking-water taps as a free alternative to buying new plastic water bottles
Resource implication and requirement
A pay-as-you-throw scheme requires significant administrative and operational resources as well as substantial monitoring and enforcement efforts
113 See Pietzsch et al (2017) 114 See SF Environment (2019)115 See White (2019)
Sector-based policy options
66
66
It also requires a relatively law-abiding culture ndash otherwise this approach may lead to unmanageable levels of illegal dumping
Cost-reflective tipping fees do not require excessive investments or operating costs However differentiated gate fees for different waste streams will require some additional control and penalty procedures
The introduction of payment for disposable products such as grocery plastic bags does not imply large costs for a city administration but substantial efforts linked to public communication are likely
Potential private-sector participation
Introducing payments or deposit return schemes for certain disposable products requires close cooperation with the private sector For instance in Scotland neither the Scottish government nor Zero Waste Scotland will run the scheme That is the job of the scheme administrator(s) which is expected to be an industry-led privately owned and not-for-profit private-sector enterprise Typically the administrator(s) of the scheme will be responsible for its day-to-day management In the case of Scotland the Deposit Return Scheme for bottles and cans creates new obligations for drinks producers and most of them are likely to nominate a scheme administrator to fulfil these on their behalf116 The service will be funded partly by small fees paid by producers with the size of those fees based on the number of drinks containers that producers put on the market For retailers and hospitality firms who will collect returned cans and empty bottles their main contact will be the scheme administrator For deposits that firms (the
`return points) refund the administrator will provide reimbursement and pay the handling fee
Implementation obstacles and solutions
Requesting payment and fees for something that used to be free of charge is never popular However comprehensive awareness-raising campaigns in cooperation with affected business communities and relevant NGOs can ensure acceptance and buy-in from the relevant population and businesses
SW3 Information strategies for residents and businesses
Description
Waste prevention depends on a shift in the attitudes and behaviour of residents and businesses This can be encouraged through various informational measures Drawing public attention to waste prevention is a fundamental step in nudging behavioural change towards more sustainable consumption and waste management practices Such informational strategies aim to change consumer behaviour encouraging informed decisions on reducing waste generation and improved separate collection of different waste streams This can lead to a number of benefits including reductions in GHG emissions environmental pollution and the use of materials Moreover waste prevention leads to cost reduction as collection and transport costs landfill volume and clean-up costs are all lower
In addition it is important to inform the public how the current systems work or how source-separation works and to communicate the cityrsquos plans and achievements For instance a new sanitary landfill will lead to tariff increases but only a few neighbours might see improvements ndash thus the city needs to communicate this too in order to improve acceptance of increased tariffs
A number of information strategies can be used including awareness campaigns information on waste prevention techniques training programmes for local authorities and eco-labelling Effective awareness campaigns often focus on a specific waste stream
116 See Zero Waste Scotland (2020)
Introducing payments or deposit return schemes for certain disposable products requires close cooperation with the private sector
Sector-based policy options
67
and provide easy-to-follow practical advice on waste-prevention actions Campaigns may choose to focus on visible actions such as the use of canvas bags instead of plastic bags the implementation of home composting the use of no-junk-mail stickers and the repair and recycling of clothing117 Specific methods for information dissemination include online information portals geared towards consumers online tools facilitating the calculation and tracking of data on waste and the development of waste prevention plans
Resource implications and key requirements
Education campaigns can be administratively demanding due to the need to provide information on waste prevention techniques for specific users such as households businesses and organisations In addition the campaigns demand substantial budgetary resources with leading waste authorities in Europe having invested significant resources into awareness generation of at least euro5 per resident118 For this reason it is important that the financing of campaigns is stable At the same time waste prevention also saves a city money ndash for instance if food waste is recycled instead of disposed of in a landfill ndash and awareness campaigns could therefore have a positive effect on a cityrsquos budget Campaigns can be tailor-made for specific waste streams and target groups using different media
Potential private-sector participation
Although campaigns are often conducted at the national level several cities have also been proactive in launching their own campaigns While the private sector is rarely involved it is common for awareness campaigns to be provided through external non-profit organisations and through school teachers when education campaigns target school children A specific measure for awareness-raising is the establishment of a network of waste advisers These are volunteers or employees trained in waste prevention and management who support residents in reducing and correctly separating at source the waste generated in households Leading waste organisations in Europe have put in place one waste adviser per 20000 residents
Implementation obstacles and solutions
It is important that messages are tailor-made for well-defined target audiences and delivered consistently through a range of complementary measures Other success factors include cooperation between the local authority and the stakeholders involved in providing the campaign such as waste charities school teachers and waste advisers The quality of preparation and implementation of the campaign is important and can be based on previous studies and recommendations from stakeholders Campaign continuity and well-developed materials are equally important for a successful campaign as well as recognition of the campaign at the national level119 It is also crucial to monitor the impact of particular campaigns on key performance indicators
Successful examples of campaigns in the UK targeted towards consumers include the Love Food Hate Waste campaign the Recycle Now campaign the Love Your Clothes campaign and the Real Nappies campaign Examples in other countries include campaigns for tap water instead of bottled water in Portugal and Italy and the Stop Pub campaign in France Furthermore Vienna is promoting lifestyles geared towards services and culture rather than products Successful examples of informational tools include Eunaofaccedilolixocom in Portugal which suggests waste prevention techniques for different types of household room the WRAP Waste Prevention toolkit and WasteCap a non-profit network in the USA
Comparison with other policy options
Information strategies are a necessary step towards inducing behaviour change and therefore any waste prevention policy will implicitly require information strategies Awareness campaigns must be delivered in conjunction with the right tools to support organisations in managing their waste together with an efficient separate waste-collection system and promotional measures for waste reuse and repair
117 See European Commission Directorate ndash General Environment (2012)118 See Dri et al (2018)119 See Regions4recycling (2014)
Sector-based policy options
68
SW4 Formalisation of informal waste collectors
Description
Many economies in the EBRD regions are affected by a number of financial technical and efficiency-related problems in their waste sector that have caused poor waste management practices and sometimes a lack of any formal practices This situation has led individuals groups and micro-enterprises to perform informal collection and recycling generating income through collection fees and by selling the extracted valuable materials Informal workers perform their activities under inadequate and uncontrolled conditions putting themselves at risk of occupational injury and disease120 Their work is further characterised by low entry barriers low organisation levels and irregular income
The integration of the informal sector into formal solid waste management systems can help reduce overall system costs support the local industry by providing low-cost materials and create new jobs Furthermore it can reduce negative environmental and climate impacts from solid waste management through improved resource recovery and reduced disposal Lastly it can help to generate income and improve working conditions for poor populations who often lack other economic opportunities
Recognising the role of the informal waste sector several governments have implemented various formalisation measures to address the social problems linked to the sector There are three main types of approaches to the formal and legal recognition of informal waste collectors
(i) Formalisation based on organising informal waste workers in associations and cooperatives which establish contracts or cooperation agreements for performing waste collection and recycling services The sustainability of such models can be ensured through waste policy and regulation changes proposing a combination of sources of revenue
(ii) Formalisation based on organising recyclers in community-based organisations or micro and
small enterprises These are mostly covered by waste collection fees paid by users and from selling recycled materials The role of the municipality is minor in such cases mostly supporting through awareness-raising and equipment provision
(iii) Formalisation based on integrating recyclers as workers for the formal waste management sector by recruiting them to perform collection or recycling at facilities
Several factors are critical for the successful integration of the informal sector including deploying a mix of approaches and establishing stable organisational structures Cooperatives small enterprises and networks in numerous countries show that these organisations were the first step to get informal workers out of social marginalisation improving their economic efficiency and thus their position in the economic value chain They also made partnerships with municipalities and other stakeholders possible121
Resource implications and key requirements
The integration of the informal waste sector demands substantial administrative resources to coordinate their formalisation into a formal sector or through associations and community organisations
Potential private-sector participation
Partnerships in the private sector between formal and informal actors become more and more important Many private enterprises perceive the opportunities stemming from the use of waste as a (material or energy) resource and recognise that partnerships with the informal sector can improve the value chains related to sourcing materials from waste The private sector can for instance be responsible for providing training and empowerment of waste workers as well as implementing occupational safety practices Furthermore it can also help assess and document the waste management system and expand the capital base of the sector And lastly the private sector may need to be involved to formally recruit informal waste collectors
120 See Wilson et al (2006)121 See GIZ (2012)
Sector-based policy options
69
Implementation obstacles and solutions
Not all attempts at formalisation have been successful due to the existence of barriers which have prevented the implementation of such attempts as well as a lack of understanding of these barriers and the measures that may enable formalisation122
For instance formalisation reduces waste pickersrsquo ability to enter and exit the waste management economy and research shows that waste pickers value that flexibility Hence formalisation efforts by government have often been unsuccessful exposing the limitations of the governmentrsquos ability to regulate and monitor the actions of those in the sector123 Governments should therefore seek to provide economic support through financial incentives diversification of services and appropriate payment schemes The formation of partnerships and stakeholder involvement are key and can involve the formation of cooperatives and associations Funding should also be provided for waste infrastructure to provide adequate sorting and storage spaces It is also best practice to train and empower informal workers and include them in formalised waste activities
For instance the city of Cairo pursued a policy of the privatisation of municipal solid waste collection as part of various World Bank initiatives to improve the conditions in the city However this has been seen as threatening the sustainability of garbage collectorsrsquo communities as well as new claims on and the commodification of Cairorsquos waste materials to the detriment of effective collection124
Integration of informal workers into the formal sector has been successfully used in Austria and Hungary as the preferred option Recent waste policies and legal frameworks of countries such as Brazil and Peru have included recycling associations and cooperatives in separate collection and recycling programmes Colombia has introduced a 3R (reduce reuse recycle) waste hierarchy and enabled the participation of marginalised groups in a bidding process Countries such as India and the Philippines have also recognised the need to involve informal waste collectors
SW5 Improvement of waste collection services
Description
Three components are needed to rectify a poor waste collection system (i) infrastructure or equipment (ii) good collection services and (iii) adequate contribution by waste generators ndash in other words households institutions and businesses Furthermore in the economies where the EBRD invests there is often no full lsquocollection service coverage ratersquo meaning that not all households have access to frequent waste collection services Hence typically in addition to replacing worn-out collection infrastructure cities also seek to extend collection services to the whole city
Infrastructure investments (in other words bins containers collection points vehicles and perhaps transfer stations) and related maintenance will have to be well planned and financed and cover collection systems for different waste streams For instance container-based lsquobringrsquo systems can be used for construction and demolition waste whereas residential waste (kerbside) collection systems are feasible for municipal waste with clearly defined bin types volumes collection frequencies and so on Adequate maintenance also includes cleaning repair and replacement of broken equipment for which responsibilities must be clearly defined
A good collection service implies adequate coverage of all locations and adequate frequency and capacity as well as the provision of collection services in a predictable and resource-efficient manner
Effective waste collection systems rely on sufficient contributions from households institutions businesses and industry Different waste streams must be delivered as planned placed in the right containers and bins which must be made easily available and looked after In order to ensure that residents and other stakeholders are committed and contribute to the collection process effective information and attitude campaigns may be needed Such campaigns can be pursued through a combination of different forms but one effective way is
122 See Aparcana (2017) 123 See Linder (2019) 124 See Fahmi and Sutton (2010)
Sector-based policy options
70
to educate children through schools and kindergartens who later lsquopolicersquo their parents and carers
Resource implications and key requirements
Waste collection services are costly as they imply capital costs for equipment and vehicles and significant operating costs for fuel and operating staff
The logistics and efforts needed to put in place adequate infrastructure can be substantial depending on how radical the changes to the collection system are Sometimes it can mean bins containers and new or additional collection vehicles only At other times it may also include the acquisition or construction of new collection points and transfer stations to streamline some of the processes For example Ljubljana invested euro421291 in its door-to-door system to be able to provide bins and vehicles servicing an urban population of 400000 in the municipality of Ljubljana and 10 bordering municipalities The annual running costs for the door-to-door system were estimated to be euro984 per tonne125
Potential private-sector participation
Private collection companies contracted through international competitive tenders can provide useful expertise and cost-efficient waste collection solutions Private contracts can also help introduce better contractual arrangements and help depoliticise and professionalise the collection services with clearly defined rights obligations processes performance targets and incentive-based revenues By requiring private collection companies to undertake awareness and attitude campaigns incentives are further aligned given that successful attitude campaigns and increased buy-in from inhabitants will benefit the collection company Some of the financing for vehicles and other equipment can also be provided by private collection companies although this does not bring down the overall costs for the waste collection services There may be benefits to splitting a city into more than one collection area or contract for comparative and competitive reasons Private collection contracts should cover multiple years (five or more) in order for companies to be considered creditworthy and to benefit from their awareness and attitude campaigns
Implementation obstacles and solutions
Significant resistance can be expected from existing and well-connected operators providing suboptimal collection services Informal waste collection activities may also lose out with political and social implications There may also be significant objections from residents and businesses groups that may have to change their efforts and pay a higher waste collection fee in order to make a new collection system work Therefore strong political commitment combined with comprehensive awareness campaigns education and a wide spectrum of stakeholder engagement are necessary By aligning incentives for private collection companies to also undertake awareness-raising campaigns the effort required to improve commitment and buy-in from various stakeholders will be increased
SW6 Waste sorting and treatment to encourage recycling and energy recovery
Description
Important steps to reduce landfilling include sorting and treatment of waste These are also necessary steps to capture economic value from produced waste Waste sorting is a prerequisite for specialised disposal of hazardous waste and for recycling It is also the first step of treatment processes aiming to convert waste into fuel for energy purposes
Waste can be sorted after its arrival at a landfill a transfer station or a waste treatment plant However waste sorting has proven to be most cost efficient when it is combined with pre-sorting at source by households and businesses ndash for example through kerbside collection schemes or recycling yards with multiple bins for recyclables and other waste streams such as paper glass metal garden waste food waste and residual waste However it should be noted that waste sorting aimed at promoting recycling is only economically justified when the general waste stream is sufficiently rich in recyclables As a general rule the share of recyclables in the general waste stream tends to increase in line with GDP per capita
125 See European Commission (2014)
Sector-based policy options
71
Further treatment of non-recycled waste includes the biological treatment of residual waste or anaerobic digestion of food waste Both treatment processes require large investments and aim to convert waste into refuse-derived fuel (RDF) As recyclables and RDFs are sold through pre-agreed contracts or through relevant markets it is important to secure reliable access to such markets and contracts prior to large investments in sorting and treatment solutions
Resource implications and key requirements
Separation of waste is costly Pre-sorting of waste at source implies additional costs for equipment and vehicles able to deal with pre-sorted material It also implies additional capital energy and staff costs linked to the extra mechanical or manual sorting processes As a general rule one can assume that recycling of household segregated waste is almost never a profitable activity despite the revenues from the sale of recyclables However recovering recyclables from industry and institutions is easier to operate and less costly and may generate profit for the operators
Waste treatment facilities are large investments and require predictable waste streams and offtake agreements for many years
Potential private-sector participation
Experienced private collection companies contracted through international competitive tenders can provide
useful expertise and cost-efficient waste sorting and collection solutions Private contracts can also help introduce better contractual arrangements and depoliticise and professionalise collection services with clearly defined rights obligations processes performance targets and incentive-based revenues Requiring private collection companies to undertake awareness and attitude campaigns can be a way to further align the incentives ndash as successful attitude campaigns and increased buy-in from residents and businesses benefit the collection company Some of the financing for vehicles and other equipment can also be provided by private collection firms although this will not bring down the overall costs of waste sorting and collection Private contracts for the promotion and collection of pre-sorted waste should cover multiple years (five or more) in order for companies to be considered creditworthy and to benefit from their information and attitude campaigns
The financing construction and operation of waste treatment plants have proven to be done effectively by private contractors through PPP-style arrangements However risk mitigation through long-term agreements covering waste delivery and offtake of refuse-derived fuel plays an important role
Implementation obstacles and solutions
Formalised waste separation at source may come into conflict with informal waste collection activities and may have political and social implications Waste sorting may also be met with objections from
Sector-based policy options
72
residents and businesses who may have to change their behaviour and potentially encounter higher collection fees To address this targeted awareness campaigns comprehensive stakeholder engagement and strong political commitment are necessary By incentivising private collection companies to also undertake awareness-raising campaigns one may accelerate the effort needed to improve sorting and the overall buy-in from various stakeholders
Unintended effects
Waste-to-energy solutions can come into conflict with efforts aimed at recycling or waste minimisation as large investment in waste treatment facilities requires large volumes of waste preferably with a high calorific value sometimes found in recyclables EU directives are increasingly ambitious in terms of recycling and waste minimisation and it is important that waste-to-energy solutions are aligned with these targets for all EU and EU candidate countries
SW7 Promotion of sharing and reuse of products
Description
The sharing and reuse of products can also cut down the overall use of resources as these are cost-effective ways to reduce waste generation and landfilling This approach can provide a number of benefits including reductions in environmental pollution material consumption and the need for additional landfills It can also provide employment opportunities in secondary markets and increase societal cohesion through the promotion of a sharing culture In addition to environmental benefits sharing can create a sense of community among strangers thus facilitating trust and social inclusion It can also supplement supply in periods of peak demand for instance a tourist location can benefit from a sharing platform through which multiple owners make accommodation available during peak season rather than turning to additional construction126
These approaches include both sharing among individuals and communities as well as among city
governments In the former category the sharing economy has entered nearly all urban spheres and includes solutions related to mobility and transport (for example Uber and Zipcar) spaces (for example Airbnb and WeWork) skills and talent (for example Upwork and Fiverr) financing (for example Zopa and Kickstarter) health (for example CrowdMed) utilities (for example Gridmates and Vandebron) food (for example VizEat) and learning (for example Coursera) With regard to the latter category cities can also leverage the potential of the sharing economy in municipal goods municipal spaces civic assets municipal services and the skills and talent of city residents An example related to municipal services is the Intermunicipal Collaboration Framework in Alberta Canada127
126 See World Economic Forum (2017) 127 See Government of Alberta (2020)
Sector-based policy options
73
73
Policies supporting these sharing approaches both among individuals and among city administrations include the provision of physical and IT-based infrastructure that is necessary for product sharing and for second-hand markets to take place Policies also include initiatives aimed at raising awareness and changing peoplersquos mindsets Today various city governments have institutionalised sharing practices through innovation offices (Seoul and Amsterdam) working groups (Vienna) a task force (Denver) or similar institutions dedicated to advocacy awareness and furthering the agenda of sharing in cities
Resource implications and key requirements
Reuse and sharing of products are primarily a result of market-based solutions which may need only modest provision of interventions or resources by the city authorities For example a sharing-based economy is increasingly being promoted in some areas such as through car and bike-sharing schemes on the back of increased digitalisation and the development of user-friendly apps where the private sector plays a key role Moreover it is possible to further increase the awareness and popularity of second-hand products through the involvement of NGOs community-based initiatives and the availability of infrastructure-facilitating second-hand markets
This is also a field of resource efficiency and waste minimisation and promotional measures can place a substantial administrative burden on the local administration which would need to engage with various stakeholders to coordinate promotional action Depending on the nature of the promotional strategies the measures may also necessitate significant financial and technical resources
Potential private-sector participation
As outlined above solutions related to the reuse of products are primarily driven by the private sector or charities City governments can also take on a combination of roles depending on the socioeconomic environment in the city An example is the Sharing City Seoul project which is being implemented based on cooperation between the private and public sectors steered by the Sharing Promotion Committee The initiative has certified
50 sharing projects that provide people with an alternative to owning things they rarely use and has given grants to a number of these projects
Implementation obstacles and solutions
Peoplersquos mindset may be the biggest obstacle to the development of an economy based on more sharing and reuse of products Identity is often linked to the products (for example cars) a person owns and second-hand products may be viewed as something for the poor A gradual process supported by community-based and city-supported awareness campaigns may be the most effective way forward
In Belgium Ghentrsquos Foodsavers platform operated by the city brings together food leftovers from the wholesale market and local retailers and redistributes them to food banks social restaurants and social supermarkets Another successful initiative is the Restorestje a local version of a leftover container It is distributed to restaurants for free in order to encourage them to use it Campaigns have managed to change peoplersquos behaviour and encouraged them to take their leftovers home128
In general not all aspects of sharing-economy models are positive Cities have faced challenges in creating policy and regulatory frameworks protecting consumers avoiding unfair competition modernising outdated taxation laws and assuring social equality For instance while sharing can bring social and environmental benefits sharing models can also result in excess supply One example of this is in China where companies like MoBike (bike-sharing) have created a surplus of bikes at rental stations rather than improving the use of existing assets in the belief that a large inventory will help them to dominate an extremely competitive market
It is therefore crucial for cities to establish trust and reputation in sharing platforms ensure the safety and security of data and people and be cautious about social inequalities that can potentially be caused by the sharing economy
128 See RUAF Foundation (nd)
74
75
Cross-cuttingpolicy options
41 Governance
42 Finance
04
76
Local governments often struggle to undertake environmental action due to several constraints including limited political power low levels of institutional capacity low levels of stakeholder integration low levels of multi-level government cooperation limited fiscal power poor financial management and lack of access to finance129 Cities need strong institutional environments that allow their local governments to function more efficiently flexibly and competitively to achieve an ambitious green city agenda
Local governments around the world are also increasingly responsible for providing and coordinating services across the sectors of transport energy buildings waste water and land use These require heavy infrastructure investment and may have substantial administrative and budgetary implications Local governments are also responsible for managing social sectors such as health education and public safety which have significant operating costs130 It is therefore important for local governments to explore the ways in which they can improve their governance and financial responsibility
While the policy options presented in this chapter may not target green objectives directly they are critical for enabling cities to pursue their green agendas in a sustainable and efficient manner The continuous improvement of the institutional environment of cities can make policy implementation more effective enabling the transition to prosperous cities in which sustainability is integrated into the different facets of
public- and private-sector decision-making A strong institutional environment comprises aspects such as (i) the devolution of powers to local governments (ii) sufficient multi-level government coordination (iii) capacity and expertise of all actors so they can play their roles effectively (iv) participation of relevant stakeholders including residents and representatives from various groups (women young people the elderly migrants people with disabilities and so on) (v) financial transfers from central government and (vi) accountable management and transparent use of public resources The enabling environment may be divided into two cross-cutting policy areas namely governance and finance
41 GovernanceEconomies and cities in the EBRD regions have a legacy of poor governance which was further exacerbated after the poorly planned decentralisation that followed the collapse of centrally planned regimes City governments in these regions tend to lack strong administrative authority political autonomy skills resources technologies and capacity to play an active role in city planning management and development This has led to a limited ability to coordinate public infrastructure and service provision at the local level as well as to weak procedures
Cross-cutting policy options
Strong institutional structures and reliable financial mechanisms are required for cities to pursue their green agendas effectively
129 See Sustainable Development Solutions Network (2016)130 See UN-Habitat (2009)
Cross-cutting policy options
77
a culture of insufficient observation and the criticism of city governments by the public
Local governments may explore the following selection of policy options perhaps in combination with each other as a policy mix
1 Political and fiscal decentralisation
2 Improved transparency and accountability
3 Enhanced integration across government bodies
4 Effective stakeholder participation
5 Capacity-building
These can bring a number of benefits beyond environmental improvements including better social cohesion and inclusion improved political involvement and a stronger ability to successfully change behaviours with a long-term view to generating sustainable development
G1 Political and fiscal decentralisation
Description
Empowered local governments have been shown to have a positive impact on the provision of public services and quality of life131 The major benefits of decentralised decisions include (i) a more targeted or tailored supply of public services and infrastructure in response to local demand which should lead to (ii) a more cost-efficient use of public expenditure and may (iii) increase cost-recovery funding from residents who are more willing to pay for adequate services Decentralisation can also (iv) promote accountability and reduce corruption due to proximity to the population which may be more aware of local governmentsrsquo actions than those of the central government
However if poorly implemented decentralisation may result in inefficiencies and corruption and further disillusionment with the government Therefore for the abovementioned benefits to materialise it is important that (a) decisions (and not only operational obligations) are transferred to local authorities (b) local authorities have sufficient financial and institutional capacity and procedures in place and (c) the decentralisation promotes engagement and enables people to hold institutions to account for delivering policies in a transparent way
The transfer of political or decision-making powers (point (a) above) would primarily be a central government choice The same is true for the decision to transfer parts of the central budget or collected taxes to local authorities in order to improve their fiscal capacity (point b) However ensuring adequate funding is also a task for the local authorities and so is the building of institutional capacity and procedures These enable good governance to promote the populationrsquos ability to engage with and hold institutions to account for delivering policies in a transparent way (point c) For example in terms of fundraising decentralised governments may be responsible for raising their own revenue and setting their own taxes That should further improve accountability and responsibility at a local level There is also evidence that taxes are easier to collect when people can see that they are being used for local purposes132 Beyond setting local business personal or property taxes local revenues can also come from increased fees for licences or permits or from higher tariffs for utility services These options are discussed further under the policy area for local financing (see Section F1)
Resource implications and key requirements
Key requirements for effective decentralisation include central government support and a meaningful local democracy that can inform the local decision-makers and hold them accountable for delivering policies It is also instrumental to have adequate capacity and procedures in place before any transfer of political and fiscal powers in order to minimise uncertainties and confusion during the decentralisation process Significant resources are needed to ensure adequate institutional capacity and
131 See Bilbao (2015)132 McKinsey amp Company (2013)
Cross-cutting policy options
78
procedures ndash and further resources will be needed to ensure peoplersquos engagement to further deliver results For instance in Poland the reform of public administration demanded effective legislative and operational work monitoring of the implementation evaluation of the effects of the reforms and engagement with civil society and local residents about the reform133
Implementation obstacles and solutions
A decentralisation process may meet opposition at central and local levels Central authorities may be reluctant to give away powers and may be concerned about the ability of local authorities to assume new responsibilities and powers Local authorities also may be reluctant to take on responsibilities and powers that they are not familiar with In both cases it may be argued that uncertainty and limited capacity are the key sources of the problem While limited capacity can be addressed through capacity-building programmes uncertainties for both central and local stakeholders can be mitigated by a gradual transfer of powers for example first transferring a prescribed service delivery before greater powers to define and organise service obligations and later giving extended local powers to plan invest and finance local infrastructure and related services Uncertainties can also be mitigated through a careful sequencing of capacity-building and the promotion of local stakeholdersrsquo understanding of tasks and processes before powers are decentralised Close cooperation and the transfer of skills between central and local authorities are also important to mitigate uncertainties and risks during the transfer process
Lastly while decentralisation can help strengthen accountability and improve performance and decisions by bringing government closer to people it can also present risks of corruption and poor performance Local officials may have greater vested interests based on family friendship and business ties that can influence decision-making and local institutions designed to hold local public officials to account are not always adequate
G2 Improved transparency and accountability
Description
When transparency and accountability are put at the heart of local governance systems the risk of corruption is reduced and incentives to perform well can be strengthened Central authorities can promote accountability incentives through a top-down approach However transparency and accountability should also be promoted through a bottom-up approach where residents can participate in and influence city policy design and implementation as well as hold local officials to account for their decisions and the performance of local institutions
Transparency can be promoted through mutually reinforcing strategies that include (i) ensuring access to information (ii) enhancing ethics professionalism and integrity and (iii) conducting regular assessment and monitoring
A well-organised record management system that contains accurate and easily accessible information about municipal rules decisions plans public spending and financial management can be developed and it is advisable to disclose documents of general interest through user-friendly reports and online presentations Information should cover rules and procedures related to the hiring and administration of staff calls for tenders procurement and monitoring of contract execution Further information relates to how the law requires that local governments be subject to regular and independent financial and organisational audits within a specific timeframe E-government is a commonly used tool for local governments to disseminate information and interact with their citizens
Moreover the transparency of a local government is contingent on the strength of its legal infrastructure which regulates the behaviour of city officials and promotes ethics and integrity Such legal infrastructure may include laws on conflict of interest on disclosure of income and assets and on whistleblower protection and transparent procurement In addition to legal measures a municipal code of ethics could be established thoroughly communicated with city
133 See Kulesza (nd)
Cross-cutting policy options
79
officials and effectively implemented Municipalities should also consider designating an independent agency that has the authority to interpret and enforce the code
As for assessment and monitoring the key objective is to inform the public about the activities and performance of the local government and its departments In order to incentivise good performance the government should conduct annual public reporting about municipal services These services should be measured against agreed targets and against the performance levels of previous years Other useful tools for assessment and monitoring include the Municipal Checklist the Urban Corruption Survey and Report Cards developed jointly by Transparency International and UN-Habitat134
In order to further bolster accountability well-resourced institutions designed to ensure adequate structures for checks and balances should be promoted and civic oversight and control should be encouraged One way to promote better accountability within municipal operations is to transform municipal services such as water supply district heating or public transport into separate legal and commercial companies Such public companies can then be further governed by a well-defined public service contract to be signed between the municipality and the municipal company A public service contract refers here to a contract that sets out rights and obligations for both parties including performance targets planning processes and procedures for approval of revenues and tariff adjustments It also sets out the role of the municipality and limits on its ability to interfere in operational decisions The objective of such contracts is to ensure transparency predictability and accountability for both sides
Another institutional innovation to improve accountability is the complaints and ombudsmanrsquos office which allows people to address their grievances and complaints about government bureaucracies This option is additional to existing channels such as the judiciary or internal complaints procedures The ombudsman is an independent organisation that receives and investigates allegations of maladministration The office of the Northern Ireland
Ombudsman for example deals with complaints from people who claim injustice due to maladministration The Ombudsman is entirely independent of the Northern Ireland Assembly and the Northern Ireland Executive All complaints are treated in confidence and the services are provided to citizens free of charge
Resource implications and key requirements
The improvement of transparency and accountability requires substantial administrative capacity as well as some financial and technical resources However it also enables cities to make efficiency gains once processes are in place For example Vienna introduced an information management system as part of the initiative Smart City Wien that was also used for effective public disclosure of performance monitoring The success of the programme was facilitated by its integration within the cityrsquos overall planning framework and by giving the entire municipal authority access to the system135 For tools like e-Government to have a meaningful impact computer literacy should be reasonably widespread and access to the internet for local residents must be ensured
Implementation obstacles and solutions
People and institutions may oppose significant transparency as it is more comfortable to not be held to account The publicised data may also be perceived as unreliable which again may hamper the benefits of a transparency initiative Part of the problem is
134 See Transparency International and UN-Habitat (2004)135 See Department MA 18 ndash Urban Development and Planning (2018)
Cross-cutting policy options
80
connected to trust This relates both to trust among the data providers that accurate reporting will not lead to harsh penalties or public outcry and no reward and trust among the data consumers that the reported information is correct or intended to be correct
In such cases it may be necessary to introduce transparent reporting gradually One example of this is the water sector in a country in south-eastern Europe Here the central government initiated compulsory performance reporting and benchmarking for the water utilities This initiative failed as the water utilities misreported performance levels in fear of being penalised for any reported underperformance Following this failure a voluntary performance benchmarking initiative was initiated among the leading water utility firms Performance data was collected and shared during workshops but the identity of the utilities reporting their performance levels was hidden behind a number (for example utility number 1 number 2 number 3) Following some successful workshops the firms no longer saw the need to hide their identities and were happy to replace the numbers with the real utility names Later fear of the central government and the sector regulator also vanished and these institutions were invited to participate in performance benchmarking workshops and to see the accurately reported data that the central government had not been able to obtain in the first attempt
G3 Enhanced integration across government bodies
Description
The enabling environment for city governments is influenced by multiple levels of governance Integration in government refers to the coordination between multiple departments or public-sector organisations in providing a public service or programme Such integration is essential to develop a shared long-term vision for economic development across government bodies and sectors and to ensure effective delivery of public services Collaboration has a number of benefits including the provision of more comprehensive services at the local level promotion
of joint cultural and economic development strengthened relationships between local and national governments improved local governance through modelling and information exchange opportunities for integrated planning increased access to a skills knowledge and services better use of available technology and better use of capital and other assets136
An integrated approach to urban planning emphasises the social economic and environmental dimensions of sustainable development by
(i) aligning vertical development priorities across different levels of government
(ii) encouraging horizontal coordination between departments and public-sector institutions
(iii) promoting intermunicipal or territorial coordination
Working in partnership with higher levels of government is required to improve the governance of local governments Vertical coordination across different levels of government may be achieved through representative institutions at the central government level working with local governments to offer capacity development and cooperation Special purpose vehicles ndash partnerships formed for joint project planning and implementation ndash can also be used In addition central governments may provide vertical funds which are funds earmarked for programmatic planning For example in France the Agence de lrsquoEnvironnement et de la Maicirctrise de lrsquoEnergie an inter-ministerial agency focused on environmental and energy research and policy has developed a funding programme to assist municipal areas with the development of a Bilan Carbone emissions inventory137
Horizontal and cross-sectoral coordination between departments and public-sector institutions is a necessary approach to dealing with public problems effectively138 This may be achieved through informal cooperation or local government directives Cross-sectoral departments such as planning and statistics departments can be allocated the responsibility of facilitating multi-sectoral cooperation Lastly shared
136 See Institute of Public Administration (2012) 137 See Corfee-Morlot et al (2009)138 See Howell (2012)
Cross-cutting policy options
81
digital platforms such as GIS-based platforms should be made accessible to all departments to foster a culture of open data and information sharing
Intermunicipal or territorial coordination can be facilitated through intermunicipal agencies that provide coordination among municipal organisations often called strategic alliances Sectoral governance boards support service delivery across municipal borders to ensure fair cost distribution and service efficiencies The benefit of this approach is that it achieves the advantages of amalgamation such as economies of scale streamlined business processes and improved service delivery while preserving local democracy An example of such coordinating bodies can be found in the Romanian water sector where regional water utilities servicing several municipalities are governed by inter-community development associations representing all the relevant municipalities
Resource implications and key requirements
Integration among government bodies demands a certain level of administrative human and IT-related resources Technical resources may be necessary when a government body needs to integrate functions or processes that they did not previously use Integration necessitates limited financial resources although this depends on the specific integration package It also provides opportunities for cost-sharing among administrations For example Alba Iulia a city of 74000 people in Romania introduced a pilot smart city project in 2018 developed jointly with the national government and more than 20 private companies The open data platform under construction will provide useful data to aid decision-making and foster evidence-based analysis139
Implementation obstacles and solutions
A major barrier to government integration is the tendency to think in a lsquosilorsquo approach which is difficult to break out of140 There are several other barriers to cooperation such as an emphasis on the status quo processes that bring everyone together
but reinforce silos processes that set similar goals and use the same data and decision-making driven by quests for funding141
The success of integration depends on high levels of commitment and resource-sharing Successful cooperation strategies need to be based on an understanding of the collaboration cycle strong leadership capacities an understanding of the balances between risks and rewards a culture of innovation and an emphasis on the desired outcomes and impacts142 Collaborating parties should take a design approach to cross-sector collaboration and should adopt flexible structures143
It is important to start change management efforts early in the process of planning and implementation To this end during the planning stage it is advisable to develop a thorough plan for change management Lastly a phased approach to government integration can be more manageable than a direct cutover approach
A practical form of integrated governance framework is illustrated by the Urban Nexus a concept developed by ICLEI - Local Governments for Sustainability (ICLEI) in cooperation with Deutsche Gesellschaft fuumlr Internationale Zusammenarbeit (GIZ) At a variety of scales this framework integrates services across systems sectors social relations and behaviours For example the city of Hanover in Germany used the framework to guide the integrated planning and construction process of the environmentally friendly district Kronsberg improving the provision of affordable housing and social cohesion in the metropolitan area144
G4 Effective stakeholder participation
Description
Effective stakeholder participation should be an underlying principle for most municipal activities It can enable different forms of collaborative governance and help improve decision-making implementation
139 See Sustainable Cities (2018) 140 See OECD (nda) 141 See Norris-Tirrell and Clay (2010) 142 See Institute of Public Administration (2012) 143 See Bryson et al (2015)144 See ICLEI and GIZ (2014)
Cross-cutting policy options
82
and monitoring at the local level It can cover a wide range of activities and may involve governmental bodies the private sector residents interest groups NGOs and more
For instance at an early phase of a potential investment project residents and other interested groups can help inform the city about their needs and concerns even before concrete proposals have been developed Stakeholders can at a later stage respond to ideas or discuss solutions proposed by the municipality by developers or by other organisations such as industries or NGOs A city administration can also invite its population to provide their own suggestions in response to certain challenges or development goals for example through the co-design of public spaces (see policy option L4) Effective monitoring of municipal services and assets can be undertaken by city residents or NGOs for example by online reporting on the quality of their local road network Residents and NGOs can also play an important role as volunteers or implementing agencies for attitude campaigns for example by informing school children about the benefits of recycling and waste separation
A transparent integrated and inclusive process to engage a wide range of stakeholders helps align different perspectives altering traditional political dynamics145 It helps strengthen relationships and
increases the sense of ownership of city strategies and plans among residents It can also improve the quality acceptance and effectiveness of project implementation and produce better social cohesion and urban planning outcomes146 It is thus important to engage a wide range of stakeholders and particularly groups that are less likely to be able to participate in standard engagement activities such as women young people the elderly ethnic minorities migrants disabled people LGBTQ+ people and so on Cities should ensure the participation of these groups in discussions
Resource implications and key requirements
Improving the participation and inclusion of stakeholders demands substantial administrative capacities and may necessitate technical capacity-building in public stakeholder engagement Success factors related to stakeholder participation include a stakeholder engagement strategy for policymaking which understands the needs priorities and interests and seeks participation from key stakeholders Cities also need to develop effective communication keeping stakeholders informed and motivated to participate
Monitoring of the number of stakeholders involved in decision-making activities and the presence of mechanisms that encourage community engagement also support effective stakeholder participation processes Collaborative governance is therefore closely linked to the development of open governance systems open platform databases and shared information systems government resource-sharing research and development activities and innovation and technology transfer
As part of a national road connectivity initiative the city of Tirana in Albania introduced an online app for reporting sections of road that need repair and also offered public information on the time it takes to address the reported need for repair147 The setting-up and operation of this system had cost implications but in return the city achieved road surveillance for lsquofreersquo
145 See UCLG and World Bank (2009) 146 See Global Platform for Sustainable Cities and World Bank (2018) 147 See World Bank (2018)
Cross-cutting policy options
83
Cluj-Napoca in Romania initiated the Innovation and Civic Imagination Centre to support the co-design and co-creation of urban solutions within the local community In 2019 two major debates were held one in support of a master plan for a large-scale development area while the other focused on EU cohesion policy The organisation of meetings and workshops that take place at the centre costs the municipal budget euro10000-euro15000 per month148
Implementation obstacles and solutions
Active public participation may require a certain culture and an active civil society that may not be present in many cities in the EBRD regions This form of democratic development can be fostered however through the education system and also by introducing feedback loops that do not require the capacity of effective civil society units Tiranarsquos online app for reporting road defects is an example of a user-friendly feedback system
Several cities have incorporated civil society into their urban planning and implementation process Cities including Surabaya (Indonesia) and Ghent (Belgium) have seen improved outcomes Ouagadougou (Burkina Faso) and Douala (Cameroon) also represent impressive examples of cities that have improved development initiatives through an inclusive and participatory approach Ongoing advocacy and open dialogues were key to encouraging citizens to engage in a city strategy Consensus and cooperation in establishing and acting on the strategy contributed to institutional confidence and unlocked financial opportunities149
Satildeo Paulo (Brazil) has made a considerable effort to include residents in the development of the municipalityrsquos Open Government Partnership local action plan Satildeo Paulo has also made efforts to encourage large-scale public participation in the development of a new master plan for the city with more than 25000 people attending 114 public hearings Between these hearings and the cityrsquos online crowdsourcing platform Satildeo Paulorsquos inhabitants have contributed over 10000 ideas
to improve the city and therefore the environment around them150
G5 Capacity-building
Description
Capacity-building is the process through which individuals and organisations can obtain strengthen and maintain the capabilities to set and achieve their goals151 Capacity-building is important for local governments as they adopt increasingly sophisticated policies management practices and an integrated planning culture
There are three broad types of capability that should be recognised (i) institutional or organisational capacity refers to the policies structures process rules and procedures that allow local governments to operate and provide leadership in their jurisdiction (ii) human capacity refers to the experience tools and knowledge mastered by the employees of local governments which enable them to identify analyse and respond to peoplersquos needs ensure their implementation and assess their impact and (iii) societal capacity refers to the empowerment of the community NGOs and city residents including those that face disproportionate barriers to economic opportunities to inform and hold local governments and administrations accountable for the services they offer and the good management of the community
Human capacity-building focuses on strengthening different types of abilities and skills within local governance Organisational skills are associated with efficiency in programme and project management tax collection and procurement processes and municipal finance management Technical skills target particular areas of expertise in specific sectors such as urban planning water and sanitation engineering waste management and transport engineering Behavioural skills have to do with cultural shifts and changes in attitude among all stakeholders including residents such as for encouraging multi-level cooperation or waste prevention152 Incorporating digital technologies
148 See Euro Cities (2019) 149 See UN-Habitat (2009)150 See WRI (2016)151 See UNDP (2009) 152 See Sustainable Development Solutions Network (2016)
Cross-cutting policy options
84
can further ease administrative burdens promote greater cooperation between stakeholders and allow for more oversight and transparency in operations
A number of potential activities are aimed at promoting well-targeted capacity-building within a public administration Initial diagnostics should help identify relevant shortcomings in capacity Legal stipulations can require capacity-development plans andor budget allocations for all implementation programmes Regular staff-training programmes or requirements for continued learning can be put in place among public-sector employees Project partnerships with higher levels of government public or private organisations academic institutions and civil society groups can also involve capacity-building Moreover external expert consultants from private organisations or academic institutions with sectoral or technical expertise can provide skills that are required for a specified period of time as opposed to training internal staff
Resource implications and key requirements
Capacity-building demands substantial administrative budgetary and technical resources It is a long-term process and should be represented in annual budgets and administrative commitments
Implementation obstacles and solutions
Budget constraints may be a key implementation obstacle but clearly defined needs and plans with well-defined objectives and performance indicators may help mobilise funding and support from central governments international networks or organisations or NGOs
Learning from the experiences and outcomes of initiatives by other cities or local governments for example by joining coalitions of cities is another way to build capacity A successful example of cooperation among municipalities and regions is the Network of Towns and Cities towards Sustainability created in 1997 by the Barcelona Provincial Council It allows municipalities to exchange knowledge and pool resources A particular success has been the working group on the Covenant of Mayors which along with other support from the Barcelona Provincial Council
has meant that most municipalities have now drawn up local-level sustainable energy action plans153
42 FinanceCity governments must harness their financial reserves effectively to deliver the necessary services and infrastructure that meet the needs of their residents The ability to collect manage and invest these resources through appropriate financial mechanisms determines a cityrsquos fiscal sustainability Examples of unsustainable approaches include high levels of debt or other liabilities which can divert funds from policy investments or corruption and mismanagement of funds The following policy options or policy objectives are discussed below
1 Improved revenue and financial autonomy
2 Improved accountability and transparency
3 Improved creditworthiness
4 Financial incentives or financial support schemes for green investments
This section explores the policies or approaches that city governments can take to address these points and strengthen their financial credentials so that they can finance the necessary projects to become a green and sustainable city
F1 Improved revenue and financial autonomy
Description
It is generally desirable for local governments to have the opportunity to raise their own revenue and set their own taxes This is also a good way of achieving accountability and responsibility at a local level
153 See European Union (2017)
Cross-cutting policy options
85
In addition there is evidence suggesting that taxes are easier to collect when people can see that they are being used for local purposes To ensure a degree of political and financial autonomy it is important that local revenues go beyond the bare minimum needed to cover the municipalityrsquos allocated service obligations so that surplus funds can be used to finance investments or services at the discretion of the city administration If a city relies too heavily on the national government the city may be restricted in the way it spends funding the extent of the spending and the time it takes to use it This in turn will affect the delivery of policies and programmes Fundraising instruments or mechanisms that ensure adequate local revenues include (i) taxes and transfers (ii) administrative or commercial fees and (iii) land-value capture
Taxes and transfers The opportunity to raise or receive tax revenues depends on the fiscal decentralisation in the country and primarily falls outside of the control of the local government Such tax revenues are typically linked to local property sales and business taxes or local personal taxes It also includes ldquosharingrdquo taxes between the nation and the region in the form of budgetary transfers from the national budget to local administrations
Local administrative or commercial revenues This represents funding that local authorities can influence to a larger degree regardless of the countryrsquos fiscal decentralisation This normally happens through the way fees are set and the rigour with which they are collected Administrative fees could include building permits or licensing for a wide range of activities such as operating certain business premises or motor vehicles Municipal commercial revenues may include fees or tariffs for municipal services such as water waste heating and parking services or revenues from the letting out or sale of public land and public real-estate to private entities Cost-reflective and consumption-based heat and water bills not only provide sustainable funding for the sector but also promote resource efficiency Therefore it may be recommended to move utility services towards proper metering and fully cost-reflective tariffs while providing targeted support for low-income households (see policy option E4)
Local administrative and commercial revenues account for just over one-fifth of revenues in Sofia Bulgaria with 16 per cent of the annual budget in 2018 coming from municipal fees and 6 per cent from fines and penalties income from asset ownership and sale of non-financial assets Other key sources of revenue include 20 per cent in property and other taxes 28 per cent in intergovernmental transfers and 21 per cent in EU funding154
Land-value capture There is a strong link between public investments for example in transport and economic growth and property values with new transport services such as train and metro stations typically increasing the accessibility attractiveness and value of their surrounding areas The benefits of public investment can therefore often be substantially captured by private individuals as an unearned windfall gain This problem in combination with public funding constraints has led to the development of a variety of lsquoland-value capturersquo mechanisms in order to transfer some private financial benefits back to the public sector These mechanisms may include
1 Direct development The city transport authority makes direct purchases of land surrounding planned new transit stations and develops the land directly or in partnership with the private sector making commercial returns through subsequent sale or lease (shops commercial units flats and so on) Examples include Network Rail station development programmes such as Londonrsquos Kings Cross St Pancras or the Hong Kong Metro This approach involves little complexity ndash it can be implemented by the city or transport authority directly ndash and is less controversial than some other mechanisms that may require imposing taxes on developers and existing businesses and residents However it may require significant upfront investment and financial risk for the city
2 Negotiated payments from developers The city authority secures payments from local developers to fund infrastructure improvements associated with specific large developments for example the agreement between London and the Battersea Power Station developers to partly fund the Northern Line extension This approach also involves little complexity ndash it can be
154 See Sofia Municipality (2018)
Cross-cutting policy options
86
implemented through direct negotiation between the city or transport authority and developers seeking planning consent
3 Zonal or city-wide tax increment A zonal tax increment is a tax uplift or levy imposed by the transport authority and local government on commercial andor residential properties set to benefit within a specified area around the site to capture part of the windfall gains accruing to property owners This increment could be applied to various taxes for example business rates council tax or stamp duty This approach is more complex as it is likely to require legal or tax reform and central political support for the increases in tax Focusing on areas of benefit may reduce objections ndash but requires difficult decisions over boundaries A city-wide tax increment avoids the boundary question and has the potential to raise very large sums to support strategic infrastructure investment but may not provide sufficient targeting of areas that gain the most benefit (see for example the Community Infrastructure Levy for Crossrail in London)
Resource implications and key requirements
Setting and raising local tax revenues whether as part of general taxes or as a form of land-value capture requires adequate fiscal decentralisation and sufficient administrative capacity This requires time and the development of significant resources Increasing and collecting administrative fees for permits or end-user tariffs for utility services is less complex but requires political will and enforcement capacity
Implementation obstacles and solutions
Fiscal decentralisation may be hampered by a lack of local administrative capacity and processes Therefore ensuring adequate local capacity and procedures is often an important first step While fiscal decentralisation may take a long time to implement local authorities can improve their financial position by raising funds through increased fees and commercial revenues This also gives the local authorities the opportunity to experience and demonstrate their capacity to plan budget and operate municipal infrastructure and can subsequently help increase confidence among local and central authorities that further fiscal decentralisation is feasible
F2 Improved financial accountability and transparency
Description
The financial management of a municipality should ensure accountability and transparency This can improve the confidence of and support from central governments the international community civil society and local and international businesses ndash which in turn can lead to greater receipt of public and private funds Accurate financial management can also enable better insight into which groups benefit most from the municipal budget including various marginalised groups Strong fiscal accountability and transparency are also likely to reduce or prevent corruption thus leading to more efficient spending of public resources Robust public financial management can also improve a cityrsquos creditworthiness and enable better access to commercial debt and capital markets Municipalities can take several steps to enhance their financial accountability and transparency including (i) ensuring that they apply accrual accounting in order to provide an accurate financial picture which is then used to make fiscal and budgetary decisions (ii) ensuring that well-defined systems are in place with clearly defined auditing and control functions (iii) publishing municipal financial statements regularly and (iv) using any financial information combined with data analytics to identify inefficiencies mismanagement or fraudulent behaviour
Resource implications and key requirements
Accrual accounting goes beyond reporting on cash coming in and going out It also looks at assets and liabilities to provide a more complete and accurate picture of the financial position of a municipality Preparation of accrual accounting requires the identification and valuing of all municipal assets and liabilities Such inventory requires significant resources In addition substantial resources and time
ldquoStrong fiscal accountability and transparency are also likely to reduce or prevent corruption thus leading to more efficient spending of public resourcesrdquo
Cross-cutting policy options
87
are needed for the development of the necessary IT systems for accounting purposes data analytics and information management For example over the course of five years together with the World Bank Rijeka in Croatia planned and transformed its financial management and accounting system to one based on transparent accrual accounting and improved accountability155
Implementation obstacles and solutions
Lack of local technical administrative or financial capacity may prevent necessary improvements to municipal financial management There may also be vested interests that do not want increased transparency These obstacles or challenges may be addressed through adequate capacity-building programmes and well-defined action plans aimed at improving governance structures with clearly defined auditing and control functions
Belize has identified a need to address fiscal accountability as one factor that could contribute to improvements in municipal management Despite beginning the process of decentralisation in the 1990s there has since been little impact as local authorities do not have the technical administrative or financial capacity to manage funds and powers effectively The World Bank worked alongside the Belize government to leverage grant resources from the Public-Private Infrastructure Advisory Facility (PPIAF) to support capacity-building around fiscal management Key activities included conducting a diagnosis of fiscal conditions training practitioners in financial management revenue collection use of financial management software and designing a new accounting approach that included balance sheets156
This case of Belize demonstrates the absence of basic accounting procedures in many countries and cities and the importance of supporting policies for example information and capacity-building (see policy option G5) to support improvements in fiscal accountability
In Cape Town South Africa despite significant efforts to decentralise powers to local authorities poor sector budgeting is significantly limiting urban development decisions Current reporting of spending
is ineffective (often done in a highly technical manner) resident participation occurs after decision-making and there is no clear public framework that outlines the process of spending decisions This in turn leads to a lack of trust in the local authority and further lowers public participation To address this the Development Action Group convened a number of civic organisations to discuss a range of issues but all were centred on the absence of accountability From this measure two civic coalitions were created These held workshops and developed resolutions to improve accountability while encouraging greater civic participation via their web-based platform This case in Cape Town demonstrates the importance of stakeholder engagement as well as the value of providing a platform for local people to query and challenge public fiscal spending as well as bridging key knowledge gaps157
F3 Improved creditworthiness
Description
Creditworthiness is essentially an opinion by third parties mainly lenders on whether debt service payments will be made fully and on time A lender that has confidence in the long-term financial strength of the borrower and in the ability and willingness of the municipality to pay its obligations in full and on time will regard that municipality as creditworthy
In order to attract private financing cities must demonstrate that they are a viable investment proposal that they are able to effectively manage their own finances and are transparent in this process Improving the creditworthiness or the credit rating of a city is a gradual process partly limited by factors external to the city such as the wealth and credit rating of the national authorities However there are measures a city can take to strengthen its creditworthiness
155 See World Bank Institute (2013) 156 World Bank (2017) 157 See Kumar and Fester (2019)
Cross-cutting policy options
88
A city seeking to improve its creditworthiness should focus on improving conditions in the following five broad categories
bull economic conditions for example municipal income levels and economic diversification
bull financial management including transparency administrative capacity professional management of debt and liquidity
bull budgetary performance or operating balance
bull budgetary flexibility for example own-source revenues
bull current level of debt debt servicing requirements and other liabilities
While some of these dimensions are difficult to change in the short term a city may develop a creditworthiness action plan as a start This allows the city to set a current baseline and realistic ambitions and aims as well as identify problematic and priority areas that need to be addressed Key areas may include managing expenditure developing a pipeline of public infrastructure projects to be funded and undertaking its own lsquoshadowrsquo credit rating assessment
An official municipal credit rating issued by a well-recognised rating agency has several benefits Beyond improving access to private financing it represents and guides a process aimed at improving the financial management of a municipality This also provides valuable information to the benefit of central authorities and potential donors It also further enhances the accountability of the city management as it clearly shows the financial rigour of the municipality
Resource implications and key requirements
A creditworthiness enhancement programme is not difficult to develop but is challenging to implement It is also important to remember that improving the creditworthiness or the credit rating of a city is a gradual process For example Zaprešić in Croatia
has worked to improve its creditworthiness since the establishment of a local treasury system in 2012 The city was assessed in 2016 as having a low credit risk with a high level of budget liquidity and has been placed in the top 5 per cent of exceptionally transparent local budgets in Croatia158 159
In Uganda Kampalarsquos improvements in municipal revenue can be attributed to the work undertaken by local authorities since 2012 to improve its creditworthiness delivered through a city-wide strategic plan Despite the citys growing economy Kampala has faced significant financial problems including poor revenue collection weak governance and reliance on government transfers This limited the cityrsquos ability to invest in improving its local services and implementing infrastructure projects In light of this situation a strategic plan was developed to strengthen the governance and service delivery The plan identified key areas to target including human resource development better record management and stronger monitoring processes
To improve its administrative capacity the city received assistance from the World Bank and PPIAF enabling the Kampala authorities to develop more robust accounting approaches The plan was extremely successful and in one year Kampala managed to increase its revenues by 86 per cent However as identified creditworthiness is a continuum this requires continuous effort and commitment to financial management
Implementation obstacles and solutions
Pursuing a credit rating can be an administratively and technically challenging task as it requires addressing any gaps or weaknesses in financial management Cities can seek support from the national level or through the capacity-building programmes of international organisations for example the C40 Cities Finance Facility Incorporating a resourcing timeline into a creditworthiness action plan allows cities to effectively manage their staff and budgets for this process
External factors may include an unstable wider economy and as the national assessment forms an
158 See World Bank Group and Government of Austria (2018)159 See City of Zaprešić Finance and Budgeting Department (nd)
Cross-cutting policy options
89
89
element of a credit rating this may impact a cityrsquos ability to obtain private finance Improving these external factors can be beyond the remit of a city However active stakeholder engagement with the national government and other surrounding cities or municipalities can enable the sharing of best practice and improvement of wider conditions
F4 Financial incentives or financial support schemes for green investments
Description
Local governments can help provide financial incentives and funding in support of green investments Such support schemes can include targeted subsidy schemes like the Seoul solar panel programme It can further include the setting-up of municipally owned or funded green banks or the setting-up of investment funds (for example the Melbourne green investment fund) that can provide green loans or dedicated risk-sharing facilities for private banks Local authorities may also work with local banks in order to facilitate green lending solutions with little or no financial contribution from the city
One example is Frederikshavn Denmark which developed specific soft loans for the energy renovation of housing to meet its climate change targets A new product was developed by the municipality in agreement with local banks featuring lower interest rates and a longer maturity period relative to typical market conditions The municipality does not allocate any funds to the financing scheme Instead soft loans are provided by the partner banks that bear all the risk They run a creditworthiness check of homeowners to decide who gets a loan and under what conditions
Resource implications and key requirements
Providing financial incentives will require budgetary commitments and may be administratively demanding for the local government Significant technical capacity will also be required to identify how to configure and apply incentives Incentives can target lower income brackets of the population to address
social equity concerns associated with energy poverty Both the central and local policy frameworks need to accommodate the setting-up of incentive and funding schemes by local authorities
Potential private-sector participation
Local governments can work with commercial banks to provide financial incentives therefore sharing or shifting the financial burden from the public to the private sector
Implementation obstacles and solutions
The provision of direct financial support is financially demanding for local governments and can target fuel-poor homes It is good practice to undertake a comprehensive cost and benefit analysis of retrofitting to zero carbon for all households that are in fuel poverty and provide targeted funding for these homes160 One of the first programmes to tackle energy poverty was the Warm Front programme in the United Kingdom A total of 23 million households received assistance from the scheme Grants were offered for improvements such as loft insulation cavity wall insulation and heating system improvements161
The success factors associated with energy efficiency measures include gaining and maintaining consumer trust an effective communication and marketing strategy training and qualification schemes to ensure that worker qualifications keep pace with the technical complexity of buildings and the targeting of trigger points such as household renovations or sales162
The provision of financial incentives and favourable financing should only come after energy efficiency building codes have been enacted and adequate enforcement and compliance mechanisms are in place for building construction and retrofits
160 See National Assembly for Wales (2018) 161 See UK Parliament (2013)162 See Committee on Climate Change (2016)
Case studies - mobility and transport
90
Case studies - mobility and transport
91
05
Case studies
Case studies - mobility and transport
92
Integrated urban mobility Burgas Bulgaria
Burgas has sought to reverse a legacy of car-centric urban transport through a cohesive policy on mobility A rapid transit bus system integrated transport management greater accessibility and lower costs for using public transport are among the measures introduced
Snapshot
bull Location Burgas Bulgaria
bull Population Small ndash 202000 (2017)
bull Policy area Transport
bull Policy options Parking pricing restrictions information and enforcement pedestrian-oriented and car-restrictive policies pro-cycling policies planning and regulation of public transport services
bull Financial capacity Limited
bull Administrative capacity Strengthening
Context and policy overviewBurgas is easily accessible by car and connected by two highways to other cities Consequently private vehicles are the most popular form of transport in 2016 58 per cent of city residents used a personal
car and 37 per cent used public transport)163 However the municipality of Burgas recognised the adverse environmental and social impacts of this system and introduced policies to address them including a Sustainable Urban Mobility Plan (SUMP) for the period 2014-20 The city engaged stakeholders to contribute to the SUMP and considered three scenarios The chosen approach called for the city to (i) develop a dense network of high-speed bus lanes (ii) increase the use of public transport and (iii) boost the number of bicycle parking areas and lanes164
ImplementationThe municipality introduced a number of measures under its Integrated Urban Transport Project In 2015 the city began implementing a project to create an intelligent transport system that would improve the safety efficiency and convenience of the public transport network The plan included integrated ticketing and video surveillance of the network165
First in 2018 commuters obtained real-time access to information on buses and trolley buses
163 See ICLEI ndash Local Governments for Sustainability (2016)164 See Stoyanova (2014)165 See ICLEI ndash Local Governments for Sustainability (2016)
Case studies - mobility and transport
93
166 See Go to Burgas (2020)167 See EcoMobility SHIFT (nd)168 Ibid 169 Ibid 170 See EcoMobility SHIFT (nd)171 Ibid 172 See ICLEI ndash Local Governments for Sustainability (2016)173 See Braun (2017)
The electronic boards at bus stops were also made more informative
Second the city rolled out modern buses and smart intersections This included the introduction of 60 new buses running on compressed natural gas (CNG) and diesel to operate over the improved transport infrastructure The new vehicles replaced the cityrsquos oldest buses greatly improving the service and its reliability with reduced emissions and maintenance costs and more attractive public transport166
Third Burgas introduced paid parking charges in central areas of the city It also restricted the access of cars to the main administrative area and market converting those parts of the city to a pedestrianised zone A ldquoring and riderdquo service was provided for disabled individuals and for children167
Lastly the city constructed a complete cycling network adding 20 km to the scheme already in place and introduced a public bike-sharing scheme
To enable the implementation of these measures Burgas has sought to increase its administrative capacity including systematic policy planning targeted funding and the participation of residents The city set aside euro60 million from its municipal budget to implement the programme and obtained funding from international bodies such as the EBRD In addition the local public transport company has its own budget and receives contributions from the national government168
Public transport is free for certain groups (for instance individuals over 65 children people with disabilities) This measure cost the city euro2 million in 2012 and therefore it was imperative to obtain funding from other sources169
Results and lessons learnedThe Integrated Urban Transport Project achieved the following outcomes
bull The ring-and-ride support scheme was used more than 20000 times in its first year170
bull The ike-sharing scheme has had more than 5000 subscription contracts with daily users171
bull The city has seem reductions in air pollution and GHG emissions related to the modal shift in the transport sector
Despite these success stories Burgas remains a predominantly car-centric city In 2016 more than half of all journeys were made in private vehicles while cycling represented just 3 per cent of the modal share172 In order to foster a local cycling culture Burgas is planning campaigns including the Bike2Work scheme173
Links to similar initiativesFreiburg integrated mobility policies Lund eco-mobility policies Strasbourg integrated multi-modal transport
Case studies - mobility and transport
94
Snapshot
bull Location Strasbourg France
bull Population Small ndash 277000 (2015)
bull Economy Service economy
bull Policy area Transport
bull Policy options Pedestrian-oriented and car-restrictive policies pro-cycling policies planning and regulation of public transport services
bull Financial capacity Strong
bull Administrative capacity Strong
Context and policy overviewIn Strasbourg during the 1980s the growing use of private vehicles was increasing congestion air and
noise pollution as well as the number of accidents174 In the 1990s cross-border traffic with Germany was an additional problem given that Strasbourg sits on the busiest road link between Baden and Alsace In 1990 approximately 240000 vehicles per day were present in the city centre This congestion was exacerbated during the peak holiday seasons when visitors flocked to Strasbourg to see its historic buildings and monuments175
To address these issues Strasbourgrsquos Urban Mobility Plan also known as the first plan de circulation176 laid out initial ambitions for reducing the use of private vehicles The main aim was to build two new tramlines that would serve the city centre To facilitate this engineering project Strasbourg implemented a number of transit-oriented policies These included
bull a trial-period extension of the traffic-free precinct in Central Strasbourg ndash which was later made permanent
Integrated multi-modal transport Strasbourg France
Driven by a longstanding ambition to improve air quality Strasbourg has been removing private vehicles from the city centre while facilitating the uptake of active and public transport The city has achieved this through a mix of policy options detailed in its Urban Mobility Plan
174 See European Commission (nd)175 Ibid 176 See Strasbourgeu eurometropole (2015)
Case studies - mobility and transport
95
bull limited or altered vehicular access to the city centre for example by only allowing access through a number of loops rather than through direct connections between one district and another
bull increased fees for inner-city parking
bull the introduction of cyclist-only or pedestrian-only zones
bull the introduction of park-and-ride sites alongside tramway lines to facilitate transit-oriented development and better connectivity
The main goals of the approach were to
bull invest in transport to encourage economic development and trade in the city
bull regenerate Strasbourg to increase the quality of life and protect the environment
bull provide equal services to communities improving social cohesion
bull produce a multi-modal and coordinated system which would decrease the number of private cars in the city
ImplementationThe policy approach was guided by the Urban Transportation Planning Document (PDU) which covers Strasbourgrsquos transport policies for 10-15 years as required by national law to address air quality issues The guidance document is seen as a tool for encouraging local authorities to integrate their transport policies into broader city planning policy
Three private consultancy firms developed the PDU Its eventual adoption required ratification from all municipalities in Greater Strasbourg (CUS) the CUS Council the regional and national governments and civic organisations The tramway department and the Compagnie des Transports Strasbourgeois were responsible for assessing and reviewing the progress of the plan and its impact
These institutions acted as major levers for the policyrsquos implementation and financing CUS had significant governance powers as the organising authority achieved through devolution from the national level The state implemented structures to allow local authorities to manage mass transit services This currently enables CUS to coordinate transit with urban planning processes and service provision
The main sources of funding for public transport systems are the national government regional and local authorities The local authority supplies financing through a transport tax the versement de transport which places a levy of 1 per cent on private wages paid within the Greater Strasbourg area177 Although the tax does not provide full financing for all the projects it is of benefit The system cost euro97 million which worked out at a reasonable industry cost Most parking measures are delivered through public-private partnerships between the city and businesses
Barriers and critical success factorsThe mayoral contest held before the implementation of this plan centred on urban planning changes The winner Catherine Trautmann was strongly motivated to carry out the plan and to recruit a more diverse team of professionals into the public bodies tasked with delivering the programme
There was strong opposition to the scheme particularly from businesses operating in the city centre who believed that the policies would result in a loss of income Moreover they were concerned that works to install the trams would restrict access even further These negative sentiments resulted in the creation of an opposition campaign However the local authority worked hard to develop an engaging communications strategy that would allay peoplersquos fears
The new mayor brought the political vision required to make the plan acceptable among residents Her campaign was built on transforming the cityrsquos transport system and despite opposition she continued to pursue this goal throughout her term
177 See The Princersquos Foundation for the Built Environment (nd)
Case studies - mobility and transport
96
Due to this opposition Strasbourg undertook an extensive consultation process with local residents businesses and associations There was also an accompanying awareness-raising campaign by the city authorities and transport operator The campaign sought to shift entrenched travel behaviours and was supported through a communications strategy with a city symbol (Bruno the bear) to add a face to the campaign
Strasbourg established a phone line to deal with complaints more efficiently and personally The communications strategy also provided regular updates to residents keeping the community involved
Furthermore the city provided landscaping to improve the quality of the environment along routes through social housing projects This work helped to gain support for the transport plan
Results and lessons learnedThe overall PDU programme generated 30 jointly developed managed and funded projects 15 of which focused exclusively on improved environmental protection
Following the implementation of policies outlined in the Urban Mobility Plan by 2000 the number of vehicles in the city centre had fallen by 16 per cent178 to a third less than the figure that would have been expected on the basis of population growth Strasbourg achieved this success despite an overall increase in traffic volumes across the municipality However this traffic reduction in the city centre may have resulted in a transfer of traffic to surrounding roads
Nevertheless data for the tramlines do indicate that more people shifted to using public transport During its first year Tramline A carried 68000 passengers a day potentially contributing to a 17 per cent reduction in traffic entering the area
Furthermore contrary to initial expectations pedestrianisation increased property values and trading figures as the quality of life increased And by 2015 125 jobs had been created across these projects
Strasbourgrsquos Urban Mobility Plan offers lessons for other cities that hope to implement similar initiatives First building an engaging and relatable communications strategy is key to driving change particularly if a programme faces fierce opposition Second this strategy should involve extensive stakeholder engagement while tailoring the communications to the chosen audience In particular the benefits for each group must be made clear and communicated Third any communications strategy must not be a one-off but rather a continuous dialogue
Links to similar initiativesLjubljana car-free zone Seoul transit-oriented development
178 See European Commission (nd)
Case studies - mobility and transport
97
Shifting from transport to mobility Moscow Russia
The Greater Moscow region has successfully implemented a large-scale programme to increase the efficiency of its transport system Measures to cut traffic and shift journeys to public transport modes have reduced the number of cars in the region by 25 per cent compared to 2012
179 See Maltcev (2017)180 See Moscow Transport (2017)
Snapshot
bull Location Moscow Russia
bull Population Large ndash 123 million (2017)
bull Policy area Transport
bull Policy options Planning and regulation of public transport services road-user charges parking pricing restrictions information and enforcement car-sharing car-pooling and ride-sharing
bull Financial capacity Strong
bull Administrative capacity Strong
Context and policy overview In 2010 a new Moscow city government was established At the time traffic congestion was high
during peak hours public transport was ineffective (with inconvenient routes and low quality of service) and the city lacked space for pedestrians and cyclists These problems were exacerbated by the fact that many residents commuted to the city centre via the Moscow ring road To tackle these challenges the Moscow authorities have been implementing a large-scale programme since 2010 to increase the efficiency of the cityrsquos transport system179
A new programme called the ldquoDevelopment of the Transport System 2012-2016 and Further Prospects for 2020rdquo was launched in 2012 with a budget of US$ 80 billion until 2020180 The programme included a number of measures such as development of the metro traffic improvements the creation of bicycle and pedestrian spaces the promotion of car-sharing services and the creation of a smart transport system
The effect of investment at this scale was tremendous with 80 new rail and metro stations a complete renewal of the bus fleet and a significant renewal of the tram and metro fleets
Case studies - mobility and transport
98
181 See Maltcev (2017)182 See Liksutov (2018b)
ImplementationThrough the programme the construction of new metro stations was intensified (18 new stations came into operation between 2010 and 2016) Furthermore an electronic travel card the Troika was introduced It uses payment methods such as Apple Pay and works on all public transport in Moscow Some 249 additional kilometres of road lanes were designated for public transport and 75 per cent of the public transport fleet was renewed
The city government reduced private car use in the centre of Moscow by building parking places near metro stations Heavy goods vehicles were restricted from entering the city centre between 6am and 10pm alleviating congestion Car-sharing businesses were also set up The city introduced an intelligent transport system (ITS) with a budget of US$ 17 billion for the period 2012-20 Digitisation has played a key role in updating Moscowrsquos transport network Public transport operators use mobile applications to provide route-planning options for passengers and by 2018 80 per cent of all taxi bookings were made via smartphones181
Barriers and critical success factorsThe city transport department recognised that one of the main challenges with regard to the uptake of public transport is the difficulty of competing with the comfort of private cars To tackle this issue the department has been upgrading its own fleet purchasing more than 8000 new vehicles and 1600 new metro train cars (all manufactured domestically) By the end of 2017 37 per cent of all metro carriages were new along with 90 per cent of the aboveground transport fleet Today public transport is more accessible with 98 per cent of aboveground vehicles suitable for use by disabled passengers Electronic ticketing systems a successful city bike hire system (the volume of journeys made using this system doubled between 2015 and 2017) bus lanes CCTV to improve passenger safety and regulation of the taxi industry have also played key roles
The introduction in 2013 of the Troika transport card ndash which allows seamless transfers between all types of aboveground public transport ndash has been a further success with more than 85 per cent of trips being paid for through this system 182 More recently the city
Case studies - mobility and transport
99
has also introduced contactless payment through mobile phone payment systems183
Moscow has been using data and technology to provide a better service and to gain more insights from transport customers and other residents In 2020 the city launched an online portal for capturing feedback to help inform priorities for the next investment cycle184
Overall political will has been key in enabling Moscow to improve the efficiency of its transport system Sergey Sobyanin the mayor appointed in 2010 made upgrading the Moscow transport network one of his key priorities In addition the transport programme tackled the issues holistically seeking to improve parking road infrastructure public transport infrastructure and the ITS185
Results and lessons learned
bull Commuter traffic in the Greater Moscow region increased by 600 million trips or 12 per cent between 2010 and 2016 Over the same period the city saw a 37 per cent increase in the percentage of economically active residents using public transport186
bull Travel time from the ring road to the centre has fallen by 20 minutes over the past 10 years187
bull The improvement in traffic speeds benefited non-drivers as well average dwell times were halved for public transport passengers and reduced by more than a quarter for taxi passengers188
bull Moscow became a TomTom Traffic Index Parking award winner in 2016 when the
average time spent searching for a parking space had been reduced by 65 per cent In the 2013 version of the TomTom Traffic Index Moscow traffic ranked as the worst in the world but by the 2017 edition it was in sixth place27 Based on these achievements in 2016 Moscow won an International Transport Award from the International Transport Forum for tackling traffic congestion190
The experience of Moscow offers lessons for other cities seeking to upgrade their transport systems Above all the cityrsquos experience shows that public transport must be safe reliable and convenient in order to be a credible alternative to private vehicles
Links to similar initiativesRotterdam customer-centric public transport Seoul demand-side policies for transit-oriented development Paris public transport integration Tallinn subsidised public transport
183 See Liksutov (2020)184 Ibid185 See Maltcev (2017)186 Ibid187 See Liksutov (2020)188 See Maltcev (2017)189 See TomTom (2020)190 See International Transport Forum (2016)
Case studies - mobility and transport
100
Snapshot
bull Location Freiburg Germany
bull Population Small ndash 227000 (2017)
bull Policy area Transport
bull Policy options Pedestrian-oriented and car-restrictive policies pro-cycling policies planning and regulation of public transport services
bull Financial capacity Strong
bull Administrative capacity Strong
Context and policy overviewFreiburg is a city in which public transport and bicycles are the prevailing methods of transport
From the 1950s to the 1970s Freiburg saw an increase in private transport However in 1969 with its First Transport Plan Freiburg switched away from policies focusing on private transport to ones that took a more holistic view of the urban community In the early 1970s this change saw the planning of an integrated cycling network and a new car-free pedestrian zone in the centre of the old town191 Moreover faced with traffic congestion city officials decided to maintain and develop rather than remove their tram system
In the 1980s Freiburg introduced traffic-calming zones to all residential neighbourhoods to discourage the use of cars in residential areas For instance parking schemes were introduced with limited long-term parking and increased parking fees Neighbourhood associations backed this policy
Implementation The city has ensured that the tram is a convenient mode of transport for residents The tram system is
Incentives to use public and active transport Freiburg Germany
In a quest to cut traffic congestion and environmental pollution Freiburg has sought to reduce the cityrsquos reliance on cars by better integrating affordable and convenient alternatives such as walking and cycling Today more than one-third of residents do not own a car
191 See Buchler and Pucher (2011)
Case studies - mobility and transport
101
constantly being extended with new lines built and existing ones prolonged as needed This has resulted in 65 per cent of Freiburg residents having a tram stop within 300 metres of their home192 Affordability has been another concern for the city which chose to combine affordable public transport charges with a mobility card model in the 1980s
Freiburg has doubled the use of bicycles since the 1980s thanks to a number of pro-cycling policies The average annual budget for bicycle facilities has been euro836000 since 1976193 In 2011 bikes accounted for 27 per cent of all journeys194 The city has more than 400 km of well-connected cycle routes with more than 9000 cycle parking spaces in the centre of Freiburg and at bike-and-ride locations at bus and tram stops
The city also recognised the importance of having an integrated mass transit system throughout the urban area Using planning and design it created a ldquocity of short distancesrdquo enabling high levels of public transport use cycling and walking Investment in the transit system and measures to encourage cycle use were coupled with restrictions on car use through road design and traffic and parking management measures195
New developments such as Rieselfeld and Vauban were developed around tram lines and both districts limited car access and parking All streets were traffic calmed at 30 km per hour or less and were well connected to Freiburgrsquos cycle network and tram system In Vauban more than 70 per cent of households do not own a car Car owners have to purchase a parking space in a multistorey car park on the outskirts of the development costing US$ 25000 plus a monthly service charge196
Resource implicationsNeither of these developments required a contribution from the city budget Both were designed to be self-financing plans with costs being covered by income received from selling serviced plots of land to
cooperatives individuals and small builders Freiburg also has a betterment levy which allows the city authorities to access one-third of the increase in value on the sale of open land197
The city was able to realise its ambitions to control car use partly due to changes in federal government funding reforms in the 1970s During this period municipal governments were given greater autonomy to direct transport funding as they wished The state of Baden-Wuerttemberg also funded the initial trial of Freiburgrsquos flat-rate monthly travel tickets198
192 Ibid 193 See Whitelegg (2014)194 See ICLEI (2011)195 See World Habitat Awards (2013)196 See Buchler and Pucher (2011)197 See World Habitat Awards (2013)198 See Buchler and Pucher (2011)
Case studies - mobility and transport
102
199 Ibid 200 See ICLEI (2011)
Overall the cityrsquos policies have had the effect of shifting the relative costs of car ownership and use compared to those of public and active transport modes199
Barriers and critical success factorsThe plan faced initial resistance from many residents especially those who lived in the suburbs Developers also had a negative response to Freiburgrsquos approach demanding fewer restrictions on how they developed the city These problems were overcome by the city having a clear strategic direction with good communication and engagement with local communities Moreover an increase in service levels and modes of public transport contributed to reducing the percentage of private transport
Citizen participation has been a critical element of the cityrsquos transport planning since the 1970s and was a significant driver in the shaping of Vauban into a car-free neighbourhood Freiburg developed its land-use plan in collaboration with the community with 900 participants
Results and lessons learnedThe city successfully reduced the prominence of cars while increasing the use of sustainable transport modes More specifically it achieved the following impacts200
bull Freiburg has the lowest car density of any city in Germany (423 per 1000 people) Annual car trips have hardly increased over the last 15 years even while the total number of trips of all forms has increased by 30 per cent
bull In the 1990s the use of public transport doubled with 200000 residents using the four tram lines and 26 bus lines
bull The total number of cycling trips each year has nearly doubled
Freiburg is internationally recognised to be a leading green and sustainable city Its successful transition to sustainable modes of transport offers valuable lessons for other municipalities and cities globally First public acceptance of car-restrictive measures is closely linked to the cost and quality of the alternatives provided Residents are more likely to substitute their car ride for a tram journey if the tram is reliable clean and affordable Second active stakeholder engagement is important in order to overcome (and even prevent) opposition to sustainable transport policies Residents businesses and civil society groups must be given a voice and listened to Third the availability of national funding ndash for example to subsidise ticket prices for a limited period of time ndash can help to introduce new services and limit the costs for city authorities
Links to similar initiativesBologna eco-mobility policies Lund eco-mobility policies Strasbourg integrated multi-modal transport
Case studies - mobility and transport
103
Snapshot
bull Country Slovenia
bull Population Small ndash 287000 (2015)
bull Policy area Transport
bull Policy options Pedestrian-oriented and car-restrictive policies pro-cycling policies
bull Financial capacity Strengthening
bull Administrative capacity Strong
Context and policy overviewBetween 2002 and 2012 Ljubljana experienced a 52 per cent increase in car use while also witnessing a 23 per cent decline in the use of public transport
In 2011 the modal share of public transport stood at just 13 per cent while cars accounted for 67 per cent
To reverse this trend Ljubljana adopted a new Sustainable Mobility Plan (SUMP) in 2012 The plan sought to limit personal motor vehicle traffic and instead give greater priority to pedestrians cyclists and public transport201
When introducing the plan the city set itself concrete targets to increase walking by 20 per cent cycling by 40 per cent and bus journeys by 50 per cent all the while reducing car journeys by 20 per cent For 2020 the modal split envisioned was one-third public transport one-third non-motorised mobility and one-third private vehicles202
To achieve these targets the SUMP proposed a broad mixture of policy measures that are outlined below
Pedestrianisation and car-free zones Ljubljana Slovenia
In 2012 Ljubljana adopted a plan to restrict private motorised transport and promote sustainable forms of mobility By introducing new technology improving public spaces and upgrading the bus network the city achieved a significant increase in public transport use and greater uptake of walking and cycling
201 See European Union (2015) 202 See Civitas (2013)
Case studies - mobility and transport
104
203 See Jovičić (2019)
ImplementationLjubljana implemented numerous measures across various policy areas to limit motorised transport and promote sustainable mobility In terms of pedestrian-oriented and car-restrictive policies the city
bull set up an eco-friendly zone which closed the old city centre to traffic and restricted deliveries to the mornings
bull made Slovenska Street a traffic artery more pedestrian friendly by improving accessibility and refurbishing the surrounding area This entailed planting 63 young ash trees along a 400-metre stretch which also attracted local wildlife
Moreover Ljubljana implemented several supporting policies such as the establishment of five new park-and-ride facilities the purchase of 32 new CNG buses and the introduction of an electric tourist train In order to further promote cycling the city also manages 220 km of dedicated cycle routes and rolled out a public bike hire scheme (Bicike) which comprises 36 stations and 360 bikes
In addition to improve the convenience and efficiency of public transport use the city introduced real-time arrival displays for the bus network as well as a smart travel card the Urbana card
Funding for many of the projects under Ljubljanarsquos SUMP has come from the EUrsquos Cohesion Fund at a national level but Slovenia plans to switch to its own financing from 2020 This will require changes to national legislation and financing and the carrying out of engagement and awareness campaigns203
Barriers and critical success factorsSeveral factors contributed to the success of the SUMP First due to continuous awareness-raising campaigns the city was able to take new policy measures year on year As part of its communication efforts Ljubljana also hosted the European Mobility Week in 2003 and 2013 This is Europersquos largest mobility campaign designed to encourage city administrators to introduce sustainable transport policies
Case studies - mobility and transport
105204 See CityLab (2016) 205 See Istenič (2016) 206 See City of Ljubljana (2020)207 See ICLEI (nd)208 Ibid
Second the mild climate and the flat topography of the city make it ideal for cycling all year round This has helped Ljubljanarsquos bike-sharing scheme to succeed
Third from a political point of view mayor Zoran Janković chose to implement the bigger more controversial changes such as banning cars from the city centre within his first year of office This meant that the inconveniences associated with the implementation of the SUMP would be over early on and residents and initial critics could experience the benefits of cleaner air safer streets and quieter public spaces by the time the next election campaign came around204 This strategy showed success Mr Janković has since been re-elected three times
Results and lessons learnedThrough the implementation of its SUMP Ljubljana achieved a significant uptake in public transport and active mobility options
With regard to public transport the city saw
bull an 185 per cent increase in public transport use between 2010 and 2014
bull 17 per cent more city bus users since 2011
bull a 34 per cent increase in journeys on regional buses between 2013 and 2014
Moreover 98 per cent of city residents think that the shared bike scheme is a positive idea and it has seen close to three million journeys in its first four years of implementation
Ljubljana has also successfully transformed from a car-friendly to a pedestrian-friendly city in turn bringing down pollution levels Through the SUMP
bull pedestrian surfaces were increased by 620 per cent through closing the city centre (100000 m2) to all motorised vehicles205
bull the city centre is now used for cultural social and sporting events throughout the year The renovation of Slovenska Street reduced black carbon levels by 70 per cent and PM 25 levels by 58 per cent while the concentrations on surrounding streets have not increased206
In recognition of all the above results the city received the bronze Access City Award from the European Union in 2015 The award identified Ljubljana as one of Europersquos leading cities in terms of accessibility to public spaces and public transport207
These impacts also had a direct positive effect on peoplersquos wellbeing In 2015 the European survey on quality of life (Eurobarometer) found that 92 per cent of Ljubljana residents were very satisfied or satisfied with the quality of life in the city208
The success stories in Ljubljana clearly offer valuable lessons for other cities First Ljubljana did not take an isolated approach to combat rising numbers of private vehicles and the associated detrimental environmental effects Instead it implemented a balanced mixture of policy measures to achieve a modal shift Second it can be beneficial for politicians to implement controversial measures early on so that the positive impacts of initiatives are visible by the time the next elections are due
Links to similar initiativesCopenhagen active transport policies Lund eco-mobility policies Freiburg active transport policies
Case studies - mobility and transport
106
Snapshot
bull Location Lund Sweden
bull Population Small ndash 92000 (2018)
bull Economy Service economy
bull Policy area Transport
bull Policy options Pedestrian-oriented and car-restrictive policies pro-cycling policies
bull Financial capacity Strong
bull Administrative capacity Strong
bull Other Supportive national policy
Context and policy overviewIn 2017 just two years after the Paris Agreement Sweden committed to becoming carbon neutral by 2045209 one of the first countries in the world to commit to such a target Overall environmental awareness has grown rapidly in Sweden since the
1970s and this has also been reflected in Lundrsquos environmental policy
In 1999 the city developed a new Environmental Code which streamlined all previous environmental acts and included concepts such as the polluter-pays principle210 Since the 1970s the city has been implementing a series of hard and soft measures to improve transport management in particular
Today the city has a well-developed transport plan (LundaMaTs) which it has further developed to consider wider environmental economic and social sustainability (LundaMaTs II) The long-term ambition of this plan is to encourage the use of active transport (walking cycling and public transport) while also reducing the use of private vehicles
All measures have been supported by suitable levels of funding as well as a highly engaged motivated and well-educated population211
Promotion of active transport Lund Sweden
Over the last 10 years Lund has implemented a series of pro-cycling and pedestrian-friendly transport policies leading to a decrease in car use and a rise in the uptake of active transport options
209 See UNFCC (2017) 210 See Baltic Environment and Energy (2007) 211 See CiViTAS (2009)
Case studies - mobility and transport
107
Implementation The small size of Lund (2575 kmsup2) lends itself to active transport and with significant green space the city is an attractive environment for pedestrians212 The measures taken to facilitate the LundaMaTs transport plan were a broad mixture including rezoning the establishment of partnerships education and awareness campaigns the redesigning of outdoor spaces and pro-cycling measures
Rezoning The city initially carried out a series of rezoning measures including closing several streets and squares to vehicular traffic and limiting bus traffic to certain times of the day
Redesigning outdoor spaces The city recognised that the uptake of walking could be even greater for both disabled groups and non-disabled groups if Lund improved accessibility and made the cityrsquos open spaces safer with lighting through project proposals that could be included in a pedestrian management plan
Pro-cycling measures At the start of the programme cycling was already popular across the city and Lund is recognised as one of the most popular places to cycle in Europe The municipality undertook a mixture of policies to further capitalise on this popularity including
bull improvements to cycling infrastructure
bull bicycle traffic safety campaigns
bull establishing partnerships with the public and private sectors
In particular the infrastructure programme facilitated the construction of 260 km of high-quality bike lanes more than 5500 cycle parking spaces and multistorey parking and bike storage facilities with servicing at the central train station213
Partnerships Partnerships between public and private institutions and transport and traffic companies have been established in Lund
The city has supported these measures to improve active transport through
bull an online service that allows residents to compare different modes of transport in terms of their cost time environmental impact and health benefits It is an open-source service that enables users to contribute and has therefore become a co-produced map
bull measures to improve the public transit system The bus system is coordinated across the region and provides frequent local services connecting 400 bus stops over 11 lines The train system from neighbouring Denmark is similarly unified under one ticketing system
212 See ICLEI (2011) 213 See CiViTAS (2009)
Case studies - mobility and transport
108
Lund has had significant municipal and national government funding for the measures mainly due to the wider national ambitions of Sweden The level of annual funding for active transport in Lund is difficult to estimate However a basic budget equivalent to approximately GBP 300000 is spent on maintenance Projects to improve provision are additional costs ndash for example the equivalent of GBP 2 million for the creation of tunnels and an investment of more than GBP 71 million between 1998 and 2005 as part of the LundaMaTs programme214 One source states that funding has varied between GBP 15 million and GBP 5 million215
Results and lessons learnedThe LundaMaTs programme consisted of a mixture of policies implemented over a decade which allowed the city to adjust to the changes to spread out the costs and to create long-term behavioural shifts among residents
In 2011 43 per cent of all trips in Lund were taken by bicycle and in the preceding decade there was no increase in car use In fact in 2010 there was a measured drop of 2 per cent in the kilometres travelled annually by car compared with the levels seen in the previous year216
Moreover improvements in accessible design led to a halving of the number of deaths and injuries from
traffic accidents The city aims to have no deaths and injuries in the future
Looking ahead the already well-connected bus network will be further supported by the introduction of a tram network that is due to open in December 2020217 to facilitate faster public transport greater capacity and an environmentally cleaner system
The experience of Lund shows that a balanced and well-thought-out mixture of policies implemented over a longer period can help to facilitate behavioural change among residents and to address funding constraints
Links to similar initiativesAmsterdam mobility plan European Commission report on cycling Copenhagen cycling strategy
214 See Warren (2010) 215 See Transport for London (2014)216 See ICLEI (2011)217 See Railway Gazette (2020)
Case studies - mobility and transport
109
Snapshot
bull Location Copenhagen Denmark
bull Population Large ndash 602000 (2017)
bull Policy area Transport
bull Policy options Pedestrian-oriented and car-restrictive policies pro-cycling policies
bull Financial capacity Strong
bull Administrative capacity Strong
Context and policy overview Like many other cities in Europe Copenhagen experienced a major rise in private car ownership and use from 1945 to 1975 This brought about a corresponding decrease in bicycle use and an increase in levels of traffic and pollution
However in the 1970s a number of factors including the oil crisis led the city government to prioritise cycling in Copenhagen218219
This strategy entailed various planning infrastructure and financing measures and has helped Copenhagen to attain the status of being one of the worldrsquos leading cycling hubs
ImplementationAs part of its plan to be CO2 neutral by 2025 Copenhagen has set itself the goal of becoming the worldrsquos best city for cycling To achieve this it has deployed a policy mix of planning infrastructure and financing measures
Planning measures Bicycle planning is now an integrated feature of urban development and urban governance in Copenhagen The city has developed various policy planning and strategy documents addressing different aspects of cycling through targets implementation and funding The most important documents include
Cycling strategy Copenhagen Denmark
Copenhagen achieved a shift from being an increasingly car-centric city in the 1970s to one in which cycling is now becoming the norm for most inhabitants While cycling in Denmark has decreased by 30 per cent since 1998 in Copenhagen it has risen by 30 per cent
218 See Urban Sustainability Exchange (nd)219 See Ruggieri (2017)
Case studies - mobility and transport
110
220 See Urban Sustainability Exchange (nd)221 See The City of Copenhagen Technical and Environmental Administration Traffic Department (2011)
bull the Copenhagen Cycle Policy (2002-12)
bull the Copenhagen Transport and Environment Plan 2004
bull the Copenhagen Bicycle Strategy (2011-25)
bull the Copenhagen Cycle Priority Plan (2006-16)
Infrastructure measures There is a large amount of cycling infrastructure in Copenhagen aimed at improving the safety and convenience of cycling through a network of segregated bike paths dedicated bicycle traffic lights separated coloured bike paths where cars and bikes share road space and parking for bicycles and cargo bikes Cargo bikes are used for transporting children and shopping and are often an alternative to car ownership
Financing measures Copenhagen allocated euro80 million to implement its bicycle strategies and infrastructure between 2010 and 2014220
Barriers and critical success factorsThe main barrier to establishing Copenhagen as a bicycle-friendly city was the rise of private car use from the 1950s onwards To improve the situation the city integrated cycling into its planning and policy ensuring that there were sufficient resources to support the policies Copenhagen has also promoted a culture of cycling which has been central to the success of the strategy
A critical success factor has been the single Technical and Environmental Administration within the city government as it enables a ldquoone-stop shoprdquo approach to urban and transport planning The administration works collaboratively with an open work culture reducing conflict between urban and transport planning
Results and lessons learnedCopenhagen successfully managed an urban transformation process from being a car-centric city in the 1970s to becoming a global role model for bicycle-
oriented planning Through a variety of measures the city achieved impressive results221
bull The number of daily bicycle trips increased from 110000 in 1970 to 150000 in 2015 (a 36 per cent modal share) Copenhagen plans to increase this further to 240000 by 2025
bull Since 1998 the city has seen a 30 per cent increase in total kilometres cycled and a more than 33 per cent rise in cyclingrsquos modal share for work or educational trips
bull Bicycles are increasingly used even for trips with heavy shopping or children and 17 per cent of households have a cargo bike
bull The bicycle is now the most popular form of transport for Copenhagenrsquos commuters
Today cities around the world look to Copenhagen for guidance and inspiration when it comes to designing and implementing pro-cycling policies The lessons learned from Copenhagen can be summarised under two areas governance and political leadership and commitment
Governance Copenhagen has successfully reduced and minimised conflicts between urban and transport planning by taking an integrated approach across departments and agencies
Political leadership and commitment In Copenhagen cycling is increasingly the norm for the majority of residents Promoting a culture of cycling and supporting that with sufficient resourcing and planning commitments has been crucial to this success
Links to similar initiativesMuenster policy to promote cycling Burgas cycling measures Utrecht cycling city of the Netherlands
Case studies - land use
111
Snapshot
bull Location Stuttgart Germany
bull Population Large ndash 628000 (2016)
bull Economy Service economy
bull Policy area Land use
bull Policy option Promotion of green spaces and biodiversity
bull Financial capacity Strong
bull Administrative capacity Strong
Context and policy overviewStuttgartrsquos geography and economic base heavily influence its air quality A mild local climate low wind speeds and a valley basin location combined with industrial activity and high traffic volumes all contribute to poor air quality222
Climate projections for the period 2071-2100 predict a 2ordmC increase in mean annual temperatures for the
city And projections for heat waves ndash defined as temperatures exceeding 30degC ndash suggest that heat stress will be a significant issue with more than half of the Greater Stuttgart area experiencing at least 30 days of heat stress by 2100 Low-lying areas could experience more than 60 days significantly increasing the risk to local people223 Moreover ongoing development of valley slopes surrounding the city hinders air flow exacerbating poor air quality and the urban heat island effect
Stuttgart has a decades-long legacy of climate mapping air-quality data collection and local climate assessment began in the 1930s As air quality worsened into the 1970s the city began a more focused campaign to address this problem224
Adapting to climate change and mitigating its effects remains a political priority The city adopted its first climate change mitigation strategy in 1997 and has since supplemented this with an adaptation strategy adopted in 2012
The main goal of these strategies is to improve air quality and reduce the urban heat island effect by channelling flows of cool air via ventilation corridors from the hills towards urban areas in the valley basin
Green ventilation corridors Stuttgart Germany
Stuttgart developed a climate atlas that maps temperatures and cool air flows in and around the city This information helps develop planning and zoning regulations to both protect open spaces and incorporate new ones into dense urban areas
222 See WWF (2012) 223 See European Environment Agency (2014)224 See WWF (2012)
Case studies - land use
112
The climate atlas for the Stuttgart region was initiated in 2008 It provides a spatial overview of the region and includes the assessment of 179 towns and municipalities225
ImplementationThe atlas illustrates the movement of cold air and the levels of various air pollutants It also establishes eight types of local climate typology with associated planning and zoning recommendations to protect open spaces and to promote the creation of new ones especially in built-up areas For example the climate atlas prohibits construction in cold air ventilation corridors and any other open spaces that have a large effect on the local climate The Atlas recommends additional greening for developed areas in locations that have a significant effect on the climate Further planning principles include the following226
bull Buildings must be surrounded by open space and there must be a larger interconnected network of open spaces
bull Valleys hills and hillsides may not be built on
bull Urban sprawl should be avoided
bull For industrial buildings air pollutants that would affect the surrounding settlements should be avoided
Collaboration and public participation underpin the implementation of the climate atlas which was developed and funded in a partnership between the city regional authorities and climate experts227 To increase the programmersquos public appeal and participation the city also provided financial assistance for the private installation of green roofs and encouraged residents to adopt and care for a tree228
Barriers and critical success factors The following success factors have contributed to the successful improvement of air quality and to mitigation of the urban heat island effect229
bull The consolidation by the atlas of critical details of the regionrsquos geography climate and land use has faciliated precise planning for different areas
bull The cityrsquos increased internal capacity to conduct climate research has created valuable knowledge of the local environment This has allowed Stuttgart to act on specific information rather than relying on general principles and has rendered the cityrsquos efforts more effective Furthermore this concrete knowledge applied
225 See City of Stuttgart (nd)226 See WWF (2012)227 See European Environment Agency (2014)228 Ibid 229 Ibid
Case studies - land use
113
over decades has enabled Stuttgart to regulate development and land use to intentionally create a region-wide system of air flows
bull The atlas has shown that existing regulations (such as the German building code) can also be used to further promote climate-related planning recommendations
bull The partnership between the Office for Environmental Protection and the City Planning and Renewal team in Stuttgart has meant that the recommended green infrastructure solutions were implemented through spatial planning and development control
Results and lessons learnedHaving initiated subsidies for green roofs since 1986 Stuttgart now mandates them on new developments As a result the green roof market has had a significant boost230 Stuttgart is now a leader in the field with more than 300000 m2 of green roofs More than 60 per cent of Stuttgartrsquos land area is green open space In addition at 39 per cent of the total land area the city has the highest percentage of protected land of any city in Germany These green spaces include 5000 ha of forested land 65000 park trees and 35000 street trees Through a concerted strategy in place since the 1970s the city has integrated green areas into a large green corridor People can now travel from the royal gardens in the city centre to forests at the edge of Stuttgart exclusively via green spaces231
Recent changes to the climate atlas prohibit development in ventilation corridors and on the hills surrounding the city Plans set out in the cityrsquos 2010 Land Use Plan to develop more than 60 ha of these areas have now been halted in order to protect green spaces232
Using financial support provided by the city about 60000 m2 of green roofs have been installed and nearly 500 trees have been paired with citizens in a tree adoption programme These volunteers water the
trees report on pest infestations and remove fallen leaves branches and dog excrement233
The climate atlas concept has been replicated in other cities across Germany and internationally For example Berlin has developed an environmental atlas and Kobe Japan has created an environmental atlas to inform measures that support air circulation from the sea during the day and from the mountains during the night234
Links to similar initiativesTirana green belt policy Novi Sad green living concept Hamburg green roof strategy Liverpool mapping green infrastructure Antwerp green tool
230 See Mees (2014)231 See European Environment Agency (2014)232 See WWF (2012)233 See European Environment Agency (2014)234 See WWF (2012)
Case studies - land use
114
Snapshot
bull Location Barcelona Spain
bull Population Large ndash 16 million (2016)
bull Policy area Land use
bull Policy options Development of compact cities promotion of mixed-use areas and transit-oriented development promotion of green spaces and biodiversity community-based land planning
bull Financial capacity Strong
bull Administrative capacity Strong
Context and policy overview The municipality of Barcelonarsquos ldquoCitizen Commitment to Sustainability 2012-2022 ndash Compromiacutes 22rdquo agenda promotes engagement and collaboration to create a more liveable and sustainable city More than
800 local organisations have signed the document235 One of the aims of the Commitment is to place the individual at the centre of decision-making in city planning with an increased focus on small-scale interventions236 The ldquoLetrsquos fill the streets with liferdquo programme was initiated to prioritise access to public space for people rather than vehicles The programme centres around public participation237
Barcelonarsquos Climate Plan 2018-2030 builds on the Commitmentrsquos aims with ldquosuperblocksrdquo seen as a means of fulfilling the planrsquos goal to increase green space and cut GHG emissions238
The cityrsquos 2013-18 Barcelona Urban Mobility Plan (UMP) also sought ldquoto promote positive communal relations between people as well as social cohesion wellbeing and public healthrdquo and promoted superblocks239 Moreover the new Urban Mobility Plan 2019-2024 includes plans to significantly expand the superblocks programme across the entire city240
Urban planning with superblocks Barcelona Spain
The municipality of Barcelona in partnership with the Urban Ecology Agency developed the innovative ldquosuperblocksrdquo project to address local challenges such as air pollution noise traffic road accidents health issues and a lack of green space
235 See Ajuntament de Barcelona (nda)236 See Energy Cities (2016)237 See Ajuntament de Barcelona (ndb)238 See Ajuntament de Barcelona (ndc)239 See Ajuntament de Barcelona (ndd)240 See Ajuntament de Barcelona (nde)
Case studies - land use
115
ImplementationThe superblocks programme redefines public space giving priority to people greenery and human interaction while minimising the space allocated to roads and vehicles Superblocks consist of a small grid of blocks and roads (approximately 400 m x 400 m) with cars vans scooters and other vehicles restricted to the outer perimeter roads (unless the drivers are residents or delivering to local businesses in which case their maximum speed should be 10 kmh) The city has expanded cycle lanes and initiated an orthogonal-grid bus network using main thoroughfares only241 Superblocks are intended to function as mini-neighbourhoods creating opportunities for leisure sports and social interaction
The approach was first tested in the neighbourhood of Poblenou in 2015 There the initiative has transformed public space with 75 per cent of the area that was once occupied by cars now freed up for cycle lanes benches and room for residents to interact and children to play242 Four new 2050 m2 public squares have also been introduced
So far Barcelona has completed six superblocks and the Urban Ecology Agency (BCNEcologia) a public consortium within the city council has set out plans to develop 503 more superblocks across the city
Barriers and critical success factorsWhile there have been some criticisms for instance about the inconvenience to drivers as a result of complicated rerouting the occupants of superblock areas have tended to welcome the changes243
Following the Poblenou test case the city learned important lessons that were carried through into the development of later superblocks For example a lack of sufficient funding to develop the superblock and an initial failure to engage local stakeholders created some opposition and animosity244
Strong clear communication between planning authorities and residents is recognised as being essential to increase the acceptability of the projects Public engagement and participation throughout the planning stages also create a sense of ownership and emotional attachment to the areas for the people who will use the spaces Participatory processes take both those involved in design and policy as well as the communities on a shared journey that is likely to culminate in a joint and mutually acceptable vison for Barcelona
Furthermore during the process of developing and designing the superblock spaces a willingness to experiment and to learn by doing allows people to evaluate the changes as they engage with the spaces This enables simple low-cost no-regret interventions to bring about rapid changes in behaviour and the environment These can then lead to investment in more permanent changes to the public realm a clear demonstration of value creation for the neighbourhood Superblocks are open projects since the completion of the Poblenou project any proposed action undergoes a participatory process involving local residents and organisations to ensure social acceptance The outcomes of the implementation process are different in each block as each neighbourhood has its own preferred approach characteristics economic activity density and so on245
The superblocks initiative is simple but its effects have been transformative The project is low-cost and relatively quick to carry out with no physical changes
241 See Bausells (2016)242 See PublicSpace (2018)243 See Bloomberg (2017)244 See Serena (2018)245 See Bausells (2016)
Case studies - land use
116246 See C40 Cities (2016b)247 Ibid 248 See Publicspace (2018)249 See C40 Cities (2016b)250 See Mueller (2020)
required and with a strong dialogue between city authorities and residents being the major driver of success
Results and lessons learned
bull Building on the initial experiment in Poblenou the municipality has now created superblocks in five pilot neighbourhoods with plans for many more Through these projects the city hopes to achieve emission reductions of between 20 per cent and 75 per cent
bull The superblocks initiative is part of the cityrsquos Urban Mobility Plan which aims to decrease traffic by 21 per cent while extending car-free spaces and providing 300 km of bicycle lanes In the Poblenou superblock vehicle numbers on the inner streets have fallen by 58 per cent while traffic around the periphery has increased by only 26 per cent More than 300 benches have been installed and 212 new trees planted
bull The project has increased the amount of green space by 1 m2 per capita reduced the heat island effect and noise pollution and improved air quality
bull The superblocks provide car-free places that are safer and more enjoyable for children and older people These areas also foster social interaction sports and cultural activities and expand opportunities for small businesses
bull Quality of life has improved in the city making Barcelona a more attractive destination for business and tourism
bull The initiative is scalable and could be applied to new developments as well as to regeneration projects
bull A recent study found that if all 503 of the proposed superblocks were implemented almost 700 premature deaths could be prevented annually (mainly due to reduced pollution levels) and life expectancy could be increased by almost 200 days per resident These outcomes could result in economic savings of euro17 billion a year
The experience of superblocks in Barcelona has shown that initial opposition to such projects must be expected but can be overcome through strong engagement and communication tailored to the specific circumstances of a neighbourhood
Links to similar initiativesAmman 2025 from master plan to strategic initiative Transformation of Tiranarsquos New Bazaar Beijing low-carbon zoning policies
Case studies - land use
117
Snapshot
bull Location Roubaix France
bull Population Small ndash 96000 (2015)
bull Economy Service economy
bull Policy area Land use
bull Policy options Promotion of mixed-used areas and transit-oriented development promotion of community-based land use planning
bull Financial capacity Strong
bull Administrative capacity Strong
Context and policy overview Together with the Lorraine region Nord-Pas de Calais was a cradle of the industrial revolution in France While coal mining and steel industries developed in the region Roubaix ndash one of the four major cities in Nord-Pas de Calais ndash built its industrial prosperity on textile manufacturing However in the early 1970s the
textile industry fell into crisis and 50000 jobs were lost in Roubaix and the surrounding areas251
The decline of the cityrsquos textile industry created a host of interlinking challenges including unemployment low skill levels urban decay housing market collapse poverty inequality violence and racism252 As a way to tackle these issues and attract the middle classes back to the city Roubaix identified a series of strategic objectives253
bull recovery from deindustrialisation by encouraging the growth of new sectors
bull revitalisation of the rundown city centre and rebuilding of a retail offer
bull addressing the need for better more affordable housing for residents and attracting new residents and
bull ensuring that investment and economic development benefit existing residents especially by providing training and new employment opportunities
Urban regeneration and renewal Roubaix France
The city of Roubaix has successfully followed a market-led approach to urban renewal which integrates issues such as social inclusion housing renewal and economic and cultural development
251 See Cadell et al (2008)252 See Rousseau (2009)253 See Colomb (2007)
Case studies - land use
118
Reneacute Vandierendonck was elected mayor of Roubaix in 1994 with a political mandate to revitalise the city centre The mayorrsquos strategy was implemented in a changing political and economic context Lille Metropolitan Authority (LMCU) ndash an intercommunal cooperative body with investment-related responsibilities transferred from its 87 individual member municipalities ndash started to play a strategic role in developing a vision for economic development and urban regeneration LMCU also initiated a series of long-term agreements with the mayors of the regionrsquos four big cities which led to the emergence of a consensus and a grouping together of budgets254
The resulting strategy Ville Renouveleacutee (ldquorenewed cityrdquo) includes a spatial plan for metropolitan Roubaix and aims to reverse urban decline and create value for residents and investors The concept became one of the key objectives of the 1997 strategic plan for the Lille metropolitan region and also informed French national urban policy255
ImplementationRegeneration of the city centre was planned across five key areas256
bull creating secure and successful public spaces which enhance the architectural legacy of Roubaix
bull improving the retail offer and establishing the city centre as a commercial destination
bull designating zones including enterprise zones to channel economic development into strategic areas
bull launching a cultural strategy to promote Roubaix as a cultural destination
bull renewing the cityrsquos housing stock
Improvements to the public realm were designed to entice investment businesses and shoppers to the
city centre These actions included (i) regenerating the main central square and its civic buildings (ii) regenerating public spaces and streets while respecting the local architectural and industrial heritage (iii) regenerating the Canal de Roubaix (iv) promoting the painting of faccedilades in bright colours to break up the grey industrial image of the city and (v) improving safety for instance through additional policing and CCTV257
To improve the city centrersquos retail offer the city council established a small core of commercial opportunities through improvements to the streetscape design improvements in public transport interchanges for the metro tram and bus financial and technical support such as tax exemptions for people interested in opening retail shops and grant to support the refurbishment of buildings Two large retail outlet centres were also opened on the outskirts of the city The designation of Roubaix as a Zone Franche Urbaine (tax-exempt enterprise zone) in 1997 brought tax-break incentives and helped promote business and job creation These measures helped to spread the benefits of the renewal programme across the city and its communities258
Barriers and critical success factorsKey to the success of Roubaixrsquos regeneration was the strong city-regional relationship in which political cooperation developed in the early 1990s Beginning in 1994 with the mayoral tenure of Reneacute Vandierendonck collaboration increased between the city and the LMCU The regeneration benefited from outstanding civic leadership and vision both at the city-regional level and at the level of the city of Roubaix itself The sharing of budgets between the regions also facilitated more collaborative opportunities The regeneration process in Roubaix was also heavily influenced by the fact that the various urban social and economic regeneration elements were carried out in parallel within a concentrated period of change It was the synergy between these elements that made the process a real success259
254 See Cadell et al (2008)255 See Colomb (2007)256 Ibid257 Ibid258 Ibid259 See Colomb (2007)
Case studies - land use
119
Investment in the public realm housing and communities as well as job creation and business incentives also increased the desirability of the city and attracted people to return there to live and work The cityrsquos cultural policy also helped to enhance Roubaixrsquos image enabling the celebration of its cultural and social history while creating a dynamic modern environment and attracting younger wealthier people and even tourists
Resource implicationsRoubaix has been used as an experimental area for all urban policy initiatives taken by successive local governments across the country since the birth of urban policy in the early 1980s This has created a relatively complex combination of schemes and funding but has also meant that the city has used all possible programmes While the city had a weak tax base it was able to tap into substantial funding from the central government and the LMCU One of the challenges for the Lille city-region has been leveraging funding from many different levels (for instance EU national and local levels) to finance a clear and coherent approach to metropolitan regeneration
Results and lessons learnedThe strategy has brought meaningful improvements in the public realm to central Roubaix from quality infrastructure such as housing unified paving street furniture cleanliness and coloured facades to jobs skills and business opportunities The middle classes have returned to the city the property market has recovered and the cityrsquos image has been transformed
Roubaix now has a standardised system to conserve and refurbish industrial buildings that date from the industrial revolution Alongside the improved public realm these initiatives have supported the re-emergence of retailing in the town centre
Today Roubaix has many important cultural amenities including La Piscine museum which saw the cityrsquos old public swimming pool converted into
an internationally known cultural venue thanks to an innovative regeneration programme260
Local leaders have also crafted a strategy for cultural regeneration against great odds The Ministry of Culture awarded Roubaix the title of Ville drsquoArt et drsquoHistoire only one of 59 cities to earn the title Similarly a range of factors including a better nationwide economic climate the impact of the tax-exempt zone and improved links between economic development and local employment has cut unemployment from 33 per cent in the 1980s to 22 per cent in 2005261
Furthermore people have moved to Roubaix and invested there As central Lille became more expensive Roubaixrsquos improved city centre became more appealing not least thanks to its proximity ndash only 20 minutes away by metro train following the completion of a new line The many renewal strategies featured in the programme have also benefited vulnerable groups in particular in terms of local employment opportunities262
Links to similar initiativesRotterdam urban regeneration Gothenburg urban regeneration Christchurch urban regeneration
260 See Guardian (2008)261 See Colomb (2007)262 See Cadell et al (2008)
Case studies - land use
120
Snapshot
bull Country Toronto Canada
bull Population Large ndash 29 million (2017)
bull Policy area Land use
bull Policy option Development of compact cities
bull Financial capacity Strong
bull Administrative capacity Strong
Context and policy overviewA strong development market in Toronto has led to a spate of high-rise construction especially residential condominiums and office buildings With the establishment of a protected greenbelt area rising land values a buoyant real estate market and population and employment growth developers have a strong incentive to build projects that are taller and
denser than those preferred by local government and city residents
To address this issue bonusing in relation to height and density has become an important tool in Torontorsquos urban planning over the past twenty years According to Section 37 of the Ontario Planning Act of 1990 developers are allowed to propose a new building larger than would be permitted by existing land controls in exchange for the delivery of community benefits263
The provisions of Section 37 usually apply to developments if they have a gross floor area exceeding 10000 m2 and if the applicant proposes to exceed the permitted density by 1500 m2 or more andor increase the permitted height of the building264
ImplementationCity leaders and planners use density bonuses to entice private developers to create public benefits
Density bonusing and development Toronto Canada
Toronto has applied density bonusing to secure community benefits in exchange for approval to build taller and denser buildings Parking improvements public art and funds for new daycare facilities and affordable housing are among these benefits
263 See Pantale (2014)264 Ibid
Case studies - land use
121
265 See City of Toronto (nd)266 Ibid267 See Moore (2013)268 See Lehrer and Pantalone (2018)269 See RE Millward amp Associates Ltd (2013)270 See Moore (2013)
This has been particularly useful in situations where development will create additional demand on infrastructure or the public realm and where there is a lack of public resources to make improvements Torontorsquos regular use of Section 37 has provided funds for open spaces public art affordable housing and childcare facilities265
Developers and city planning staff negotiate Section 37 benefits on a case-by-case basis Once the planning team has completed its review the application for development goes for consideration by the community council This period includes public consultation and the opportunity to formally register comments about the development and related Section 37 benefits If approved by the community council the application goes to the city council to render a final decision Once approved the Section 37 benefits are ldquosecuredrdquo and the city enters into a formal agreement with the applicant266
Given that restrictive frameworks may hinder development and community-building potential in a city the negotiation process under Section 37 has remained flexible in order to react to changing market demand and community needs
Developers can provide the Section 37 benefits through in-kind or cash-in-lieu methods The city has discretion regarding how to spend cash-in-lieu contributions Toronto secured around 850 Section 37 benefits in the period from 2009 to 2014 Some 55 per cent of these were in-kind contributions and 45 per cent were cash in lieu
Barriers and critical success factorsIn contrast to many other tools of municipal finance Section 37 benefits bring benefits primarily to the area affected by the development As a result the ldquodensity for benefit agreementsrdquo (DBAs) are heavily concentrated in the parts of Toronto that have had substantial development activity especially the downtown core Hence the number of benefits has been disproportionately high in wards with the most
DBAs which has led to an uneven distribution of policy outcomes
Since its inception the bonusing policy has experienced controversy and criticism from various actors in Toronto Points of criticism have included the allegedly inconsistent application of the policy disagreement over how funds should be spent the tendency to engender poor planning decisions and a negotiation process that has little public oversight267 Critics also note that the community benefits that the policy seeks have not been achieved in proportion to the developments created and their associated externalities268
To tackle these points the city council adopted a protocol for negotiating Section 37 community benefits through which it encouraged consultation with a variety of stakeholders during the assessment of community benefits Consultations would be held with elected representatives city council staff and the local community and decisions would be supported by evidence of community needs from previous studies269
Results and lessons learned270
bull Over a 15-year period Section 37 agreements generated more than euro220 million in benefits for Toronto
bull The range of benefits secured through the Section 37 process varied widely and included community facilities parks road improvement schemes public transport projects and arts and cultural facilities
Links to similar initiativesLondon density development Vancouver density bonusing New York inclusionary zoning
Case studies - energy and buildings
122
Energy manager obligation and white certificate scheme Italy
Since 2005 Italy has operated a market-based incentive scheme for energy efficiency interventions This ldquowhite certificaterdquo system has delivered substantial savings in the use of electricity and heat
Snapshot
bull Location Italy (nationwide)
bull Population 592 million (2019)
bull Policy area Energy and buildings
bull Policy options Industrial regulations and information to report on energy performance fiscal incentives for efficiency related to machinery and materials in industries
bull Financial capacity Limited
bull Administrative capacity Strengthening
Context and policy overview271
In the 1990s the industrial sector was responsible for approximately one-third of Italyrsquos energy consumption Initially the government responded by introducing rules requiring certain industrial firms and public sector organisations to nominate an energy manager
For industrial companies this rule applied if their energy consumption exceeded 10000 tonnes of oil equivalent (toe) per year and for public sector organisations the threshold was set at more than 1000 toe per year
While the new energy managers were effective in raising awareness of potential savings from energy efficiency industries and public bodies were not required to act in response to this newfound awareness The situation changed in 2005 when Italy introduced a market mechanism for energy efficiency investment called the Titoli di Efficienza Energetica (TEEs or ldquowhite certificatesrdquo) The TEE scheme obliged electricity and gas utilities with more than 50000 customers to reach specific targets in terms of primary energy savings The utilities could choose to deliver energy efficiency measures themselves or to purchase white certificates earned by other scheme participants as a result of energy efficiency savings The pool of scheme participants includes all those organisations that had been required to appoint an energy manager under the earlier scheme as well as other organisations with energy management systems in place This arrangement created a larger
271 See Thomas et al (2014)
Case studies - energy and buildings
123
pool of certificate ldquosellersrdquo which the utility firms could access to reduce the overall cost of their compliance It also ensured that energy managers with the required know-how were in place in every participating organisation272
The scheme involves a 12-month baseline monitoring period prior to the proposal of eligible measures and a 12-month post-completion monitoring and verification period before a firm or organisation submits an application for a TEE certificate
Implementation and challenges273
At first the scheme had a price cap of euro100 per TEE and more than 80 per cent of the energy efficiency savings were in the residential sector274 In 2012 the government introduced a durability coefficient ldquotaurdquo that allowed up to 336 TEEs to be earned per toe saved Subsequently the euro100 per TEE cap was removed and the scheme was able to leverage greater investment275
In 2013 Italy introduced a measure that prevented technologies that had previously benefited from other national support mechanisms from receiving support under the TEE scheme In 2017 the durability coefficient was abolished as it incentivised projects with a long technical life and other incentives were introduced The durability cofficient was replaced by a rule allowing scheme participants to front-load the attributable savings to the first half of the projectrsquos useful lifecycle276
In 2018 further modifications were made to increase the supply of certificates and to address concerns about fraud and the complexity of the scheme These modifications included changes to the assessment of additionality a two-year increase in the designated useful life of measures277 an expansion of the project eligibility criteria the creation of new pre-approved standardised solutions the flexibility to spread compliance across scheme years and the setting of a new definition of cumulativeness278
Barriers and critical success factorsTo increase overall energy efficiency savings and diversify measures away from the residential sector (which dominated the early years of the scheme) incentives were increased for industrial sector investments These included awarding a higher ratio of certificates to industry and removing the price cap for industrial sector savings which had resulted in higher market prices (euro427 per TEE in February 2018 for instance)279
272 Ibid273 See Energy Systems Catapult (2018) 274 See Di Santo (2018)275 See Qualenergiait (2017)276 See Gianni-Origoni amp Grippo-Cappelli Partners (2017)277 Ibid278 See FIRE Federazione Italiana per luso Razionale dellEnergia (2018)279 See Energy Systems Catapult (2018)
Case studies - energy and buildings
124
280 Ibid281 See Di Santo et al (2018) 282 Ibid283 See Di Santo et al (2018)284 See Energy Systems Catapult (2018)285 Ibid286 See Di Santo et al (2018)
Industrial sector energy efficiency was also supported by the EU Emissions Trading Scheme (ETS) but under this scheme the carbon price was not sufficient to drive significant investment in the sector However the white certificate scheme was able to supplement the EU ETS and achieve higher rates of investment and savings280 Regular modifications to the scheme were essential to its continuing reliability and effectiveness although these have at times created uncertainty and complexity281
Extensive data collection by the public Italian energy services operator GSE has helped to create a valuable database for assessment and for comparison with other schemes Furthermore strict monitoring and verification procedures have helped to identify and reduce fraud in the system
Defining the appropriate target that parties are required to meet is essential to the attractiveness and effectiveness of the scheme The wrong target could create low prices and make the scheme less attractive to voluntary members or create high prices for end-users and the potential for fraud282
Outcomes and impacts
bull The scheme has resulted in cumulative additional energy savings of 256 million toe and annual savings of around 2 million additional toe and 6 million tonnes of CO2283
bull Certifications under the scheme were initially dominated by the residential sector which accounted for 70 per cent of certified projects in the period 2011-12 By 2017 the industrial sector represented 54 per cent of projects due to the increase in
industry-focused incentives while the household sectorrsquos share fell to around 14 per cent284
bull In total 5807831 TEEs were certified by 2017 with total primary energy savings calculated at 192 Mtoe Most of those savings (55 per cent) came from cuts in primary energy use (natural gas) and a further 26 per cent from reduced electricity consumption285
Additional benefits of the scheme include the creation of around 11000 full-time equivalent direct and indirect jobs as well as a significant increase in knowledge about good practices in industrial energy efficiency across the energy industry286
Links to similar initiativesIrish large industry energy network Tokyo cap-and-trade programme White certificates in France
Case studies - energy and buildings
125
Energy performance contracting Berlin Germany
The Berlin Energy Agency initiated energy saving partnerships in 1996 to implement energy performance contracting and improve energy efficiency in public buildings using the established German ESCO market
Snapshot
bull Location Berlin Germany
bull Population Large ndash 35 million (2016)
bull Policy area Energy
bull Policy options Improved energy performance for public buildings policies and support for energy performance contracts
bull Financial capacity Strong
bull Administrative capacity Strong
Context and policy overviewIn the early 1990s the Federal State of Berlin faced a tight budget and a lack of financial resources Energy-related costs were high (approximately euro255 million per year) and there was potential for average savings of around 30 per cent287
In 1994 the Berlin Senatersquos Department for Health Environment and Consumer Protection set a CO2
emissions reduction target by 2010 it aimed to decrease CO2 emissions across all sectors by 25 per cent relative to the levels seen in 1990 Moreover the Department introduced an updated Climate Protection Concept which set a CO2 emissions reduction target of 40 per cent by 2020 relative to the 1990 levels
In this context the Berlin Energy Saving Partnership approach was initiated in 1996 by the Berlin Energy Agency (BEA) and the Federal State of Berlin The approach provides a framework for the project management of retrofits and tender preparation for renovation works guaranteeing energy consumption reductions that are based on energy performance contracting (EPC)288
BEA is a public-private partnership between the government of the federal state of Berlin the development bank KfW Bankengruppe and private stakeholders BEA acts as the independent project manager facilitating and managing the process from baseline to contract negotiation289
287 See Berliner Energieagentur (2006) 288 Ibid289 See Citynvest (2015)
Case studies - energy and buildings
126
ImplementationThe necessary investments are made by a private energy service company (ESCO) the contractor and refinanced by the energy costs saved The contracting authority may combine a selection of its building stock into a so-called ldquobuilding poolrdquo which can be comprised of town halls schools swimming pools or administrative and service buildings BEA plays the role of project aggregator bringing together a number of buildings from four to as many as 150 which are then classified as a pool via an EPC tender This consolidation of buildings into packages encourages interest from multiple competent ESCOs and ensures good levels of competition and expertise
Since 1996 BEA has successfully launched and supervised 26 energy saving partnerships covering more than 1400 public buildings and more than 500 private properties in Berlin alone Contractors have so far invested in excess of euro50 million in energy retrofits Energy saving measures have included the renewal and optimisation of building energy and ventilation control systems the replacement of gas boilers and the installation of combined heat and power systems The Berlin Energy Agency accompanies energy saving partnerships from the conception of a project to the realisation of the energy performance contract and is also responsible for the monitoring process290
The energy contracting model is well established in Germany The public sector remains an important client group for EPC with significant ongoing potential for projects The overall market size for energy contracting has been estimated at more than euro4 billion with energy performance contracting representing around 15 per cent of this market The general suitability of public buildings is high due to stable patterns of use openness to longer contract durations (more than 10 years) and extensive experience of EPC in the German market At the same time the percentage of EPC projects in the private sector is growing with a strong focus on hospitals and healthcare but also significant activity in the services sector and industry EPC is less common in the residential sector due to a number of barriers such as the lack of a legislative framework the complexity of tenure and uncertainty with regard to estimating energy reductions291
Barriers and critical success factorsGermany has enjoyed a high level of political commitment to ESCO and energy efficiency projects The country has one of the most mature ESCO markets in Europe However the general legal framework for energy performance contracting in residential buildings is currently not very supportive292
290 See Berliner Energieagentur (nd b)291 See Boza-Kiss et al (2017)292 See Berliner Energieagentur (2019)
Case studies - energy and buildings
127293 See GEF and UNDP (2010) 294 See Berliner Energieagentur (2006)295 See Citynvest (2015)296 Ibid
Financing for projects is available including risk mitigation instruments which are backed by appropriate due diligence procedures and standardised processes With 50 per cent funding from the Federal State of Berlin BEA is able to make financially attractive offers to property owners BEA also helps to raise awareness among customers ESCOs energy auditors and so on
Moreover the energy saving partnership is not limited to large building complexes The grouping of smaller projects into pools means that transaction costs are reduced293
Berlin has considered developing an Energy Saving Partnership Plus concept aiming to extend partnerships to include building renovation and insulation measures such as heat insulation and window replacement Furthermore Berlinrsquos Energy Saving Partnership model has been transferred to other local authorities due to its low impact on the public balance sheet and its moderate staffing requirements294
Results and lessons learnedThe Energy Saving Partnership has proven to be a successful model for reducing energy consumption and improving efficiency in the cityrsquos public buildings Outcomes include the following
bull Over the first fifteen years of the programme the average annual investment was euro35 million which supported energy efficiency measures in an average of nearly 100 buildings per year295
bull The scheme delivered an average of 26 per cent savings in energy costs for building owners with some individual schemes achieving savings as high as 40 per cent296
The Berlin experience demonstrates the potential of energy performance contracting to delivery substantial energy savings However it also highlights the challenges faced by municipalities seeking to deliver energy efficiency investments without additional financial support from a higher-tier authority
Links to similar initiativesStuttgart ESCO market Czech Republic ESCO market Slovenia ESCO market European ESCO market
Case studies - energy and buildings
128
Snapshot
bull Location Seoul South Korea
bull Population Large ndash 99 million (2018)
bull Policy area Energy and buildings
bull Policy options Policies promoting renewable electricity generation improved building energy codes and labelling financial incentives or financial support schemes for green investments
bull Financial capacity Strong
bull Administrative capacity Strong
Context and policy overviewFollowing the Fukushima nuclear disaster of 2011 the Seoul Metropolitan Government (SMG) launched a two-stage ldquoOne Less Nuclear Power Plantrdquo initiative in 2012 with the aim of reducing energy consumption and increasing renewable energy production Through
the first phase which ran from 2012 to 2014 SMG reduced energy demand by 2 million tonnes of oil equivalent (toe) corresponding to the annual generation capacity of one nuclear plant
The second stage of the initiative targeted the transition of around 4 million toe of energy to renewables As part of these efforts in November 2017 SMG developed the 2022 Solar City Seoul plan to accelerate solar installations
Through this plan SMG has strived to expand the citywide deployment of solar energy units on public buildings By 2022 it hopes that solar panels will generate a total of 243 MW across all suitable public buildings and land in Seoul297 In addition to the work on municipal buildings SMG plans to expand the residential solar market by adding 551 MW of solar capacity to one million households including 540000 apartment balconies 90000 rental homes and 370000 buildings Other initiatives such as solar landmarks and smart energy districts are to increase the target to 1 GW298
Solar City Seoul Seoul South Korea
Seoulrsquos metropolitan government plans to deploy 1 GW of solar photovoltaic power for residential and municipal buildings By 2022 every public building and one million homes in the city are set to be solar-powered thanks to the Solar City Seoul project
297 See The Korea Times (2018)298 See Seoul Metropolitan Government (2017)
Case studies - energy and buildings
129
ImplementationSMG provides a number of incentives to households to facilitate the uptake of solar energy For instance it was the first municipality in South Korea to pay a city-level subsidy for small solar power plants with an output of 50 kW or less since the nationwide feed-in tariff was abolished in 2011 due to the related fiscal burden Subsidies are in place for the installation of mini-solar panels reducing the upfront cost by 80 per cent In addition SMG launched the Energy Self-reliant Village programme in 2012 attempting to inspire a shared vision of energy self-sufficiency in urban and rurual communities
Furthermore in 2015 SMG set up a government-backed fund called the Solar Power Generation Citizensrsquo Fund for solar projects Residents of Seoul can subscribe to the fund to earn a guaranteed annual return of 4 per cent Land rental concessions are also available to solar power cooperatives installing photovoltaic (PV) systems in unused spaces
that are leased from SMG at low rental rates299 In addition since 2018 newly built public apartments have been required to install a mini PV facility and existing apartments have continued to receive an installation subsidy
In order to promote the concepts developed for Seoul SMG plans to create solar energy landmarks and special solar energy districts that it can market as tourist attractions SMG also plans to transform Magok a western neighbourhood of the city into a smart energy district by promoting an urban energy paradigm in cooperation with Korearsquos major energy firms Moreover SMG has launched various information and training campaigns to promote solar energy
bull The Sunshine City Seoul campaign was developed during the first stage of the One Less Nuclear Plant programme
bull The Seoul Solar Map was developed to show the potential capacity for solar power in buildings and houses
bull Seoul organised school campaigns in which students were selected to be leaders in energy-saving and volunteering activities
bull The city established the Seoul Energy Dream Centre that would achieve 100 per cent energy self-sufficiency and serve as a learning centre for students and other residents
bull The Seoul Solar Expo which took place in August 2018 and was free to attend invited solar energy companies to exhibit and held a solar design competition along with various hands-on events300
Lastly in 2018 SMG set up support centres called Seoul Solar Centres which provide one-stop services for installation and maintenance Free consulting services will be provided as well as a School for Energy Start-ups which will provide training for people who want to set up a solar energy business301
299 See LEGCO (2017) 300 See Seoul Metropolitan Government (2018b)301 See Seoul Metropolitan Government (2018a)
Case studies - energy and buildings
130
Barriers and critical success factorsVarious factors have made the solar city plan a success including the following
bull The topping up and subsequent replacement of national subsidies with alternative sources of finance (such as subsidies and grants rental concessions for cooperatives) have incentivised the deployment of solar plants in residential buildings
bull The identification of sites suitable for solar plants such as public landmarks parking lots villages and districts in cooperation with energy companies has promoted Seoul as a role model for other cities and supported tourism
bull SMG has introduced solar mandates for new multiple-unit dwellings and commercial buildings helping to accelerate the deployment of solar panels
bull SMG has visibly demonstrated the cityrsquos commitment to renewable energy It has provided information for residents through a range of mechanisms such as school programmes expos design competitions support centres and training for start-ups all of which have supported residential solar PV installations
Results and lessons learnedCurrently 127 public buildings in Seoul have a total installed capacity of 38 MW 17 infrastructural facilities have a combined capacity of 38 MW 43 schools have a joint capacity of 18 MW and 12 MW of capacity has been installed on public parking lots In addition as of September 2018 a total of 161000 households had installed the PV facilities thereby generating a total of 210 MW annually
Including the new supply of 52 MW of solar power installed in 2018 and a total installation capacity of 210 MW the Solar City Seoul project has generated 237805 MWh of annual energy It has also reduced
greenhouse gases by 109 tonnes of CO2 and fine particulate matter by 276 tonnes This means that by the end of 2022 the cityrsquos capacity will need to be raised by a further 760 MW approximately in order to meet the projectrsquos 1 GW target
In 2019 Seoul was selected as the winner in the renewable energy category of the annual C40 Cities Bloomberg Philanthropies Awards in particular due to its efforts to become a global solar city
Links to similar initiativesToronto coal phase-out Porto Alegre local renewables Bristol smart energy policy
Case studies - energy and buildings
131
Snapshot
bull Location Tokyo Japan
bull Population Large ndash 135 million (2015)
bull Economy Service economy
bull Policy area Energy and buildings
bull Policy option Policies and support for energy performance contracts
bull Financial capacity Strong
bull Administrative capacity Strong
Context and policy overview302
Commercial and residential buildings in Tokyo accounted for more than 72 per cent of the cityrsquos CO2 emissions in 2013 This was primarily as a result of the high number of small to medium-sized commercial and industrial facilities (around 660000) that are concentrated in the city
The Tokyo Metropolitan Government (TMG) has set an interim GHG emissions reduction target of 30 per cent by 2030 which has subsequently been accelerated in the cityrsquos Environmental Masterplan to 38 per cent by 2030
Against this backdrop the programme of Carbon Reduction Reporting for Small and Medium Entities (CRR) was launched in 2010 with two core objectives
bull encouraging the owners and tenants of small to medium-sized commercial and industrial facilities to monitor their annual CO2 emissions
bull providing policymakers with data on the building stock and providing this back to building owners and the market
These goals are pursued by mandating for facility owners the submission of an annual report outlining CO2 emissions for the previous fiscal year Additional qualitative information on planned and implemented emissions reduction measures must also be submitted
Carbon reduction reporting programme Tokyo Japan
Tokyorsquos carbon reduction reporting programme mandates the reporting of CO2 emissions for small and medium-sized facilities which account for 60 per cent of total CO2 emissions in the cityrsquos industrial and commercial sectors
302 See C40 Cities (2017)
Case studies - energy and buildings
132
There is no single GHG emissions reduction target for the programme Instead reporting entities are encouraged to set individual emissions reduction targets Reports are publicly disclosed on the TMG website
The CRR contains both a mandatory and a voluntary component Reporting occurs as a regulatory obligation and as a voluntary measure to monitor CO2 emissions and allows facility owners to compare their performance to that of their peers
Implementation The CRR was launched in 2010 The scheme is based on the Tokyo Carbon Reduction Reporting Programme for existing large facilities which ran from 2002 to 2005 That programme was superseded by the mandatory cap-and-trade system also launched in 2010 The core metric by which facilities monitor and report their annual CO2 emissions is carbon intensity (kgCO2msup2)303
The CRR seeks to target owners of the roughly 660000 facilities in the metropolitan area For these facilities the threshold for mandatory reporting has been set at between 30 litres and 15 million litres of crude oil equivalent The reporting requirement also applies to businesses that own or operate multiple facilities with a total consumption exceeding 3000 million litres of crude oil equivalent Facilities with a consumption higher than this level are expected to participate in the citywide cap-and-trade programme304
In 2012 a low-carbon benchmark component was added after it became apparent that merely reporting would not be sufficient to motivate facility owners and tenants to reduce their energy consumption Benchmarks allow owners to determine how their facility currently performs relative to the mean performance of other buildings of the same type Later a Carbon Report Card initiative was added to enable prospective tenants to compare the energy and CO2 emissions performance of buildings305
The CRR provides a variety of incentives to both encourage participation in the programme and spur implementation of retrofitting measures
bull A programme participation certificate ndash the so-called PR Sheet ndash has proved to be a major incentive for voluntary participation
bull Small and medium-sized leased buildings that report consistently for more than three years and perform better than the average CO2 intensity benchmarks can earn the label ldquoLow Carbon Model Buildingrdquo
bull Advice and training on low-energy strategies is provided through free energy audits in-company training sessions with expert trainers and industry-specific courses on energy saving measures
bull Subsidies for energy saving equipment are available including a green leasing scheme and tax incentives for energy saving initiatives306
Improvements in emission reductions have not been uniformly significant across all building types For instance schools universities and entertainment venues have achieved significantly lower reductions
The programme has been notable in attracting many voluntary submissions This has improved the validity of the resulting industry benchmarks Approximately 93 per cent of CO2 emissions in reporting facilities are related to electricity use hence most emission reductions can be attributed to a decrease in electricity consumption Emission reductions observed over the period 2010-13 are largely attributable to the rationing of electricity caused by the closure of the Fukushima power plant However emissions have not rebounded since the full restoration of power supplies It should be noted that the increase in the carbon intensity of electricity has been largely due to the shift from nuclear to gas and coal307
303 See Nishida (2013)304 See Tokyo Metropolitan Government (2018)305 Ibid306 Ibid307 See C40 Cities (2017)
Case studies - energy and buildings
133308 Ibid 309 Ibid 310 See C40 Cities (2017)311 Ibid
The CRR used multiple strategies to increase the educational value of data collected through annual reports and thus to motivate enterprises to pursue improved energy efficiency308
bull The low-carbon benchmarks provide building owners and tenants with an overview of how their facility is performing compared to industry averages
bull The Carbon Report Card aims to encourage facility owners to improve their annual benchmark performance and to use report cards as green building labels
bull A series of tailored energy efficiency handbooks were provided to key industry leaders and aimed at facility supervisors in 27 types of business
The TMG has created several partnerships with key industry stakeholders to enable the recruitment of reporting institutions It has also reached out to corporate real estate agencies to secure their cooperation in raising tenantsrsquo awareness of CRR
Data verification is carried out by TMG including checks on previous energy consumption levels and CO2 emission reports (to check for anomalies year on year) Reporting organisations are contacted when errors are identified and data problems are rectified Additional verification is also carried out before the reports are made publicly available309
Barriers and critical success factorsLandlords have faced challenges in obtaining the relevant energy data from tenants to comply with reporting requirements This was addressed by a rule change allowing the publication of only CO2 emissions intensity (not of actual consumption) and allowing building owners to provide estimates where actual data was not readily available
TMG officials were unable to achieve widespread disclosure of energy consumption data due to industry
resistance Public disclosure of energy consumption figures would deliver a more positive and meaningful message than data on CO2 emissions
Despite the strategies taken to increase awareness and participation a 2015 survey of 1149 small and medium-sized enteprises found very low levels of awareness about some of the additional initiatives related to the CRR Officials have also encountered challenges in engaging corporate tenants with energy efficiency issues In addition many recommendations provided in free energy audits are not implemented due to the splitting of incentives between owners and tenants TMG officials have collaborated with real estate agencies to conduct tenant seminars on CRR participation and effective energy efficiency measures310
Results and lessons learned311
bull The number of organisations participating in the voluntary reporting scheme grew by 60 per cent over the five years from 2010 to 2015
bull Over a five-year period the companies reporting achieved an average CO2 emissions reduction of 13 per cent and cut energy use by 18 per cent
bull The reports provide a valuable database of energy efficiency measures being taken by SMEs For example they identify high penetration levels in terms of low-energy lighting water saving devices and cooling-loss reduction for refrigerated food displays Reports cover both physical measures and behaviour change initiatives
Links to similar initiativesTokyo cap-and-trade programme Carbon disclosure project
Case studies - energy and buildings
134
Snapshot
bull Location Tartu Estonia
bull Population Small ndash 101000 (2000)
bull Economy Industrial economy
bull Policy area Energy and buildings
bull Policy option Decarbonisation of district heating supply
bull Financial capacity Strong
bull Administrative capacity Strong
Context and policy overviewEstoniarsquos energy system is dominated by the use of shale oil for electricity while heating is provided by a mix of sources including local biomass and imported fossil fuels312 Meanwhile around 45 per cent of heating demand is met through district heating networks313
The country is committed to reducing carbon emissions through its adopted National Energy and Climate Plan 2030 The plan includes a commitment to reduce carbon emissions by 70 per cent by 2030 relative to a 1990 baseline and to ensure that renewables account for 42 per cent of final energy consumption314 Meanwhile the National Development Plan of the Energy Sector sets a target for 80 per cent of heat to be derived from renewable sources by 2030315
The city of Tartu is served by a fity-year old district heating network and a five-year old district cooling network The privatised network serves around 75000 customers and is owned and operated by Fortum Tartu The city and the network operator have carried out multiple innovations to improve energy efficiency air quality carbon emissions and customer satisfaction316
ImplementationTartursquos district heating system was established in 1967 and owned first by the state and then by the municipality Originally powered by gas and oil the network was converted in 1995 to use biomass
District heating and cooling Tartu Estonia
Tartu Estoniarsquos second-largest city has managed to upgrade its old district heating network and turn it into a world-class system that uses local renewable energy sources
312 See Groszlige et al (2015)313 See Government of Estonia (2017)314 Ibid 315 Ibid316 See Raud (2019)
Case studies - energy and buildings
135
and peat with financing from the World Bank and the EBRD In 2000 the system was privatised and then acquired by Fortum Tartu in 2004 The privatisation provided the network with access to much-needed capital to carry out a systemwide renewal and to support network expansion317
The municipal government has supported the district heating network through its planning policies and through securing funding for smart city innovation The first urban development master plan for Tartu was established in 1999 and focused on sustainable development It included an integrated district heating zone to improve air quality and customer satisfaction levels The city council raised awareness in support of the district heating system through public campaigns The plan mandated that all new and renovated buildings in the designated districted heating zones should connect to the heating network unless their heat consumption was less than 40 kWhmsup2 per year Meanwhile a smart city project financed by Horizon 2020 helped to target investment to retrofit energy-inefficient homes and connect them to the heating network318
Fortum Tartu has implemented a number of business and operational innovations to sustain the performance and financial stability of the company These include319
bull vertical integration and diversification allowing the firm to become a biomass fuel producer and supplier
bull development of a new biomass combined-heat-and-power plant
bull growth through the expansion and acquisition of a nearby heating network operator
bull development of a low-carbon district cooling network partially supplied from the Emajotildegi River which runs through the centre of the city
Most recently Fortum Tartu has participated in a low-temperature innovation pilot which has demonstrated the potential to reduce system flow temperatures from a peak of 105degC to as low as 60degC achieving a significant reduction in losses and creating the potential to capture low-grade heat from industrial and other local sources of waste heat320
Barriers and critical success factorsA number of success factors have enabled Tartu to develop and sustain its district heating and cooling system321
317 See Galindo Fernandez et al (2015)318 Ibid 319 Ibid 320 See Raud (2020)321 See Galindo Fernandez et al (2015)
Case studies - energy and buildings
136
322 See ERRee (2020)323 See Galindo Fernandez et al (2015)
bull Privatisation has enabled the city to access investment capital and international know-how to renew and expand its district heating network and diversify operations to include district cooling and a fuel supply business
bull A strong national policy framework for district heating clarifies roles for effective operations while pricing market regulations enable the operator to maintain a financially sustainable business
bull The local policy framework integrates development planning and energy planning to encourage higher density development and to connect new developments to the heating network
A culture of partnership and innovation has characterised the relationship with the city supported by multiple EU investment and research programmes This culture will be critical to supporting the cityrsquos recently announced goal of reducing its carbon emissions by 40 per cent by 2030 relative to 2010 and of becoming carbon neutral by 2050322
Results and lessons learned
bull The district heating network supplies around 50 per cent of the cityrsquos buildings and 75 per cent of its residents
bull The price of district heating is lower than the national average
bull The network has reduced its carbon footprint to 102gMWh per year323
Links to similar initiativesVancouver district heating system Copenhagen district heating and cooling system Paris Saclay smart district heating and cooling system
Case studies - energy and buildings
137
Sustainable eco-districts Malmouml Sweden
Malmouml has regenerated its urban area by converting disused sites such as former shipyards and other heavy industry zones into sustainable low-carbon districts
324 See Fitzgerald (2016)325 See Smedby (2015)
Snapshot
bull Location Malmouml Sweden
bull Population Medium-sized ndash 316000 (2018)
bull Policy area Energy and buildings
bull Policy options Improved codes for building energy and better labelling policies promoting renewable energy generation
bull Financial capacity Strong
bull Administrative capacity Strong
Context and policy overviewIn the late 1980s and early 1990s Malmoumlrsquos industrial centre lost one-third of its jobs but today the city is a vibrant and sustainable urban area The heart of this transformation is Western Harbour an eco-district and regeneration zone The area was developed as a testbed in the cityrsquos ambitious plans to become climate-neutral by 2020 and to run entirely on renewable energy by 2030 The mayor envisioned using the eco-district concept as a model for future sustainable urban development throughout the city
And with a blank slate ndash a restored brownfield site ndashplanners could integrate all aspects of Malmoumlrsquos sustainability approach into the eco-district324
In Sweden the energy performance of buildings is regulated at the national level However Malmouml has developed several policy instruments to meet the cityrsquos climate and sustainability goals One example of these instruments is the ldquoDeveloper Dialoguerdquo which involves different stakeholders in the planning process Malmouml has also worked with the city of Lund to set sustainability requirements that exceed national regulations for new building developments It has achieved this through a voluntary programme called MBP South in which developers can choose between three levels of ambition325
ImplementationThe objective for the Western Harbour eco-district was to reduce energy consumption to 105 kWhmsup2 This is equivalent to half the energy consumption of Malmoumlrsquos current housing stock and below the nationally required levels for new construction
City planners invited a variety of stakeholders including architects developers and construction companies to submit development plans and hold
Case studies - energy and buildings
138
326 See Kanters and Wall (2018)327 See Fitzgerald (2016)
discussions to establish building sustainability standards for Western Harbour Building standards were established for energy materials systems technology acoustics and noise green space and biodiversity moisture control and the indoor environment326
In the second phase of the project participatory planning ndash which goes beyond conventional stakeholder consultation processes ndash was used to bring parties together to shape the approach to energy efficiency The process involved a combination of site visits and workshops and cooperative design processes to set standards for new buildings
Sustainable urban mobility was another key policy objective for the district with a combination of car restrictions and measures to support walking and cycling The district boasts a 40 per cent modal share for cycle-based journeys to work
Following the development of Western Harbour the eco-district concept was replicated in the planning of further projects through Developer Dialogues These are held to enhance the sustainability profile of prospective eco-districts Malmoumlrsquos city planners applied the eco-district approach to redevelop lower income neighbourhoods such as Rosengaringrd a social housing area with a history of significant social conflict This project aimed to demonstrate how a troubled neighbourhood can be redeveloped with a focus on environmental sustainability and increased social and economic integration with the rest of the city327
Barriers and critical success factorsIn Malmouml political ambition and leadership is strong and goals are set at a high level The city departments cooperate with each other as well as with developers universities and other organisations Malmouml is committed to and has been working towards sustainability for a long time
Experimentation supported by cross-departmental collaboration and dialogue with developers has been key to promoting innovation in planning For example project managers from the environment and planning
departments meet on a regular basis to discuss the delivery of more integrated projects
The fact that the city owns most of the land means that it has considerable power to impose standards on developers Swedish cities also benefit from significant national and EU funding to support climate action
In terms of programme design MBP South gives building developers a choice between three different levels of ambition In contrast similar sustainability programmes in Sweden set only one level of requirements Moreover administration of the
Case studies - energy and buildings
139
programme has been efficient due to the relatively large size of the municipality and the fact that it developed the programme jointly with another municipality
Results and lessons learnedMalmouml has been successful in reducing energy consumption cutting GHG emissions and making the urban area more liveable for residents
bull The city lowered energy consumption from 72 kWhm2 to 65 kWhm2 for a development using MBP South without the Developer Dialogue and to 56 kWhm2 for a development using MBP South with the Developer Dialogue
bull Due to Malmoumlrsquos action and the decline of the shipbuilding industry per capita GHG emissions have fallen to 34 tonnes per year (compared to 56 tonnes in Sweden as a whole and 176 tonnes in the United States of America in 2010)
bull The eco-districts have contributed to economic growth social innovation and inclusion in the city making Malmouml an attractive place to live
While external factors such as funding opportunities and land ownership by the city were favourable to Malmouml much of the cityrsquos success is thanks to effective urban planning and these lessons can be applied anywhere The experience in Malmouml demonstrates that experimentation is key to innovation in planning It also shows that the formalisation of learning across departments can ensure that a city addresses obstacles to cooperation and institutionalises good practices
Links to similar initiativesPortland eco-districts Ulaanbaatar eco-districts
Case studies - water
140
Snapshot
bull Location Yerevan Armenia
bull Population Large ndash 11 million (2016)
bull Policy area Water
bull Policy option Regulation and contracting of public and private service providers
bull Financial capacity Strengthening
bull Administrative capacity Strengthening
Context and policy overview In recent years Armenia has seen major achievements in relation to water resource management to which the private sector has made significant contributions Previously Armenia had lagged behind European countries in terms of the non-revenue water ratios water accessibility and supply328
Yerevan the capital of Armenia is the largest and most populous city in the country In the 1990s Yerevanrsquos water utility company the Yerevan Water and Sewerage Enterprise (YWSE) struggled financially and had a poor water system which was unable to supply water efficiently to city residents Fee collections were only around 20 per cent and revenue did not cover operational and maintenance expenses The majority of customers (80 per cent) connected to the network could only access tap water for between 2 and 8 hours a day Meanwhile approximately 72 per cent of water in the network was lost through identified leakages across the system329
ImplementationIn 2000 the government of Armenia sought private input via a competitive tender to improve the provision of water services Through the tendering process the government commissioned Acea Spa Utility (Acea) a joint venture led by an Italian water operator to run the water utility system for five years330 The appointment was designed to bring in private sector expertise
Private contracting in the water sector Yerevan Armenia
Yerevanrsquos water utility signed a five-year performance-based management contract with private operator Acea Over the contract period water supply collection rates and energy efficiency improved
328 See World Bank (2018)329 See Energy Sector Management Assistance Program (2011a)330 See Eiweida and Tokhmakhyan (2011b)
Case studies - water
141
331 Ibid332 See Eiweida and Tokhmakhyan (2011b)
to handle the water distribution network efficiently An investment fund was created by the government and the World Bank in order to manage Acearsquos capital investment for water utility services With the aim of enhancing the water utility system Acea created a programme to repair leaks increased the gravity-fed water supply fixed pumping stations introduced meters and stabilised water pressure across the networks of three districts These developments cost US$ 24 million and strengthened the water network across Yerevan
There are differing degrees of private-sector participation (PSP) in the water sector These can include minor outsourcing of non-core activities or private concession contracts where investment obligations and revenue risks are fully transferred to private operators The performance-based contract introduced in Yerevan represented a moderate first step in terms of increased PSP with only minor risks transferred to private contractors which are linked to performance incentives However it was a first step that brought sector expertise and well-defined performance incentives into the cityrsquos water services It also helped to build capacity and experience of private contracting for the relevant water authorities This experience later paved the way for wider and deeper PSP in the Armenian water sector
Barriers and critical success factorsPolitical support and commitment by policymakers helped the public-private partnership (PPP) with Acea to succeed Both the government and the operator demonstrated a willingness to resolve issues and agree on common benefits PPPs are a way to resolve some water sector challenges but are not the only tool that policymakers have In order to benefit from the private sector policymakers need to create a business environment that facilitates private-sector involvement with a reasonable legal and regulatory framework331
In Yerevan several measures were taken to ensure strong results These included performance targets incentive mechanisms and an efficient selection process for procuring a contractor Government and
city officials together with Acea discussed progress and challenges to ensure that appropriate measures were taken
A key lesson learned from the project was the importance of obtaining an accurate baseline for system performance before setting contractual performance targets The projectrsquos failure to meet targets for non-revenue water ratios was linked to the use of inaccurate baseline values332
A significant part of the projectrsquos success was the joint effort by the government and Acea to gain public acceptance for the work This entailed early improvements to services before the introduction of tariff increases
Case studies - water
142
Results and lessons learnedYerevanrsquos experience is an example of a well-implemented PPP scheme using performance-based contract incentives It demonstrates that these delivery models can produce positive outcomes for cities if appropriately structured with an effective statutory framework in place More specifically between 2000 and 2004 Yerevan achieved the following improvements333
bull a significant increase in access to water with the availability of water increasing from 6 to 18 hours per day
bull an increase in fee collection from 20 to 80 per cent
bull a fall in electricity consumption by 30 per cent exceeding the initial target of 20 per cent
bull a stronger focus on sustainability improving the resilience of the network
bull a stronger financial performance due to reductions in energy use and water losses and a dramatic improvement in collection rates
bull a 10-year contract between the government and Veolia a French water company following the success of the project
The cityrsquos experience also illustrates the importance of transparent and predictable regulation as well as contract implementation by a competent public authority These are necessary not only to avoid disputes but also to ensure good bidding processes with strong competition between serious and competent companies that fully understand what they are bidding for and feel comfortable with the regulatory environment
Lastly Yerevanrsquos experience with performance-based management contracting demonstrates the need to have realistic expectations about the scale and pace
of reforms in the water sector Sustainable changes to a system require time to take effect
Links to similar initiativesAmman private-sector participation in the waste sector Iasi water tariffs and governance improvements Kirklees performance contracting in the waste sector
333 See International Bank for Reconstruction and Development and World Bank (2017)
Case studies - water
143
Snapshot
bull Location Madaba Jordan
bull Population Small ndash 105000 (2018)
bull Economy Service economy
bull Policy area Water
bull Policy options Regulation and contracting of public and private service providers reform and strengthening of water utilities effective tariff reforms and price signals
bull Financial capacity Limited
bull Administrative capacity Limited
Context and policy overviewHigh levels of population growth in combination with climate change and droughts had a strong impact on Jordanrsquos water supply in the 1990s and early 2000s334
Despite investment in the countryrsquos water sector the reduction in the percentage of non-revenue water (NRW) was disappointing The Ministry of Water and Irrigation documented national NRW rates as high as 66 per cent with only a slight improvement over time from 46 per cent in 2005 to 44 per cent in 2010 This NRW rate was due to both physical and administrative losses Old water pipelines pipe bursts poor service connections illegal tapping and incorrect water meter readings were just some of the reasons for the losses335
In addition the Water Authority of Jordan (WAJ) had experienced multiple challenges in service delivery and business administration Application processes and billing were often found to be incorrect and overall customer management was inefficient and unsatisfactory336
In 2004 the Ministry of Water and Irrigation proposed a set of policy measures to manage the NRW including a micro approach to private-sector participation This option was proposed to achieve
Micro private-sector participation Madaba Jordan
The administration of Madaba implemented a micro approach to private-sector participation to reduce the percentage of non-revenue water The contract addressed billing illegal use and the replacement and resealing of water meters In the seventh quarter the water system reached break-even
334 See Al-Karablieh and Salman (2016)335 See Baghdali et al (2013)336 Ibid
Case studies - water
144
service improvements in Jordan across the operation and management of the water network It was seen as a complementary approach that would prepare for more PSP schemes across the distribution of water services in Jordan
The WAJ defined its targets around improving financial performance through better management of water and wastewater stronger collection rates and improvements to customer service and management
ImplementationThe micro-PSP approach was implemented in Madaba from 2005 to 2011 The ministry chose Madaba as the city had a small customer base limiting complexity Households accounted for 94 per cent of this base while only 6 per cent of customers were industrial consumers In addition proximity to Amman would enable easier cooperation with WAJ headquarters and facilitate general transactions and logistics Moreover there was strong interest in the micro-PSP approach from local stakeholders337
A bidding process was set up for the micro PSP to manage billing and revenue collection and thus reduce the NRW ratio A workshop was arranged
to raise awareness and to give bidders as much information as possible The services that were expected of bidders included managing billing and revenue collection using a tool based on geographical information systems implementing a system for customer management and operating a database for the sewerage network in the region338
The contract specification included details of the required activities and levels of performance and was divided into two parts The first part considered the business processes of the company During this first stage business processes were to be updated to ensure use of the necessary systems and equipment The staff would also receive training The second part of the contract covered performance management In this stage the private company would carry out meter readings billing collection and customer service including inspections339
Under the contract terms the private company received a portion of the extra revenue collected each year in order to incentivise performance The contract also had clearly defined targets and indicators The Project Management Unit of the WAJ monitored the performance of the winning contractor Engicon an engineering consultancy firm
337 Rabi (2013)338 See Baghdali et al (2013)339 Ibid
Case studies - water
145
Barriers and critical success factorsThe micro-PSP project in Madaba was considered to be a success and it was scaled up and extended for three more years This enabled smaller local companies to participate in Madabarsquos water resource management bringing cash flow into the sector and saving water across the city The project has also influenced water and wastewater systems in other regions across the Middle East and the Gulf States Nevertheless Madaba experienced some challenges
bull It took more than two and a half years to start the programme
bull There was a reliance on external funding
bull A major concern was the availability of local private companies to take on key tasks outsourced by the WAJ340
Strong long-term results for the project depended on an integrated approach that ensured capacity-building to sustain a competitive local market in water services
Results and lessons learnedThe micro-PSP experience in Madaba yielded several results and key lessons On a general level micro-PSP effectively reduced costs and created a local market in which private companies could compete to provide important services across the water sector
The project brought a significant reduction in NRW through efforts in billing collection of water fees and the fixing of water meters By 2011 billed amounts had increased by 175 per cent relative to the level seen in 2005 There were nearly 3000 reported cases of illegal water use between 2006 and 2011 Over the same period more than 22000 water meters were resealed and 14000 replaced341
In 2008 the total annual additional income achieved reached approximately euro2 million (excluding tariff increases or revenues from new customers) This represented a significant increase compared to total revenue of less than euro12 million in 2005 In fact
cash collections doubled across the period 2005-08 After one year the additional income from the project exceeded the cost of the investment This helped to strengthen the overall financial performance of the WAJ342
Compared to large-scale PSP models the micro-PSP scheme requires less funding and the preparatory phase tends to be shorter (although detailed preparation may be necessary where local capacity is limited) In the case of Madaba the scheme managed to monitor control and assess reduction levels through incentives capacity-building and awareness-raising343
These results and the new customer service arrangements built confidence in the system This was a crucial step towards gaining public acceptance and trust which contributed to a fall in the illegal consumption of water
Links to similar initiativesIasi water tariff and governance improvement Singapore water metering and billing Johannesburg reduction of water losses
340 See Baghdali et al (2013)341 Ibid 342 Ibid343 See Rabi (2013)
Case studies - water
146
Snapshot
bull Location Drakenstein South Africa
bull Population Small ndash 224000 (2015)
bull Economy Service economy
bull Policy area Water
bull Policy options Effective tariff reforms and price signals awareness campaigns for households and industry promotion of resource-efficient utilities
bull Financial capacity Strengthening
bull Administrative capacity Strengthening
Context and policy overview The Drakenstein municipality in South Africarsquos Western Cape province had long experienced water shortages These peaked in 1999 when the water supply could no longer meet demand which was growing at 35 per cent a year This pressure was predominantly due to the high ratio of non-revenue
water (NRW) at 33 per cent of total supply Approximately 90 per cent of the municipalityrsquos water had to be purchased from the city of Cape Town while Drakenstein derived only 10 per cent from its own sources344
Following the 1999 water crisis the municipality had to take remedial measures While Drakenstein faced a great challenge the crisis was also a major opportunity to strengthen the municipalityrsquos water resource management The remedial measures focused on reducing water imports by cutting consumption and minimising wastage
A water demand management programme was introduced to address the crisis The scheme aimed to reduce the high percentage of NRW reduce the level of daily demand and conserve water345
More specifically the programme focused on six main targets
bull decreasing the high proportion of non-revenue water
bull stabilising water pressure
Management of water demand Drakenstein South Africa
A programme of water demand management in Drakenstein achieved a two-thirds reduction in the percentage of non-revenue water over two years boosting municipal revenue
344 See Drakenstein Municipality (2013) 345 See 2030 Water Resources Group (2015)
Case studies - water
147
bull managing average daily demand
bull strengthening financial performance by boosting fee collection
bull improving service to residents and other consumers
bull conserving water
ImplementationThe programme included wide-ranging interventions such as
bull improving the master plan for the reticulation network through hydraulic modelling
bull metering abstraction points and properties
bull supplying water at a low cost while imposing penalties on heavy users through tariffs
bull advertising water scarcity to raise public awareness including the promotion of water-saving devices and plumbing repairs
bull improving leaks and making repairs across the network infrastructure
bull developing a pressure management system
Identifying water leaks across the reticulation network was an important step in reducing water loss This was complemented by an ambitious policy to repair all leaks within an hour of their identification resulting in one of South Africarsquos lowest levels of physical water leakages Poor-quality pipes were replaced with high-quality equivalents and stainless-steel fittings reducing the number of pipe bursts
Works were also carried out on advanced management of pressure The pressure management installations included work on valves pipes chambers and controllers Seven pressure reduction valves that ranged from 100 mm to 300 mm in diameter were equipped with flow-modulated electronic controllers in order to achieve advanced pressure reduction
The works totalled around US$ 500000 but within five months that cost had been covered by the savings achieved
Barriers and critical success factorsThe project gained a high level of support within the community This was partly due to the creation of local jobs through the use of labour-based construction methods in conjunction with extensive local stakeholder engagement
Moreover in order to create a reliable collection and storage system for water the municipality introduced a water treatment programme This enabled a steady supply of water in the region regardless of season and rainfall A feasibility study that examined Drakensteinrsquos water supply management proposed the development of a water treatment plant for the Paarl Mountain dam because a related network for distribution had already been established The study also proved that significant savings could be made by creating a water treatment plant instead of buying water from Cape Town346
346 See AVK International (nd)
Case studies - water
148
Results and lessons learnedDrakenstein achieved its targets for water demand management Overall the municipality now ranks among the best in South Africa with regard to efficient use of water347
The unacceptably high level of non-revenue water was cut from 33 per cent to just 11 per cent over a period of 12 years boosting municipal revenue The combination of a new block tariff structure and reduced spending on water purchases from the city of Cape Town increased the net revenue and outweighed the costs of previous measures taken despite a decrease in the volume of water sold to consumers348
Water demand decreased from 17800000 msup3year to 11900000 msup3year This resulted in significant
savings on water purchases from suppliers and the fulfilment of targets for water conservation349
Notably the performance indicator for physical leakage (ILI) had decreased to below two by 2012 making it one of the lowest levels in South Africa and demonstrating the impressive water savings that all of Drakensteinrsquos interventions had achieved Across the 12-year period of the project total savings exceeded euro70 million No single intervention resulted in this outcome Instead it was the combined effect of many smaller interventions that brought eventual success This has also been the case in the majority of other municipalities in South Africa350
Links to similar initiativesSingapore water metering and billing Johannesburg reduction of water losses Madaba micro private-sector participation
347 See Drakenstein Municipality (2013)348 See 2030 Water Resources Group (2015)349 Ibid 350 Ibid
Case studies - water
149
Snapshot
bull Location Chennai India
bull Population Large ndash 7 million (2011)
bull Policy area Water
bull Policy options Regulation and contracting of public and private service providers reform and strengthening of water utilities effective tariff reforms and price signal
bull Financial capacity Limited
bull Administrative capacity Strengthening
Context and policy overviewThe city of Chennai in southern India has been experiencing water scarcity due to rapid population growth and a rising demand for energy following higher levels of economic activity This water crisis presented the Chennai Metropolitan Water Supply and Sewerage Board (CMWSSB) with the challenges of supplying water efficiently to residents while also ensuring that the local economy and industry were not compromised351
Over several years city officials passed a set of regulations and bylaws to stabilise and manage water sourcing and use These aimed to ensure maximum reuse of water and to see that wastewater met the safe quality standards required by the city The new regulatory framework was complemented by partnerships between the private sector and governmental agencies in order to promote innovation
The water crisis peaked in June 2019 when Chennai declared ldquoDay Zerordquo marking the depletion of water across all of the cityrsquos four main reservoirs Water was being tankered (or transported via train) from unregulated sources at high costs and to the detriment of rural farming communities352
ImplementationIn order to address the rising scarcity of water changes to legislation were made over many years leading up to 2019 The CMWSSB implemented a water reuse plan and the Greater Chennai Corporation set up a bylaw covering compulsory recycling of wastewater that applied to all stakeholders including government authorities the private sector and citizens These rules stated that all developers should include wastewater recycling in their designs that water should go through organic filtration for
Water and wastewater recycling Chennai India
Rapid population and economic growth have caused increasing water scarcity in Chennai In response the city has taken measures to accelerate the reuse of water and wastewater
351 See International Water Association (2018)352 See Trivedi and Chertock (2019)
Case studies - water
150
353 See International Water Association (2019)354 See Raghavan (2019)355 See International Water Association (2019)356 Ibid 357 See Natarajan (2020)358 See Alam et al (2019) 359 See Raghavan S (2019) 360 See International Water Association (2018)
groundwater recharge (except water from toilets which would go through the sewerage network) and that toilet flushing should use recycled water In 2002 the CMWSSB implemented a rainwater harvesting programme under which new or renewed water and sewerage connections had to include systems for harvesting rainwater353 Chennai is one of the first cities in India to have educated residents on the importance on rainwater harvesting354
Another priority area for the city has been energy efficiency In 2010 CMWSSB commissioned six sewage treatment plants The plants capture and use biogas to power most of their electricity demand355
Another priority has been zero discharge Industries and manufacturers are now under legislation that requires them to achieve zero liquid discharge from their operations Wastewater should not be discharged and should be treated for reuse For example the CMWSSB treats wastewater and sells it to major industries across the city356
Since ldquoDay Zerordquo the CMWSSB has committed to a variety of further measures to reduce the risk of future water crisis events including357
bull reuse of wastewater by expanding the number of treatment plants in Chennai
bull decentralisation of water sources with a focus on smaller lakes
bull an increase in the number of water supply schemes reducing reliance on tankers
bull the provision of sewer connections to new areas
bull the collection of sewage from areas where there is no underground sewerage network
bull monitoring of groundwater levels
bull GIS mapping of the water supply network
bull engaging manual scavengers in other work
bull upgrading the CMWSSB quality assurance laboratory
Results and lessons learnedIntegrated water resource management is necessary to achieve long-term resilience as a single intervention would be too simplistic358
bull Through mandatory rainwater harvesting Chennai has improved its water quality and groundwater levels have increased significantly359
bull Chennai has met 15 per cent of its water demand through water recycling while 8 per cent of treated wastewater is sold to industries Moreover some 40 per cent of domestic water demand in newly built houses is met through wastewater reuse360
bull Improvements to sewerage networks as a resulting of reduced pressure due to more rainwater harvesting and in situ wastewater reuse systems have saved water across the network
bull Electricity imports and GHG emissions have fallen due to the use of biogas for energy production The public-private partnership scheme has reduced dependence on the electricity grid by approximately 77 per cent
bull Innovation in wastewater treatment has been incentivised as new markets in this area have been created
Links to similar initiativesDurban water recycling Aqaba wastewater reuse Namibia wastewater reclamation
Case studies - water
151
Snapshot
bull Location Zaragoza Spain
bull Population Large ndash 663000 (2016)
bull Policy area Water
bull Policy options Awareness campaigns for households and industry effective tariff reforms and price signals
bull Financial capacity Strong
bull Administrative capacity Strong
Context and policy overviewZaragoza is located in the north of Spain It is a semi-dry area with moderate average rainfall (314 mm a year) In the 1990s a severe drought made the cityrsquos water shortages a distinct problem sparking public concern and political controversy361
In 1996 the NGO Fundacioacuten Ecologiacutea y Desarollo and the municipality jointly set up the Zaragoza Water Saving City programme to tackle water scarcityThe aim was to change wasteful behaviour and increase
efficient use of water The programme set an ambitious target of reducing domestic water consumption This included saving one million m3 of water a target that the programme successfully achieved within a year362
Water shortages in an urban context can be challenging to overcome However this project addressed shortages through financial incentives educational campaigns and multiple partnerships which secured funding from a variety of sources
ImplementationThe water-saving project comprised a wide range of measures
Media campaign In order to increase public awareness of the project Zaragoza ran a broad media campaign It featured advertisements on TV radio and public transport in addition to information on leaflets and posters The campaign achieved a high level of public awareness about the project
Educational outreach The programme used education to make people conscious of their own domestic water use and to prompt more efficient use of water and related technologies This outreach
Water-saving programme Zaragoza Spain
In 1996 the city of Zaragoza introduced a water efficiency programme to address water scarcity The programme included awareness-raising campaigns financial incentives and voluntary commitments by residents and businesses
361 See 2030 Water Resources Group (2015)362 See Kassam (2014)
Case studies - water
152
was later extended to schools to ensure that children understood the principles of efficient water use and why it is important to reduce water wastage By April 1998 168 educational establishments 428 teachers and 70000 students had participated directly in the campaigns educational programme363 The cost of the media campaign and educational outreach was around euro25 million between 2002 and 2010 The second part of the water saving project included a ldquo50 Good Practicesrdquo guide The guide identified measures for efficient water use by businesses covering water-related technology and behaviours in the cityrsquos green spaces buildings and industry364
Economic incentives The regional government gave discounts of 20 to 25 per cent to citizens purchasing water-efficient products In 2002 the Zaragoza city council also offered economic incentives for households to reduce their water consumption Residents who reduced their water use by 40 per cent or more in the first year of the scheme were entitled to a 10 per cent discount on their water bill A 10 per cent reduction in water consumption was also expected in the following years Water bills were redesigned to show clearly how each householdrsquos consumption compared to the levels in previous months365
Partnerships In order to ensure a range of options for customers the water-saving project partnered with businesses and companies that sold water-related technologies and products This allowed consumers to choose water-efficient products for their homes including for bathrooms and kitchens
Tariff reform Water tariffs have the ability to make water consumption fairer and more responsive to demand Revenues can be used to cover indirect costs in the water cycle and the direct costs of providing services366 In this case the following measures were under taken
bull the establishment of fair costs for consumers that correspond to the resulting benefits and services
bull a reasonably priced and accessible provision of water services to maintain affordability for vulnerable households
bull incentives for smart and efficient water use including financial incentives such as discounts on water bills tied to a reduction in household water consumption and higher rates for excessive water consumption
Infrastructure upgrade The programme also required significant upgrades to the water infrastructure in order to minimise leakages Approximately 16 per cent of the 1200 km pipeline network required upgrading The city also initiated pressure management controls and maintenance of leaking storage tanks in order to limit water loss367
Barriers and critical success factors368
The most significant factor contributing to the projectrsquos success was the change in consumer behaviour following effective public awareness campaigns and engagement Instead of promoting generic water-saving messages specific user groups were targeted with awareness-raising activities directly relevant to their business or lifestyle
363 See Edo et al (1998)364 See 2030 Water Resources Group (2015)365 Ibid 366 See SWITCH (2014)367 Ibid 368 Ibid
Case studies - water
153
The establishment of a central coordination unit also contributed to the success of the campaign The Zaragoza Water Commission ensured that there was a coherent approach to smart and efficient implementation and monitoring
A network of 50 volunteer ldquoaccomplicesrdquo was set up and free audits were offered to these non-residential water users to help implement water-saving measures This group included for instance a hospital a fish supplier and a swimming pool operator Subsequently as soon as positive results came in case studies of their success stories were circulated to other businesses369
Policy commitments and the supportive city council made the cityrsquos achievement possible through an increase in the available funding opportunities This also contributed to civic pride The authorities led by example providing a reliable efficient water and wastewater service
Results and lessons learnedOverall the Zaragoza project significantly reduced water use and enabled smart behaviour in relation to water consumption It achieved the following outcomes
bull The city decreased water use by almost 30 per cent within a 15-year period despite a 12 per cent increase in population over the same time frame Daily water consumption per capita fell from around 150 litres in 1997 to 99 litres in 2012370
bull The campaign enlisted 140 businesses selling technologies that minimised water consumption in homes This enabled consumers to purchase products that were more water efficient For instance one bathroom retailer reported a 58 per cent rise in sales of automatic taps371
bull After the first phase of the project had been completed 72 per cent of residents were aware of water-saving measures compared to 40 per cent before the project started
bull Water system performance improved with pipe burst events reduced by more than 50 per cent and losses by more than 40 per cent
The experience in Zaragoza shows that encouraging public participation and targeting specific sectors are valuable measures when implementing awareness campaigns Strong political commitment is also important The municipal strategic plan identified stakeholder engagement and public participation as important to managing the cityrsquos water consumption
Links to similar initiativesSingapore water demand management Beaufort West water demand management Nevada water conservation programme
369 See Kassam (2014)370 Ibid 371 See 2030 Water Resources Group (2015)
Case studies - water
154
Snapshot
bull Location Bucharest Romania
bull Population Large ndash 18 million (2011)
bull Policy area Water
bull Policy option Regulation and contracting of public and private service providers reform and strengthening of water utilities effective tariff reforms and price signals
bull Financial capacity Strengthening
bull Administrative capacity Limited
Context and policy overview In Bucharest water losses were very high (around 50 per cent) in the 1990s and the city had low levels of fee collection because the metering system was inadequate Relative to EU quality standards improvements were required and the commercial model and tariff structure in place at the time
did not allow EU funds to be made available for capital investment372
In 1996 following World Bank recommendations Bucharest initated a tender process to privatise the cityrsquos water and sanitation system This resulted in a 25-year concession agreement between Apa Nova a subsidiary of the French firm Vivendi (now Veolia) and the Bucharest municipality for the management of the system In 2000 Apa Nova won the tender to manage the Bucharest water concession including the development of the Crivina plant The contract included operations and the provision of clean water and sanitation while ownership of the water system remained with the municipality
The private-sector participation approach gave control of management and investments to a private company and linked its remuneration to efficiency gains and operational performance The municipality expected that this would lead to significant improvements in Apa Novarsquos capital and operating efficiency and a higher standard of service In addition the municipality hoped to see expertise from international practices in management and operations transferred to Apa Novarsquos local staff373
Public-private partnership agreement Bucharest Romania
Bucharest introduced new capital improvements to the water sector through a PPP agreement which has led to efficiency gains and better operational performance of the cityrsquos water distribution network
372 See Water Time (2005)373 See Islam (2012)
Case studies - water
155
ImplementationIn one of the first PPPs in the local water sector the private contractor was selected through international competitive tendering organised by the municipality of Bucharest with the support of the International Finance Corporation (IFC) The agreement provided a 25-year contract for Apa Nova to deliver US$ 1 billion worth of investments in existing and new treatment plants and in network renewal374
The contract included targets for key performance indicators in relation to water quality completion of new infrastructure and customer service Although the contractor had operational control over the network and the authority to deploy resources to meet these KPIs the municipality retained ownership of the infrastructure and the power to veto certain decisions375
The agreement helped create a source of capital to support an upgrade and extension of the Bucharest water system The partnership agreement required the private partner to provide financial resources to upgrade the system and part of the project included the upgrading of the Crivina plant The Crivina project had already started 10 years earlier but the municipality lacked the financial resources and expertise to complete it To finance the project Apa Nova and the city of Bucharest applied for an EBRD loan which offered better terms than other commercial sources of capital376
This PPP model offers a degree of stability and risk- and profit-sharing In 2000 the PPP environment in Romania was uncertain and the classical nature of the model used in Bucharest may therefore have been beneficial to the city377
Results and lessons learnedThe PPP contract was beneficial to both parties Bucharest was able attract financial resources to upgrade and improve the quality of its water system
and accessed the necessary expertise to do this Meanwhile Apa Nova also benefited with profits of euro24 million in 2006378
Overall the project improved the cityrsquos water distribution network and saw the completion of the Crivina potable water treatment plant on the outskirts of Bucharest
Key metrics for the period 2002-06 included
bull a 44 per cent reduction in losses379
bull a 50 per cent decrease in demand380
bull a 21 per cent increase in customer satisfaction (from 46 per cent to 67 per cent)381
Moreover the competitive nature of the contract its 25-year duration and the controlled pricing mean that as a result of this concession consumers in Bucharest have one of the lowest tariffs for water and sanitation in Europe382
Links to similar initiativesSingapore water demand management Johannesburg water supply efficiency Jeddah leakage reduction
374 See World Bank (2016)375 Ibid 376 Ibid377 See Islam (2012)378 See World Bank (2014) 379 See IFC (nd) 380 Ibid381 See World Bank (2014) 382 Ibid
Case studies - waste
156
Snapshot
bull Location Cape Town South Africa
bull Population Large ndash 37 million (2011)
bull Policy area Waste
bull Policy options Regulation and information to encourage the reuse of materials and the reformulation of processes incentives for waste recycling by industries information strategies for residents and businesses
bull Financial capacity Strong
bull Administrative capacity Strong
Context and policy overviewDespite its rich and diverse resource base South Africa relies heavily on fossil fuels has high rates of landfill use and suffers water scarcity In Cape Town the Western Cape industrial symbiosis programme
(WISP) seeks to address these issues by providing a free facilitation service that promotes the reuse and recycling of industrial waste The programme covers materials water energy staffing and expertise and other assets Its overarching aim is to contribute to the circular economy384 385
The sharing of resources enables businesses to reduce costs and boost profits improve operational efficiency introduce new revenue streams learn from one another operate more sustainably and divert waste from landfills
The WISP was inspired by the UKrsquos national industrial symbiosis programme (NISP) which successfully proved that reutilising underused resources across industrial and commercial waste improved the environmental impact of companies386
ImplementationThe WISP was set up by the Western Cape government and delivered by the non-profit organisation GreenCape with technical support from the city
Industrial symbiosis programme Cape Town South Africa
The Western Cape industrial symbiosis programme connects local companies to facilitate the reuse of resources such as water energy and materials383
383 See Western Cape Government (nd)384 See Global Opportunity Explorer (2018)385 See African Circular Cities Alliance (nd)386 See Western Cape Government (nd)
Case studies - waste
157
387 Ibid 388 See C40 Cities and Climate KIC (2018)389 See C40 Cities (2017) 390 Ibid 391 See GreenCape (2018) 392 See OrsquoCarroll et al (2016)
of Cape Town and financial support from other partners387 GreenCape seeks widespread adoption of green economy solutions The WISP helps to engage local businesses improving their understanding of the content and potential uses of waste streams which in turn helps to identify underutilised resources388
Connections were made between nearly 500 participating companies via workshops led by the city and GreenCape and through the use of an online database SYNERGietrade389 When connections are made between firms the WISP supports the exchange of resources and the communication between the relevant actors Feedback to the WISP is encouraged in order to improve matching and to ensure strong social environmental and financial impacts for all parties involved Emission savings that result from the scheme are calculated using an international standard carbon calculator that has been developed for the purposes of the programme390
By way of example the WISP successfully matched the marketing company Scan Display with the specialist manufacturing firm Sealand Gear This helped the former to avoid disposing of single-use conference display stands and banners instead
diverting them to Sealand Gear which used the products to make bags and clothing The long-term relationship between these two firms helped to avoid two tonnes of landfill waste and delivered financial savings to both companies Sealand Gear saved ZAR 270000 (euro14000) per year on raw materials and Scan Display saved ZAR 900 (euro50) per year in landfill gate fees391
Barriers and critical success factorsDespite its overall success the project faced challenges including regulatory issues (the reuse or recycling of waste materials for instance) the cost of transport and logistics services a lack of demand for secondary materials and additional capital investments It also faced a difficult enterprise development process and lack of large-scale solutions for dealing with waste composite materials bio-waste textiles and wood392
Factors that helped to overcome these issues and make the project successful include GreenCapersquos reputation as a reliable and trusted NGO with no hidden agendas the use of partnerships to tap into
Case studies - waste
158
393 Ibid 394 See C40 Cities and Climate-KIC (2018)
networks and the contribution made by International Synergies a firm whose experience in industrial symbiosis helped to demonstrate the value of this approach
Government funding was also instrumental in facilitating the development of the free-to-use WISP service393
Results and lessons learnedThe WISP operates across several industries allowing greater scope for the reuse of materials and delivering a range of benefits such as
bull 27000 tonnes of waste diverted from landfill thus saving 45000 tonnes of greenhouse gas emissions over a five-year period
bull income and savings and private-sector investments totalling ZAR 43 million (euro28 million equivalent)
bull the direct creation of 25 jobs and a further 118 indirect jobs
The programme has also inspired and influenced other industrial symbiosis programmes across South Africarsquos provinces including in KwaZulu Natal and Gauteng The WISP is seeking further expansion394
Links to similar initiativesYokohama 3R Dream Plan Malmo industrial symbiosis Kristiansand green business competition
Case studies - waste
159
Snapshot
bull Country South Korea
bull Population Large ndash 97 million (2017)
bull Policy area Waste
bull Policy options Establishment of a waste management plan and administrative capacity promotion of sharing and reuse of products information strategies for residents and businesses
bull Financial capacity Strong
bull Administrative capacity Strong
Context and policy overviewInitiated in 2012 and funded by the city the Sharing City Seoul programme seeks to develop a sharing economy covering infrastructure business public resources data and digital services395
Overpopulation urbanisation and a high population density in Seoul have exacerbated challenges in relation to housing transport air pollution and access to resources The Sharing City Seoul project was initiated to tackle these challenges and facilitate growth without further exploiting resources or adding pressure to infrastructure and services
The aims of the project include396
bull supporting job creation and increasing prosperity across the city
bull reducing waste and excess consumption and improving sustainability across businesses and organisations and
bull improving community spirit by increasing trust between people
ImplementationSeoul is seeking to move away from its conventional policy of building primary infrastructure (such as roads schools and so on) towards an innovative
Sharing city project Seoul South Korea
Seoul declared itself a ldquosharing cityrdquo in 2012 and began applying the concept of the sharing economy to its urban policies This minimised the waste of resources while generating economic opportunities and better relationships between city residents
395 See Johnson (2013)396 Ibid
Case studies - waste
160
focus on secondary infrastructure (such as spaces objects skills and other underutilised resources)397
To achieve this ambition the city is implementing a mix of policy and other mechanisms including a supportive regulatory framework public awareness campaigns and financial and other support for businesses398 Some of the key measures include the following399
Promoting sharing enterprises The city supports approximately 20 business start-ups led by young people providing them with office space advisory services and subsidies In addition the city subsidises the expenses of 27 sharing enterprises with KRW 460 million (euro340000 equivalent) to either launch or scale up their platforms400
Sharing enterprises chosen for city support include
bull Kozaza and Labo Korea two platforms for home-sharing
bull Woozoo a platform that provides affordable housing by remodelling old houses into shared accommodation
bull Wonderlend and Billi businesses that promote the sharing and borrowing of goods that are underused
bull SoCar a platform for car-sharing services
bull Kiple a business that promotes the sharing of childrenrsquos clothes
bull The Open Closet a company that distributes donated suits to young job-seekers
bull The Living and Art Creative Center a space for creative writing and art
bull Zipbob a platform that promotes food-sharing
Public awareness Seoul introduced a ldquostamp of approvalrdquo for particular sharing services in order to build trust in the sharing economy Moreover Seoul is branding itself as an innovator in sharing and is hosting an international sharing city conference to share best practices
Seoul established an online platform called the ShareHub in June 2013 to help residents understand the concepts of the sharing city and to initiate a directory of sharing services401
Governance The sharing city project was based on cooperation between the private and public sectors steered by a committee that the city established in February 2013 to promote sharing The committee is made up of representatives working in areas such as the media law IT corporate social responsibility welfare and social innovation In 2013 mayor Park set up the Seoul Innovation Bureau The Bureau encourages peoplersquos engagement in all aspects of city life from identifying challenges to providing policy ideas and participating in the sharing economy402
397 See Urban Sustainability Exchange (nd)398 Ibid 399 See Johnson (2013)400 See Johnson (2014)401 Ibid402 See Centre for Public Impact (2017)
Case studies - waste
161
Other measures Seoul established a car-sharing service with a fleet of around 500 cars and a selection of parking lots and municipal buildings were opened to the public during off-peak times To tackle the growing need for housing the city created a system to connect older people who had spare rooms with students in need of accommodation Shared bookshelves and ldquolibrariesrdquo of tools were also set up in communities across Seoul403
The city works closely with private companies to develop public-private partnerships and finance the programme
Barriers and critical success factorsThe Seoul metropolitan government is the driving force behind the cityrsquos circular economy The mayorrsquos Seoul Innovation Bureau facilitates the sharing model by means of financial and other support for businesses start-ups and communities It is well resourced and funded with 58 staff members and an annual budget of euro55 million404
Stakeholder engagement is at the heart of the sharing economy Strong communication and alignment between the Bureau the mayor private sector partners and communities is an important success factor The mayorrsquos office has arranged more than 6000 workshops resulting in input from 600000 residents with many of these insights since developed into policies and projects For example following a popular suggestion on Twitter the city used mobile phone data to modify the night-bus timetable to meet passenger demand405
In addition to top-down support from the metropolitan government and the mayor the programmersquos success can also be attributed to the cityrsquos encouragement and support for a grassroots resident-driven approach to sharing opportunities Official support is available for tech start-ups and other organisations focused on enabling more sharing However the city acts as a partner and facilitator for these emerging initiatives rather than dictating how they should function406
403 See Johnson (2013)404 See Centre for Public Impact (2017)405 Ibid406 See Johnson (2014)
Case studies - waste
162407 See Centre for Public Impact (2017)408 See Park (2016)409 Ibid410 Ibid411 See Johnson (2013)
The city also records the growth of sharing initiatives and the number of residents attending events and contributing to sharing policies and ideas both online and offline407
While some people were initially sceptical about this new sharing process presentation meetings organised by the city have helped residents to better understand the logic and potential benefits of the approach
Public assurance from the metropolitan government in terms of laws and systems to promote sharing has also been key in helping to generate an ecosystem of start-up companies Taxation in particular has been a sensitive matter and the insurance system for the sharing economy is not yet complete Regulation and laws that stand in the way of sharing activities are continuously reviewed by the city so that amendments can be made by the relevant departments
Results and lessons learned
bull By 2016 the initiative had certified 50 sharing projects and given grants to a number of these Certified projects range from local car-sharing company SoCar to websites like Billiji that help people share things with their neighbours One of the best results of the project is the increasing participation of residents
bull Some individual successes illustrate the scale of the projectrsquos impact the car-sharing enterprises Green Car and SoCar have more than 400000 members the Moducompany platform has shared 2000 parking spaces that are underused during the daytime and childrenrsquos clothing company Kiple has shared eight million items of clothing408
bull Moreover Seoul has opened up almost 800 public buildings for public meetings and events when they are not in use ShareHub has organised a sizeable campaign of public engagement and education with conferences seminars reports and a book
bull The metropolitan government has concluded that these sharing policies have had a positive effect on the economy equivalent to around KRW 48 billion (euro36 million equivalent)409
bull The city government plans to expand the programme and estimates that this could save city residents a total of KRW 12 billion (euro9 million) a year and the city administration KRW 118 trillion (euro900 million) with more than 1200 new jobs and CO2 savings of 30000 tonnes over the course of the expanded programme410
The sharing city project in Seoul has influenced other South Korean cities such as Gwangju and Busan which have implemented sharing activities based on the success of the initiative411 They have taken particular inspiration from Seoulrsquos distinct approach which combines top-down and bottom-up measures
Links to similar initiativesSan Francisco zero waste city Berlin circular city Oslo integrated waste-management strategy
Case studies - waste
163
Snapshot
bull Location Yokohama Japan
bull Population Large ndash 37 million (2015)
bull Policy area Waste
bull Policy options Regulation and information to encourage the reuse of materials and the reformulation of processes incentives for industries to recycle waste information strategies for residents and businesses
bull Financial capacity Strong
bull Administrative capacity Strong
Context and policy overviewIn the late 1990s Yokohama faced a significant challenge with waste generation exceeding the cityrsquos waste treatment capacity In response it proposed a long-term plan in January 2003 called the Yokohama G30 Plan which aimed to facilitate recycling and curb waste production Specifically the plan sought
to reduce waste by 30 per cent by 2010 relative to a baseline of 16 million tonnes of waste in 2001412
Building on the success of this plan a subsequent project was developed in 2010 The 3R Dream Plan aimed to ldquoreduce garbage while continuing the separation and recycling of garbage to deal with global warming and to reduce CO2 emissions [and] to realise [a] comfortable and liveable city where garbage is controlled by pursuing safe secure and stable garbage processingrdquo 413
The Yokohama 3R Dream Plan also demonstrated how manufacturers can produce items using recycled and recyclable materials and encourages the sale of eco-products and services to help avoid and reduce the import use and waste of resources It supported participation by residents through briefings and through campaigns at the many waste collection points and train stations414
Reduce reuse recycle Yokohama Japan
Yokohamarsquos 3R Dream Plan encourages behavioural change and facilitates coordination between residents businesses and the city government to increase recycling and reduce waste
412 See Tokyo Development Learning Centre (2017)413 See C40 Cities (2016a)414 See C40 Cities (2016b)
Case studies - waste
164415 See Tokyo Development Learning Centre (2017)416 Ibid 417 Ibid 418 See C40 Cities (2016b)419 See Tokyo Development Learning Centre (2017)
Implementation The G30 plan gave residents considerable responsibility for separating waste at source and bringing it to designated collection points The city expanded the system to require separation into 10 different categories of waste each to be placed in clear plastic bags for easy identification by waste operatives415 The new plan was supported by extensive education campaigns to raise public awareness of waste management The campaign included more than 1000 seminars for residents on waste reduction and segregation along with numerous events at railway stations and local waste collection sites Citizen volunteers ndash so-called ldquogarbage guardiansrdquo ndash were appointed to promote sorting measures416
The 3R Dream Plan promoted better waste management by ensuring secure and efficient processing and disposal of waste It also sought to encourage collaboration between government agencies businesses and residents in order to achieve Yokohamarsquos vision of becoming a sustainable city For instance the city worked with producers to design products that create less waste and to implement ldquotake backrdquo schemes for the refurbishment or recycling of products that have reached the end of their lifecycle417
Barriers and critical success factorsThe scheme aimed to reduce waste while supporting the cityrsquos economic development Its success was heavily influenced by the participatory environment created between government industry businesses and consumers418
The involvement of residents and companies was critical in Yokohama for the establishment of effective waste management even without the deployment of new technology or investment Education also played an important role ensuring that residents became involved in waste management activities
Results and lessons learnedYokohama achieved the following outcomes through its implementation of the G30 plan and the 3R Dream Plan
bull Yokohama saved approximately euro900 million in capital expenditure by avoiding the construction of two new incineration plants and euro25 million in avoided operational expenditure The new system of recycling was expected to cost approximately euro20 million a year resulting in significant savings for the city 419
Case studies - waste
165
bull By 2015 Yokohama had reduced waste by 45 per cent from a peak of 161 million tonnes in 2001 achieving this success while the cityrsquos population grew by 170000 people over the same period Another marker of success is that by 2005 the G30 plan had already reduced waste by 30 per cent reaching its target five years ahead of schedule420
bull The city experienced a significant reduction in GHG emissions from waste disposal Between 2003 and 2013 waste-related emissions fell by 10 per cent which equates to more than 29000 tonnes of CO2 saved per year421
bull The 3R Dream Plan set a target of reducing waste-related GHG emissions by 59 per cent by 2025 relative to a 2009 baseline422
bull Yokohama aims to cut more than 141000 tonnes of CO2 emissions by 2025 relative to the level in 2009 423
In terms of lessons learned the experience of Yokohama is appealing because it did not require large investment or new technologies to reduce waste In fact the efforts produced new business opportunities in the recycling industry The Yokohama example also shows that the involvement of residents and companies is critical for effective waste management
As landfill capacities fall and environmental regulations tighten many cities are aiming to reduce and avoid waste The experience in Yokohama thus reminds policymakers of the importance of engaging businesses and communities in the increasing drive towards a circular economy
Links to similar initiativesCape Town industrial symbiosis Malmo industrial symbiosis Kristiansand green business competition
420 See C40 Cities (2015)421 Ibid422 Ibid423 See C40 Cities (2016a)
Case studies - waste
166
Snapshot
bull Location Ljubljana Slovenia
bull Population Small ndash 279000 (2016)
bull Economy Service economy
bull Policy area Waste
bull Policy options Establishment of a waste management plan and administrative capacity effective price signals and funding information strategies and funding improvement in waste collection waste sorting and treatment to encourage recycling and energy recovery
bull Financial capacity Strong
bull Administrative capacity Strong
bull Other Supportive national policy
Context and policy overview Slovenia is well recognised as a country that promotes sustainability and green growth In 2016 it became the first to receive a Green Destinations award while Ljubljana was honoured as the European Green Capital424 Waste management played an important role in these awards Indeed Ljubljana has been a leader in its approach to managing urban waste and developing a local circular economy
In September 2014 Ljubljana became the first European capital to commit to zero waste425 The zero-waste strategy encompassed various pillars426
bull expanding separate collection of waste streams at household level
bull collecting residual waste less frequently while maintaining the collection frequency of separate waste categories
bull encouraging residents and businesses to generate less waste
Zero-waste strategy Ljubljana Slovenia
In 2004 nearly all of Ljubljanarsquos municipal waste was sent to landfill However over the last decade the city has seen a tenfold increase in separate collection of reusable and recyclable materials almost eliminating waste disposal to landfill
424 See Ford (2017)425 See European Commission (2019)426 See Oblak (2019)
Case studies - waste
167
The strategy had ambitious targets to achieve 78 per cent separate collection by 2025 (from 60 per cent in 2014) and to reduce the generation of residual waste to 60 kg per capita by 2025 (from 150 kg per capita in 2014)427
The zero-waste scheme is fully operated by Snaga Ljubljana the largest Slovenian municipal waste management company The firm manages waste for Ljubljanarsquos 400000 residents in addition to the inhabitants of 10 neighbouring municipalities428
Under the scheme fees for waste management services are based on the pay-as-you-throw (PAYT) principle in which households pay according to the amount of waste they generate The charges are linked to container sizes and the frequency of collection The average monthly cost per household is euro8 which is among the lowest in Slovenia and the wider region429
ImplementationIn 2002 the city introduced the collection of glass paper and packaging in separate container stands In 2006 it began household collection of biodegradable
waste some 17 years ahead of the implementation deadline set by the EU Waste Framework Directive (200898EC) for separate collection of bio-waste430 In 2012 Snaga replaced neighbourhood and roadside containers for paper and packaging with a door-to-door collection system431
While door-to-door collection of separated recyclable and biodegradable waste was being increased the cityrsquos waste operator began reducing the frequency with which it collected residual waste For single-household dwellings collection of residual waste was reduced to once every three weeks In multi-apartment buildings the collection was weekly while other streams were collected more frequently432
In spite of a significant communication effort by Snaga the public and media initially resisted the changes Rates of separation were low leading to overflowing containers of residual waste However Snaga stuck to the policy and ramped up its communications including arranging a field trip to demonstrate how much of the residual waste in the bins could actually be placed into the more frequently collected waste streams Behaviour gradually changed in response to the new system and by late 2013 the rate of separate waste collection had reached 55 per cent433 A survey
427 Ibid428 See LGB (nd)429 See Snaga Ljubljana (2018)430 See Dakskobler (2019)431 See Oblak (2019)432 Ibid 433 Ibid
Case studies - waste
168
in 2016 indicated high satisfaction rates with the cityrsquos waste system among residents and businesses alike (albeit the results were based on a very small sample size)434
Snaga uses multiple channels to communicate with residents about costs and performance including through its website and social media accounts Users can also set up a free SMS reminder to notify them when waste will be collected
In addition to its household collection system the city operates a reuse centre and two household waste recycling centres for other reusable or recyclable materials These are well used They contribute to overall waste reduction and heighten awareness of waste with a survey reporting that some 70 per cent of residents think about how to ensure the reuse of goods that they no longer need435 Building on this success Snaga plans to construct 10 smaller centres in denser areas436
For its treatment solution the city opted to pursue a mechanical and biological treatment approach instead of the mass incineration of residual waste The Regional Centre for Waste Management (RCERO Ljubljana) opened in 2016 and currently processes almost a quarter of Sloveniarsquos waste The facility produces its own heat and electricity through biogas derived from the processing The facility achieves reuse recycling or energy recovery for nearly all the materials it receives with less than 5 per cent going to landfill437
Barriers and critical success factorsThe key to Ljubljanarsquos success proved to be political support good management and communication and a commitment to constantly increasing zero-waste goals
The introduction of door-to-door collection contributed most to the increase in recycling rates Snagarsquos communication strategy was also critical in helping to overcome initial opposition to the zero-waste strategy through media outreach and stakeholder engagement The example of Ljubljana also shows
how important it is to adjust communication strategies and messages as circumstances change
Results and lessons learnedLjubljana had previously lagged behind the rest of Europe in terms of the recycling and reuse of municipal solid waste Over a 10-year period the city boosted recycling rates from 29 per cent to 68 per cent and cut waste generation to around 358 kg per capita (compared with an EU average of 486 kg per capita) Among EU capital cities Ljubljana managed to achieve the highest share of separately collected waste while keeping waste management costs to a minimum438
Ljubljana became the European Green Capital in 2016 an award based on its environmental record Among the five finalists Ljubljana was the only city without a waste incineration plant or plans to build one Instead it focused on alternative solutions including a comprehensive waste management plan working towards the development of a zero-waste society
Links to similar initiativesSan Francisco zero waste by 2020 Flanders waste management Vancouver zero waste by 2040
434 See Petek (2016)435 See Oblack (2019)436 See Dakskobler (2019)437 See Oblak (2019)438 Ibid
Case studies - waste
169
Snapshot
bull Location Parma Italy
bull Population Small ndash 194000 (2017)
bull Economy Service economy
bull Policy area Waste
bull Policy options Establishment of a waste management plan and administrative capacity effective price signals and funding information strategies and funding improvement of waste collection waste sorting and treatment to encourage recycling and energy recovery
bull Financial capacity Strong
bull Administrative capacity Strong
Context and policy overviewParma is a relatively small city located in northern Italyrsquos Emilia-Romagna region In 2014 the city occupied a dubious position as the countryrsquos most
waste-producing city with 636 kg of municipal waste produced per person (compared with an EU average of around 480 kg per capita)439 Around 50 per cent of municipal waste was collected separately for reuse and recycling and the other half was incinerated or landfilled Door-to-door collection of separate waste streams was very limited with most recycling taking place through collection containers440
Waste became a major point of debate in the 2012 municipal elections Responding to public pressure and to leadership within the city council the city began a series of changes to its collection regime The new system made it easier for residents to separate out their recyclable waste from residual waste and created financial incentives to reduce waste and increase recycling Public engagement and consultation were also integral to the process
ImplementationThe first step was to replace collection containers with door-to-door collection of separate waste streams Parma started this programme in the historical centre and extended door-to-door collection across the city
Zero-waste strategy Parma Italy
Parma dramatically increased the collection of biodegradable and recyclable material in only four years after launching its zero-waste policy in 2012 This success was due to strong political will effective communication and a pricing strategy to set the right incentives
439 See Zero Waste Europe (2016)440 See Heinrich (2018)
Case studies - waste
170
district by district Within 18 months door-to-door collection had been extended to all districts for food waste paper packaging and residual waste Collection frequency varies by material with bio-waste collected more than once per week and residual waste collected weekly (or less frequently in some areas)
The new system was scheduled according to location and population density Waste collection in the city centre occurrs during the night (to avoid blocking streets and causing a nuisance to the night-time economy) while collection in residential areas took place during the mornings Roadside containers were installed for the collection of garden waste and glass
Parma faced a high cost of disposal (euro170 per tonne for its new incinerator) and so the city used a pricing approach to reduce its residual waste stream and lower the overall costs of the system The cityrsquos pay-as-you-throw scheme has a two-part fee structure based on the waste that each household generates The first part is a fixed cost based on the size of the property and household Additional allowances are available for households with children younger than 30 months to account for the additional waste from nappies The fixed cost covers a minimum number of collections per household and also the costs of management and enforcement Additional removals of residual waste beyond the fixed number incur a cost per bag or bin441
Households can earn additional lsquoeco-pointsrsquo for sorting and disposing of electronic hazardous and medical waste in the appropriate way Eco-points are worth a discount of euro015 on the following yearrsquos waste bill up to a maximum discount of euro20442
Households also receive a 12 per cent discount on their bill for home composting443
Parma also introduced lsquoeco-stationsrsquo and lsquoeco-wagonsrsquo to complement the door-to-door collection system and provide flexibility Eco-stations are small kiosks open 24 hours a day where people can recycle their waste outside of the main door-to-door collection hours Recyclables are free to deposit while residual waste incurs a fee Kiosks have eight windows where
recyclables and residual waste can be left accessible with a user card which is also used to collect eco-points for depositing recyclables Eco-wagons are located in the city centre and support the other waste collection services The system operates like a bus service with routes and stations to enable people to bring out their waste at the appropriate time
Barriers and critical success factorsA communication campaign targeting local residents was essential to the success of the new waste system in Parma This included awareness-raising in public squares information sent to peoplersquos homes a specially created hotline and a competition between schools to reduce waste
Residents were concerned that waste collection would not be frequent enough so the eco-stations gave them the option of bringing their extra waste for disposal444 The flexibility of the system increased its acceptability and peoplersquos willingness to support the new approach445
Illegal dumping and fraud were also concerns ahead of the transition Residents are protected through the use of RFID tags in each bag so they are only charged for their own waste The city also installed CCTV
441 Ibid 442 See 2020 Collectors Project (2020)443 See Zero Waste Europe (2016)444 See Heinrich (2018)445 See 2020 Collectors Project (2020)
Case studies - waste
171
cameras at eco-stations and created an app for residents to report illegal dumping Overall rates of illegal dumping were low at around 500 g per capita per year446
Results and lessons learnedThe new system dramatically reduced residual waste and increased the collection of recyclable and biodegradable materials As of 2018 Parma had achieved the following capture rates447
bull paper 81 per cent
bull plastic 69 per cent
bull metal 33 per cent
bull glass 93 per cent
bull composite material 36 per cent
Meanwhile kerbside collection of bio-waste collection nearly doubled from 50 kg to 100 kg per capita per year between 2011 and 2015 while the fraction of impurities fell from 8 per cent to 3 per cent448
Typical costs for households rose in the early years as investments were made in both capital and operations However as the system settled in and savings were captured by reducing disposal costs the cost for customers began to fall After a peak in 2013 typical costs in 2016 were at a similar level to those seen in 2010 before the new system was implemented (around euro250 a year for a three-person household) In effect the city is delivering much better outcomes for the same cost as the old system449
The success in Parma helped the adoption of targets in Emilia-Romagna which exceed national and EU requirements including a 25 per cent reduction of total waste 73 per cent separate collection and 70 per cent effective recycling This system incentivised
cities to achieve the best performance while penalising those lagging behind Through this regional system of incentives Parma has received euro710000 for its reduction of residual waste450
Links to similar initiativesLjubljana zero-waste city San Francisco zero waste by 2020 Flanders waste management
446 See Heinrich (2018)447 See 2020 Collectors Project (2020)448 See Ricci (2020)449 See Heinrich (2018)450 See Zero Waste Europe (2016)
Case studies - waste
172
Snapshot
bull Location Belo Horizonte Brazil
bull Population Large ndash 25 million (2015)
bull Policy area Waste
bull Policy options Formalisation of informal services improvement of waste collection
bull Financial capacity Limited
bull Administrative capacity Strengthening
Context and policy overview451
Belo Horizonte is a large middle-income city in the Brazilian state of Minas Gerais The cityrsquos population has grown rapidly from around 35 million in 1990 to around 6 million today
Waste management has been a key challenge for Belo Horizonte as the city has grown In the mid-20th century much of its waste went to an open dumpsite which was scavenged for valuable materials by catadores waste pickers living on the margins of society The city stopped this practice when the dumpsite was closed and replaced with a sanitary landfill in the early 1970s The waste pickers continued to operate but were marginalised and persecuted by the authorities responsible for urban sanitation In response the catadores made use of 1988 legislation to form a workersrsquo cooperative called the Association of Collectors of Paper Cardboard and Recyclable Material (ASMARE)452
In the 1990s the city developed a flexible and integrated system of solid waste management which incorporated the waste pickers into a formalised relationship with the cityrsquos waste authority SLU and the wider waste and recycling ecosystem According to Aurora Pederzoli SLU Chief of Special Programmes ldquoOur solid waste management model is based on
Formalisation of informal waste pickers Belo Horizonte Brazil
Belo Horizonte Brazilrsquos third-largest city began to address its waste management issues in the 1970s with a new sanitary landfill However it took a new formalised relationship with catadores ndash informal waste pickers ndash to deliver a truly integrated solid waste management system
451 See Centre for Public Impact (2016)452 See Magni and Guumlnther (2014)
Case studies - waste
173
a concept of social inclusion and income and job generationrdquo453
ImplementationThe cityrsquos adversarial relationship with waste pickers began to change when the Pastoral de Rua of the Archdiocese of Belo Horizonte engaged with the cooperative to understand their needs and aims The Pastoral mediated negotiations with the city to develop a plan for the waste management system which had the support of all participants ndash the city the waste authority ASMARE and other waste businesses454
Belo Horizontersquos environmental plan for recovery and recycling of civil construction waste was initiated in 1993 to provide a mixed system of waste collection and drop-off sites with selective waste-sorting carried out by the waste pickers455 The city introduced weekly kerbside collection of paper metal glass and plastic and established collection sites for households not served by kerbside collection Waste from both streams was sent to the cooperative warehouses for the sorting and recovery of recyclable materials456
In 2003 the city set up a citizenrsquos forum to facilitate greater dialogue on waste issues The purpose of the forum was both to review progress and to expand the system to include other workersrsquo cooperatives457
In 2011 the state government introduced a lsquorecycling bonusrsquo a financial incentive for the waste pickers Payments are made on the basis of the quality and value of the recyclable raw materials The payment provides an additional source of income for these workers but also provides an incentive to the cooperatives to innovate to improve the quality of recyclates and to improve business management practices458
Barriers and critical success factorsThe cityrsquos successful approach was preceded by a long period of dispute and acrimony with waste pickers
Intensive communication and sustained political support for the new integrated system were therefore essential to overcome the legacy of mistrust between different actors in the cityrsquos waste system Belo Horizonte used creative communication approaches including carnival parades theatre dance and music to change public attitudes to the waste pickers and their positive contributions to the cityrsquos environmental quality
The legal framework limited the cityrsquos ability to reform the waste system These issues were addressed over time including through a change at city level to assign the rights to cooperatives to collect and sell recyclable raw materials At the federal level in 2001 waste collecting was classified as a professional occupation459
453 See LSE Cities ICLEI and GGGI (2013)454 See Magni and Guumlnther (2014)455 See Sabatino (2017)456 See Centre for Public Impact (2016)457 See Sabatino (2017)458 See Dias (2016)459 See Sabatino (2017)
Case studies - waste
174460 See Centre for Public Impact (2016)461 Ibid 462 See Colombijn and Morbidini (2017)463 See Centre for Public Impact (2016)464 See LSE Cities ICLEI and GGGI (2013)
Results and lessons learnedThe achievements and positive change in Belo Horizontersquos waste management have proved to be a model for other Brazilian cities Key outcomes included the following
bull By 2012 the cityrsquos formal waste management system was serving 95 per cent of the urban population and at least 70 per cent of favelas with 93 per cent of residual waste being disposed of in sanitary landfills460
bull Some 3000 waste workers are supported by the system and together with the municipal waste management system they had collectively recycled up to 20000 tonnes by 2012
bull Working conditions for waste collectors improved significantly with the introduction of a monthly minimum wage of euro270461 The cooperatives provide the workers with a degree of security462
bull Skills development and training were delivered through a Municipal Waste and Citizenship Forum which was supported by municipal funding and additional support of euro125000 from Caixa Bank463
bull Recycling outcomes were relatively low with recycling rates remaining below 10 per cent as of 2008464
Links to similar initiativesBangalore informal waste pickers Four strategies to integrate waste pickers Waste pickers and cities
Case studies - governance
175
Snapshot
bull Location Poland
bull Population 378 million countrywide (2019)
bull Policy area Governance
bull Policy option Political and fiscal decentralisation
bull Financial capacity Strengthening
bull Administrative capacity Strengthening
Context and policy overviewDecentralisation in Poland began soon after the collapse of the Soviet Union The early reforms devolved various central government functions including some revenue-raising authority to existing municipalities In 1999 the country implemented structural reforms of provincial and local government which saw further devolution of powers to counties
and municipalities bringing public services closer to people and making local government in Poland more accountable to its electorate465
Most of the interaction between citizens and public services occurs at the local level and in Poland local governments have a good reputation466 This success was achieved through reforms to administration and by strengthening the capacities of cities and regions467 To implement reform changes were made to legislation and the operation of public administration The implementation process was monitored and evaluated and the public were kept informed468
ImplementationFundamental changes were required to the structure of central and local systems including to legislation staffing and organisation It was also necessary to address issues regarding the ownership of public infrastructure and services
Initially the state established new institutions including new offices for the different levels of public
Political and fiscal decentralisation Poland
Decentralisation in Poland has been successful leading to increased local revenue and improved service delivery Most interaction between citizens and public administration now occurs at the level of local governments the most trusted institutions in the country
465 See World Bank Group (2017) 466 See Laszek and Trzeciakowski (2018) 467 See European Association for Local Democracy (2016) 468 See Kulesza (nd)
Case studies - governance
176
469 See demosEuropa ndash Centre for European Strategy (2015) 470 See Szescilo and Kulesza (2012) 471 See World Bank Group (2017)472 See Schiffbauer and Varela (2019) 473 See Szescilo (nd) 474 See Laszek and Trzeciakowski (2018)475 Ibid
administration followed by a sharing of assets and staff between these institutions Next a list of public institutions was created and passed to territorial self-governments to allow them to take over the running of these assets
In terms of sequencing Polandrsquos series of political and fiscal reforms since 1990 have been delivered through at least three different approaches469 Between 1989 and 1991 the ldquoshock-therapyrdquo technique was used to create rapid change in the economic system In 1997 a ldquobig bangrdquo approach was employed to implement four major structural reforms within a year More recently the preferred approach has been incremental making important decisions in separate stages Of these three approaches the 1997 reforms in particular towards a three-tier system of local and regional self-government enabled local communities and society as a whole to take a greater stake in the countryrsquos development Delegating responsiblity for public tasks led to stronger local government470 Municipalities therefore have a high level of autonomy within the Polish system although they must act within the law
Barriers and critical success factorsPoland used a gradual programme of reform to increase transparency and accountability allowing the changes to become effective and the country to absorb large EU funds efficiently471 Initially reforms focused on institutions that did not fit with the new market economy context These efforts were followed by steady action to enable the institutions that had been retained to evolve in response to the growing sophistication of Polandrsquos market economy The shared goal of EU accession also spurred political support for the reform of institutions472
While public expenditure has been decentralised local government has limited control over taxes473 Control over expenditure and revenue alike is important for local government to succeed474
There can be friction between local and national tiers of government when the degree of autonomy is not established in advance It is clear that detailed and well-communicated legislation is key to success
Results and lessons learned
bull Local government has been effective without large regional disparities
bull Service delivery improved because local governments were able to implement centrally designed policies and they had greater accountability
bull Increased accountability allowed local governments to boost their revenue while also benefiting from dependable intergovernmental transfers and large amounts of EU funds
bull Poland has become more resilient to economic downturns
bull In a recent survey local governments ranked as the most trusted public institutions in Poland475
Links to similar initiativesUnited Kingdom decentralisation Colombia decentralisation Finland decentralisation
Case studies - governance
177
Snapshot
bull Location Vienna Austria
bull Population Large ndash 19 million (2019)
bull Economy Service economy
bull Policy area Governance
bull Policy option Improving transparency and accountability
bull Financial capacity Strong
bull Administrative capacity Strong
Context and policy overviewVienna is regularly ranked as the city that offers the worldrsquos best quality of life476 It also has a tradition of strong governance and engagement with residents in constructive participatory dialogue
While Viennarsquos employment rates and average incomes are high the region and the city face
environmental challenges including pollution of the Danube River due to unsustainable development along its banks and increasing air pollution due to private transport477
Against this background in June 2014 Viennarsquos city council adopted the Smart City Wien Framework Strategy (SCWFS) a comprehensive scaffold for developing effective responses to climate change including radical conservation of resources and productive use of new technology Projects that have emerged from the strategy include for instance an initiative for e-car-sharing478 The strategy was updated in 2019 to incorporate the UN Sustainable Development Goals and to reflect the increased urgency of addressing climate change479
There was concern that such a complex long-term framework would develop actions that would be left by the wayside among the daily pressing agendas of local government Therefore the city council required the municipal administration to undertake a periodic monitoring programme and to verify at regular intervals that the frameworkrsquos objectives were being met480 This monitoring was intended to serve as a performance management tool for policymakers
Smart city performance monitoring Austria Vienna
Vienna has developed a comprehensive programme to monitor the impact and key objectives of its Smart City Wien Framework Strategy These include resource conservation innovation and improvements in quality of life
476 See Mercer (2015) 477 See WWF (nd) 478 Ibid479 See Brandl and Zielinska (2020) 480 See Municipal Department MA 18 ndash Urban Development and Planning (2018)
Case studies - governance
178
and to support the city in implementing and updating the strategy
Vienna recognised that to back this monitoring process and make the strategy more transparent the city would need to establish a central data platform This had to cover the entirety of the municipal administration and ensure access for residents and the exchange of information In this way it would involve all of the main stakeholders in the implementation of the SCWFS
Two principles were defined for the monitoring approach First there would be extensive cooperation across city departments and associated organisations to maximise support and ownership The second key principle was to minimise the data collection workload for participants and to focus on analysing the existing data pool and reporting structure
ImplementationVienna created the SCWFS in 2013 following two years of stakeholder engagement and the City Council Resolution of 2014 which first stipulated the need for a monitoring process
The initial step was to conduct an extensive exploratory project to establish a methodology for monitoring that would reflect the objectives of the SCWFS The first monitoring process took place in 2017 as part of an EU-funded project and consisted of
bull monitoring objectives by evaluating them individually based on an extensive set of indicators
bull carrying out overall monitoring of the Frameworkrsquos results
One-third of the objectives could be measured quantitatively However the remaining objectives posed greater challenges as their measurement required extensive qualitative descriptions In these cases individual indicators were grouped together making it possible to assess a subject area in more general terms
Some of the indicators used by the city were found to require greater precision before they could provide a more comprehensive picture although Vienna recognises that evaluation of indicators should be an ongoing process
The monitoring is a resource-heavy and time-consuming process exacerbated by the absence of a central overview of the cityrsquos data Indeed centralised access to the Viennarsquos data pools has been identified as an area for future improvement This could be achieved through further improvement to the online reporting tool already in place and by providing access for the entire municipal authority
An additional evaluation is expected to take place in order to make the process more routine
The monitoring programmersquos key success factor was its integration of evaluation with the strategic performance management cycle for the overall framework This ensured that the findings could be fed back in more effectively
The division of tasks across a multitude of stakeholders according to their areas of expertise (data provision for instance) was supported by academic institutions This approach ensured ownership and reduced the administrative burden on local government
Results and lessons learnedThe cityrsquos monitoring process involved particpants from across the municipality and stakeholder organisations These organisations took different roles in the process from reporting on goals to providing objective evaluation and data This illustrates the methodologyrsquos effective approach of engaging a multitude of stakeholders thus creating ownership of the framework481
One feature of Viennarsquos implementation framework is the Smart City Agency which is responsible for coordinating activities under the framework482 An agency of this kind is a key ingredient in the successful implementation of smart city strategies483
481 See Municipal Department MA 18 ndash Urban Development and Planning (2018)482 See Urban Innovation Vienna (2020) 483 See SmartCities World (2019)
Case studies - governance
179
The monitoring provided evidence-based findings on progress against individual objectives and showed where the city needed to make further progress For example the assessment identified that Viennarsquos CO2 reduction target for 2030 had almost been achieved just one year after the framework was launched Although this was a positive finding the monitoring also identified persistent social disadvantages in access to green space Some measured outcomes of the SCWFS as detailed in the 2017 monitoring report include
bull a reduction in per capita GHG emissions of 33 per cent in 2014 relative to a 1990 baseline (this is a headline goal with the reduction of GHG emissions being the strategyrsquos prime objective)
bull a fall in per capita energy consumption since 2005 of around 14 per cent
bull growth in the share of renewable energy from 121 per cent in 2010 to 195 per cent in 2015
Using the monitoring framework to not only report achievements but to put these in the context of progress against an eventual target ensures a long-term view and identifies the scale of further actions required For example the 2017 monitoring report identified successes and good progress against some targets but also areas of stagnation or poor performance for instance
bull levels of car traffic have stagnated since 2013 and Vienna is not on track to meet its objectives to shift to other modes of transport
bull similar stagnation or fluctuation in the trends for environmental indicators in buildings and in the water and waste sectors suggests that efforts are required to remain on track or get back on track
The accountability offered by a monitoring process has been shown to have a tangible impact on the fulfilment of a cityrsquos strategy Moreover in Vienna the data collection necessary to complete the monitoring and evaluation in a smart way was built on existing databases and enabled the creation of a new online reporting tool
Links to similar initiatives Alba Iulia smart city City of York performance management Utrecht and the UN SDGs
Case studies - governance
180
Snapshot
bull Location Cluj-Napoca Romania
bull Population Medium-sized ndash 303000 (2012)
bull Policy area Governance
bull Policy option Effective stakeholder participation
bull Financial capacity Strengthening
Context and policy overview484
Over the last decade Cluj-Napoca has been the only growing city in Romania Its evolving cultural life has transformed Cluj-Napoca into a vibrant European city with a multicultural environment that attracts tourists and businesses The city received the European Youth Capital title in 2015 a year in which it organised a range of cultural events Cluj-Napoca is home to the Paintbrush Factory an industrial facility that was
converted into a cultural space and is one of the countryrsquos most notable artistic projects485 In short the city has gained its place as a centre of culture and innovation
In 2017 Cluj-Napoca established the Civic Imagination and Innovation Centre (CIIC) offering residents the opportunity to take part in shaping their city and community The inauguration of the CIIC was marked with a debate to identify solutions for the regeneration of a local park Local government representatives residents specialists and academics meet at the CIIC to collaborate on transforming the city
The CIIC is led by public administration It has no permanent location and functions by collaborating with the community The centre is funded by the municipal budget costing the city euro10000-euro15000 n month486
Co-designing and co-creating urban solutions Cluj-Napoca Romania
Cluj-Napoca established a centre for civic innovation and imagination to encourage debate and collaboration among community representatives and city stakeholders about urban projects
484 See ROCK (2019) 485 See ASEF CULTURE360 (2011)486 See Innovation and Civic Imagination Centre ndash CIIC (2019)
Case studies - governance
181
ImplementationThe CIIC has revamped the cityrsquos method for designing and developing large-scale urban intervention projects Debates focus on an array of themes such as urban and public spaces and museums
In 2018 the centre hosted the third Romanian national workshop on the ldquoAttractive Danuberdquo The worshoprsquos overall objective was to identify at a national level measurable indicators of the attractiveness of a region (for the purposes of investment in tourism and business) However the workshop held in Cluj focused specifically on bringing the discussion towards local problems and solutions487 Attendance was broad ranging from various levels of government to interest groups academics and businesses The Territorial Attractiveness Monitoring Platform (TAMP) an open online platform that maximises accessibility was introduced at the event and received good feedback This workshop alongside other national workshops in the series yielded recommendations from a diverse range of 35 organisations to include 86 draft Territorial Attractiveness indicators within the TAMP tool488
Early 2019 saw two further debates one on an urban plan for a large-scale development area (Sopor) and a citizen panel focused on EU Cohesion Policy
Barriers and critical success factors Having clear objectives for meetings and communications was important in Cluj-Napoca to ensure that people understood the purpose of these events It was also important to assign a manager who would be in charge of analysing the information collected
Using a multidisciplinary approach CIIC events elicited a number of viewpoints which allowed a story to be told and engaged the community Where there were socio-cultural differences the CIIC used facilitators to resolve clashes and address the local dynamics Local communities had the opportunity to learn about the process of urban development and planning
In addition communication about government intentions and an inclusive dialogue that
accommodated differing points of view were important for promoting public participation Furthermore the centre offered capacity-building for stakeholder engagement to local communities helping them to understand the planning and urban development process step by step
Results and lessons learnedThe centre has enabled the creation of levers such as public debates oriented towards addressing urban problems and bridging the gap between three key groups the city administration experts and residents
Two years after CIICrsquos inauguration residents are more aware of the opportunities they have to participate and feel empowered to take part in the urban planning and development The move has enabled more innovation and new ideas allowing the community to become involved and to have more interaction with the changes to their city
The success of the CIIC shows that active engagement of residents in urban planning does not need to come at a very high cost Moreover the experience in Cluj-Napoca demonstrates the importance of setting clear objectives and expectations with regard to facilitating debates between residents and policymakers
Links to similar initiativesSkopje innovation lab Bologna civic collaboration Lyon citizen participation Satildeo Paulo civic participation
487 See UrbaSofia (2018) 488 See Interreg Danube Transnational Programme (2018)
Case studies - finance
182
Snapshot
bull Location Bogotaacute Colombia
bull Population Large ndash 71 million (2018)
bull Policy area Finance
bull Policy option Improved revenue and financial autonomy
bull Financial capacity Strengthening
bull Administrative capacity Strengthening
Context and policy overviewLegislation authorising the use of a betterment levy known as the contribucioacuten de valorizacioacuten is common in Latin American countries This form of levy is often opposed because it can be complex and resource intensive However in Colombia the betterment levy has been used regularly to raise revenue to fund public works489 490
ImplementationThe amount of the betterment levy is set to the lowest value among the following three factors
bull the cost of the project
bull the value that the project creates
bull the affordability of the levy (whether property owners can afford to pay the levy)
Bogotaacute has been innovative in its use of the levy For example the city applied it across a package of road projects and other infrastructure upgrades491
The Urban Development Institute (Instituto de Desarrollo Urbano or IDU) is responsible for administering the betterment levy in Bogotaacute The IDU also selects the infrastructure upgrades that the levy will finance All affected properties are subject to the levy which is calculated by multiplying different benefit factors
The IDU defines the ldquoareas of influencerdquo that will benefit from the levy This definition is based on a propertyrsquos proximity and access to a project and hence to benefits (such as an increase in land value) The IDU endeavours to maximise the number of properties within this area in order to lower the average burden of the levy on individual properties The benefits for an area could include for instance
bull better road layouts leading to increased mobility and transit speeds shorter transit
Land-value capture Bogotaacute Colombia
Bogotaacute has applied a form of ldquobetterment levyrdquo to finance road and other infrastructure upgrade projects around the whole city
489 See World Bank (2009)490 See Borrero Ochoa (2011)491 Ibid
Case studies - finance
183
times lower operating costs and a better quality of life
bull better public spaces
bull stimulation of new commercial activity
bull increased real estate value
bull better integration of the area into the city structure
bull regeneration
In Bogotaacute the betterment levies are no longer tied specifically to incremental changes in land value492
Barriers and critical success factorsInitial criticism emerged in relation to the cost of implementing the levy system for infrastructure projects (particularly the cost of administration) and in relation to the calculation of land value gains which were not measured directly and were therefore found to be inaccurate To address the criticism and reduce the burden on those paying the levy city authorities had an incentive to underestimate the cost of infrastructure projects which led to underfunding of infrastructure The authorities also focused schemes in wealthier areas where landowners could pay more easily As a result infrastructure improvements were unequally distributed across Bogotaacute493
Creating trust is an essential component of the success of betterment levies This trust must be built largely on affordability the equitable distribution of benefits the promotion of social value and participation by city residents in the process and its implementation494
In Bogotaacute public resistance to the betterment levy has since been tempered by spreading public works improvements across the entire urban area In addition the city has given residents the option to pay the levy over five years minimising the financial impact on each property owner This has enabled
Bogotaacute to use valorizacioacuten payments to repay the short-term debt used to fund construction
Results and lessons learned
bull In the period 1997-2007 Bogotaacute financed 217 public works projects through the contribucioacuten de valorizacioacuten These projects were located throughout the city and primarily consisted of bridge and road projects and improvements to drainage495
bull Over the same period the city used the levy to finance more than US$ 1 billion of municipal public works496
Links to similar initiativesChina and India value capture via land sale Satildeo Paulo sale of development rights Istanbul municipal and state land sales
492 Ibid 493 See World Bank (2009)494 See Borrero Ochoa (2011)495 See World Bank (2009)496 See Blanco et al (2017)
Case studies - finance
184
Snapshot
bull Location Rijeka Croatia
bull Population Small ndash 128000 (2011)
bull Policy area Finance
bull Policy option Improved accountability and transparency
bull Financial capacity Strengthening
bull Administrative capacity Strong
Context and policy overviewRijeka is a port city in Croatia comprised of 34 municipal entities and a population of 130000497 It is one of the smallest and most densely populated cities in Croatia In recent decades Rijeka has grown steadily intensifying environmental challenges such
as transport pollution light pollution and wastewater treatment498
The city undertook several investments in the early 2000s to address these challenges including funding 13 buses and 8 minibuses that run on CNG and establishing Croatiarsquos first CNG filling station However in order to facilitate these investments Rijeka needed to assess its financial position and improve the financial management of the municipality499
The strategic objectives of the city were
bull to attract global investment through the development of the Rijeka Gateway project
bull to develop a competitive economy based on knowledge and new technology and
bull to strengthen social inclusion through the implementation of capital investment projects
Diagnosis framework for municipal finance Rijeka Croatia
Rijeka has successfully implemented the World Bankrsquos Municipal Finance Self-Assessment framework to evaluate the cityrsquos financial health and identify specific actions that will improve its public spending and mobilisation of funding
497 See Croatian Bureau of Statistics (2012)498 See World Bank Institute (2013)499 See Environmental Local Authorities InterBalkan Network (nd)
Case studies - finance
185
In 2012 Rijeka used the World Bankrsquos Municipal Finance Self-Assessment (MFSA) tool to strategically assess its finances and develop a long-term action plan for financial management and investment decisions500
ImplementationThe work of applying the MFSA began in 2012 The framework provides a common methodology and internationally accepted indicators which can aid cities in accessing external funding and in more efficiently tracking local resources and spending over time The key steps of the framework are as follows501
1 Transform core databases of municipal financial data into the MFSA format
2 Carry out analysis of historic trends and balances and assess the level of services provided
3 Calculate financial ratios and set benchmarks
4 Use growth trends to identify financial needs and the implications of future policy decisions
5 Assess the quality of financial management using performance indicators identifying strengths and weaknesses in the current system
The MFSA framework is intended to improve the transparency of municipal financial management and help cities make more prudent investment decisions
As a self-assessment this approach can require significant administrative resources to review the current spending and finances of a city However the task can be outsourced to external auditors so that the local government are not direct owners of the process but instead analyse and interpret the results to develop a long-term action plan
Rijeka prides itself on its strong digital credentials and sought to incorporate its smart city infrastructure into this self-assessment to make its municipal finance more transparent and encourage residents to become involved502 In 2011 Rijeka launched an interactive game Proračun(ajme) (Budget me) on its municipal open data portal The game allowed residents to create their own budget for the city based on existing funds This educated people about details of the current budget and allowed them to simulate juggling the city finances503
The strategic long-term financial plan was published in 2014 Subsequent developments in relation to the transparency of municipal finance included the development of a public finance portal created in 2016
500 See World Bank Institute (2013)501 Ibid 502 See Filipovic (2019) 503 Proračun Grada Rijeke (2018)
Case studies - finance
186
The self-assessment revealed that between 2008 and 2012 Rijekarsquos average annual decrease in revenue was 29 per cent and the debt burden increased significantly These findings along with the financial ratio analysis indicated that the cityrsquos fiscal autonomy was weak These trends reflected the economic crisis of 2008 and falling GDP at the national level504
This assessment enabled the city to identify its need to finance capital expenditure through the national government or private financing which it could achieve by strengthening municipal financial transparency and accountability The procedures and benchmarking established by the MFSA assist in this process
The framework has a number of unique features that differentiate it from normal practices It can promote accountability in local administration by focusing on self-assessment by municipal staff which also enables them to more effectively identify the most realistic actions to place in their improvement plan505
City officials are also actively encouraged to share their findings with other cities to promote learning and visibility in the use of public funds An example of this approach was the UPP Technical Workshop on Municipal Finance and Urban Audit held in 2018 with 40 participants from cities in Albanian and North Macedonia506
Results and lessons learnedBy using the MFSA approach Rijeka developed an action plan to improve its finances The main objectives of this multi-year planning and capital investment programme were507
bull to provide a stronger revenue foundation for the city with more robust local tax collection
bull to increase the autonomy and flexibility of financial operations
bull to improve financial management and build capacity and financial literacy within the city council
The MFSA tool not only helped Rijeka to identify these key objectives but also enabled the city to meet these goals in the future by providing a key framework for tracking spending through the use of financial ratio analysis which creates municipal finance benchmarks for internal purposes
Links to similar initiativesZaprešić creditworthiness Kolkata creditworthiness Istanbul land asset management
504 See World Bank Institute (2013)505 See Farvacque-Vitkovic and Sinet (2014)506 See SEE Cities (2018)507 See World Bank (2013)
Case studies - finance
187
Snapshot
bull Country Melbourne Australia
bull Population Large ndash 48 million (2017)
bull Policy area Finance
bull Policy option Municipal funding support for green investments
bull Financial capacity Strong
bull Administrative capacity Strong
Context and policy overviewIn 2003 the city of Melbourne set out a roadmap to achieve net zero emissions by 2020508 The Sustainable Melbourne Fund (SMF) was established concurrently with the roadmap preparation in order to provide financial support to businesses implementing projects that have an environmental benefit These projects include everything from solar waste and
water solutions to more innovative and complex measures such as waste to energy projects509
The SMF furthers the city councilrsquos sustainability goals ensuring that the activities it funds create financial social and environmental benefits
In 2016 the fund was valued at AUD 156 million including an initial investment of AUD 5 million in equity and a further AUD 10 million debt facility510 This success led to national expansion of the programme In 2019 the fund was recapitalised and expanded across Australia with increased investment becoming the Sustainable Australia Fund511
The fund allows both tenants and property owners of small and medium-sized enterprises (SMEs) to obtain up to 100 per cent finance with repayments made through the local council (often through property rates) This enables a business to get an immediate boost to its profits through a reduction in energy bills while property owners benefit from capital growth to their building Loans of up to AUD 500000 are provided for individual projects that deliver environmental and economic benefits512
Climate Fund Melbourne Australia
The Sustainable Melbourne Fund allows both tenants and property owners of small and medium-sized enterprises to obtain 100 per cent finance for renewable-energy and energy-efficiency projects with repayments made through council rates
508 See City of Melbourne (2008)509 See City of Melbourne (nd)510 See C40 Cities (2016)511 See Sustainable Australia Fund (2020)512 See City of Melbourne (2020)
Case studies - finance
188
513 See Sustainable Australia Fund (2020)514 See C40 Cities (2016)515 See Better Building Finance (nd)516 See C40 Cities (2016)517 Ibid 518 Ibid
ImplementationA key component of the SMF programme involves financing packages that are designed to overcome the hurdle of owners lacking credit The Environmental Upgrade Finance (EUF) for instance is a flagship product developed for the programme and administered by the SMF
The EUF is an agreement between parties ndash the owner of the building a financial institution and the city of Melbourne The financial institution lends money to the building owner and the city uses rates andor taxes to collect the loan repayments and return these funds to the lender The loans are specially designed to include fixed interest rates and repayment periods of up to 20 years Importantly the charge is fixed to the building and can be passed on to the next owner if the building is sold513
As a further option retrofitting costs (in other words the loan) can be shared between the owner and the tenant as a way of overcoming the split-incentive dilemma whereby the owner pays for an upgrade and the tenants benefit from lower energy expenses514 The SMF also developed a simple application process for SMEs that does not require consent or approval from the existing financiers of the properties
Barriers and critical success factorsDeveloping new products and services of this type requires a sound understanding of where market gaps exist The SMF studied the market produced novel revenue models went beyond the simpler goal of stimulating economic activity in the sustainability sector and created scalable products and services
When a city operates a climate fund it can require substantial resources Frequently the city will also depend on partner organisations to help in particular technical or specialist areas such as creating communications and sales strategies For example the SMF partnered with ClimateWorks Australia to create the Better Building Finance website515
Communications and public relations are also critical in the creation of climate funds It is also vital to sell as much of the financial package as possible516
Results and lessons learned
bull The SMF has directly invested more than AUD 169 million (US$ 125 million equivalent) in building retrofits district or neighbourhood innovations renewable energy systems software technology and lighting solutions517
bull Cumulatively these investments have led to GHG reductions that exceed 245000 tonnes The SMF reinvests the returns and co-finances projects with other banks Altogether this work has resulted in more than AUD 26 million (US$ 192 million) of projects in energy efficiency and renewable energy518
Councils can play a key role as facilitators between tenants property owners and financial institutions Melbourne has demonstrated a role for councils in developing new financial products and services that meet the needs of disparate groups The council found that the SMFrsquos administrator role in environmental upgrade agreements was cost effective and aligned with the preferences of the industryrsquos key actors
Links to similar initiativesMelbourne renewable energy aggregated power purchase agreement San Francisco investment grant Mexico City green bond
189
AfDB ADB EBRD and IDB (2019) Creating Liveable Cities Regional Perspectives ADB Manila Available at httpswwwadborgsitesdefaultfilespublication531126livable-cities-main-reportpdf (last accessed 18 August 2020)
M F Alam S S Guntoju and A Sikka (2019) ldquoChennai Water crisis a wake-up call for Indian citiesrdquo Down to Earth Available at httpswwwdowntoearthorginblogwaterchennai-water-crisis-a-wake-up-call-for-indian-cities-66024 (last accessed on 29 September 2020)
E Al-Karablieh and A Salman (2016) ldquoWater Resources Use and Management in Jordan ndash a Focus on Groundwaterrdquo IWMI Project Report 11 Available at httpsgw-menaiwmiorgwp-contentuploadssites3201704Rep11-Water-resources-use-and-management-in-Jordan-a-focus-on-groundwaterpdf (last accessed on 29 September 2020)
African Circular Cities Alliance (nd) ldquoSouth Africa Case Studiesrdquo ACCA Available at httpsafriccaorgcase-studiesSouthAfrica (last accessed on 24 September 2020)
M P G Aguilar (2015) ldquoParticipatory Design for Public Urban Spacesrdquo Global Compact Cities Programme website Available at httpscitiesprogrammeorgwp-contentuploads201910participatory_design-report_webpdf (last accessed 18 August 2020)
Ajuntament de Barcelona (nda) ldquoCitizen Commitment to Sustainability ndash a More Sustainable Barcelonardquo Available at httpsajuntamentbarcelonacatecologiaurbanaenwhat-we-do-and-whypublic-commitmentcitizen-engagement-network (last accessed on 29 September 2020)
Ajuntament de Barcelona (ndb) ldquoSuperblocks - lsquoLetrsquos fill the streets with lifersquordquo Available at httpsajuntamentbarcelonacatecologiaurbanaenbodies-involvedcitizen-participationsuperblocks (last accessed on 29 September 2020)
Ajuntament de Barcelona (ndc) ldquoA road map to combat climate changerdquo Available at httpswwwbarcelonacatbarcelona-pel-climaennoticiaa-road-map-to-combat-climate-change_646065 (last accessed on 29 September 2020)
Ajuntament de Barcelona (ndd) ldquoUrban Mobility Plan (2013-2018)rdquo Available at httpsajuntamentbarcelonacatecologiaurbanaenwhat-we-do-and-whyactive-and-sustainable-mobilityurban-mobility-plan (last accessed on 29 September 2020)
Ajuntament de Barcelona (nde) ldquoNew Urban Mobility Plan for 2019-2024rdquo Available at httpswwwbarcelonacatmobilitatennews-and-documentsnew-urban-mobility-plan-2019-2024 (last accessed on 29 September 2020)
S Aparcana (2017) ldquoApproaches to formalization of the informal waste sector into municipal solid waste management systems in low- and middle-income countries Review of barriers and success factorsrdquo Waste Management Vol 61 pp 593-607
ASEF CULTURE360 (2011) ldquoThe Paintbrush Factoryrdquo Available at httpsculture360aseforgresourcespaintbrush-factory (last accessed on 6 August 2019)
Asian Development Bank (2011) Inclusive Cities Urban Development Series Manila Available at httpswwwadborgpublicationsinclusivecities (last accessed 18 August 2020)
AVK International (nd) ldquoExcessive leakage reduction in Drakensteinrdquo Available at httpswwwavkvalveseuencaseswater-casesleakage-reduction-drakenstein (last accessed on 5 August 2019)
R L Baghdali T Yino M Nasereddin and L Nadifi (2013) ldquoDocumentation of best practices in non-revenue water management in selected Mediterranean countriesrdquo Available at httpwwwswim-smeufilesBest_Practices_in_non-revenue_water_EN_Finalpdf (last accessed on 29 September 2020)
Baltic Environment and Energy (2007) ldquoSwedish Environmental Policies History and present regulationsrdquo Available at httpwwwubcwheeleudownloadphpattachmentsarticles607Swedish20environmental20policypdf (last accessed on 20 October 2020)
L Barber (2016) ldquoCarsharing carpooling ridesharinghellipwhatrsquos the differencerdquo 12 May 2016 Liftshare website Available at httpblogliftsharecomliftsharecarsharing-carpooling-ridesharing-whats-thedifference (last accessed 18 August 2020)
Barcelona Energia (2019) ldquoNuestra Actividadrdquo Barcelona Energia web page Available at httpswwwbarcelonaenergiacatesnuestraactividad (last accessed 18 August 2020)
U Batsaikhan Z Darvas and I Goncalves Raposo (2018) People on the move migration and mobility in the European Union Blueprint Series 28 Bruegel Brussels Available at httpbruegelorgwp-contentuploads201801People_on_the_move_ONLINEpdf (last accessed 18 August 2020)
M Bausells (2016) ldquoSuperblocks to the rescue Barcelonarsquos plan to give streets back to residentsrdquo The Guardian 17 May 2016 Available at httpswwwtheguardiancomcities2016may17superblocks-rescue-barcelona-spain-plan-give-streets-back-residents (last accessed on 29 September 2020)
BBC (2009) ldquoThe city where bicycles dominaterdquo Available at httpnewsbbccouk1hiengland8393475stm (last accessed on 20 October 2020)
BBC News (2016) ldquoYoung people urged for park-life viewsrdquo M Kinver September 2016 BBC website Available at httpswwwbbccouknewsscience-environment-37505850 (last accessed 18 August 2020)
Berliner Energieagentur (nda) ldquoEnergy Saving Partnership A Berlin Success Modelrdquo Available at httpseceuropaeuenergyintelligentprojectssitesiee-projectsfilesprojectsdocumentseesi_good_practices_from_berlin_enpdf (last accessed 8 October 2020)
Berliner Energieagentur (ndb) ldquoBerliner Energiesparpartnerschaftenrdquo Berliner-e-agenturde Available at httpswwwberliner-e-agenturdeennode154 (last accessed 8 October 2020)
Berliner Energieagentur (2006) ldquoPerformance Contracting A Berlin Success Modelrdquo Berlin Senate Department of Urban Development Available at httpswwwberliner-e-agenturdesitesdefaultfiles2018-09broschuereenergiesparpartnerschaftenpdf (last accessed 12 July 2019)
Berliner Energieagentur (2019) ldquoMarket Report on the German EPC Marketrdquo Available at httpsguarantee-projecteudewp-contentuploadssites2201612guarantEE_Market_Report_Germanypdf (last accessed 11 October 2020)
Better Building Finance (nd) website Available at httpsbetterbuildingfinancecomau (last accessed on 8 October 2020)
J R Bilbao (2015) ldquoWhat is the Territorial Approach to Local Developmentrdquo Capacity4Dev knowledge sharing platform Available at httpseuropaeucapacity4devarticlewhat-territorial-approach-localdevelopment (last accessed 18 August 2020)
A G Blanco M Nancy Moreno D M Vetter and M F Vetter for Inter-American Development Bank (2017) ldquoThe Potential of Land Value Capture for financing urban projects methodological considerations and case studiesrdquo Available at httpspublicationsiadborgpublicationsenglishdocumentThe-Potential-of-Land-Value-Capture-for-Financing-Urban-Projects-Methodological-Considerations-and-Case-Studiespdf (last accessed on 8 October 2020)
References
190
Bloomberg (2017) ldquoBarcelonarsquos Car-Taming lsquoSuperblocksrsquo Meet Resistancerdquo Available at httpswwwbloombergcomnewsarticles2017-01-20barcelona-s-superblocks-expand-but-face-protests (last accessed on 29 September 2020)
Bloomberg Citylab (2012a) ldquoWhat Cities Can Learn From Torontorsquos Green Roof Policyrdquo Available at httpswwwcitylabcomdesign201204what-cities-can-learn-torontos-green-roof-policy1846 (last accessed 18 August 2020)
Bloomberg Citylab (2012b) ldquoWhy Denser Cities Are Smarter and More Productiverdquo 10 December 2012 RFlorida Available at httpswwwbloombergcomnewsarticles2012-12-10why-denser-citiesare-smarter-and-more-productivetargetText=Specifically2C20doubling20density20productivityof20two20to20four20percentamptargetText=It20thus20goes20well20beyondperformance20of20individual20industrial20sectors (last accessed 18 August 2020)
O Borrero Ochoa (2011) ldquoBetterment Levy in Colombia Relevance Procedures and Social Acceptabilityrdquo Available at httpswwwlincolninstedusitesdefaultfilespubfiles1899_1213_LLA110404pdf (last accessed on 6 August 2019)
A Bortoleto A and K Hanaki (2006) ldquoAnalysis of Waste Prevention Policies Applied at the Solid Waste Management in Belo Horizonte Brazilrdquo Available at httpswwwiswaorguploadstx_iswaknowledgebase543801_Paperpdf (last accessed on 25 October 2020)
B Boza-Kiss P Bertoldi and M Economidou (2017) Energy Service Companies in the EU Status review and recommendations for further market development with a focus on Energy Performance Contracting European Commission Joint Research Centre Available at httpspublicationsjrceceuropaeurepositorybitstreamJRC106624kjna28716ennpdf (last accessed 11 October 2020)
J Brandl and I Zielinska (2020) ldquoReviewing the Smart City Vienna Framework Strategyrsquos Potential as an Eco-Social Policy in the Context of Quality of Work and Socio-Ecological Transformationrdquo Sustainability 2020 Vol 12 (3) 859 Available at httpsdoiorg103390su12030859 (last accessed 24 September 2020)
M Braun (2017) ldquoBike Sharing System in Burgas (Bulgaria)rdquo Available at httpswwweltisorgdiscovercase-studiesbike-sharing-system-burgas-bulgaria (last accessed on 20 October 2020)
D Broekhoff G Piggott and P Erickson (2018) Building Thriving Low-Carbon Cities An Overview of Policy Options for National Governmentsrdquo Coalition for Urban Transitions London and Washington DC Available at httpsurbantransitionsglobalenpublicationbuilding-thriving-lowcarbon-cities-an-overview-of-policy-options-for-national-governments (last accessed 18 August 2020)
J M Bryson B C Crosby and M Middleton Stone (2015) ldquoDesigning and Implementing Cross-Sector Collaborations Needed and Challengingrdquo Public Administration Review Vol 75 (5) pp 647-663 Available at httpswwwhhhumnedusiteshhhumnedufilesdesigning_and_implementing_cross-sector_collaborations_needed_and_challengingpdf_0pdf (last accessed 18 August 2020)
R Buchler and J Pucher (2011) ldquoSustainable Transport in Freiburg Lessons from Germanyrsquos Environmental Capitalrdquo Available at httpswwwtandfonlinecomdoiabs10108015568311003650531 (last accessed on 20 October 2020)
C Cadell N Falk and F King (2008) ldquoRegeneration in European cities making connectionsrdquo Joseph Rowntree Foundation 7 April 2008 Available at httpswwwjrforgukreportregeneration-european-cities-making-connections (last accessed on 29 September 2020)
Centre for Public Impact (2016) ldquoIntegrated solid waste management in Belo Horizonte Brazilrdquo Available at httpswwwcentreforpublicimpactorgcase-studyintegrated-waste-management-brazil (last accessed on 3 July 2019)
Centre for Public Impact (2017) ldquoThe Seoul Innovation Bureau and its ldquoSharing Cityrdquo initiativerdquo Available at httpswwwcentreforpublicimpactorgcase-studyseoul-innovation-bureau (last accessed on 30 September 2020)
C40 Cities (2015) ldquoYokohama - Yokohama 3R Dream Planrdquo Available at httpswwwc40orgawards2015-awardsprofiles59 (last accessed on 1 October 2020)
C40 Cities (2016a) ldquoCase Study C40 Good Practice Guides Yokohama - 3R Dream Planrdquo Available at httpswwwc40orgcase_studiesc40-good-practice-guides-yokohama-3r-dream-plan (last accessed on 1 October 2020)
C40 Cities (2016b) ldquoC40 Good Practice Guides Melbourne ndash Sustainable Melbourne Fundrdquo Available at httpswwwc40orgcase_studiesc40-good-practice-guides-melbourne-sustainable-melbourne-fund (last accessed on 8 October 2020)
C40 Cities (2016c) ldquoCities 100 Barcelona - Redefining City Blocks to Tackle Traffic-Related Emissionsrdquo Available at httpswwwc40orgcase_studiescities100-barcelona-redefining-city-blocks-to-tackle-traffic-related-emissions (last accessed on 29 September 2020)
C40 Cities (2016d) ldquoCities 100 City Solutions for an Urbanizing Worldrdquo Available at httpsissuucomsustainiadocscities100_2016_final_small (last accessed on 29 September 2020)
C40 Cities (2016e) ldquoGood Practice Guide Waste to Resourcesrdquo Available at httpc40-production-imagess3amazonawscomother_uploadsimages554_W2R_UPDATED_EC_15316originalpdf1458040149 (last accessed on 1 October 2020)
C40 Cities (2017a) ldquoCase Study Cities 100 Cape Town - Industrial Resource Exchanges Reduce CO2rdquo Available at httpswwwc40orgcase_studiescities100-cape-town-industrial-resource-exchanges-reduce-co2 (last accessed on 30 September 2020)
C40 Cities (2017b) ldquoUrban Efficiency II Mexico City ndash Sustainable Buildings Certification Programrdquo case study February 2017 Available at httpswwwc40orgcase_studiesurban-efficiency-2-sustainable-buildingscertification-program (last accessed 18 August 2020)
C40 Cities (2017c) ldquoUrban Efficiency II Seven Innovative City Programmes for Existing Building Energy Efficiencyrdquo Available at httpsissuucomc40citiesdocsurbanefficiencyii_final_hi_res__1_ (last accessed 8 October 2020)
C40 Cities (2018) ldquoThe implementation of the Superblocks programme in Barcelona Filling our streets with liferdquo March 2018 C40 Cities website Available at httpswwwc40orgcase_studiesbarcelona-superblocks (last accessed 18 August 2020)
C40 Cities (2019) ldquoHow to install solar panels on city-owned property and lead by examplerdquo Available at httpswwwc40knowledgehuborgsarticleHow-to-install-solar-panels-on-city-owned-property-and-lead-byexamplelanguage=en_US (last accessed 18 August 2020)
C40 Cities and Climate-KIC (2018) ldquoMunicipality-led circular economy case studiesrdquo Available at httpswwwc40orgresearchesmunicipality-led-circular-economy (last accessed on 12 October 2020)
CityLab (2016) ldquoHow Ljubljana Turned Itself Into Europes lsquoGreen Capitalrsquordquo Available at httpswwwcitylabcomdesign201602how-ljubljana-turned-itself-into-europes-green-capital458934 (last accessed on 19 July 2019)
Citynvest (2015) ldquoBerlin Energy Saving Partnershipsrdquo Available at httpcitynvesteusitesdefaultfileslibrary-documentsModel202_Berlin20Energy20Saving20Partnerships_finalpdf (last accessed 11 October 2020)
City of Copenhagen Technical and Environmental Administration Traffic Department (2011) ldquoThe City of Copenhagenrsquos Bicycle Strategy 2011-2025rdquo Available at httpswwweltisorgsitesdefaultfilescase-studiesdocumentscopenhagens_cycling_strategypdf (last accessed on 16 July 2019)
City of Zaprešić Finance and Budgeting Department (2018) ldquoThe City of Zaprešić Experience in the Application of MFSA ndash Action Planrdquo Available at httpwwwseecitieseuseecitieseuPortals0ImagesUploadDocumentsCity20to20City20dialogue20Skopje202017City20of2020Zapresicpdfver=2018-01-10-084851-633 (last accessed 18 August 2020)
191
City of Ljubljana (2020) ldquoTransport and mobilityrdquo in Ljubljanasi Available at httpswwwljubljanasienljubljana-for-youtransport-in-ljubljana (last accessed 20 October 2020)
City of Melbourne (nd) ldquoSustainable Melbourne Fundrdquo Available at httpwwwmelbournevicgovaubusinesssustainable-businessPagessustainable-melbourne-fundaspx (last accessed on 8 October 2020)
City of Melbourne (2008) ldquoZero Net Emissions by 2020 Update 2008rdquo Available at httpswwwmelbournevicgovauSiteCollectionDocumentszero-net-emissions-2008pdf
City of Stuttgart Office for Environmental Protection (nd) ldquoClimate Atlas of the Region of Stuttgart (2008)rdquo Available at httpswwwstadtklima-stuttgartdeindexphpclimate_climate_atlas_2008 (last accessed on 20 October 2020)
City of Toronto (nd) ldquoSection 37 An Essential Tool for Building Healthier Neighbourhoodsrdquo Available at httpswwwtorontocacity-governmentplanning-developmentofficial-plan-guidelinessection-37-benefits (last accessed on 29 September 2020)
CIVITAS (2009a) ldquoLundrdquo Available at httpscivitaseucontentlund (last accessed on 20 October 2020)
CIVITAS (2009b) ldquoSmart choices for cities Cycling in the Cityrdquo CIVITAS WIKI Policy Analysis Series Available at httpscivitaseusitesdefaultfilesciv_pol-09_m_webpdf (last accessed 18 August 2020)
CIVITAS (2013) ldquoUpdate of the sustainable urban transport planrdquo in Civitaseu Available at httpscivitaseumeasureupdate-sustainable-urban-transport-plan (last accessed 20 October 2020)
Climate ADAPT (2019) ldquoFour pillars to Hamburgrsquos Green Roof Strategy financial incentive dialogue regulation and science (2016)rdquo Available at httpsclimate-adapteeaeuropaeumetadatacase-studiesfour-pillarsto-hamburg2019s-green-roof-strategy-financial-incentive-dialogueregulation-and-sciencecost_benefit_anchor (last accessed 18 August 2020)
Coins Global (2015) ldquoNet Zero Energy Buildings (NZEBs) Building the Futurerdquo February 2015 Available at httpswwwcoins-globalcomstoragedocumentsEmerging-Technologies-for-the-Built-Environmen-Net-Zero-Energy-Buildingspdf (last accessed 18 August 2020)
P Collier E Glaser A Venables M Blake and P Manwaring (2019) ldquoAccess to opportunity policy decisions for enhancing urban mobilityrdquo IGC Cities that Work Policy Framing Paper Available at httpswwwtheigcorgwp-contentuploads201805access-to-opportunity-3-march1pdf (last accessed 18 August 2020)
C Colomb (2007) Making Connections Transforming People and Places in Europe Case Study of Roubaix Lille URBED and the Joseph Rowntree Foundation 29 June 2006 updated December 2007 Available at httpurbedcoopsitesdefaultfilesCase20Study20of20Roubaix20Lillepdf (last accessed on 29 September 2020)
F Colombijn and M Morbidini (2017) ldquoPros and cons of the formation of waste-pickersrsquo cooperatives a comparison between Brazil and Indonesiardquo from Decision 44 91ndash101 Available at httpslinkspringercomarticle101007s40622-017-0149-5 (last accessed on 2 October 2020)
Committee on Climate Change (2016) ldquoNext Steps for UK Heat Policyrdquo Available at httpswwwthecccorgukpublicationnext-steps-for-ukheat-policy (last accessed 18 August 2020)
Copenhagen Resource Institute and Bipro (2014) ldquoCapital factsheet on separate collectionrdquo Available at httpswwwmunicipalwasteeuropeeusitesdefaultfilesSI20Ljubljana20Capital20factsheetpdf (last accessed on 9 July 2019)
J Corfee-Morlot L Khamal Chaoui MG Donovan I Cochran A Robert and PJ Teasdale (2009) ldquoCities Climate Change and Multilevel Governancerdquo OECD Environmental Working Papers No 14 OECD Available at httpswwwoecdorgenvcc44242293pdf (last accessed 18 August 2020)
Croatian Bureau of Statistics (2012) Population by Ethnicity by TownsMunicipalities 2011 Census County of Primorje-Gorski kotar Available at httpswwwdzshrEngcensusescensus2011resultshtm
E01_01_04e01_01_04_zup08html (last accessed on 8 October 2020)
CTCN (2015) ldquoRehabilitation and Modernization of the district heating (DH) system in the City of Banja Lukardquo Climate Technology Centre and Network August 2015 Available at httpswwwctc-norgtechnical-assistanceprojectsrehabilitation-and-modernization-district-heating-dh-systemcity-banja (last accessed 18 August 2020)
L Dakskobler (2019) ldquoFrom no recycling to zero waste how Ljubljana rethought its rubbishrdquo The Guardian May 2019 Available at httpswwwtheguardiancomcities2019may23zero-recycling-to-zero-waste-how-ljubljana-rethought-its-rubbish (last accessed 25 September 2020)
S David AG Sabiescu and L Cantoni (2013) ldquoCo-design with communities A reflection on the literaturerdquo November 2013 Conference paper IDIA 2013 Bangkok Available at httpswwwresearchgatenetpublication257998124_Co-design_with_communities_A_reflection_on_the_literature (last accessed 18 August 2020)
demosEuropa ndash Centre for European Strategy (2015) ldquoPoland as a Global Development Partner Towards Polandrsquos Global Engagementrdquo World Bank Washington DC Available at httppubdocsworldbankorgen228061435014173462Poland-Global-engagementpdf (last accessed 15 October 2020)
Department MA 18 ndash Urban Development and Planning (2018) ldquoMonitoring Report 2017 Smart City Wien Framework Strategyrdquo City of Vienna Urban Development and Planning Available at httpswwwwiengvatstadtentwicklungstudienpdfb008520pdf (last accessed 18 August 2020)
C Deuskar (2015) ldquoWhat does ldquourbanrdquo meanrdquo World Bank Blog June 2015 Available at httpsblogsworldbankorgsustainablecitieswhatdoes-urban-mean (last accessed 18 August 2020)
S M Dias (2016) ldquoWaste pickers and cities Environment amp Urbanisationrdquo from Environment and Urbanization Vol 28 No 2 October 2016 Available at httpsjournalssagepubcomdoipdf1011770956247816657302 (last accessed on 3 July 2019)
D Di Santo (2018) ldquoWhite certificates in Italy what happened what to expectrdquo Bolzano 4 October 2018 Available at httpblogfire-italiaorgwp-contentuploads2018112018-10-white-certificatepdf (last accessed 11 October 2020)
D Di Santo L De Chicchis and E Biele (2018) ldquoWhite certificates in Italy lessons learnt over 12 years of evaluationrdquo from 2018 International Energy Policy and Programme Evaluation Conference Vienna Austria Available at httpswwwdariodisantocomwp-contentuploads2018072018-DiSanto_paper_vienna-IEPPECpdf (last accessed 28 September 2020)
Drakenstein Municipality (2013) ldquoDrakenstein Water Demand Management Programme ndash A resounding successrdquo Available at httpsshowmecozapaarlnewsdrakenstein-water-demand-management-programme-a-resounding-success (last accessed on 29 September 2020)
M Dri P Canfora I Antonopoulos and P Gaudillat (2018) Best environmental management practice for the waste management sector JRC Science Policy Report Publications Office of the European Union Available at httpseceuropaeujrcenpublicationeur-scientific-andtechnical-research-reportsbest-environmental-management-practicewaste-management-sector (last accessed 18 August 2020)
EBRD (2017) ldquoEBRD to fund installation of heat meters in Kazakhstanrdquo S Pyrkalo EBRD website February 2017 Available at httpswwwebrdcomnews2017ebrd-to-fund-installation-of-heat-meters-in-kazakhstan-html (last accessed 18 August 2020)
EBRD (2018a) ldquoGreen Cities Framework ndash Banja Luka District Heatingrdquo project summary document Available at httpswwwebrdcomwork-with-usprojectspsdgrcf-banja-luka-district-heatinghtml (last accessed 18 August 2020)
EBRD (2018b) ldquoMaking district heating happen empowering users through fair meteringrdquo policy paper Available at httpswwwebrdcomdocumentsadminmaking-district-heating-happen-empowering-usersthrough-fair-meteringpdf (last accessed 18 August 2020)
192
EBRD (2019) ldquoFast-growing EBRD Green Citiesrdquo news page Available at httpswwwebrdcomnews2019fastgrowing-ebrd-green-cities-signsup-its-25th-city-html (last accessed 18 August 2020)
EcoMobility SHIFT (nd) ldquoBurgasrdquo Available at httpseceuropaeuenergyintelligentprojectssitesiee-projectsfilesprojectsdocumentsecomobility_shift_ecomobility_shift_case_study_burgas_bg_enpdf (last accessed on 20 October 2020)
The Economist (2012) ldquoThe lure of Chilecon Valleyrdquo The Economist website Available at httpswwweconomistcombusiness20121013the-lure-of-chilecon-valley (last accessed 18 August 2020)
The Economist (2017) ldquoEastern Europersquos wave of emigration may have crestedrdquo The Economist website Available at httpswwweconomistcomeurope20170826eastern-europes-wave-of-emigration-mayhave-crested (last accessed 18 August 2020)
V Edo J Barrio M Allende and M Garcia Nart (1998) ldquoZaragoza Saving Water City (Spain)rdquo Available at httphabitataqupmesbpesonu98bp439enhtml (last accessed on 23 October 2020)
E Eiweida and Z Tokhmakhyan (2011b) ldquoPublic-Private Partnerships Enhances Water Utilityrsquos Performance in Armeniardquo Knowledge Brief issue no 44 Available at httpdocumentsworldbankorgcurateden920781468029671050Public-private-partnership-enhances-water-utilitys-performance-in-Armenia (last accessed on 28 September 2020)
EMF (2019) ldquoPlanning for Compact Connected Citiesrdquo Ellen MacArthur Foundation Available at httpswwwellenmacarthurfoundationorgassetsdownloads1_Buildings_Planning_Mar19pdf (last accessed 18 August 2020)
Energy Cities (2016a) ldquoFrederikshavn Denmark Mobilising savings sleeping on citizens bank accountsrdquo the European association of cities in energy transition January 2016 Available at httpsenergy-citieseufrederikshavn-denmark-mobilising-savings-sleeping-on-citizens-bankaccounts (last accessed 18 August 2020)
Energy Cities (2016b) ldquoldquoSuperblocksrdquo free up to 92 of public space in Barcelonardquo Available at httpenergy-citieseubest-practicesuperblocks-free-up-to-92-of-public-space-in-barcelona (last accessed on 29 September 2020)
Energy Sector Management Assistance Program (ESMAP) (2011a) ldquoGood practices in city energy efficiency Yerevan Armenia ndash Water and Sewerage Management Contractrdquo Energy Efficient Cities Initiative Available at httpswwwesmaporgsitesdefaultfilesesmap-filesArmenia_Yerevan_Water_Case_Studypdf (last accessed on 28 September 2020)
Environmental Local Authorities InterBalkan Network (nd) ldquoThe municipality of Rijeka Croatiardquo Available at httpselaineupartnersrijeka-croatia (last accessed on 22 May 2019)
ERRee (2020) ldquoCity of Tartu seeking to reduce CO2 emissions by 40 percent by 2030rdquo ERRee News 1 September 2020 Available at httpsnewserree1129902city-of-tartu-seeking-to-reduce-co2-emissions-by-40-percent-by-2030 (last accessed 12 October 2020)
Energy Systems Catapult (2018) ldquoItalian Energy Efficiency White Certificate Schemerdquo Available at httpsescatapultorgukwp-contentuploads201810Italy-White-Certificate-Scheme-Case-Study-FINALpdf (last accessed 28 September 2020)
Euro Cities (2019) ldquoCluj-Napoca Romania ndash Imagine the future of the city Innovation and Civic Imagination Centre ndash CIICrdquo Available at httpnwseurocitieseuMediaShellmedia2019_ROCK_CaseStudiesBooklet_Clujpdf (last accessed 18 August 2020)
EURONET 5050 MAX (nd) EURONET 5050 MAX website Available at httpwwweuronet50-50maxeuen (last accessed 18 August 2020)
European Association for Local Democracy (2016) ldquoDecentralised cooperation an added value for Eastern Partnership Countriesrdquo Available at httpseuropeanmovementeuwp-contentuploads201602139-Paper_EaP_IssueNo1_AVpdf (last accessed 15 October 2020)
European Commission (nda) ldquoLjubljana becomes the first EU capital to adopt Zero Waste Goalrdquo news page Available at httpeceuropaeuenvironmenteuropeangreencapitalljubljana-zero-waste-goal (last accessed 18 August 2020)
European Commission (ndb) ldquoReclaiming city streets for people Chaos or quality of liferdquo EC Directorate-General for the Environment Available at httpeceuropaeuenvironmentpubspdfstreets_peoplepdf (last accessed on 2 July 2019)
European Commission (2014) ldquoCapital factsheet ndash LlubjlanaSloveniardquo Part of EC study ldquoAssessment of separate collection schemes in the 28 capitals of the EUrdquo Municipal Waste Europe website Available at httpswwwmunicipalwasteeuropeeusitesdefaultfilesSI20Ljubljana20Capital20factsheetpdf (last accessed 18 August 2020)
European Commission (2018) ldquoFinancing a Sustainable European Economy ndash Final Report 2018 by the High-Level Expert Group on Sustainable Financerdquo p 7 Available at httpseceuropaeuinfositesinfofiles180131-sustainable-finance-final-report_enpdf (last accessed 18 August 2020)
European Commission (2019) ldquoLjubljana becomes the first EU capital to adopt Zero Waste Goalrdquo Available at httpeceuropaeuenvironmenteuropeangreencapitalljubljana-zero-waste-goal (last accessed on 9 July 2019)
European Commission (2020) Nearly Zero Energy Buildings European Commission website Available at httpseceuropaeuenergytopicsenergy-efficiencyenergy-efficient-buildingsnearly-zero-energy-buildings_en (last accessed 14 April 2020)
European Commission Directorate ndash General Environment (2012) ldquoPreparing a Waste Prevention Programme Guidance documentrdquo October 2012 Available at httpeceuropaeuenvironmentwastepreventionpdfWaste20prevention20guidelinespdf (last accessed 18 August 2020)
European Environment Agency (2014) ldquoStuttgart combating the heat island effect and poor air quality with green ventilation corridors (2014)rdquo case study Climate Adapt website Available at httpsclimate-adapteeaeuropaeumetadatacase-studiesstuttgart-combating-the-heat-islandeffect-and-poor-air-quality-with-green-ventilation-corridors (last accessed 18 August 2020)
European Union (2015) ldquoLjubljana European Green Capital 2016rdquo Available at httpeceuropaeuenvironmenteuropeangreencapitalwp-contentuploads201302ljubljana_european_green_capital_2016pdf (last accessed on 2 July 2019)
European Union (2017) Effective multi-level environmental governance for a better implementation of EU environment legislation Study European Committee of the Regions Available at httpscoreuropaeuenengagestudiesDocumentsEnvironmental-governancepdf (last accessed 18 August 2020)
European Union (2018) Directive of the European Parliament and of the Council amending Directive 200898EC on waste Reference PE-CONS 1118 27 April 2018 Available at httpsdataconsiliumeuropaeudocdocumentPE-11-2018-INITenpdf (last accessed on 25 October 2020)
EUROSCOPE (TR1023) (1999) Evaluation Results and Comparative Assessment Available at httpwwwitsleedsacukprojectskonsultprivatelevel2instrumentsinstrument040l2_040chtm (last accessed 18 August 2020)
Eurostat (2020) ldquoPassenger Cars in the EUrdquo web page Available at httpseceuropaeueurostatstatistics-explainedindexphpPassenger_cars_in_the_EUHighest_share_of_passenger_cars_over_20_years_old_in_Poland (last accessed 18 August 2020)
Eurostat and EIB (2018) ldquoA Guide to the Statistical Treatment of Energy Performance Contractsrdquo May 2018 Available at httpseceuropaeueurostatwebgovernment-finance-statisticsmethodologyguidance-onaccounting-rules (last accessed 18 August 2020)
W Fahmi and K Sutton (2010) ldquoCairorsquos Contested Garbage Sustainable Solid Waste Management and the Zabaleenrsquos Right to the Cityrdquo Sustainability Vol 2 (6) pp 1765-1783 Available at httpswwwmdpicom2071-1050261765 (last accessed 18 August 2020)
193
C Farvacque-Vitkovic and A Sinet (2014) ldquoAchieving greater transparency and accountabilityrdquo Municipal Finances A Handbook for Local Governments Chapter 8 Box 86 Available at httpdocuments1worldbankorgcurateden403951468180872451pdfMunicipal-finances-a-handbook-for-local-governmentspdf (last accessed on 8 October 2020)
M Filipovic (2019) ldquoRijeka ndash Smart City experiences and plans for the futurerdquo Available at httpwwwseecitieseuseecitieseuPortals0ImagesUploadDocumentsC2CCity20to20City20Dialogue20-20Cities20Drivers20of20Economy20Vision202030Day2021120Rijeka20-20Smart20Citypdfver=2019-05-08-100821-320 (last accessed on 8 October 2020)
Financial Times (2019) ldquoNumber 214 to Highgate leads UKrsquos electric bus charge ndash British companies use Chinese technology to power up in new age of public transportrdquo Financial Times website November 2019 Available at httpswwwftcomcontent5c81dee4-ffe1-11e9-b7bcf3fa4e77dd47 (last accessed 18 August 2020)
FIRE (2018) ldquoItalian white certificates the new rulesrdquo Federazione Italiana per luso Razionale dellEnergia wwwbuildupeu 20 November 2018 Available at httpswwwbuildupeuenpracticespublicationsitalian-white-certificates-new-rules (last accessed 28 September 2020)
J Fitzgerald (2016) ldquoWhat city planners can learn from Malmorsquos eco-districtsrdquo Available at httpsblogslseacukeuroppblog2016040237589 (last accessed 12 July 2019)
C Ford (2017) ldquoSlovenia has been named the greenest country in the world and this is whyrdquo Available at httpswwwcontikicomsix-twoslovenia-has-been-named-the-greenest-country-in-the-world-and-this-is-why (last accessed on 9 July 2019)
M Galindo Fernandez C Roger-Lacan U Gaumlhrs and V Umaitre (2016) ldquoEfficient district heating and cooling systems in the EUrdquo Available at httppublicationsjrceceuropaeurepositorybitstreamJRC104437study20on20efficient20dhc20systems20in20the20eu20-dec2016_final20-20public20report6pdf (last accessed 11 October 2020)
GEF and UNDP (2010) ldquoPromoting Energy Efficiency in Buildings Lessons Learned From International Experiencerdquo Available at httpswwwthegeforgsitesdefaultfilespublicationsEEBuilding_WEB_2pdf (last accessed 8 October 2020)
Gianni-Origoni amp Grippo-Cappelli Partners (2017) ldquoIl nuovo regime dei certificate bianchi cosa cambiardquo Available at httpwwwgopitdoc_pubblicazioni652_3j1fi3dkur_itapdf (last accessed 8 October 2020)
GIZ (2012) ldquoRecovering resources creating opportunities Integrating the informal sector into solid waste managementrdquo GIZ on behalf of the German Federal Ministry for Economic Cooperation and Development Available at httpswwwgizdededownloadsgiz2011-en-recyclingpartnerships-informal-sector-final-reportpdf (last accessed 18 August 2020)
Global Opportunity Explorer (2018) ldquoCape Town Industrial Resource Exchanges Reduce CO2rdquo Available at httpsgoexplorerorgcape-town-industrial-resource-exchanges-reduce-co2 (last accessed on 30 September 2020)
Global Platform for Sustainable Cities and World Bank (2018) Urban Sustainability Framework (USF) First edition Washington DC Available at httpdocumentsworldbankorgcurateden339851517836894370pdf123149-Urban-Sustainability-Frameworkpdf (last accessed 18 August 2020)
Go to Burgas (2020) ldquoPublic Transportrdquo Available at httpswwwgotoburgascomenindexstatic24 (last accessed on 20 October 2020)
Government of Alberta (2020) ldquoIntermunicipal Collaboration Frameworksrdquo web page Available at httpswwwalbertacaintermunicipalcollaboration-frameworkaspx (last accessed 18 August 2020)
Government of Estonia (2019) Estoniarsquos 2030 National Energy and Climate Plan Final version 19 December 2019 Available at httpseceuropaeuenergysitesenerfilesdocumentsee_final_necp_main_enpdf (last accessed 12 October 2020)
GreenCape (2018) ldquoWISP Case Study Banners to Bagsrdquo Available at httpswwwgreencapecozaassetsUploadsGC3-20181005-
WISPCaseStudy-BannerstoBags-Webpdf (last accessed on 30 September 2020)
J Groszlige N B Groth C Fertner J Tamm and K Alev (2015) Urban energy planning in Tartu [PLEEC Report D42 Tartu] EU-FP7 project PLEEC Available at httpscuriskudkwsfiles142223033D42_Tartu_2015_01_14_finalpdf (last accessed 12 October 2020)
K Heinrich (2018) ldquoParmarsquos journey to world-class food waste recycling levelsrdquo in Beyondfoodwastecom 22 August 2018 Available at httpsbeyondfoodwastecomparmas-journey-to-world-class-food-waste-recycling-levels (last accessed 25 October 2020)
Herne Hill (2015) ldquoHerne Hill Flood Alleviation Scheme Shortlisted for Awardrdquo April 2015 Available at httpwwwhernehillorguknewsherne-hill-flood-alleviation-scheme-shortlisted-award (last accessed 18 August 2020)
M Holder (2018) ldquoBMW takes full ownership of DriveNow carsharing schemerdquo March 2018 Business Green website Available at httpswwwbusinessgreencombgnews3028696bmw-takes-full-ownership-ofdrivenow-carsharing-service (last accessed 18 August 2020)
S Howell (2012) ldquoLocal authorities must break down silos to deliver better public servicesrdquo The Guardian website September 2012 Available at httpswwwtheguardiancomlocal-government-network2012sep14localis-report-public-service-delivery (last accessed 18 August 2020)
ICLEI (nd) ldquoLjubljana (Slovenia)rdquo Available at httpsiclei-europeorgmember-in-the-spotlightpreviousljubljana-slovenia (last accessed on 20 October 2020)
ICLEI (2011a) ldquoFreiburg Successfully reducing automobile trafficrdquo Available at httpoldicleiorgfileadminPUBLICATIONSCase_Stories4_EcoMobilityICLEI_CaseStories_EcoMobility_Freiburgpdf (last accessed on 2 July 2019)
ICLEI (2011b) ldquoLund Sweden An ambitious city of ideas and innovationrdquo Available at httpssustainablemobilityicleiorgwpdm-packagelund-sweden-an-ambitious-city-of-ideas-and-innovation (last accessed on 26 June 2019)
ICLEI (2014) ldquoAmman Jordan ndash Urban agriculture finding multi-purpose Urban NEXUS solutions through collaborative actionrdquo Urban Nexus case story August 2014 Available at httpoldicleiorgfileadminPUBLICATIONSCase_StoriesUrban_NEXUS26_Urban_NEXUS_Case_Story_Amman_ICLEI-GIZ_2014pdf (last accessed 18 August 2020)
ICLEI ndash Local Governments for Sustainability (2016) ldquoBurgas Bulgariardquo Available at httpssustainablemobilityicleiorgecomobility-alliance-back-upburgas-bulgaria (last accessed on 19 October 2020)
ICLEI and GIZ (2014) ldquoOperationalizing the Urban NEXUS ndash Towards resource-efficient and integrated cities and metropolitan regionsrdquo Deutsche Gesellschaft fuumlr Internationale Zusammenarbeit and ICLEI ndash Local Governments for Sustainability Available at httpswwwsustainable-urbanisationorgsitessgupfilespublicationsoperationalising_the_urban_nexuspdf (last accessed 18 August 2020)
IFC (nd) ldquoBucharest Water and Sanitationrdquo Urban Water Available at httpslibrarypppknowledgelaborgdocuments4722download (last accessed on 30 September 2020)
Inclusive Design Research Centre (nd) ldquoCo-designing Inclusive Citiesrdquo IDRC website Available at httpscitiesinclusivedesignca (last accessed 16 April 2019)
Innovative Governance of Large Urban Systems (2017) ldquoThe Greater Moscow Region on its shifting way from transportation to mobilityrdquo S Maltcev IGLUS website July 2017 Available at httpsiglusorgthe-greater-moscow-region-on-its-shifting-way-from-transportation-to-mobility (last accessed 18 August 2020)
Institute for Building Efficiency (2010a) ldquoEnergy Performance Contracting in the European Union Introduction Barriers and Prospectsrdquo Issue Brief August 2010 Available at httpwwwbuildupeusitesdefaultfilescontentInstitute20BE20-20Energy20Performance20Contracting20in20the20European20Unionpdf (last accessed 18 August 2020)
Institute for Building Efficiency (2010b) ldquoEnergy Performance Contracting in the European Union Creating Common lsquoModelrsquo Definitions Processes
194
and Contractsrdquo Issue Brief September 2010 Available at httpwwwbuildupeusitesdefaultfilescontentInstitute20BE-Energy20Performance20Contracting20in20the20EU-20Common20models20definitions2C20Contracts2C20Processespdf (last accessed 18 August 2020)
ITDP (2015) ldquoWhatrsquos Stopping Carsharing 4 Challenges Holding Emerging Markets Backrdquo December 2015 Institute for Transportation and Development Policy Available at httpswwwitdporg20151217whats-stoppingcarsharing-4-challenges-holding-emerging-markets-back (last accessed 18 August 2020)
Institute of Public Administration (2012) ldquoStrategic collaboration in local governmentrdquo Local Government research Series Report no 2 January 2012 Available at httpswwwipaie_fileUploadDocumentsStrategicCollaborationpdf (last accessed 18 August 2020)
Institute on Municipal Finance and Governance (2013) ldquoTrading Density for Benefits Toronto and Vancouver Comparedrdquo Munk School of Global Affairs IMFG Papers on Municipal Finance and Governance No 13 Available at httpsmunkschoolutorontocaimfguploads220imfg_no_13_moorer3_online_finalpdf (last accessed 18 August 2020)
International Bank for Reconstruction and Development and World Bank (2017) ldquoRepublic of Armenia Support to Armeniarsquos Second-Generation Water PPPsrdquo Available at httpsppiaforgdocuments5694download (last accessed on 28 September 2020)
International Transport Forum (2016) ldquoMoscow wins international transport award for tackling traffic gridlockrdquo Available at httpswwwitf-oecdorgmoscow-wins-international-transport-award-tackling-traffic-gridlock (last accessed on 20 October 2020)
International Water Association (2018) Wastewater Report 2018 The Reuse Opportunity Available at httpwwwiwa-networkorgwp-contentuploads201802OFID-Wastewater-report-2018pdf (last accessed on 8 August 2019)
Interreg Danube Transnational Programme (2018) ldquoSummary of all the ATTRACTIVE DANUBE National Workshopsrdquo Available at wwwinterreg-danubeeunews-and-eventsproject-news2322 (last accessed on 16 October 2020)
M Islam (2012) ldquoKey Factors and Readiness Perception Indicators Appraisal Public-Private Partnership in Infrastructure Development Project in Bangladeshrdquo Available at httpscoreacukdownloadpdf61803306pdf (last accessed on 26 October 2020)
S Istenič (2016) ldquoReviving Public Spaces through Cycling and Gardening Ljubljana ndash European Green Capital 2016rdquo in Etnološka tribina Godišnjak Hrvatskog etnološkog društva Vol 46 No 39 2016 Available at httpswwwresearchgatenetpublication311863407_Reviving_Public_Spaces_through_Cycling_and_Gardening_Ljubljana_-_European_Green_Capital_2016 (last accessed 20 October 2020)
C Johnson (2014) ldquoSharing City Seoul A Model for the Worldrdquo Available at httpswwwshareablenetsharing-city-seoul-a-model-for-the-world (last accessed on 30 September 2020)
B Jovičić (2019) ldquoSEE parliamentarians visit Ljubljana ndash European Green Capital and regional leader in sustainable urban mobilityrdquo Available at httpswwwtransformative-mobilityorgnewssee-parliamentarians-visit-ljubljana-european-green-capital-and-regional-leader-in-sustainable-urban-mobility (last accessed on 20 October 2020)
M Kahn (2017) ldquoConstruction begins on Atlantarsquos Proctor Creek Greenwayrdquo Curbed Atlanta website August 2017 Available at httpsatlantacurbedcom201782116176662proctor-creek-greenwayphase-one-construction-starts (last accessed 18 August 2020)
J Kanters and M Wall (2018) ldquoExperiences from the urban planning process of a solar neighbourhood in Malmouml Sweden Urban Planning and Transport Researchrdquo Available at httpswwwtandfonlinecomdoipdf1010802165002020181478323 (last accessed 8 October 2020)
A Kassam (2014) ldquoSmarter urban water how Spainrsquos Zaragoza learned to use lessrdquo The Guardian Available at httpswwwtheguardiancomlifeandstyle2014jul30zaragoza-smarter-urban-water-zaragoza-spain-learned-to-use-less (last accessed on 29 September 2020)
The Korea Times (2018) ldquoSeoul to generate 1 GW of energy from solar by 2022rdquo Korea Times 26 November 2018 Available at httpm
koreatimescokrpagesarticleaspnewsIdx=259295 (last accessed 22 July 2019)
M Kulesza (nd) ldquoMethods and Techniques of Managing Decentralization Reforms in CEE Countries The Polish Experiencerdquo Pennsylvania State University Available at httpciteseerxistpsueduviewdocdownloaddoi=10111118460amprep=rep1amptype=pdf (last accessed 18 August 2020)
A Kumar and R Fester (2019) ldquoFiscal Futures Is there a Space for Better Fiscal Accountability in South Africarsquos Metropolitan Municipalitiesrdquo International Budget Partnership website March 2019 Available at httpswwwinternationalbudgetorg201903fiscal-futures-is-therespace-for-better-fiscal-accountability-in-south-africas-metropolitanmunicipalities (last accessed 18 August 2020)
A Laszek and R Trzeciakowski (2018) ldquoState Decentralization in Poland Has Been Successful but There is Still Room for Improvementrdquo Available at http4libertyeuwp-contentuploads201811ALEKSANDER-C581ASZEK-RAFAC581-TRZECIAKOWSKI_STATE-DECENTRALIZATION-IN-POLAND-HASpdf (last accessed 9 August 2019)
LEGCO (2017) ldquoFeed-in tariff for solar power in selected placesrdquo Available at httpswwwlegcogovhkresearch-publicationsenglish1718in04-feed-in-tariff-for-solar-power-in-selected-places-20180117-epdf (last accessed 22 July 2019)
U Lehrer and P Pantalone (2018) ldquoThe sky is not the limit Negotiating height and density in Torontorsquos condominium boomrdquo from Spaces of Urban Politics pp 85-95 Available at httpswwwresearchgatenetpublication326547999_The_sky_is_not_the_limit_Negotiating_height_and_density_in_Toronto27s_condominium_boom (last accessed on 29 September 2020)
LGB (nd) ldquoSNAGA Development and maintenance of a geospatial information system for service managementrdquo Available at httpswwwlgbsienprojectssnaga (last accessed on 1 October 2020)
M Liksutov (2018a) ldquoModernising Moscow How the Russian capital is transforming its transport servicesrdquo Intelligent Transport 4 October 2018 Available at httpswwwintelligenttransportcomtransport-articles72221moscow-public-transport-network (last accessed on 19 October 2020)
M Liksutov (2018b) ldquoBuilding Smart Transport in Moscowrdquo Interview by McKinsey Available at httpswwwmckinseycomindustriescapital-projects-and-infrastructureour-insightsbuilding-smart-transport-in-moscow (last accessed on 19 July 2019)
M Liksutov (2020) ldquoCity Snapshot Mobility in Moscowrdquo Intelligent Transport 28 January 2020 Available at httpswwwintelligenttransportcomtransport-articles95256city-snapshot-mobility-in-moscow (last accessed on 20 October 2020)
A Linder (2019) ldquoThe formalisation of South African waste pickers in a globalised recycling economyrdquo lecture May 2019 Available at httpswwwlawoxacukeventsformalisation-south-african-waste-pickersglobalised-recycling-economy (last accessed 18 August 2020)
LSE Cities ICLEI and GGGI (2013) Going Green How cities are leading the next economy Available at httpswwwlseacukcitiespublicationsresearch-reportsGoing-Green-How-cities-are-leading-the-next-economy (last accessed on 25 October 2020)
LSE Cities UN-Habitat and United Cities and Local Governments (2016) ldquoHow cities are governed Building a local database for current models of urban governancerdquo Available at httpsurbangovernancenet (last accessed 18 August 2020)
A Magni and W Guumlnther (2014) ldquoCooperatives of waste pickers as an alternative to social exclusion and its relationship with the homeless populationrdquo in Sauacutede e Sociedade vol 23 no1 Satildeo Paulo Jan-Mar 2014 Available at httpswwwscielobrscielophppid=S0104-12902014000100146ampscript=sci_arttextamptlng=en (last accessed on 25 October 2020)
S Maltcev (2017) ldquoThe Greater Moscow Region on its shifting way from transportation to mobilityrdquo Igluscom 9 July 2017 Available at httpsiglusorgthe-greater-moscow-region-on-its-shifting-way-from-transportation-to-mobility (last accessed on 20 October 2020)
195
P Marin M Dambudzo and A Andreasyan (2017) Review of Armeniarsquos Experience with Water Public-Private Partnerships World Bank Group Washington DC Available at httpdocumentsworldbankorgcurateden117301510813106522pdfReview-of-Armenia-s-experience-withwater-public-private-partnershipspdf (last accessed 18 August 2020)
A Marshal (2019) ldquoWhy electric buses havenrsquot taken over the world ndash yetrdquo Wired June 2019 Available at httpswwwwiredcomstoryelectricbuses-havent-taken-over-world (last accessed 18 August 2020)
C Marshall (2016) ldquoWhere is the worldrsquos most hi-tech city (And itrsquos not San Francisco)rdquo The Guardian website October 2016 Available at httpswwwtheguardiancomcities2016oct19where-world-most-hi-tech-city-not-san-francisco (last accessed 18 August 2020)
McKinsey amp Company (2013) ldquoTen quick steps to unlocking tax-revenue collection in rapidly growing marketsrdquo July 2013 Available at httpswwwmckinseycomindustriespublic-sectorour-insightsten-quicksteps-to-unlocking-tax-revenue-collection-in-rapidly-growing-markets (last accessed 18 August 2020)
H Mees (2014) ldquoEntire cities could benefit from green roofsrdquo Delta RotterdamUtrecht University Available at httpsdspacelibraryuunlbitstreamhandle1874306732websitepdfsequence=1ampisAllowed=y (last accessed on 15 July 2020)
Metro (2019) ldquoMetro partners with Getaround to offer car sharing at 27 transit stationsrdquo metronet website page February 2019 The Source blog Available at httpsthesourcemetronet20190207metro-partnerswith-getaround-to-offer-car-sharing-at-27-transit-stations (last accessed 5 May 2019)
RE Millward amp Associates Ltd (2013) ldquoSecuring Cultural Benefits Approaches to the Use of Section 37 for Arts and Culture Facilitiesrdquo Available at httpswwwtorontocalegdocsmmis2013edbgrdbackgroundfile-62975pdf (last accessed on 15 July 2019)
Ministry of Finance of the Slovak Republic (nd) ldquoPlatobny mechanizmus vychadzajuci zo Vzorovej zmluvy o energetickej efektivnosti s garantovanou usporou energierdquo Available at httpswwwmhsrskuploadsfilesCqkpdgoUpdf (last accessed 18 August 2020)
T Misra (2016) ldquoHow to Build Inclusive Citiesrdquo Bloomberg CityLab June 2016 Available at httpswwwcitylabcomequity201606how-tobuild-inclusive-cities487322 (last accessed 18 August 2020)
A Moore (2013) for Institute on Municipal Finance and Governance ldquoTrading Density for Benefits Toronto and Vancouver Comparedrdquo Available at httpsmunkschoolutorontocaimfguploads220imfg_no_13_moorer3_online_finalpdf (last accessed on 15 July 2019)
Moscow Transport (2017) ldquoMoscow Transport strategy main goals and achievementsrdquo Available at httpswwwuneceorgfileadminDAMtransdoc2017wp52_5Sept2017_Ms_Maltsevapdf (last accessed on 19 October 2020)
N Mueller D Rojas-Rueda H Khreis M Cirach D Andreacutes J Ballester X Bartoll C Daher A Deluca C Echave C Milagrave S Maacuterquez J Palou K Peacuterez C Tonne M Stevenson S Rueda and M Nieuwenhuijsen (2020) ldquoChanging the urban design of cities for health The superblock modelrdquo Environment International Vol 134 Available at httpswwwsciencedirectcomsciencearticlepiiS0160412019315223 (last accessed on 29 September 2020)
Municipal Department MA 18 ndash Urban Development and Planning (2018) Monitoring Report 2017 Smart City Wien Framework Strategy Available at httpswwwwiengvatstadtentwicklungstudienpdfb008520pdf (last accessed 16 October 2020)
A Natarajan (2020) ldquoMetro Waterrsquos 10 big promises for Chennai citizens in 2020rdquo Available at httpschennaicitizenmattersinmetro-water-promises-for-chennai-2020-13822 (last accessed on 29 October 2020)
National Assembly for Wales (2018) ldquoLow Carbon Housing the Challengerdquo Climate Change Environment and Rural Affairs Committee August 2018 Available at httpswwwassemblywaleslaid20documentscrld11711cr-ld11711-epdf (last accessed 18 August 2020)
National Lottery Heritage Fund (2014) ldquoPublic parks under threatrdquo June 2014 Heritage Fund website Available at httpswwwheritagefundorguknewspublic-parks-under-threat (last accessed 18 August 2020)
Y Nishida (2013) ldquoEnergy Efficiency in Buildings Policy and Programs in Policy and Programs in Tokyordquo Available at httpswwweu-japaneusiteseu-japaneufilesNishidapdf (last accessed 11 October 2020)
D Norris-Tirrell and JA Clay (2010) Strategic Collaboration in Public and Nonprofit Administration ndash A Practice-Based Approach to Solving Shared Problems Routledge Abingdon and New York Available at httpswwwroutledgecomStrategic-Collaboration-in-Public-and-Nonprofit-Administration-A-Practice-BasedNorris-Tirrell-Claypbook9781420088755 (last accessed on 26 November 2020)
E Oblak (2019) ldquoThe story of Ljubljana Case studyrdquo Available at httpszerowasteeuropeeudownloadscase-study-5-ljubljana-2 (last accessed on 1 October 2020)
S OrsquoCarroll J Wallace C Pineo L Basson J Woodcock R Daniel and C Mouton (2016) ldquoThe Western Cape Industrial Symbiosis Programme (WISP) An Innovative Approach to Resource Efficiency and Waste Minimisation for South African Businessesrdquo from Proceedings of the 20th WasteCon Conference 6-10 October 2014 Somerset West Cape Town Available at httpswww3smediacozainfrastructurenewswp-contentuploadssites4201601Oe28099Carroll-S-et-al-80pdf (last accessed on 30 September 2020)
OECD (nda) ldquoBreaking out of silos Joining up policy locallyrdquo F Froy OECD website Available at httpwwwoecdorgregionalleed43056251pdf (last accessed 18 August 2020)
OECD (ndb) ldquoMixes of policy instrumentsrdquo OECD website Available at httpwwwoecdorgenvtools-evaluationmixesofpolicyinstrumentshtm (last accessed 18 August 2020)
OECD and ICLEI (2016) ldquoGreen Cities Programme Methodologyrdquo Final Report May 2016 Available at httpswwwebrdgreencitiescomassetsUploadsPDF436b87ef46Green-City-Action-Plan-Methodology-Englishpdf (last accessed 18 August 2020)
100 Resilient Cities (nd) 100 Resilient Cities website Available at httpswww100resilientcitiesorg (last accessed 18 August 2020)
100 Resilient Cities (2018) ldquoAtlantarsquos Proctor Creek Greenway delivers multiple co-benefits from a single interventionrdquo Available at httpswww100resilientcitiesorgatlantas-proctor-creek-greenway-deliversmultiple-co-benefits-from-a-single-intervention (last accessed 18 August 2020)
Opensignal (2017) ldquoGlobal State of Mobile Networks (February 2017)rdquo Opensignal website Available at httpswwwopensignalcomreports201702global-state-of-the-mobile-network (last accessed 18 August 2020)
P Pantale (2014) ldquoDensity Bonusing and Development in Torontordquo Available at httpsfesyorkucawp-contentuploads201810Peter-Pantalone-Major-Research-Paper-FINALpdf (last accessed on 15 July 2019)
J Park (2016) ldquoHow the citizens of Seoul benefit from a sharing culture and an enhanced listening policyrdquo Available at httpssocialinnovationexchangeorginsightshow-citizens-seoul-benefit-sharing-culture-and-enhanced-listening-policy (last accessed on 30 September 2020)
Parma Futuro Smart (2020a) ldquoPesatura rifiuti smartrdquo in parmafuturosmartcomuneparmait Available at httpparmafuturosmartcomuneparmaitprogettisistemi-smart-per-pesatura-rifiuti (last accessed on 25 October 2020)
I Petek (2016) ldquoLjubljana Sloveniardquo in IMPACTPAPERECEU Available at httpsimpactpapereceuenfacts-figurescase-studiesljubljana-slovenia (last accessed 25 October 2020)
N Pietzsch JL Duarte Ribeiro J Fleith de Medeiros (2017) ldquoBenefits challenges and critical factors of success for Zero Waste A systematic literature reviewrdquo Waste Management Vol 67 pp 324-353
The Princersquos Foundation for the Built Environment (nd) ldquoStrasbourg Regaining the public realmrdquo Available at httpswwwacademiaedu23526879Strasbourg_Regaining_the_public_realm (last accessed on 19 October 2020)
196
Proračun Grada Rijeke (2018) ldquoProracun(ajme)rdquo Available at httpswwwvojko-obersnelcomhrproracunaj-me2018 (last accessed 15 October 2020)
PublicSpace (2018) ldquoPoblenou ldquoSuperblockrdquo Barcelona (Spain) 2018rdquo Available at httpswwwpublicspaceorgworks-projectk081-poblenou-s-superblock (last accessed on 29 September 2020)
Push-Pull Parking (2015) ldquoCatalogue on Case Studies for Parking Management Solutionsrdquo push-pull-parkingeu Available at httpwwweltisorgsitesdefaultfilestrainingmaterialspp_pm_catalogue_01062015_finalpdf (last accessed 18 August 2020)
Qualenergiait (2017) ldquoPrezzo die TEE alle stells lsquoeffetto Governo e GSErsquordquo Available at httpswwwqualenergiaitarticoli20170316-prezzo-dei-tee-alle-stelle-effetto-governo-e-gse (last accessed 8 October 2020)
S Raghavan (2019) ldquoThe success and failure of Water management in Chennairdquo Future Directions Available at httpswwwfuturedirectionsorgaupublicationthe-success-and-failure-of-water-management-in-chennai (last accessed on 29 September 2020)
Railway Gazette (2020) ldquoLund tramway gets revised launch daterdquo Available at railwaygazettecomprojects-and-planninglund-tramway-gets-revised-launch-date55881article (last accessed on 20 October 2020)
A Rabi (2013) ldquoReview and Analysis of Private Sector Participation Modalities in Water Service Delivery with Emphasis on the Southern Mediterranean Regionrdquo Available at httpwwwswim-smeuindexphpenresourcescategory76-assessments-en (last accessed on 29 September 2020)
M Raud (2020) ldquoLow temperature heating project in Tarturdquo in RELaTEDProjecteu Available at httpwwwrelatedprojecteuwp-contentuploads202004RELaTED-moreinfo-Fortum-Tartu-v2pdf (last accessed 12 October 2020)
Regions4recycling (2014) ldquoGood practice Tallinn Waste awareness educational campaigns for children and adultsrdquo Available at httpdocplayernet22211005-Good-practice-tallinn-waste-awarenesseducational-campaigns-for-children-and-adults-june-2014html (last accessed 18 August 2020)
M Ricci (2020) ldquoFood waste collection and recycling in Italyrdquo webinar presentation for the Bio-based and Biodegradable Industries Association 14 May 2020 Available at httpsbbiaorgukwp-contentuploads202006RICCI-BBIA-FW-Collection-IT-Webinar-2020-0514pdf (last accessed 25 October 2020)
ROCK (2019) ldquoCluj-Napoca Romania Imagine the future of the cityrdquo Participatory Approaches and Social Inclusion in Cultural Heritage Regeneration and Optimisation of Cultural Heritage in Creative and Knowledge Cities Horizon 2020 programme July 2019 Available at httpsinddadobecomview4c399cc1-0836-488c-83d4-fe21588c819b (last accessed 16 October 2020)
N Rogers (2017) ldquoDriving Fee Rolls Back Asthma Attacks in Stockholmrdquo Inside Science website February 2017 Available at httpswwwinsidescienceorgnewsdriving-fee-rolls-back-asthma-attacks-stockholm (last accessed 18 August 2020)
N Rolander (2018) ldquoBMWrsquos DriveNow Car-Sharing Services Bite the Dust in Stockholmrdquo July 2018 Bloomberg website Available at httpswwwbloombergcomnewsarticles2018-07-18bmw-s-drivenow-car-sharingservice-bites-the-dust-in-stockholm (last accessed 18 August 2020)
M Rousseau (2009) ldquoRe-imaging the City Centre for the Middle Classes Regeneration Gentrification and Symbolic Policies in lsquoLoser Citiesrsquordquo in International Journal of Urban and Regional Research Vol 33 (3) September 2009 pp 770-880 Available at httpsonlinelibrarywileycomdoiepdf101111j1468-2427200900889x (last accessed on 21st October 2020)
RUAF Foundation (2016) ldquoFrom strategies to operational goals for the Gent en Garderdquo Available at httpsruaforgassets201911Gent-en-Gardepdf (last accessed 18 August 2020)
G Ruggieri (2017) ldquoThe State of Art of Copenhagenrsquos Cycling Infrastructure and Possible Application in Other Urban Contextsrdquo Available at httpswwwpolitesipolimiitbitstream1058913415812017_04_RUGGIERIpdf (last accessed on 16 July 2019)
C Sabatino (2017) ldquoSolid Waste Management Systems through Social Inclusion The case of Belo Horizonte Brazilrdquo Available at httpwwwglobaldeliveryinitiativeorglibrarycase-studiessolid-waste-management-systems-through-social-inclusion-case-belo-horizonte (last accessed on 25 October 2020)
M Schiffbauer and G Varela (2019) ldquoMacro and Micro Features of Successful Economic Convergence The Case of Polandrdquo Available at httpdocuments1worldbankorgcurateden704781547133350911pdf133617-MTI-Discussion-Paper-11-Fixedpdf (last accessed 10 August 2019)
SEE Cities (2018) ldquoUPP Technical Workshop on Municipal Finance and Urban Auditrdquo Available at httpwwwseecitieseuseecitieseuUAitemid84amid549 (last accessed on 8 October 2020)
Seoul Metropolitan Government (2017) ldquoOne in three houses in Seoul to have photovoltaic facilityrdquo November 2017 Available at httpenglishseoulgokrone-three-houses-seoul-photovoltaic-facility (last accessed 18 August 2020)
Seoul Metropolitan Government (2018a) ldquolsquoSolar Cityrsquo Seoulrsquos future energy to be promoted at Seoul Solar Expordquo Available at httpenglishseoulgokrsolar-city-seouls-future-energy-to-be-promoted-at-seoul-solar-expo (last accessed 22 July 2019)
Seoul Metropolitan Government (2018b) ldquoSeoul Energy Corporation has launched Seoul Solar Centers in 5 regionsrdquo Available at httpenglishseoulgokrseoul-energy-corporation-launched-seoul-solar-centers-5-regions-providing-support-installment-post-m (last accessed 22 July 2019)
A Serena A Tob-Ogu and A Genovese (2018) ldquoTransitioning Urban Consolidation Centres initiatives in successful operations A Collection of EU case experiencesrdquo The University of Sheffield Available at httpwwwprosfeteuPROSFETwp-contentuploads201805Transitioning-Urban-Consolidation-Centres-initiatives-in-successful-operationspdf (last accessed on 29 September 2020)
I Šerić (2017) ldquoThe EPC market in Croatia and the new Eurostat rules on EPC accountingrdquo European Union November 2017 Available at httpseceuropaeuenergysitesenerfilesdocuments018_1b_ivan_seric_seif_milan_16-11-17pdf (last accessed 18 August 2020)
SF Environment (2019) ldquoCheckout Bag Charge and Recyclable or Compostable Pre-Checkout Bag Ordinancerdquo San Francisco Department of the Environment Available at httpssfenvironmentorgcheckout-bagordinance (last accessed 18 August 2020)
Shareable (2013) ldquoIs Seoul the Next Great Sharing Cityrdquo Available at httpswwwshareablenetis-seoul-the-next-great-sharing-city (last accessed on 25 September 2020)
SmartCities World (2019) ldquoVienna ranked top for smart city strategyrdquo SmartCitiesWorldnet 14 March 2019 Available at httpswwwsmartcitiesworldnetnewsnewsvienna-ranked-top-for-smart-city-strategy-3965 (last accessed 24 September 2020)
N Smedby (2015) ldquoAssessing local governance experiments for building energy efficiency ndash the case of Malmouml Swedenrdquo Available at httpsjournalssagepubcomdoipdf1011770263774X15614176 (last accessed 12 July 2019)
M Smith and J Castellano (2015) ldquoCosts associated with nonresidential electric vehicle supply equipment Factors to consider in the implementation of electric vehicle charging stationsrdquo US Department of Energy Available at httpstridtrborgview1377403 (last accessed 18 August 2020)
Snaga Ljubljana (2018) ldquoSnaga Ljubljana the biggest Slovenian waste management companyrdquo Available at httpsissuucomsnaga4docssnaga_ljubljana_eng (last accessed on 9 July 2019)
Sofia Municipality (2018) ldquoSofia Municipal Budgetrdquo February 2018 Available at httpswwwsofiabgwebsofia-municipalitystart-asset_publisherHMYVGw6PDFKhcontentthe-budget-of-sofia-is-now-uploaded-to-the-open-data-portalinheritRedirect=false (last accessed 18 August 2020)
D Staničić (2019) Jožef Stefan Institute Energy Efficiency Centre presentation 28 March 2019 slide 3
197
Z Stoyanova (2014) ldquoSustainable Urban Mobility Plan of Burgas 2014 ndash 2020rdquo Available at httpwwwsoutheast-europenetdocumentcmtid=842 (last accessed on 19 October 2020)
Strasbourg Eurometropole (2015) ldquo20 years of active policy supporting mobility within Strasbourg Eurometropolerdquo Available at Strasbourgeu eurometropole (2015) (last accessed on 19 October 2020)
Sustainable Australia Fund (2020) ldquoAbout usrdquo Available at httpssustainableaustraliafundcomauwho-we-are (last accessed on 8 October 2020)
Sustainable Cities (nd) ldquoOrbital Forest a Balance Between the City and Nature Rediscoveredrdquo Sustainable Cities website Available at httpwwwsustainablecitieseutransformative-actionsdatabasec=searchampaction_id=eu2ii6rw (last accessed 18 August 2020)
Sustainable Cities (2018) ldquoAlba Iulia Smart City Pilot Projectrdquo Sustainable Cities website Available at httpwwwsustainablecitieseutransformative-actions-databasec=searchampaction_id=ixgrulm3 (last accessed 18 August 2020)
Sustainable Development Solutions Network (2016) ldquoGetting Started with the SDGs in Citiesrdquo Available at httpsresourcesunsdsnorggettingstarted-with-the-sdgs-in-cities (last accessed 18 August 2020)
Sustainable Water Integrated Management (SWIM) Support Mechanism (2013) ldquoDocumentation of best practices in non-revenue water management in selected Mediterranean countriesrdquo European Union-funded project February 2013 Available at httpwwwswim-smeufilesBest_Practices_in_non-revenue_water_EN_Finalpdf (last accessed 18 August 2020)
SWITCH (Sustainable Water Management Improves Tomorrow Cities Health) project (2014) ldquoZaragoza combining awareness raising and financial measures to ensure water efficiencyrdquo Available at httpsclimate-adapteeaeuropaeumetadatacase-studieszaragoza-combining-awareness-raising-and-financial-measures-to-enhance-water-efficiency (last accessed on 8 August 2019)
D Szescilo (nd) ldquoStrengthening fiscal capacities for subnational public investment The case of Polandrdquo Available at httpwwwoecdorgregionalregional-policyStrengthening-Fiscal-Capacities-Poland-ENGpdf (last accessed 9 August 2019)
D Szescilo and M Kulesza (2012) ldquoLocal Government in Polandrdquo Local Government in the Member States of the European Union A Comparative Legal Perspective Madrid Available at httpswwwresearchgatenetpublication283568884_Local_government_in_Poland (last accessed 15 October 2020)
S Thomas et al (2014) Energy Efficiency Watch Energy Efficiency Policies in Europe Case Study Energy Manager Obligation and White Certificate Scheme ndash Italy Available at httpwwwfedareneorgwp-contentuploads201603Case_Study_Manager_White-Certificates_Italy_finalpdf (last accessed 10 October 2020)
S M Tica P Živanović S Bajčetić S Gavrilović and S Filipović (2012) ldquoOrganization and Management of Complex Interoperable Tariff and Fare Collection Systems-Example of the City of Belgraderdquo Proceedings of the International Conference on Traffic and Transport Engineering p 259 Belgrade Available at httpsbibirbhrdatoteka629846ICTTE_Belgrade_2012_Proceedingspdfpage=268 (last accessed 18 August 2020)
Tokyo Development Learning Centre (2017) ldquoAddressing Solid Waste Management through the 3R Approachrdquo Available at httpsprogrammeworldwaterweekorgContentProposalResourcesPDF2017pdf-2017-7137-5-Japan20Project20Brief_Yokohama3RPDF (last accessed on 1 October 2020)
Tokyo Metropolitan Government (2018) ldquoTokyo Carbon Reporting Program for SMFsrdquo Available at httpwwwkankyometrotokyojpenclimatetokyo_carbonhtml (last accessed 10 October 2020)
TomTom (nd) ldquoTraffic Index 2019rdquo TomTom website Available at httpswwwtomtomcomen_gbtraffic-indexranking (last accessed 18 August 2020)
TomTom (2020) ldquoMoscow region (oblast) trafficrdquo Available at httpswwwtomtomcomen_gbtraffic-indexmoscow-traffic (last accessed on 20 October 2020)
Transparency International and UN-Habitat (2004) ldquoTools to Support Transparency in Local Governancerdquo March 2004 Urban Governance Toolkit Series Available at httpswwwtransparencyorgenpublicationstools-to-support-transparency-in-local-governance (last accessed 23 August 2020)
Transport and Environment (2017) ldquoDoes sharing cars really reduce car userdquo June 2017 briefing note Available at httpswwwtransportenvironmentorgsitestefilespublicationsDoes-sharing-carsreally-reduce-car-use-June202017pdf (last accessed 18 August 2020)
Transport for London (2014) ldquoInternational Cycling Infrastructure Best Practice Study Appendix ndash City Summariesrdquo Available at httpcontenttflgovukinternational-cycling-infrastructure-best-practice-study-appendixpdf (last accessed on 20 October 2020)
A Trivedi and M Chertock (2019) ldquoResponding to Day Zero Equitably Water Crisis Lessons from Cape Town and Chennairdquo Available at httpswwwwriorgblog201910responding-day-zero-equitably-water-crisis-lessons-cape-town-and-chennai (last accessed on 23 October 2020)
J L Trujillo and J Parilla (2016) ldquoRedefining Global Cities ndash The Seven Types of Global Metro Economiesrdquo Global Cities Initiative The Brookings Institution Available at httpswwwbrookingseduresearchredefiningglobal-cities (last accessed 18 August 2020)
2020 Collectors Project (2020) ldquoCase Study Parma Italyrdquo Available at httpswwwcollectors2020euwp-contentuploads202008Case_Integration_Summary_Parmapdf (last accessed on 2 October 2020)
2030 Water Resources Group (2013) ldquoManaging Water Use in Scarce Environments A Catalogue of Case Studiesrdquo August 2013 Available at httpswwwwaterscarcitysolutionsorgwp-contentuploads201508WRG-Managing-Water-Scarcity-Cataloguepdf (last accessed 18 August 2020)
2030 Water Resources Group (2015) ldquoManaging Water Use in Scarce Environments A Catalogue of Case Studiesrdquo Available at httpswwwwaterscarcitysolutionsorgwp-contentuploads201508WRG-Managing-Water-Scarcity-Cataloguepdf (last accessed on 29 September 2020)
UCLG and World Bank (2009) ldquoDecentralization and Local Democracy in the World First Global Report by United Cities and Local Governments 2008rdquo Available at httpsopenknowledgeworldbankorghandle109862609 (last accessed 18 August 2020)
UK Department for Business Energy and Industrial Strategy (2019) ldquoSmart Meter Roll-Out Cost-Benefit Analysis (2019)rdquo September 2019 Available at httpsassetspublishingservicegovukgovernmentuploadssystemuploadsattachment_datafile831716smart-meter-roll-out-cost-benefit-analysis-2019pdf (last accessed 18 August 2020)
UK Parliament (2013) ldquoWarm Front Schemerdquo Commons Research Briefing SN06231 House of Commons Library August 2013 Available at httpsresearchbriefingsparliamentukResearchBriefingSummarySN06231 (last accessed 18 August 2020)
UN (nd) ldquoCities and Pollution contribute to climate changerdquo Available at httpswwwunorgenclimatechangecitiespollutionshtml~text=Cities20are20major20contributors20tocent20of20the20Earths20surface (last accessed 19 August 2020)
UN (2018a) ldquo68 per cent of the world population projected to live in urban areas by 2050 says UNrdquo Available at httpswwwunorgdevelopmentdesaennewspopulation2018-revision-of-world-urbanizationprospectshtml (last accessed 18 August 2020)
UN (2018b) World Urbanization Prospects The 2018 Revision Department of Economic and Social Affairs New York Available at httpspopulationunorgwupPublicationsFilesWUP2018-Reportpdf (last accessed 18 August 2020)
UN (2020) ldquoGoal 11 Make cities inclusive safe resilient and sustainablerdquo Available at httpswwwunorgsustainabledevelopmentcities (last accessed 18 August 2020)
198
UNDP (2009) Capacity Development A UNDP Primer United Nations Development Programme New York
UN Environment Programme (2017) ldquoWinter is coming for fossil fuel heating in Banja Lukardquo November 2017 Available at httpswwwunenvironmentorgnews-and-storiespress-releasewinter-comingfossil-fuel-heating-banja-luka (last accessed 18 August 2020)
UN Environment Programme (2019) ldquoSustainable Citiesrdquo Available at httpswwwunenvironmentorgregionsasia-and-pacificregionalinitiativessupporting-resource-efficiencysustainable-cities (last accessed 18 August 2020)
UNFCC (2017) ldquoSweden Plans to Be Carbon Neutral by 2045rdquo Available at httpsunfcccintnewssweden-plans-to-be-carbon-neutral-by-2045 (last accessed on 26 June 2019)
UN-Habitat (2009) International Guidelines on Decentralization and Access to Basic Services for All United Nations Human Settlements Programme Nairobi Available at httpsunhabitatorgsitesdefaultfilesdownload-manager-filesInternational20Guidelines20on20Decentralization20and20Access20to20Basic20Services20for20allpdf (last accessed 18 August 2020)
UN-Habitat (2013) State of the Worldrsquos Cities 20122013 Prosperity of Cities United Nations Human Settlements Programme Nairobi (last accessed 18 August 2020)
UN-Habitat (2017) ldquoHow to improve residential energy efficiency in South Eastern Europe and CISrdquo Policy Discussion Brief for national governments and international organizations April 2017 Available at httpswwwhabitatorgsitesdefaultfilesHow20to20improve20REE_policy20brief_FINAL_0pdf (last accessed 18 August 2020)
Urban Innovation Vienna (2020) ldquoSmart City Agencyrdquo Available at httpswwwurbaninnovationatenSmart-City-Agency (last accessed 24 September 2020)
Urban Sustainability Exchange (nda) ldquoThe City of Copenhagenrsquos Bicycle Strategyrdquo Available at httpsusemetropolisorgcase-studiescycling-in-copenhagencasestudydetail (last accessed on 16 July 2019)
Urban sustainability exchange (ndb) ldquoThe Sharing City Seoul Projectrdquo Available at httpsusemetropolisorgcase-studiesthe-sharing-city-seoul-project (last accessed on 21 October 2020)
UrbaSofia (2018) Results of the ATTRACTIVE DANUBE 3rd National Workshop Available at httpsurbasofiaeuenresults-of-the-attractive-danube-3rd-national-workshop (last accessed on 16 October 2020)
URBED and the Joseph Rowntree Foundation (2006) ldquoMaking Connections Transforming People and Places in Europe Case Study of Roubaix Lille (France)rdquo updated December 2007 Available at httpurbedcoopsitesdefaultfilesCase20Study20of20Roubaix20Lillepdf (last accessed 18 August 2020)
VivaCity2020 Cities Institute LondonMet (nd) ldquoThe Generation of Diversity Mixed Use and Urban Sustainability Clerkenwell (L B Islington) Case Studyrdquo Available at httpwwwvivacity2020coukMembersVivaCity20WP220Case20Study20Clerkenwellpdf (last accessed 18 August 2020)
J Warren (2010) ldquoCivilising the Streets How strong leadership can deliver high quality of life and vibrant public spacesrdquo Available at httptransformscotlandorgukwpwp-contentuploads201412Civilising-the-Streetspdf (last accessed on 20 October 2020)
Water Time (2005) ldquoBucharestrdquo Available at httpwwwwatertimenetwt_cs_cit_ncrhtmlRomania (last accessed on 29 September 2020)
M Wattenbarger (2018) ldquoThe Mexican town that refused to become a smart cityrdquo The Guardian website October 2016 Available at httpswwwtheguardiancomcities2018oct16the-mexican-town-that-refused-to-become-a-smart-city (last accessed 18 August 2020)
R Webb G Avram J Buron Garcia and A Joyce (2018) ldquoTransforming Cities by Designing with Communitiesrdquo The Hackable City pp 95-117 M de Lange and M de Waal (eds) Springer Link
Western Cape Government (nd) ldquoWestern Cape Industrial Symbiosis Programmerdquo Available at httpswwwwesterncapegovza110greenprojectswestern-cape-industrial-symbiosis-programme (last accessed on 24 September 2020)
M White (2019) ldquoVeolia and Leon trial deposit return scheme in Londonrdquo FoodBev Media website page March 2019 Available at httpswwwfoodbevcomnewsveolia-and-leon-trial-deposit-return-scheme-inlondon (last accessed 18 August 2020)
J Whitelegg (2014) ldquoCycles of change three bike-friendly European cities with lessons for the UKrdquo Available at httpswwwtheguardiancomlocal-government-network2014jan29cycling-rates-european-cities-lessons-for-uk (last accessed on 20 October 2020)
WHO (nd) ldquoWHO European Healthy Cities Networkrdquo World Health Organization Regional Office for Europe website Available at httpwwweurowhointenhealth-topicsenvironment-and-healthurban-healthwho-european-healthy-cities-network (last accessed 11 April 2019)
WHO and UN Environment (2017) ldquoCities Transport health and environmentrdquo Available at httpwwweurowhoint__dataassetspdf_file0019341128Fact-Sheet-1-City-Transport-health-and-environmentpdfua=1 (last accessed 11 April 2019)
K Willsher (2018) ldquoFrancersquos art deco jewel is reborn to make an even bigger splashrdquo The Guardian 21 October 2018 Available at httpswwwtheguardiancomartanddesign2018oct21france-art-deco-jewel-swimming-pool-art-gallery-reopens (last accessed on 30th September 2020)
D C Wilson C Velis and C Cheeseman (2006) ldquoRole of informal sector recycling in waste management in developing countriesrdquo Habitat International Vol 30 (4) pp 797-808
World Bank (nd) ldquoInclusive Citiesrdquo World Bank website page Available at httpswwwworldbankorgentopicinclusive-cities (last accessed 24 May 2019)
World Bank (2009) ldquoUnlocking Land Values to Finance Urban Infrastructurerdquo Available at httpdocumentsworldbankorgcurateden723411468139800644pdf461290PUB0Box3101OFFICIAL0USE0ONLY1pdf (last accessed on 6 August 2019)
World Bank (2013) ldquoCity of Rijeka MFSA summary 2013rdquo Available at httppubdocsworldbankorgen366021438191576243City-of-Rijeka-MFSA-summary-24-12-2013pdf (last accessed on 8 October 2020)
World Bank (2014) ldquoOvercoming constraints in the financing of infrastructurerdquo Available at httpwwwg20utorontoca2014WBG_IIWG_Success_Stories_Overcoming_Constraints_to_the_Financing_of_Infrastructurepdf (last accessed on 30 September 2020)
The World Bank (2016) ldquoPPI Project Summary Romania Bucharest ndash Concession Agreement for Water and Sanitation Servicesrdquo Available at httpspppworldbankorgpublic-private-partnershipppi-project-summary-romania-bucharest-concession-agreement-water-and-sanitation-services (last accessed on 29 September 2020)
World Bank (2017) ldquoImproving Local Governance in Belizersquos Municipalitiesrdquo Results Briefs Available at httpswwwworldbankorgenresults20171020improving-local-governance-in-belizesmunicipalities (last accessed 18 August 2020)
World Bank (2018) ldquoArmenia - Municipal Water Projectrdquo Independent Evaluation Group Project Performance Assessment Report 127226 Available at httpsiegworldbankgrouporgsitesdefaultfilesDatareportsppar_armeniawaterpdf (last accessed on 28 September 2020)
World Bank (2019) ldquoSolid Waste Managementrdquo Brief September 2019 Available at httpswwwworldbankorgentopicurbandevelopmentbriefsolid-waste-management (last accessed 18 August 2020)
World Bank Group (2017) ldquoLessons from Poland Insights for Poland A Sustainable and Inclusive Transition to High Income Statusrdquo World Bank Washington DC Available at httpsopenknowledgeworldbankorghandle1098628960 (last accessed 15 October 2020)
World Bank Group (2018) ldquoProject Appraisal Document on a Proposed Loan in the Amount of US$ 50 Million to the Republic of Albania for
199
a Regional and Local Roads Connectivity Projectrdquo Available at httpdocumentsworldbankorgcurateden133741523301183905pdfAlbania-Roads-Project-Appraisal-Document-PAD-Revised-04052018pdf (last accessed 18 August 2020)
World Bank Group (2020) ldquoUrban Development ndash Overviewrdquo Available at httpswwwworldbankorgentopicurbandevelopmentoverview (last accessed 18 August 2020)
World Bank Group and Government of Austria (2018) ldquoUrban Partnership Program (UPP) Improving Local Government Capacityrdquo Available at httpdocumentsworldbankorgcurateden613241525861852694pdfMFSA-Booklet-City-data-sheets-022018pdf (last accessed 18 August 2020)
World Bank Institute (2013) ldquoImproving Local Governments Capacity The Experience of Municipal Finances Self-Assessment (MFSA) in South-East Europerdquo Available at httpwwwseecitieseuPortals0ImagesStoriesPublicationsMFSA20-20onlinepdf (last accessed 18 August 2020)
World Economic Forum (2017) ldquoCollaboration in Cities From Sharing to lsquoSharing Economyrsquordquo White paper December 2017 Available at httpwww3weforumorgdocsWhite_Paper_Collaboration_in_Cities_report_2017pdf (last accessed 18 August 2020)
World Energy Council and Arup (2016) ldquoPerspective input into the World Energy Council Scenarios lsquoInnovating Urban Energyrsquordquo October 2016 Available at httpswwwarupcomperspectivespublicationsresearchsectionperspective-input-into-the-world-energy-council-scenariosinnovating-urban-energy (last accessed 18 August 2020)
World Habitat Awards (2013) ldquo30 Years of Planning Continuity in Freiburg Germanyrdquo Available at httpswwwworld-habitatorgworld-habitat-awardswinners-and-finalists30-years-of-planning-continuity-in-freiburg-germany (last accessed on 20 October 2020)
WRI (2016) ldquoLocalizing Open Government Reformsrdquo World Resources Institute website December 2016 Available at httpswwwwriorgblog201612localizing-open-government-reforms (last accessed 18 August 2020)
WWF (nd) ldquoAustriardquo Available at httpswwfpandaorgget_involvedlive_greentravelon_vacationeco_tipsaustria (last accessed 4 June 2019)
WWF (2012) ldquoStuttgart green corridorsrdquo Available at httpwwfpandaorg204461Stuttgart-green-corridors (last accessed on 15 July 2020)
M Xylia S Leduc P Patrizio F Kraxner and S Silveira (2017) ldquoLocating charging infrastructure for electric buses in Stockholmrdquo Transportation Research Part C Emerging Technologies Vol 78 pp 183-200 Available at httpswwwresearchgatenetpublication315066457_Locating_charging_infrastructure_for_electric_buses_in_Stockholm (last accessed 18 August 2020)
Zero Waste Europe (2016) ldquoThe Story of Parmardquo Available at httpssmartnetniuaorgsitesdefaultfilesresourcescs7-parma-webpdf (last accessed on 2 October 2020)
Zero Waste Europe (2019) ldquoThe story of Ljubljana Case study 5rdquo Available at httpszerowasteeuropeeudownloadscase-study-5-ljubljana-2 (last accessed 18 August 2020)
Zero Waste Scotland (nd) ldquoScheme Administratorsrdquo Zero Waste Scotland website page Available at httpsdepositreturnschemezerowastescotlandorgukscheme-administrators (last accessed 18 August 2020)
200
Abbreviations and acronyms
AfDB African Development Bank
ADB Asian Development Bank
CDP corporate development programme
CEE central and eastern Europe
CTCN Climate Technology Centre and Network
DH district heating
the EBRD the Bank European Bank for Reconstruction and Development
EIB European Investment Bank
EPC energy performance contracting
ESCO energy service company
EVSE electric vehicle supply equipment
EU European Union
GCAP Green City Action Plan
GDP gross domestic product
GHG greenhouse gas
GIZ Deutsche Gesellschaft fuumlr Internationale Zusammenarbeit
ICLEI ICLEI - Local Governments for Sustainability
IDB Inter-American Development Bank
ITDP Institute for Transportation and Development Policy
IT information technology
JSC joint stock company
OECD Organisation for Economic Co-operation and Development
LCV light commercial vehicle
LSE London School of Economics and Political Science
NGO non-governmental organisation
PM particulate matter
PPP public-private partnership
PSC public service contract
SEE south-eastern Europe
SEMED southern and eastern Mediterranean
UCLG United Cities and Local Governments
UN United Nations
UNDP United Nations Development Programme
WHO World Health Organization
201
The contents of this publication reflect the opinions of individual authors and do not necessarily reflect the views of the EBRD
Terms names and images used in this report to refer to geographical or other territories political and economic groupings and units do not constitute and should not be construed as constituting an express or implied position endorsement acceptance or expression of opinion by the European Bank for Reconstruction and Development or its members concerning the status of any country territory grouping and unit or delimitation of its borders or sovereignty
copy European Bank for Reconstruction and Development One Exchange Square London EC2A 2JN United Kingdom wwwebrdcom
All rights reserved No part of this publication may be reproduced or transmitted in any form or by any means including photocopying and recording without the written permission of the copyright holder Such written permission must also be obtained before any part of this publication is stored in a retrieval system of any nature
Photography copy EBRD and iStockphoto
Designed and produced by Pimclick and the EBRD
1272 Effective policy options for green cities

Case studies
Title of case study Related policy options
Integrated urban mobility Burgas Bulgaria
bull Parking policiesbull Road-user chargesbull Planning and regulation of public transport servicesbull Pro-cycling policies
92
Integrated multi-modal transport Strasbourg France
bull Pedestrian-oriented and car-restrictive policiesbull Planning and regulation of public transport servicesbull Pro-cycling policies
94
Shifting from transport to mobility Moscow Russia
bull Parking policiesbull Road-user chargesbull Planning and regulation of public transport servicesbull Car-sharing and car-pooling policies
97
Incentives to use public and active transport Freiburg Germany
bull Pedestrian-oriented and car-restrictive policies bull Planning and regulation of public transport services bull Pro-cycling policies
100
Pedestrianisation and car-free zones Ljubljana Slovenia
bull Pedestrian-oriented and car-restrictive policiesbull Pro-cycling policies
103
Promotion of active transport Lund Sweden
bull Pedestrian-oriented and car-restrictive policiesbull Pro-cycling policies
106
Cycling strategy Copenhagen Denmark
bull Pedestrian-oriented and car-restrictive policiesbull Pro-cycling policies
109
Green ventilation corridors Stuttgart Germany
bull Promotion of green spaces and biodiversity 111
Urban planning with superblocks Barcelona Spain
bull Development of compact citiesbull Promotion of mixed-use areas and transit-oriented
developmentbull Promotion of green spaces and biodiversity
114
Urban regeneration and renewal Roubaix France
bull Promotion of mixed-use areas and transit-oriented development
bull Promotion of community-based land use planning
117
Density bonusing and development Toronto Canada
bull Development of compact cities 120
Policy areas
Transport92
Water140
Solid waste156
Energy and buildings 122
Land use111
Governance175
Finance184
Energy manager obligation Italy bull Support of energy performance contracts 122
Energy performance contracting Berlin Germany
bull Improved energy performance for public buildingsbull Support of energy performance contracts
125
Solar City Seoul Seoul South Korea
bull Improved energy building codes and labellingbull Promotion of renewable electricity generation
128
Carbon reduction reporting programme Tokyo Japan
bull Support of energy performance contracts 131
District heating and cooling Tartu Estonia
bull Decarbonisation of district heating supply 134
Sustainable eco-districts Malmouml Sweden
bull Improved energy building codes and labellingbull Promotion of renewable electricity generation
137
Private contracting in the water sector Yerevan Armenia
bull Regulation and contracting of service providers 140
Micro private-sector participation Madaba Jordan
bull Regulation and contracting of service providersbull Reform and strengthening of water utilitiesbull Effective tariff reforms and price signals
143
Management of water demand Drakenstein South Africa
bull Promotion of resource-efficient utilitiesbull Effective tariff reforms and price signalsbull Awareness campaigns for households and industry
146
Water and wastewater recycling Chennai India
bull Regulation and contracting of service providersbull Reform and strengthening of water utility firmsbull Effective tariff reforms and price signals
149
Water-saving programme Zaragoza Spain
bull Effective tariff reforms and price signalsbull Awareness campaigns for households and industry
151
Public-private partnership agreement Bucharest Romania
bull Regulation and contracting of service providersbull Reform and strengthening of water utilitiesbull Effective tariff reforms and price signals
154
Industrial symbiosis programme Cape Town South Africa
bull Information strategies for residents and industrybull Formalisation of informal waste collection
156
Sharing city project Seoul South Korea
bull Information strategies for residents and industrybull Promotion of sharing and reuse of products
159
Reduce reuse recycle Yokohama Japan
bull Information strategies for residents and industry 163
Zero-waste strategy Ljubljana Slovenia
bull Effective price signals and fundingbull Information strategies for residents and industrybull Waste sorting and treatment to encourage recycling
166
Policy areas
Transport92
Water140
Solid waste156
Energy and buildings 122
Land use111
Governance175
Finance182
Zero-waste strategy Parma Italy bull Effective price signals and fundingbull Information strategies for residents and industrybull Waste sorting and treatment to encourage recycling
169
Formalisation of informal waste pickers Belo Horizonte Brazil
bull Formalisation of informal waste collectorsbull Improvement of waste collection services
172
Political and fiscal decentralisation Poland
bull Political and fiscal decentralisation 175
Smart city performance monitoring Austria Vienna
bull Improved transparency and accountability 177
Co-designing and co-creating urban solutions Cluj-Napoca Romania
bull Effective stakeholder participation 180
Land Value Capture Bogotaacute Colombia
bull Improved revenue and financial autonomy 182
Diagnosis framework for municipal finance Rijeka Croatia
bull Improved financial accountability and transparency 184
Climate Fund Melbourne Australia bull Improved revenue and financial autonomy 187
Policy areas
Transport92
Water140
Solid waste156
Energy and buildings 122
Land use111
Governance175
Finance182
7
Maintaining economic growth while creating sustainable cities for all is the biggest urban challenge that countries face today More than half of the worldrsquos population lives in cities and that share is projected to reach 68 per cent by 2050 Cities and metropolitan areas are engines of economic growth contributing about 80 per cent of global GDP However they
also account for about 60 per cent of global carbon emissions and more than 70 per cent of energy use1 2 Today many cities struggle with environmental degradation inadequate urban infrastructure and traffic congestionsup3 These challenges will become only more pressing if the pace and pattern of urbanisation continues
Foreword
This report presents impactful urban policy options and case studies that can help cities accelerate their green agendas A digital tool for specific policies and case studies will accompany the final version of this document ndash see wwwebrdgreencitiescom
sup1 See United Nations (2018) sup2 See United Nations (nd)sup3 See United Nations Environment Programme (2019)
Foreword
8
Against this backdrop the EBRD launched its Green Cities Framework in 2016 to systematically promote sustainable urban development across the Bankrsquos regions Today EBRD Green Cities is our largest investment programme covering 44 cities in 22 countries with more than euro15 billion committed by the EBRD and multiple donors for investments and technical support Recently as cities have been at the forefront of the Covid-19 crisis the programme has become even more important supporting our partner cities as they ldquobuild back betterrdquo from the pandemic
While investments in sustainable infrastructure are crucial complementary policy reforms also play a vital role in helping to achieve systemic impact However through our work with EBRD Green Cities we have noticed the lack of a cross-sectoral overview of green urban policy options that could guide municipal authorities and relevant stakeholders in the selection design and implementation of effective policies This report aims to develop such an overview and contribute to a shared vision of the role and opportunities of city-led policy initiatives and programmes It seeks to raise awareness of the potentially impactful role of policy initiatives of how they interact with other urban policies and in particular how policies can enhance and complement the environmental benefits of municipal investment programmes
While this publication was produced in the context of EBRD Green Cities and all policies and case studies have been selected and presented with the EBRD regions in mind itis highly relevant for any city seeking green solutions regardless of its location The policy options and case studies detailed in this document are structured around seven policy areas with each policy option and case study presented in a brief and hands-on manner The content aims to be practical and accessible to a wide range of
stakeholders including those with limited technical or policymaking experience
The process of drafting this report was complex The main challenge was the integrated nature of urban policies and the multiple benefits (and costs) that one policy may create directly and indirectly for different stakeholders In this complex landscape of activities and outcomes it is sometimes difficult to structure and categorise policies and benefits in a simple way without losing too much of the true picture Fortunately we are not the first institution to compile a structured overview of urban policies In drafting this report we benefited greatly from the support and expertise of a wide range of external partners as well as from the knowledge and help of many teams across the EBRD A detailed list of contributors is available in the acknowledgement section at the front of this report
As the content of this report and its accompanying digital tool will be shared and explored among policymakers stakeholders and other interested parties the EBRD expects to collect a rich set of feedback and suggestions that it will incorporate and build on We hope that this will be reflected in an even richer set of policy options and case studies in future In addition we aim to further emphasise aspects of smart inclusive and resilient urban development ndash as well as their interaction with green urban policies ndash in future updates to the digital tool and this report We look forward to intensifying our work with partners around urban policies and hope that this report serves as an important step in this direction
Elisabetta Falcetti Director Sector Economics and Policy EBRD
ldquoToday EBRD Green Cities is our largest investment programme covering 44 cities in 22 countries with more than euro15 billion mobilised by the EBRD and multiple donors for investments and technical supportrdquo
Elisabetta Falcetti
9
1 IntroductionWith the pace of urbanisation accelerating globally it is almost impossible to discuss the opportunities and challenges of sustainable development without reflecting on the role and impact of cities
On the one hand cities are powerhouses of economic growth generating more than 80 per cent of global GDP On the other hand they also account for about 70 per cent of energy use and 60 per cent of greenhouse gas emissions4 5
Given the transformative power of cities ndash for better or for worse ndash sustainable urban development has moved to the centre of the global development agenda This is most prominently reflected in Goal 11 of the United Nations (UN) Sustainable Development Goals (SDGs) which seeks to ldquomake cities and human settlements inclusive safe resilient and sustainablerdquo by 20306
However not only has more attention been given to cities lately but the way of looking at cities and urban development has also changed over the years Whereas the focus was previously on economically efficient cities often linked to car-based urban planning today the idea of a green and people-centric urban development dominates
In this view residents are seen both as important users of urban spaces and services and also as important guardians of accountability ensuring well-governed and inclusive urban development In addition there is a growing recognition that cities do not merely provide close proximity between the workforce and fixed places of employment but also represent dynamic arenas for interaction between the working and resident populations which are increasingly embedded in a digitalised environment
Given all of these issues it is becoming clear that sustainable urban development should
be pursued through a systematic and holistic approach Such an approach must go beyond cross-sectoral planning and coordination to combine and integrate investment programmes with well-defined policy frameworks and put residents at the centre An inclusive and participatory approach to sustainable urban development is vital to ensure the participation of residents and guarantee that all interests including those of marginalised groups are considered when developing implementing and maintaining urban solutions
In response to this awareness in 2016 the EBRD developed its Green Cities Framework in order to promote sustainable urban development across the Bankrsquos regions in a systematic and holistic manner EBRD Green Cities is now the largest investment programme of the Bank with more than euro15 billion mobilised from the EBRD and external donors for investment and technical support and more than 40 cities signed up to date The programme seeks to help cities identify and address their key environmental challenges through evidence-based diagnostics and an inclusive planning process ndash followed by the preparation and implementation of priority investments and policy initiatives
2 Content of this reportIn light of the importance of well-defined and inclusive policy initiatives as part of any agenda for sustainable urban development this report presents impactful urban policy options and related case studies relevant to cities pursuing an agenda of this kind
The report structures these policy options and case studies around seven policy areas ndash five sector-specific areas (urban transport land planning energy efficiency and buildings water and wastewater solid waste) and two cross-sectoral or enabling policy areas (governance and financing) Within each policy area the main five to ten policy options are presented in
Executive summary
4 See United Nations (nd)5 See World Bank Group (2020)6 See UN (2020)
Executive summary
10
terms of their resource implications benefits and risks necessary conditions typical implementation challenges or expected opposition and critical success criteria The listed policy options are backed by relevant case studies from cities located within and outside the EBRD regions These case studies have been selected on the basis of a multi-criteria analysis which ranked them in terms of their characteristics such as replicability transparency community buy-in and so on
This report provides a useful and practical source of references for a wide range of urban stakeholders and interested parties and promotes a shared understanding of the possibilities and likely implications of various policy initiatives The policy options and case studies are concise7 This report does not aim to provide support on how to identify environmental shortcomings in a city Rather it assumes that the shortcomings have been identified prior to using this knowledge product However readers can use the menu of policy options to guide any form of gap analysis undertaken by cities seeking to accelerate their green agenda8
The report content is oriented towards the cities in the EBRD regions taking part in the Green Cities programme ndash a practical framework that aims to help cities prioritise and implement investments and urban policies Hence for the purposes of this publication policies are understood as being most non-investment activities that target the lsquogreeningrsquo of cities that municipal authorities can implement or influence within five years and that can generate material impact within five to ten years Consequently this report does not cover high-level strategic policies or visionary plans more suitable for central governments Instead it focuses on tactical and operational policy options that fall within municipal control and influence Among others these options include planning regulation incentives funding and financing skills development capacity-building and monitoring as well as attitude campaigns awareness-raising and information programmes
3 The main issues in each of the seven policy areasUrban transport Cities across the region face high levels of air pollution due to growing car ownership and insufficient vehicle standards compounded by a lack of attractive public and active modes of transport Relevant green transport policies include those that aim to restrict car use on the one hand and to promote public and active mobility on the other Furthermore cities can promote cleaner vehicles including through the electrification of urban transport
Land use and biodiversity Some cities in the EBRD regions face uncontrolled population growth and urban sprawl Other cities may be more stagnant while suffering from a legacy of poor availability of recreational and green infrastructure and from limited biodiversity Potential policies to tackle these challenges include the development of compact cities the promotion of mixed-use areas and transit-oriented urban development the promotion of green spaces and the encouragement of community-based land-use planning
Energy efficiency and buildings Many economies in which the EBRD invests share a legacy of buildings characterised by poor energy efficiency and high electricity and heat consumption commonly linked to fossil fuels Policies to address these issues cover initiatives that promote energy-efficient buildings ensure better price signals and more energy-conscious consumption and help decarbonise the provision of heat and electricity
Water sector In the EBRD regions cities experience high levels of ldquonon-revenuerdquo water use water pollution and the overuse of water resources as well as significant climatic stresses which are bound to increase Policies aimed at the supply side focus on water utilities and include the regulation and contracting of public and private service providers the reform and strengthening of water utility firms and the promotion of resource-efficient utilities Policies that target water users include effective tariff reforms and price signals as well as awareness campaigns for households and industry
7 A digital tool for easy access to specific policies and case studies accompanies this report and is available at wwwebrdgreencitiescom8 For guidance on how to identify and map a cityrsquos environmental challenges through an evidence-based and holistic process readers may explore the methodology for a Green City Action Plan as outlined at wwwebrdgreencitiescom
Executive summary
11
Solid waste sector Inadequate management of municipal and industrial waste is common among these cities leading to contamination of land and groundwater as well as failure to support a lsquocircular economyrsquo model Policies in this area focus on how cities can ensure more effective governance and buy-in as well as on targeted initiatives to increase recycling and recovery rates Here the policy instruments include improved planning accountability structures price signals and funding combined with information strategies for residents and businesses and the formalisation of informal waste-collection services
Governance The legacy of poor local governance and low administrative and financial capacity across cities in these regions is detrimental to the implementation of the green urban policies mentioned above Policies that can be implemented to improve governance among local governments include political and fiscal decentralisation improved transparency and accountability enhanced integration and coordination across government bodies strong stakeholder consultation processes and the building of awareness and engagement among a diversity of interest groups ndash some of which may face disproportionate barriers to economic opportunities
Finance Financial constraints are widespread within cities in the EBRD regions This is often due to declining populations or a lack of creditworthiness and limited access to financing which can hinder the delivery of public services Policies to improve the financial health and autonomy of cities include initiatives to upgrade their financial planning and management boost revenue collection and enhance accountability and transparency all of which can help to enhance a cityrsquos creditworthiness and financial autonomy
4 Other key messagesUrbanisation patterns differ significantly across the EBRD regions The EBRD operates in 38 economies across three continents (see Table 1 for details) Across the EBRD regions which include economies as far east as Mongolia and as far west as Morocco population patterns and urban trends differ significantly Economies in the southern and eastern Mediterranean region Central Asia and Turkey generally have young and growing populations paired
with increasing levels of urbanisation In contrast the countries in central eastern and south-eastern Europe tend to have ageing stagnating or shrinking populations with the majority of cities experiencing a decline in population
The EBRD regions also share a legacy of minimal decentralisation and immature private-sector participation The centralised top-down structure in many economies has led to inadequate local accountability procedures and hence poor governance It has also limited capacity and expertise among local authorities and inhibited trust in local administrations and buy-in and engagement among the populace Among the former socialist economies in the EBRD regions there is also a legacy of poor price signals and a limited role for commercial solutions leading to continued resource inefficiencies and an immature involvement of the private sector As a result poor operational and environmental performance and a lack of people-centric urban development remains widespread in many of these regions
Decentralisation is important and should be facilitated by local capacity-building Cities that want to pursue an ambitious green agenda should be empowered to take initiatives and make their own decisions Cities must also be able to incorporate feedback from local community representatives and city authorities should be held accountable by the local population That said central governments tend to be reluctant to transfer decision-making and financial powers to regional and municipal authorities in particular where local capacity is weak Cities should help to encourage and prepare for the decentralisation process by strengthening their procedures capacity and expertise
Effective private-sector solutions require mature city administrations Deeper private-sector involvement can offer innovative solutions relevant expertise and better contractual arrangements However many local authorities in the EBRD regions have limited capacity and experience with effective private sector contracting Such administrative capacity and experience takes time to acquire Therefore in the absence of robust administrative experience a gradual build-up of capacity is recommended
Despite their differences many cities face similar environmental challenges and policy needs All cities are unique in their economic social and
Executive summary
12
political composition and urban policies must be tailored to each case Nevertheless cities often face similar environmental challenges and the relevant policy solutions often entail significant similarities This report appreciates these similarities while recognising the main differences between the typologies of cities in different regions
The most successful cities plan a mix of policies and investments Standalone policies and investments often fail to fully benefit from the synergies of optimal coordination and sequencing of interrelated policies investments and the involvement of residents While this may sound obvious developing a shared vision and a coordinated effort can be difficult in a city where departments work in lsquosilosrsquo
Inclusive urban development has numerous critical benefits The co-development of urban solutions may be difficult where there is a weak culture of active involvement by residents Nevertheless (i) many cities have been able to cut costs and improve quality by proactively involving their residents and their varied interest groups ndash despite the upfront costs linked to such initiatives This involvement should include marginalised groups and women in particular Moreover (ii) inclusive urban development is better at
addressing inequality issues experienced by women and marginalised groups and (iii) a broad supporter base for a specific green or inclusive urban agenda makes it more sustainable as it is harder for new or existing political or administrative authorities to divert from the initial plan
There are many impactful policy options that have moderate implications for a city budget However many of these options which may include active regulation and pricing of the behaviour of commercial users and residents can be politically costly and may thus be better introduced as part of a policy mix Other policy options may not be financially costly but may involve comprehensive private-sector participation and therefore require institutional capacity-building
Long-term shared visions are necessary to ensure effective and sustainable urban development While the policy options presented in this report have a short to medium-term timeframe a clear long-term political vision which may seek to pursue gradual change over time is required as a foundation for sustainable urban development
13
14
Introduction
01
15
The European Bank for Reconstruction and Development (the EBRD or the Bank) has developed a new strategic approach to addressing urban environmental challenges in the economies where it invests the EBRD Green Cities Framework With a volume of euro15 billion it is one of the Bankrsquos largest investment programmes and a flagship product EBRD Green Cities seeks to help cities identify and prioritise environmental challenges and address them through targeted investments services and policy instruments in a strategic and holistic manner The programme was initiated at the end of 2016 and now covers more than 40 cities in the EBRD regions
As part of the EBRD Green Cities approach cities develop a Green City Action Plan (GCAP) ndash a process initiated by a technical diagnostic study followed by the development and approval of priority investments and policies The process for preparing a GCAP
is defined in further detail in the Green Cities Programme Methodology9 The purpose of a GCAP is to apply a systematic evidence-based approach to prioritising green city projects and to identifying the right enabling framework of policy regulation and incentives The initial technical diagnostic is based on a set of indicators to be measured and scored against international standards and benchmarks These 70 indicators cover (i) the quality of the cityrsquos environment including air quality pollution levels in water sources or the quality and stock of other natural resources (ii) the sources of the pollution or other adverse impacts on the environment and (iii) the response indicators ndash the current municipal activities institutional arrangements and policy initiatives that set out to improve or protect the environment in the city Following the technical identification of the cityrsquos environmental shortcomings the relevant stakeholders are consulted and priority investments
Introduction
9 See OECD and ICLEI (2016)
Figure 1 Overview of the Green City Action Plan process and the role of this report
Source EBRD
1 2 3 4
Initiate Green City Action Plan
Commit to trigger investment project
Prepare and organise Implement and monitor
Conduct technical diagnostics
Set investment and policy priorities with stakeholders
Identify and prioritise
Set vision and goals and derive investments and policies
Plan actions
Report Menu of green urban policies
Energy Electrification Parking
Pro-cycling measures Pedestrianisation
Road user charges Car-sharing
Water
Finance Waste Transport
Land use Governance
P
Policy areas Policy options
Conduct investments Implement policy measures
Introduction
and policies are identified and developed to address these challenges
In order to support the recommendations that emerge from the development of a GCAP and to further strengthen policy discussions in cities participating in the Green Cities programme the EBRD has developed a knowledge product in the form of this report It presents policy options and practical case studies that can be effective in mitigating reducing and addressing the environmental challenges that cities face
Menu of policy options and case studies
The policy options in this report (see Figure 2) are structured around seven areas ndash five sector-specific areas (transport water solid waste land use and energy) and two cross-sectoral or lsquoenablingrsquo areas (governance and finance) Within each policy area the main five to ten policy options are presented in terms of their resource implications benefits and risks and necessary conditions as well as key implementation challenges and critical success criteria In line with the market-oriented mandate of the EBRD the policy descriptions also include ways to unlock or integrate private sector participation The policy options (or policy instruments) are further backed and illustrated by relevant practical case studies10
Selection of policy options and case studies Combining top-down and bottom-up approaches
The policy options and case studies presented in this report were selected through the combination of a bottom-up and a top-down approach The top-down approach relates to extensive desk research and literature reviews The structuring of the policy options and case studies derives from the seven policy areas for each of which the report outlines the most relevant environmental challenges and targets
The bottom-up approach is based on the development of a long list of potential case studies and the policies they represent All of the potential case studies were assessed in terms of the kind of policies and cities they covered and through a comprehensive evaluation based on criteria such as impact effectiveness political acceptability transparency or replicability
To evaluate the relevance of potential policies necessary metadata about each policy and case study were collected To enable future users to understand and use them effectively a number of policy characteristics were drawn up from academic literature and international organisations for example from the OECD11 Similarly for the case studies a list of policy evaluation criteria such as effectiveness and administrative viability was developed to assess the
10 A guided and user-friendly path to the relevant content of this knowledge product is also available through a digital tool at ebrdgreencitiescom11 See OECD (ndb)
Figure 2 Structure of the policy areas policy options and case studies
Source EBRD
Energy CopenhagenElectrification Parking
Pro-cycling measures Pedestrianisation
Road user charges Car-sharing
Water Strasbourg
Finance FreiburgWaste LjubljanaTransport
Land Use LundGovernance Burgas
P
Policy areas Policy options Case studies
16
Introduction
17
policy delivery policy outcomes and impacts such that cities can take these examples and apply the policies that have been used most effectively12
This suite of policy options should also relate to the range of characteristics of cities where the EBRD Green Cities programme is being implemented The assessment of city characteristics provides an insight into whether a city has the right conditions to ensure the success of a specific policy To some extent the current GCAP methodology already carries out such an approach through the political framework reports which include a preliminary review of policy finance and governance to develop a project-prioritisation matrix
Objectives and limitations of this report
The objective of this report is to help guide and stimulate the policy discussions taking place in cities ndash in the EBRD regions and beyond ndash that are aiming to accelerate their green agenda The report aims to promote a shared understanding of the possibilities and likely implications of various policy initiatives and provide practical advice on their delivery in combination with relevant investment programmes The intention is to create a practical and concise reference point for a wide range of urban stakeholders and interested parties While this knowledge product does not seek to provide detailed instructions on how to plan and implement specific policies it aims to offer useful guidance on what to expect and to consider supported by practical case studies and lessons learned
The reportrsquos content is oriented towards cities in the EBRD regions taking part in the Green Cities programme As a consequence the menu of policy options and case studies is limited in the following ways
bull The policy options presented here are primarily relevant to cities and do not cover high-level strategic policies or visionary plans that are more suitable for central governments Instead the focus is on tactical and operational policy options that fall within municipal control and influence
bull This report emphasises effective policy options rather than green investments to address environmental challenges It covers options that can be pursued and implemented within a five-year period in a process that is primarily city-driven The policy options lead to material impact in the medium term in other words five to ten years For example a parking policy that may influence the urban transport sector within a few years would be included as a policy option rather than a strategic pursuit of a compact urban design that would take decades to achieve material results
bull This report does not provide support on how to identify environmental shortcomings in a given city Rather it assumes that the environmental shortcomings have been identified prior to using this knowledge product For guidance on how to identify and map a cityrsquos environmental challenges through an evidence-based and holistic process the reader may explore the GCAP methodology outlined at wwwebrdgreencitiescom
Overall relevant public policies should be understood here as meaning most non-investment activities that target the greening of cities and that municipal authorities can implement or influence and expect to generate impact within three to eight years Among other activities these include planning and monitoring regulation incentives funding and financing skills development and capacity-building as well as awareness-raising attitude campaigns and information programmes This report also presents new technical solutions but with an emphasis on policies that enable such new solutions to be applied
12 Note that quantitative ex-post evaluations of individual policies are rarely possible The causal linking of a policy with an outcome is prevented by the scale and timescale of impact and the presence in a real city of innumerable confounding factors The exceptions to this occur when a policy of major significance is implemented (for example the London congestion charge) Nevertheless policy impact can be judged through a combination of quantitative data anecdotal information research across multiple locations and information from those whom a policy has targeted This caution should be reflected in the language used to document a policy evaluation
18
19
Urban development trends and regional context
21 Transformation in cities
22 Beyond green cities other relevant city concepts
02
20
21 Transformation in cities
Demographic trends in the EBRD regionsPatterns of population growth and composition differ significantly across the EBRD regions which include economies as far east as Mongolia and as far west as Morocco (see Table 1 for details) Economies in the southern and eastern Mediterranean region and
Central Asia have young and growing populations while in central eastern and south-eastern Europe populations are declining
As documented in the EBRDrsquos Transition Report 2018-19 Central Asia the southern and eastern Mediterranean and Turkey currently find themselves in the early stages of their demographic transition ndash with large increasingly young populations
Urban developmenttrends and regional context
Policy considerations must recognise the priorities and needs of different types of cities which can vary considerably in their size geography and history
Region Economies
Central Asia Kazakhstan Kyrgyz Republic Mongolia Tajikistan Turkmenistan Uzbekistan
Central Europe and the Baltic states
Croatia Estonia Hungary Latvia Lithuania Poland Slovak Republic Slovenia
Eastern Europe and the Caucasus
Armenia Azerbaijan Belarus Georgia Moldova Ukraine
South-eastern Europe Albania Bosnia and Herzegovina Bulgaria Cyprus Greece Kosovo Montenegro North Macedonia Romania Serbia
Southern and eastern Mediterranean
Egypt Jordan Lebanon Morocco Tunisia West Bank and Gaza
Other Russia Turkey
Table 1 Economies where the EBRD invests
Source EBRD
Urban development trends and regional context
21
In contrast the demographic transformation in central eastern and south-eastern Europe is much more advanced compared to the emerging markets in Asia Latin America and parts of the Middle East and Africa Populations in emerging Europe are growing more slowly or even shrinking and ageing at approximately the same rate as the populations of advanced European economies due to a combination of modest birth rates and continued improvements in life expectancy often exacerbated by the emigration of young people to other EU countries For instance from 1992-2015 the population of eastern Europe shrank by 18 million (around 6 per cent) with the trend accelerating as a number of countries joined the European Union which gave workers the ability to travel freely to other nations within the bloc13 In contrast southern European countries have observed an increase in emigration despite high unemployment rates persisting after the 2008 global financial crisis with net migration up to +013 per cent14 It is worth noting that this trend of emigration from eastern European countries has slowed in recent years These countries have experienced the highest levels of
return migration in Europe leading to a stabilisation of net migration at -023 per cent of population per year as economic conditions have strengthened
Urbanisation trends in the EBRD regions
There is a global trend of increasing urbanisation with 55 per cent of the worldrsquos population today living in urban areas and this proportion expected to increase to 68 per cent by 205015 Over the past 25 years the EBRD regions have experienced on average a steady process of urbanisation with more than 60 per cent of the population living in urban areas today16 However within the EBRD regions there are significant variations from country to country ranging from 27 per cent of the population living in urban areas in Tajikistan to over 90 per cent in Jordan (see Figure 2)
Source World Development Indicators urban population (percentage of total population) (httpsdataworldbankorgindicatorspurbtotlinzs) and EBRD staff calculations as presented in the report Creating Liveable Cities Regional Perspectives)17
100
90
80
70
60
50
40
30
20
10
0
Tajik
ista
n
Kyr
gyz
Rep
ublic
Mol
dova
Egyp
t
Bos
nia
and
Her
zego
vina
Uzb
ekis
tan
Turk
men
ista
n
Slov
ak R
epub
lic
Rom
ania
Slov
enia
Azer
baija
n
Serb
ia
Croa
tia
Kaz
akhs
tan
Nor
th M
aced
onia
Geo
rgia
Alba
nia
Pola
nd
Mor
occo
Arm
enia
Mon
tene
gro
Cypr
us
Lith
uani
a
Latv
ia
Mon
golia
Tuni
sia
Esto
nia
Ukr
aine
Hun
gary
Rus
sia
Turk
ey
Bul
garia
Wes
t Ban
k an
d G
aza
Bel
arus
Gre
ece
Leba
non
Jord
an
Figure 2 Share of urban population to total population 2017 (per cent)
13 See The Economist (2017) 14 See Batsaikhan et al (2018) 15 See UN (2018a) 16 Urban areas are often defined as settlements with populations of more than 5000 inhabitants although national statistical definitions vary Other criteria may include population density type of economic activity physical characteristics level of infrastructure or a combination of these and other criteria See Deuskar (2015) 17 See AfDB et al (2019)
Urban development trends and regional context
22
Within the EBRD regions there are also significant differences in the levels of urban population growth The growth pattern of urban populations (urbanisation) follows the demographic trends in which the growing population in Central Asia the southern and eastern Mediterranean region and Turkey is closely linked to a rapid increase in the urban population while the stagnating or even declining population in emerging Europe is matched by a slower process of urbanisation Figure 3 shows how urban population growth is very slow or even negative in
central Europe the Baltic states south-eastern and eastern Europe and the Caucasus in stark contrast with the patterns observed in most other emerging economies ndash including those in Central Asia the southern and eastern Mediterranean and Turkey which have seen rapidly growing urban populations High rates of population growth and urbanisation are particularly strong in Tunis Cairo parts of Morocco the Nile valley and delta and much of Jordan Lebanon and the West Bank and Gaza
The story of secondary cities in the EBRD region
Beyond the general demographic and urban trends in the EBRD regions there is a noteworthy story about the role and decline of secondary cities in the former centrally planned economies Populations in the EBRD regions have so far been more concentrated in secondary cities than in large urban agglomerations as opposed to the pattern seen in many other emerging markets Within the former socialist economies in the EBRD regions only Moscowrsquos population exceeds 5 million which together with Istanbul and Cairo are the only cities with populations above 10 million in all of the EBRD regions
Historically secondary cities have played a relatively greater role in the formerly socialist economies which under central planning tended to have high rates of urbanisation relative to their level of development albeit with more dispersed settlement patterns in secondary cities Many of these secondary cities were developed around state-owned manufacturing hubs with little economic diversification and limited alternatives for the local labour force once the manufacturing plants were closed down or relocated as part of the transformation to market-based and more service-oriented economies As a result over 80 per cent of cities in some economies of eastern and south-eastern Europe have been
4
3
2
1
0
-1
-2
Lith
uani
a
Croa
tia
Latv
ia
Bul
garia
Rom
ania
Serb
ia
Ukr
aine
Hun
gary
Bos
nia
and
Her
zego
vina
Gre
ece
Alba
nia
Mol
dova
Geo
rgia
Esto
nia
Pola
nd
Mon
tene
gro
Bel
arus
Slov
enia
Nor
th M
aced
onia
Rus
sia
Slov
ak R
epub
lic
Arm
enia
Kos
ovo
Cypr
us
Azer
baija
n
Tuni
sia
Leba
non
Mor
occo
Kaz
akhs
tan
Turk
ey
Mon
golia
Turk
men
ista
n
Uzb
ekis
tan
Egyp
t
Kyr
gyz
Rep
ublic
Tajik
ista
n
Jord
an
Wes
t Ban
k an
d G
aza
Population growth Urban population growth
Source World Development Indicators urban population growth (httpsdataworldbankorgindicatorSPURBGROW) and population growth (httpsdataworldbankorgindicatorSPPOPGROW) and EBRD staff calculations as presented in the report Creating Liveable Cities Regional Perspectives18
Figure 3 Population and urban population growth 2017 (per cent)
18 Ibid
Urban development trends and regional context
23
Figure 4 Percentage of cities with falling populations 2000-12
shrinking (see Figure 4) The economic and social consequences of this shift in the urban landscape have been severe While the growing urban centres benefit from increased productivity and an inflow of capital and skilled labour the declining secondary cities often experience fiscal constraints due to falling tax revenues imbalanced and deteriorating infrastructure assets and housing values and a poorly skilled labour force due to selective out-migration All of this potentially limits the fiscal and administrative capacity of the declining cities to address current and upcoming environmental challenges
Policy considerations should recognise the priorities and needs of different categories of cities ndash small large growing or declining For instance a rapidly growing megacity like Cairo would need significant upgrades of infrastructure services and clear policies to manage an otherwise unregulated urban sprawl associated with poor mobility economic exclusion low environmental standards and poor public health Policymakers in growing cities may also more generally consider the environmental benefits and resource efficiencies of a more compact urban design However in shrinking or declining cities policies should focus on mitigating the negative effects of declining population and capacity including by helping
to diversify the economy coordinate investments and transfer capacity-building and skills across public private and academic agencies
Urbanisation economic growth and inequality
The shifting landscape of urban centres has created and continues to create lsquowinnersrsquo and lsquolosersrsquo across different cities The more productive and dynamic urban centres tend to attract investment capital and skilled labour and as a result they represent the majority of the innovation and higher economic growth compared to the rest of their respective countries In general gross domestic product (GDP) per capita is significantly higher in large cities than elsewhere in a country and in the EBRD regions such differentials tend to be on a par with or higher than those observed in advanced economies (Figure 5)
There is also an increasing division between lsquowinnersrsquo and lsquolosersrsquo within the growing cities as inequality ndash as measured through the Gini coefficient ndash is particularly pronounced in fast-growing cites20 Policymakers should recognise these patterns and pursue policies that help reallocate wealth and promote equaleconomic opportunities for all both to help the declining cities and regions left behind and to ensure that growing urban centres are as inclusive as they can be
Wealth and consumption patterns
In terms of consumption patterns and environmental impact it is not just absolute population growth that drives consumption emissions and congestion problems in growing cities Rather the interrelationships between wealth and population growth are highly relevant as growing population centres increasingly tend to house wealthier people Wealthy people consume more and generate more waste For example across the EBRD regions many citizens are craving to spend newly acquired wealth on buying a car and this is reflected in the urban road congestion in the EBRD economies Road congestion and high pollution levels from traffic are observed in many of the larger cities in the EBRD regions due to a combination of increased car ownership poor vehicle standards and the absence of pollution control and monitoring21 According to the TomTom road congestion
19 Ibid20 See UN-Habitat (2013)21 Poland and Estonia are the countries in the EU with the highest population of cars older than 20 years making up 337 per cent and 276 per cent of their car fleets respectively See Eurostat (2020)
100
90
80
70
60
50
40
30
20
10
0
Tajik
ista
n
Uzb
ekis
tan
Kaz
akhs
tan
Geo
rgia
Kyr
gyz
Rep
ublic
Pola
nd
Turk
ey
Bel
arus
Serb
ia
Rus
sia
Mol
dova
Ukr
aine
Alba
nia
Rom
ania
Bul
garia
Source World Bank City Database and EBRD staff calculations as presented in the report Creating Liveable Cities Regional Perspectives19
Urban development trends and regional context
24
index for 2019 16 out of the 18 most congested cities in Europe were located in the EBRD regions23 This represents a key challenge for policymakers who must seek a good balance between regulation price signals and viable transport alternatives to reduce the need for and attractiveness of private cars
Decentralisation governance and regulation in the EBRD regions
The ability of cities to find solutions to economic stagnation environmental challenges climate change risks and inequality is highly dependent on the efficiency and effectiveness of their governance structures For instance the Urban Governance Survey (developed by LSE Cities UN-Habitat and United Cities and Local Governments (UCLG)) which interviewed local city government representatives on urban governance showed that 36 per cent of respondents believed that inflexible bureaucracy and rigid rules were a major factor in reducing the abilities of cities to implement their policies24
Many countries and cities in the EBRD regions have a legacy of poor local governance The former centrally planned economies do not have a good track
record of promoting local capacity and procedures for self-governance or accountability mechanisms and influence through local civil societies Poor local governance was often exacerbated by inadequately planned and implemented decentralisation processes that followed the collapse of central planning within the EBRD regions
Empowered local governments have been shown to have a positive impact on the provision of public services and on quality of life25 The major benefits of decentralised decisions include (i) a more targeted or tailored supply of public services and infrastructure as a response to local demand which should lead to (ii) a more cost-efficient use of public expenditures and may lead to (iii) an increase in cost-recovery funding from residents who are more willing to pay for adequate services Decentralisation can also (iv) promote accountability and reduce corruption due to a greater proximity to a population that may be more aware of local governmentsrsquo actions than they are of the actions of central government
However if executed poorly decentralisation may result in inefficiencies and corruption and further disillusionment with local government Therefore
Note Data for Albania Croatia France Ireland Italy Latvia Lithuania the Netherlands Norway and North Macedonia are for 2016Source Eurostat GDP per inhabitant for capital city metropolitan regions (httpseceuropaeueurostatstatistics-explainedindexphpUrban_Europe_E28094_statistics_on_cities_towns_and_suburbs_E28094_the_dominance_of_capital_cities) and EBRD staff calculations as presented in the report Creating Liveable Cities Regional Perspectives22
Figure 5 GDP per capita in the largest cityrsquos metropolitan region 2017 (national average = 100)
300
280
260
240
220
200
180
160
140
120
100
80
Fran
ce
Slov
ak R
epub
lic
Rom
ania
Pola
nd
Czec
h R
epub
lic
Hun
gary
Net
herla
nds
Uni
ted
Kin
gdom
Croa
tia
Serb
ia
Turk
ey
Bel
gium
Latv
ia
Nor
way
Lith
uani
a
Nor
th M
aced
onia
Esto
nia
Slov
enia
Den
mar
k
Irela
nd
Swed
en
Alba
nia
Gre
ece
Spai
n
Port
ugal
Finl
and
Italy
Aust
ria
Bul
garia
Ger
man
y
22 Ibid23 See TomTom (nd)24 See LSE Cities UN-Habitat United Cities and Local Governments (2016) 25 See Bilbao (2015)
Urban development trends and regional context
25
for the abovementioned benefits to materialise it is important that (a) decisions (and not only operational obligations) are transferred to local authorities (b) local authorities have sufficient financial and institutional capacity and procedures in place and (c) the decentralisation promotes engagement and enables residents to hold institutions to account for delivering policies in a transparent manner
Unfortunately the decentralisation processes in many of the economies where the EBRD invests are still incomplete with the capacity resources procedures and political autonomy of local authorities remaining inadequate The process of developing a strong culture and presence of civil society has also proven to be a long and challenging journey in many cities This too has hampered the way local communities are able to influence urban development and hold its local decision-makers accountable
Conclusion
Urban development and regulation has been reoriented in many parts of the world over the past few decades from an earlier focus on production and productivity with less emphasis on environmental and human wellbeing to a stage where the environment and its residents increasingly take priority While this reorientation first started among the more advanced OECD economies in the 1970s and 1980s the centrally planned economies in the EBRD regions began the process later These economies also had a more rigid approach to management based on a top-down command structure As a consequence many municipalities in the EBRD regions have less experience with rich and complex policy programmes that combine comprehensive stakeholder dialogue processes and the involvement of local community members in urban development Such programmes encompass effective price signals economic incentives strict transparency principles and information- and trust-building efforts between residents and local authorities
Taking these observations into account makes it clear that the regions require a combination of green and inclusive urban development To achieve this a rich and comprehensive policy mix is needed in many places
where the interdependence of different policies and the synergies between investment programmes and policy initiatives would need to be carefully considered and debated This report aims to contribute to the debate
22 Beyond green cities other relevant conceptsFigure 6 captures some of the many terms and concepts being used to refer to programmes and objectives of modern progressive cities While this report focuses on green urban policies ndash targeting environmental and climatic challenges ndash it touches on these other concepts where relevant
Smart cities are those that prioritise the development of digital infrastructure connectivity to facilitate the growth and curation of human capital The increase in the innovative capacity of smart cities enables them to maintain their industrial competitiveness26
But interconnected digital solutions are not just for the powerhouse cities of the Global North Santiagorsquos Chilecon Valley for example is being heralded as a prime example of an open smart district in South America27 Its growth of digital start-ups can be attributed in part to the countryrsquos pro-immigrant policy designed to welcome innovators from the United States of America The capital also boasts the most advanced public transit system in South America and is making plans to accommodate rapid growth in the use of electric vehicles charged by the smart grid28
This demonstrates the role that smart cities can also play in driving a green agenda For instance data can be used to effectively manage the roll-out of electric vehicles and optimise vehicle-to-grid energy balancing which can reduce energy consumption as it mitigates against the lsquopeak-troughrsquo energy-demand profile of cities
However these ambitions for technological revolution have not been well received in all cities with some communities seeing the approach as pandering to outside interests rather than addressing local concerns29 For example international firms that are
26 See Trujillo and Parilla (2016) 27 See The Economist (2012) 28 See Marshall (2016)29 See Wattenbarger (2018)
Urban development trends and regional context
26
vocal about the transition to smart cities include the likes of IBM and Siemens The smart city concept is applied and supported by initiatives such as the Smart Cities Prosperity Fund Programme and the EUrsquos Digital Cities Challenge and many cities are seeking to pursue a smart urban development agenda
Circular cities are a relatively new phenomenon based on well-established schools of thought around functional service economies and natural capital These are cities that seek to harmonise economic development with environmental conservation Some of the key sectors that are thought to benefit most from this approach include waste and textiles and transport and food production The principles of a circular economy can be integrated into planning policy for example compact city development as demonstrated by Curitiba a city in Brazil which implemented this development strategy 30 years ago The strategy entailed mixed-use development and densification along five bus rapid transit (BRT)
corridors This has been reported to help improve land-use issues increase public transport use and reduce congestion30
Strengthening the resilience of a city is a priority for many governments and their citizens and circular and smart cities can help in this endeavour A resilient city is one that is able to strengthen its response recovery and adaptive capacity not just to physical but also to social and economic shocks and stresses These may include high unemployment endemic violence or floods One such global organisation supporting cities to develop resilience strategies is 100 Resilient Cities which works to enable cities to structure their approach and pathway to a more resilient future It has outlined seven key qualities that characterise a resilient city reflective resourceful robust redundant flexible inclusive and integrated31
30 See EMF (2019)31 See 100 Resilient Cities (nd)
Source Arup Group
Figure 6 Other concepts used for city programmes and objectives
Circularcities
Smartcities
Concepts
Resilientcities
Healthycities
Inclusivecities
Urban development trends and regional context
27
Specific actions that cities are taking to become more resilient include the development of green corridors as promoted in Atlanta which has dedicated 400 acres of green space along the BeltLine Westside Trail This master plan has sought to address the racial inequity in access to green space in the area while also seeking to minimise health issues caused by frequent flooding with sewage-contaminated water32 33
Inclusiveness is a key element of resilient cities as documented by Jan Gehl in his book Cities for People It is also a focus of work for organisations such as the World Bank and the Asian Development Bank
The concept of healthy cities focuses on promoting health via the political agenda through institutional change capacity-building and innovation Creating healthier urban settings supports the health and wellbeing of the people that use them The WHO European Healthy Cities Network is a group of European cities that has been working towards this agenda for the past 30 years and forms part of a wider network of 1400 municipalities34 When health is used as a lens through which to examine city sectors it can generate other sustainable urban improvements for example shifts towards active mobility that can not only reduce the risk of respiratory disease but also decrease emissions of air pollutants reduce congestion and injuries and free up green space35
Inclusive cities are those that can provide services infrastructure and access for all residents regardless of gender sexual orientation race age or ability36 The international community has widely acknowledged the importance of creating inclusive cities to improve peoplersquos lives with Sustainable Development Goal 11 calling for ldquoinclusive safe resilient and sustainablerdquo cities37 While urbanisation creates the conditions to facilitate opportunities for a better life for residents for example through access to larger and more diverse economic markets the expansion of cities can also increase inequality and exclusion especially of the poor and vulnerable38 Developing inclusive cities
is an ongoing and dynamic challenge that requires city governments businesses and residents to work together Inclusion encompasses various complex factors such as economic inclusion social inclusion and spatial inclusion39 Recognising that each of these closely related dimensions need to be addressed will enable cities to break cycles of marginalisation exclusion and inequality
32 See Kahn (2017) 33 See 100 Resilient Cities (2018)34 See WHO (nd)35 See WHO and UN Environment (2017) 36 See Misra (2016) 37 See UN (2020) 38 See Asian Development Bank (2011) 39 See World Bank (nd)
ldquoInclusive cities are those that can provide services infrastructure and access for all residents regardless of gender sexual orientation race age or abilityrdquo
28
29
Sector-based policy options
31 Mobility and transport
32 Land planning green space and biodiversity
33 Energy and buildings
34 Water and wastewater
35 Solid waste
03
30
This section discusses the sector-based policy options available to cities to support sustainable urban development and green city investments It is divided into the sectors of mobility and transport land use energy and buildings water and wastewater and solid waste
31 Mobility and transportTransport accounts for a quarter of global carbon dioxide emissions and is responsible for harmful air pollutants that negatively impact the health of city residents From an environmental perspective the main policy objective with regard to the transport sector today is to cap or reduce the use of private cars and increase the share of public and active mobility (such as cycling or walking) Policy objectives may further seek to promote cleaner public and private vehicles ndash ideally with zero emissions Together with land planning related policies may also seek to reduce the need for motorised mobility or transport
Policy measures in the transport sector can be divided roughly into (i) demand-side measures aimed at influencing travel decisions and (ii) supply-side measures seeking to provide a credible alternative to private cars Among the demand-side measures are policies aimed at making cars ndash in particular those that release the most CO2 and nitrogen monoxide ndash less attractive (for example parking policies or road-user charges but also attitude campaigns and the pedestrianisation of selected streets) Among the supply-side measures are policies and initiatives aimed at providing well-planned sustainable and
attractive public transport services as well as policies that seek to increase the modal share of active mobility options
Both demand-side and supply-side measures have been inadequate throughout the EBRD regions partly due to (i) low administrative capacity in cities (ii) weak enforcement and (iii) a low revenue base These shortcomings must be addressed as part of an effective policy mix aimed at tackling the main environmental challenges linked to the urban transport sector
A selection of such urban transport and mobility policies includes the following
Car-restrictive policies
1 Parking policies ndash including pricing restrictions information and enforcement
2 Road-user charges ndash including congestion charges and low emission zones
3 Pedestrian-oriented and car-restrictive policies
4 Car-sharing car-pooling and ride-sharing
Promotion of public and active mobility
5 Planning and regulation of public transport services
6 Pro-cycling policies
Promotion of cleaner vehicles
7 Electrification of urban transport
Sector-based policy options
Cities can choose from a wide range of policy options to address urban environmental challenges ndash some options are sector-specific while others cover multiple sectors
Sector-based policy options
31
T1 Parking policiesSummary
The primary environmental objective of parking policies is to make parking and the use of private cars less attractive in order to promote a shift towards public and active mobility Restrictive parking policies cover several types of intervention including the pricing of parking and the limitation or relocation of available parking spaces An active use of parking regulation can be an effective deterrent to the use of private cars with a limited or even a positive impact on the city budget Parking policies can also help promote the use of electric or low-emission cars and effective use of parking facilities may be supported by appropriate information systems Furthermore real-estate developers can be obliged to provide off-street parking solutions when needed However parking policies only succeed in cities with credible enforcement capacity and good public transport services as a viable alternative to private cars
Description
Effective parking regulation requires consistent urban coverage pricing and enforcement One such approach is the introduction of parking zones where each zone often labelled with different colour codes represents different price levels ndash from highly priced and often time-limited parking in the centre to cheaper and less restricted parking in zones further from the centre More sophisticated parking schemes may include parking fees linked to the vehicle emission levels at the time of car registration or dedicated parking and charging facilities for electric cars
Workplace levies may also be considered as part of a cityrsquos parking policies This measure imposes taxes on companies for each parking space they provide to employees and may also have a significant positive effect on the cityrsquos revenue For example in Nottingham in the United Kingdom money raised from the workplace levy has helped fund extensions to the existing tram system and the redevelopment of Nottinghamrsquos railway station
Restrictive parking policies may include the reduction or relocation of available parking spaces which can be coordinated with other transport solutions
For example the removal of on-street parking spaces frees up space that can be repurposed for other needs such as dedicated bus lanes widened pavements or cycle lanes Hamburg implemented this approach in 1976 and Zuumlrich in 199640 Parking solutions may also be tailored to public transport schemes through parking (lsquopark-and-ridersquo) facilities located next to key transit stations
Resource implications and key requirements
Introducing regulated parking fees for the first time involves some coordination with land planning and traffic planning It requires adequate marking of dedicated parking spaces and related signposts It also requires a reliable and user-friendly payment solution of the kind that are increasingly based on payments through mobile phones rather than the more traditional pay-and-display solutions Operating the system also requires good control and enforcement mechanisms Lastly significant legislative changes might be needed in order to regulate private car-parking facilities
Introducing additional parking fees or time limits on existing parking spaces may require little investment or additional control and enforcement costs for the city The removal of parking spaces is not financially costly either However the removal of on-street parking may be combined with other arrangements such as the construction and operation of off-street parking garages or park-and-ride facilities which may require significant resources and coordination among city designers and planners in relation to other policy areas
Potential private-sector participation
The private sector can play an effective role in setting up and operating parking payment and control schemes Here cities can consider both availability payments (for a system that works) and performance payments (for revenues collected) For example private contractors can help improve parking control and revenue collection through a well-defined and well-managed parking service contract At the same time the private sector can play a constructive role in the financing construction and operation of off-street parking garages and lsquopark and ridersquo facilities
40 See Push-Pull Parking (2015)
Sector-based policy options
32
In addition real-estate developers can be obliged to provide off-street parking solutions as part of their development permits
Implementation obstacles and solutions
A radical change to parking fees or parking availability requires a new mindset and acceptance from the public It also needs adequate control procedures and enforcement capacity Therefore recommendations may include the gradual introduction (both in terms of coverage and price levels) of parking fees This enables a gradual change in peoplersquos attitudes and a gradual building of the necessary operational and enforcement capacity Furthermore both the pricing and the relocation of parking facilities can play a constructive role in a policy mix together with other lsquoshiftrsquo measures As car owners see parking fees as a burden such interventions are more readily accepted when they appear together with improved public transport services as a viable alternative to private cars
Time-limited parking facilities prevent specific user groups such as workers or selected residents from using those facilities The removal of on-street parking may further upset many potential beneficiaries of such facilities ndash including business communities workers
and selected residents and like parking fees policies that limit parking may face less opposition when combined with improved public transport services or other measures as part of a policy mix
Parking restrictions that support the general demand for public transport services while also providing carefully planned relocation of parking facilities close to key transit stations (park-and-ride facilities) can have a particularly strong impact on the shift from cars to public urban transport Removal of parking spaces also provides a great opportunity to reallocate scarce urban space to dedicated bus lanes bicycle lanes or even trees and green spaces
Comparison with other policy options
When comparing an active use of parking pricing to road-user charging (see policy option T2) it is worth noting that many of the benefits can be quite similar Parking policies are often quicker and less complicated to implement and represent lower investment costs compared to the introduction of a new congestion charging solution Removal of parking facilities may provide good opportunities to reallocate scarce urban space to public and active mobility
Sector-based policy options
33
Secondary measures and effects parking information and guidance
Modern parking facilities equipped with sensors can collect real-time information about parking availability This information can be communicated to drivers through information boards and mobile apps It enables drivers to plan and find available parking more easily reducing search time and traffic and thus minimising congestion and pollution while also helping to enhance the quality of the urban area
Introducing this parking information which in a smart city can be combined with pricing traffic and congestion data in order to propose an optimal parking solution improves the driver experience rather than promoting a shift away from private cars It can however be viewed as a mitigation of objections by drivers to the relocation of existing on-street parking facilities Furthermore these systems can also be economically viable As an example within five years the gradual introduction of a Parking Guidance and Information System in Southampton United Kingdom proved to have an economic rate of return of 91 per cent where the cost-benefit calculation took into account the cost of installation and maintenance and the benefits associated with the reduced times spent searching and queuing for parking spaces Broader
benefits included reductions in distance travelled time spent parking vehicle operating costs and fuel consumption41
Unintended consequences
Parking policies to deter private cars in urban areas have sometimes accelerated the development of large shopping centres on the outskirts of cities Such developments should be handled with care as rather than addressing an urban traffic problem the parking policies may end up relocating the problem to another part of the city where public and active transport modal shares are even harder to increase
T2 Road-user charges
Description
Road-user charging is a transport-demand policy instrument The primary environmental objective of introducing road-user charges is to discourage the use of certain classes of vehicles fuel sources or more polluting vehicles
As an instrument road pricing can be tailored to specific areas times vehicles emission standards and fuel types It has the potential to generate substantial revenue but has high investment and collection costs for example in the form of physical road-tolling stations or through an automated charging system that relies on complex information technology (IT) infrastructure and a good vehicle database for effective enforcement procedures Road charging schemes have often met strong opposition and many plans have been delayed or cancelled due to disapproval from residents
Urban road-user charging can be arranged in different ways including through toll booths or through electronic vehicle-recognition infrastructure placed on all entry points to a targeted area of a city Charging typically requires comprehensive upfront investment and collection costs are substantial Road-user charges can be tailored to specific areas of a city and to certain times of the day (for example more expensive at peak times) andor vehicle types (for example fees for heavy goods vehicles) They can
41 EUROSCOPE (TR1023) (1999)
Sector-based policy options
34
also be tailored to vehicle emission levels at the time of vehicle registration and are sometimes used to promote low or ultra-low emission zones
In terms of relevant case studies Singaporersquos Electronic Road Pricing scheme was one of the first and most complex The scheme was launched in 1998 and covers selected expressways arterial roads and three restricted zones The toll is applied to all vehicles and varies by time of day and direction of travel
The London Congestion Charge was introduced in 2003 and works with a flat daily charge for driving a vehicle within the charging zone The charge helped reduce traffic in Londonrsquos city centre by 39 per cent between 2002 and 2014 In 2019 the city launched its Ultra-Low Emission Zone which includes more stringent emissions standards
Stockholmrsquos congestion charge was introduced in 2006 and is designed as a barrier scheme in which a payment is required for each entry through the barrier and is dependent on the time of day A study of congestion pricing in Stockholm between 2006 and 2010 found that in the absence of congestion pricing Stockholmrsquos ldquoair would have been five to ten percent more polluted between 2006 and 2010 and young children would have suffered 45 percent more asthma attacksrdquo42
Resource implications and key requirements
While there is no clear-cut way of narrowing down the resources needed to introduce a road-pricing measure it is generally a costly solution that requires strong administrative capacity It may require complex IT infrastructure a good vehicle database for enforcement and significant changes to legal and organisational frameworks For example in 2015 Transport for Londonrsquos collection cost was pound85 million representing one-third of total fee collection ndash with a congestion charge of pound1150 per day
In cities where no dependable licence plate database exists and there is no legislation enabling congestion charging this step might be the greatest bottleneck in the entire process The relationship between the national legislative framework and regional or city
legislative structures is also important in that cities or regional areas may be able to enact their own laws or they may have to rely on national laws being applied in their geographical areas
Implementation obstacles and solutions
Despite evidence of impact the public has repeatedly rejected proposed road-user charges For example in Manchester and New York in 2008 and Copenhagen in 2012 tolling schemes were rejected by public referendums Public acceptability requires an incremental introduction of fee levels It also requires consultation and feedback from the public in designing the policy and robust awareness campaigns with evidence of improvement in terms of traffic congestion public transport and road networks43 Furthermore the vision of the policy should be part of an overall traffic plan including improvements in public transport funded by the road pricing revenue In London and Oslo resistance to congestion and toll charges was partly overcome by transparently linking these fees with public investment
Comprehensive congestion charging remains suitable for large cities with a congestion problem in their city centres but is rarely a recommended solution for small to medium-sized cities due to the administrative and financial burden For small to medium-sized cities parking measures are much more effective but may need to be combined with charges for goods vehicles
Comparison with other policy options
Effective use of restrictive parking policies has many of the same benefits as road-user charges However parking policies are often significantly easier to implement and can be introduced in a more gradual fashion
T3 Pedestrian-friendly policies
Description
Pedestrianising roads or city centres can be seen as a demand-side measure aimed at regulating and influencing travel decisions When combined with
42 See Rogers (2017)43 See Collier et al (2019)
Sector-based policy options
35
good solutions for public and active mobility it can be an effective policy to reduce traffic and improve local air quality In addition car-free roads can promote more vibrant and enjoyable urban spaces A large number of European towns and cities have made parts of their centres car-free since the early 1960s This approach is often accompanied by car parking facilities on the edge of the pedestrianised zone and is sometimes combined with park-and-ride schemes or cycle lanes to facilitate public and active transport to the pedestrianised centre Most pedestrianised zones allow delivery trucks at certain times of the day
Pedestrian-oriented policies can be more or less restrictive or ambitious in terms of the area the time and the vehicle classifications that are subject to restricted access It can involve complete pedestrianisation of a large area or it can be modest in its coverage or accept motorised vehicles at certain times There is also the opportunity to exempt certain vehicles from the ban for example public transport vehicles or the vehicles of selected residents business owners or disabled people The promotion of car-free days is another approach often aimed at raising awareness as much as regulating travel decisions
Resource implications and key requirements
Restricting car traffic for a given road has initially low financial and administrative implications However implementation costs and consequences with regard to shifts in traffic flow patterns will need to be considered Promoting active mobility may also require additional investment such as better street lighting
Implementation obstacles and solutions
The main resistance to car restrictions tends to come from local shopkeepers and to some extent from local residents and other businesses For instance policymakers should be aware that the pedestrianisation of city centres can cause surrounding property prices to increase significantly And while in almost all cases retail businesses also benefit this can lead to an inexorable rise in commercial rents too This means that pedestrianised retail centres risk becoming further homogenised
with only the most high-end independent shops able to operate The challenge for policymakers therefore is to implement pedestrianisation while minimising the negative effects of the gentrification that is likely to accompany it To this end the success factors of pedestrianisation schemes include a gradual approach coupled with public consultations This allows businesses to adapt to and influence the policy Transparency regular community engagement monitoring and evaluation are crucial to measuring the success of the scheme
The city centre of Nuremberg Germany has been gradually pedestrianised since the 1970s to address the decline in air quality When heavily congested roads were closed to cars traffic volumes fell by up to 25 per cent in the historic city centre while on nearby roads it increased between 4 and 19 per cent Over the following 10 years the area was transformed into an attractive pedestrian precinct buildings were renovated street furniture upgraded and art works introduced Public support for the pedestrianisation scheme has proved to be strong Proposals to reopen the centre to car traffic following a change in political leadership of the city in 1996 were not realised due to public objection44
T4 Planning and regulation of public transport services
Description
The degree of planning and regulation of urban transport services can vary from a liberal approach to a more structured and coordinated approach A liberal approach based on largely unregulated private bus and minibus services requires less administrative and financial capacity within the municipality and is flexible and responsive to most transport demand in cities
However a liberal approach tends to face coordination problems An effective pursuit of environmentally friendly and inclusive mobility requires adequate regulation of transport services on the back of a plan for sustainable urban mobility
44 See European Commission (nd)
Sector-based policy options
36
Effective transport services require professionalism predictability and accountability Improved performance of incumbent operators can be promoted by transforming municipal transport operators into separate legal and commercial entities or joint stock companies (JSCs) This helps to depoliticise the management of these operators To further professionalise the relationship between the company management and the city it is recommended to set up public service contracts (PSCs) between the municipality and the JSC ndash defining rights obligations and processes ndash to ensure predictability and accountability for all Improved transport services can also be promoted through well-regulated and well-procured private service contracts
The benefits of a well-planned and regulated transport sector include better resource efficiency through synergies between transport modes including private cars bicycles and various public transport services Better regulation and coordination can further facilitate integrated multi-journey ticketing covering journeys that include a variety of transport modes It also enables the introduction of an electronic ticketing solution electronic vehicle monitoring and transport management which allows for real-time information systems All this improves user experience and increases the popularity of public transport services
Resource implications and key requirements
Setting up a strong integrated urban transport regulator takes time It requires adequate capacity to
plan contract procure and monitor services Effective contracting and transparent funding of regulated services also require shifting the control of cash flow from the operators to the transport authority
Of the different solutions it is worth noting that electronic transport management includes operation of the necessary IT infrastructure and control room In Moscow which has a population of 123 million the creation of an intelligent transport system had an overall budget of US$ 17 billion from 2012-2045 Electronic ticketing and real-time information systems may also require significant investment in ticket machines validators information boards and IT infrastructure
Potential private-sector participation
Increased administrative planning and coordination does not imply a crowding-out of private operators Regulated bus services can be effectively procured contracted to private operators and monitored by a dedicated authority The introduction operation and maintenance of electronic ticketing systems electronic vehicle monitoring or real-time information services can also be effectively financed implemented and operated by private contractors For example the city of Belgrade contracted out the supply financing and operation of an electronic vehicle (bus) monitoring and ticketing solution including ticket sales and ticket control in return for 83 per cent of the ticket revenues collected For the city the outcome was a more than 10 per cent revenue increase in the first year of operation implying a net rise in municipal revenue better vehicle monitoring under the PSCs and lower costs of ticket sales without any material capital expenditure46
Implementation obstacles and solutions
Effective regulation of the urban transport sector may upset public and private operators alike One challenge is the formalisation of unregulated minibus services for which moderate adjustments to licencing requirements may be a first step Effective regulation may involve the unbundling of a transport authority that has in the past provided services and regulated the sector It may also involve account separation
45 See Innovative Governance of Large Urban Systems (2017) 46 See Tica et al (2012)
ldquoEffective transport services require professionalism predictability and accountability The performance of incumbent operators can be improved by transforming municipal transport operators into separate legal and commercial entities or joint stock companiesrdquo
Sector-based policy options
37
and further unbundling of different transport modes or operators to ensure transparency and well-defined service contracts for each mode and operator A gradual approach may be needed here as both managers and related unions may oppose such moves towards transparency and future competition for related transport markets
Effective contracting and the transparent funding of regulated services require shifting the control of cash flow from the operators to the transport authority This implies a change of mindset and may have to be introduced gradually through one transport mode at a time on the back of a well-defined and well-funded public service contract for the relevant operators
T5 Electrification of urban transport
Description
Electric vehicles have zero tailpipe emissions and where renewable electricity generation is on the rise can be effective in reducing greenhouse gas emissions Policies promoting the electrification of the transport sector include the introduction of battery-powered electric buses and the promotion of trams and trolleybuses ndash with or without in-motion charging solutions This also includes policies promoting individual electric vehicles including private cars and light commercial vehicles Key policies promoting private electric vehicles include the use of road-user charges in favour of electric vehicles (see policy option T2) parking policies in favour of electric vehicles (see policy option T1) access to bus lanes for electric vehicles and the roll-out of convenient charging infrastructure
Resource implications and key requirements
A shift to electric buses brings about fundamental changes to the operating model ndash and the economics These changes include significant upfront investment in charging and maintenance facilities and higher costs for the purchase of rolling stock They also include important negotiations with the energy sector to ensure sufficient capacity on the local grid and optimal electricity prices for overnight or day-time charging Personnel will also be affected
and many staff will require retraining and redeployment Drivers will need to adapt to new driving techniques and protocols for recharging and battery management while the maintenance of buses and charging infrastructure will change to the extent that these may be outsourced as part of supply-operate-maintain contracts
Overall lower fuel and maintenance costs are associated with electric buses compared to diesel buses but as the relevant market segments are less settled the pricing of these activities is subject to some uncertainties A less radical approach is the expansion of tram or trolleybus networks as this represents less of a change compared to the existing model in operation Here one increasingly relevant hybrid solution involves trolleybuses with battery capacity and in-motion charging using existing or new trolley wires for battery charging This approach which is mostly relevant for cities with an existing trolleybus service enables the buses to operate temporarily outside the network of overhead wires with moderate battery capacity installed
Policies aimed at the electrification of private vehicles may include revision to a current road-user charge to parking regulation or the access of electric cars to bus lanes which may not have huge resource implications The installation of charging stations at selected parking places however represents a significant investment cost In concrete terms in 2015 the cost of single-port non-residential electric-vehicle supply equipment (EVSE) unit ranged from US$ 300-1500 for Level 1 US$ 400-6500 for Level 2 and US$ 10000-40000 for direct current (DC fast charging while the installation costs varied greatly from site to site with a ballpark cost range of US$ 0-3000 for Level 1 US$ 600-12700 for Level 2 and US$ 4000-51000 for DC fast charging47 In light of this local initiatives aimed at promoting private electric vehicles will only work well when combined with national policies that support the use of electric and low-emission cars
47 See Smith and Castellano (2015)
Sector-based policy options
38
Implementation obstacles and solutions
Electrification of bus services requires considerable investments in fleets maintenance and charging infrastructure and thus significant capital expenditure The cost of electric buses can be double the price of their diesel equivalents and charging stations are also expensive ndash they cost about US$ 50000 for a standard depot-based version used for overnight charging48 Nevertheless several cities have introduced electrification of bus services on a small scale on the back of a clear green vision for the relevant city and with some financial support from national or international entities It has also been suggested that electric buses have lower operating costs in the long term and are easier to maintain For example in the case of Stockholm evidence suggests that lower fuel costs for electric buses can balance the high investment costs incurred in building charging infrastructure while achieving in the bus fleet a reduction of up to 51 per cent in emissions and up to 34 per cent in energy use49 In addition to financial barriers the current state of technology can be an issue For instance during early tests in Belo Horizonte in Brazil electric buses had trouble getting over steep hills with full passenger loads50
T6 Pro-cycling policies
Description
Cycling generates no emissions or noise requires less road and parking space compared to cars and is a more economical and healthier form of mobility compared to motorised transport51 Policies to encourage cycling include pro-cycling infrastructure pro-cycling regulation and pro-cycling subsidies A modal shift to cycling can be further promoted by awareness and attitude campaigns
Pro-cycling infrastructure includes the introduction of segregated cycle lanes and the introduction of convenient and theft-preventing parking facilities as well as bike-sharing facilities Pro-cycling regulation can be seen as an effort to modify road use and traffic patterns in favour of cycling for example introducing two-way cycling in one-way streets or introducing advanced-stop boxes in front of cars at traffic lights Such regulation can also include work towards a reduction or calming of traffic
Pro-cycling subsidies may fall primarily within the sphere of national policies However municipal fiscal measures may include local tax benefits to install cycle-friendly infrastructure such as bicycle parking at work Local governments can also demonstrate their support for cycling through cycle-friendly public procurement procedures which may include purchasing electric bicycles or electric cargo bikes instead of light commercial vehicles for services such as postal deliveries
Resource implications and key requirements
The design and construction of segregated cycle lanes may be costly but moderate alterations to existing road infrastructure such as painted lanes on the side of roads are more affordable for a city budget A different issue arises from the potential need to reallocate scarce urban road space to safe cycling infrastructure by removing on-street car parking facilities or by introducing one-way streets From 2010-14 the city of Copenhagen allocated euro80 million to the implementation of its bicycle strategy The cycling infrastructure in Copenhagen is extensive and includes
48 See Financial Times (2019) 49 See Xylia et al (2017) 50 See Marshal (2019) 51 See CIVITAS (2009)
Sector-based policy options
39
a network of segregated bike paths bicycle traffic lights separated coloured bike paths where cars and bikes share road space and bicycle parking
Pro-cycling policies can be administratively demanding due to the need to create a cycling code and implement new regulations for non-road infrastructure provision such as bicycle parking Policy measures that involve re-regulation of traffic patterns can also be technically demanding and may necessitate new capacities within the local administration Bike sharing is not cheap but with good sponsorship arrangements it can represent a minimal burden for the city budget
Potential private-sector participation
The private sector is involved through the provision and sponsorship of bike-sharing schemes and companies may be further involved in providing bicycle parking facilities and cycling incentives as part of their human resources policies or remuneration policies Non-governmental organisations (NGOs) can also play an important role in rolling out information about cycling initiatives such as bike-sharing schemes
Implementation obstacles and solutions
Reallocation of scarce urban road space away from cars and buses will naturally meet resistance and compromises will have to be made As in many policy options a gradual introduction of pilot cases combined with clear communication and ideas for the city-wide and global benefits of a shift towards active mobility must make up a core part of a pro-cycling strategy This can include supporting cycling organisations working with stakeholders and developing marketing and education programmes ndash in which NGOs can also play a role
In many cities bicycle theft is a growing problem and should be addressed through supportive measures An important aspect of reducing bicycle theft is to involve multiple actors Municipalities should make safe parking spaces available and launch campaigns to inform bicycle owners about locks as well as introduce registration systems for bicycles or more advanced systems such as chips
T7 Car-sharing car-pooling and ride-sharing
Description
Reducing the number of car trips is a way to alleviate traffic with the aim of reducing pollution and greenhouse gas (GHG) emissions freeing up space for pedestrians and cyclists reducing journey times and increasing productivity Trip reduction may be promoted through several measures including (i) car-sharing which is the practice of renting a car from a prominent service provider and having ownership of the car for a limited time (ii) car-pooling in which a group of people travel together using their private vehicles especially for commuting taking the trips in turn and (iii) ride-sharing a car service in which a person uses a smartphone app to book a ride in a privately owned vehicle52 Some cities promote car-sharing services in the form of self-service cars in a similar form to cycle-sharing schemes (for example Share Now)
Car-sharing is not a predominantly public-centred policy but public authority bodies can facilitate or provide incentives for car-sharing programmes and it can be seen as a phasing policy before the introduction of full congestion charging or pedestrianisation
Resource implications and key requirements
Car-sharing can have a low administrative and technical burden and although it could have an associated financial burden if incentives are offered to individuals or companies to operate there are significant savings to be obtained through reducing the number of cars on the road Congestion is estimated to cost the EU economy euro100 billion annually with a US study indicating that if car-sharing schemes were widely adopted vehicle numbers could be reduced by one-third in specific scenarios53
Potential private-sector participation
To develop and implement a successful car-sharing programme local authorities must work with a wide mix of stakeholders including regional transport authorities regulatory bodies businesses and
52 See Barber (2016) 53 See Transport and Environment (2017)
Sector-based policy options
40
multiple local government bodies Local authorities may have to invest or require businesses to invest in online platforms to facilitate easy connection between users and vehicles Self-service schemes are normally administrated by the private sector
Implementation obstacles and solutions
The first barriers to car-sharing are the reluctance of potential users to adopt car-sharing services and a strong desire for car ownership and use In order to overcome these barriers it is important to generate awareness and change aspirations from single car ownership to the use of connected transport modes through robust awareness campaigns and user behaviours
There is a risk that car-sharing may have a limited impact on reducing car use in a city and further infrastructure for cars may have to be provided that is specific to self-service sharing schemes Moreover the effect of ride-hailing apps on congestion is contested They could reduce traffic by encouraging people to leave their cars at home or they could increase the number of vehicles on the road if people switch away from public transport or forms of active mobility
In the case of sharing schemes it is also important to provide procedures for checking driving licences and to have appropriate insurance procedures in place to ensure safety for women in particular
A further challenge relates to private vehicle restrictions that pose a threat to car-sharing Exemptions from such policies could be a solution to promote car-sharing
It is difficult to generate a large user base to reach a certain operational scale for self-service car-sharing schemes and it has been found that competition from taxis that are competitively priced can reduce the use of car-sharing services54 Paris is an example of a city with an electric scheme Autolib which closed in 2018 and offers some lessons to other cities The service had to compete with a minicab service suffered from
poor maintenance by users and the vehicles became places of shelter for drug users Due to decreasing use of the service the operating company went into debt
In order to be successful it is important that the operators of car-sharing schemes understand the context and regulation of the cities in which they plan to launch DriveNow an alternative car-sharing scheme has seen significantly more uptake with one million registered users across multiple cities55 However the firm has had to abandon business in Stockholm due to high congestion charging and parking costs56
Ride-sharing apps such as Uber have encountered resistance from the public due to their employment practices leading to bans on taxi and ridesharing apps in some countries and cities Solutions to this issue can include labour law reforms for self-employed workers and the enactment of regulation on installing mandatory meters Furthermore such apps require a strong and reliable mobile network with reasonable cost for data use Economies in the southern and eastern Mediterranean region have particularly weak data networks with Jordan Lebanon Morocco and Tunisia all in the lowest third of countries globally for overall data speeds57
Elsewhere the Los Angeles Metro is working alongside car-sharing company Getaround to provide an affordable and ldquohassle-freerdquo car-sharing service at more than 25 Metro transit park-and-ride lots58
Comparison with other policy options
Car-sharing does not yield the same benefits of transitioning to active or public transport but can still be successful in reducing congestion and air pollution and can lessen the risk of low public acceptability that can be associated with car-free zones or congestion charging Car-sharing is not intended to replace other traffic management policies but rather to complement them
54 See ITDP (2015) 55 See Holder (2018) 56 See Rolander (2018) 57 See Opensignal (2017) 58 See Metro (2019)
Sector-based policy options
41
32 Land planning green space and biodiversity Land planning should sit at the centre of any urban development programme From an environmental perspective land planning seeks to protect and promote green and liveable spaces promote resource efficiency and minimise any conflicts linked to the use of scarce urban space It also seeks to regulate the development and use of buildings and infrastructure Effective land planning is a necessity for the development of other infrastructure services in a city Therefore one should normally see close coordination between land planning and sector-specific developments ndash including infrastructure services linked to transport water energy and waste
Over the past decades urban design and planning have in many places shifted away from a car-enabling development that focused primarily on productivity to a more people-oriented development with greater emphasis on environmental aspects and the wellbeing of the population As a consequence there has also been a shift to a more community-based planning process in which active participation by residents increasingly influences the land-use priorities of a city
From an environmental and wellbeing perspective some key strategic principles for land use include the following
1 Development of compact cities
2 Promotion of mixed-use areas and transit-oriented development
3 Promotion of green spaces and biodiversity
4 Promotion of community-based land-use planning
These strategic principles or policy options are
described in further detail in Sections L1-L4
L1 Development of compact cities
Description
Compact cities have many environmental benefits when compared to sprawling areas of low density The benefits include a reduced dependence on cars (hence lowering emissions) a smaller energy consumption due to dense development better and more cost-efficient public transport services and increased overall accessibility through public and active mobility Resource efficiency is further promoted through the reuse of infrastructure and previously developed land on the back of regeneration of urban areas
Policies of urban compaction involve the promotion of urban regeneration the revitalisation of town
Sector-based policy options
42
centres restraint on development in rural areas and higher-density real-estate development The promotion of compact cities is further linked to mixed-use development and the concentration of urban development at public transport connection points (see policy option L2)
One way of promoting more compact urban development is to restrain development in rural or peripheral areas of the city Such development can be controlled through the approval process of planning applications and through effective control and enforcement of any illegal developments
Other ways of promoting compact urban development include support for urban regeneration and higher-density real-estate development Urban regeneration would normally involve private developers getting involved in brownfield redevelopment projects This would normally work best when there is a clear partnership between private developers and the municipal authorities and where the municipality among others commits to providing strategic visions adequate infrastructure and transport services Private developers tend to welcome higher-density real-estate development and building permits can include obligations to undertake additional investments linked to the decontamination of brownfield sites or to the construction of green or public spaces for the benefit of the wider area
Resource implications and key requirements
Building restrictions at the periphery of a city require effective control and enforcement of building permits In cities where illegal construction activities are widespread significant resources and effort must be put in place to regulate the informal sector However building restrictions offer revenue-generation opportunities for city authorities For example Toronto has secured over US$ 350 million through its density-bonusing policies and in-kind benefits seem likely to have doubled the total value of revenues59 Normally restraining urban sprawl would not require significant capital investments by a city On the contrary the containment of urban sprawl should lead to less demand for expanded infrastructure networks and related services
Urban regeneration and the construction of high-density real estate require massive investment programmes However such investments are primarily provided by private developers and city authorities may only be obliged to finance-related infrastructure upgrades Nevertheless the necessary municipal investments may not be trivial and should be carefully considered before embarking on a large-scale urban regeneration programme City authorities must also be ready to provide comprehensive planning documents and feasibility studies as well as carrying parts of the site preparation costs and development risks linked to issues such as requirements to decontaminate sites prior to their development
Potential private sector participation
While the city authority may sit in the driving seat in terms of restraining urban sprawl the private sector will normally be financing and ndash to a large extent ndash driving any urban regeneration efforts and real-estate development
Implementation obstacles and possible solutions
Controlling urban sprawl may meet substantial resistance from developers and local residents One way to help build a public consensus and clarify the regulation can be to build a greenbelt around the city This however may require the city to acquire land to relocate people and to manage the landscaping and maintenance of the greenbelt In Tirana Albaniarsquos capital the Donate a Tree initiative has surpassed its target and triggered donations by residents companies and international organisations60
59 See Institute on Municipal Finance and Governance (2013) 60 See Sustainable Cities Platform (nd)
Sector-based policy options
43
Urban regeneration projects require substantial buy-in from local residents and private developers who may have differing interests For example the city of Roubaix in France has followed a market-led approach to urban renewal while integrating the issues of social exclusion housing renewal and economic and cultural development into its regeneration policies61 Comprehensive stakeholder engagement is therefore crucial and to incentivise private-sector participation the municipal authorities must be able to provide strategic visions and comprehensive planning documents This provision needs to be combined with a clear commitment to providing the necessary transport solutions and perhaps risk-sharing arrangements linked to issues such as requirements to decontaminate sites prior to their development
L2 Promotion of mixed-use areas and transit-oriented development
Description
Mixed-use development where housing jobs commerce and leisure are in close proximity is considered to yield significant economic and social benefits compared to more traditional separately zoned cities in other words those in which residential areas sit adrift from commercial areas First mixed-use areas require less transport for their inhabitants who will travel shorter distances between private and public activities In addition the shorter transport distances within a mixed-use area may also help promote active mobility rather than motorised transport As a consequence significant time-saving and environmental benefits are expected to follow a shift towards mixed-use urban development ndash time saving that can be used for leisure or for productive work For example a doubling of job and living density has been shown to increase economic productivity by 2 to 4 per cent62 Economies that are less transport-dependent can also be more inclusive for individuals who otherwise would not be able to afford the transport cost required to access job markets education or other services
The environmental benefits can be further enhanced if mixed-use areas are developed in line with transit- oriented urban development which refers to centres of social and commercial activities that are located at public transport connection points Such a combination of mixed-use areas and transit-oriented development can accelerate the use of clean transport systems and further rebalance the use of the streets in favour of pedestrianisation and active mobility where cars are prevented from undermining communal life
Land-use zoning is a concept used to support transit-oriented and mixed-use development In this context zoning policies are those that designate an area to a certain use and are often supported by a regulatory framework to ensure that developers abide by the recommendations and future developments do not threaten the ambitions set out in the policy They are particularly successful where there are areas of vacant land for example brownfield areas like old industrial sites or other areas where the policy is not in direct contradiction to existing developments
Resource implications and key requirements
Shifting to mixed-use and transit-oriented urban development requires significant resources in terms of planning and regulation and it has to be pursued in close coordination with various city departments including the cityrsquos transport planners It takes many years and requires close cooperation with multiple stakeholders and a constructive partnership with private developers In Clerkenwell in London mixed-use areas have been developed as a consistent policy for more than 20 years after the concept of mixed-use development emerged in national planning policy guidance63
Potential private-sector participation
In general the associated real-estate development will be financed and constructed by private developers Good planning coordination and contracting with private developers and businesses is therefore important
61See URBED and the Joseph Rowntree Foundation (2006) 62 See Bloomberg Citylab (2012b) 63 See VivaCity2020 Cities Institute LondonMet (nd)
Sector-based policy options
44
Implementation obstacles and solutions
Like other forms of urban regeneration projects promoting mixed-use areas on the back of a transit-oriented development will require coordination among several city departments as well as the buy-in of local residents and private developers who may have differing interests Such multi-stakeholder complexity may prevent or delay the implementation of mixed-use strategies Comprehensive stakeholder engagement will be crucial and clear municipal commitments to strategic visions together with improved infrastructure and public transport services may be needed
L3 Promotion of green spaces
Description
A wide range of benefits are associated with the provision of accessible urban green spaces and waterways First access to green spaces and waterways has a positive impact on the mental wellbeing of the population Second green spaces have direct environmental benefits They can help improve air quality and even regulate the air temperature of a city Furthermore they can reduce flood risks as vegetated surfaces are well equipped to absorb and store water Lastly green spaces can help boost biodiversity In order to promote the benefits of green spaces policies and initiatives should aim (i) to promote more green space (ii) to improve the value of the green spaces and (iii) to facilitate better accessibility for all to green spaces infrastructure and waterways
It may be necessary to extend the amount of green space through a combination of protective measures for existing green spaces and a proactive conversion or restoration of urban space and building surfaces into new vegetated areas Protective regulation includes rules monitoring and enforcement to protect green spaces from being lost to new built structures For example in Stuttgart Germany green areas are protected by local urban zoning and planning regulations These are supported by a Climate Atlas created to guide the location of green spaces to facilitate cooling and airing of the city64 These protective measures would normally be carried out by municipal authorities although local communities and NGOs may undertake some of the monitoring functions
Transformation of urban brownfield areas and building surfaces into vegetated land will however require close cooperation with private developers and landlords Opportunities here include ways to integrate green or blue urban space development such as the obligation to develop pocket parks or to clean up waterways as part of brownfield redevelopment projects Other measures aimed at increasing the amount of green space include community-based initiatives to increase the development of pocket parks gardens and farming activities on available urban land For example urban agriculture policies in Amman Jordan have initiated the greening of more than 300 rooftops and of around 4000 school and home gardens65
An increase in the number of green urban spaces can also be achieved through the promotion of green roofs Green roofs (or walls) have many of the same environmental benefits as traditional parks and gardens including decreased surface-water run-off preventing flooding during heavy rainfall improved local air quality decreased local air temperature and the promotion of local biodiversity Green roofs can be introduced on public buildings They can also be introduced on private buildings through subsidies or through planning approvals for new construction or renovation In addition green roofs can be promoted through better information and awareness campaigns For example Toronto in Canada has introduced an ambitious green roof policy requiring
64 See European Environment Agency (2014) 65 See ICLEI (2014)
Sector-based policy options
45
buildings above a certain height to have a certain percentage of green roofs66
Beyond the amount of vegetated land the quality and the value of green infrastructure also matter Green spaces can increase their value through proper landscaping and maintenance Turning green spaces into multifunctional areas is another way of increasing their value which again can generate new revenue streams to fund landscaping and maintenance For example urban green spaces can be rented out for specific events and parks can be designed as flood barriers reducing flood risks or the need to spend resources on alternative flood-protection measures Examples of this are the jointly funded flood alleviation schemes on parks in London UK For example through joint funding from Southwark Council the Environment Agency and Thames Water schemes delivered surface-water flood protection for over 100 homes at risk and brought investment and improvements to several parks and sports grounds67
Improved accessibility is another way to ensure the benefits of green spaces in a city Therefore urban planning should always consider how new or amended network infrastructure and built environment can improve current or restored green or blue infrastructure
Resource implication and key requirements
It requires a significant number of resources to construct improve and maintain green spaces and urban waterways For example in Hamburg Germany the estimated costs for the installation of 300 square metres of green roofs is estimated at euro9500 compared to euro3000 for grey roofs68 Green roofs have higher maintenance costs but reduced rainwater fees and a longer roof lifetime led to similar overall costs over 40 years Therefore recognising the multifunctional potential and additional revenue streams for urban green spaces can help mobilise significant funds to the sector With an adequate mix of incentives regulation and information campaigns private developers and property owners can be encouraged to contribute to the greening of cities
Implementation obstacles and solutions
Acquiring resources may be the biggest obstacle to an effective urban green space policy Therefore professional management of green and blue assets is important with visions and skills to mobilise funding and contributions from private sector and voluntary organisations To address this issue a number of local authorities in the UK are considering transferring their management of green spaces from the public sector to private and charitable sectors69 It has been argued here that one single charitable body at armrsquos length from the government can present a more compelling case for support to corporate sponsors private donors and charitable trusts as well as attracting new volunteers In terms of the untapped opportunity to benefit from volunteering a UK survey found that nearly 70 per cent of young people wanted to volunteer to help create better green spaces in their community but only 7 per cent said they currently do70
L4 Promotion of participatory land-use planning
Description
Community-based land planning and participatory design for public urban spaces refer to a collaborative
66 See Bloomberg Citylab (2012a) 67 See Herne Hill (2015)68 See Climate ADAPT (2019)69 See National Lottery Heritage Fund (2014)70 See BBC News (2016)
ldquoBeyond the amount of vegetated land the quality and the value of green infrastructure also matter Green spaces can increase their value through proper landscaping and maintenance Turning green spaces into multifunctional areas is another way of increasing their valuerdquo
Sector-based policy options
46
approach to planning and design between urban planners government authorities businesses and the local community This approach goes beyond traditional stakeholder consultation and instead invites members of the local community to propose solutions and new ideas It may relate to a specific project but can also be used for the development and testing of a wider strategic plan Such approaches are becoming increasingly popular as authorities recognise the diverse natures of the communities they govern and that traditional fixed standards and design criteria do not take into account the varying needs of residents71
The use of participatory land planning and design is expected to ensure the improved liveability of city areas and it is likely to improve the public acceptability of development proposals by demonstrating transparency in the design approach ensuring greater inclusivity and community ownership of the final design72
Resource implications and key requirements
A number of frameworks for public co-design have been developed by academic and research institutions These can be replicated across cities with a variety of contexts and characteristics For example the Adaptive Governance Lab at the School of Architecture at University of Limerick has developed a lsquoDesigning with Communitiesrsquo framework which emerged after five years of practice73
The existence of already well-designed approaches can reduce the administrative burden on cities although participation in design of this nature requires multidisciplinary teams to facilitate the process74 Such teams must be appropriately trained in this type of engagement as the use of appropriate language in a specific context and with specific groups is key to successful communication with stakeholders Therefore local government authorities may require capacity-building or working alongside external experts In Barcelona such a community-based approach to urban planning and design is being pursued to promote ldquoSuperblocksrdquo whose overall
programme has a budget of US$ 124 million from 2014-19 This shows that it is not necessary to invest in large infrastructure solutions to improve the lives of city residents75
Implementation obstacles and solutions
Co-design of urban spaces can be a slower and more time-consuming process than other stakeholder engagement processes but if considered early on in the design approach it can be significantly rewarding
Delivering workshops or interactions with community members that facilitate co-design requires trained professionals who understand the complexities risks and potential conflicts arising through such intense involvement of local groups who may not have an in-depth knowledge of planning approaches Using the co-design of urban spaces as a tool for stakeholder engagement can also build up the expectations of stakeholders as to their influence or impact on the project which can be particularly challenging to manage for groups that have a high level of interest in the project Therefore at the beginning of any session or period of engagement it is important to lay out the expectations and potential outcomes to the groups being engaged This is where a pre-prepared engagement plan can assist in identifying the opportunities outcomes and risks ahead of time
33 Energy and buildingsIn the EBRD regions there is a legacy of buildings with poor energy efficiency and high electricity and heat consumption as well as widespread use of fossil fuels for electricity and heat generation For instance nearly half of the housing stock in central and eastern European countries was constructed between 1960 and 1990 During this time new housing construction was primarily pre-fabricated large-scale multi-family housing blocks built with little or no consideration of energy efficiency76 Furthermore the use of solid fuels
71 See Inclusive Design Research Centre (nd) 72 See David et al (2012) 73 See Webb et al (2018)74 See Aguilar (2015)75 See C40 Cities (2018) 76 See UN-Habitat (2017)
Sector-based policy options
47
for heating remains common in some cities in the EBRD regions and this has also been a major source of local air pollution
These environmental challenges are linked to several structural problems and shortcomings Partly these challenges are linked to the legacy of low electricity and heat prices and the lack of consumption-based billing all of which limit incentives to reduce heat consumption or to invest in energy-efficient buildings They are also partly linked to low administrative and financial capacity in the cities which hampers the ability to invest in regulate and promote energy efficiency measures or renewable energy generation at the city level The financial constraints are often further increased by a lack of creditworthiness and by limited access to financing for local public and private entities in the EBRD regions
There is an increasing awareness of and a growing effort to achieve an energy-efficient building stock and a decarbonised energy sector following both national and local commitments to the Sustainable Development Goals and the Paris Agreement Among the policy efforts to reduce GHGs and pollution from urban electricity and heating consumption are (i) ways to encourage investment in energy-efficient buildings (ii) ways to ensure more energy-conscious consumption patterns and (iii) ways to decarbonise the provision of heat and electricity Key policy options can be presented according to the following list
Policies to encourage energy-efficient buildings
1 Improved energy performance for public buildings
2 Improved energy codes and labelling for buildings
3 Policies and support for energy performance contracts
4 Financial incentives and access to capital for energy-efficient renovation
Policies to ensure more energy-conscious consumption
5 Pricing metering and billing of heat and electricity
Policies to decarbonise heat and electricity provision
6 Decarbonisation of district heating supply
7 Renewable electricity generation
E1 Improved energy performance for public buildings
Description
Increased energy efficiency of municipal buildings can have a direct and significant effect on the energy consumption and the related emissions and expenditures of a city It can also have an indirect impact through the demonstration effect and potential for raising awareness of energy efficiency benefits among the wider public
One way to encourage improved energy performance of municipal buildings is to require higher energy standards for new public buildings For example for countries subject to the EUrsquos Energy Efficiency Directive all new buildings occupied and owned by public authorities must now be ldquonearly zero-energy buildingsrdquo77 This EU Directive also sets mandatory requirements for municipal purchases and new rental agreements Public procurement of low-energy buildings however can only address some of the problems as long as the main energy efficiency challenges derive from the existing building stock In such cases improved energy performance should also be pursued through effective refurbishment of the municipal building stock
Setting up a municipal energy agency has proven to be a cost-effective way to identify and refurbish public buildings For example the Berlin Energy Agency
77 See European Commission (2020)
Sector-based policy options
48
a public-private partnership was founded in 1992 and has since launched energy efficiency retrofits in more than 1300 public buildings and 500 private properties78 The size of a municipal energy agency can be scaled from a one-officer position to a larger unit with extended expertise Similarly the role of an energy agency can be scaled from only assessing and ranking the public buildings with the greatest energy-saving potential to also cover extensive procurement and implementation support together with training and awareness-raising activities among decision-makers and occupants of public buildings
Resource implications and key requirements
Public procurement of low-energy buildings will typically imply higher investment costs and lower operating costs and can be economically justified in the long term For cities with a population larger than 50000 setting up an energy agency has proven to pay for itself through the energy and cost savings the agency helps to achieve However highly subsidised energy prices would not favour energy-efficient constructions or refurbishments and it is important that countries with large energy subsidies seek to reduce them
Implementation obstacles and solutions
Complacency among city officials and limited financial capacity may prevent an effective pursuit of energy-efficient public buildings Increased public disclosure of the energy performance of different city
departments combined with the inclusion of energy consumption in key performance indicators (KPIs) for various city managers may provide good incentives and raise awareness of the benefits of improved energy efficiency Private-sector involvement through PPP-style energy performance contracts (see policy option E3) has also proven to be an effective way to finance and implement energy efficiency measures This approach has for instance been deployed in Berlin under the Energy Saving Partnerships using energy performance contracting
E2 Improved energy building codes and labelling
Description
A building code sets out minimum requirements and standards for buildings and covers various aspects of health safety and welfare ndash including energy performance Relevant building energy codes typically consider lighting walls and roofs glazing heating ventilation and air conditioning Building energy codes can vary in their degree of ambition and for nearly zero-energy buildings one would typically incorporate sensors to automatically control lighting and water use as well as centralised energy control systems to monitor and dynamically minimise energy use79 Effective implementation of building codes requires adequate approval and verification procedures where the construction or major alteration of buildings must
78 See Berliner Energie Agentur (2006)79 See Coins Global (2015)
Sector-based policy options
49
conform to the code to obtain planning permission usually from a local council
Building energy codes are often supplemented with building certification labelling or information disclosure programmes An energy certification and labelling process helps to ensure that the energy performance of a building is above a certain threshold and communicated to customers in an effective way Certifications and labelling can be mandatory or voluntary Mandatory certification can be used to ensure compliance with building codes and enable better enforcement Energy certificates can further inform prospective owners and tenants about the performance of specific buildings and systems and may offer recommendations on how to improve energy performance Certification further raises awareness about energy efficiency and energy expenditures with the potential to gradually ensure that a more efficient building stock is being demanded and subsequently supplied Voluntary certification can be used if sellers or landlords want to distinguish themselves from their competitors This allows them to inform consumers and help prospective purchasers to anticipate energy costs and therefore increase the demand for energy-efficient buildings80
While building energy codes may be driven by national authorities local authorities have significant influence over implementation by means of the planning permission stage Local authorities can also help promote energy efficiency standards through local requirements for information-sharing and through mandatory energy labelling of private and public buildings Furthermore municipal authorities can also facilitate information-sharing platforms and standards for voluntary energy-labelling schemes
Resource implication and key requirements
As building energy codes become more sophisticated they require additional expertise and continued efforts to develop and apply them as part of building permitting Developing or revising a building energy code for local use may not require an excessive amount of resources National templates can also be developed for more easy application at the local level
However effective implementation and enforcement of a building energy code requires city officials or accredited professionals to sign off on plans and the finalisation of building works ndash and this requires significant resources The costs of verification and reporting can be passed on to private building sellers and buyers
Due to the substantial upfront costs it may be a solution to combine tighter building energy codes with financial incentives as well as certification and labelling to improve consumer awareness and support enforcement Tighter building codes may also be combined with expedited review of the permitting process and density or height bonuses if buildings meet particular sustainability criteria For example Mexico Cityrsquos Sustainable Buildings Certification Programme a voluntary programme reflecting various levels of sustainability performance offers a number of incentives including property tax reduction and attractive financial schemes to cover the cost of building upgrades as well as expedited processing of construction permitting81 And lastly in countries or cities with a flawed construction permit system and a large informal construction sector it is important to dedicate resources to effectively manage the construction sector
Potential private-sector participation
Building-code verification tasks can be carried out by accredited private professionals (who should lose their accreditation in cases of misconduct) They do however require careful consideration regarding which bodies can provide accreditation in order to avoid one or more business associations managing this process in a monopolistic and non-transparent manner
Local governments can work with commercial banks to provide financial incentives therefore shifting the financial burden from the public to the private sector One example is Frederikshavn in Denmark which developed specific soft loans for the energy renovation of housing to meet its climate change targets A new product was developed by the municipality in agreement with local banks featuring a longer maturity period and lower interest rates relative to typical market conditions
80 See Broekhoff et al (2018)81 See C40 Cities (2017)
Sector-based policy options
50
Implementation obstacles and solutions
A tightened building energy code represents increased investment costs for owners of existing and new property An extended information disclosure and labelling programme for existing buildings also requires more involvement and buy-in from property owners Under such scenarios it is natural that many stakeholders either oppose compliance or fail to contribute to the necessary arrangements It should also be noted that a large number of stakeholders will need to develop adequate understanding and capacity ndash including stakeholders such as real-estate developers architects engineers interior designers regulators inspectors subcontractors manufacturers of building materials and others
Given these challenges a gradual introduction of tighter building energy codes is recommended along with a gradual rollout of extended labelling and information disclosure programmes These should be combined with effective enforcement A gradual approach can be pursued through a step-by-step increase in the required standards and required activities ndash which should be announced years ahead of implementation A gradual approach can also be pursued by introducing higher energy-performance and reporting standards first as voluntary measures before making them mandatory Successful implementation of building energy efficiency codes can take many years to achieve
Denmark was one of the first countries to introduce nationwide energy efficiency standards for buildings The energy requirements in the Danish Building Regulations for new buildings have been tightened using a step-by-step approach preparing the Danish industry for future requirements almost 10 years in advance Moreover the new requirements are introduced as voluntary energy classes before they become mandatory
E3 Policies and support for energy performance contracting
Description
Energy performance contracting (EPC) is a form of packaged financing and capital works where financial savings from energy conservation measures are used to fund the cost of the measures82 EPC involves an energy service company (ESCO) that provides various services including finances and guaranteed energy savings The ESCO has a stake in energy savings for the client which leads to accountable energy and carbon savings The ESCO may be required to absorb some of the lost savings if savings do not materialise as expected which commercially incentivises ESCOs to complete optimal investments83
The attraction of EPC is that it enables end-users to secure energy-saving investments without drawing on capital or balance sheet payments The private ESCO companies provide the financing and so reduce the debt burden of the municipal authorities Eurostat confirmed that EPC investments are off balance sheet for public clients and provided a related guide for practitioners84 There are some examples of policymakers embracing this opportunity for public-sector energy efficiency investments having obtained Eurostatrsquos clarification for example in the Slovak Republic85 There is also evidence that specific investment costs are lower while energy savings are higher when applying EPC rather than regular public procurement of projects86
82 See World Energy Council and Arup (2016) 83 See Institute for Building Efficiency (2010b) 84 See Eurostat and EIB (2018) 85 See Ministry of Finance of the Slovak Republic (nd) 86 See Staničić (2018)
Sector-based policy options
51
The ESCO is the economic owner of the asset and bears most of the risks and rewards of the investment The ESCO is also responsible for the proper operation of the installed equipment and bears the maintenance and refurbishment risks87 It stays involved in the measurement and verification process for the energy savings during the repayment period ESCOs and energy performance contracting are mostly found in the public sector and to a lesser extent in the industrial and commercial building sectors
EPC policy instruments can include (i) the promotion of energy performance contracting through awareness-raising (ii) the removal of legal barriers to the use of innovative financial instruments (iii) the preparation of sample contracts and procedures (iv) the provision of expert support primarily to the public sector for preparing energy performance and supply projects contracts and evaluating the projects results and (v) the establishment of a qualified energy services provider scheme
Resource implications and key requirements
EPC requires sufficient technical capacity and often necessitates capacity-building due to the extent to which it differs from traditional public procurement processes Additional efforts will be needed in market sounding and preparation of EPC To enable EPC to take place it is important that the municipal budget law allows city authorities to sign medium-term to long-term service contracts Depending on the length of the EPC contract duration a stable reliable economic and political system and rule of law
are prerequisites For instance in Slovenia contract durations of up to 20 years are common
Potential private-sector participation
EPC involves the private sector directly through the creation of a market for ESCOs including a wide range of possible contractors such as engineering companies utility firms and equipment providers Furthermore ESCO structures are alongside PPPs one of the few financial structures that would allow the introduction of more private-sector finance into energy efficiency investments than the mere debt capacity of ESCO clients would allow thereby helping to bridge the existing finance gap88
Implementation obstacles and solutions
A lack of awareness in both the private and public sectors is often the first barrier to EPC This can be tackled through capacity-building A lack of resources to prepare related EPC tenders in the public sector is another barrier This can be improved through information provision and through providing technical support in procuring EPC projects
Prohibitive public budget and procurement regulations are another barrier For example in many European countries budgetary restrictions imposing lending limits on local governments leave capital-strapped administrations little room to pay for the upfront costs of performance contracting89 Regulatory reforms can be used to treat EPC investments as off-balance-sheet (no new public debt) and the aforementioned Eurostat clarification should give EU member states and accession candidates sufficient confidence Furthermore extending the contract duration is required too with deep building-retrofit projects in Slovenia for example having EPC contract durations of 20 years Public procurement regulation may also need to be reformed to include lifecycle cost analysis and functional tenders that use energy efficiency criteria as selection criteria in public procurement contracts and leave the technical solutions up to the contractor
Financing constraints are yet another barrier Credit markets remain constrained and lending institutions
87 See Šerić (2017)88 See European Commission (2018)89 See Institute for Building Efficiency (2010a)
Sector-based policy options
52
may be unwilling to offer energy performance contract financing despite provisions to guarantee ESCO performance Smaller ESCOs that are new on the market lack the creditworthiness required by banks As a response governments can provide guarantee schemes for energy efficiency loans provided to ESCOs An alternative solution is to create a project pipeline which investment banks such as the EBRD can then fund
However it is more than the availability of debt that prevents ESCO market development it is the limited borrowing capacity of ESCOs that limit the capacity to finance many deep-retrofit EPC projects with 20-year contract durations The solution to this is the sale of receivables of ESCOs to financiers that can understand price and accept the 20-year limited-recourse finance risk Supporting the development of such innovative financial (forfeiting) instruments through risk-sharing or other support mechanisms could be part of the policy mix backed by local authorities
The Czech Republic provides a good example of the development of a market for EPCs There facilitating has become an indispensable part of EPC projects in the public sector In addition competitive bidding has been developed into a standardised procedure which increases the quality of EPC projects for clients The European Code of Conduct for Energy Performance Contracting has been widely used and complies with the actual practice in the country
E4 Financial incentives and access to capital for energy-efficient renovation
Description
Central and local governments can provide financial incentives such as green mortgages and tax exemptions to developers or new building owners in order to encourage energy-efficient design and construction This can be used in parallel to certification and labelling
Financial incentives can be provided to encourage lsquoable to payrsquo households to retrofit their homes Some of the measures that governments can deploy include
supplier obligations grants and tax incentives Energy efficiency programmes can also be designed to leverage private capital for example through revolving loan funds or other financing structures in order to enable and incentivise green renovation of residential and commercial buildings
For instance Frederikshavn in Denmark developed specific soft loans for the energy renovation of housing to meet its climate change targets90 A new product was created by the municipality in agreement with local banks featuring a longer maturity period and lower interest rates relative to typical market conditions No funds are assigned to the financing schemes by the municipality Rather soft loans are provided by the partner banks that bear all the risk The partner banks run a creditworthiness check of homeowners decide who gets a loan and under which conditions In other cases public funds can be set up to provide favourable funding for energy renovation of private buildings through direct loans or through risk-sharing facilities for private banks
Resource implications and key requirements
Providing financial incentives will require budgetary commitments and may be administratively demanding for the local government Significant technical capacity will also be required to identify how incentives should be configured and applied Incentives can be targeted at lower income brackets of the population to address social equity concerns associated with energy poverty
Potential private-sector participation
Local governments can work with commercial banks to provide financial incentives thereby shifting the financial burden from the public to the private sector
Implementation challenges and possible solutions
The provision of direct financial support is financially demanding on local governments and can be targeted at fuel-poor homes It is good practice to undertake a comprehensive cost and benefit analysis of retrofitting to zero carbon for all households that are in fuel poverty and to provide targeted funding to
90 See Energy Cities (2016)
Sector-based policy options
53
these homes91 One of the first programmes to tackle energy poverty was the Warm Front programme in the United Kingdom 23 million households received assistance from the scheme Grants were on offer for improvements such as loft insulation cavity wall insulation and heating system improvements92
It is important to address market failures that prevent potentially cost-effective investments in buildings One such problem is the split incentives between owners and tenants where property owners may be reluctant to invest in energy efficiency if the main beneficiary is a non-contributing tenant The EURONET 5050 MAX project is an example of how this challenge can be successfully addressed for public buildings93
The success factors associated with energy efficiency measures include gaining and maintaining consumer trust an effective communication and marketing strategy training and qualification schemes to ensure that worker qualifications keep pace with the technical complexity of buildings and the targeting of trigger points such as household renovations or sales94 The provision of financial incentives and favourable financing should only come after energy efficiency building codes have been enacted and adequate enforcement and compliance mechanisms are in place for building construction and retrofits
E5 Pricing metering and billing of heat and electricity
Description
The EBRD regions have a legacy of subsidised electricity and heat tariffs along with normative billing rather than consumption-based billing Normative billing occurs when for example monthly heating bills are based on the size of an apartment rather than on the actual heating consumed However correct price signals are necessary to promote prudent energy consumption and to incentivise energy efficiency investments Today tariff reforms remain a key challenge in many of the economies where the EBRD invests
Good price signals depend on decent price-setting as well as good metering and billing mechanisms Price-setting should reflect all costs including environmental or climate-related costs In addition to an adequate price level it is also important that tariffs are set and adjusted in a predictable manner so that related investments can be undertaken without unnecessary risks of price volatility To ensure this the heat and electricity tariffs should be devised using a formula-based methodology and approved by an independent and capable regulator To this end the city authorities could help to set up or improve both the relevant methodology and the regulatory authorities While electricity tariffs often fall outside municipal control district heating (DH) and cooling tariffs are normally under the control or influence of local authorities
Effective metering billing and bill collection are also important to ensure correct price signals for electricity and heat consumption Electricity metering and billing can have different degrees of sophistication ndash from plain mechanical readers to digital meters with real-time information on consumption and expenditures combined with differentiated tariffs for day- and night-time consumption More sophisticated metering and tariff structures can help promote a more prudent and cost-efficient consumption pattern for example running washing machines at night when electricity tariffs and grid capacity are more favourable An even higher degree of lsquosmartnessrsquo includes metering and tariff arrangements that record reversed energy flow back to the grid This form of smart metering can help promote the installation of renewable energy solutions ndash such as solar panels on buildings as surplus energy production can then be sold back to the grid and further reduce the energy bill for the relevant buildings
District heating metering generally lags behind electricity metering in accuracy and sophistication and normative billing is widespread The technical challenges associated with DH metering are often largely due to old infrastructure that was not intended for individual metering However as new generations of heat allocators can be used as an alternative to heat meters the opportunity to achieve accurate
91 See National Assembly for Wales (2018)92 See UK Parliament (2013)93 See EURONET 5050 MAX (2020) 94 See Committee on Climate Change (2016)
Sector-based policy options
54
consumption-based billing of DH use is there This will have significant impacts on consumption patterns and incentives to invest in energy-efficient refurbishment of buildings
Utility sector pricing reforms are needed to accompany the installation of apartment-level metering technologies Kazakhstan is currently undergoing a smart heat-meter programme95 while a number of cities in Europe such as Tartu Estonia and Copenhagen Denmark have installed these systems
Resource implications and key requirements
There are significant investment costs linked to the installation and upgrading of meters For example fourth-generation apartment-level heat-cost allocators for metering with remote reading and control needed to introduce consumption-based heat billing cost around euro40 per allocator One allocator is needed for each radiator in an apartment96 The costs of a smart metering roll-out are largely borne by energy suppliers predominantly through funding the installation and purchase cost of meters (about euro110 per household) and through funding the national smart metering communications infrastructure Installation of meters in private properties also requires access to the properties Here cooperation with the property owners may require significant resources for the relevant implementation agencies Introducing smart meters that enable bidirectional energy flows would further require the development of a smart grid and necessary capacity within energy distribution companies that are able to implement such net metering arrangements To encourage the buy-in and cooperation of private companies and property owners some subsidy schemes may be needed which again represents additional resource requirements for the city or the authorities promoting this policy
A cost-benefit analysis by the UK government found that costs related to smart meters are expected to be around pound670 million per year whereas the benefits are calculated at pound19 billion per year on average Overall the UK government estimates that from
2028 the programme will be delivering net benefits of around pound12 billion per year97
Implementation obstacles and solutions
Increased electricity and heat tariffs often imply affordability constraints for low-income households It has been argued that this problem can be addressed most effectively through targeted support for the poor rather than by providing universal energy or heat subsidies to the population Installation of meters in private properties also requires access to the properties and necessary cooperation with the property owners To support this process a combination of information campaigns stakeholder consultation and price incentives to change metering arrangements has proven effective
E6 Decarbonisation of district heating supply
Description
District heating (DH) systems can reduce their carbon emissions through improving efficiency in the system or by switching to new fuel sources or new heat sources Efficiency in the DH system may be achieved by rescaling the size of the DH network as some DH systems are oversized or by upgrading old boilers and leaking heat pipes District heating systems can be further decarbonised by switching away from fossil fuels to renewable sources and by capturing new sources of surplus heat
Whenever DH systems are based on carbon-intensive fuel sources such as coal or heavy fuel oil the potential carbon reduction is significant For example in Bosnia and Herzegovina several district heating operators have replaced heavy fuel oil heat boilers with biomass boilers This has not only reduced carbon emissions it has also reduced fuel expenditure and helped generate local jobs by developing local markets for the supply of sustainably sourced biomass98
95 See EBRD (2017) 96 See EBRD (2018b) 97 See UK Department for Business Energy and Industrial Strategy (2019)98 See UN Environment Programme (2017)
Sector-based policy options
55
Actively capturing the heat surplus from other economic activities is another way to decarbonise the district heating sector Historically heating systems have often been fuelled by surplus heat or heat waste from industrial processes or from electricity generation However as some manufacturing industries close down and new technologies and new industries emerge new opportunities for potential heat sources may appear Some of these heat sources may need a lsquotop-uprsquo to bring the final temperature in line with a commercially required heat supply but such heat sources may include surplus heat from data centres shopping malls or wastewater treatment plants
Resource implications and requirements
All the abovementioned ways to decarbonise the DH supply require significant upfront investment However these measures are expected to considerably reduce operating costs and can therefore be economically justified in the long term For example the city of Banja Luka in Bosnia and Herzegovina has developed a feasibility study to improve its district heating system which has attracted interest from the EBRD in providing an investment package of euro15 million for new biomass boilers network upgrades and other efficiency measures These are expected to reconnect 80 per cent of disconnected users to the district heating network within four years and reduce fuel consumption by 27 per cent thus reducing emissions by 20000 tonnes of CO2 per year and leading to euro45 million in fuel savings99 100
Potential private-sector participation
Many of the proposed investments and solutions can be provided through PPP-style contracts or energy performance contracts Under these contracts private energy servicing companies (ESCOs) make the necessary investments which they also finance while being remunerated based on the energy efficiency achieved during a fixed operating period Energy performance contracts have been demonstrated to be an efficient way of addressing investment needs providing operational efficiency without adding an additional debt burden to municipal accounts (see policy option E3)
Implementation obstacles and possible solutions
High upfront investment costs and a potential reluctance of some decision-makers to change may hamper support for the proposed decarbonisation measures One possible solution is the use of private-sector contracting or energy performance contracting where the debt burden and performance risks are allocated to private contractors
E7 Promotion of renewable electricity generation
Description
Public and private actors can help increase the local production of renewable energy and thus help reduce the carbon footprint of a city The public sector can lead the way by seeking to install and apply renewable energy solutions wherever economically justified This can include (i) the introduction of solarphotovoltaic panels for existing and new public buildings or other built structures (ii) the use of solar panels to fuel public installations such as street lights or ticketing machines and (iii) an active use of biomass or biogas solutions for energy purposes For example this can include gas capture from solid waste or wastewater facilities The benefits of such installations are not only their reduction of energy consumption and the related carbon emissions and energy expenditure but also that they raise awareness and underpin other initiatives aimed at encouraging private actors to install renewable energy solutions
Another possible policy instrument to encourage private actors to install renewable energy solutions is the cityrsquos control over planning permits for new buildings and for large building alterations For example a city can insist on specific renewable energy components being included as a condition of obtaining building works permits Alternatively the city can as a minimum require that renewable energy alternatives are analysed when project proposals are being developed Another measure could be to include solar panel mandates for certain parts of the building stock For example Seoul has introduced solar mandates for
99 See CTCN (2015)100 See EBRD (2018a)
Sector-based policy options
56
new multiple-unit dwellings and commercial buildings to accelerate the deployment of solar panels101
While solar panels can be introduced for self-consumption purposes this can be further incentivised if it is combined with smart meters or net metering mechanisms This approach could include further incentives through favourable feed-in tariffs for the energy sold back to the grid by private households or private companies
Setting up a municipal energy agency has also proven to be a cost-effective way to promote renewable energy in a city For example the city of Barcelona has set up the Barcelona Energy Agency to meet its environmental and energy commitments The agency currently supplies 20000 users in public and private buildings with renewable energy102
Resource implications and key requirements
Even though the costs of solar technology have been falling rapidly financing often remains the biggest challenge to implementing a municipal solar plan Cities have a range of business model options to overcome this barrier distinguished by who owns the asset the city itself or a third-party investor103 Cities must weigh up these financing and ownership options taking into account upfront capital costs and expected payback over the lifetime of the installation National and local regulations including on whether third-party ownership is permissible at all will determine the type of possible financing structures Similarly there are significant investment costs linked to the installation and upgrading of meters (see policy option E5)
Implementation challenges and possible solutions
As outlined above significant investment costs are often the biggest barrier to cities embracing solar solutions To overcome these barriers cities can either pursue a direct or a third-party ownership strategy with regard to the solar assets In the direct ownership model the city purchases the solar system using its own funds grants from national or regional government or by borrowing money using
municipal bonds The benefits of such a model are that direct ownership allows the city to have full control over the benefits of solar However the city is dependent on the upfront capital being available or the financial legal and political ability to issue bonds In most cases the city also shoulders the full risk of constructing and operating the solar system Direct ownership can be a cityrsquos only option if the regulatory framework necessary to enable more elaborate business models is not in place
In the third-party ownership model the city government enters into a contractual agreement with a private developer who provides the upfront investment for the solar system These models can allow the city to install solar power with no upfront capital costs and no impact on their balance sheets Third-party ownership models are better suited to larger scale projects because the legal and due diligence costs for investors can be high The two core models of third-party ownership are power purchase agreements or lease arrangements104
Upgrading electricity meters also requires significant investment costs as well as widespread cooperation from private property owners who may be unwilling to cooperate Therefore these policy measures may be most successful when combined with subsidy schemes and favourable price signals such as subsidised feed-in tariffs for electricity thus channelling electricity back to the grid from private businesses and private property owners Predictability is very important in order to encourage private actors to invest in renewable energy solutions Hence city authorities should consider ways to increase predictability through risk-sharing arrangements or guarantee mechanisms The city should also clearly define its commitment to the renewable energy agenda as part of its stakeholder consultation process and public awareness campaigns
101 See Seoul Metropolitan Government (2017)102 See Barcelona Energia (2019) 103 See C40 Cities (2019) 104 Ibid
Sector-based policy options
57
34 Water and wastewaterFrom an environmental perspective the main objectives of water sector policies are to prevent pollution and to encourage resource efficiency in the sector Furthermore water policies should also enable quality water services to be provided in a sustainable manner Pollution generated in the water sector primarily derives from untreated wastewater and to some extent from emissions related to energy use in the sector Resource efficiency can therefore be related to water efficiency including reuse of wastewater as well as energy efficiency in the sector
Water utilities sit at the centre of this but industries businesses and residents also play important roles as do water users and producers of wastewater Starting with the water utility the relevant policies are to ensure that the utility firm has enough resources and the capacity to make necessary investments as well as to provide good services in a sustainable manner It is also important to ensure a predictable institutional framework with clear rules and incentives for the water utilities to make the right decisions Therefore policy reforms should aim to ensure that the utility firm is well regulated and controlled on the back of robust institutional capacity and adequate information
Regarding water users such as industries businesses and households an effective control of water use and wastewater pollution is critical Policies should also provide price signals incentives and support for water-efficient behaviour and awareness among the different user groups Sustainable supply and use of water and wastewater services must be built on the back of a sector plan that carefully assesses future water sources and water needs as well as investment needs Such a plan should also carefully consider the sequence of reforms and investment programmes In particular tariff reforms should be introduced at an early stage to detect any reduced demand and to better scale the necessary investments in water and wastewater treatment capacity
Potential water policy options relevant for green cities include the following
Policies targeting water and wastewater utilities
1 Regulation and contracting of public and private service providers
2 Reform and strengthening of water utilities
3 Promotion of resource-efficient utilities
Policies targeting water users
4 Effective tariff reforms and price signals
5 Awareness campaigns for households and industry
W1 Regulation and contracting of public and private service providers
Description
While municipal water utilities are subject to national rules and regulation the governance of the water sector also relies on municipal authorities playing an active role On the one hand city authorities are needed to ensure proper supervision and enforcement of national rules ndash for example through local monitoring control and enforcement On the other hand city authorities should also play an important role as the owners of the municipal water utilities This governance function can be supported by a well-defined public service contract (PSC) specifying the rights and obligations of the city and the water utility firm Furthermore in the case of extended private-sector involvement the city should play an important role in procuring and supervising any private-service providers
A well-defined PSC between the city and the water utility can help ensure clear and transparent governance of that utility when it is owned by a municipality ndash the utility should have been converted into a separate legal and commercial entity Such contracts should clearly define the rights and obligations of both the water utility and the respective city authorities It should also specify procedures and methodologies for business planning and approvals for budget- and tariff-setting and for performance assessment and reporting The aim is that
Sector-based policy options
58
a well-defined service contract will provide predictability and clear accountability for both the water utility and for its municipal owner
Resource implications and key requirements
Efforts and additional capacity may be needed to design and supervise a well-defined service contract between city authorities and the water operators Drafting a PSC can sometimes benefit from contract templates or examples from other cities or international institutions With some external support and technical assistance a service contract can in many cases be concluded within six to nine months For example in Bucharest the concession contract between the municipality and Vivendi Universal was signed in March 2000 and became effective in November 2000 But effective application of the service contract requires more time as there may be a need for a change of mindset among the city authorities and the utility management
Potential private-sector participation
Water and wastewater services can be provided through different forms of private-sector participation ndash from the outsourcing of non-core activities to management contracts or full-scale concession contracts
Outsourcing contracts may cover a targeted area of activities such as meter reading and bill collection More comprehensive private-sector involvement can come in the form of a management contract under which a private contractor works alongside or fully replaces the existing utility management The benefit of a management contract is that a private contractor brings in expertise and may also be less subject to politicised pressure once a contract with clearly defined objectives and performance-based remuneration has been signed Even more comprehensive private-sector involvement could come in the form of a concession contract often referred to as a PPP contract which transfers funding construction and operational obligations to the private contractor It can also transfer the full operational and revenue collection risks to the private sector
The preparation and monitoring of a concession contract requires significant resources and administrative capacity within the respective city authorities It also requires a robust legal framework A full-scale concession contract for a water utility should thus only be recommended in cities that benefit from good information about current operations and infrastructure assets and that further benefit from a well-developed legal framework and a strong administrative and procurement capacity
Implementation obstacles and possible solutions
The introduction of a public service contract implies a more formalised relationship between the city authority or administration and the water utility management This requires a change of mindset and more transparent processes which some stakeholders may find unnecessary
The introduction of deeper private-sector participation in the form of comprehensive management contracts or a full-scale concession contract requires significant preparation and institutional capacity within the city administration Therefore for cities with limited experience of private-sector contracting it may be beneficial to pursue a step-by-step approach where smaller and less complex contracts are introduced first followed gradually by deeper private-sector involvement For instance the Armenian water authority has introduced the private sector in a gradual manner over more than 10 years by first introducing management contracts
Sector-based policy options
59
and then transferring revenue risks and later investment obligations to the private sector105
W2 Reform and strengthening of water utilities
Description
Converting a municipal water utility from an administrative unit into a separate legal entity with clearly defined objectives and targets can help make the utility and its management focus on its operational and financial deliverables ndash and thereby help to depoliticise and professionalise the planning and management of the utility Such corporatisation into a joint stock company (JSC) may also enable better and more transparent governance of the water services following the introduction of an arms-length distance between the utility management and its municipal owner
The operational and financial performance of a water utility can be further improved through targeted capacity-building and restructuring of their utility Such efforts typically involve the development and implementation of a corporate development programme (CDP) A CDP would typically start off with a diagnostic followed by clear recommendations and actions aimed at addressing any identified shortcomings linked to capacity systems or processes within the utility and its operations
Resource implications and key requirements
Converting a municipal water utility into a JSC requires a significant legal effort and there is a need for clear political buy-in However it is in principle a one-off event and it does not require significant physical investment
In contrast building necessary capacity within the city administration and their water utility is a process that can take several years It requires the utility to develop capacity to manage and plan its assets and future investment needs This may require the utility to invest in better information management systems and to improve its accounting procedures External technical
assistance may be an effective way to start the process and developing a CDP and a twinning agreement with a more experienced water utility may also be a good starting point
Implementation obstacles and solutions
Converting a water utility into a separate legal and commercial entity may imply a mayorrsquos loss of control over daily operations at the water utility Therefore there may be political resistance to this structure To provide the city administration with sufficient comfort regarding future control and supervision of the water company a well-defined PSC can be developed and signed between the water company and its municipal owner
Building necessary capacity is normally not controversial However any company restructuring aimed at improving efficiency that implies labour reforms may lead to opposition from political authorities and from the utility staff Targeted retraining and relocation of staff combined with natural attrition as a way to increase labour productivity may be needed to avoid overly severe social impact and political opposition For example in Madaba Jordan the first phase of the contract was seen as the basis for re-engineering of the business processes and entailed the implementation of the necessary systems as well as staff training106
W3 Promotion of resource-efficient utilities
Description
There is a range of solutions that utilities can explore in order to improve resource efficiency or capture the value of various by-products As a traditional approach utilities can reduce water losses or energy consumption through targeted investments and the maintenance of distribution networks and related pumping equipment To ensure well-targeted investments and timely maintenance an asset management approach may be recommended A mature asset management approach is based on having a good inventory and on planning procedures
105 See Marin et al (2017)106 See Sustainable Water Integrated Management (SWIM) Support Mechanism (2013)
Sector-based policy options
60
in which investments and maintenance works are planned in a predictable and forward-looking manner This approach requires good data collection and analysis by the utilities and a long-term commitment and budgeting from the city authorities
Water utility companies can also be encouraged to explore more innovative solutions For instance water efficiency can be pursued through better utilisation of waste streams such as treated wastewatergrey water or better harvesting of water through sustainable urban drainage solutions ndash solutions that may have to be restructured to better prepare for future risks of flooding The carbon footprint of water and wastewater services can be further reduced by including forms of energy generation as part of their operation One way to do this is to exploit the hydropower potential and install a turbine inside the water pipes transporting water down from a reservoir through gravitation Energy can also be generated through the capture of biogas at wastewater treatment plants Lastly solar and wind power solutions can be located in wastewater treatment plants in order to cover some of the energy needs of the sector
Another by-product of the wastewater treatment process is sludge Increased wastewater service provision for instance to address a sanitation shortfall or to meet higher regulations will generate more wastewater sludge The capacity of sanitary landfills to receive such sludge may be limited and the impact of the EUrsquos Landfill Directive is likely to drive further reductions in these types of outlet As a consequence alternative solutions for effective management and disposal of wastewater sludge may be increasingly important in a many cities Sludge re-use for landscaping or agriculture is one option Other options include co-composting with green waste or using sludge in combination with other waste or fuel sources for power generation
Resource implications and key requirements
Most of the energy and water efficiency solutions presented here require significant investment Therefore long and predictable contracts with clear revenue streams may be needed For example for renewable energy production to be made sufficiently
attractive any renewable energy subsidies on the energy market should be made available This may require connections to the electricity grid and bilateral power purchasing agreements may need to be negotiated and signed Consequently a water utility firm may need to develop additional capacity and procedures for arrangements in the energy market Commercial sludge management may also require predictable offtake agreements with relevant stakeholders There may also be legal limitations on where the utility firm can dispose of wastewater sludge
The Bangkok Metropolitan Administration has enacted by-laws requiring the installation of a wastewater treatment facility for new housing developments with more than 10 detached houses and for all industries and businesses Septic sludge is treated in order to be used as fertiliser in the cityrsquos public parks surrounding green areas and farmland The administration also aims to produce compost with a mix of natural rice straw and the dewatered sludge from the 12 wastewater treatment plants to be used as manure107
Potential private-sector participation
Many of the necessary investments in resource efficiency can be provided through PPP-style contracts whereby a private energy servicing company finances constructs and operates the relevant installation in return for a performance-related remuneration
In Aqaba Jordan the Aqaba Water Company has made large investments in sewers and wastewater treatment Currently 90 per cent of the cityrsquos wastewater is collected and treated with 69 per cent of wastewater reused and 100 per cent of energy recovered The capital investment is paid off by the sale of reclaimed water under a PPP contract to hotels and other commercial offtakers108
There is also an important role for the private sector as offtakers of grey water and processed wastewater sludge For example selected companies may be interested in reusing treated wastewater for industrial purposes and farmers or forestry companies may also wish to use wastewater sludge
107 See The International Water Association (2018) 108 Ibid
Sector-based policy options
61
Implementation obstacles and possible solutions
Financial risks as well as legal and environmental uncertainties may prevent the pursuit of some of the solutions outlined above To address such obstacles it may be helpful to run comprehensive stakeholder engagement sessions It may also be advisable to run adequate market testing to explore the opportunities for obtaining predictable and long-term offtake agreements with relevant stakeholders
W4 Effective tariff reforms and price signals
Description
There is a legacy of subsidised water and wastewater tariffs in the EBRD regions ndash in particular for households There is also a legacy of fixed monthly billing rather than consumption-based billing Correct price signals are necessary to promote prudent water consumption ndash and tariff reforms remain a key challenge in many of the economies where the EBRD invests
Good price signals require correct price-setting as well as good metering and billing mechanisms Price-setting should reflect all costs of extracting treating transporting and disposing of water and wastewater In water-scarce areas water tariffs should go beyond covering production and distribution costs and also reflect the foregone benefits of farmers for example whose productivity losses may be higher than the regular water tariff
In addition to an adequate price level it is also important that tariffs are set and adjusted in a predictable manner This is to make sure that related investments made by businesses and others can be undertaken without unnecessary risks of price volatility To this end the water tariffs should be developed using a formula-based methodology and approved by an independent and capable regulator In the absence of a national water regulator the city authorities can help set up or improve both the relevant methodology and a local regulatory authority
Effective metering billing and bill collection are also important to ensure true price signals for water use Therefore effective tariff reforms should include
programmes aimed at installing or upgrading individual water meters whenever this is needed
Resource implications and key requirements
Setting up the institutional capacity and operating a well-defined water tariff methodology is not too costly but it may require strong political will to introduce tariff reforms that could be unpopular What is costly however is the installation or upgrading of water meters Installation of meters in private properties may also require access to the properties and significant resources and cooperation with property owners will be needed to roll out new or improved water meters
Implementation obstacles and solutions
Increased water tariffs will generally be unpopular and often difficult for low-income households to afford The affordability problem should however be addressed through targeted support for the poor and not by providing subsidised water to the whole population Installation of meters in private properties also requires access to the properties and cooperation with the property owners To support this process a combination of information campaigns stakeholder consultation and price incentives to change metering arrangements would be recommended A gradual adjustment in tariffs over several years may also be needed to obtain acceptance among the wider population
W5 Awareness campaigns for households and industry
Description
Information campaigns at the household level can trigger behavioural changes in consumption Different types of information can be communicated to promote water-saving initiatives and activities This includes information about
bull devices for household appliances to monitor water use such as for showers or washing machines
bull technical advice that offers water-saving tips for example spending less time in the shower
Sector-based policy options
62
bull norm-based information communicating practical household experiences as before-and-after examples for instance
bull benchmarking data comparing the performance of a household against its neighbours
bull informing residents of the potential impacts of localised drought and flooding
This information can also be conveyed in different ways Whereas providing information through public advertisement campaigns is one option information can also be provided in combination with water-saving competitions or similar interactive ways of raising awareness Attitude campaigns targeting children in schools and pre-schools who then start lsquopolicingrsquo their parents have also proven to be effective
In Spain the Zaragoza Water Saving City programme ran a broad media campaign which was extended to schools Discounts were offered on water-efficient products and this initiated voluntary commitments by residents and businesses109 A ldquo50 Good Practicesrdquo guide was also developed that provided businesses with a reference model for identifying effective methods of improving water efficiency
Resource implications and key requirements
This policy option is a relatively low-cost and proactive approach compared to more reactive network investments However it requires substantial efforts to reach the majority of households in particular if children are to be convinced and there should be an administrative commitment to the policy to generate long-term behavioural changes
Potential private-sector participation
Public or private water utility firms may have an incentive to influence water consumption patterns ndash in particular when infrastructure or water sources are stressed Utility firms often provide awareness campaigns through external non-profit organisations and through school teachers when education campaigns target school children
Implementation obstacles and solutions
A lack of municipal resources or committed city officials may prevent effective attitude campaigns from taking place To overcome this problem one solution may be to team up with local NGOs and schools in order to benefit from their resources and enthusiasm to promote public awareness and attitude campaigns including for school children Another ally could be the local water utility company as it may have an incentive to influence water consumption patterns ndash in particular when infrastructure or water sources are stressed
35 Solid wasteThe environmental objective of the waste management sector is first of all to ensure pollution control preventing the diffusion of waste and pollution into soil and water as well as the emission of GHGs into the atmosphere This in turn protects and improves the environment human health nature and public spaces and further mitigates the risks of climate change Second the waste management sector also seeks to reduce landfilling while promoting value extraction and resource efficiency
Pollution control (stage 1) can be achieved by ensuring proper collection and delivery of waste to be disposed of at sanitary landfills and further by the closure and decontamination of informal and non-compliant dumpsites The reduction of landfilling and the promotion of value capture or resource efficiency can be realised by moving up the so-called waste hierarchy (see Figure 8) either through energy recovery (stage 2) recycling (3) reuse (4) or the reduction (5) of generated waste
While the objectives may be clear the waste sector is complex from a technical perspective with multiple steps and processes required to take place for different waste streams in a carefully integrated manner The sector is also complex from a policy perspective Multiple formal and informal stakeholders and multiple laws seek to regulate influence and operate within the sector Regulations include among
109 See 2030 Water Resources Group (2013)
Sector-based policy options
63
1
2
3
4
5
others the application of land air and water pollution directives as well as the obligations of national regional and municipal authorities Other factors include land planning and the obligations and rights of commercial and residential entities The sector also relies heavily on the behaviour and buy-in of the public
Poor waste management has been a widespread problem in most of the economies where the EBRD invests Substandard planning inadequate funding and limited know-how have led to poor performance and low environmental standards Not only have poor planning and inadequate funding prevented the necessary investments and services from taking place inadequate and unpredictable funding has also weakened accountability among the various operators and authorities in the sector For example an underpaid waste collection company will lsquounderstandablyrsquo cut down on the collection frequency or coverage and thus not provide the agreed service level making plans and targets less meaningful Lastly poor waste management services lead to a poor waste management culture and may hamper buy-in from residents and the relevant public and private institutions
When seeking to improve the waste management sector it is important to keep in mind that effective waste management is expensive often comprising 20-50 per cent of municipal budgets110 Overall it is not a profitable sector even after taking into account revenues from the sale of recyclables refuse-derived fuels or energy Therefore adequate funding for both investments and operations must be in place at all times while improving the performance of the sector In addition due to the complexity of the sector changes should be introduced incrementally without oversized interventions in line with the administrative capacity and with public support and willingness to contribute to an improved waste management system
To help address the pollution challenges and gradually move up the waste hierarchy requires multiple technical and policy-related solutions ndash including policies that target good planning adequate funding effective accountability and effective change in attitudes among residents businesses and public authorities Some of the main policy options or building blocks are presented below covering initiatives (i) to ensure effective governance and buy-in from various stakeholders and (ii) to move up the waste hierarchy
Ensuring effective governance and buy-in
1 Establishment of a waste management strategy action plan and administrative capacity
2 Effective price signals and funding
3 Information strategies for residents and businesses
4 Formalisation of informal services
Moving up the waste hierarchy
5 Improvement of waste collection
6 Waste sorting and treatment to encourage recycling and energy recovery
7 Promotion of sharing and reuse of products
Source EBRD
Figure 8 The waste hierarchy
110 See World Bank (2019)
Waste prevention
Preparation for reuseSt
ages
1-5
Recycling
Other recovery
Disposal
Sector-based policy options
64
SW1 Establishment of a waste management strategy action plan and administrative capacity
Description
In terms of waste management an important first step is to develop a waste strategy and an action plan at the city level If national or international (in other words EU-level) waste strategy or policy and related institutions exist this should be taken into account and strategies should be aligned In the absence of national plans and regulation local solutions can still be planned at the city level Given the complexity of the waste sector it is important that local waste strategies and action plans have holistic views in the pursuit of an integrated waste management structure covering all the technical and practical steps This includes the question of how to provide the infrastructure necessary to manage different waste streams such as mixed municipal waste recyclables hazardous waste construction and demolition waste organic waste and medical waste It further includes how to select collection or delivery solutions in terms of lsquobringrsquo systems or residential waste (kerbside) collection systems bin types volumes collection frequencies and so on If seeking to promote separation and collection of recyclables careful planning is needed to make the process as convenient as possible for residents
While a waste strategy may set up general objectives responsibilities and resource implications an action plan is more detailed and includes practical steps with details targets and timelines for the implementation of different solutions A waste plan should also clarify the capacity needed and responsibilities related to the provision of information awareness campaigns and monitoring systems Both the waste strategy and the action plan should cover all the formal processes of waste collection transportation treatment and final disposal ndash and may also include ways to better internalise the informal operators when relevant An action plan should also articulate the roles of the public sector versus any private sector investments or operations Moreover as the sector seeks to move up its waste hierarchy additional and more sophisticated efforts
need to be planned incentivised coordinated and enforced
At an early stage it is important to build adequate capacity and know-how within the city administration in order to plan operate contract and monitor waste management activities Considerable technical expertise is required to design a strategy or an action plan within the national context and based on local needs and conditions Enforcement and reporting mechanisms are also necessary to ensure continued implementation and compliance While some regulatory capacity and know-how can be provided by central authorities the local administration should be expected to plan secure financing contract supervise monitor and enforce the waste management activities in the city
Resource implications and key requirements
While the planning itself does not require significant financial or human resources it needs sufficient know-how which initially may need to come from the central government or other external knowledge providers As the planning process evolves and the implementation and the related investments and operations start the resources needed for a competent management and governance of the sector grow For example in Ljubljana in Slovenia the public waste management company Snaga Ljubljana has been working on planning and administrating the process for 10 years in order to move the sector towards EU compliance ndash in other words full collection disposal in sanitary landfills and the closure of non-compliant dumpsites111 In September 2014 Ljubljana became the first European capital to commit to becoming a zero-waste city112
Potential private-sector participation
Planning and regulation should be led by public institutions and relevant authorities However where there is a clear lack of know-how private knowledge providers may be helpful when developing strategies and action plans for a cityrsquos waste management sector To this end numerous international consultancy firms offer specialist services related to
111 See Zero Waste Europe (nd)112 See European Commission (2019)
Sector-based policy options
65
the development of waste management strategies that comply with international standards
Implementation obstacles and solutions
The implementation of an ambitious waste management strategy and action plan entails a number of challenges Significant resistance can be expected from existing and well-connected operators providing suboptimal services Informal waste management activities may lose out with political and social implications and adequate buy-in and commitment from the public may be difficult to achieve Implementation therefore requires strong political commitment and support combined with comprehensive awareness campaigns and education In addition as a city seeks to move up the waste hierarchy it requires an ever-wider spectrum of stakeholder engagement For example moving up the waste hierarchy may involve stronger commitment to waste-sorting at source by residents more standardised use of materials by producers or a sector-wide commitment to introducing nationwide deposit schemes for cans and bottles It may also require changing the awareness and behaviour of citizens and the establishment of permanent communication and education about source-separation of recyclables and various forms of waste reduction This work creates an understanding of the entire lifecycle of products as well as the feasibility of recycling and the repair of products While these steps higher up in the waste hierarchy are ambitious measures one may look at the way Tirana introduced compulsory payments for plastic bags provided by local shops Alternatively one can look at cities such as Parma in northern Italy or Ljubljana in Slovenia where significant improvements have taken place on the back of a mix of policy measures113
SW2 Effective price signals and funding
Description
Adequate pricing of waste-related activities can positively influence behaviour (in other words lead to a reduction of waste) and ensure more sustainable funding of the sector Cities have various possible
pricing mechanisms and measures at their disposal that are outlined below
Fist city authorities can introduce pricing (pay-as-you-throw) on the waste delivered by ndash or collected from ndash households businesses and industry Pay-as-you-throw schemes can be set up for businesses and households as a charge for waste bags for different waste streams However with the exception of the most law-abiding and well-monitored societies this solution can easily trigger illegal waste dumping and a fixed cost-reflective fee for municipal waste collection is normally a more feasible funding scheme
Second the city can normally set tipping fees at the landfill To help reduce landfilling and to incentivise waste sorting at source differentiated gate fees for sorted and mixed waste at the landfill can be introduced This requires weight-based tipping fees and increased control
Third cities can introduce pricing requirements and subsidies on certain products such as disposable and reusable grocery shopping bags and they can promote the introduction of deposit return schemes for products such as beverage containers In San Francisco the checkout bag ordinance that was extended to cover all retail stores in 2012 and all food establishments in 2013 has led to a 72 per cent reduction in plastic bag use since 2010114
Lastly another pricing mechanism incentivising recycling is the introduction of deposit return schemes for products such as beverage containers This can be introduced for selected outdoor bars or it can include the setting-up of machine-based schemes where individuals are rewarded for returning beverage containers for example in the case of the Veolia-linked pilot in London115 Moreover while not a direct charging mechanism cities can install and inform their residents about public drinking-water taps as a free alternative to buying new plastic water bottles
Resource implication and requirement
A pay-as-you-throw scheme requires significant administrative and operational resources as well as substantial monitoring and enforcement efforts
113 See Pietzsch et al (2017) 114 See SF Environment (2019)115 See White (2019)
Sector-based policy options
66
66
It also requires a relatively law-abiding culture ndash otherwise this approach may lead to unmanageable levels of illegal dumping
Cost-reflective tipping fees do not require excessive investments or operating costs However differentiated gate fees for different waste streams will require some additional control and penalty procedures
The introduction of payment for disposable products such as grocery plastic bags does not imply large costs for a city administration but substantial efforts linked to public communication are likely
Potential private-sector participation
Introducing payments or deposit return schemes for certain disposable products requires close cooperation with the private sector For instance in Scotland neither the Scottish government nor Zero Waste Scotland will run the scheme That is the job of the scheme administrator(s) which is expected to be an industry-led privately owned and not-for-profit private-sector enterprise Typically the administrator(s) of the scheme will be responsible for its day-to-day management In the case of Scotland the Deposit Return Scheme for bottles and cans creates new obligations for drinks producers and most of them are likely to nominate a scheme administrator to fulfil these on their behalf116 The service will be funded partly by small fees paid by producers with the size of those fees based on the number of drinks containers that producers put on the market For retailers and hospitality firms who will collect returned cans and empty bottles their main contact will be the scheme administrator For deposits that firms (the
`return points) refund the administrator will provide reimbursement and pay the handling fee
Implementation obstacles and solutions
Requesting payment and fees for something that used to be free of charge is never popular However comprehensive awareness-raising campaigns in cooperation with affected business communities and relevant NGOs can ensure acceptance and buy-in from the relevant population and businesses
SW3 Information strategies for residents and businesses
Description
Waste prevention depends on a shift in the attitudes and behaviour of residents and businesses This can be encouraged through various informational measures Drawing public attention to waste prevention is a fundamental step in nudging behavioural change towards more sustainable consumption and waste management practices Such informational strategies aim to change consumer behaviour encouraging informed decisions on reducing waste generation and improved separate collection of different waste streams This can lead to a number of benefits including reductions in GHG emissions environmental pollution and the use of materials Moreover waste prevention leads to cost reduction as collection and transport costs landfill volume and clean-up costs are all lower
In addition it is important to inform the public how the current systems work or how source-separation works and to communicate the cityrsquos plans and achievements For instance a new sanitary landfill will lead to tariff increases but only a few neighbours might see improvements ndash thus the city needs to communicate this too in order to improve acceptance of increased tariffs
A number of information strategies can be used including awareness campaigns information on waste prevention techniques training programmes for local authorities and eco-labelling Effective awareness campaigns often focus on a specific waste stream
116 See Zero Waste Scotland (2020)
Introducing payments or deposit return schemes for certain disposable products requires close cooperation with the private sector
Sector-based policy options
67
and provide easy-to-follow practical advice on waste-prevention actions Campaigns may choose to focus on visible actions such as the use of canvas bags instead of plastic bags the implementation of home composting the use of no-junk-mail stickers and the repair and recycling of clothing117 Specific methods for information dissemination include online information portals geared towards consumers online tools facilitating the calculation and tracking of data on waste and the development of waste prevention plans
Resource implications and key requirements
Education campaigns can be administratively demanding due to the need to provide information on waste prevention techniques for specific users such as households businesses and organisations In addition the campaigns demand substantial budgetary resources with leading waste authorities in Europe having invested significant resources into awareness generation of at least euro5 per resident118 For this reason it is important that the financing of campaigns is stable At the same time waste prevention also saves a city money ndash for instance if food waste is recycled instead of disposed of in a landfill ndash and awareness campaigns could therefore have a positive effect on a cityrsquos budget Campaigns can be tailor-made for specific waste streams and target groups using different media
Potential private-sector participation
Although campaigns are often conducted at the national level several cities have also been proactive in launching their own campaigns While the private sector is rarely involved it is common for awareness campaigns to be provided through external non-profit organisations and through school teachers when education campaigns target school children A specific measure for awareness-raising is the establishment of a network of waste advisers These are volunteers or employees trained in waste prevention and management who support residents in reducing and correctly separating at source the waste generated in households Leading waste organisations in Europe have put in place one waste adviser per 20000 residents
Implementation obstacles and solutions
It is important that messages are tailor-made for well-defined target audiences and delivered consistently through a range of complementary measures Other success factors include cooperation between the local authority and the stakeholders involved in providing the campaign such as waste charities school teachers and waste advisers The quality of preparation and implementation of the campaign is important and can be based on previous studies and recommendations from stakeholders Campaign continuity and well-developed materials are equally important for a successful campaign as well as recognition of the campaign at the national level119 It is also crucial to monitor the impact of particular campaigns on key performance indicators
Successful examples of campaigns in the UK targeted towards consumers include the Love Food Hate Waste campaign the Recycle Now campaign the Love Your Clothes campaign and the Real Nappies campaign Examples in other countries include campaigns for tap water instead of bottled water in Portugal and Italy and the Stop Pub campaign in France Furthermore Vienna is promoting lifestyles geared towards services and culture rather than products Successful examples of informational tools include Eunaofaccedilolixocom in Portugal which suggests waste prevention techniques for different types of household room the WRAP Waste Prevention toolkit and WasteCap a non-profit network in the USA
Comparison with other policy options
Information strategies are a necessary step towards inducing behaviour change and therefore any waste prevention policy will implicitly require information strategies Awareness campaigns must be delivered in conjunction with the right tools to support organisations in managing their waste together with an efficient separate waste-collection system and promotional measures for waste reuse and repair
117 See European Commission Directorate ndash General Environment (2012)118 See Dri et al (2018)119 See Regions4recycling (2014)
Sector-based policy options
68
SW4 Formalisation of informal waste collectors
Description
Many economies in the EBRD regions are affected by a number of financial technical and efficiency-related problems in their waste sector that have caused poor waste management practices and sometimes a lack of any formal practices This situation has led individuals groups and micro-enterprises to perform informal collection and recycling generating income through collection fees and by selling the extracted valuable materials Informal workers perform their activities under inadequate and uncontrolled conditions putting themselves at risk of occupational injury and disease120 Their work is further characterised by low entry barriers low organisation levels and irregular income
The integration of the informal sector into formal solid waste management systems can help reduce overall system costs support the local industry by providing low-cost materials and create new jobs Furthermore it can reduce negative environmental and climate impacts from solid waste management through improved resource recovery and reduced disposal Lastly it can help to generate income and improve working conditions for poor populations who often lack other economic opportunities
Recognising the role of the informal waste sector several governments have implemented various formalisation measures to address the social problems linked to the sector There are three main types of approaches to the formal and legal recognition of informal waste collectors
(i) Formalisation based on organising informal waste workers in associations and cooperatives which establish contracts or cooperation agreements for performing waste collection and recycling services The sustainability of such models can be ensured through waste policy and regulation changes proposing a combination of sources of revenue
(ii) Formalisation based on organising recyclers in community-based organisations or micro and
small enterprises These are mostly covered by waste collection fees paid by users and from selling recycled materials The role of the municipality is minor in such cases mostly supporting through awareness-raising and equipment provision
(iii) Formalisation based on integrating recyclers as workers for the formal waste management sector by recruiting them to perform collection or recycling at facilities
Several factors are critical for the successful integration of the informal sector including deploying a mix of approaches and establishing stable organisational structures Cooperatives small enterprises and networks in numerous countries show that these organisations were the first step to get informal workers out of social marginalisation improving their economic efficiency and thus their position in the economic value chain They also made partnerships with municipalities and other stakeholders possible121
Resource implications and key requirements
The integration of the informal waste sector demands substantial administrative resources to coordinate their formalisation into a formal sector or through associations and community organisations
Potential private-sector participation
Partnerships in the private sector between formal and informal actors become more and more important Many private enterprises perceive the opportunities stemming from the use of waste as a (material or energy) resource and recognise that partnerships with the informal sector can improve the value chains related to sourcing materials from waste The private sector can for instance be responsible for providing training and empowerment of waste workers as well as implementing occupational safety practices Furthermore it can also help assess and document the waste management system and expand the capital base of the sector And lastly the private sector may need to be involved to formally recruit informal waste collectors
120 See Wilson et al (2006)121 See GIZ (2012)
Sector-based policy options
69
Implementation obstacles and solutions
Not all attempts at formalisation have been successful due to the existence of barriers which have prevented the implementation of such attempts as well as a lack of understanding of these barriers and the measures that may enable formalisation122
For instance formalisation reduces waste pickersrsquo ability to enter and exit the waste management economy and research shows that waste pickers value that flexibility Hence formalisation efforts by government have often been unsuccessful exposing the limitations of the governmentrsquos ability to regulate and monitor the actions of those in the sector123 Governments should therefore seek to provide economic support through financial incentives diversification of services and appropriate payment schemes The formation of partnerships and stakeholder involvement are key and can involve the formation of cooperatives and associations Funding should also be provided for waste infrastructure to provide adequate sorting and storage spaces It is also best practice to train and empower informal workers and include them in formalised waste activities
For instance the city of Cairo pursued a policy of the privatisation of municipal solid waste collection as part of various World Bank initiatives to improve the conditions in the city However this has been seen as threatening the sustainability of garbage collectorsrsquo communities as well as new claims on and the commodification of Cairorsquos waste materials to the detriment of effective collection124
Integration of informal workers into the formal sector has been successfully used in Austria and Hungary as the preferred option Recent waste policies and legal frameworks of countries such as Brazil and Peru have included recycling associations and cooperatives in separate collection and recycling programmes Colombia has introduced a 3R (reduce reuse recycle) waste hierarchy and enabled the participation of marginalised groups in a bidding process Countries such as India and the Philippines have also recognised the need to involve informal waste collectors
SW5 Improvement of waste collection services
Description
Three components are needed to rectify a poor waste collection system (i) infrastructure or equipment (ii) good collection services and (iii) adequate contribution by waste generators ndash in other words households institutions and businesses Furthermore in the economies where the EBRD invests there is often no full lsquocollection service coverage ratersquo meaning that not all households have access to frequent waste collection services Hence typically in addition to replacing worn-out collection infrastructure cities also seek to extend collection services to the whole city
Infrastructure investments (in other words bins containers collection points vehicles and perhaps transfer stations) and related maintenance will have to be well planned and financed and cover collection systems for different waste streams For instance container-based lsquobringrsquo systems can be used for construction and demolition waste whereas residential waste (kerbside) collection systems are feasible for municipal waste with clearly defined bin types volumes collection frequencies and so on Adequate maintenance also includes cleaning repair and replacement of broken equipment for which responsibilities must be clearly defined
A good collection service implies adequate coverage of all locations and adequate frequency and capacity as well as the provision of collection services in a predictable and resource-efficient manner
Effective waste collection systems rely on sufficient contributions from households institutions businesses and industry Different waste streams must be delivered as planned placed in the right containers and bins which must be made easily available and looked after In order to ensure that residents and other stakeholders are committed and contribute to the collection process effective information and attitude campaigns may be needed Such campaigns can be pursued through a combination of different forms but one effective way is
122 See Aparcana (2017) 123 See Linder (2019) 124 See Fahmi and Sutton (2010)
Sector-based policy options
70
to educate children through schools and kindergartens who later lsquopolicersquo their parents and carers
Resource implications and key requirements
Waste collection services are costly as they imply capital costs for equipment and vehicles and significant operating costs for fuel and operating staff
The logistics and efforts needed to put in place adequate infrastructure can be substantial depending on how radical the changes to the collection system are Sometimes it can mean bins containers and new or additional collection vehicles only At other times it may also include the acquisition or construction of new collection points and transfer stations to streamline some of the processes For example Ljubljana invested euro421291 in its door-to-door system to be able to provide bins and vehicles servicing an urban population of 400000 in the municipality of Ljubljana and 10 bordering municipalities The annual running costs for the door-to-door system were estimated to be euro984 per tonne125
Potential private-sector participation
Private collection companies contracted through international competitive tenders can provide useful expertise and cost-efficient waste collection solutions Private contracts can also help introduce better contractual arrangements and help depoliticise and professionalise the collection services with clearly defined rights obligations processes performance targets and incentive-based revenues By requiring private collection companies to undertake awareness and attitude campaigns incentives are further aligned given that successful attitude campaigns and increased buy-in from inhabitants will benefit the collection company Some of the financing for vehicles and other equipment can also be provided by private collection companies although this does not bring down the overall costs for the waste collection services There may be benefits to splitting a city into more than one collection area or contract for comparative and competitive reasons Private collection contracts should cover multiple years (five or more) in order for companies to be considered creditworthy and to benefit from their awareness and attitude campaigns
Implementation obstacles and solutions
Significant resistance can be expected from existing and well-connected operators providing suboptimal collection services Informal waste collection activities may also lose out with political and social implications There may also be significant objections from residents and businesses groups that may have to change their efforts and pay a higher waste collection fee in order to make a new collection system work Therefore strong political commitment combined with comprehensive awareness campaigns education and a wide spectrum of stakeholder engagement are necessary By aligning incentives for private collection companies to also undertake awareness-raising campaigns the effort required to improve commitment and buy-in from various stakeholders will be increased
SW6 Waste sorting and treatment to encourage recycling and energy recovery
Description
Important steps to reduce landfilling include sorting and treatment of waste These are also necessary steps to capture economic value from produced waste Waste sorting is a prerequisite for specialised disposal of hazardous waste and for recycling It is also the first step of treatment processes aiming to convert waste into fuel for energy purposes
Waste can be sorted after its arrival at a landfill a transfer station or a waste treatment plant However waste sorting has proven to be most cost efficient when it is combined with pre-sorting at source by households and businesses ndash for example through kerbside collection schemes or recycling yards with multiple bins for recyclables and other waste streams such as paper glass metal garden waste food waste and residual waste However it should be noted that waste sorting aimed at promoting recycling is only economically justified when the general waste stream is sufficiently rich in recyclables As a general rule the share of recyclables in the general waste stream tends to increase in line with GDP per capita
125 See European Commission (2014)
Sector-based policy options
71
Further treatment of non-recycled waste includes the biological treatment of residual waste or anaerobic digestion of food waste Both treatment processes require large investments and aim to convert waste into refuse-derived fuel (RDF) As recyclables and RDFs are sold through pre-agreed contracts or through relevant markets it is important to secure reliable access to such markets and contracts prior to large investments in sorting and treatment solutions
Resource implications and key requirements
Separation of waste is costly Pre-sorting of waste at source implies additional costs for equipment and vehicles able to deal with pre-sorted material It also implies additional capital energy and staff costs linked to the extra mechanical or manual sorting processes As a general rule one can assume that recycling of household segregated waste is almost never a profitable activity despite the revenues from the sale of recyclables However recovering recyclables from industry and institutions is easier to operate and less costly and may generate profit for the operators
Waste treatment facilities are large investments and require predictable waste streams and offtake agreements for many years
Potential private-sector participation
Experienced private collection companies contracted through international competitive tenders can provide
useful expertise and cost-efficient waste sorting and collection solutions Private contracts can also help introduce better contractual arrangements and depoliticise and professionalise collection services with clearly defined rights obligations processes performance targets and incentive-based revenues Requiring private collection companies to undertake awareness and attitude campaigns can be a way to further align the incentives ndash as successful attitude campaigns and increased buy-in from residents and businesses benefit the collection company Some of the financing for vehicles and other equipment can also be provided by private collection firms although this will not bring down the overall costs of waste sorting and collection Private contracts for the promotion and collection of pre-sorted waste should cover multiple years (five or more) in order for companies to be considered creditworthy and to benefit from their information and attitude campaigns
The financing construction and operation of waste treatment plants have proven to be done effectively by private contractors through PPP-style arrangements However risk mitigation through long-term agreements covering waste delivery and offtake of refuse-derived fuel plays an important role
Implementation obstacles and solutions
Formalised waste separation at source may come into conflict with informal waste collection activities and may have political and social implications Waste sorting may also be met with objections from
Sector-based policy options
72
residents and businesses who may have to change their behaviour and potentially encounter higher collection fees To address this targeted awareness campaigns comprehensive stakeholder engagement and strong political commitment are necessary By incentivising private collection companies to also undertake awareness-raising campaigns one may accelerate the effort needed to improve sorting and the overall buy-in from various stakeholders
Unintended effects
Waste-to-energy solutions can come into conflict with efforts aimed at recycling or waste minimisation as large investment in waste treatment facilities requires large volumes of waste preferably with a high calorific value sometimes found in recyclables EU directives are increasingly ambitious in terms of recycling and waste minimisation and it is important that waste-to-energy solutions are aligned with these targets for all EU and EU candidate countries
SW7 Promotion of sharing and reuse of products
Description
The sharing and reuse of products can also cut down the overall use of resources as these are cost-effective ways to reduce waste generation and landfilling This approach can provide a number of benefits including reductions in environmental pollution material consumption and the need for additional landfills It can also provide employment opportunities in secondary markets and increase societal cohesion through the promotion of a sharing culture In addition to environmental benefits sharing can create a sense of community among strangers thus facilitating trust and social inclusion It can also supplement supply in periods of peak demand for instance a tourist location can benefit from a sharing platform through which multiple owners make accommodation available during peak season rather than turning to additional construction126
These approaches include both sharing among individuals and communities as well as among city
governments In the former category the sharing economy has entered nearly all urban spheres and includes solutions related to mobility and transport (for example Uber and Zipcar) spaces (for example Airbnb and WeWork) skills and talent (for example Upwork and Fiverr) financing (for example Zopa and Kickstarter) health (for example CrowdMed) utilities (for example Gridmates and Vandebron) food (for example VizEat) and learning (for example Coursera) With regard to the latter category cities can also leverage the potential of the sharing economy in municipal goods municipal spaces civic assets municipal services and the skills and talent of city residents An example related to municipal services is the Intermunicipal Collaboration Framework in Alberta Canada127
126 See World Economic Forum (2017) 127 See Government of Alberta (2020)
Sector-based policy options
73
73
Policies supporting these sharing approaches both among individuals and among city administrations include the provision of physical and IT-based infrastructure that is necessary for product sharing and for second-hand markets to take place Policies also include initiatives aimed at raising awareness and changing peoplersquos mindsets Today various city governments have institutionalised sharing practices through innovation offices (Seoul and Amsterdam) working groups (Vienna) a task force (Denver) or similar institutions dedicated to advocacy awareness and furthering the agenda of sharing in cities
Resource implications and key requirements
Reuse and sharing of products are primarily a result of market-based solutions which may need only modest provision of interventions or resources by the city authorities For example a sharing-based economy is increasingly being promoted in some areas such as through car and bike-sharing schemes on the back of increased digitalisation and the development of user-friendly apps where the private sector plays a key role Moreover it is possible to further increase the awareness and popularity of second-hand products through the involvement of NGOs community-based initiatives and the availability of infrastructure-facilitating second-hand markets
This is also a field of resource efficiency and waste minimisation and promotional measures can place a substantial administrative burden on the local administration which would need to engage with various stakeholders to coordinate promotional action Depending on the nature of the promotional strategies the measures may also necessitate significant financial and technical resources
Potential private-sector participation
As outlined above solutions related to the reuse of products are primarily driven by the private sector or charities City governments can also take on a combination of roles depending on the socioeconomic environment in the city An example is the Sharing City Seoul project which is being implemented based on cooperation between the private and public sectors steered by the Sharing Promotion Committee The initiative has certified
50 sharing projects that provide people with an alternative to owning things they rarely use and has given grants to a number of these projects
Implementation obstacles and solutions
Peoplersquos mindset may be the biggest obstacle to the development of an economy based on more sharing and reuse of products Identity is often linked to the products (for example cars) a person owns and second-hand products may be viewed as something for the poor A gradual process supported by community-based and city-supported awareness campaigns may be the most effective way forward
In Belgium Ghentrsquos Foodsavers platform operated by the city brings together food leftovers from the wholesale market and local retailers and redistributes them to food banks social restaurants and social supermarkets Another successful initiative is the Restorestje a local version of a leftover container It is distributed to restaurants for free in order to encourage them to use it Campaigns have managed to change peoplersquos behaviour and encouraged them to take their leftovers home128
In general not all aspects of sharing-economy models are positive Cities have faced challenges in creating policy and regulatory frameworks protecting consumers avoiding unfair competition modernising outdated taxation laws and assuring social equality For instance while sharing can bring social and environmental benefits sharing models can also result in excess supply One example of this is in China where companies like MoBike (bike-sharing) have created a surplus of bikes at rental stations rather than improving the use of existing assets in the belief that a large inventory will help them to dominate an extremely competitive market
It is therefore crucial for cities to establish trust and reputation in sharing platforms ensure the safety and security of data and people and be cautious about social inequalities that can potentially be caused by the sharing economy
128 See RUAF Foundation (nd)
74
75
Cross-cuttingpolicy options
41 Governance
42 Finance
04
76
Local governments often struggle to undertake environmental action due to several constraints including limited political power low levels of institutional capacity low levels of stakeholder integration low levels of multi-level government cooperation limited fiscal power poor financial management and lack of access to finance129 Cities need strong institutional environments that allow their local governments to function more efficiently flexibly and competitively to achieve an ambitious green city agenda
Local governments around the world are also increasingly responsible for providing and coordinating services across the sectors of transport energy buildings waste water and land use These require heavy infrastructure investment and may have substantial administrative and budgetary implications Local governments are also responsible for managing social sectors such as health education and public safety which have significant operating costs130 It is therefore important for local governments to explore the ways in which they can improve their governance and financial responsibility
While the policy options presented in this chapter may not target green objectives directly they are critical for enabling cities to pursue their green agendas in a sustainable and efficient manner The continuous improvement of the institutional environment of cities can make policy implementation more effective enabling the transition to prosperous cities in which sustainability is integrated into the different facets of
public- and private-sector decision-making A strong institutional environment comprises aspects such as (i) the devolution of powers to local governments (ii) sufficient multi-level government coordination (iii) capacity and expertise of all actors so they can play their roles effectively (iv) participation of relevant stakeholders including residents and representatives from various groups (women young people the elderly migrants people with disabilities and so on) (v) financial transfers from central government and (vi) accountable management and transparent use of public resources The enabling environment may be divided into two cross-cutting policy areas namely governance and finance
41 GovernanceEconomies and cities in the EBRD regions have a legacy of poor governance which was further exacerbated after the poorly planned decentralisation that followed the collapse of centrally planned regimes City governments in these regions tend to lack strong administrative authority political autonomy skills resources technologies and capacity to play an active role in city planning management and development This has led to a limited ability to coordinate public infrastructure and service provision at the local level as well as to weak procedures
Cross-cutting policy options
Strong institutional structures and reliable financial mechanisms are required for cities to pursue their green agendas effectively
129 See Sustainable Development Solutions Network (2016)130 See UN-Habitat (2009)
Cross-cutting policy options
77
a culture of insufficient observation and the criticism of city governments by the public
Local governments may explore the following selection of policy options perhaps in combination with each other as a policy mix
1 Political and fiscal decentralisation
2 Improved transparency and accountability
3 Enhanced integration across government bodies
4 Effective stakeholder participation
5 Capacity-building
These can bring a number of benefits beyond environmental improvements including better social cohesion and inclusion improved political involvement and a stronger ability to successfully change behaviours with a long-term view to generating sustainable development
G1 Political and fiscal decentralisation
Description
Empowered local governments have been shown to have a positive impact on the provision of public services and quality of life131 The major benefits of decentralised decisions include (i) a more targeted or tailored supply of public services and infrastructure in response to local demand which should lead to (ii) a more cost-efficient use of public expenditure and may (iii) increase cost-recovery funding from residents who are more willing to pay for adequate services Decentralisation can also (iv) promote accountability and reduce corruption due to proximity to the population which may be more aware of local governmentsrsquo actions than those of the central government
However if poorly implemented decentralisation may result in inefficiencies and corruption and further disillusionment with the government Therefore for the abovementioned benefits to materialise it is important that (a) decisions (and not only operational obligations) are transferred to local authorities (b) local authorities have sufficient financial and institutional capacity and procedures in place and (c) the decentralisation promotes engagement and enables people to hold institutions to account for delivering policies in a transparent way
The transfer of political or decision-making powers (point (a) above) would primarily be a central government choice The same is true for the decision to transfer parts of the central budget or collected taxes to local authorities in order to improve their fiscal capacity (point b) However ensuring adequate funding is also a task for the local authorities and so is the building of institutional capacity and procedures These enable good governance to promote the populationrsquos ability to engage with and hold institutions to account for delivering policies in a transparent way (point c) For example in terms of fundraising decentralised governments may be responsible for raising their own revenue and setting their own taxes That should further improve accountability and responsibility at a local level There is also evidence that taxes are easier to collect when people can see that they are being used for local purposes132 Beyond setting local business personal or property taxes local revenues can also come from increased fees for licences or permits or from higher tariffs for utility services These options are discussed further under the policy area for local financing (see Section F1)
Resource implications and key requirements
Key requirements for effective decentralisation include central government support and a meaningful local democracy that can inform the local decision-makers and hold them accountable for delivering policies It is also instrumental to have adequate capacity and procedures in place before any transfer of political and fiscal powers in order to minimise uncertainties and confusion during the decentralisation process Significant resources are needed to ensure adequate institutional capacity and
131 See Bilbao (2015)132 McKinsey amp Company (2013)
Cross-cutting policy options
78
procedures ndash and further resources will be needed to ensure peoplersquos engagement to further deliver results For instance in Poland the reform of public administration demanded effective legislative and operational work monitoring of the implementation evaluation of the effects of the reforms and engagement with civil society and local residents about the reform133
Implementation obstacles and solutions
A decentralisation process may meet opposition at central and local levels Central authorities may be reluctant to give away powers and may be concerned about the ability of local authorities to assume new responsibilities and powers Local authorities also may be reluctant to take on responsibilities and powers that they are not familiar with In both cases it may be argued that uncertainty and limited capacity are the key sources of the problem While limited capacity can be addressed through capacity-building programmes uncertainties for both central and local stakeholders can be mitigated by a gradual transfer of powers for example first transferring a prescribed service delivery before greater powers to define and organise service obligations and later giving extended local powers to plan invest and finance local infrastructure and related services Uncertainties can also be mitigated through a careful sequencing of capacity-building and the promotion of local stakeholdersrsquo understanding of tasks and processes before powers are decentralised Close cooperation and the transfer of skills between central and local authorities are also important to mitigate uncertainties and risks during the transfer process
Lastly while decentralisation can help strengthen accountability and improve performance and decisions by bringing government closer to people it can also present risks of corruption and poor performance Local officials may have greater vested interests based on family friendship and business ties that can influence decision-making and local institutions designed to hold local public officials to account are not always adequate
G2 Improved transparency and accountability
Description
When transparency and accountability are put at the heart of local governance systems the risk of corruption is reduced and incentives to perform well can be strengthened Central authorities can promote accountability incentives through a top-down approach However transparency and accountability should also be promoted through a bottom-up approach where residents can participate in and influence city policy design and implementation as well as hold local officials to account for their decisions and the performance of local institutions
Transparency can be promoted through mutually reinforcing strategies that include (i) ensuring access to information (ii) enhancing ethics professionalism and integrity and (iii) conducting regular assessment and monitoring
A well-organised record management system that contains accurate and easily accessible information about municipal rules decisions plans public spending and financial management can be developed and it is advisable to disclose documents of general interest through user-friendly reports and online presentations Information should cover rules and procedures related to the hiring and administration of staff calls for tenders procurement and monitoring of contract execution Further information relates to how the law requires that local governments be subject to regular and independent financial and organisational audits within a specific timeframe E-government is a commonly used tool for local governments to disseminate information and interact with their citizens
Moreover the transparency of a local government is contingent on the strength of its legal infrastructure which regulates the behaviour of city officials and promotes ethics and integrity Such legal infrastructure may include laws on conflict of interest on disclosure of income and assets and on whistleblower protection and transparent procurement In addition to legal measures a municipal code of ethics could be established thoroughly communicated with city
133 See Kulesza (nd)
Cross-cutting policy options
79
officials and effectively implemented Municipalities should also consider designating an independent agency that has the authority to interpret and enforce the code
As for assessment and monitoring the key objective is to inform the public about the activities and performance of the local government and its departments In order to incentivise good performance the government should conduct annual public reporting about municipal services These services should be measured against agreed targets and against the performance levels of previous years Other useful tools for assessment and monitoring include the Municipal Checklist the Urban Corruption Survey and Report Cards developed jointly by Transparency International and UN-Habitat134
In order to further bolster accountability well-resourced institutions designed to ensure adequate structures for checks and balances should be promoted and civic oversight and control should be encouraged One way to promote better accountability within municipal operations is to transform municipal services such as water supply district heating or public transport into separate legal and commercial companies Such public companies can then be further governed by a well-defined public service contract to be signed between the municipality and the municipal company A public service contract refers here to a contract that sets out rights and obligations for both parties including performance targets planning processes and procedures for approval of revenues and tariff adjustments It also sets out the role of the municipality and limits on its ability to interfere in operational decisions The objective of such contracts is to ensure transparency predictability and accountability for both sides
Another institutional innovation to improve accountability is the complaints and ombudsmanrsquos office which allows people to address their grievances and complaints about government bureaucracies This option is additional to existing channels such as the judiciary or internal complaints procedures The ombudsman is an independent organisation that receives and investigates allegations of maladministration The office of the Northern Ireland
Ombudsman for example deals with complaints from people who claim injustice due to maladministration The Ombudsman is entirely independent of the Northern Ireland Assembly and the Northern Ireland Executive All complaints are treated in confidence and the services are provided to citizens free of charge
Resource implications and key requirements
The improvement of transparency and accountability requires substantial administrative capacity as well as some financial and technical resources However it also enables cities to make efficiency gains once processes are in place For example Vienna introduced an information management system as part of the initiative Smart City Wien that was also used for effective public disclosure of performance monitoring The success of the programme was facilitated by its integration within the cityrsquos overall planning framework and by giving the entire municipal authority access to the system135 For tools like e-Government to have a meaningful impact computer literacy should be reasonably widespread and access to the internet for local residents must be ensured
Implementation obstacles and solutions
People and institutions may oppose significant transparency as it is more comfortable to not be held to account The publicised data may also be perceived as unreliable which again may hamper the benefits of a transparency initiative Part of the problem is
134 See Transparency International and UN-Habitat (2004)135 See Department MA 18 ndash Urban Development and Planning (2018)
Cross-cutting policy options
80
connected to trust This relates both to trust among the data providers that accurate reporting will not lead to harsh penalties or public outcry and no reward and trust among the data consumers that the reported information is correct or intended to be correct
In such cases it may be necessary to introduce transparent reporting gradually One example of this is the water sector in a country in south-eastern Europe Here the central government initiated compulsory performance reporting and benchmarking for the water utilities This initiative failed as the water utilities misreported performance levels in fear of being penalised for any reported underperformance Following this failure a voluntary performance benchmarking initiative was initiated among the leading water utility firms Performance data was collected and shared during workshops but the identity of the utilities reporting their performance levels was hidden behind a number (for example utility number 1 number 2 number 3) Following some successful workshops the firms no longer saw the need to hide their identities and were happy to replace the numbers with the real utility names Later fear of the central government and the sector regulator also vanished and these institutions were invited to participate in performance benchmarking workshops and to see the accurately reported data that the central government had not been able to obtain in the first attempt
G3 Enhanced integration across government bodies
Description
The enabling environment for city governments is influenced by multiple levels of governance Integration in government refers to the coordination between multiple departments or public-sector organisations in providing a public service or programme Such integration is essential to develop a shared long-term vision for economic development across government bodies and sectors and to ensure effective delivery of public services Collaboration has a number of benefits including the provision of more comprehensive services at the local level promotion
of joint cultural and economic development strengthened relationships between local and national governments improved local governance through modelling and information exchange opportunities for integrated planning increased access to a skills knowledge and services better use of available technology and better use of capital and other assets136
An integrated approach to urban planning emphasises the social economic and environmental dimensions of sustainable development by
(i) aligning vertical development priorities across different levels of government
(ii) encouraging horizontal coordination between departments and public-sector institutions
(iii) promoting intermunicipal or territorial coordination
Working in partnership with higher levels of government is required to improve the governance of local governments Vertical coordination across different levels of government may be achieved through representative institutions at the central government level working with local governments to offer capacity development and cooperation Special purpose vehicles ndash partnerships formed for joint project planning and implementation ndash can also be used In addition central governments may provide vertical funds which are funds earmarked for programmatic planning For example in France the Agence de lrsquoEnvironnement et de la Maicirctrise de lrsquoEnergie an inter-ministerial agency focused on environmental and energy research and policy has developed a funding programme to assist municipal areas with the development of a Bilan Carbone emissions inventory137
Horizontal and cross-sectoral coordination between departments and public-sector institutions is a necessary approach to dealing with public problems effectively138 This may be achieved through informal cooperation or local government directives Cross-sectoral departments such as planning and statistics departments can be allocated the responsibility of facilitating multi-sectoral cooperation Lastly shared
136 See Institute of Public Administration (2012) 137 See Corfee-Morlot et al (2009)138 See Howell (2012)
Cross-cutting policy options
81
digital platforms such as GIS-based platforms should be made accessible to all departments to foster a culture of open data and information sharing
Intermunicipal or territorial coordination can be facilitated through intermunicipal agencies that provide coordination among municipal organisations often called strategic alliances Sectoral governance boards support service delivery across municipal borders to ensure fair cost distribution and service efficiencies The benefit of this approach is that it achieves the advantages of amalgamation such as economies of scale streamlined business processes and improved service delivery while preserving local democracy An example of such coordinating bodies can be found in the Romanian water sector where regional water utilities servicing several municipalities are governed by inter-community development associations representing all the relevant municipalities
Resource implications and key requirements
Integration among government bodies demands a certain level of administrative human and IT-related resources Technical resources may be necessary when a government body needs to integrate functions or processes that they did not previously use Integration necessitates limited financial resources although this depends on the specific integration package It also provides opportunities for cost-sharing among administrations For example Alba Iulia a city of 74000 people in Romania introduced a pilot smart city project in 2018 developed jointly with the national government and more than 20 private companies The open data platform under construction will provide useful data to aid decision-making and foster evidence-based analysis139
Implementation obstacles and solutions
A major barrier to government integration is the tendency to think in a lsquosilorsquo approach which is difficult to break out of140 There are several other barriers to cooperation such as an emphasis on the status quo processes that bring everyone together
but reinforce silos processes that set similar goals and use the same data and decision-making driven by quests for funding141
The success of integration depends on high levels of commitment and resource-sharing Successful cooperation strategies need to be based on an understanding of the collaboration cycle strong leadership capacities an understanding of the balances between risks and rewards a culture of innovation and an emphasis on the desired outcomes and impacts142 Collaborating parties should take a design approach to cross-sector collaboration and should adopt flexible structures143
It is important to start change management efforts early in the process of planning and implementation To this end during the planning stage it is advisable to develop a thorough plan for change management Lastly a phased approach to government integration can be more manageable than a direct cutover approach
A practical form of integrated governance framework is illustrated by the Urban Nexus a concept developed by ICLEI - Local Governments for Sustainability (ICLEI) in cooperation with Deutsche Gesellschaft fuumlr Internationale Zusammenarbeit (GIZ) At a variety of scales this framework integrates services across systems sectors social relations and behaviours For example the city of Hanover in Germany used the framework to guide the integrated planning and construction process of the environmentally friendly district Kronsberg improving the provision of affordable housing and social cohesion in the metropolitan area144
G4 Effective stakeholder participation
Description
Effective stakeholder participation should be an underlying principle for most municipal activities It can enable different forms of collaborative governance and help improve decision-making implementation
139 See Sustainable Cities (2018) 140 See OECD (nda) 141 See Norris-Tirrell and Clay (2010) 142 See Institute of Public Administration (2012) 143 See Bryson et al (2015)144 See ICLEI and GIZ (2014)
Cross-cutting policy options
82
and monitoring at the local level It can cover a wide range of activities and may involve governmental bodies the private sector residents interest groups NGOs and more
For instance at an early phase of a potential investment project residents and other interested groups can help inform the city about their needs and concerns even before concrete proposals have been developed Stakeholders can at a later stage respond to ideas or discuss solutions proposed by the municipality by developers or by other organisations such as industries or NGOs A city administration can also invite its population to provide their own suggestions in response to certain challenges or development goals for example through the co-design of public spaces (see policy option L4) Effective monitoring of municipal services and assets can be undertaken by city residents or NGOs for example by online reporting on the quality of their local road network Residents and NGOs can also play an important role as volunteers or implementing agencies for attitude campaigns for example by informing school children about the benefits of recycling and waste separation
A transparent integrated and inclusive process to engage a wide range of stakeholders helps align different perspectives altering traditional political dynamics145 It helps strengthen relationships and
increases the sense of ownership of city strategies and plans among residents It can also improve the quality acceptance and effectiveness of project implementation and produce better social cohesion and urban planning outcomes146 It is thus important to engage a wide range of stakeholders and particularly groups that are less likely to be able to participate in standard engagement activities such as women young people the elderly ethnic minorities migrants disabled people LGBTQ+ people and so on Cities should ensure the participation of these groups in discussions
Resource implications and key requirements
Improving the participation and inclusion of stakeholders demands substantial administrative capacities and may necessitate technical capacity-building in public stakeholder engagement Success factors related to stakeholder participation include a stakeholder engagement strategy for policymaking which understands the needs priorities and interests and seeks participation from key stakeholders Cities also need to develop effective communication keeping stakeholders informed and motivated to participate
Monitoring of the number of stakeholders involved in decision-making activities and the presence of mechanisms that encourage community engagement also support effective stakeholder participation processes Collaborative governance is therefore closely linked to the development of open governance systems open platform databases and shared information systems government resource-sharing research and development activities and innovation and technology transfer
As part of a national road connectivity initiative the city of Tirana in Albania introduced an online app for reporting sections of road that need repair and also offered public information on the time it takes to address the reported need for repair147 The setting-up and operation of this system had cost implications but in return the city achieved road surveillance for lsquofreersquo
145 See UCLG and World Bank (2009) 146 See Global Platform for Sustainable Cities and World Bank (2018) 147 See World Bank (2018)
Cross-cutting policy options
83
Cluj-Napoca in Romania initiated the Innovation and Civic Imagination Centre to support the co-design and co-creation of urban solutions within the local community In 2019 two major debates were held one in support of a master plan for a large-scale development area while the other focused on EU cohesion policy The organisation of meetings and workshops that take place at the centre costs the municipal budget euro10000-euro15000 per month148
Implementation obstacles and solutions
Active public participation may require a certain culture and an active civil society that may not be present in many cities in the EBRD regions This form of democratic development can be fostered however through the education system and also by introducing feedback loops that do not require the capacity of effective civil society units Tiranarsquos online app for reporting road defects is an example of a user-friendly feedback system
Several cities have incorporated civil society into their urban planning and implementation process Cities including Surabaya (Indonesia) and Ghent (Belgium) have seen improved outcomes Ouagadougou (Burkina Faso) and Douala (Cameroon) also represent impressive examples of cities that have improved development initiatives through an inclusive and participatory approach Ongoing advocacy and open dialogues were key to encouraging citizens to engage in a city strategy Consensus and cooperation in establishing and acting on the strategy contributed to institutional confidence and unlocked financial opportunities149
Satildeo Paulo (Brazil) has made a considerable effort to include residents in the development of the municipalityrsquos Open Government Partnership local action plan Satildeo Paulo has also made efforts to encourage large-scale public participation in the development of a new master plan for the city with more than 25000 people attending 114 public hearings Between these hearings and the cityrsquos online crowdsourcing platform Satildeo Paulorsquos inhabitants have contributed over 10000 ideas
to improve the city and therefore the environment around them150
G5 Capacity-building
Description
Capacity-building is the process through which individuals and organisations can obtain strengthen and maintain the capabilities to set and achieve their goals151 Capacity-building is important for local governments as they adopt increasingly sophisticated policies management practices and an integrated planning culture
There are three broad types of capability that should be recognised (i) institutional or organisational capacity refers to the policies structures process rules and procedures that allow local governments to operate and provide leadership in their jurisdiction (ii) human capacity refers to the experience tools and knowledge mastered by the employees of local governments which enable them to identify analyse and respond to peoplersquos needs ensure their implementation and assess their impact and (iii) societal capacity refers to the empowerment of the community NGOs and city residents including those that face disproportionate barriers to economic opportunities to inform and hold local governments and administrations accountable for the services they offer and the good management of the community
Human capacity-building focuses on strengthening different types of abilities and skills within local governance Organisational skills are associated with efficiency in programme and project management tax collection and procurement processes and municipal finance management Technical skills target particular areas of expertise in specific sectors such as urban planning water and sanitation engineering waste management and transport engineering Behavioural skills have to do with cultural shifts and changes in attitude among all stakeholders including residents such as for encouraging multi-level cooperation or waste prevention152 Incorporating digital technologies
148 See Euro Cities (2019) 149 See UN-Habitat (2009)150 See WRI (2016)151 See UNDP (2009) 152 See Sustainable Development Solutions Network (2016)
Cross-cutting policy options
84
can further ease administrative burdens promote greater cooperation between stakeholders and allow for more oversight and transparency in operations
A number of potential activities are aimed at promoting well-targeted capacity-building within a public administration Initial diagnostics should help identify relevant shortcomings in capacity Legal stipulations can require capacity-development plans andor budget allocations for all implementation programmes Regular staff-training programmes or requirements for continued learning can be put in place among public-sector employees Project partnerships with higher levels of government public or private organisations academic institutions and civil society groups can also involve capacity-building Moreover external expert consultants from private organisations or academic institutions with sectoral or technical expertise can provide skills that are required for a specified period of time as opposed to training internal staff
Resource implications and key requirements
Capacity-building demands substantial administrative budgetary and technical resources It is a long-term process and should be represented in annual budgets and administrative commitments
Implementation obstacles and solutions
Budget constraints may be a key implementation obstacle but clearly defined needs and plans with well-defined objectives and performance indicators may help mobilise funding and support from central governments international networks or organisations or NGOs
Learning from the experiences and outcomes of initiatives by other cities or local governments for example by joining coalitions of cities is another way to build capacity A successful example of cooperation among municipalities and regions is the Network of Towns and Cities towards Sustainability created in 1997 by the Barcelona Provincial Council It allows municipalities to exchange knowledge and pool resources A particular success has been the working group on the Covenant of Mayors which along with other support from the Barcelona Provincial Council
has meant that most municipalities have now drawn up local-level sustainable energy action plans153
42 FinanceCity governments must harness their financial reserves effectively to deliver the necessary services and infrastructure that meet the needs of their residents The ability to collect manage and invest these resources through appropriate financial mechanisms determines a cityrsquos fiscal sustainability Examples of unsustainable approaches include high levels of debt or other liabilities which can divert funds from policy investments or corruption and mismanagement of funds The following policy options or policy objectives are discussed below
1 Improved revenue and financial autonomy
2 Improved accountability and transparency
3 Improved creditworthiness
4 Financial incentives or financial support schemes for green investments
This section explores the policies or approaches that city governments can take to address these points and strengthen their financial credentials so that they can finance the necessary projects to become a green and sustainable city
F1 Improved revenue and financial autonomy
Description
It is generally desirable for local governments to have the opportunity to raise their own revenue and set their own taxes This is also a good way of achieving accountability and responsibility at a local level
153 See European Union (2017)
Cross-cutting policy options
85
In addition there is evidence suggesting that taxes are easier to collect when people can see that they are being used for local purposes To ensure a degree of political and financial autonomy it is important that local revenues go beyond the bare minimum needed to cover the municipalityrsquos allocated service obligations so that surplus funds can be used to finance investments or services at the discretion of the city administration If a city relies too heavily on the national government the city may be restricted in the way it spends funding the extent of the spending and the time it takes to use it This in turn will affect the delivery of policies and programmes Fundraising instruments or mechanisms that ensure adequate local revenues include (i) taxes and transfers (ii) administrative or commercial fees and (iii) land-value capture
Taxes and transfers The opportunity to raise or receive tax revenues depends on the fiscal decentralisation in the country and primarily falls outside of the control of the local government Such tax revenues are typically linked to local property sales and business taxes or local personal taxes It also includes ldquosharingrdquo taxes between the nation and the region in the form of budgetary transfers from the national budget to local administrations
Local administrative or commercial revenues This represents funding that local authorities can influence to a larger degree regardless of the countryrsquos fiscal decentralisation This normally happens through the way fees are set and the rigour with which they are collected Administrative fees could include building permits or licensing for a wide range of activities such as operating certain business premises or motor vehicles Municipal commercial revenues may include fees or tariffs for municipal services such as water waste heating and parking services or revenues from the letting out or sale of public land and public real-estate to private entities Cost-reflective and consumption-based heat and water bills not only provide sustainable funding for the sector but also promote resource efficiency Therefore it may be recommended to move utility services towards proper metering and fully cost-reflective tariffs while providing targeted support for low-income households (see policy option E4)
Local administrative and commercial revenues account for just over one-fifth of revenues in Sofia Bulgaria with 16 per cent of the annual budget in 2018 coming from municipal fees and 6 per cent from fines and penalties income from asset ownership and sale of non-financial assets Other key sources of revenue include 20 per cent in property and other taxes 28 per cent in intergovernmental transfers and 21 per cent in EU funding154
Land-value capture There is a strong link between public investments for example in transport and economic growth and property values with new transport services such as train and metro stations typically increasing the accessibility attractiveness and value of their surrounding areas The benefits of public investment can therefore often be substantially captured by private individuals as an unearned windfall gain This problem in combination with public funding constraints has led to the development of a variety of lsquoland-value capturersquo mechanisms in order to transfer some private financial benefits back to the public sector These mechanisms may include
1 Direct development The city transport authority makes direct purchases of land surrounding planned new transit stations and develops the land directly or in partnership with the private sector making commercial returns through subsequent sale or lease (shops commercial units flats and so on) Examples include Network Rail station development programmes such as Londonrsquos Kings Cross St Pancras or the Hong Kong Metro This approach involves little complexity ndash it can be implemented by the city or transport authority directly ndash and is less controversial than some other mechanisms that may require imposing taxes on developers and existing businesses and residents However it may require significant upfront investment and financial risk for the city
2 Negotiated payments from developers The city authority secures payments from local developers to fund infrastructure improvements associated with specific large developments for example the agreement between London and the Battersea Power Station developers to partly fund the Northern Line extension This approach also involves little complexity ndash it can be
154 See Sofia Municipality (2018)
Cross-cutting policy options
86
implemented through direct negotiation between the city or transport authority and developers seeking planning consent
3 Zonal or city-wide tax increment A zonal tax increment is a tax uplift or levy imposed by the transport authority and local government on commercial andor residential properties set to benefit within a specified area around the site to capture part of the windfall gains accruing to property owners This increment could be applied to various taxes for example business rates council tax or stamp duty This approach is more complex as it is likely to require legal or tax reform and central political support for the increases in tax Focusing on areas of benefit may reduce objections ndash but requires difficult decisions over boundaries A city-wide tax increment avoids the boundary question and has the potential to raise very large sums to support strategic infrastructure investment but may not provide sufficient targeting of areas that gain the most benefit (see for example the Community Infrastructure Levy for Crossrail in London)
Resource implications and key requirements
Setting and raising local tax revenues whether as part of general taxes or as a form of land-value capture requires adequate fiscal decentralisation and sufficient administrative capacity This requires time and the development of significant resources Increasing and collecting administrative fees for permits or end-user tariffs for utility services is less complex but requires political will and enforcement capacity
Implementation obstacles and solutions
Fiscal decentralisation may be hampered by a lack of local administrative capacity and processes Therefore ensuring adequate local capacity and procedures is often an important first step While fiscal decentralisation may take a long time to implement local authorities can improve their financial position by raising funds through increased fees and commercial revenues This also gives the local authorities the opportunity to experience and demonstrate their capacity to plan budget and operate municipal infrastructure and can subsequently help increase confidence among local and central authorities that further fiscal decentralisation is feasible
F2 Improved financial accountability and transparency
Description
The financial management of a municipality should ensure accountability and transparency This can improve the confidence of and support from central governments the international community civil society and local and international businesses ndash which in turn can lead to greater receipt of public and private funds Accurate financial management can also enable better insight into which groups benefit most from the municipal budget including various marginalised groups Strong fiscal accountability and transparency are also likely to reduce or prevent corruption thus leading to more efficient spending of public resources Robust public financial management can also improve a cityrsquos creditworthiness and enable better access to commercial debt and capital markets Municipalities can take several steps to enhance their financial accountability and transparency including (i) ensuring that they apply accrual accounting in order to provide an accurate financial picture which is then used to make fiscal and budgetary decisions (ii) ensuring that well-defined systems are in place with clearly defined auditing and control functions (iii) publishing municipal financial statements regularly and (iv) using any financial information combined with data analytics to identify inefficiencies mismanagement or fraudulent behaviour
Resource implications and key requirements
Accrual accounting goes beyond reporting on cash coming in and going out It also looks at assets and liabilities to provide a more complete and accurate picture of the financial position of a municipality Preparation of accrual accounting requires the identification and valuing of all municipal assets and liabilities Such inventory requires significant resources In addition substantial resources and time
ldquoStrong fiscal accountability and transparency are also likely to reduce or prevent corruption thus leading to more efficient spending of public resourcesrdquo
Cross-cutting policy options
87
are needed for the development of the necessary IT systems for accounting purposes data analytics and information management For example over the course of five years together with the World Bank Rijeka in Croatia planned and transformed its financial management and accounting system to one based on transparent accrual accounting and improved accountability155
Implementation obstacles and solutions
Lack of local technical administrative or financial capacity may prevent necessary improvements to municipal financial management There may also be vested interests that do not want increased transparency These obstacles or challenges may be addressed through adequate capacity-building programmes and well-defined action plans aimed at improving governance structures with clearly defined auditing and control functions
Belize has identified a need to address fiscal accountability as one factor that could contribute to improvements in municipal management Despite beginning the process of decentralisation in the 1990s there has since been little impact as local authorities do not have the technical administrative or financial capacity to manage funds and powers effectively The World Bank worked alongside the Belize government to leverage grant resources from the Public-Private Infrastructure Advisory Facility (PPIAF) to support capacity-building around fiscal management Key activities included conducting a diagnosis of fiscal conditions training practitioners in financial management revenue collection use of financial management software and designing a new accounting approach that included balance sheets156
This case of Belize demonstrates the absence of basic accounting procedures in many countries and cities and the importance of supporting policies for example information and capacity-building (see policy option G5) to support improvements in fiscal accountability
In Cape Town South Africa despite significant efforts to decentralise powers to local authorities poor sector budgeting is significantly limiting urban development decisions Current reporting of spending
is ineffective (often done in a highly technical manner) resident participation occurs after decision-making and there is no clear public framework that outlines the process of spending decisions This in turn leads to a lack of trust in the local authority and further lowers public participation To address this the Development Action Group convened a number of civic organisations to discuss a range of issues but all were centred on the absence of accountability From this measure two civic coalitions were created These held workshops and developed resolutions to improve accountability while encouraging greater civic participation via their web-based platform This case in Cape Town demonstrates the importance of stakeholder engagement as well as the value of providing a platform for local people to query and challenge public fiscal spending as well as bridging key knowledge gaps157
F3 Improved creditworthiness
Description
Creditworthiness is essentially an opinion by third parties mainly lenders on whether debt service payments will be made fully and on time A lender that has confidence in the long-term financial strength of the borrower and in the ability and willingness of the municipality to pay its obligations in full and on time will regard that municipality as creditworthy
In order to attract private financing cities must demonstrate that they are a viable investment proposal that they are able to effectively manage their own finances and are transparent in this process Improving the creditworthiness or the credit rating of a city is a gradual process partly limited by factors external to the city such as the wealth and credit rating of the national authorities However there are measures a city can take to strengthen its creditworthiness
155 See World Bank Institute (2013) 156 World Bank (2017) 157 See Kumar and Fester (2019)
Cross-cutting policy options
88
A city seeking to improve its creditworthiness should focus on improving conditions in the following five broad categories
bull economic conditions for example municipal income levels and economic diversification
bull financial management including transparency administrative capacity professional management of debt and liquidity
bull budgetary performance or operating balance
bull budgetary flexibility for example own-source revenues
bull current level of debt debt servicing requirements and other liabilities
While some of these dimensions are difficult to change in the short term a city may develop a creditworthiness action plan as a start This allows the city to set a current baseline and realistic ambitions and aims as well as identify problematic and priority areas that need to be addressed Key areas may include managing expenditure developing a pipeline of public infrastructure projects to be funded and undertaking its own lsquoshadowrsquo credit rating assessment
An official municipal credit rating issued by a well-recognised rating agency has several benefits Beyond improving access to private financing it represents and guides a process aimed at improving the financial management of a municipality This also provides valuable information to the benefit of central authorities and potential donors It also further enhances the accountability of the city management as it clearly shows the financial rigour of the municipality
Resource implications and key requirements
A creditworthiness enhancement programme is not difficult to develop but is challenging to implement It is also important to remember that improving the creditworthiness or the credit rating of a city is a gradual process For example Zaprešić in Croatia
has worked to improve its creditworthiness since the establishment of a local treasury system in 2012 The city was assessed in 2016 as having a low credit risk with a high level of budget liquidity and has been placed in the top 5 per cent of exceptionally transparent local budgets in Croatia158 159
In Uganda Kampalarsquos improvements in municipal revenue can be attributed to the work undertaken by local authorities since 2012 to improve its creditworthiness delivered through a city-wide strategic plan Despite the citys growing economy Kampala has faced significant financial problems including poor revenue collection weak governance and reliance on government transfers This limited the cityrsquos ability to invest in improving its local services and implementing infrastructure projects In light of this situation a strategic plan was developed to strengthen the governance and service delivery The plan identified key areas to target including human resource development better record management and stronger monitoring processes
To improve its administrative capacity the city received assistance from the World Bank and PPIAF enabling the Kampala authorities to develop more robust accounting approaches The plan was extremely successful and in one year Kampala managed to increase its revenues by 86 per cent However as identified creditworthiness is a continuum this requires continuous effort and commitment to financial management
Implementation obstacles and solutions
Pursuing a credit rating can be an administratively and technically challenging task as it requires addressing any gaps or weaknesses in financial management Cities can seek support from the national level or through the capacity-building programmes of international organisations for example the C40 Cities Finance Facility Incorporating a resourcing timeline into a creditworthiness action plan allows cities to effectively manage their staff and budgets for this process
External factors may include an unstable wider economy and as the national assessment forms an
158 See World Bank Group and Government of Austria (2018)159 See City of Zaprešić Finance and Budgeting Department (nd)
Cross-cutting policy options
89
89
element of a credit rating this may impact a cityrsquos ability to obtain private finance Improving these external factors can be beyond the remit of a city However active stakeholder engagement with the national government and other surrounding cities or municipalities can enable the sharing of best practice and improvement of wider conditions
F4 Financial incentives or financial support schemes for green investments
Description
Local governments can help provide financial incentives and funding in support of green investments Such support schemes can include targeted subsidy schemes like the Seoul solar panel programme It can further include the setting-up of municipally owned or funded green banks or the setting-up of investment funds (for example the Melbourne green investment fund) that can provide green loans or dedicated risk-sharing facilities for private banks Local authorities may also work with local banks in order to facilitate green lending solutions with little or no financial contribution from the city
One example is Frederikshavn Denmark which developed specific soft loans for the energy renovation of housing to meet its climate change targets A new product was developed by the municipality in agreement with local banks featuring lower interest rates and a longer maturity period relative to typical market conditions The municipality does not allocate any funds to the financing scheme Instead soft loans are provided by the partner banks that bear all the risk They run a creditworthiness check of homeowners to decide who gets a loan and under what conditions
Resource implications and key requirements
Providing financial incentives will require budgetary commitments and may be administratively demanding for the local government Significant technical capacity will also be required to identify how to configure and apply incentives Incentives can target lower income brackets of the population to address
social equity concerns associated with energy poverty Both the central and local policy frameworks need to accommodate the setting-up of incentive and funding schemes by local authorities
Potential private-sector participation
Local governments can work with commercial banks to provide financial incentives therefore sharing or shifting the financial burden from the public to the private sector
Implementation obstacles and solutions
The provision of direct financial support is financially demanding for local governments and can target fuel-poor homes It is good practice to undertake a comprehensive cost and benefit analysis of retrofitting to zero carbon for all households that are in fuel poverty and provide targeted funding for these homes160 One of the first programmes to tackle energy poverty was the Warm Front programme in the United Kingdom A total of 23 million households received assistance from the scheme Grants were offered for improvements such as loft insulation cavity wall insulation and heating system improvements161
The success factors associated with energy efficiency measures include gaining and maintaining consumer trust an effective communication and marketing strategy training and qualification schemes to ensure that worker qualifications keep pace with the technical complexity of buildings and the targeting of trigger points such as household renovations or sales162
The provision of financial incentives and favourable financing should only come after energy efficiency building codes have been enacted and adequate enforcement and compliance mechanisms are in place for building construction and retrofits
160 See National Assembly for Wales (2018) 161 See UK Parliament (2013)162 See Committee on Climate Change (2016)
Case studies - mobility and transport
90
Case studies - mobility and transport
91
05
Case studies
Case studies - mobility and transport
92
Integrated urban mobility Burgas Bulgaria
Burgas has sought to reverse a legacy of car-centric urban transport through a cohesive policy on mobility A rapid transit bus system integrated transport management greater accessibility and lower costs for using public transport are among the measures introduced
Snapshot
bull Location Burgas Bulgaria
bull Population Small ndash 202000 (2017)
bull Policy area Transport
bull Policy options Parking pricing restrictions information and enforcement pedestrian-oriented and car-restrictive policies pro-cycling policies planning and regulation of public transport services
bull Financial capacity Limited
bull Administrative capacity Strengthening
Context and policy overviewBurgas is easily accessible by car and connected by two highways to other cities Consequently private vehicles are the most popular form of transport in 2016 58 per cent of city residents used a personal
car and 37 per cent used public transport)163 However the municipality of Burgas recognised the adverse environmental and social impacts of this system and introduced policies to address them including a Sustainable Urban Mobility Plan (SUMP) for the period 2014-20 The city engaged stakeholders to contribute to the SUMP and considered three scenarios The chosen approach called for the city to (i) develop a dense network of high-speed bus lanes (ii) increase the use of public transport and (iii) boost the number of bicycle parking areas and lanes164
ImplementationThe municipality introduced a number of measures under its Integrated Urban Transport Project In 2015 the city began implementing a project to create an intelligent transport system that would improve the safety efficiency and convenience of the public transport network The plan included integrated ticketing and video surveillance of the network165
First in 2018 commuters obtained real-time access to information on buses and trolley buses
163 See ICLEI ndash Local Governments for Sustainability (2016)164 See Stoyanova (2014)165 See ICLEI ndash Local Governments for Sustainability (2016)
Case studies - mobility and transport
93
166 See Go to Burgas (2020)167 See EcoMobility SHIFT (nd)168 Ibid 169 Ibid 170 See EcoMobility SHIFT (nd)171 Ibid 172 See ICLEI ndash Local Governments for Sustainability (2016)173 See Braun (2017)
The electronic boards at bus stops were also made more informative
Second the city rolled out modern buses and smart intersections This included the introduction of 60 new buses running on compressed natural gas (CNG) and diesel to operate over the improved transport infrastructure The new vehicles replaced the cityrsquos oldest buses greatly improving the service and its reliability with reduced emissions and maintenance costs and more attractive public transport166
Third Burgas introduced paid parking charges in central areas of the city It also restricted the access of cars to the main administrative area and market converting those parts of the city to a pedestrianised zone A ldquoring and riderdquo service was provided for disabled individuals and for children167
Lastly the city constructed a complete cycling network adding 20 km to the scheme already in place and introduced a public bike-sharing scheme
To enable the implementation of these measures Burgas has sought to increase its administrative capacity including systematic policy planning targeted funding and the participation of residents The city set aside euro60 million from its municipal budget to implement the programme and obtained funding from international bodies such as the EBRD In addition the local public transport company has its own budget and receives contributions from the national government168
Public transport is free for certain groups (for instance individuals over 65 children people with disabilities) This measure cost the city euro2 million in 2012 and therefore it was imperative to obtain funding from other sources169
Results and lessons learnedThe Integrated Urban Transport Project achieved the following outcomes
bull The ring-and-ride support scheme was used more than 20000 times in its first year170
bull The ike-sharing scheme has had more than 5000 subscription contracts with daily users171
bull The city has seem reductions in air pollution and GHG emissions related to the modal shift in the transport sector
Despite these success stories Burgas remains a predominantly car-centric city In 2016 more than half of all journeys were made in private vehicles while cycling represented just 3 per cent of the modal share172 In order to foster a local cycling culture Burgas is planning campaigns including the Bike2Work scheme173
Links to similar initiativesFreiburg integrated mobility policies Lund eco-mobility policies Strasbourg integrated multi-modal transport
Case studies - mobility and transport
94
Snapshot
bull Location Strasbourg France
bull Population Small ndash 277000 (2015)
bull Economy Service economy
bull Policy area Transport
bull Policy options Pedestrian-oriented and car-restrictive policies pro-cycling policies planning and regulation of public transport services
bull Financial capacity Strong
bull Administrative capacity Strong
Context and policy overviewIn Strasbourg during the 1980s the growing use of private vehicles was increasing congestion air and
noise pollution as well as the number of accidents174 In the 1990s cross-border traffic with Germany was an additional problem given that Strasbourg sits on the busiest road link between Baden and Alsace In 1990 approximately 240000 vehicles per day were present in the city centre This congestion was exacerbated during the peak holiday seasons when visitors flocked to Strasbourg to see its historic buildings and monuments175
To address these issues Strasbourgrsquos Urban Mobility Plan also known as the first plan de circulation176 laid out initial ambitions for reducing the use of private vehicles The main aim was to build two new tramlines that would serve the city centre To facilitate this engineering project Strasbourg implemented a number of transit-oriented policies These included
bull a trial-period extension of the traffic-free precinct in Central Strasbourg ndash which was later made permanent
Integrated multi-modal transport Strasbourg France
Driven by a longstanding ambition to improve air quality Strasbourg has been removing private vehicles from the city centre while facilitating the uptake of active and public transport The city has achieved this through a mix of policy options detailed in its Urban Mobility Plan
174 See European Commission (nd)175 Ibid 176 See Strasbourgeu eurometropole (2015)
Case studies - mobility and transport
95
bull limited or altered vehicular access to the city centre for example by only allowing access through a number of loops rather than through direct connections between one district and another
bull increased fees for inner-city parking
bull the introduction of cyclist-only or pedestrian-only zones
bull the introduction of park-and-ride sites alongside tramway lines to facilitate transit-oriented development and better connectivity
The main goals of the approach were to
bull invest in transport to encourage economic development and trade in the city
bull regenerate Strasbourg to increase the quality of life and protect the environment
bull provide equal services to communities improving social cohesion
bull produce a multi-modal and coordinated system which would decrease the number of private cars in the city
ImplementationThe policy approach was guided by the Urban Transportation Planning Document (PDU) which covers Strasbourgrsquos transport policies for 10-15 years as required by national law to address air quality issues The guidance document is seen as a tool for encouraging local authorities to integrate their transport policies into broader city planning policy
Three private consultancy firms developed the PDU Its eventual adoption required ratification from all municipalities in Greater Strasbourg (CUS) the CUS Council the regional and national governments and civic organisations The tramway department and the Compagnie des Transports Strasbourgeois were responsible for assessing and reviewing the progress of the plan and its impact
These institutions acted as major levers for the policyrsquos implementation and financing CUS had significant governance powers as the organising authority achieved through devolution from the national level The state implemented structures to allow local authorities to manage mass transit services This currently enables CUS to coordinate transit with urban planning processes and service provision
The main sources of funding for public transport systems are the national government regional and local authorities The local authority supplies financing through a transport tax the versement de transport which places a levy of 1 per cent on private wages paid within the Greater Strasbourg area177 Although the tax does not provide full financing for all the projects it is of benefit The system cost euro97 million which worked out at a reasonable industry cost Most parking measures are delivered through public-private partnerships between the city and businesses
Barriers and critical success factorsThe mayoral contest held before the implementation of this plan centred on urban planning changes The winner Catherine Trautmann was strongly motivated to carry out the plan and to recruit a more diverse team of professionals into the public bodies tasked with delivering the programme
There was strong opposition to the scheme particularly from businesses operating in the city centre who believed that the policies would result in a loss of income Moreover they were concerned that works to install the trams would restrict access even further These negative sentiments resulted in the creation of an opposition campaign However the local authority worked hard to develop an engaging communications strategy that would allay peoplersquos fears
The new mayor brought the political vision required to make the plan acceptable among residents Her campaign was built on transforming the cityrsquos transport system and despite opposition she continued to pursue this goal throughout her term
177 See The Princersquos Foundation for the Built Environment (nd)
Case studies - mobility and transport
96
Due to this opposition Strasbourg undertook an extensive consultation process with local residents businesses and associations There was also an accompanying awareness-raising campaign by the city authorities and transport operator The campaign sought to shift entrenched travel behaviours and was supported through a communications strategy with a city symbol (Bruno the bear) to add a face to the campaign
Strasbourg established a phone line to deal with complaints more efficiently and personally The communications strategy also provided regular updates to residents keeping the community involved
Furthermore the city provided landscaping to improve the quality of the environment along routes through social housing projects This work helped to gain support for the transport plan
Results and lessons learnedThe overall PDU programme generated 30 jointly developed managed and funded projects 15 of which focused exclusively on improved environmental protection
Following the implementation of policies outlined in the Urban Mobility Plan by 2000 the number of vehicles in the city centre had fallen by 16 per cent178 to a third less than the figure that would have been expected on the basis of population growth Strasbourg achieved this success despite an overall increase in traffic volumes across the municipality However this traffic reduction in the city centre may have resulted in a transfer of traffic to surrounding roads
Nevertheless data for the tramlines do indicate that more people shifted to using public transport During its first year Tramline A carried 68000 passengers a day potentially contributing to a 17 per cent reduction in traffic entering the area
Furthermore contrary to initial expectations pedestrianisation increased property values and trading figures as the quality of life increased And by 2015 125 jobs had been created across these projects
Strasbourgrsquos Urban Mobility Plan offers lessons for other cities that hope to implement similar initiatives First building an engaging and relatable communications strategy is key to driving change particularly if a programme faces fierce opposition Second this strategy should involve extensive stakeholder engagement while tailoring the communications to the chosen audience In particular the benefits for each group must be made clear and communicated Third any communications strategy must not be a one-off but rather a continuous dialogue
Links to similar initiativesLjubljana car-free zone Seoul transit-oriented development
178 See European Commission (nd)
Case studies - mobility and transport
97
Shifting from transport to mobility Moscow Russia
The Greater Moscow region has successfully implemented a large-scale programme to increase the efficiency of its transport system Measures to cut traffic and shift journeys to public transport modes have reduced the number of cars in the region by 25 per cent compared to 2012
179 See Maltcev (2017)180 See Moscow Transport (2017)
Snapshot
bull Location Moscow Russia
bull Population Large ndash 123 million (2017)
bull Policy area Transport
bull Policy options Planning and regulation of public transport services road-user charges parking pricing restrictions information and enforcement car-sharing car-pooling and ride-sharing
bull Financial capacity Strong
bull Administrative capacity Strong
Context and policy overview In 2010 a new Moscow city government was established At the time traffic congestion was high
during peak hours public transport was ineffective (with inconvenient routes and low quality of service) and the city lacked space for pedestrians and cyclists These problems were exacerbated by the fact that many residents commuted to the city centre via the Moscow ring road To tackle these challenges the Moscow authorities have been implementing a large-scale programme since 2010 to increase the efficiency of the cityrsquos transport system179
A new programme called the ldquoDevelopment of the Transport System 2012-2016 and Further Prospects for 2020rdquo was launched in 2012 with a budget of US$ 80 billion until 2020180 The programme included a number of measures such as development of the metro traffic improvements the creation of bicycle and pedestrian spaces the promotion of car-sharing services and the creation of a smart transport system
The effect of investment at this scale was tremendous with 80 new rail and metro stations a complete renewal of the bus fleet and a significant renewal of the tram and metro fleets
Case studies - mobility and transport
98
181 See Maltcev (2017)182 See Liksutov (2018b)
ImplementationThrough the programme the construction of new metro stations was intensified (18 new stations came into operation between 2010 and 2016) Furthermore an electronic travel card the Troika was introduced It uses payment methods such as Apple Pay and works on all public transport in Moscow Some 249 additional kilometres of road lanes were designated for public transport and 75 per cent of the public transport fleet was renewed
The city government reduced private car use in the centre of Moscow by building parking places near metro stations Heavy goods vehicles were restricted from entering the city centre between 6am and 10pm alleviating congestion Car-sharing businesses were also set up The city introduced an intelligent transport system (ITS) with a budget of US$ 17 billion for the period 2012-20 Digitisation has played a key role in updating Moscowrsquos transport network Public transport operators use mobile applications to provide route-planning options for passengers and by 2018 80 per cent of all taxi bookings were made via smartphones181
Barriers and critical success factorsThe city transport department recognised that one of the main challenges with regard to the uptake of public transport is the difficulty of competing with the comfort of private cars To tackle this issue the department has been upgrading its own fleet purchasing more than 8000 new vehicles and 1600 new metro train cars (all manufactured domestically) By the end of 2017 37 per cent of all metro carriages were new along with 90 per cent of the aboveground transport fleet Today public transport is more accessible with 98 per cent of aboveground vehicles suitable for use by disabled passengers Electronic ticketing systems a successful city bike hire system (the volume of journeys made using this system doubled between 2015 and 2017) bus lanes CCTV to improve passenger safety and regulation of the taxi industry have also played key roles
The introduction in 2013 of the Troika transport card ndash which allows seamless transfers between all types of aboveground public transport ndash has been a further success with more than 85 per cent of trips being paid for through this system 182 More recently the city
Case studies - mobility and transport
99
has also introduced contactless payment through mobile phone payment systems183
Moscow has been using data and technology to provide a better service and to gain more insights from transport customers and other residents In 2020 the city launched an online portal for capturing feedback to help inform priorities for the next investment cycle184
Overall political will has been key in enabling Moscow to improve the efficiency of its transport system Sergey Sobyanin the mayor appointed in 2010 made upgrading the Moscow transport network one of his key priorities In addition the transport programme tackled the issues holistically seeking to improve parking road infrastructure public transport infrastructure and the ITS185
Results and lessons learned
bull Commuter traffic in the Greater Moscow region increased by 600 million trips or 12 per cent between 2010 and 2016 Over the same period the city saw a 37 per cent increase in the percentage of economically active residents using public transport186
bull Travel time from the ring road to the centre has fallen by 20 minutes over the past 10 years187
bull The improvement in traffic speeds benefited non-drivers as well average dwell times were halved for public transport passengers and reduced by more than a quarter for taxi passengers188
bull Moscow became a TomTom Traffic Index Parking award winner in 2016 when the
average time spent searching for a parking space had been reduced by 65 per cent In the 2013 version of the TomTom Traffic Index Moscow traffic ranked as the worst in the world but by the 2017 edition it was in sixth place27 Based on these achievements in 2016 Moscow won an International Transport Award from the International Transport Forum for tackling traffic congestion190
The experience of Moscow offers lessons for other cities seeking to upgrade their transport systems Above all the cityrsquos experience shows that public transport must be safe reliable and convenient in order to be a credible alternative to private vehicles
Links to similar initiativesRotterdam customer-centric public transport Seoul demand-side policies for transit-oriented development Paris public transport integration Tallinn subsidised public transport
183 See Liksutov (2020)184 Ibid185 See Maltcev (2017)186 Ibid187 See Liksutov (2020)188 See Maltcev (2017)189 See TomTom (2020)190 See International Transport Forum (2016)
Case studies - mobility and transport
100
Snapshot
bull Location Freiburg Germany
bull Population Small ndash 227000 (2017)
bull Policy area Transport
bull Policy options Pedestrian-oriented and car-restrictive policies pro-cycling policies planning and regulation of public transport services
bull Financial capacity Strong
bull Administrative capacity Strong
Context and policy overviewFreiburg is a city in which public transport and bicycles are the prevailing methods of transport
From the 1950s to the 1970s Freiburg saw an increase in private transport However in 1969 with its First Transport Plan Freiburg switched away from policies focusing on private transport to ones that took a more holistic view of the urban community In the early 1970s this change saw the planning of an integrated cycling network and a new car-free pedestrian zone in the centre of the old town191 Moreover faced with traffic congestion city officials decided to maintain and develop rather than remove their tram system
In the 1980s Freiburg introduced traffic-calming zones to all residential neighbourhoods to discourage the use of cars in residential areas For instance parking schemes were introduced with limited long-term parking and increased parking fees Neighbourhood associations backed this policy
Implementation The city has ensured that the tram is a convenient mode of transport for residents The tram system is
Incentives to use public and active transport Freiburg Germany
In a quest to cut traffic congestion and environmental pollution Freiburg has sought to reduce the cityrsquos reliance on cars by better integrating affordable and convenient alternatives such as walking and cycling Today more than one-third of residents do not own a car
191 See Buchler and Pucher (2011)
Case studies - mobility and transport
101
constantly being extended with new lines built and existing ones prolonged as needed This has resulted in 65 per cent of Freiburg residents having a tram stop within 300 metres of their home192 Affordability has been another concern for the city which chose to combine affordable public transport charges with a mobility card model in the 1980s
Freiburg has doubled the use of bicycles since the 1980s thanks to a number of pro-cycling policies The average annual budget for bicycle facilities has been euro836000 since 1976193 In 2011 bikes accounted for 27 per cent of all journeys194 The city has more than 400 km of well-connected cycle routes with more than 9000 cycle parking spaces in the centre of Freiburg and at bike-and-ride locations at bus and tram stops
The city also recognised the importance of having an integrated mass transit system throughout the urban area Using planning and design it created a ldquocity of short distancesrdquo enabling high levels of public transport use cycling and walking Investment in the transit system and measures to encourage cycle use were coupled with restrictions on car use through road design and traffic and parking management measures195
New developments such as Rieselfeld and Vauban were developed around tram lines and both districts limited car access and parking All streets were traffic calmed at 30 km per hour or less and were well connected to Freiburgrsquos cycle network and tram system In Vauban more than 70 per cent of households do not own a car Car owners have to purchase a parking space in a multistorey car park on the outskirts of the development costing US$ 25000 plus a monthly service charge196
Resource implicationsNeither of these developments required a contribution from the city budget Both were designed to be self-financing plans with costs being covered by income received from selling serviced plots of land to
cooperatives individuals and small builders Freiburg also has a betterment levy which allows the city authorities to access one-third of the increase in value on the sale of open land197
The city was able to realise its ambitions to control car use partly due to changes in federal government funding reforms in the 1970s During this period municipal governments were given greater autonomy to direct transport funding as they wished The state of Baden-Wuerttemberg also funded the initial trial of Freiburgrsquos flat-rate monthly travel tickets198
192 Ibid 193 See Whitelegg (2014)194 See ICLEI (2011)195 See World Habitat Awards (2013)196 See Buchler and Pucher (2011)197 See World Habitat Awards (2013)198 See Buchler and Pucher (2011)
Case studies - mobility and transport
102
199 Ibid 200 See ICLEI (2011)
Overall the cityrsquos policies have had the effect of shifting the relative costs of car ownership and use compared to those of public and active transport modes199
Barriers and critical success factorsThe plan faced initial resistance from many residents especially those who lived in the suburbs Developers also had a negative response to Freiburgrsquos approach demanding fewer restrictions on how they developed the city These problems were overcome by the city having a clear strategic direction with good communication and engagement with local communities Moreover an increase in service levels and modes of public transport contributed to reducing the percentage of private transport
Citizen participation has been a critical element of the cityrsquos transport planning since the 1970s and was a significant driver in the shaping of Vauban into a car-free neighbourhood Freiburg developed its land-use plan in collaboration with the community with 900 participants
Results and lessons learnedThe city successfully reduced the prominence of cars while increasing the use of sustainable transport modes More specifically it achieved the following impacts200
bull Freiburg has the lowest car density of any city in Germany (423 per 1000 people) Annual car trips have hardly increased over the last 15 years even while the total number of trips of all forms has increased by 30 per cent
bull In the 1990s the use of public transport doubled with 200000 residents using the four tram lines and 26 bus lines
bull The total number of cycling trips each year has nearly doubled
Freiburg is internationally recognised to be a leading green and sustainable city Its successful transition to sustainable modes of transport offers valuable lessons for other municipalities and cities globally First public acceptance of car-restrictive measures is closely linked to the cost and quality of the alternatives provided Residents are more likely to substitute their car ride for a tram journey if the tram is reliable clean and affordable Second active stakeholder engagement is important in order to overcome (and even prevent) opposition to sustainable transport policies Residents businesses and civil society groups must be given a voice and listened to Third the availability of national funding ndash for example to subsidise ticket prices for a limited period of time ndash can help to introduce new services and limit the costs for city authorities
Links to similar initiativesBologna eco-mobility policies Lund eco-mobility policies Strasbourg integrated multi-modal transport
Case studies - mobility and transport
103
Snapshot
bull Country Slovenia
bull Population Small ndash 287000 (2015)
bull Policy area Transport
bull Policy options Pedestrian-oriented and car-restrictive policies pro-cycling policies
bull Financial capacity Strengthening
bull Administrative capacity Strong
Context and policy overviewBetween 2002 and 2012 Ljubljana experienced a 52 per cent increase in car use while also witnessing a 23 per cent decline in the use of public transport
In 2011 the modal share of public transport stood at just 13 per cent while cars accounted for 67 per cent
To reverse this trend Ljubljana adopted a new Sustainable Mobility Plan (SUMP) in 2012 The plan sought to limit personal motor vehicle traffic and instead give greater priority to pedestrians cyclists and public transport201
When introducing the plan the city set itself concrete targets to increase walking by 20 per cent cycling by 40 per cent and bus journeys by 50 per cent all the while reducing car journeys by 20 per cent For 2020 the modal split envisioned was one-third public transport one-third non-motorised mobility and one-third private vehicles202
To achieve these targets the SUMP proposed a broad mixture of policy measures that are outlined below
Pedestrianisation and car-free zones Ljubljana Slovenia
In 2012 Ljubljana adopted a plan to restrict private motorised transport and promote sustainable forms of mobility By introducing new technology improving public spaces and upgrading the bus network the city achieved a significant increase in public transport use and greater uptake of walking and cycling
201 See European Union (2015) 202 See Civitas (2013)
Case studies - mobility and transport
104
203 See Jovičić (2019)
ImplementationLjubljana implemented numerous measures across various policy areas to limit motorised transport and promote sustainable mobility In terms of pedestrian-oriented and car-restrictive policies the city
bull set up an eco-friendly zone which closed the old city centre to traffic and restricted deliveries to the mornings
bull made Slovenska Street a traffic artery more pedestrian friendly by improving accessibility and refurbishing the surrounding area This entailed planting 63 young ash trees along a 400-metre stretch which also attracted local wildlife
Moreover Ljubljana implemented several supporting policies such as the establishment of five new park-and-ride facilities the purchase of 32 new CNG buses and the introduction of an electric tourist train In order to further promote cycling the city also manages 220 km of dedicated cycle routes and rolled out a public bike hire scheme (Bicike) which comprises 36 stations and 360 bikes
In addition to improve the convenience and efficiency of public transport use the city introduced real-time arrival displays for the bus network as well as a smart travel card the Urbana card
Funding for many of the projects under Ljubljanarsquos SUMP has come from the EUrsquos Cohesion Fund at a national level but Slovenia plans to switch to its own financing from 2020 This will require changes to national legislation and financing and the carrying out of engagement and awareness campaigns203
Barriers and critical success factorsSeveral factors contributed to the success of the SUMP First due to continuous awareness-raising campaigns the city was able to take new policy measures year on year As part of its communication efforts Ljubljana also hosted the European Mobility Week in 2003 and 2013 This is Europersquos largest mobility campaign designed to encourage city administrators to introduce sustainable transport policies
Case studies - mobility and transport
105204 See CityLab (2016) 205 See Istenič (2016) 206 See City of Ljubljana (2020)207 See ICLEI (nd)208 Ibid
Second the mild climate and the flat topography of the city make it ideal for cycling all year round This has helped Ljubljanarsquos bike-sharing scheme to succeed
Third from a political point of view mayor Zoran Janković chose to implement the bigger more controversial changes such as banning cars from the city centre within his first year of office This meant that the inconveniences associated with the implementation of the SUMP would be over early on and residents and initial critics could experience the benefits of cleaner air safer streets and quieter public spaces by the time the next election campaign came around204 This strategy showed success Mr Janković has since been re-elected three times
Results and lessons learnedThrough the implementation of its SUMP Ljubljana achieved a significant uptake in public transport and active mobility options
With regard to public transport the city saw
bull an 185 per cent increase in public transport use between 2010 and 2014
bull 17 per cent more city bus users since 2011
bull a 34 per cent increase in journeys on regional buses between 2013 and 2014
Moreover 98 per cent of city residents think that the shared bike scheme is a positive idea and it has seen close to three million journeys in its first four years of implementation
Ljubljana has also successfully transformed from a car-friendly to a pedestrian-friendly city in turn bringing down pollution levels Through the SUMP
bull pedestrian surfaces were increased by 620 per cent through closing the city centre (100000 m2) to all motorised vehicles205
bull the city centre is now used for cultural social and sporting events throughout the year The renovation of Slovenska Street reduced black carbon levels by 70 per cent and PM 25 levels by 58 per cent while the concentrations on surrounding streets have not increased206
In recognition of all the above results the city received the bronze Access City Award from the European Union in 2015 The award identified Ljubljana as one of Europersquos leading cities in terms of accessibility to public spaces and public transport207
These impacts also had a direct positive effect on peoplersquos wellbeing In 2015 the European survey on quality of life (Eurobarometer) found that 92 per cent of Ljubljana residents were very satisfied or satisfied with the quality of life in the city208
The success stories in Ljubljana clearly offer valuable lessons for other cities First Ljubljana did not take an isolated approach to combat rising numbers of private vehicles and the associated detrimental environmental effects Instead it implemented a balanced mixture of policy measures to achieve a modal shift Second it can be beneficial for politicians to implement controversial measures early on so that the positive impacts of initiatives are visible by the time the next elections are due
Links to similar initiativesCopenhagen active transport policies Lund eco-mobility policies Freiburg active transport policies
Case studies - mobility and transport
106
Snapshot
bull Location Lund Sweden
bull Population Small ndash 92000 (2018)
bull Economy Service economy
bull Policy area Transport
bull Policy options Pedestrian-oriented and car-restrictive policies pro-cycling policies
bull Financial capacity Strong
bull Administrative capacity Strong
bull Other Supportive national policy
Context and policy overviewIn 2017 just two years after the Paris Agreement Sweden committed to becoming carbon neutral by 2045209 one of the first countries in the world to commit to such a target Overall environmental awareness has grown rapidly in Sweden since the
1970s and this has also been reflected in Lundrsquos environmental policy
In 1999 the city developed a new Environmental Code which streamlined all previous environmental acts and included concepts such as the polluter-pays principle210 Since the 1970s the city has been implementing a series of hard and soft measures to improve transport management in particular
Today the city has a well-developed transport plan (LundaMaTs) which it has further developed to consider wider environmental economic and social sustainability (LundaMaTs II) The long-term ambition of this plan is to encourage the use of active transport (walking cycling and public transport) while also reducing the use of private vehicles
All measures have been supported by suitable levels of funding as well as a highly engaged motivated and well-educated population211
Promotion of active transport Lund Sweden
Over the last 10 years Lund has implemented a series of pro-cycling and pedestrian-friendly transport policies leading to a decrease in car use and a rise in the uptake of active transport options
209 See UNFCC (2017) 210 See Baltic Environment and Energy (2007) 211 See CiViTAS (2009)
Case studies - mobility and transport
107
Implementation The small size of Lund (2575 kmsup2) lends itself to active transport and with significant green space the city is an attractive environment for pedestrians212 The measures taken to facilitate the LundaMaTs transport plan were a broad mixture including rezoning the establishment of partnerships education and awareness campaigns the redesigning of outdoor spaces and pro-cycling measures
Rezoning The city initially carried out a series of rezoning measures including closing several streets and squares to vehicular traffic and limiting bus traffic to certain times of the day
Redesigning outdoor spaces The city recognised that the uptake of walking could be even greater for both disabled groups and non-disabled groups if Lund improved accessibility and made the cityrsquos open spaces safer with lighting through project proposals that could be included in a pedestrian management plan
Pro-cycling measures At the start of the programme cycling was already popular across the city and Lund is recognised as one of the most popular places to cycle in Europe The municipality undertook a mixture of policies to further capitalise on this popularity including
bull improvements to cycling infrastructure
bull bicycle traffic safety campaigns
bull establishing partnerships with the public and private sectors
In particular the infrastructure programme facilitated the construction of 260 km of high-quality bike lanes more than 5500 cycle parking spaces and multistorey parking and bike storage facilities with servicing at the central train station213
Partnerships Partnerships between public and private institutions and transport and traffic companies have been established in Lund
The city has supported these measures to improve active transport through
bull an online service that allows residents to compare different modes of transport in terms of their cost time environmental impact and health benefits It is an open-source service that enables users to contribute and has therefore become a co-produced map
bull measures to improve the public transit system The bus system is coordinated across the region and provides frequent local services connecting 400 bus stops over 11 lines The train system from neighbouring Denmark is similarly unified under one ticketing system
212 See ICLEI (2011) 213 See CiViTAS (2009)
Case studies - mobility and transport
108
Lund has had significant municipal and national government funding for the measures mainly due to the wider national ambitions of Sweden The level of annual funding for active transport in Lund is difficult to estimate However a basic budget equivalent to approximately GBP 300000 is spent on maintenance Projects to improve provision are additional costs ndash for example the equivalent of GBP 2 million for the creation of tunnels and an investment of more than GBP 71 million between 1998 and 2005 as part of the LundaMaTs programme214 One source states that funding has varied between GBP 15 million and GBP 5 million215
Results and lessons learnedThe LundaMaTs programme consisted of a mixture of policies implemented over a decade which allowed the city to adjust to the changes to spread out the costs and to create long-term behavioural shifts among residents
In 2011 43 per cent of all trips in Lund were taken by bicycle and in the preceding decade there was no increase in car use In fact in 2010 there was a measured drop of 2 per cent in the kilometres travelled annually by car compared with the levels seen in the previous year216
Moreover improvements in accessible design led to a halving of the number of deaths and injuries from
traffic accidents The city aims to have no deaths and injuries in the future
Looking ahead the already well-connected bus network will be further supported by the introduction of a tram network that is due to open in December 2020217 to facilitate faster public transport greater capacity and an environmentally cleaner system
The experience of Lund shows that a balanced and well-thought-out mixture of policies implemented over a longer period can help to facilitate behavioural change among residents and to address funding constraints
Links to similar initiativesAmsterdam mobility plan European Commission report on cycling Copenhagen cycling strategy
214 See Warren (2010) 215 See Transport for London (2014)216 See ICLEI (2011)217 See Railway Gazette (2020)
Case studies - mobility and transport
109
Snapshot
bull Location Copenhagen Denmark
bull Population Large ndash 602000 (2017)
bull Policy area Transport
bull Policy options Pedestrian-oriented and car-restrictive policies pro-cycling policies
bull Financial capacity Strong
bull Administrative capacity Strong
Context and policy overview Like many other cities in Europe Copenhagen experienced a major rise in private car ownership and use from 1945 to 1975 This brought about a corresponding decrease in bicycle use and an increase in levels of traffic and pollution
However in the 1970s a number of factors including the oil crisis led the city government to prioritise cycling in Copenhagen218219
This strategy entailed various planning infrastructure and financing measures and has helped Copenhagen to attain the status of being one of the worldrsquos leading cycling hubs
ImplementationAs part of its plan to be CO2 neutral by 2025 Copenhagen has set itself the goal of becoming the worldrsquos best city for cycling To achieve this it has deployed a policy mix of planning infrastructure and financing measures
Planning measures Bicycle planning is now an integrated feature of urban development and urban governance in Copenhagen The city has developed various policy planning and strategy documents addressing different aspects of cycling through targets implementation and funding The most important documents include
Cycling strategy Copenhagen Denmark
Copenhagen achieved a shift from being an increasingly car-centric city in the 1970s to one in which cycling is now becoming the norm for most inhabitants While cycling in Denmark has decreased by 30 per cent since 1998 in Copenhagen it has risen by 30 per cent
218 See Urban Sustainability Exchange (nd)219 See Ruggieri (2017)
Case studies - mobility and transport
110
220 See Urban Sustainability Exchange (nd)221 See The City of Copenhagen Technical and Environmental Administration Traffic Department (2011)
bull the Copenhagen Cycle Policy (2002-12)
bull the Copenhagen Transport and Environment Plan 2004
bull the Copenhagen Bicycle Strategy (2011-25)
bull the Copenhagen Cycle Priority Plan (2006-16)
Infrastructure measures There is a large amount of cycling infrastructure in Copenhagen aimed at improving the safety and convenience of cycling through a network of segregated bike paths dedicated bicycle traffic lights separated coloured bike paths where cars and bikes share road space and parking for bicycles and cargo bikes Cargo bikes are used for transporting children and shopping and are often an alternative to car ownership
Financing measures Copenhagen allocated euro80 million to implement its bicycle strategies and infrastructure between 2010 and 2014220
Barriers and critical success factorsThe main barrier to establishing Copenhagen as a bicycle-friendly city was the rise of private car use from the 1950s onwards To improve the situation the city integrated cycling into its planning and policy ensuring that there were sufficient resources to support the policies Copenhagen has also promoted a culture of cycling which has been central to the success of the strategy
A critical success factor has been the single Technical and Environmental Administration within the city government as it enables a ldquoone-stop shoprdquo approach to urban and transport planning The administration works collaboratively with an open work culture reducing conflict between urban and transport planning
Results and lessons learnedCopenhagen successfully managed an urban transformation process from being a car-centric city in the 1970s to becoming a global role model for bicycle-
oriented planning Through a variety of measures the city achieved impressive results221
bull The number of daily bicycle trips increased from 110000 in 1970 to 150000 in 2015 (a 36 per cent modal share) Copenhagen plans to increase this further to 240000 by 2025
bull Since 1998 the city has seen a 30 per cent increase in total kilometres cycled and a more than 33 per cent rise in cyclingrsquos modal share for work or educational trips
bull Bicycles are increasingly used even for trips with heavy shopping or children and 17 per cent of households have a cargo bike
bull The bicycle is now the most popular form of transport for Copenhagenrsquos commuters
Today cities around the world look to Copenhagen for guidance and inspiration when it comes to designing and implementing pro-cycling policies The lessons learned from Copenhagen can be summarised under two areas governance and political leadership and commitment
Governance Copenhagen has successfully reduced and minimised conflicts between urban and transport planning by taking an integrated approach across departments and agencies
Political leadership and commitment In Copenhagen cycling is increasingly the norm for the majority of residents Promoting a culture of cycling and supporting that with sufficient resourcing and planning commitments has been crucial to this success
Links to similar initiativesMuenster policy to promote cycling Burgas cycling measures Utrecht cycling city of the Netherlands
Case studies - land use
111
Snapshot
bull Location Stuttgart Germany
bull Population Large ndash 628000 (2016)
bull Economy Service economy
bull Policy area Land use
bull Policy option Promotion of green spaces and biodiversity
bull Financial capacity Strong
bull Administrative capacity Strong
Context and policy overviewStuttgartrsquos geography and economic base heavily influence its air quality A mild local climate low wind speeds and a valley basin location combined with industrial activity and high traffic volumes all contribute to poor air quality222
Climate projections for the period 2071-2100 predict a 2ordmC increase in mean annual temperatures for the
city And projections for heat waves ndash defined as temperatures exceeding 30degC ndash suggest that heat stress will be a significant issue with more than half of the Greater Stuttgart area experiencing at least 30 days of heat stress by 2100 Low-lying areas could experience more than 60 days significantly increasing the risk to local people223 Moreover ongoing development of valley slopes surrounding the city hinders air flow exacerbating poor air quality and the urban heat island effect
Stuttgart has a decades-long legacy of climate mapping air-quality data collection and local climate assessment began in the 1930s As air quality worsened into the 1970s the city began a more focused campaign to address this problem224
Adapting to climate change and mitigating its effects remains a political priority The city adopted its first climate change mitigation strategy in 1997 and has since supplemented this with an adaptation strategy adopted in 2012
The main goal of these strategies is to improve air quality and reduce the urban heat island effect by channelling flows of cool air via ventilation corridors from the hills towards urban areas in the valley basin
Green ventilation corridors Stuttgart Germany
Stuttgart developed a climate atlas that maps temperatures and cool air flows in and around the city This information helps develop planning and zoning regulations to both protect open spaces and incorporate new ones into dense urban areas
222 See WWF (2012) 223 See European Environment Agency (2014)224 See WWF (2012)
Case studies - land use
112
The climate atlas for the Stuttgart region was initiated in 2008 It provides a spatial overview of the region and includes the assessment of 179 towns and municipalities225
ImplementationThe atlas illustrates the movement of cold air and the levels of various air pollutants It also establishes eight types of local climate typology with associated planning and zoning recommendations to protect open spaces and to promote the creation of new ones especially in built-up areas For example the climate atlas prohibits construction in cold air ventilation corridors and any other open spaces that have a large effect on the local climate The Atlas recommends additional greening for developed areas in locations that have a significant effect on the climate Further planning principles include the following226
bull Buildings must be surrounded by open space and there must be a larger interconnected network of open spaces
bull Valleys hills and hillsides may not be built on
bull Urban sprawl should be avoided
bull For industrial buildings air pollutants that would affect the surrounding settlements should be avoided
Collaboration and public participation underpin the implementation of the climate atlas which was developed and funded in a partnership between the city regional authorities and climate experts227 To increase the programmersquos public appeal and participation the city also provided financial assistance for the private installation of green roofs and encouraged residents to adopt and care for a tree228
Barriers and critical success factors The following success factors have contributed to the successful improvement of air quality and to mitigation of the urban heat island effect229
bull The consolidation by the atlas of critical details of the regionrsquos geography climate and land use has faciliated precise planning for different areas
bull The cityrsquos increased internal capacity to conduct climate research has created valuable knowledge of the local environment This has allowed Stuttgart to act on specific information rather than relying on general principles and has rendered the cityrsquos efforts more effective Furthermore this concrete knowledge applied
225 See City of Stuttgart (nd)226 See WWF (2012)227 See European Environment Agency (2014)228 Ibid 229 Ibid
Case studies - land use
113
over decades has enabled Stuttgart to regulate development and land use to intentionally create a region-wide system of air flows
bull The atlas has shown that existing regulations (such as the German building code) can also be used to further promote climate-related planning recommendations
bull The partnership between the Office for Environmental Protection and the City Planning and Renewal team in Stuttgart has meant that the recommended green infrastructure solutions were implemented through spatial planning and development control
Results and lessons learnedHaving initiated subsidies for green roofs since 1986 Stuttgart now mandates them on new developments As a result the green roof market has had a significant boost230 Stuttgart is now a leader in the field with more than 300000 m2 of green roofs More than 60 per cent of Stuttgartrsquos land area is green open space In addition at 39 per cent of the total land area the city has the highest percentage of protected land of any city in Germany These green spaces include 5000 ha of forested land 65000 park trees and 35000 street trees Through a concerted strategy in place since the 1970s the city has integrated green areas into a large green corridor People can now travel from the royal gardens in the city centre to forests at the edge of Stuttgart exclusively via green spaces231
Recent changes to the climate atlas prohibit development in ventilation corridors and on the hills surrounding the city Plans set out in the cityrsquos 2010 Land Use Plan to develop more than 60 ha of these areas have now been halted in order to protect green spaces232
Using financial support provided by the city about 60000 m2 of green roofs have been installed and nearly 500 trees have been paired with citizens in a tree adoption programme These volunteers water the
trees report on pest infestations and remove fallen leaves branches and dog excrement233
The climate atlas concept has been replicated in other cities across Germany and internationally For example Berlin has developed an environmental atlas and Kobe Japan has created an environmental atlas to inform measures that support air circulation from the sea during the day and from the mountains during the night234
Links to similar initiativesTirana green belt policy Novi Sad green living concept Hamburg green roof strategy Liverpool mapping green infrastructure Antwerp green tool
230 See Mees (2014)231 See European Environment Agency (2014)232 See WWF (2012)233 See European Environment Agency (2014)234 See WWF (2012)
Case studies - land use
114
Snapshot
bull Location Barcelona Spain
bull Population Large ndash 16 million (2016)
bull Policy area Land use
bull Policy options Development of compact cities promotion of mixed-use areas and transit-oriented development promotion of green spaces and biodiversity community-based land planning
bull Financial capacity Strong
bull Administrative capacity Strong
Context and policy overview The municipality of Barcelonarsquos ldquoCitizen Commitment to Sustainability 2012-2022 ndash Compromiacutes 22rdquo agenda promotes engagement and collaboration to create a more liveable and sustainable city More than
800 local organisations have signed the document235 One of the aims of the Commitment is to place the individual at the centre of decision-making in city planning with an increased focus on small-scale interventions236 The ldquoLetrsquos fill the streets with liferdquo programme was initiated to prioritise access to public space for people rather than vehicles The programme centres around public participation237
Barcelonarsquos Climate Plan 2018-2030 builds on the Commitmentrsquos aims with ldquosuperblocksrdquo seen as a means of fulfilling the planrsquos goal to increase green space and cut GHG emissions238
The cityrsquos 2013-18 Barcelona Urban Mobility Plan (UMP) also sought ldquoto promote positive communal relations between people as well as social cohesion wellbeing and public healthrdquo and promoted superblocks239 Moreover the new Urban Mobility Plan 2019-2024 includes plans to significantly expand the superblocks programme across the entire city240
Urban planning with superblocks Barcelona Spain
The municipality of Barcelona in partnership with the Urban Ecology Agency developed the innovative ldquosuperblocksrdquo project to address local challenges such as air pollution noise traffic road accidents health issues and a lack of green space
235 See Ajuntament de Barcelona (nda)236 See Energy Cities (2016)237 See Ajuntament de Barcelona (ndb)238 See Ajuntament de Barcelona (ndc)239 See Ajuntament de Barcelona (ndd)240 See Ajuntament de Barcelona (nde)
Case studies - land use
115
ImplementationThe superblocks programme redefines public space giving priority to people greenery and human interaction while minimising the space allocated to roads and vehicles Superblocks consist of a small grid of blocks and roads (approximately 400 m x 400 m) with cars vans scooters and other vehicles restricted to the outer perimeter roads (unless the drivers are residents or delivering to local businesses in which case their maximum speed should be 10 kmh) The city has expanded cycle lanes and initiated an orthogonal-grid bus network using main thoroughfares only241 Superblocks are intended to function as mini-neighbourhoods creating opportunities for leisure sports and social interaction
The approach was first tested in the neighbourhood of Poblenou in 2015 There the initiative has transformed public space with 75 per cent of the area that was once occupied by cars now freed up for cycle lanes benches and room for residents to interact and children to play242 Four new 2050 m2 public squares have also been introduced
So far Barcelona has completed six superblocks and the Urban Ecology Agency (BCNEcologia) a public consortium within the city council has set out plans to develop 503 more superblocks across the city
Barriers and critical success factorsWhile there have been some criticisms for instance about the inconvenience to drivers as a result of complicated rerouting the occupants of superblock areas have tended to welcome the changes243
Following the Poblenou test case the city learned important lessons that were carried through into the development of later superblocks For example a lack of sufficient funding to develop the superblock and an initial failure to engage local stakeholders created some opposition and animosity244
Strong clear communication between planning authorities and residents is recognised as being essential to increase the acceptability of the projects Public engagement and participation throughout the planning stages also create a sense of ownership and emotional attachment to the areas for the people who will use the spaces Participatory processes take both those involved in design and policy as well as the communities on a shared journey that is likely to culminate in a joint and mutually acceptable vison for Barcelona
Furthermore during the process of developing and designing the superblock spaces a willingness to experiment and to learn by doing allows people to evaluate the changes as they engage with the spaces This enables simple low-cost no-regret interventions to bring about rapid changes in behaviour and the environment These can then lead to investment in more permanent changes to the public realm a clear demonstration of value creation for the neighbourhood Superblocks are open projects since the completion of the Poblenou project any proposed action undergoes a participatory process involving local residents and organisations to ensure social acceptance The outcomes of the implementation process are different in each block as each neighbourhood has its own preferred approach characteristics economic activity density and so on245
The superblocks initiative is simple but its effects have been transformative The project is low-cost and relatively quick to carry out with no physical changes
241 See Bausells (2016)242 See PublicSpace (2018)243 See Bloomberg (2017)244 See Serena (2018)245 See Bausells (2016)
Case studies - land use
116246 See C40 Cities (2016b)247 Ibid 248 See Publicspace (2018)249 See C40 Cities (2016b)250 See Mueller (2020)
required and with a strong dialogue between city authorities and residents being the major driver of success
Results and lessons learned
bull Building on the initial experiment in Poblenou the municipality has now created superblocks in five pilot neighbourhoods with plans for many more Through these projects the city hopes to achieve emission reductions of between 20 per cent and 75 per cent
bull The superblocks initiative is part of the cityrsquos Urban Mobility Plan which aims to decrease traffic by 21 per cent while extending car-free spaces and providing 300 km of bicycle lanes In the Poblenou superblock vehicle numbers on the inner streets have fallen by 58 per cent while traffic around the periphery has increased by only 26 per cent More than 300 benches have been installed and 212 new trees planted
bull The project has increased the amount of green space by 1 m2 per capita reduced the heat island effect and noise pollution and improved air quality
bull The superblocks provide car-free places that are safer and more enjoyable for children and older people These areas also foster social interaction sports and cultural activities and expand opportunities for small businesses
bull Quality of life has improved in the city making Barcelona a more attractive destination for business and tourism
bull The initiative is scalable and could be applied to new developments as well as to regeneration projects
bull A recent study found that if all 503 of the proposed superblocks were implemented almost 700 premature deaths could be prevented annually (mainly due to reduced pollution levels) and life expectancy could be increased by almost 200 days per resident These outcomes could result in economic savings of euro17 billion a year
The experience of superblocks in Barcelona has shown that initial opposition to such projects must be expected but can be overcome through strong engagement and communication tailored to the specific circumstances of a neighbourhood
Links to similar initiativesAmman 2025 from master plan to strategic initiative Transformation of Tiranarsquos New Bazaar Beijing low-carbon zoning policies
Case studies - land use
117
Snapshot
bull Location Roubaix France
bull Population Small ndash 96000 (2015)
bull Economy Service economy
bull Policy area Land use
bull Policy options Promotion of mixed-used areas and transit-oriented development promotion of community-based land use planning
bull Financial capacity Strong
bull Administrative capacity Strong
Context and policy overview Together with the Lorraine region Nord-Pas de Calais was a cradle of the industrial revolution in France While coal mining and steel industries developed in the region Roubaix ndash one of the four major cities in Nord-Pas de Calais ndash built its industrial prosperity on textile manufacturing However in the early 1970s the
textile industry fell into crisis and 50000 jobs were lost in Roubaix and the surrounding areas251
The decline of the cityrsquos textile industry created a host of interlinking challenges including unemployment low skill levels urban decay housing market collapse poverty inequality violence and racism252 As a way to tackle these issues and attract the middle classes back to the city Roubaix identified a series of strategic objectives253
bull recovery from deindustrialisation by encouraging the growth of new sectors
bull revitalisation of the rundown city centre and rebuilding of a retail offer
bull addressing the need for better more affordable housing for residents and attracting new residents and
bull ensuring that investment and economic development benefit existing residents especially by providing training and new employment opportunities
Urban regeneration and renewal Roubaix France
The city of Roubaix has successfully followed a market-led approach to urban renewal which integrates issues such as social inclusion housing renewal and economic and cultural development
251 See Cadell et al (2008)252 See Rousseau (2009)253 See Colomb (2007)
Case studies - land use
118
Reneacute Vandierendonck was elected mayor of Roubaix in 1994 with a political mandate to revitalise the city centre The mayorrsquos strategy was implemented in a changing political and economic context Lille Metropolitan Authority (LMCU) ndash an intercommunal cooperative body with investment-related responsibilities transferred from its 87 individual member municipalities ndash started to play a strategic role in developing a vision for economic development and urban regeneration LMCU also initiated a series of long-term agreements with the mayors of the regionrsquos four big cities which led to the emergence of a consensus and a grouping together of budgets254
The resulting strategy Ville Renouveleacutee (ldquorenewed cityrdquo) includes a spatial plan for metropolitan Roubaix and aims to reverse urban decline and create value for residents and investors The concept became one of the key objectives of the 1997 strategic plan for the Lille metropolitan region and also informed French national urban policy255
ImplementationRegeneration of the city centre was planned across five key areas256
bull creating secure and successful public spaces which enhance the architectural legacy of Roubaix
bull improving the retail offer and establishing the city centre as a commercial destination
bull designating zones including enterprise zones to channel economic development into strategic areas
bull launching a cultural strategy to promote Roubaix as a cultural destination
bull renewing the cityrsquos housing stock
Improvements to the public realm were designed to entice investment businesses and shoppers to the
city centre These actions included (i) regenerating the main central square and its civic buildings (ii) regenerating public spaces and streets while respecting the local architectural and industrial heritage (iii) regenerating the Canal de Roubaix (iv) promoting the painting of faccedilades in bright colours to break up the grey industrial image of the city and (v) improving safety for instance through additional policing and CCTV257
To improve the city centrersquos retail offer the city council established a small core of commercial opportunities through improvements to the streetscape design improvements in public transport interchanges for the metro tram and bus financial and technical support such as tax exemptions for people interested in opening retail shops and grant to support the refurbishment of buildings Two large retail outlet centres were also opened on the outskirts of the city The designation of Roubaix as a Zone Franche Urbaine (tax-exempt enterprise zone) in 1997 brought tax-break incentives and helped promote business and job creation These measures helped to spread the benefits of the renewal programme across the city and its communities258
Barriers and critical success factorsKey to the success of Roubaixrsquos regeneration was the strong city-regional relationship in which political cooperation developed in the early 1990s Beginning in 1994 with the mayoral tenure of Reneacute Vandierendonck collaboration increased between the city and the LMCU The regeneration benefited from outstanding civic leadership and vision both at the city-regional level and at the level of the city of Roubaix itself The sharing of budgets between the regions also facilitated more collaborative opportunities The regeneration process in Roubaix was also heavily influenced by the fact that the various urban social and economic regeneration elements were carried out in parallel within a concentrated period of change It was the synergy between these elements that made the process a real success259
254 See Cadell et al (2008)255 See Colomb (2007)256 Ibid257 Ibid258 Ibid259 See Colomb (2007)
Case studies - land use
119
Investment in the public realm housing and communities as well as job creation and business incentives also increased the desirability of the city and attracted people to return there to live and work The cityrsquos cultural policy also helped to enhance Roubaixrsquos image enabling the celebration of its cultural and social history while creating a dynamic modern environment and attracting younger wealthier people and even tourists
Resource implicationsRoubaix has been used as an experimental area for all urban policy initiatives taken by successive local governments across the country since the birth of urban policy in the early 1980s This has created a relatively complex combination of schemes and funding but has also meant that the city has used all possible programmes While the city had a weak tax base it was able to tap into substantial funding from the central government and the LMCU One of the challenges for the Lille city-region has been leveraging funding from many different levels (for instance EU national and local levels) to finance a clear and coherent approach to metropolitan regeneration
Results and lessons learnedThe strategy has brought meaningful improvements in the public realm to central Roubaix from quality infrastructure such as housing unified paving street furniture cleanliness and coloured facades to jobs skills and business opportunities The middle classes have returned to the city the property market has recovered and the cityrsquos image has been transformed
Roubaix now has a standardised system to conserve and refurbish industrial buildings that date from the industrial revolution Alongside the improved public realm these initiatives have supported the re-emergence of retailing in the town centre
Today Roubaix has many important cultural amenities including La Piscine museum which saw the cityrsquos old public swimming pool converted into
an internationally known cultural venue thanks to an innovative regeneration programme260
Local leaders have also crafted a strategy for cultural regeneration against great odds The Ministry of Culture awarded Roubaix the title of Ville drsquoArt et drsquoHistoire only one of 59 cities to earn the title Similarly a range of factors including a better nationwide economic climate the impact of the tax-exempt zone and improved links between economic development and local employment has cut unemployment from 33 per cent in the 1980s to 22 per cent in 2005261
Furthermore people have moved to Roubaix and invested there As central Lille became more expensive Roubaixrsquos improved city centre became more appealing not least thanks to its proximity ndash only 20 minutes away by metro train following the completion of a new line The many renewal strategies featured in the programme have also benefited vulnerable groups in particular in terms of local employment opportunities262
Links to similar initiativesRotterdam urban regeneration Gothenburg urban regeneration Christchurch urban regeneration
260 See Guardian (2008)261 See Colomb (2007)262 See Cadell et al (2008)
Case studies - land use
120
Snapshot
bull Country Toronto Canada
bull Population Large ndash 29 million (2017)
bull Policy area Land use
bull Policy option Development of compact cities
bull Financial capacity Strong
bull Administrative capacity Strong
Context and policy overviewA strong development market in Toronto has led to a spate of high-rise construction especially residential condominiums and office buildings With the establishment of a protected greenbelt area rising land values a buoyant real estate market and population and employment growth developers have a strong incentive to build projects that are taller and
denser than those preferred by local government and city residents
To address this issue bonusing in relation to height and density has become an important tool in Torontorsquos urban planning over the past twenty years According to Section 37 of the Ontario Planning Act of 1990 developers are allowed to propose a new building larger than would be permitted by existing land controls in exchange for the delivery of community benefits263
The provisions of Section 37 usually apply to developments if they have a gross floor area exceeding 10000 m2 and if the applicant proposes to exceed the permitted density by 1500 m2 or more andor increase the permitted height of the building264
ImplementationCity leaders and planners use density bonuses to entice private developers to create public benefits
Density bonusing and development Toronto Canada
Toronto has applied density bonusing to secure community benefits in exchange for approval to build taller and denser buildings Parking improvements public art and funds for new daycare facilities and affordable housing are among these benefits
263 See Pantale (2014)264 Ibid
Case studies - land use
121
265 See City of Toronto (nd)266 Ibid267 See Moore (2013)268 See Lehrer and Pantalone (2018)269 See RE Millward amp Associates Ltd (2013)270 See Moore (2013)
This has been particularly useful in situations where development will create additional demand on infrastructure or the public realm and where there is a lack of public resources to make improvements Torontorsquos regular use of Section 37 has provided funds for open spaces public art affordable housing and childcare facilities265
Developers and city planning staff negotiate Section 37 benefits on a case-by-case basis Once the planning team has completed its review the application for development goes for consideration by the community council This period includes public consultation and the opportunity to formally register comments about the development and related Section 37 benefits If approved by the community council the application goes to the city council to render a final decision Once approved the Section 37 benefits are ldquosecuredrdquo and the city enters into a formal agreement with the applicant266
Given that restrictive frameworks may hinder development and community-building potential in a city the negotiation process under Section 37 has remained flexible in order to react to changing market demand and community needs
Developers can provide the Section 37 benefits through in-kind or cash-in-lieu methods The city has discretion regarding how to spend cash-in-lieu contributions Toronto secured around 850 Section 37 benefits in the period from 2009 to 2014 Some 55 per cent of these were in-kind contributions and 45 per cent were cash in lieu
Barriers and critical success factorsIn contrast to many other tools of municipal finance Section 37 benefits bring benefits primarily to the area affected by the development As a result the ldquodensity for benefit agreementsrdquo (DBAs) are heavily concentrated in the parts of Toronto that have had substantial development activity especially the downtown core Hence the number of benefits has been disproportionately high in wards with the most
DBAs which has led to an uneven distribution of policy outcomes
Since its inception the bonusing policy has experienced controversy and criticism from various actors in Toronto Points of criticism have included the allegedly inconsistent application of the policy disagreement over how funds should be spent the tendency to engender poor planning decisions and a negotiation process that has little public oversight267 Critics also note that the community benefits that the policy seeks have not been achieved in proportion to the developments created and their associated externalities268
To tackle these points the city council adopted a protocol for negotiating Section 37 community benefits through which it encouraged consultation with a variety of stakeholders during the assessment of community benefits Consultations would be held with elected representatives city council staff and the local community and decisions would be supported by evidence of community needs from previous studies269
Results and lessons learned270
bull Over a 15-year period Section 37 agreements generated more than euro220 million in benefits for Toronto
bull The range of benefits secured through the Section 37 process varied widely and included community facilities parks road improvement schemes public transport projects and arts and cultural facilities
Links to similar initiativesLondon density development Vancouver density bonusing New York inclusionary zoning
Case studies - energy and buildings
122
Energy manager obligation and white certificate scheme Italy
Since 2005 Italy has operated a market-based incentive scheme for energy efficiency interventions This ldquowhite certificaterdquo system has delivered substantial savings in the use of electricity and heat
Snapshot
bull Location Italy (nationwide)
bull Population 592 million (2019)
bull Policy area Energy and buildings
bull Policy options Industrial regulations and information to report on energy performance fiscal incentives for efficiency related to machinery and materials in industries
bull Financial capacity Limited
bull Administrative capacity Strengthening
Context and policy overview271
In the 1990s the industrial sector was responsible for approximately one-third of Italyrsquos energy consumption Initially the government responded by introducing rules requiring certain industrial firms and public sector organisations to nominate an energy manager
For industrial companies this rule applied if their energy consumption exceeded 10000 tonnes of oil equivalent (toe) per year and for public sector organisations the threshold was set at more than 1000 toe per year
While the new energy managers were effective in raising awareness of potential savings from energy efficiency industries and public bodies were not required to act in response to this newfound awareness The situation changed in 2005 when Italy introduced a market mechanism for energy efficiency investment called the Titoli di Efficienza Energetica (TEEs or ldquowhite certificatesrdquo) The TEE scheme obliged electricity and gas utilities with more than 50000 customers to reach specific targets in terms of primary energy savings The utilities could choose to deliver energy efficiency measures themselves or to purchase white certificates earned by other scheme participants as a result of energy efficiency savings The pool of scheme participants includes all those organisations that had been required to appoint an energy manager under the earlier scheme as well as other organisations with energy management systems in place This arrangement created a larger
271 See Thomas et al (2014)
Case studies - energy and buildings
123
pool of certificate ldquosellersrdquo which the utility firms could access to reduce the overall cost of their compliance It also ensured that energy managers with the required know-how were in place in every participating organisation272
The scheme involves a 12-month baseline monitoring period prior to the proposal of eligible measures and a 12-month post-completion monitoring and verification period before a firm or organisation submits an application for a TEE certificate
Implementation and challenges273
At first the scheme had a price cap of euro100 per TEE and more than 80 per cent of the energy efficiency savings were in the residential sector274 In 2012 the government introduced a durability coefficient ldquotaurdquo that allowed up to 336 TEEs to be earned per toe saved Subsequently the euro100 per TEE cap was removed and the scheme was able to leverage greater investment275
In 2013 Italy introduced a measure that prevented technologies that had previously benefited from other national support mechanisms from receiving support under the TEE scheme In 2017 the durability coefficient was abolished as it incentivised projects with a long technical life and other incentives were introduced The durability cofficient was replaced by a rule allowing scheme participants to front-load the attributable savings to the first half of the projectrsquos useful lifecycle276
In 2018 further modifications were made to increase the supply of certificates and to address concerns about fraud and the complexity of the scheme These modifications included changes to the assessment of additionality a two-year increase in the designated useful life of measures277 an expansion of the project eligibility criteria the creation of new pre-approved standardised solutions the flexibility to spread compliance across scheme years and the setting of a new definition of cumulativeness278
Barriers and critical success factorsTo increase overall energy efficiency savings and diversify measures away from the residential sector (which dominated the early years of the scheme) incentives were increased for industrial sector investments These included awarding a higher ratio of certificates to industry and removing the price cap for industrial sector savings which had resulted in higher market prices (euro427 per TEE in February 2018 for instance)279
272 Ibid273 See Energy Systems Catapult (2018) 274 See Di Santo (2018)275 See Qualenergiait (2017)276 See Gianni-Origoni amp Grippo-Cappelli Partners (2017)277 Ibid278 See FIRE Federazione Italiana per luso Razionale dellEnergia (2018)279 See Energy Systems Catapult (2018)
Case studies - energy and buildings
124
280 Ibid281 See Di Santo et al (2018) 282 Ibid283 See Di Santo et al (2018)284 See Energy Systems Catapult (2018)285 Ibid286 See Di Santo et al (2018)
Industrial sector energy efficiency was also supported by the EU Emissions Trading Scheme (ETS) but under this scheme the carbon price was not sufficient to drive significant investment in the sector However the white certificate scheme was able to supplement the EU ETS and achieve higher rates of investment and savings280 Regular modifications to the scheme were essential to its continuing reliability and effectiveness although these have at times created uncertainty and complexity281
Extensive data collection by the public Italian energy services operator GSE has helped to create a valuable database for assessment and for comparison with other schemes Furthermore strict monitoring and verification procedures have helped to identify and reduce fraud in the system
Defining the appropriate target that parties are required to meet is essential to the attractiveness and effectiveness of the scheme The wrong target could create low prices and make the scheme less attractive to voluntary members or create high prices for end-users and the potential for fraud282
Outcomes and impacts
bull The scheme has resulted in cumulative additional energy savings of 256 million toe and annual savings of around 2 million additional toe and 6 million tonnes of CO2283
bull Certifications under the scheme were initially dominated by the residential sector which accounted for 70 per cent of certified projects in the period 2011-12 By 2017 the industrial sector represented 54 per cent of projects due to the increase in
industry-focused incentives while the household sectorrsquos share fell to around 14 per cent284
bull In total 5807831 TEEs were certified by 2017 with total primary energy savings calculated at 192 Mtoe Most of those savings (55 per cent) came from cuts in primary energy use (natural gas) and a further 26 per cent from reduced electricity consumption285
Additional benefits of the scheme include the creation of around 11000 full-time equivalent direct and indirect jobs as well as a significant increase in knowledge about good practices in industrial energy efficiency across the energy industry286
Links to similar initiativesIrish large industry energy network Tokyo cap-and-trade programme White certificates in France
Case studies - energy and buildings
125
Energy performance contracting Berlin Germany
The Berlin Energy Agency initiated energy saving partnerships in 1996 to implement energy performance contracting and improve energy efficiency in public buildings using the established German ESCO market
Snapshot
bull Location Berlin Germany
bull Population Large ndash 35 million (2016)
bull Policy area Energy
bull Policy options Improved energy performance for public buildings policies and support for energy performance contracts
bull Financial capacity Strong
bull Administrative capacity Strong
Context and policy overviewIn the early 1990s the Federal State of Berlin faced a tight budget and a lack of financial resources Energy-related costs were high (approximately euro255 million per year) and there was potential for average savings of around 30 per cent287
In 1994 the Berlin Senatersquos Department for Health Environment and Consumer Protection set a CO2
emissions reduction target by 2010 it aimed to decrease CO2 emissions across all sectors by 25 per cent relative to the levels seen in 1990 Moreover the Department introduced an updated Climate Protection Concept which set a CO2 emissions reduction target of 40 per cent by 2020 relative to the 1990 levels
In this context the Berlin Energy Saving Partnership approach was initiated in 1996 by the Berlin Energy Agency (BEA) and the Federal State of Berlin The approach provides a framework for the project management of retrofits and tender preparation for renovation works guaranteeing energy consumption reductions that are based on energy performance contracting (EPC)288
BEA is a public-private partnership between the government of the federal state of Berlin the development bank KfW Bankengruppe and private stakeholders BEA acts as the independent project manager facilitating and managing the process from baseline to contract negotiation289
287 See Berliner Energieagentur (2006) 288 Ibid289 See Citynvest (2015)
Case studies - energy and buildings
126
ImplementationThe necessary investments are made by a private energy service company (ESCO) the contractor and refinanced by the energy costs saved The contracting authority may combine a selection of its building stock into a so-called ldquobuilding poolrdquo which can be comprised of town halls schools swimming pools or administrative and service buildings BEA plays the role of project aggregator bringing together a number of buildings from four to as many as 150 which are then classified as a pool via an EPC tender This consolidation of buildings into packages encourages interest from multiple competent ESCOs and ensures good levels of competition and expertise
Since 1996 BEA has successfully launched and supervised 26 energy saving partnerships covering more than 1400 public buildings and more than 500 private properties in Berlin alone Contractors have so far invested in excess of euro50 million in energy retrofits Energy saving measures have included the renewal and optimisation of building energy and ventilation control systems the replacement of gas boilers and the installation of combined heat and power systems The Berlin Energy Agency accompanies energy saving partnerships from the conception of a project to the realisation of the energy performance contract and is also responsible for the monitoring process290
The energy contracting model is well established in Germany The public sector remains an important client group for EPC with significant ongoing potential for projects The overall market size for energy contracting has been estimated at more than euro4 billion with energy performance contracting representing around 15 per cent of this market The general suitability of public buildings is high due to stable patterns of use openness to longer contract durations (more than 10 years) and extensive experience of EPC in the German market At the same time the percentage of EPC projects in the private sector is growing with a strong focus on hospitals and healthcare but also significant activity in the services sector and industry EPC is less common in the residential sector due to a number of barriers such as the lack of a legislative framework the complexity of tenure and uncertainty with regard to estimating energy reductions291
Barriers and critical success factorsGermany has enjoyed a high level of political commitment to ESCO and energy efficiency projects The country has one of the most mature ESCO markets in Europe However the general legal framework for energy performance contracting in residential buildings is currently not very supportive292
290 See Berliner Energieagentur (nd b)291 See Boza-Kiss et al (2017)292 See Berliner Energieagentur (2019)
Case studies - energy and buildings
127293 See GEF and UNDP (2010) 294 See Berliner Energieagentur (2006)295 See Citynvest (2015)296 Ibid
Financing for projects is available including risk mitigation instruments which are backed by appropriate due diligence procedures and standardised processes With 50 per cent funding from the Federal State of Berlin BEA is able to make financially attractive offers to property owners BEA also helps to raise awareness among customers ESCOs energy auditors and so on
Moreover the energy saving partnership is not limited to large building complexes The grouping of smaller projects into pools means that transaction costs are reduced293
Berlin has considered developing an Energy Saving Partnership Plus concept aiming to extend partnerships to include building renovation and insulation measures such as heat insulation and window replacement Furthermore Berlinrsquos Energy Saving Partnership model has been transferred to other local authorities due to its low impact on the public balance sheet and its moderate staffing requirements294
Results and lessons learnedThe Energy Saving Partnership has proven to be a successful model for reducing energy consumption and improving efficiency in the cityrsquos public buildings Outcomes include the following
bull Over the first fifteen years of the programme the average annual investment was euro35 million which supported energy efficiency measures in an average of nearly 100 buildings per year295
bull The scheme delivered an average of 26 per cent savings in energy costs for building owners with some individual schemes achieving savings as high as 40 per cent296
The Berlin experience demonstrates the potential of energy performance contracting to delivery substantial energy savings However it also highlights the challenges faced by municipalities seeking to deliver energy efficiency investments without additional financial support from a higher-tier authority
Links to similar initiativesStuttgart ESCO market Czech Republic ESCO market Slovenia ESCO market European ESCO market
Case studies - energy and buildings
128
Snapshot
bull Location Seoul South Korea
bull Population Large ndash 99 million (2018)
bull Policy area Energy and buildings
bull Policy options Policies promoting renewable electricity generation improved building energy codes and labelling financial incentives or financial support schemes for green investments
bull Financial capacity Strong
bull Administrative capacity Strong
Context and policy overviewFollowing the Fukushima nuclear disaster of 2011 the Seoul Metropolitan Government (SMG) launched a two-stage ldquoOne Less Nuclear Power Plantrdquo initiative in 2012 with the aim of reducing energy consumption and increasing renewable energy production Through
the first phase which ran from 2012 to 2014 SMG reduced energy demand by 2 million tonnes of oil equivalent (toe) corresponding to the annual generation capacity of one nuclear plant
The second stage of the initiative targeted the transition of around 4 million toe of energy to renewables As part of these efforts in November 2017 SMG developed the 2022 Solar City Seoul plan to accelerate solar installations
Through this plan SMG has strived to expand the citywide deployment of solar energy units on public buildings By 2022 it hopes that solar panels will generate a total of 243 MW across all suitable public buildings and land in Seoul297 In addition to the work on municipal buildings SMG plans to expand the residential solar market by adding 551 MW of solar capacity to one million households including 540000 apartment balconies 90000 rental homes and 370000 buildings Other initiatives such as solar landmarks and smart energy districts are to increase the target to 1 GW298
Solar City Seoul Seoul South Korea
Seoulrsquos metropolitan government plans to deploy 1 GW of solar photovoltaic power for residential and municipal buildings By 2022 every public building and one million homes in the city are set to be solar-powered thanks to the Solar City Seoul project
297 See The Korea Times (2018)298 See Seoul Metropolitan Government (2017)
Case studies - energy and buildings
129
ImplementationSMG provides a number of incentives to households to facilitate the uptake of solar energy For instance it was the first municipality in South Korea to pay a city-level subsidy for small solar power plants with an output of 50 kW or less since the nationwide feed-in tariff was abolished in 2011 due to the related fiscal burden Subsidies are in place for the installation of mini-solar panels reducing the upfront cost by 80 per cent In addition SMG launched the Energy Self-reliant Village programme in 2012 attempting to inspire a shared vision of energy self-sufficiency in urban and rurual communities
Furthermore in 2015 SMG set up a government-backed fund called the Solar Power Generation Citizensrsquo Fund for solar projects Residents of Seoul can subscribe to the fund to earn a guaranteed annual return of 4 per cent Land rental concessions are also available to solar power cooperatives installing photovoltaic (PV) systems in unused spaces
that are leased from SMG at low rental rates299 In addition since 2018 newly built public apartments have been required to install a mini PV facility and existing apartments have continued to receive an installation subsidy
In order to promote the concepts developed for Seoul SMG plans to create solar energy landmarks and special solar energy districts that it can market as tourist attractions SMG also plans to transform Magok a western neighbourhood of the city into a smart energy district by promoting an urban energy paradigm in cooperation with Korearsquos major energy firms Moreover SMG has launched various information and training campaigns to promote solar energy
bull The Sunshine City Seoul campaign was developed during the first stage of the One Less Nuclear Plant programme
bull The Seoul Solar Map was developed to show the potential capacity for solar power in buildings and houses
bull Seoul organised school campaigns in which students were selected to be leaders in energy-saving and volunteering activities
bull The city established the Seoul Energy Dream Centre that would achieve 100 per cent energy self-sufficiency and serve as a learning centre for students and other residents
bull The Seoul Solar Expo which took place in August 2018 and was free to attend invited solar energy companies to exhibit and held a solar design competition along with various hands-on events300
Lastly in 2018 SMG set up support centres called Seoul Solar Centres which provide one-stop services for installation and maintenance Free consulting services will be provided as well as a School for Energy Start-ups which will provide training for people who want to set up a solar energy business301
299 See LEGCO (2017) 300 See Seoul Metropolitan Government (2018b)301 See Seoul Metropolitan Government (2018a)
Case studies - energy and buildings
130
Barriers and critical success factorsVarious factors have made the solar city plan a success including the following
bull The topping up and subsequent replacement of national subsidies with alternative sources of finance (such as subsidies and grants rental concessions for cooperatives) have incentivised the deployment of solar plants in residential buildings
bull The identification of sites suitable for solar plants such as public landmarks parking lots villages and districts in cooperation with energy companies has promoted Seoul as a role model for other cities and supported tourism
bull SMG has introduced solar mandates for new multiple-unit dwellings and commercial buildings helping to accelerate the deployment of solar panels
bull SMG has visibly demonstrated the cityrsquos commitment to renewable energy It has provided information for residents through a range of mechanisms such as school programmes expos design competitions support centres and training for start-ups all of which have supported residential solar PV installations
Results and lessons learnedCurrently 127 public buildings in Seoul have a total installed capacity of 38 MW 17 infrastructural facilities have a combined capacity of 38 MW 43 schools have a joint capacity of 18 MW and 12 MW of capacity has been installed on public parking lots In addition as of September 2018 a total of 161000 households had installed the PV facilities thereby generating a total of 210 MW annually
Including the new supply of 52 MW of solar power installed in 2018 and a total installation capacity of 210 MW the Solar City Seoul project has generated 237805 MWh of annual energy It has also reduced
greenhouse gases by 109 tonnes of CO2 and fine particulate matter by 276 tonnes This means that by the end of 2022 the cityrsquos capacity will need to be raised by a further 760 MW approximately in order to meet the projectrsquos 1 GW target
In 2019 Seoul was selected as the winner in the renewable energy category of the annual C40 Cities Bloomberg Philanthropies Awards in particular due to its efforts to become a global solar city
Links to similar initiativesToronto coal phase-out Porto Alegre local renewables Bristol smart energy policy
Case studies - energy and buildings
131
Snapshot
bull Location Tokyo Japan
bull Population Large ndash 135 million (2015)
bull Economy Service economy
bull Policy area Energy and buildings
bull Policy option Policies and support for energy performance contracts
bull Financial capacity Strong
bull Administrative capacity Strong
Context and policy overview302
Commercial and residential buildings in Tokyo accounted for more than 72 per cent of the cityrsquos CO2 emissions in 2013 This was primarily as a result of the high number of small to medium-sized commercial and industrial facilities (around 660000) that are concentrated in the city
The Tokyo Metropolitan Government (TMG) has set an interim GHG emissions reduction target of 30 per cent by 2030 which has subsequently been accelerated in the cityrsquos Environmental Masterplan to 38 per cent by 2030
Against this backdrop the programme of Carbon Reduction Reporting for Small and Medium Entities (CRR) was launched in 2010 with two core objectives
bull encouraging the owners and tenants of small to medium-sized commercial and industrial facilities to monitor their annual CO2 emissions
bull providing policymakers with data on the building stock and providing this back to building owners and the market
These goals are pursued by mandating for facility owners the submission of an annual report outlining CO2 emissions for the previous fiscal year Additional qualitative information on planned and implemented emissions reduction measures must also be submitted
Carbon reduction reporting programme Tokyo Japan
Tokyorsquos carbon reduction reporting programme mandates the reporting of CO2 emissions for small and medium-sized facilities which account for 60 per cent of total CO2 emissions in the cityrsquos industrial and commercial sectors
302 See C40 Cities (2017)
Case studies - energy and buildings
132
There is no single GHG emissions reduction target for the programme Instead reporting entities are encouraged to set individual emissions reduction targets Reports are publicly disclosed on the TMG website
The CRR contains both a mandatory and a voluntary component Reporting occurs as a regulatory obligation and as a voluntary measure to monitor CO2 emissions and allows facility owners to compare their performance to that of their peers
Implementation The CRR was launched in 2010 The scheme is based on the Tokyo Carbon Reduction Reporting Programme for existing large facilities which ran from 2002 to 2005 That programme was superseded by the mandatory cap-and-trade system also launched in 2010 The core metric by which facilities monitor and report their annual CO2 emissions is carbon intensity (kgCO2msup2)303
The CRR seeks to target owners of the roughly 660000 facilities in the metropolitan area For these facilities the threshold for mandatory reporting has been set at between 30 litres and 15 million litres of crude oil equivalent The reporting requirement also applies to businesses that own or operate multiple facilities with a total consumption exceeding 3000 million litres of crude oil equivalent Facilities with a consumption higher than this level are expected to participate in the citywide cap-and-trade programme304
In 2012 a low-carbon benchmark component was added after it became apparent that merely reporting would not be sufficient to motivate facility owners and tenants to reduce their energy consumption Benchmarks allow owners to determine how their facility currently performs relative to the mean performance of other buildings of the same type Later a Carbon Report Card initiative was added to enable prospective tenants to compare the energy and CO2 emissions performance of buildings305
The CRR provides a variety of incentives to both encourage participation in the programme and spur implementation of retrofitting measures
bull A programme participation certificate ndash the so-called PR Sheet ndash has proved to be a major incentive for voluntary participation
bull Small and medium-sized leased buildings that report consistently for more than three years and perform better than the average CO2 intensity benchmarks can earn the label ldquoLow Carbon Model Buildingrdquo
bull Advice and training on low-energy strategies is provided through free energy audits in-company training sessions with expert trainers and industry-specific courses on energy saving measures
bull Subsidies for energy saving equipment are available including a green leasing scheme and tax incentives for energy saving initiatives306
Improvements in emission reductions have not been uniformly significant across all building types For instance schools universities and entertainment venues have achieved significantly lower reductions
The programme has been notable in attracting many voluntary submissions This has improved the validity of the resulting industry benchmarks Approximately 93 per cent of CO2 emissions in reporting facilities are related to electricity use hence most emission reductions can be attributed to a decrease in electricity consumption Emission reductions observed over the period 2010-13 are largely attributable to the rationing of electricity caused by the closure of the Fukushima power plant However emissions have not rebounded since the full restoration of power supplies It should be noted that the increase in the carbon intensity of electricity has been largely due to the shift from nuclear to gas and coal307
303 See Nishida (2013)304 See Tokyo Metropolitan Government (2018)305 Ibid306 Ibid307 See C40 Cities (2017)
Case studies - energy and buildings
133308 Ibid 309 Ibid 310 See C40 Cities (2017)311 Ibid
The CRR used multiple strategies to increase the educational value of data collected through annual reports and thus to motivate enterprises to pursue improved energy efficiency308
bull The low-carbon benchmarks provide building owners and tenants with an overview of how their facility is performing compared to industry averages
bull The Carbon Report Card aims to encourage facility owners to improve their annual benchmark performance and to use report cards as green building labels
bull A series of tailored energy efficiency handbooks were provided to key industry leaders and aimed at facility supervisors in 27 types of business
The TMG has created several partnerships with key industry stakeholders to enable the recruitment of reporting institutions It has also reached out to corporate real estate agencies to secure their cooperation in raising tenantsrsquo awareness of CRR
Data verification is carried out by TMG including checks on previous energy consumption levels and CO2 emission reports (to check for anomalies year on year) Reporting organisations are contacted when errors are identified and data problems are rectified Additional verification is also carried out before the reports are made publicly available309
Barriers and critical success factorsLandlords have faced challenges in obtaining the relevant energy data from tenants to comply with reporting requirements This was addressed by a rule change allowing the publication of only CO2 emissions intensity (not of actual consumption) and allowing building owners to provide estimates where actual data was not readily available
TMG officials were unable to achieve widespread disclosure of energy consumption data due to industry
resistance Public disclosure of energy consumption figures would deliver a more positive and meaningful message than data on CO2 emissions
Despite the strategies taken to increase awareness and participation a 2015 survey of 1149 small and medium-sized enteprises found very low levels of awareness about some of the additional initiatives related to the CRR Officials have also encountered challenges in engaging corporate tenants with energy efficiency issues In addition many recommendations provided in free energy audits are not implemented due to the splitting of incentives between owners and tenants TMG officials have collaborated with real estate agencies to conduct tenant seminars on CRR participation and effective energy efficiency measures310
Results and lessons learned311
bull The number of organisations participating in the voluntary reporting scheme grew by 60 per cent over the five years from 2010 to 2015
bull Over a five-year period the companies reporting achieved an average CO2 emissions reduction of 13 per cent and cut energy use by 18 per cent
bull The reports provide a valuable database of energy efficiency measures being taken by SMEs For example they identify high penetration levels in terms of low-energy lighting water saving devices and cooling-loss reduction for refrigerated food displays Reports cover both physical measures and behaviour change initiatives
Links to similar initiativesTokyo cap-and-trade programme Carbon disclosure project
Case studies - energy and buildings
134
Snapshot
bull Location Tartu Estonia
bull Population Small ndash 101000 (2000)
bull Economy Industrial economy
bull Policy area Energy and buildings
bull Policy option Decarbonisation of district heating supply
bull Financial capacity Strong
bull Administrative capacity Strong
Context and policy overviewEstoniarsquos energy system is dominated by the use of shale oil for electricity while heating is provided by a mix of sources including local biomass and imported fossil fuels312 Meanwhile around 45 per cent of heating demand is met through district heating networks313
The country is committed to reducing carbon emissions through its adopted National Energy and Climate Plan 2030 The plan includes a commitment to reduce carbon emissions by 70 per cent by 2030 relative to a 1990 baseline and to ensure that renewables account for 42 per cent of final energy consumption314 Meanwhile the National Development Plan of the Energy Sector sets a target for 80 per cent of heat to be derived from renewable sources by 2030315
The city of Tartu is served by a fity-year old district heating network and a five-year old district cooling network The privatised network serves around 75000 customers and is owned and operated by Fortum Tartu The city and the network operator have carried out multiple innovations to improve energy efficiency air quality carbon emissions and customer satisfaction316
ImplementationTartursquos district heating system was established in 1967 and owned first by the state and then by the municipality Originally powered by gas and oil the network was converted in 1995 to use biomass
District heating and cooling Tartu Estonia
Tartu Estoniarsquos second-largest city has managed to upgrade its old district heating network and turn it into a world-class system that uses local renewable energy sources
312 See Groszlige et al (2015)313 See Government of Estonia (2017)314 Ibid 315 Ibid316 See Raud (2019)
Case studies - energy and buildings
135
and peat with financing from the World Bank and the EBRD In 2000 the system was privatised and then acquired by Fortum Tartu in 2004 The privatisation provided the network with access to much-needed capital to carry out a systemwide renewal and to support network expansion317
The municipal government has supported the district heating network through its planning policies and through securing funding for smart city innovation The first urban development master plan for Tartu was established in 1999 and focused on sustainable development It included an integrated district heating zone to improve air quality and customer satisfaction levels The city council raised awareness in support of the district heating system through public campaigns The plan mandated that all new and renovated buildings in the designated districted heating zones should connect to the heating network unless their heat consumption was less than 40 kWhmsup2 per year Meanwhile a smart city project financed by Horizon 2020 helped to target investment to retrofit energy-inefficient homes and connect them to the heating network318
Fortum Tartu has implemented a number of business and operational innovations to sustain the performance and financial stability of the company These include319
bull vertical integration and diversification allowing the firm to become a biomass fuel producer and supplier
bull development of a new biomass combined-heat-and-power plant
bull growth through the expansion and acquisition of a nearby heating network operator
bull development of a low-carbon district cooling network partially supplied from the Emajotildegi River which runs through the centre of the city
Most recently Fortum Tartu has participated in a low-temperature innovation pilot which has demonstrated the potential to reduce system flow temperatures from a peak of 105degC to as low as 60degC achieving a significant reduction in losses and creating the potential to capture low-grade heat from industrial and other local sources of waste heat320
Barriers and critical success factorsA number of success factors have enabled Tartu to develop and sustain its district heating and cooling system321
317 See Galindo Fernandez et al (2015)318 Ibid 319 Ibid 320 See Raud (2020)321 See Galindo Fernandez et al (2015)
Case studies - energy and buildings
136
322 See ERRee (2020)323 See Galindo Fernandez et al (2015)
bull Privatisation has enabled the city to access investment capital and international know-how to renew and expand its district heating network and diversify operations to include district cooling and a fuel supply business
bull A strong national policy framework for district heating clarifies roles for effective operations while pricing market regulations enable the operator to maintain a financially sustainable business
bull The local policy framework integrates development planning and energy planning to encourage higher density development and to connect new developments to the heating network
A culture of partnership and innovation has characterised the relationship with the city supported by multiple EU investment and research programmes This culture will be critical to supporting the cityrsquos recently announced goal of reducing its carbon emissions by 40 per cent by 2030 relative to 2010 and of becoming carbon neutral by 2050322
Results and lessons learned
bull The district heating network supplies around 50 per cent of the cityrsquos buildings and 75 per cent of its residents
bull The price of district heating is lower than the national average
bull The network has reduced its carbon footprint to 102gMWh per year323
Links to similar initiativesVancouver district heating system Copenhagen district heating and cooling system Paris Saclay smart district heating and cooling system
Case studies - energy and buildings
137
Sustainable eco-districts Malmouml Sweden
Malmouml has regenerated its urban area by converting disused sites such as former shipyards and other heavy industry zones into sustainable low-carbon districts
324 See Fitzgerald (2016)325 See Smedby (2015)
Snapshot
bull Location Malmouml Sweden
bull Population Medium-sized ndash 316000 (2018)
bull Policy area Energy and buildings
bull Policy options Improved codes for building energy and better labelling policies promoting renewable energy generation
bull Financial capacity Strong
bull Administrative capacity Strong
Context and policy overviewIn the late 1980s and early 1990s Malmoumlrsquos industrial centre lost one-third of its jobs but today the city is a vibrant and sustainable urban area The heart of this transformation is Western Harbour an eco-district and regeneration zone The area was developed as a testbed in the cityrsquos ambitious plans to become climate-neutral by 2020 and to run entirely on renewable energy by 2030 The mayor envisioned using the eco-district concept as a model for future sustainable urban development throughout the city
And with a blank slate ndash a restored brownfield site ndashplanners could integrate all aspects of Malmoumlrsquos sustainability approach into the eco-district324
In Sweden the energy performance of buildings is regulated at the national level However Malmouml has developed several policy instruments to meet the cityrsquos climate and sustainability goals One example of these instruments is the ldquoDeveloper Dialoguerdquo which involves different stakeholders in the planning process Malmouml has also worked with the city of Lund to set sustainability requirements that exceed national regulations for new building developments It has achieved this through a voluntary programme called MBP South in which developers can choose between three levels of ambition325
ImplementationThe objective for the Western Harbour eco-district was to reduce energy consumption to 105 kWhmsup2 This is equivalent to half the energy consumption of Malmoumlrsquos current housing stock and below the nationally required levels for new construction
City planners invited a variety of stakeholders including architects developers and construction companies to submit development plans and hold
Case studies - energy and buildings
138
326 See Kanters and Wall (2018)327 See Fitzgerald (2016)
discussions to establish building sustainability standards for Western Harbour Building standards were established for energy materials systems technology acoustics and noise green space and biodiversity moisture control and the indoor environment326
In the second phase of the project participatory planning ndash which goes beyond conventional stakeholder consultation processes ndash was used to bring parties together to shape the approach to energy efficiency The process involved a combination of site visits and workshops and cooperative design processes to set standards for new buildings
Sustainable urban mobility was another key policy objective for the district with a combination of car restrictions and measures to support walking and cycling The district boasts a 40 per cent modal share for cycle-based journeys to work
Following the development of Western Harbour the eco-district concept was replicated in the planning of further projects through Developer Dialogues These are held to enhance the sustainability profile of prospective eco-districts Malmoumlrsquos city planners applied the eco-district approach to redevelop lower income neighbourhoods such as Rosengaringrd a social housing area with a history of significant social conflict This project aimed to demonstrate how a troubled neighbourhood can be redeveloped with a focus on environmental sustainability and increased social and economic integration with the rest of the city327
Barriers and critical success factorsIn Malmouml political ambition and leadership is strong and goals are set at a high level The city departments cooperate with each other as well as with developers universities and other organisations Malmouml is committed to and has been working towards sustainability for a long time
Experimentation supported by cross-departmental collaboration and dialogue with developers has been key to promoting innovation in planning For example project managers from the environment and planning
departments meet on a regular basis to discuss the delivery of more integrated projects
The fact that the city owns most of the land means that it has considerable power to impose standards on developers Swedish cities also benefit from significant national and EU funding to support climate action
In terms of programme design MBP South gives building developers a choice between three different levels of ambition In contrast similar sustainability programmes in Sweden set only one level of requirements Moreover administration of the
Case studies - energy and buildings
139
programme has been efficient due to the relatively large size of the municipality and the fact that it developed the programme jointly with another municipality
Results and lessons learnedMalmouml has been successful in reducing energy consumption cutting GHG emissions and making the urban area more liveable for residents
bull The city lowered energy consumption from 72 kWhm2 to 65 kWhm2 for a development using MBP South without the Developer Dialogue and to 56 kWhm2 for a development using MBP South with the Developer Dialogue
bull Due to Malmoumlrsquos action and the decline of the shipbuilding industry per capita GHG emissions have fallen to 34 tonnes per year (compared to 56 tonnes in Sweden as a whole and 176 tonnes in the United States of America in 2010)
bull The eco-districts have contributed to economic growth social innovation and inclusion in the city making Malmouml an attractive place to live
While external factors such as funding opportunities and land ownership by the city were favourable to Malmouml much of the cityrsquos success is thanks to effective urban planning and these lessons can be applied anywhere The experience in Malmouml demonstrates that experimentation is key to innovation in planning It also shows that the formalisation of learning across departments can ensure that a city addresses obstacles to cooperation and institutionalises good practices
Links to similar initiativesPortland eco-districts Ulaanbaatar eco-districts
Case studies - water
140
Snapshot
bull Location Yerevan Armenia
bull Population Large ndash 11 million (2016)
bull Policy area Water
bull Policy option Regulation and contracting of public and private service providers
bull Financial capacity Strengthening
bull Administrative capacity Strengthening
Context and policy overview In recent years Armenia has seen major achievements in relation to water resource management to which the private sector has made significant contributions Previously Armenia had lagged behind European countries in terms of the non-revenue water ratios water accessibility and supply328
Yerevan the capital of Armenia is the largest and most populous city in the country In the 1990s Yerevanrsquos water utility company the Yerevan Water and Sewerage Enterprise (YWSE) struggled financially and had a poor water system which was unable to supply water efficiently to city residents Fee collections were only around 20 per cent and revenue did not cover operational and maintenance expenses The majority of customers (80 per cent) connected to the network could only access tap water for between 2 and 8 hours a day Meanwhile approximately 72 per cent of water in the network was lost through identified leakages across the system329
ImplementationIn 2000 the government of Armenia sought private input via a competitive tender to improve the provision of water services Through the tendering process the government commissioned Acea Spa Utility (Acea) a joint venture led by an Italian water operator to run the water utility system for five years330 The appointment was designed to bring in private sector expertise
Private contracting in the water sector Yerevan Armenia
Yerevanrsquos water utility signed a five-year performance-based management contract with private operator Acea Over the contract period water supply collection rates and energy efficiency improved
328 See World Bank (2018)329 See Energy Sector Management Assistance Program (2011a)330 See Eiweida and Tokhmakhyan (2011b)
Case studies - water
141
331 Ibid332 See Eiweida and Tokhmakhyan (2011b)
to handle the water distribution network efficiently An investment fund was created by the government and the World Bank in order to manage Acearsquos capital investment for water utility services With the aim of enhancing the water utility system Acea created a programme to repair leaks increased the gravity-fed water supply fixed pumping stations introduced meters and stabilised water pressure across the networks of three districts These developments cost US$ 24 million and strengthened the water network across Yerevan
There are differing degrees of private-sector participation (PSP) in the water sector These can include minor outsourcing of non-core activities or private concession contracts where investment obligations and revenue risks are fully transferred to private operators The performance-based contract introduced in Yerevan represented a moderate first step in terms of increased PSP with only minor risks transferred to private contractors which are linked to performance incentives However it was a first step that brought sector expertise and well-defined performance incentives into the cityrsquos water services It also helped to build capacity and experience of private contracting for the relevant water authorities This experience later paved the way for wider and deeper PSP in the Armenian water sector
Barriers and critical success factorsPolitical support and commitment by policymakers helped the public-private partnership (PPP) with Acea to succeed Both the government and the operator demonstrated a willingness to resolve issues and agree on common benefits PPPs are a way to resolve some water sector challenges but are not the only tool that policymakers have In order to benefit from the private sector policymakers need to create a business environment that facilitates private-sector involvement with a reasonable legal and regulatory framework331
In Yerevan several measures were taken to ensure strong results These included performance targets incentive mechanisms and an efficient selection process for procuring a contractor Government and
city officials together with Acea discussed progress and challenges to ensure that appropriate measures were taken
A key lesson learned from the project was the importance of obtaining an accurate baseline for system performance before setting contractual performance targets The projectrsquos failure to meet targets for non-revenue water ratios was linked to the use of inaccurate baseline values332
A significant part of the projectrsquos success was the joint effort by the government and Acea to gain public acceptance for the work This entailed early improvements to services before the introduction of tariff increases
Case studies - water
142
Results and lessons learnedYerevanrsquos experience is an example of a well-implemented PPP scheme using performance-based contract incentives It demonstrates that these delivery models can produce positive outcomes for cities if appropriately structured with an effective statutory framework in place More specifically between 2000 and 2004 Yerevan achieved the following improvements333
bull a significant increase in access to water with the availability of water increasing from 6 to 18 hours per day
bull an increase in fee collection from 20 to 80 per cent
bull a fall in electricity consumption by 30 per cent exceeding the initial target of 20 per cent
bull a stronger focus on sustainability improving the resilience of the network
bull a stronger financial performance due to reductions in energy use and water losses and a dramatic improvement in collection rates
bull a 10-year contract between the government and Veolia a French water company following the success of the project
The cityrsquos experience also illustrates the importance of transparent and predictable regulation as well as contract implementation by a competent public authority These are necessary not only to avoid disputes but also to ensure good bidding processes with strong competition between serious and competent companies that fully understand what they are bidding for and feel comfortable with the regulatory environment
Lastly Yerevanrsquos experience with performance-based management contracting demonstrates the need to have realistic expectations about the scale and pace
of reforms in the water sector Sustainable changes to a system require time to take effect
Links to similar initiativesAmman private-sector participation in the waste sector Iasi water tariffs and governance improvements Kirklees performance contracting in the waste sector
333 See International Bank for Reconstruction and Development and World Bank (2017)
Case studies - water
143
Snapshot
bull Location Madaba Jordan
bull Population Small ndash 105000 (2018)
bull Economy Service economy
bull Policy area Water
bull Policy options Regulation and contracting of public and private service providers reform and strengthening of water utilities effective tariff reforms and price signals
bull Financial capacity Limited
bull Administrative capacity Limited
Context and policy overviewHigh levels of population growth in combination with climate change and droughts had a strong impact on Jordanrsquos water supply in the 1990s and early 2000s334
Despite investment in the countryrsquos water sector the reduction in the percentage of non-revenue water (NRW) was disappointing The Ministry of Water and Irrigation documented national NRW rates as high as 66 per cent with only a slight improvement over time from 46 per cent in 2005 to 44 per cent in 2010 This NRW rate was due to both physical and administrative losses Old water pipelines pipe bursts poor service connections illegal tapping and incorrect water meter readings were just some of the reasons for the losses335
In addition the Water Authority of Jordan (WAJ) had experienced multiple challenges in service delivery and business administration Application processes and billing were often found to be incorrect and overall customer management was inefficient and unsatisfactory336
In 2004 the Ministry of Water and Irrigation proposed a set of policy measures to manage the NRW including a micro approach to private-sector participation This option was proposed to achieve
Micro private-sector participation Madaba Jordan
The administration of Madaba implemented a micro approach to private-sector participation to reduce the percentage of non-revenue water The contract addressed billing illegal use and the replacement and resealing of water meters In the seventh quarter the water system reached break-even
334 See Al-Karablieh and Salman (2016)335 See Baghdali et al (2013)336 Ibid
Case studies - water
144
service improvements in Jordan across the operation and management of the water network It was seen as a complementary approach that would prepare for more PSP schemes across the distribution of water services in Jordan
The WAJ defined its targets around improving financial performance through better management of water and wastewater stronger collection rates and improvements to customer service and management
ImplementationThe micro-PSP approach was implemented in Madaba from 2005 to 2011 The ministry chose Madaba as the city had a small customer base limiting complexity Households accounted for 94 per cent of this base while only 6 per cent of customers were industrial consumers In addition proximity to Amman would enable easier cooperation with WAJ headquarters and facilitate general transactions and logistics Moreover there was strong interest in the micro-PSP approach from local stakeholders337
A bidding process was set up for the micro PSP to manage billing and revenue collection and thus reduce the NRW ratio A workshop was arranged
to raise awareness and to give bidders as much information as possible The services that were expected of bidders included managing billing and revenue collection using a tool based on geographical information systems implementing a system for customer management and operating a database for the sewerage network in the region338
The contract specification included details of the required activities and levels of performance and was divided into two parts The first part considered the business processes of the company During this first stage business processes were to be updated to ensure use of the necessary systems and equipment The staff would also receive training The second part of the contract covered performance management In this stage the private company would carry out meter readings billing collection and customer service including inspections339
Under the contract terms the private company received a portion of the extra revenue collected each year in order to incentivise performance The contract also had clearly defined targets and indicators The Project Management Unit of the WAJ monitored the performance of the winning contractor Engicon an engineering consultancy firm
337 Rabi (2013)338 See Baghdali et al (2013)339 Ibid
Case studies - water
145
Barriers and critical success factorsThe micro-PSP project in Madaba was considered to be a success and it was scaled up and extended for three more years This enabled smaller local companies to participate in Madabarsquos water resource management bringing cash flow into the sector and saving water across the city The project has also influenced water and wastewater systems in other regions across the Middle East and the Gulf States Nevertheless Madaba experienced some challenges
bull It took more than two and a half years to start the programme
bull There was a reliance on external funding
bull A major concern was the availability of local private companies to take on key tasks outsourced by the WAJ340
Strong long-term results for the project depended on an integrated approach that ensured capacity-building to sustain a competitive local market in water services
Results and lessons learnedThe micro-PSP experience in Madaba yielded several results and key lessons On a general level micro-PSP effectively reduced costs and created a local market in which private companies could compete to provide important services across the water sector
The project brought a significant reduction in NRW through efforts in billing collection of water fees and the fixing of water meters By 2011 billed amounts had increased by 175 per cent relative to the level seen in 2005 There were nearly 3000 reported cases of illegal water use between 2006 and 2011 Over the same period more than 22000 water meters were resealed and 14000 replaced341
In 2008 the total annual additional income achieved reached approximately euro2 million (excluding tariff increases or revenues from new customers) This represented a significant increase compared to total revenue of less than euro12 million in 2005 In fact
cash collections doubled across the period 2005-08 After one year the additional income from the project exceeded the cost of the investment This helped to strengthen the overall financial performance of the WAJ342
Compared to large-scale PSP models the micro-PSP scheme requires less funding and the preparatory phase tends to be shorter (although detailed preparation may be necessary where local capacity is limited) In the case of Madaba the scheme managed to monitor control and assess reduction levels through incentives capacity-building and awareness-raising343
These results and the new customer service arrangements built confidence in the system This was a crucial step towards gaining public acceptance and trust which contributed to a fall in the illegal consumption of water
Links to similar initiativesIasi water tariff and governance improvement Singapore water metering and billing Johannesburg reduction of water losses
340 See Baghdali et al (2013)341 Ibid 342 Ibid343 See Rabi (2013)
Case studies - water
146
Snapshot
bull Location Drakenstein South Africa
bull Population Small ndash 224000 (2015)
bull Economy Service economy
bull Policy area Water
bull Policy options Effective tariff reforms and price signals awareness campaigns for households and industry promotion of resource-efficient utilities
bull Financial capacity Strengthening
bull Administrative capacity Strengthening
Context and policy overview The Drakenstein municipality in South Africarsquos Western Cape province had long experienced water shortages These peaked in 1999 when the water supply could no longer meet demand which was growing at 35 per cent a year This pressure was predominantly due to the high ratio of non-revenue
water (NRW) at 33 per cent of total supply Approximately 90 per cent of the municipalityrsquos water had to be purchased from the city of Cape Town while Drakenstein derived only 10 per cent from its own sources344
Following the 1999 water crisis the municipality had to take remedial measures While Drakenstein faced a great challenge the crisis was also a major opportunity to strengthen the municipalityrsquos water resource management The remedial measures focused on reducing water imports by cutting consumption and minimising wastage
A water demand management programme was introduced to address the crisis The scheme aimed to reduce the high percentage of NRW reduce the level of daily demand and conserve water345
More specifically the programme focused on six main targets
bull decreasing the high proportion of non-revenue water
bull stabilising water pressure
Management of water demand Drakenstein South Africa
A programme of water demand management in Drakenstein achieved a two-thirds reduction in the percentage of non-revenue water over two years boosting municipal revenue
344 See Drakenstein Municipality (2013) 345 See 2030 Water Resources Group (2015)
Case studies - water
147
bull managing average daily demand
bull strengthening financial performance by boosting fee collection
bull improving service to residents and other consumers
bull conserving water
ImplementationThe programme included wide-ranging interventions such as
bull improving the master plan for the reticulation network through hydraulic modelling
bull metering abstraction points and properties
bull supplying water at a low cost while imposing penalties on heavy users through tariffs
bull advertising water scarcity to raise public awareness including the promotion of water-saving devices and plumbing repairs
bull improving leaks and making repairs across the network infrastructure
bull developing a pressure management system
Identifying water leaks across the reticulation network was an important step in reducing water loss This was complemented by an ambitious policy to repair all leaks within an hour of their identification resulting in one of South Africarsquos lowest levels of physical water leakages Poor-quality pipes were replaced with high-quality equivalents and stainless-steel fittings reducing the number of pipe bursts
Works were also carried out on advanced management of pressure The pressure management installations included work on valves pipes chambers and controllers Seven pressure reduction valves that ranged from 100 mm to 300 mm in diameter were equipped with flow-modulated electronic controllers in order to achieve advanced pressure reduction
The works totalled around US$ 500000 but within five months that cost had been covered by the savings achieved
Barriers and critical success factorsThe project gained a high level of support within the community This was partly due to the creation of local jobs through the use of labour-based construction methods in conjunction with extensive local stakeholder engagement
Moreover in order to create a reliable collection and storage system for water the municipality introduced a water treatment programme This enabled a steady supply of water in the region regardless of season and rainfall A feasibility study that examined Drakensteinrsquos water supply management proposed the development of a water treatment plant for the Paarl Mountain dam because a related network for distribution had already been established The study also proved that significant savings could be made by creating a water treatment plant instead of buying water from Cape Town346
346 See AVK International (nd)
Case studies - water
148
Results and lessons learnedDrakenstein achieved its targets for water demand management Overall the municipality now ranks among the best in South Africa with regard to efficient use of water347
The unacceptably high level of non-revenue water was cut from 33 per cent to just 11 per cent over a period of 12 years boosting municipal revenue The combination of a new block tariff structure and reduced spending on water purchases from the city of Cape Town increased the net revenue and outweighed the costs of previous measures taken despite a decrease in the volume of water sold to consumers348
Water demand decreased from 17800000 msup3year to 11900000 msup3year This resulted in significant
savings on water purchases from suppliers and the fulfilment of targets for water conservation349
Notably the performance indicator for physical leakage (ILI) had decreased to below two by 2012 making it one of the lowest levels in South Africa and demonstrating the impressive water savings that all of Drakensteinrsquos interventions had achieved Across the 12-year period of the project total savings exceeded euro70 million No single intervention resulted in this outcome Instead it was the combined effect of many smaller interventions that brought eventual success This has also been the case in the majority of other municipalities in South Africa350
Links to similar initiativesSingapore water metering and billing Johannesburg reduction of water losses Madaba micro private-sector participation
347 See Drakenstein Municipality (2013)348 See 2030 Water Resources Group (2015)349 Ibid 350 Ibid
Case studies - water
149
Snapshot
bull Location Chennai India
bull Population Large ndash 7 million (2011)
bull Policy area Water
bull Policy options Regulation and contracting of public and private service providers reform and strengthening of water utilities effective tariff reforms and price signal
bull Financial capacity Limited
bull Administrative capacity Strengthening
Context and policy overviewThe city of Chennai in southern India has been experiencing water scarcity due to rapid population growth and a rising demand for energy following higher levels of economic activity This water crisis presented the Chennai Metropolitan Water Supply and Sewerage Board (CMWSSB) with the challenges of supplying water efficiently to residents while also ensuring that the local economy and industry were not compromised351
Over several years city officials passed a set of regulations and bylaws to stabilise and manage water sourcing and use These aimed to ensure maximum reuse of water and to see that wastewater met the safe quality standards required by the city The new regulatory framework was complemented by partnerships between the private sector and governmental agencies in order to promote innovation
The water crisis peaked in June 2019 when Chennai declared ldquoDay Zerordquo marking the depletion of water across all of the cityrsquos four main reservoirs Water was being tankered (or transported via train) from unregulated sources at high costs and to the detriment of rural farming communities352
ImplementationIn order to address the rising scarcity of water changes to legislation were made over many years leading up to 2019 The CMWSSB implemented a water reuse plan and the Greater Chennai Corporation set up a bylaw covering compulsory recycling of wastewater that applied to all stakeholders including government authorities the private sector and citizens These rules stated that all developers should include wastewater recycling in their designs that water should go through organic filtration for
Water and wastewater recycling Chennai India
Rapid population and economic growth have caused increasing water scarcity in Chennai In response the city has taken measures to accelerate the reuse of water and wastewater
351 See International Water Association (2018)352 See Trivedi and Chertock (2019)
Case studies - water
150
353 See International Water Association (2019)354 See Raghavan (2019)355 See International Water Association (2019)356 Ibid 357 See Natarajan (2020)358 See Alam et al (2019) 359 See Raghavan S (2019) 360 See International Water Association (2018)
groundwater recharge (except water from toilets which would go through the sewerage network) and that toilet flushing should use recycled water In 2002 the CMWSSB implemented a rainwater harvesting programme under which new or renewed water and sewerage connections had to include systems for harvesting rainwater353 Chennai is one of the first cities in India to have educated residents on the importance on rainwater harvesting354
Another priority area for the city has been energy efficiency In 2010 CMWSSB commissioned six sewage treatment plants The plants capture and use biogas to power most of their electricity demand355
Another priority has been zero discharge Industries and manufacturers are now under legislation that requires them to achieve zero liquid discharge from their operations Wastewater should not be discharged and should be treated for reuse For example the CMWSSB treats wastewater and sells it to major industries across the city356
Since ldquoDay Zerordquo the CMWSSB has committed to a variety of further measures to reduce the risk of future water crisis events including357
bull reuse of wastewater by expanding the number of treatment plants in Chennai
bull decentralisation of water sources with a focus on smaller lakes
bull an increase in the number of water supply schemes reducing reliance on tankers
bull the provision of sewer connections to new areas
bull the collection of sewage from areas where there is no underground sewerage network
bull monitoring of groundwater levels
bull GIS mapping of the water supply network
bull engaging manual scavengers in other work
bull upgrading the CMWSSB quality assurance laboratory
Results and lessons learnedIntegrated water resource management is necessary to achieve long-term resilience as a single intervention would be too simplistic358
bull Through mandatory rainwater harvesting Chennai has improved its water quality and groundwater levels have increased significantly359
bull Chennai has met 15 per cent of its water demand through water recycling while 8 per cent of treated wastewater is sold to industries Moreover some 40 per cent of domestic water demand in newly built houses is met through wastewater reuse360
bull Improvements to sewerage networks as a resulting of reduced pressure due to more rainwater harvesting and in situ wastewater reuse systems have saved water across the network
bull Electricity imports and GHG emissions have fallen due to the use of biogas for energy production The public-private partnership scheme has reduced dependence on the electricity grid by approximately 77 per cent
bull Innovation in wastewater treatment has been incentivised as new markets in this area have been created
Links to similar initiativesDurban water recycling Aqaba wastewater reuse Namibia wastewater reclamation
Case studies - water
151
Snapshot
bull Location Zaragoza Spain
bull Population Large ndash 663000 (2016)
bull Policy area Water
bull Policy options Awareness campaigns for households and industry effective tariff reforms and price signals
bull Financial capacity Strong
bull Administrative capacity Strong
Context and policy overviewZaragoza is located in the north of Spain It is a semi-dry area with moderate average rainfall (314 mm a year) In the 1990s a severe drought made the cityrsquos water shortages a distinct problem sparking public concern and political controversy361
In 1996 the NGO Fundacioacuten Ecologiacutea y Desarollo and the municipality jointly set up the Zaragoza Water Saving City programme to tackle water scarcityThe aim was to change wasteful behaviour and increase
efficient use of water The programme set an ambitious target of reducing domestic water consumption This included saving one million m3 of water a target that the programme successfully achieved within a year362
Water shortages in an urban context can be challenging to overcome However this project addressed shortages through financial incentives educational campaigns and multiple partnerships which secured funding from a variety of sources
ImplementationThe water-saving project comprised a wide range of measures
Media campaign In order to increase public awareness of the project Zaragoza ran a broad media campaign It featured advertisements on TV radio and public transport in addition to information on leaflets and posters The campaign achieved a high level of public awareness about the project
Educational outreach The programme used education to make people conscious of their own domestic water use and to prompt more efficient use of water and related technologies This outreach
Water-saving programme Zaragoza Spain
In 1996 the city of Zaragoza introduced a water efficiency programme to address water scarcity The programme included awareness-raising campaigns financial incentives and voluntary commitments by residents and businesses
361 See 2030 Water Resources Group (2015)362 See Kassam (2014)
Case studies - water
152
was later extended to schools to ensure that children understood the principles of efficient water use and why it is important to reduce water wastage By April 1998 168 educational establishments 428 teachers and 70000 students had participated directly in the campaigns educational programme363 The cost of the media campaign and educational outreach was around euro25 million between 2002 and 2010 The second part of the water saving project included a ldquo50 Good Practicesrdquo guide The guide identified measures for efficient water use by businesses covering water-related technology and behaviours in the cityrsquos green spaces buildings and industry364
Economic incentives The regional government gave discounts of 20 to 25 per cent to citizens purchasing water-efficient products In 2002 the Zaragoza city council also offered economic incentives for households to reduce their water consumption Residents who reduced their water use by 40 per cent or more in the first year of the scheme were entitled to a 10 per cent discount on their water bill A 10 per cent reduction in water consumption was also expected in the following years Water bills were redesigned to show clearly how each householdrsquos consumption compared to the levels in previous months365
Partnerships In order to ensure a range of options for customers the water-saving project partnered with businesses and companies that sold water-related technologies and products This allowed consumers to choose water-efficient products for their homes including for bathrooms and kitchens
Tariff reform Water tariffs have the ability to make water consumption fairer and more responsive to demand Revenues can be used to cover indirect costs in the water cycle and the direct costs of providing services366 In this case the following measures were under taken
bull the establishment of fair costs for consumers that correspond to the resulting benefits and services
bull a reasonably priced and accessible provision of water services to maintain affordability for vulnerable households
bull incentives for smart and efficient water use including financial incentives such as discounts on water bills tied to a reduction in household water consumption and higher rates for excessive water consumption
Infrastructure upgrade The programme also required significant upgrades to the water infrastructure in order to minimise leakages Approximately 16 per cent of the 1200 km pipeline network required upgrading The city also initiated pressure management controls and maintenance of leaking storage tanks in order to limit water loss367
Barriers and critical success factors368
The most significant factor contributing to the projectrsquos success was the change in consumer behaviour following effective public awareness campaigns and engagement Instead of promoting generic water-saving messages specific user groups were targeted with awareness-raising activities directly relevant to their business or lifestyle
363 See Edo et al (1998)364 See 2030 Water Resources Group (2015)365 Ibid 366 See SWITCH (2014)367 Ibid 368 Ibid
Case studies - water
153
The establishment of a central coordination unit also contributed to the success of the campaign The Zaragoza Water Commission ensured that there was a coherent approach to smart and efficient implementation and monitoring
A network of 50 volunteer ldquoaccomplicesrdquo was set up and free audits were offered to these non-residential water users to help implement water-saving measures This group included for instance a hospital a fish supplier and a swimming pool operator Subsequently as soon as positive results came in case studies of their success stories were circulated to other businesses369
Policy commitments and the supportive city council made the cityrsquos achievement possible through an increase in the available funding opportunities This also contributed to civic pride The authorities led by example providing a reliable efficient water and wastewater service
Results and lessons learnedOverall the Zaragoza project significantly reduced water use and enabled smart behaviour in relation to water consumption It achieved the following outcomes
bull The city decreased water use by almost 30 per cent within a 15-year period despite a 12 per cent increase in population over the same time frame Daily water consumption per capita fell from around 150 litres in 1997 to 99 litres in 2012370
bull The campaign enlisted 140 businesses selling technologies that minimised water consumption in homes This enabled consumers to purchase products that were more water efficient For instance one bathroom retailer reported a 58 per cent rise in sales of automatic taps371
bull After the first phase of the project had been completed 72 per cent of residents were aware of water-saving measures compared to 40 per cent before the project started
bull Water system performance improved with pipe burst events reduced by more than 50 per cent and losses by more than 40 per cent
The experience in Zaragoza shows that encouraging public participation and targeting specific sectors are valuable measures when implementing awareness campaigns Strong political commitment is also important The municipal strategic plan identified stakeholder engagement and public participation as important to managing the cityrsquos water consumption
Links to similar initiativesSingapore water demand management Beaufort West water demand management Nevada water conservation programme
369 See Kassam (2014)370 Ibid 371 See 2030 Water Resources Group (2015)
Case studies - water
154
Snapshot
bull Location Bucharest Romania
bull Population Large ndash 18 million (2011)
bull Policy area Water
bull Policy option Regulation and contracting of public and private service providers reform and strengthening of water utilities effective tariff reforms and price signals
bull Financial capacity Strengthening
bull Administrative capacity Limited
Context and policy overview In Bucharest water losses were very high (around 50 per cent) in the 1990s and the city had low levels of fee collection because the metering system was inadequate Relative to EU quality standards improvements were required and the commercial model and tariff structure in place at the time
did not allow EU funds to be made available for capital investment372
In 1996 following World Bank recommendations Bucharest initated a tender process to privatise the cityrsquos water and sanitation system This resulted in a 25-year concession agreement between Apa Nova a subsidiary of the French firm Vivendi (now Veolia) and the Bucharest municipality for the management of the system In 2000 Apa Nova won the tender to manage the Bucharest water concession including the development of the Crivina plant The contract included operations and the provision of clean water and sanitation while ownership of the water system remained with the municipality
The private-sector participation approach gave control of management and investments to a private company and linked its remuneration to efficiency gains and operational performance The municipality expected that this would lead to significant improvements in Apa Novarsquos capital and operating efficiency and a higher standard of service In addition the municipality hoped to see expertise from international practices in management and operations transferred to Apa Novarsquos local staff373
Public-private partnership agreement Bucharest Romania
Bucharest introduced new capital improvements to the water sector through a PPP agreement which has led to efficiency gains and better operational performance of the cityrsquos water distribution network
372 See Water Time (2005)373 See Islam (2012)
Case studies - water
155
ImplementationIn one of the first PPPs in the local water sector the private contractor was selected through international competitive tendering organised by the municipality of Bucharest with the support of the International Finance Corporation (IFC) The agreement provided a 25-year contract for Apa Nova to deliver US$ 1 billion worth of investments in existing and new treatment plants and in network renewal374
The contract included targets for key performance indicators in relation to water quality completion of new infrastructure and customer service Although the contractor had operational control over the network and the authority to deploy resources to meet these KPIs the municipality retained ownership of the infrastructure and the power to veto certain decisions375
The agreement helped create a source of capital to support an upgrade and extension of the Bucharest water system The partnership agreement required the private partner to provide financial resources to upgrade the system and part of the project included the upgrading of the Crivina plant The Crivina project had already started 10 years earlier but the municipality lacked the financial resources and expertise to complete it To finance the project Apa Nova and the city of Bucharest applied for an EBRD loan which offered better terms than other commercial sources of capital376
This PPP model offers a degree of stability and risk- and profit-sharing In 2000 the PPP environment in Romania was uncertain and the classical nature of the model used in Bucharest may therefore have been beneficial to the city377
Results and lessons learnedThe PPP contract was beneficial to both parties Bucharest was able attract financial resources to upgrade and improve the quality of its water system
and accessed the necessary expertise to do this Meanwhile Apa Nova also benefited with profits of euro24 million in 2006378
Overall the project improved the cityrsquos water distribution network and saw the completion of the Crivina potable water treatment plant on the outskirts of Bucharest
Key metrics for the period 2002-06 included
bull a 44 per cent reduction in losses379
bull a 50 per cent decrease in demand380
bull a 21 per cent increase in customer satisfaction (from 46 per cent to 67 per cent)381
Moreover the competitive nature of the contract its 25-year duration and the controlled pricing mean that as a result of this concession consumers in Bucharest have one of the lowest tariffs for water and sanitation in Europe382
Links to similar initiativesSingapore water demand management Johannesburg water supply efficiency Jeddah leakage reduction
374 See World Bank (2016)375 Ibid 376 Ibid377 See Islam (2012)378 See World Bank (2014) 379 See IFC (nd) 380 Ibid381 See World Bank (2014) 382 Ibid
Case studies - waste
156
Snapshot
bull Location Cape Town South Africa
bull Population Large ndash 37 million (2011)
bull Policy area Waste
bull Policy options Regulation and information to encourage the reuse of materials and the reformulation of processes incentives for waste recycling by industries information strategies for residents and businesses
bull Financial capacity Strong
bull Administrative capacity Strong
Context and policy overviewDespite its rich and diverse resource base South Africa relies heavily on fossil fuels has high rates of landfill use and suffers water scarcity In Cape Town the Western Cape industrial symbiosis programme
(WISP) seeks to address these issues by providing a free facilitation service that promotes the reuse and recycling of industrial waste The programme covers materials water energy staffing and expertise and other assets Its overarching aim is to contribute to the circular economy384 385
The sharing of resources enables businesses to reduce costs and boost profits improve operational efficiency introduce new revenue streams learn from one another operate more sustainably and divert waste from landfills
The WISP was inspired by the UKrsquos national industrial symbiosis programme (NISP) which successfully proved that reutilising underused resources across industrial and commercial waste improved the environmental impact of companies386
ImplementationThe WISP was set up by the Western Cape government and delivered by the non-profit organisation GreenCape with technical support from the city
Industrial symbiosis programme Cape Town South Africa
The Western Cape industrial symbiosis programme connects local companies to facilitate the reuse of resources such as water energy and materials383
383 See Western Cape Government (nd)384 See Global Opportunity Explorer (2018)385 See African Circular Cities Alliance (nd)386 See Western Cape Government (nd)
Case studies - waste
157
387 Ibid 388 See C40 Cities and Climate KIC (2018)389 See C40 Cities (2017) 390 Ibid 391 See GreenCape (2018) 392 See OrsquoCarroll et al (2016)
of Cape Town and financial support from other partners387 GreenCape seeks widespread adoption of green economy solutions The WISP helps to engage local businesses improving their understanding of the content and potential uses of waste streams which in turn helps to identify underutilised resources388
Connections were made between nearly 500 participating companies via workshops led by the city and GreenCape and through the use of an online database SYNERGietrade389 When connections are made between firms the WISP supports the exchange of resources and the communication between the relevant actors Feedback to the WISP is encouraged in order to improve matching and to ensure strong social environmental and financial impacts for all parties involved Emission savings that result from the scheme are calculated using an international standard carbon calculator that has been developed for the purposes of the programme390
By way of example the WISP successfully matched the marketing company Scan Display with the specialist manufacturing firm Sealand Gear This helped the former to avoid disposing of single-use conference display stands and banners instead
diverting them to Sealand Gear which used the products to make bags and clothing The long-term relationship between these two firms helped to avoid two tonnes of landfill waste and delivered financial savings to both companies Sealand Gear saved ZAR 270000 (euro14000) per year on raw materials and Scan Display saved ZAR 900 (euro50) per year in landfill gate fees391
Barriers and critical success factorsDespite its overall success the project faced challenges including regulatory issues (the reuse or recycling of waste materials for instance) the cost of transport and logistics services a lack of demand for secondary materials and additional capital investments It also faced a difficult enterprise development process and lack of large-scale solutions for dealing with waste composite materials bio-waste textiles and wood392
Factors that helped to overcome these issues and make the project successful include GreenCapersquos reputation as a reliable and trusted NGO with no hidden agendas the use of partnerships to tap into
Case studies - waste
158
393 Ibid 394 See C40 Cities and Climate-KIC (2018)
networks and the contribution made by International Synergies a firm whose experience in industrial symbiosis helped to demonstrate the value of this approach
Government funding was also instrumental in facilitating the development of the free-to-use WISP service393
Results and lessons learnedThe WISP operates across several industries allowing greater scope for the reuse of materials and delivering a range of benefits such as
bull 27000 tonnes of waste diverted from landfill thus saving 45000 tonnes of greenhouse gas emissions over a five-year period
bull income and savings and private-sector investments totalling ZAR 43 million (euro28 million equivalent)
bull the direct creation of 25 jobs and a further 118 indirect jobs
The programme has also inspired and influenced other industrial symbiosis programmes across South Africarsquos provinces including in KwaZulu Natal and Gauteng The WISP is seeking further expansion394
Links to similar initiativesYokohama 3R Dream Plan Malmo industrial symbiosis Kristiansand green business competition
Case studies - waste
159
Snapshot
bull Country South Korea
bull Population Large ndash 97 million (2017)
bull Policy area Waste
bull Policy options Establishment of a waste management plan and administrative capacity promotion of sharing and reuse of products information strategies for residents and businesses
bull Financial capacity Strong
bull Administrative capacity Strong
Context and policy overviewInitiated in 2012 and funded by the city the Sharing City Seoul programme seeks to develop a sharing economy covering infrastructure business public resources data and digital services395
Overpopulation urbanisation and a high population density in Seoul have exacerbated challenges in relation to housing transport air pollution and access to resources The Sharing City Seoul project was initiated to tackle these challenges and facilitate growth without further exploiting resources or adding pressure to infrastructure and services
The aims of the project include396
bull supporting job creation and increasing prosperity across the city
bull reducing waste and excess consumption and improving sustainability across businesses and organisations and
bull improving community spirit by increasing trust between people
ImplementationSeoul is seeking to move away from its conventional policy of building primary infrastructure (such as roads schools and so on) towards an innovative
Sharing city project Seoul South Korea
Seoul declared itself a ldquosharing cityrdquo in 2012 and began applying the concept of the sharing economy to its urban policies This minimised the waste of resources while generating economic opportunities and better relationships between city residents
395 See Johnson (2013)396 Ibid
Case studies - waste
160
focus on secondary infrastructure (such as spaces objects skills and other underutilised resources)397
To achieve this ambition the city is implementing a mix of policy and other mechanisms including a supportive regulatory framework public awareness campaigns and financial and other support for businesses398 Some of the key measures include the following399
Promoting sharing enterprises The city supports approximately 20 business start-ups led by young people providing them with office space advisory services and subsidies In addition the city subsidises the expenses of 27 sharing enterprises with KRW 460 million (euro340000 equivalent) to either launch or scale up their platforms400
Sharing enterprises chosen for city support include
bull Kozaza and Labo Korea two platforms for home-sharing
bull Woozoo a platform that provides affordable housing by remodelling old houses into shared accommodation
bull Wonderlend and Billi businesses that promote the sharing and borrowing of goods that are underused
bull SoCar a platform for car-sharing services
bull Kiple a business that promotes the sharing of childrenrsquos clothes
bull The Open Closet a company that distributes donated suits to young job-seekers
bull The Living and Art Creative Center a space for creative writing and art
bull Zipbob a platform that promotes food-sharing
Public awareness Seoul introduced a ldquostamp of approvalrdquo for particular sharing services in order to build trust in the sharing economy Moreover Seoul is branding itself as an innovator in sharing and is hosting an international sharing city conference to share best practices
Seoul established an online platform called the ShareHub in June 2013 to help residents understand the concepts of the sharing city and to initiate a directory of sharing services401
Governance The sharing city project was based on cooperation between the private and public sectors steered by a committee that the city established in February 2013 to promote sharing The committee is made up of representatives working in areas such as the media law IT corporate social responsibility welfare and social innovation In 2013 mayor Park set up the Seoul Innovation Bureau The Bureau encourages peoplersquos engagement in all aspects of city life from identifying challenges to providing policy ideas and participating in the sharing economy402
397 See Urban Sustainability Exchange (nd)398 Ibid 399 See Johnson (2013)400 See Johnson (2014)401 Ibid402 See Centre for Public Impact (2017)
Case studies - waste
161
Other measures Seoul established a car-sharing service with a fleet of around 500 cars and a selection of parking lots and municipal buildings were opened to the public during off-peak times To tackle the growing need for housing the city created a system to connect older people who had spare rooms with students in need of accommodation Shared bookshelves and ldquolibrariesrdquo of tools were also set up in communities across Seoul403
The city works closely with private companies to develop public-private partnerships and finance the programme
Barriers and critical success factorsThe Seoul metropolitan government is the driving force behind the cityrsquos circular economy The mayorrsquos Seoul Innovation Bureau facilitates the sharing model by means of financial and other support for businesses start-ups and communities It is well resourced and funded with 58 staff members and an annual budget of euro55 million404
Stakeholder engagement is at the heart of the sharing economy Strong communication and alignment between the Bureau the mayor private sector partners and communities is an important success factor The mayorrsquos office has arranged more than 6000 workshops resulting in input from 600000 residents with many of these insights since developed into policies and projects For example following a popular suggestion on Twitter the city used mobile phone data to modify the night-bus timetable to meet passenger demand405
In addition to top-down support from the metropolitan government and the mayor the programmersquos success can also be attributed to the cityrsquos encouragement and support for a grassroots resident-driven approach to sharing opportunities Official support is available for tech start-ups and other organisations focused on enabling more sharing However the city acts as a partner and facilitator for these emerging initiatives rather than dictating how they should function406
403 See Johnson (2013)404 See Centre for Public Impact (2017)405 Ibid406 See Johnson (2014)
Case studies - waste
162407 See Centre for Public Impact (2017)408 See Park (2016)409 Ibid410 Ibid411 See Johnson (2013)
The city also records the growth of sharing initiatives and the number of residents attending events and contributing to sharing policies and ideas both online and offline407
While some people were initially sceptical about this new sharing process presentation meetings organised by the city have helped residents to better understand the logic and potential benefits of the approach
Public assurance from the metropolitan government in terms of laws and systems to promote sharing has also been key in helping to generate an ecosystem of start-up companies Taxation in particular has been a sensitive matter and the insurance system for the sharing economy is not yet complete Regulation and laws that stand in the way of sharing activities are continuously reviewed by the city so that amendments can be made by the relevant departments
Results and lessons learned
bull By 2016 the initiative had certified 50 sharing projects and given grants to a number of these Certified projects range from local car-sharing company SoCar to websites like Billiji that help people share things with their neighbours One of the best results of the project is the increasing participation of residents
bull Some individual successes illustrate the scale of the projectrsquos impact the car-sharing enterprises Green Car and SoCar have more than 400000 members the Moducompany platform has shared 2000 parking spaces that are underused during the daytime and childrenrsquos clothing company Kiple has shared eight million items of clothing408
bull Moreover Seoul has opened up almost 800 public buildings for public meetings and events when they are not in use ShareHub has organised a sizeable campaign of public engagement and education with conferences seminars reports and a book
bull The metropolitan government has concluded that these sharing policies have had a positive effect on the economy equivalent to around KRW 48 billion (euro36 million equivalent)409
bull The city government plans to expand the programme and estimates that this could save city residents a total of KRW 12 billion (euro9 million) a year and the city administration KRW 118 trillion (euro900 million) with more than 1200 new jobs and CO2 savings of 30000 tonnes over the course of the expanded programme410
The sharing city project in Seoul has influenced other South Korean cities such as Gwangju and Busan which have implemented sharing activities based on the success of the initiative411 They have taken particular inspiration from Seoulrsquos distinct approach which combines top-down and bottom-up measures
Links to similar initiativesSan Francisco zero waste city Berlin circular city Oslo integrated waste-management strategy
Case studies - waste
163
Snapshot
bull Location Yokohama Japan
bull Population Large ndash 37 million (2015)
bull Policy area Waste
bull Policy options Regulation and information to encourage the reuse of materials and the reformulation of processes incentives for industries to recycle waste information strategies for residents and businesses
bull Financial capacity Strong
bull Administrative capacity Strong
Context and policy overviewIn the late 1990s Yokohama faced a significant challenge with waste generation exceeding the cityrsquos waste treatment capacity In response it proposed a long-term plan in January 2003 called the Yokohama G30 Plan which aimed to facilitate recycling and curb waste production Specifically the plan sought
to reduce waste by 30 per cent by 2010 relative to a baseline of 16 million tonnes of waste in 2001412
Building on the success of this plan a subsequent project was developed in 2010 The 3R Dream Plan aimed to ldquoreduce garbage while continuing the separation and recycling of garbage to deal with global warming and to reduce CO2 emissions [and] to realise [a] comfortable and liveable city where garbage is controlled by pursuing safe secure and stable garbage processingrdquo 413
The Yokohama 3R Dream Plan also demonstrated how manufacturers can produce items using recycled and recyclable materials and encourages the sale of eco-products and services to help avoid and reduce the import use and waste of resources It supported participation by residents through briefings and through campaigns at the many waste collection points and train stations414
Reduce reuse recycle Yokohama Japan
Yokohamarsquos 3R Dream Plan encourages behavioural change and facilitates coordination between residents businesses and the city government to increase recycling and reduce waste
412 See Tokyo Development Learning Centre (2017)413 See C40 Cities (2016a)414 See C40 Cities (2016b)
Case studies - waste
164415 See Tokyo Development Learning Centre (2017)416 Ibid 417 Ibid 418 See C40 Cities (2016b)419 See Tokyo Development Learning Centre (2017)
Implementation The G30 plan gave residents considerable responsibility for separating waste at source and bringing it to designated collection points The city expanded the system to require separation into 10 different categories of waste each to be placed in clear plastic bags for easy identification by waste operatives415 The new plan was supported by extensive education campaigns to raise public awareness of waste management The campaign included more than 1000 seminars for residents on waste reduction and segregation along with numerous events at railway stations and local waste collection sites Citizen volunteers ndash so-called ldquogarbage guardiansrdquo ndash were appointed to promote sorting measures416
The 3R Dream Plan promoted better waste management by ensuring secure and efficient processing and disposal of waste It also sought to encourage collaboration between government agencies businesses and residents in order to achieve Yokohamarsquos vision of becoming a sustainable city For instance the city worked with producers to design products that create less waste and to implement ldquotake backrdquo schemes for the refurbishment or recycling of products that have reached the end of their lifecycle417
Barriers and critical success factorsThe scheme aimed to reduce waste while supporting the cityrsquos economic development Its success was heavily influenced by the participatory environment created between government industry businesses and consumers418
The involvement of residents and companies was critical in Yokohama for the establishment of effective waste management even without the deployment of new technology or investment Education also played an important role ensuring that residents became involved in waste management activities
Results and lessons learnedYokohama achieved the following outcomes through its implementation of the G30 plan and the 3R Dream Plan
bull Yokohama saved approximately euro900 million in capital expenditure by avoiding the construction of two new incineration plants and euro25 million in avoided operational expenditure The new system of recycling was expected to cost approximately euro20 million a year resulting in significant savings for the city 419
Case studies - waste
165
bull By 2015 Yokohama had reduced waste by 45 per cent from a peak of 161 million tonnes in 2001 achieving this success while the cityrsquos population grew by 170000 people over the same period Another marker of success is that by 2005 the G30 plan had already reduced waste by 30 per cent reaching its target five years ahead of schedule420
bull The city experienced a significant reduction in GHG emissions from waste disposal Between 2003 and 2013 waste-related emissions fell by 10 per cent which equates to more than 29000 tonnes of CO2 saved per year421
bull The 3R Dream Plan set a target of reducing waste-related GHG emissions by 59 per cent by 2025 relative to a 2009 baseline422
bull Yokohama aims to cut more than 141000 tonnes of CO2 emissions by 2025 relative to the level in 2009 423
In terms of lessons learned the experience of Yokohama is appealing because it did not require large investment or new technologies to reduce waste In fact the efforts produced new business opportunities in the recycling industry The Yokohama example also shows that the involvement of residents and companies is critical for effective waste management
As landfill capacities fall and environmental regulations tighten many cities are aiming to reduce and avoid waste The experience in Yokohama thus reminds policymakers of the importance of engaging businesses and communities in the increasing drive towards a circular economy
Links to similar initiativesCape Town industrial symbiosis Malmo industrial symbiosis Kristiansand green business competition
420 See C40 Cities (2015)421 Ibid422 Ibid423 See C40 Cities (2016a)
Case studies - waste
166
Snapshot
bull Location Ljubljana Slovenia
bull Population Small ndash 279000 (2016)
bull Economy Service economy
bull Policy area Waste
bull Policy options Establishment of a waste management plan and administrative capacity effective price signals and funding information strategies and funding improvement in waste collection waste sorting and treatment to encourage recycling and energy recovery
bull Financial capacity Strong
bull Administrative capacity Strong
bull Other Supportive national policy
Context and policy overview Slovenia is well recognised as a country that promotes sustainability and green growth In 2016 it became the first to receive a Green Destinations award while Ljubljana was honoured as the European Green Capital424 Waste management played an important role in these awards Indeed Ljubljana has been a leader in its approach to managing urban waste and developing a local circular economy
In September 2014 Ljubljana became the first European capital to commit to zero waste425 The zero-waste strategy encompassed various pillars426
bull expanding separate collection of waste streams at household level
bull collecting residual waste less frequently while maintaining the collection frequency of separate waste categories
bull encouraging residents and businesses to generate less waste
Zero-waste strategy Ljubljana Slovenia
In 2004 nearly all of Ljubljanarsquos municipal waste was sent to landfill However over the last decade the city has seen a tenfold increase in separate collection of reusable and recyclable materials almost eliminating waste disposal to landfill
424 See Ford (2017)425 See European Commission (2019)426 See Oblak (2019)
Case studies - waste
167
The strategy had ambitious targets to achieve 78 per cent separate collection by 2025 (from 60 per cent in 2014) and to reduce the generation of residual waste to 60 kg per capita by 2025 (from 150 kg per capita in 2014)427
The zero-waste scheme is fully operated by Snaga Ljubljana the largest Slovenian municipal waste management company The firm manages waste for Ljubljanarsquos 400000 residents in addition to the inhabitants of 10 neighbouring municipalities428
Under the scheme fees for waste management services are based on the pay-as-you-throw (PAYT) principle in which households pay according to the amount of waste they generate The charges are linked to container sizes and the frequency of collection The average monthly cost per household is euro8 which is among the lowest in Slovenia and the wider region429
ImplementationIn 2002 the city introduced the collection of glass paper and packaging in separate container stands In 2006 it began household collection of biodegradable
waste some 17 years ahead of the implementation deadline set by the EU Waste Framework Directive (200898EC) for separate collection of bio-waste430 In 2012 Snaga replaced neighbourhood and roadside containers for paper and packaging with a door-to-door collection system431
While door-to-door collection of separated recyclable and biodegradable waste was being increased the cityrsquos waste operator began reducing the frequency with which it collected residual waste For single-household dwellings collection of residual waste was reduced to once every three weeks In multi-apartment buildings the collection was weekly while other streams were collected more frequently432
In spite of a significant communication effort by Snaga the public and media initially resisted the changes Rates of separation were low leading to overflowing containers of residual waste However Snaga stuck to the policy and ramped up its communications including arranging a field trip to demonstrate how much of the residual waste in the bins could actually be placed into the more frequently collected waste streams Behaviour gradually changed in response to the new system and by late 2013 the rate of separate waste collection had reached 55 per cent433 A survey
427 Ibid428 See LGB (nd)429 See Snaga Ljubljana (2018)430 See Dakskobler (2019)431 See Oblak (2019)432 Ibid 433 Ibid
Case studies - waste
168
in 2016 indicated high satisfaction rates with the cityrsquos waste system among residents and businesses alike (albeit the results were based on a very small sample size)434
Snaga uses multiple channels to communicate with residents about costs and performance including through its website and social media accounts Users can also set up a free SMS reminder to notify them when waste will be collected
In addition to its household collection system the city operates a reuse centre and two household waste recycling centres for other reusable or recyclable materials These are well used They contribute to overall waste reduction and heighten awareness of waste with a survey reporting that some 70 per cent of residents think about how to ensure the reuse of goods that they no longer need435 Building on this success Snaga plans to construct 10 smaller centres in denser areas436
For its treatment solution the city opted to pursue a mechanical and biological treatment approach instead of the mass incineration of residual waste The Regional Centre for Waste Management (RCERO Ljubljana) opened in 2016 and currently processes almost a quarter of Sloveniarsquos waste The facility produces its own heat and electricity through biogas derived from the processing The facility achieves reuse recycling or energy recovery for nearly all the materials it receives with less than 5 per cent going to landfill437
Barriers and critical success factorsThe key to Ljubljanarsquos success proved to be political support good management and communication and a commitment to constantly increasing zero-waste goals
The introduction of door-to-door collection contributed most to the increase in recycling rates Snagarsquos communication strategy was also critical in helping to overcome initial opposition to the zero-waste strategy through media outreach and stakeholder engagement The example of Ljubljana also shows
how important it is to adjust communication strategies and messages as circumstances change
Results and lessons learnedLjubljana had previously lagged behind the rest of Europe in terms of the recycling and reuse of municipal solid waste Over a 10-year period the city boosted recycling rates from 29 per cent to 68 per cent and cut waste generation to around 358 kg per capita (compared with an EU average of 486 kg per capita) Among EU capital cities Ljubljana managed to achieve the highest share of separately collected waste while keeping waste management costs to a minimum438
Ljubljana became the European Green Capital in 2016 an award based on its environmental record Among the five finalists Ljubljana was the only city without a waste incineration plant or plans to build one Instead it focused on alternative solutions including a comprehensive waste management plan working towards the development of a zero-waste society
Links to similar initiativesSan Francisco zero waste by 2020 Flanders waste management Vancouver zero waste by 2040
434 See Petek (2016)435 See Oblack (2019)436 See Dakskobler (2019)437 See Oblak (2019)438 Ibid
Case studies - waste
169
Snapshot
bull Location Parma Italy
bull Population Small ndash 194000 (2017)
bull Economy Service economy
bull Policy area Waste
bull Policy options Establishment of a waste management plan and administrative capacity effective price signals and funding information strategies and funding improvement of waste collection waste sorting and treatment to encourage recycling and energy recovery
bull Financial capacity Strong
bull Administrative capacity Strong
Context and policy overviewParma is a relatively small city located in northern Italyrsquos Emilia-Romagna region In 2014 the city occupied a dubious position as the countryrsquos most
waste-producing city with 636 kg of municipal waste produced per person (compared with an EU average of around 480 kg per capita)439 Around 50 per cent of municipal waste was collected separately for reuse and recycling and the other half was incinerated or landfilled Door-to-door collection of separate waste streams was very limited with most recycling taking place through collection containers440
Waste became a major point of debate in the 2012 municipal elections Responding to public pressure and to leadership within the city council the city began a series of changes to its collection regime The new system made it easier for residents to separate out their recyclable waste from residual waste and created financial incentives to reduce waste and increase recycling Public engagement and consultation were also integral to the process
ImplementationThe first step was to replace collection containers with door-to-door collection of separate waste streams Parma started this programme in the historical centre and extended door-to-door collection across the city
Zero-waste strategy Parma Italy
Parma dramatically increased the collection of biodegradable and recyclable material in only four years after launching its zero-waste policy in 2012 This success was due to strong political will effective communication and a pricing strategy to set the right incentives
439 See Zero Waste Europe (2016)440 See Heinrich (2018)
Case studies - waste
170
district by district Within 18 months door-to-door collection had been extended to all districts for food waste paper packaging and residual waste Collection frequency varies by material with bio-waste collected more than once per week and residual waste collected weekly (or less frequently in some areas)
The new system was scheduled according to location and population density Waste collection in the city centre occurrs during the night (to avoid blocking streets and causing a nuisance to the night-time economy) while collection in residential areas took place during the mornings Roadside containers were installed for the collection of garden waste and glass
Parma faced a high cost of disposal (euro170 per tonne for its new incinerator) and so the city used a pricing approach to reduce its residual waste stream and lower the overall costs of the system The cityrsquos pay-as-you-throw scheme has a two-part fee structure based on the waste that each household generates The first part is a fixed cost based on the size of the property and household Additional allowances are available for households with children younger than 30 months to account for the additional waste from nappies The fixed cost covers a minimum number of collections per household and also the costs of management and enforcement Additional removals of residual waste beyond the fixed number incur a cost per bag or bin441
Households can earn additional lsquoeco-pointsrsquo for sorting and disposing of electronic hazardous and medical waste in the appropriate way Eco-points are worth a discount of euro015 on the following yearrsquos waste bill up to a maximum discount of euro20442
Households also receive a 12 per cent discount on their bill for home composting443
Parma also introduced lsquoeco-stationsrsquo and lsquoeco-wagonsrsquo to complement the door-to-door collection system and provide flexibility Eco-stations are small kiosks open 24 hours a day where people can recycle their waste outside of the main door-to-door collection hours Recyclables are free to deposit while residual waste incurs a fee Kiosks have eight windows where
recyclables and residual waste can be left accessible with a user card which is also used to collect eco-points for depositing recyclables Eco-wagons are located in the city centre and support the other waste collection services The system operates like a bus service with routes and stations to enable people to bring out their waste at the appropriate time
Barriers and critical success factorsA communication campaign targeting local residents was essential to the success of the new waste system in Parma This included awareness-raising in public squares information sent to peoplersquos homes a specially created hotline and a competition between schools to reduce waste
Residents were concerned that waste collection would not be frequent enough so the eco-stations gave them the option of bringing their extra waste for disposal444 The flexibility of the system increased its acceptability and peoplersquos willingness to support the new approach445
Illegal dumping and fraud were also concerns ahead of the transition Residents are protected through the use of RFID tags in each bag so they are only charged for their own waste The city also installed CCTV
441 Ibid 442 See 2020 Collectors Project (2020)443 See Zero Waste Europe (2016)444 See Heinrich (2018)445 See 2020 Collectors Project (2020)
Case studies - waste
171
cameras at eco-stations and created an app for residents to report illegal dumping Overall rates of illegal dumping were low at around 500 g per capita per year446
Results and lessons learnedThe new system dramatically reduced residual waste and increased the collection of recyclable and biodegradable materials As of 2018 Parma had achieved the following capture rates447
bull paper 81 per cent
bull plastic 69 per cent
bull metal 33 per cent
bull glass 93 per cent
bull composite material 36 per cent
Meanwhile kerbside collection of bio-waste collection nearly doubled from 50 kg to 100 kg per capita per year between 2011 and 2015 while the fraction of impurities fell from 8 per cent to 3 per cent448
Typical costs for households rose in the early years as investments were made in both capital and operations However as the system settled in and savings were captured by reducing disposal costs the cost for customers began to fall After a peak in 2013 typical costs in 2016 were at a similar level to those seen in 2010 before the new system was implemented (around euro250 a year for a three-person household) In effect the city is delivering much better outcomes for the same cost as the old system449
The success in Parma helped the adoption of targets in Emilia-Romagna which exceed national and EU requirements including a 25 per cent reduction of total waste 73 per cent separate collection and 70 per cent effective recycling This system incentivised
cities to achieve the best performance while penalising those lagging behind Through this regional system of incentives Parma has received euro710000 for its reduction of residual waste450
Links to similar initiativesLjubljana zero-waste city San Francisco zero waste by 2020 Flanders waste management
446 See Heinrich (2018)447 See 2020 Collectors Project (2020)448 See Ricci (2020)449 See Heinrich (2018)450 See Zero Waste Europe (2016)
Case studies - waste
172
Snapshot
bull Location Belo Horizonte Brazil
bull Population Large ndash 25 million (2015)
bull Policy area Waste
bull Policy options Formalisation of informal services improvement of waste collection
bull Financial capacity Limited
bull Administrative capacity Strengthening
Context and policy overview451
Belo Horizonte is a large middle-income city in the Brazilian state of Minas Gerais The cityrsquos population has grown rapidly from around 35 million in 1990 to around 6 million today
Waste management has been a key challenge for Belo Horizonte as the city has grown In the mid-20th century much of its waste went to an open dumpsite which was scavenged for valuable materials by catadores waste pickers living on the margins of society The city stopped this practice when the dumpsite was closed and replaced with a sanitary landfill in the early 1970s The waste pickers continued to operate but were marginalised and persecuted by the authorities responsible for urban sanitation In response the catadores made use of 1988 legislation to form a workersrsquo cooperative called the Association of Collectors of Paper Cardboard and Recyclable Material (ASMARE)452
In the 1990s the city developed a flexible and integrated system of solid waste management which incorporated the waste pickers into a formalised relationship with the cityrsquos waste authority SLU and the wider waste and recycling ecosystem According to Aurora Pederzoli SLU Chief of Special Programmes ldquoOur solid waste management model is based on
Formalisation of informal waste pickers Belo Horizonte Brazil
Belo Horizonte Brazilrsquos third-largest city began to address its waste management issues in the 1970s with a new sanitary landfill However it took a new formalised relationship with catadores ndash informal waste pickers ndash to deliver a truly integrated solid waste management system
451 See Centre for Public Impact (2016)452 See Magni and Guumlnther (2014)
Case studies - waste
173
a concept of social inclusion and income and job generationrdquo453
ImplementationThe cityrsquos adversarial relationship with waste pickers began to change when the Pastoral de Rua of the Archdiocese of Belo Horizonte engaged with the cooperative to understand their needs and aims The Pastoral mediated negotiations with the city to develop a plan for the waste management system which had the support of all participants ndash the city the waste authority ASMARE and other waste businesses454
Belo Horizontersquos environmental plan for recovery and recycling of civil construction waste was initiated in 1993 to provide a mixed system of waste collection and drop-off sites with selective waste-sorting carried out by the waste pickers455 The city introduced weekly kerbside collection of paper metal glass and plastic and established collection sites for households not served by kerbside collection Waste from both streams was sent to the cooperative warehouses for the sorting and recovery of recyclable materials456
In 2003 the city set up a citizenrsquos forum to facilitate greater dialogue on waste issues The purpose of the forum was both to review progress and to expand the system to include other workersrsquo cooperatives457
In 2011 the state government introduced a lsquorecycling bonusrsquo a financial incentive for the waste pickers Payments are made on the basis of the quality and value of the recyclable raw materials The payment provides an additional source of income for these workers but also provides an incentive to the cooperatives to innovate to improve the quality of recyclates and to improve business management practices458
Barriers and critical success factorsThe cityrsquos successful approach was preceded by a long period of dispute and acrimony with waste pickers
Intensive communication and sustained political support for the new integrated system were therefore essential to overcome the legacy of mistrust between different actors in the cityrsquos waste system Belo Horizonte used creative communication approaches including carnival parades theatre dance and music to change public attitudes to the waste pickers and their positive contributions to the cityrsquos environmental quality
The legal framework limited the cityrsquos ability to reform the waste system These issues were addressed over time including through a change at city level to assign the rights to cooperatives to collect and sell recyclable raw materials At the federal level in 2001 waste collecting was classified as a professional occupation459
453 See LSE Cities ICLEI and GGGI (2013)454 See Magni and Guumlnther (2014)455 See Sabatino (2017)456 See Centre for Public Impact (2016)457 See Sabatino (2017)458 See Dias (2016)459 See Sabatino (2017)
Case studies - waste
174460 See Centre for Public Impact (2016)461 Ibid 462 See Colombijn and Morbidini (2017)463 See Centre for Public Impact (2016)464 See LSE Cities ICLEI and GGGI (2013)
Results and lessons learnedThe achievements and positive change in Belo Horizontersquos waste management have proved to be a model for other Brazilian cities Key outcomes included the following
bull By 2012 the cityrsquos formal waste management system was serving 95 per cent of the urban population and at least 70 per cent of favelas with 93 per cent of residual waste being disposed of in sanitary landfills460
bull Some 3000 waste workers are supported by the system and together with the municipal waste management system they had collectively recycled up to 20000 tonnes by 2012
bull Working conditions for waste collectors improved significantly with the introduction of a monthly minimum wage of euro270461 The cooperatives provide the workers with a degree of security462
bull Skills development and training were delivered through a Municipal Waste and Citizenship Forum which was supported by municipal funding and additional support of euro125000 from Caixa Bank463
bull Recycling outcomes were relatively low with recycling rates remaining below 10 per cent as of 2008464
Links to similar initiativesBangalore informal waste pickers Four strategies to integrate waste pickers Waste pickers and cities
Case studies - governance
175
Snapshot
bull Location Poland
bull Population 378 million countrywide (2019)
bull Policy area Governance
bull Policy option Political and fiscal decentralisation
bull Financial capacity Strengthening
bull Administrative capacity Strengthening
Context and policy overviewDecentralisation in Poland began soon after the collapse of the Soviet Union The early reforms devolved various central government functions including some revenue-raising authority to existing municipalities In 1999 the country implemented structural reforms of provincial and local government which saw further devolution of powers to counties
and municipalities bringing public services closer to people and making local government in Poland more accountable to its electorate465
Most of the interaction between citizens and public services occurs at the local level and in Poland local governments have a good reputation466 This success was achieved through reforms to administration and by strengthening the capacities of cities and regions467 To implement reform changes were made to legislation and the operation of public administration The implementation process was monitored and evaluated and the public were kept informed468
ImplementationFundamental changes were required to the structure of central and local systems including to legislation staffing and organisation It was also necessary to address issues regarding the ownership of public infrastructure and services
Initially the state established new institutions including new offices for the different levels of public
Political and fiscal decentralisation Poland
Decentralisation in Poland has been successful leading to increased local revenue and improved service delivery Most interaction between citizens and public administration now occurs at the level of local governments the most trusted institutions in the country
465 See World Bank Group (2017) 466 See Laszek and Trzeciakowski (2018) 467 See European Association for Local Democracy (2016) 468 See Kulesza (nd)
Case studies - governance
176
469 See demosEuropa ndash Centre for European Strategy (2015) 470 See Szescilo and Kulesza (2012) 471 See World Bank Group (2017)472 See Schiffbauer and Varela (2019) 473 See Szescilo (nd) 474 See Laszek and Trzeciakowski (2018)475 Ibid
administration followed by a sharing of assets and staff between these institutions Next a list of public institutions was created and passed to territorial self-governments to allow them to take over the running of these assets
In terms of sequencing Polandrsquos series of political and fiscal reforms since 1990 have been delivered through at least three different approaches469 Between 1989 and 1991 the ldquoshock-therapyrdquo technique was used to create rapid change in the economic system In 1997 a ldquobig bangrdquo approach was employed to implement four major structural reforms within a year More recently the preferred approach has been incremental making important decisions in separate stages Of these three approaches the 1997 reforms in particular towards a three-tier system of local and regional self-government enabled local communities and society as a whole to take a greater stake in the countryrsquos development Delegating responsiblity for public tasks led to stronger local government470 Municipalities therefore have a high level of autonomy within the Polish system although they must act within the law
Barriers and critical success factorsPoland used a gradual programme of reform to increase transparency and accountability allowing the changes to become effective and the country to absorb large EU funds efficiently471 Initially reforms focused on institutions that did not fit with the new market economy context These efforts were followed by steady action to enable the institutions that had been retained to evolve in response to the growing sophistication of Polandrsquos market economy The shared goal of EU accession also spurred political support for the reform of institutions472
While public expenditure has been decentralised local government has limited control over taxes473 Control over expenditure and revenue alike is important for local government to succeed474
There can be friction between local and national tiers of government when the degree of autonomy is not established in advance It is clear that detailed and well-communicated legislation is key to success
Results and lessons learned
bull Local government has been effective without large regional disparities
bull Service delivery improved because local governments were able to implement centrally designed policies and they had greater accountability
bull Increased accountability allowed local governments to boost their revenue while also benefiting from dependable intergovernmental transfers and large amounts of EU funds
bull Poland has become more resilient to economic downturns
bull In a recent survey local governments ranked as the most trusted public institutions in Poland475
Links to similar initiativesUnited Kingdom decentralisation Colombia decentralisation Finland decentralisation
Case studies - governance
177
Snapshot
bull Location Vienna Austria
bull Population Large ndash 19 million (2019)
bull Economy Service economy
bull Policy area Governance
bull Policy option Improving transparency and accountability
bull Financial capacity Strong
bull Administrative capacity Strong
Context and policy overviewVienna is regularly ranked as the city that offers the worldrsquos best quality of life476 It also has a tradition of strong governance and engagement with residents in constructive participatory dialogue
While Viennarsquos employment rates and average incomes are high the region and the city face
environmental challenges including pollution of the Danube River due to unsustainable development along its banks and increasing air pollution due to private transport477
Against this background in June 2014 Viennarsquos city council adopted the Smart City Wien Framework Strategy (SCWFS) a comprehensive scaffold for developing effective responses to climate change including radical conservation of resources and productive use of new technology Projects that have emerged from the strategy include for instance an initiative for e-car-sharing478 The strategy was updated in 2019 to incorporate the UN Sustainable Development Goals and to reflect the increased urgency of addressing climate change479
There was concern that such a complex long-term framework would develop actions that would be left by the wayside among the daily pressing agendas of local government Therefore the city council required the municipal administration to undertake a periodic monitoring programme and to verify at regular intervals that the frameworkrsquos objectives were being met480 This monitoring was intended to serve as a performance management tool for policymakers
Smart city performance monitoring Austria Vienna
Vienna has developed a comprehensive programme to monitor the impact and key objectives of its Smart City Wien Framework Strategy These include resource conservation innovation and improvements in quality of life
476 See Mercer (2015) 477 See WWF (nd) 478 Ibid479 See Brandl and Zielinska (2020) 480 See Municipal Department MA 18 ndash Urban Development and Planning (2018)
Case studies - governance
178
and to support the city in implementing and updating the strategy
Vienna recognised that to back this monitoring process and make the strategy more transparent the city would need to establish a central data platform This had to cover the entirety of the municipal administration and ensure access for residents and the exchange of information In this way it would involve all of the main stakeholders in the implementation of the SCWFS
Two principles were defined for the monitoring approach First there would be extensive cooperation across city departments and associated organisations to maximise support and ownership The second key principle was to minimise the data collection workload for participants and to focus on analysing the existing data pool and reporting structure
ImplementationVienna created the SCWFS in 2013 following two years of stakeholder engagement and the City Council Resolution of 2014 which first stipulated the need for a monitoring process
The initial step was to conduct an extensive exploratory project to establish a methodology for monitoring that would reflect the objectives of the SCWFS The first monitoring process took place in 2017 as part of an EU-funded project and consisted of
bull monitoring objectives by evaluating them individually based on an extensive set of indicators
bull carrying out overall monitoring of the Frameworkrsquos results
One-third of the objectives could be measured quantitatively However the remaining objectives posed greater challenges as their measurement required extensive qualitative descriptions In these cases individual indicators were grouped together making it possible to assess a subject area in more general terms
Some of the indicators used by the city were found to require greater precision before they could provide a more comprehensive picture although Vienna recognises that evaluation of indicators should be an ongoing process
The monitoring is a resource-heavy and time-consuming process exacerbated by the absence of a central overview of the cityrsquos data Indeed centralised access to the Viennarsquos data pools has been identified as an area for future improvement This could be achieved through further improvement to the online reporting tool already in place and by providing access for the entire municipal authority
An additional evaluation is expected to take place in order to make the process more routine
The monitoring programmersquos key success factor was its integration of evaluation with the strategic performance management cycle for the overall framework This ensured that the findings could be fed back in more effectively
The division of tasks across a multitude of stakeholders according to their areas of expertise (data provision for instance) was supported by academic institutions This approach ensured ownership and reduced the administrative burden on local government
Results and lessons learnedThe cityrsquos monitoring process involved particpants from across the municipality and stakeholder organisations These organisations took different roles in the process from reporting on goals to providing objective evaluation and data This illustrates the methodologyrsquos effective approach of engaging a multitude of stakeholders thus creating ownership of the framework481
One feature of Viennarsquos implementation framework is the Smart City Agency which is responsible for coordinating activities under the framework482 An agency of this kind is a key ingredient in the successful implementation of smart city strategies483
481 See Municipal Department MA 18 ndash Urban Development and Planning (2018)482 See Urban Innovation Vienna (2020) 483 See SmartCities World (2019)
Case studies - governance
179
The monitoring provided evidence-based findings on progress against individual objectives and showed where the city needed to make further progress For example the assessment identified that Viennarsquos CO2 reduction target for 2030 had almost been achieved just one year after the framework was launched Although this was a positive finding the monitoring also identified persistent social disadvantages in access to green space Some measured outcomes of the SCWFS as detailed in the 2017 monitoring report include
bull a reduction in per capita GHG emissions of 33 per cent in 2014 relative to a 1990 baseline (this is a headline goal with the reduction of GHG emissions being the strategyrsquos prime objective)
bull a fall in per capita energy consumption since 2005 of around 14 per cent
bull growth in the share of renewable energy from 121 per cent in 2010 to 195 per cent in 2015
Using the monitoring framework to not only report achievements but to put these in the context of progress against an eventual target ensures a long-term view and identifies the scale of further actions required For example the 2017 monitoring report identified successes and good progress against some targets but also areas of stagnation or poor performance for instance
bull levels of car traffic have stagnated since 2013 and Vienna is not on track to meet its objectives to shift to other modes of transport
bull similar stagnation or fluctuation in the trends for environmental indicators in buildings and in the water and waste sectors suggests that efforts are required to remain on track or get back on track
The accountability offered by a monitoring process has been shown to have a tangible impact on the fulfilment of a cityrsquos strategy Moreover in Vienna the data collection necessary to complete the monitoring and evaluation in a smart way was built on existing databases and enabled the creation of a new online reporting tool
Links to similar initiatives Alba Iulia smart city City of York performance management Utrecht and the UN SDGs
Case studies - governance
180
Snapshot
bull Location Cluj-Napoca Romania
bull Population Medium-sized ndash 303000 (2012)
bull Policy area Governance
bull Policy option Effective stakeholder participation
bull Financial capacity Strengthening
Context and policy overview484
Over the last decade Cluj-Napoca has been the only growing city in Romania Its evolving cultural life has transformed Cluj-Napoca into a vibrant European city with a multicultural environment that attracts tourists and businesses The city received the European Youth Capital title in 2015 a year in which it organised a range of cultural events Cluj-Napoca is home to the Paintbrush Factory an industrial facility that was
converted into a cultural space and is one of the countryrsquos most notable artistic projects485 In short the city has gained its place as a centre of culture and innovation
In 2017 Cluj-Napoca established the Civic Imagination and Innovation Centre (CIIC) offering residents the opportunity to take part in shaping their city and community The inauguration of the CIIC was marked with a debate to identify solutions for the regeneration of a local park Local government representatives residents specialists and academics meet at the CIIC to collaborate on transforming the city
The CIIC is led by public administration It has no permanent location and functions by collaborating with the community The centre is funded by the municipal budget costing the city euro10000-euro15000 n month486
Co-designing and co-creating urban solutions Cluj-Napoca Romania
Cluj-Napoca established a centre for civic innovation and imagination to encourage debate and collaboration among community representatives and city stakeholders about urban projects
484 See ROCK (2019) 485 See ASEF CULTURE360 (2011)486 See Innovation and Civic Imagination Centre ndash CIIC (2019)
Case studies - governance
181
ImplementationThe CIIC has revamped the cityrsquos method for designing and developing large-scale urban intervention projects Debates focus on an array of themes such as urban and public spaces and museums
In 2018 the centre hosted the third Romanian national workshop on the ldquoAttractive Danuberdquo The worshoprsquos overall objective was to identify at a national level measurable indicators of the attractiveness of a region (for the purposes of investment in tourism and business) However the workshop held in Cluj focused specifically on bringing the discussion towards local problems and solutions487 Attendance was broad ranging from various levels of government to interest groups academics and businesses The Territorial Attractiveness Monitoring Platform (TAMP) an open online platform that maximises accessibility was introduced at the event and received good feedback This workshop alongside other national workshops in the series yielded recommendations from a diverse range of 35 organisations to include 86 draft Territorial Attractiveness indicators within the TAMP tool488
Early 2019 saw two further debates one on an urban plan for a large-scale development area (Sopor) and a citizen panel focused on EU Cohesion Policy
Barriers and critical success factors Having clear objectives for meetings and communications was important in Cluj-Napoca to ensure that people understood the purpose of these events It was also important to assign a manager who would be in charge of analysing the information collected
Using a multidisciplinary approach CIIC events elicited a number of viewpoints which allowed a story to be told and engaged the community Where there were socio-cultural differences the CIIC used facilitators to resolve clashes and address the local dynamics Local communities had the opportunity to learn about the process of urban development and planning
In addition communication about government intentions and an inclusive dialogue that
accommodated differing points of view were important for promoting public participation Furthermore the centre offered capacity-building for stakeholder engagement to local communities helping them to understand the planning and urban development process step by step
Results and lessons learnedThe centre has enabled the creation of levers such as public debates oriented towards addressing urban problems and bridging the gap between three key groups the city administration experts and residents
Two years after CIICrsquos inauguration residents are more aware of the opportunities they have to participate and feel empowered to take part in the urban planning and development The move has enabled more innovation and new ideas allowing the community to become involved and to have more interaction with the changes to their city
The success of the CIIC shows that active engagement of residents in urban planning does not need to come at a very high cost Moreover the experience in Cluj-Napoca demonstrates the importance of setting clear objectives and expectations with regard to facilitating debates between residents and policymakers
Links to similar initiativesSkopje innovation lab Bologna civic collaboration Lyon citizen participation Satildeo Paulo civic participation
487 See UrbaSofia (2018) 488 See Interreg Danube Transnational Programme (2018)
Case studies - finance
182
Snapshot
bull Location Bogotaacute Colombia
bull Population Large ndash 71 million (2018)
bull Policy area Finance
bull Policy option Improved revenue and financial autonomy
bull Financial capacity Strengthening
bull Administrative capacity Strengthening
Context and policy overviewLegislation authorising the use of a betterment levy known as the contribucioacuten de valorizacioacuten is common in Latin American countries This form of levy is often opposed because it can be complex and resource intensive However in Colombia the betterment levy has been used regularly to raise revenue to fund public works489 490
ImplementationThe amount of the betterment levy is set to the lowest value among the following three factors
bull the cost of the project
bull the value that the project creates
bull the affordability of the levy (whether property owners can afford to pay the levy)
Bogotaacute has been innovative in its use of the levy For example the city applied it across a package of road projects and other infrastructure upgrades491
The Urban Development Institute (Instituto de Desarrollo Urbano or IDU) is responsible for administering the betterment levy in Bogotaacute The IDU also selects the infrastructure upgrades that the levy will finance All affected properties are subject to the levy which is calculated by multiplying different benefit factors
The IDU defines the ldquoareas of influencerdquo that will benefit from the levy This definition is based on a propertyrsquos proximity and access to a project and hence to benefits (such as an increase in land value) The IDU endeavours to maximise the number of properties within this area in order to lower the average burden of the levy on individual properties The benefits for an area could include for instance
bull better road layouts leading to increased mobility and transit speeds shorter transit
Land-value capture Bogotaacute Colombia
Bogotaacute has applied a form of ldquobetterment levyrdquo to finance road and other infrastructure upgrade projects around the whole city
489 See World Bank (2009)490 See Borrero Ochoa (2011)491 Ibid
Case studies - finance
183
times lower operating costs and a better quality of life
bull better public spaces
bull stimulation of new commercial activity
bull increased real estate value
bull better integration of the area into the city structure
bull regeneration
In Bogotaacute the betterment levies are no longer tied specifically to incremental changes in land value492
Barriers and critical success factorsInitial criticism emerged in relation to the cost of implementing the levy system for infrastructure projects (particularly the cost of administration) and in relation to the calculation of land value gains which were not measured directly and were therefore found to be inaccurate To address the criticism and reduce the burden on those paying the levy city authorities had an incentive to underestimate the cost of infrastructure projects which led to underfunding of infrastructure The authorities also focused schemes in wealthier areas where landowners could pay more easily As a result infrastructure improvements were unequally distributed across Bogotaacute493
Creating trust is an essential component of the success of betterment levies This trust must be built largely on affordability the equitable distribution of benefits the promotion of social value and participation by city residents in the process and its implementation494
In Bogotaacute public resistance to the betterment levy has since been tempered by spreading public works improvements across the entire urban area In addition the city has given residents the option to pay the levy over five years minimising the financial impact on each property owner This has enabled
Bogotaacute to use valorizacioacuten payments to repay the short-term debt used to fund construction
Results and lessons learned
bull In the period 1997-2007 Bogotaacute financed 217 public works projects through the contribucioacuten de valorizacioacuten These projects were located throughout the city and primarily consisted of bridge and road projects and improvements to drainage495
bull Over the same period the city used the levy to finance more than US$ 1 billion of municipal public works496
Links to similar initiativesChina and India value capture via land sale Satildeo Paulo sale of development rights Istanbul municipal and state land sales
492 Ibid 493 See World Bank (2009)494 See Borrero Ochoa (2011)495 See World Bank (2009)496 See Blanco et al (2017)
Case studies - finance
184
Snapshot
bull Location Rijeka Croatia
bull Population Small ndash 128000 (2011)
bull Policy area Finance
bull Policy option Improved accountability and transparency
bull Financial capacity Strengthening
bull Administrative capacity Strong
Context and policy overviewRijeka is a port city in Croatia comprised of 34 municipal entities and a population of 130000497 It is one of the smallest and most densely populated cities in Croatia In recent decades Rijeka has grown steadily intensifying environmental challenges such
as transport pollution light pollution and wastewater treatment498
The city undertook several investments in the early 2000s to address these challenges including funding 13 buses and 8 minibuses that run on CNG and establishing Croatiarsquos first CNG filling station However in order to facilitate these investments Rijeka needed to assess its financial position and improve the financial management of the municipality499
The strategic objectives of the city were
bull to attract global investment through the development of the Rijeka Gateway project
bull to develop a competitive economy based on knowledge and new technology and
bull to strengthen social inclusion through the implementation of capital investment projects
Diagnosis framework for municipal finance Rijeka Croatia
Rijeka has successfully implemented the World Bankrsquos Municipal Finance Self-Assessment framework to evaluate the cityrsquos financial health and identify specific actions that will improve its public spending and mobilisation of funding
497 See Croatian Bureau of Statistics (2012)498 See World Bank Institute (2013)499 See Environmental Local Authorities InterBalkan Network (nd)
Case studies - finance
185
In 2012 Rijeka used the World Bankrsquos Municipal Finance Self-Assessment (MFSA) tool to strategically assess its finances and develop a long-term action plan for financial management and investment decisions500
ImplementationThe work of applying the MFSA began in 2012 The framework provides a common methodology and internationally accepted indicators which can aid cities in accessing external funding and in more efficiently tracking local resources and spending over time The key steps of the framework are as follows501
1 Transform core databases of municipal financial data into the MFSA format
2 Carry out analysis of historic trends and balances and assess the level of services provided
3 Calculate financial ratios and set benchmarks
4 Use growth trends to identify financial needs and the implications of future policy decisions
5 Assess the quality of financial management using performance indicators identifying strengths and weaknesses in the current system
The MFSA framework is intended to improve the transparency of municipal financial management and help cities make more prudent investment decisions
As a self-assessment this approach can require significant administrative resources to review the current spending and finances of a city However the task can be outsourced to external auditors so that the local government are not direct owners of the process but instead analyse and interpret the results to develop a long-term action plan
Rijeka prides itself on its strong digital credentials and sought to incorporate its smart city infrastructure into this self-assessment to make its municipal finance more transparent and encourage residents to become involved502 In 2011 Rijeka launched an interactive game Proračun(ajme) (Budget me) on its municipal open data portal The game allowed residents to create their own budget for the city based on existing funds This educated people about details of the current budget and allowed them to simulate juggling the city finances503
The strategic long-term financial plan was published in 2014 Subsequent developments in relation to the transparency of municipal finance included the development of a public finance portal created in 2016
500 See World Bank Institute (2013)501 Ibid 502 See Filipovic (2019) 503 Proračun Grada Rijeke (2018)
Case studies - finance
186
The self-assessment revealed that between 2008 and 2012 Rijekarsquos average annual decrease in revenue was 29 per cent and the debt burden increased significantly These findings along with the financial ratio analysis indicated that the cityrsquos fiscal autonomy was weak These trends reflected the economic crisis of 2008 and falling GDP at the national level504
This assessment enabled the city to identify its need to finance capital expenditure through the national government or private financing which it could achieve by strengthening municipal financial transparency and accountability The procedures and benchmarking established by the MFSA assist in this process
The framework has a number of unique features that differentiate it from normal practices It can promote accountability in local administration by focusing on self-assessment by municipal staff which also enables them to more effectively identify the most realistic actions to place in their improvement plan505
City officials are also actively encouraged to share their findings with other cities to promote learning and visibility in the use of public funds An example of this approach was the UPP Technical Workshop on Municipal Finance and Urban Audit held in 2018 with 40 participants from cities in Albanian and North Macedonia506
Results and lessons learnedBy using the MFSA approach Rijeka developed an action plan to improve its finances The main objectives of this multi-year planning and capital investment programme were507
bull to provide a stronger revenue foundation for the city with more robust local tax collection
bull to increase the autonomy and flexibility of financial operations
bull to improve financial management and build capacity and financial literacy within the city council
The MFSA tool not only helped Rijeka to identify these key objectives but also enabled the city to meet these goals in the future by providing a key framework for tracking spending through the use of financial ratio analysis which creates municipal finance benchmarks for internal purposes
Links to similar initiativesZaprešić creditworthiness Kolkata creditworthiness Istanbul land asset management
504 See World Bank Institute (2013)505 See Farvacque-Vitkovic and Sinet (2014)506 See SEE Cities (2018)507 See World Bank (2013)
Case studies - finance
187
Snapshot
bull Country Melbourne Australia
bull Population Large ndash 48 million (2017)
bull Policy area Finance
bull Policy option Municipal funding support for green investments
bull Financial capacity Strong
bull Administrative capacity Strong
Context and policy overviewIn 2003 the city of Melbourne set out a roadmap to achieve net zero emissions by 2020508 The Sustainable Melbourne Fund (SMF) was established concurrently with the roadmap preparation in order to provide financial support to businesses implementing projects that have an environmental benefit These projects include everything from solar waste and
water solutions to more innovative and complex measures such as waste to energy projects509
The SMF furthers the city councilrsquos sustainability goals ensuring that the activities it funds create financial social and environmental benefits
In 2016 the fund was valued at AUD 156 million including an initial investment of AUD 5 million in equity and a further AUD 10 million debt facility510 This success led to national expansion of the programme In 2019 the fund was recapitalised and expanded across Australia with increased investment becoming the Sustainable Australia Fund511
The fund allows both tenants and property owners of small and medium-sized enterprises (SMEs) to obtain up to 100 per cent finance with repayments made through the local council (often through property rates) This enables a business to get an immediate boost to its profits through a reduction in energy bills while property owners benefit from capital growth to their building Loans of up to AUD 500000 are provided for individual projects that deliver environmental and economic benefits512
Climate Fund Melbourne Australia
The Sustainable Melbourne Fund allows both tenants and property owners of small and medium-sized enterprises to obtain 100 per cent finance for renewable-energy and energy-efficiency projects with repayments made through council rates
508 See City of Melbourne (2008)509 See City of Melbourne (nd)510 See C40 Cities (2016)511 See Sustainable Australia Fund (2020)512 See City of Melbourne (2020)
Case studies - finance
188
513 See Sustainable Australia Fund (2020)514 See C40 Cities (2016)515 See Better Building Finance (nd)516 See C40 Cities (2016)517 Ibid 518 Ibid
ImplementationA key component of the SMF programme involves financing packages that are designed to overcome the hurdle of owners lacking credit The Environmental Upgrade Finance (EUF) for instance is a flagship product developed for the programme and administered by the SMF
The EUF is an agreement between parties ndash the owner of the building a financial institution and the city of Melbourne The financial institution lends money to the building owner and the city uses rates andor taxes to collect the loan repayments and return these funds to the lender The loans are specially designed to include fixed interest rates and repayment periods of up to 20 years Importantly the charge is fixed to the building and can be passed on to the next owner if the building is sold513
As a further option retrofitting costs (in other words the loan) can be shared between the owner and the tenant as a way of overcoming the split-incentive dilemma whereby the owner pays for an upgrade and the tenants benefit from lower energy expenses514 The SMF also developed a simple application process for SMEs that does not require consent or approval from the existing financiers of the properties
Barriers and critical success factorsDeveloping new products and services of this type requires a sound understanding of where market gaps exist The SMF studied the market produced novel revenue models went beyond the simpler goal of stimulating economic activity in the sustainability sector and created scalable products and services
When a city operates a climate fund it can require substantial resources Frequently the city will also depend on partner organisations to help in particular technical or specialist areas such as creating communications and sales strategies For example the SMF partnered with ClimateWorks Australia to create the Better Building Finance website515
Communications and public relations are also critical in the creation of climate funds It is also vital to sell as much of the financial package as possible516
Results and lessons learned
bull The SMF has directly invested more than AUD 169 million (US$ 125 million equivalent) in building retrofits district or neighbourhood innovations renewable energy systems software technology and lighting solutions517
bull Cumulatively these investments have led to GHG reductions that exceed 245000 tonnes The SMF reinvests the returns and co-finances projects with other banks Altogether this work has resulted in more than AUD 26 million (US$ 192 million) of projects in energy efficiency and renewable energy518
Councils can play a key role as facilitators between tenants property owners and financial institutions Melbourne has demonstrated a role for councils in developing new financial products and services that meet the needs of disparate groups The council found that the SMFrsquos administrator role in environmental upgrade agreements was cost effective and aligned with the preferences of the industryrsquos key actors
Links to similar initiativesMelbourne renewable energy aggregated power purchase agreement San Francisco investment grant Mexico City green bond
189
AfDB ADB EBRD and IDB (2019) Creating Liveable Cities Regional Perspectives ADB Manila Available at httpswwwadborgsitesdefaultfilespublication531126livable-cities-main-reportpdf (last accessed 18 August 2020)
M F Alam S S Guntoju and A Sikka (2019) ldquoChennai Water crisis a wake-up call for Indian citiesrdquo Down to Earth Available at httpswwwdowntoearthorginblogwaterchennai-water-crisis-a-wake-up-call-for-indian-cities-66024 (last accessed on 29 September 2020)
E Al-Karablieh and A Salman (2016) ldquoWater Resources Use and Management in Jordan ndash a Focus on Groundwaterrdquo IWMI Project Report 11 Available at httpsgw-menaiwmiorgwp-contentuploadssites3201704Rep11-Water-resources-use-and-management-in-Jordan-a-focus-on-groundwaterpdf (last accessed on 29 September 2020)
African Circular Cities Alliance (nd) ldquoSouth Africa Case Studiesrdquo ACCA Available at httpsafriccaorgcase-studiesSouthAfrica (last accessed on 24 September 2020)
M P G Aguilar (2015) ldquoParticipatory Design for Public Urban Spacesrdquo Global Compact Cities Programme website Available at httpscitiesprogrammeorgwp-contentuploads201910participatory_design-report_webpdf (last accessed 18 August 2020)
Ajuntament de Barcelona (nda) ldquoCitizen Commitment to Sustainability ndash a More Sustainable Barcelonardquo Available at httpsajuntamentbarcelonacatecologiaurbanaenwhat-we-do-and-whypublic-commitmentcitizen-engagement-network (last accessed on 29 September 2020)
Ajuntament de Barcelona (ndb) ldquoSuperblocks - lsquoLetrsquos fill the streets with lifersquordquo Available at httpsajuntamentbarcelonacatecologiaurbanaenbodies-involvedcitizen-participationsuperblocks (last accessed on 29 September 2020)
Ajuntament de Barcelona (ndc) ldquoA road map to combat climate changerdquo Available at httpswwwbarcelonacatbarcelona-pel-climaennoticiaa-road-map-to-combat-climate-change_646065 (last accessed on 29 September 2020)
Ajuntament de Barcelona (ndd) ldquoUrban Mobility Plan (2013-2018)rdquo Available at httpsajuntamentbarcelonacatecologiaurbanaenwhat-we-do-and-whyactive-and-sustainable-mobilityurban-mobility-plan (last accessed on 29 September 2020)
Ajuntament de Barcelona (nde) ldquoNew Urban Mobility Plan for 2019-2024rdquo Available at httpswwwbarcelonacatmobilitatennews-and-documentsnew-urban-mobility-plan-2019-2024 (last accessed on 29 September 2020)
S Aparcana (2017) ldquoApproaches to formalization of the informal waste sector into municipal solid waste management systems in low- and middle-income countries Review of barriers and success factorsrdquo Waste Management Vol 61 pp 593-607
ASEF CULTURE360 (2011) ldquoThe Paintbrush Factoryrdquo Available at httpsculture360aseforgresourcespaintbrush-factory (last accessed on 6 August 2019)
Asian Development Bank (2011) Inclusive Cities Urban Development Series Manila Available at httpswwwadborgpublicationsinclusivecities (last accessed 18 August 2020)
AVK International (nd) ldquoExcessive leakage reduction in Drakensteinrdquo Available at httpswwwavkvalveseuencaseswater-casesleakage-reduction-drakenstein (last accessed on 5 August 2019)
R L Baghdali T Yino M Nasereddin and L Nadifi (2013) ldquoDocumentation of best practices in non-revenue water management in selected Mediterranean countriesrdquo Available at httpwwwswim-smeufilesBest_Practices_in_non-revenue_water_EN_Finalpdf (last accessed on 29 September 2020)
Baltic Environment and Energy (2007) ldquoSwedish Environmental Policies History and present regulationsrdquo Available at httpwwwubcwheeleudownloadphpattachmentsarticles607Swedish20environmental20policypdf (last accessed on 20 October 2020)
L Barber (2016) ldquoCarsharing carpooling ridesharinghellipwhatrsquos the differencerdquo 12 May 2016 Liftshare website Available at httpblogliftsharecomliftsharecarsharing-carpooling-ridesharing-whats-thedifference (last accessed 18 August 2020)
Barcelona Energia (2019) ldquoNuestra Actividadrdquo Barcelona Energia web page Available at httpswwwbarcelonaenergiacatesnuestraactividad (last accessed 18 August 2020)
U Batsaikhan Z Darvas and I Goncalves Raposo (2018) People on the move migration and mobility in the European Union Blueprint Series 28 Bruegel Brussels Available at httpbruegelorgwp-contentuploads201801People_on_the_move_ONLINEpdf (last accessed 18 August 2020)
M Bausells (2016) ldquoSuperblocks to the rescue Barcelonarsquos plan to give streets back to residentsrdquo The Guardian 17 May 2016 Available at httpswwwtheguardiancomcities2016may17superblocks-rescue-barcelona-spain-plan-give-streets-back-residents (last accessed on 29 September 2020)
BBC (2009) ldquoThe city where bicycles dominaterdquo Available at httpnewsbbccouk1hiengland8393475stm (last accessed on 20 October 2020)
BBC News (2016) ldquoYoung people urged for park-life viewsrdquo M Kinver September 2016 BBC website Available at httpswwwbbccouknewsscience-environment-37505850 (last accessed 18 August 2020)
Berliner Energieagentur (nda) ldquoEnergy Saving Partnership A Berlin Success Modelrdquo Available at httpseceuropaeuenergyintelligentprojectssitesiee-projectsfilesprojectsdocumentseesi_good_practices_from_berlin_enpdf (last accessed 8 October 2020)
Berliner Energieagentur (ndb) ldquoBerliner Energiesparpartnerschaftenrdquo Berliner-e-agenturde Available at httpswwwberliner-e-agenturdeennode154 (last accessed 8 October 2020)
Berliner Energieagentur (2006) ldquoPerformance Contracting A Berlin Success Modelrdquo Berlin Senate Department of Urban Development Available at httpswwwberliner-e-agenturdesitesdefaultfiles2018-09broschuereenergiesparpartnerschaftenpdf (last accessed 12 July 2019)
Berliner Energieagentur (2019) ldquoMarket Report on the German EPC Marketrdquo Available at httpsguarantee-projecteudewp-contentuploadssites2201612guarantEE_Market_Report_Germanypdf (last accessed 11 October 2020)
Better Building Finance (nd) website Available at httpsbetterbuildingfinancecomau (last accessed on 8 October 2020)
J R Bilbao (2015) ldquoWhat is the Territorial Approach to Local Developmentrdquo Capacity4Dev knowledge sharing platform Available at httpseuropaeucapacity4devarticlewhat-territorial-approach-localdevelopment (last accessed 18 August 2020)
A G Blanco M Nancy Moreno D M Vetter and M F Vetter for Inter-American Development Bank (2017) ldquoThe Potential of Land Value Capture for financing urban projects methodological considerations and case studiesrdquo Available at httpspublicationsiadborgpublicationsenglishdocumentThe-Potential-of-Land-Value-Capture-for-Financing-Urban-Projects-Methodological-Considerations-and-Case-Studiespdf (last accessed on 8 October 2020)
References
190
Bloomberg (2017) ldquoBarcelonarsquos Car-Taming lsquoSuperblocksrsquo Meet Resistancerdquo Available at httpswwwbloombergcomnewsarticles2017-01-20barcelona-s-superblocks-expand-but-face-protests (last accessed on 29 September 2020)
Bloomberg Citylab (2012a) ldquoWhat Cities Can Learn From Torontorsquos Green Roof Policyrdquo Available at httpswwwcitylabcomdesign201204what-cities-can-learn-torontos-green-roof-policy1846 (last accessed 18 August 2020)
Bloomberg Citylab (2012b) ldquoWhy Denser Cities Are Smarter and More Productiverdquo 10 December 2012 RFlorida Available at httpswwwbloombergcomnewsarticles2012-12-10why-denser-citiesare-smarter-and-more-productivetargetText=Specifically2C20doubling20density20productivityof20two20to20four20percentamptargetText=It20thus20goes20well20beyondperformance20of20individual20industrial20sectors (last accessed 18 August 2020)
O Borrero Ochoa (2011) ldquoBetterment Levy in Colombia Relevance Procedures and Social Acceptabilityrdquo Available at httpswwwlincolninstedusitesdefaultfilespubfiles1899_1213_LLA110404pdf (last accessed on 6 August 2019)
A Bortoleto A and K Hanaki (2006) ldquoAnalysis of Waste Prevention Policies Applied at the Solid Waste Management in Belo Horizonte Brazilrdquo Available at httpswwwiswaorguploadstx_iswaknowledgebase543801_Paperpdf (last accessed on 25 October 2020)
B Boza-Kiss P Bertoldi and M Economidou (2017) Energy Service Companies in the EU Status review and recommendations for further market development with a focus on Energy Performance Contracting European Commission Joint Research Centre Available at httpspublicationsjrceceuropaeurepositorybitstreamJRC106624kjna28716ennpdf (last accessed 11 October 2020)
J Brandl and I Zielinska (2020) ldquoReviewing the Smart City Vienna Framework Strategyrsquos Potential as an Eco-Social Policy in the Context of Quality of Work and Socio-Ecological Transformationrdquo Sustainability 2020 Vol 12 (3) 859 Available at httpsdoiorg103390su12030859 (last accessed 24 September 2020)
M Braun (2017) ldquoBike Sharing System in Burgas (Bulgaria)rdquo Available at httpswwweltisorgdiscovercase-studiesbike-sharing-system-burgas-bulgaria (last accessed on 20 October 2020)
D Broekhoff G Piggott and P Erickson (2018) Building Thriving Low-Carbon Cities An Overview of Policy Options for National Governmentsrdquo Coalition for Urban Transitions London and Washington DC Available at httpsurbantransitionsglobalenpublicationbuilding-thriving-lowcarbon-cities-an-overview-of-policy-options-for-national-governments (last accessed 18 August 2020)
J M Bryson B C Crosby and M Middleton Stone (2015) ldquoDesigning and Implementing Cross-Sector Collaborations Needed and Challengingrdquo Public Administration Review Vol 75 (5) pp 647-663 Available at httpswwwhhhumnedusiteshhhumnedufilesdesigning_and_implementing_cross-sector_collaborations_needed_and_challengingpdf_0pdf (last accessed 18 August 2020)
R Buchler and J Pucher (2011) ldquoSustainable Transport in Freiburg Lessons from Germanyrsquos Environmental Capitalrdquo Available at httpswwwtandfonlinecomdoiabs10108015568311003650531 (last accessed on 20 October 2020)
C Cadell N Falk and F King (2008) ldquoRegeneration in European cities making connectionsrdquo Joseph Rowntree Foundation 7 April 2008 Available at httpswwwjrforgukreportregeneration-european-cities-making-connections (last accessed on 29 September 2020)
Centre for Public Impact (2016) ldquoIntegrated solid waste management in Belo Horizonte Brazilrdquo Available at httpswwwcentreforpublicimpactorgcase-studyintegrated-waste-management-brazil (last accessed on 3 July 2019)
Centre for Public Impact (2017) ldquoThe Seoul Innovation Bureau and its ldquoSharing Cityrdquo initiativerdquo Available at httpswwwcentreforpublicimpactorgcase-studyseoul-innovation-bureau (last accessed on 30 September 2020)
C40 Cities (2015) ldquoYokohama - Yokohama 3R Dream Planrdquo Available at httpswwwc40orgawards2015-awardsprofiles59 (last accessed on 1 October 2020)
C40 Cities (2016a) ldquoCase Study C40 Good Practice Guides Yokohama - 3R Dream Planrdquo Available at httpswwwc40orgcase_studiesc40-good-practice-guides-yokohama-3r-dream-plan (last accessed on 1 October 2020)
C40 Cities (2016b) ldquoC40 Good Practice Guides Melbourne ndash Sustainable Melbourne Fundrdquo Available at httpswwwc40orgcase_studiesc40-good-practice-guides-melbourne-sustainable-melbourne-fund (last accessed on 8 October 2020)
C40 Cities (2016c) ldquoCities 100 Barcelona - Redefining City Blocks to Tackle Traffic-Related Emissionsrdquo Available at httpswwwc40orgcase_studiescities100-barcelona-redefining-city-blocks-to-tackle-traffic-related-emissions (last accessed on 29 September 2020)
C40 Cities (2016d) ldquoCities 100 City Solutions for an Urbanizing Worldrdquo Available at httpsissuucomsustainiadocscities100_2016_final_small (last accessed on 29 September 2020)
C40 Cities (2016e) ldquoGood Practice Guide Waste to Resourcesrdquo Available at httpc40-production-imagess3amazonawscomother_uploadsimages554_W2R_UPDATED_EC_15316originalpdf1458040149 (last accessed on 1 October 2020)
C40 Cities (2017a) ldquoCase Study Cities 100 Cape Town - Industrial Resource Exchanges Reduce CO2rdquo Available at httpswwwc40orgcase_studiescities100-cape-town-industrial-resource-exchanges-reduce-co2 (last accessed on 30 September 2020)
C40 Cities (2017b) ldquoUrban Efficiency II Mexico City ndash Sustainable Buildings Certification Programrdquo case study February 2017 Available at httpswwwc40orgcase_studiesurban-efficiency-2-sustainable-buildingscertification-program (last accessed 18 August 2020)
C40 Cities (2017c) ldquoUrban Efficiency II Seven Innovative City Programmes for Existing Building Energy Efficiencyrdquo Available at httpsissuucomc40citiesdocsurbanefficiencyii_final_hi_res__1_ (last accessed 8 October 2020)
C40 Cities (2018) ldquoThe implementation of the Superblocks programme in Barcelona Filling our streets with liferdquo March 2018 C40 Cities website Available at httpswwwc40orgcase_studiesbarcelona-superblocks (last accessed 18 August 2020)
C40 Cities (2019) ldquoHow to install solar panels on city-owned property and lead by examplerdquo Available at httpswwwc40knowledgehuborgsarticleHow-to-install-solar-panels-on-city-owned-property-and-lead-byexamplelanguage=en_US (last accessed 18 August 2020)
C40 Cities and Climate-KIC (2018) ldquoMunicipality-led circular economy case studiesrdquo Available at httpswwwc40orgresearchesmunicipality-led-circular-economy (last accessed on 12 October 2020)
CityLab (2016) ldquoHow Ljubljana Turned Itself Into Europes lsquoGreen Capitalrsquordquo Available at httpswwwcitylabcomdesign201602how-ljubljana-turned-itself-into-europes-green-capital458934 (last accessed on 19 July 2019)
Citynvest (2015) ldquoBerlin Energy Saving Partnershipsrdquo Available at httpcitynvesteusitesdefaultfileslibrary-documentsModel202_Berlin20Energy20Saving20Partnerships_finalpdf (last accessed 11 October 2020)
City of Copenhagen Technical and Environmental Administration Traffic Department (2011) ldquoThe City of Copenhagenrsquos Bicycle Strategy 2011-2025rdquo Available at httpswwweltisorgsitesdefaultfilescase-studiesdocumentscopenhagens_cycling_strategypdf (last accessed on 16 July 2019)
City of Zaprešić Finance and Budgeting Department (2018) ldquoThe City of Zaprešić Experience in the Application of MFSA ndash Action Planrdquo Available at httpwwwseecitieseuseecitieseuPortals0ImagesUploadDocumentsCity20to20City20dialogue20Skopje202017City20of2020Zapresicpdfver=2018-01-10-084851-633 (last accessed 18 August 2020)
191
City of Ljubljana (2020) ldquoTransport and mobilityrdquo in Ljubljanasi Available at httpswwwljubljanasienljubljana-for-youtransport-in-ljubljana (last accessed 20 October 2020)
City of Melbourne (nd) ldquoSustainable Melbourne Fundrdquo Available at httpwwwmelbournevicgovaubusinesssustainable-businessPagessustainable-melbourne-fundaspx (last accessed on 8 October 2020)
City of Melbourne (2008) ldquoZero Net Emissions by 2020 Update 2008rdquo Available at httpswwwmelbournevicgovauSiteCollectionDocumentszero-net-emissions-2008pdf
City of Stuttgart Office for Environmental Protection (nd) ldquoClimate Atlas of the Region of Stuttgart (2008)rdquo Available at httpswwwstadtklima-stuttgartdeindexphpclimate_climate_atlas_2008 (last accessed on 20 October 2020)
City of Toronto (nd) ldquoSection 37 An Essential Tool for Building Healthier Neighbourhoodsrdquo Available at httpswwwtorontocacity-governmentplanning-developmentofficial-plan-guidelinessection-37-benefits (last accessed on 29 September 2020)
CIVITAS (2009a) ldquoLundrdquo Available at httpscivitaseucontentlund (last accessed on 20 October 2020)
CIVITAS (2009b) ldquoSmart choices for cities Cycling in the Cityrdquo CIVITAS WIKI Policy Analysis Series Available at httpscivitaseusitesdefaultfilesciv_pol-09_m_webpdf (last accessed 18 August 2020)
CIVITAS (2013) ldquoUpdate of the sustainable urban transport planrdquo in Civitaseu Available at httpscivitaseumeasureupdate-sustainable-urban-transport-plan (last accessed 20 October 2020)
Climate ADAPT (2019) ldquoFour pillars to Hamburgrsquos Green Roof Strategy financial incentive dialogue regulation and science (2016)rdquo Available at httpsclimate-adapteeaeuropaeumetadatacase-studiesfour-pillarsto-hamburg2019s-green-roof-strategy-financial-incentive-dialogueregulation-and-sciencecost_benefit_anchor (last accessed 18 August 2020)
Coins Global (2015) ldquoNet Zero Energy Buildings (NZEBs) Building the Futurerdquo February 2015 Available at httpswwwcoins-globalcomstoragedocumentsEmerging-Technologies-for-the-Built-Environmen-Net-Zero-Energy-Buildingspdf (last accessed 18 August 2020)
P Collier E Glaser A Venables M Blake and P Manwaring (2019) ldquoAccess to opportunity policy decisions for enhancing urban mobilityrdquo IGC Cities that Work Policy Framing Paper Available at httpswwwtheigcorgwp-contentuploads201805access-to-opportunity-3-march1pdf (last accessed 18 August 2020)
C Colomb (2007) Making Connections Transforming People and Places in Europe Case Study of Roubaix Lille URBED and the Joseph Rowntree Foundation 29 June 2006 updated December 2007 Available at httpurbedcoopsitesdefaultfilesCase20Study20of20Roubaix20Lillepdf (last accessed on 29 September 2020)
F Colombijn and M Morbidini (2017) ldquoPros and cons of the formation of waste-pickersrsquo cooperatives a comparison between Brazil and Indonesiardquo from Decision 44 91ndash101 Available at httpslinkspringercomarticle101007s40622-017-0149-5 (last accessed on 2 October 2020)
Committee on Climate Change (2016) ldquoNext Steps for UK Heat Policyrdquo Available at httpswwwthecccorgukpublicationnext-steps-for-ukheat-policy (last accessed 18 August 2020)
Copenhagen Resource Institute and Bipro (2014) ldquoCapital factsheet on separate collectionrdquo Available at httpswwwmunicipalwasteeuropeeusitesdefaultfilesSI20Ljubljana20Capital20factsheetpdf (last accessed on 9 July 2019)
J Corfee-Morlot L Khamal Chaoui MG Donovan I Cochran A Robert and PJ Teasdale (2009) ldquoCities Climate Change and Multilevel Governancerdquo OECD Environmental Working Papers No 14 OECD Available at httpswwwoecdorgenvcc44242293pdf (last accessed 18 August 2020)
Croatian Bureau of Statistics (2012) Population by Ethnicity by TownsMunicipalities 2011 Census County of Primorje-Gorski kotar Available at httpswwwdzshrEngcensusescensus2011resultshtm
E01_01_04e01_01_04_zup08html (last accessed on 8 October 2020)
CTCN (2015) ldquoRehabilitation and Modernization of the district heating (DH) system in the City of Banja Lukardquo Climate Technology Centre and Network August 2015 Available at httpswwwctc-norgtechnical-assistanceprojectsrehabilitation-and-modernization-district-heating-dh-systemcity-banja (last accessed 18 August 2020)
L Dakskobler (2019) ldquoFrom no recycling to zero waste how Ljubljana rethought its rubbishrdquo The Guardian May 2019 Available at httpswwwtheguardiancomcities2019may23zero-recycling-to-zero-waste-how-ljubljana-rethought-its-rubbish (last accessed 25 September 2020)
S David AG Sabiescu and L Cantoni (2013) ldquoCo-design with communities A reflection on the literaturerdquo November 2013 Conference paper IDIA 2013 Bangkok Available at httpswwwresearchgatenetpublication257998124_Co-design_with_communities_A_reflection_on_the_literature (last accessed 18 August 2020)
demosEuropa ndash Centre for European Strategy (2015) ldquoPoland as a Global Development Partner Towards Polandrsquos Global Engagementrdquo World Bank Washington DC Available at httppubdocsworldbankorgen228061435014173462Poland-Global-engagementpdf (last accessed 15 October 2020)
Department MA 18 ndash Urban Development and Planning (2018) ldquoMonitoring Report 2017 Smart City Wien Framework Strategyrdquo City of Vienna Urban Development and Planning Available at httpswwwwiengvatstadtentwicklungstudienpdfb008520pdf (last accessed 18 August 2020)
C Deuskar (2015) ldquoWhat does ldquourbanrdquo meanrdquo World Bank Blog June 2015 Available at httpsblogsworldbankorgsustainablecitieswhatdoes-urban-mean (last accessed 18 August 2020)
S M Dias (2016) ldquoWaste pickers and cities Environment amp Urbanisationrdquo from Environment and Urbanization Vol 28 No 2 October 2016 Available at httpsjournalssagepubcomdoipdf1011770956247816657302 (last accessed on 3 July 2019)
D Di Santo (2018) ldquoWhite certificates in Italy what happened what to expectrdquo Bolzano 4 October 2018 Available at httpblogfire-italiaorgwp-contentuploads2018112018-10-white-certificatepdf (last accessed 11 October 2020)
D Di Santo L De Chicchis and E Biele (2018) ldquoWhite certificates in Italy lessons learnt over 12 years of evaluationrdquo from 2018 International Energy Policy and Programme Evaluation Conference Vienna Austria Available at httpswwwdariodisantocomwp-contentuploads2018072018-DiSanto_paper_vienna-IEPPECpdf (last accessed 28 September 2020)
Drakenstein Municipality (2013) ldquoDrakenstein Water Demand Management Programme ndash A resounding successrdquo Available at httpsshowmecozapaarlnewsdrakenstein-water-demand-management-programme-a-resounding-success (last accessed on 29 September 2020)
M Dri P Canfora I Antonopoulos and P Gaudillat (2018) Best environmental management practice for the waste management sector JRC Science Policy Report Publications Office of the European Union Available at httpseceuropaeujrcenpublicationeur-scientific-andtechnical-research-reportsbest-environmental-management-practicewaste-management-sector (last accessed 18 August 2020)
EBRD (2017) ldquoEBRD to fund installation of heat meters in Kazakhstanrdquo S Pyrkalo EBRD website February 2017 Available at httpswwwebrdcomnews2017ebrd-to-fund-installation-of-heat-meters-in-kazakhstan-html (last accessed 18 August 2020)
EBRD (2018a) ldquoGreen Cities Framework ndash Banja Luka District Heatingrdquo project summary document Available at httpswwwebrdcomwork-with-usprojectspsdgrcf-banja-luka-district-heatinghtml (last accessed 18 August 2020)
EBRD (2018b) ldquoMaking district heating happen empowering users through fair meteringrdquo policy paper Available at httpswwwebrdcomdocumentsadminmaking-district-heating-happen-empowering-usersthrough-fair-meteringpdf (last accessed 18 August 2020)
192
EBRD (2019) ldquoFast-growing EBRD Green Citiesrdquo news page Available at httpswwwebrdcomnews2019fastgrowing-ebrd-green-cities-signsup-its-25th-city-html (last accessed 18 August 2020)
EcoMobility SHIFT (nd) ldquoBurgasrdquo Available at httpseceuropaeuenergyintelligentprojectssitesiee-projectsfilesprojectsdocumentsecomobility_shift_ecomobility_shift_case_study_burgas_bg_enpdf (last accessed on 20 October 2020)
The Economist (2012) ldquoThe lure of Chilecon Valleyrdquo The Economist website Available at httpswwweconomistcombusiness20121013the-lure-of-chilecon-valley (last accessed 18 August 2020)
The Economist (2017) ldquoEastern Europersquos wave of emigration may have crestedrdquo The Economist website Available at httpswwweconomistcomeurope20170826eastern-europes-wave-of-emigration-mayhave-crested (last accessed 18 August 2020)
V Edo J Barrio M Allende and M Garcia Nart (1998) ldquoZaragoza Saving Water City (Spain)rdquo Available at httphabitataqupmesbpesonu98bp439enhtml (last accessed on 23 October 2020)
E Eiweida and Z Tokhmakhyan (2011b) ldquoPublic-Private Partnerships Enhances Water Utilityrsquos Performance in Armeniardquo Knowledge Brief issue no 44 Available at httpdocumentsworldbankorgcurateden920781468029671050Public-private-partnership-enhances-water-utilitys-performance-in-Armenia (last accessed on 28 September 2020)
EMF (2019) ldquoPlanning for Compact Connected Citiesrdquo Ellen MacArthur Foundation Available at httpswwwellenmacarthurfoundationorgassetsdownloads1_Buildings_Planning_Mar19pdf (last accessed 18 August 2020)
Energy Cities (2016a) ldquoFrederikshavn Denmark Mobilising savings sleeping on citizens bank accountsrdquo the European association of cities in energy transition January 2016 Available at httpsenergy-citieseufrederikshavn-denmark-mobilising-savings-sleeping-on-citizens-bankaccounts (last accessed 18 August 2020)
Energy Cities (2016b) ldquoldquoSuperblocksrdquo free up to 92 of public space in Barcelonardquo Available at httpenergy-citieseubest-practicesuperblocks-free-up-to-92-of-public-space-in-barcelona (last accessed on 29 September 2020)
Energy Sector Management Assistance Program (ESMAP) (2011a) ldquoGood practices in city energy efficiency Yerevan Armenia ndash Water and Sewerage Management Contractrdquo Energy Efficient Cities Initiative Available at httpswwwesmaporgsitesdefaultfilesesmap-filesArmenia_Yerevan_Water_Case_Studypdf (last accessed on 28 September 2020)
Environmental Local Authorities InterBalkan Network (nd) ldquoThe municipality of Rijeka Croatiardquo Available at httpselaineupartnersrijeka-croatia (last accessed on 22 May 2019)
ERRee (2020) ldquoCity of Tartu seeking to reduce CO2 emissions by 40 percent by 2030rdquo ERRee News 1 September 2020 Available at httpsnewserree1129902city-of-tartu-seeking-to-reduce-co2-emissions-by-40-percent-by-2030 (last accessed 12 October 2020)
Energy Systems Catapult (2018) ldquoItalian Energy Efficiency White Certificate Schemerdquo Available at httpsescatapultorgukwp-contentuploads201810Italy-White-Certificate-Scheme-Case-Study-FINALpdf (last accessed 28 September 2020)
Euro Cities (2019) ldquoCluj-Napoca Romania ndash Imagine the future of the city Innovation and Civic Imagination Centre ndash CIICrdquo Available at httpnwseurocitieseuMediaShellmedia2019_ROCK_CaseStudiesBooklet_Clujpdf (last accessed 18 August 2020)
EURONET 5050 MAX (nd) EURONET 5050 MAX website Available at httpwwweuronet50-50maxeuen (last accessed 18 August 2020)
European Association for Local Democracy (2016) ldquoDecentralised cooperation an added value for Eastern Partnership Countriesrdquo Available at httpseuropeanmovementeuwp-contentuploads201602139-Paper_EaP_IssueNo1_AVpdf (last accessed 15 October 2020)
European Commission (nda) ldquoLjubljana becomes the first EU capital to adopt Zero Waste Goalrdquo news page Available at httpeceuropaeuenvironmenteuropeangreencapitalljubljana-zero-waste-goal (last accessed 18 August 2020)
European Commission (ndb) ldquoReclaiming city streets for people Chaos or quality of liferdquo EC Directorate-General for the Environment Available at httpeceuropaeuenvironmentpubspdfstreets_peoplepdf (last accessed on 2 July 2019)
European Commission (2014) ldquoCapital factsheet ndash LlubjlanaSloveniardquo Part of EC study ldquoAssessment of separate collection schemes in the 28 capitals of the EUrdquo Municipal Waste Europe website Available at httpswwwmunicipalwasteeuropeeusitesdefaultfilesSI20Ljubljana20Capital20factsheetpdf (last accessed 18 August 2020)
European Commission (2018) ldquoFinancing a Sustainable European Economy ndash Final Report 2018 by the High-Level Expert Group on Sustainable Financerdquo p 7 Available at httpseceuropaeuinfositesinfofiles180131-sustainable-finance-final-report_enpdf (last accessed 18 August 2020)
European Commission (2019) ldquoLjubljana becomes the first EU capital to adopt Zero Waste Goalrdquo Available at httpeceuropaeuenvironmenteuropeangreencapitalljubljana-zero-waste-goal (last accessed on 9 July 2019)
European Commission (2020) Nearly Zero Energy Buildings European Commission website Available at httpseceuropaeuenergytopicsenergy-efficiencyenergy-efficient-buildingsnearly-zero-energy-buildings_en (last accessed 14 April 2020)
European Commission Directorate ndash General Environment (2012) ldquoPreparing a Waste Prevention Programme Guidance documentrdquo October 2012 Available at httpeceuropaeuenvironmentwastepreventionpdfWaste20prevention20guidelinespdf (last accessed 18 August 2020)
European Environment Agency (2014) ldquoStuttgart combating the heat island effect and poor air quality with green ventilation corridors (2014)rdquo case study Climate Adapt website Available at httpsclimate-adapteeaeuropaeumetadatacase-studiesstuttgart-combating-the-heat-islandeffect-and-poor-air-quality-with-green-ventilation-corridors (last accessed 18 August 2020)
European Union (2015) ldquoLjubljana European Green Capital 2016rdquo Available at httpeceuropaeuenvironmenteuropeangreencapitalwp-contentuploads201302ljubljana_european_green_capital_2016pdf (last accessed on 2 July 2019)
European Union (2017) Effective multi-level environmental governance for a better implementation of EU environment legislation Study European Committee of the Regions Available at httpscoreuropaeuenengagestudiesDocumentsEnvironmental-governancepdf (last accessed 18 August 2020)
European Union (2018) Directive of the European Parliament and of the Council amending Directive 200898EC on waste Reference PE-CONS 1118 27 April 2018 Available at httpsdataconsiliumeuropaeudocdocumentPE-11-2018-INITenpdf (last accessed on 25 October 2020)
EUROSCOPE (TR1023) (1999) Evaluation Results and Comparative Assessment Available at httpwwwitsleedsacukprojectskonsultprivatelevel2instrumentsinstrument040l2_040chtm (last accessed 18 August 2020)
Eurostat (2020) ldquoPassenger Cars in the EUrdquo web page Available at httpseceuropaeueurostatstatistics-explainedindexphpPassenger_cars_in_the_EUHighest_share_of_passenger_cars_over_20_years_old_in_Poland (last accessed 18 August 2020)
Eurostat and EIB (2018) ldquoA Guide to the Statistical Treatment of Energy Performance Contractsrdquo May 2018 Available at httpseceuropaeueurostatwebgovernment-finance-statisticsmethodologyguidance-onaccounting-rules (last accessed 18 August 2020)
W Fahmi and K Sutton (2010) ldquoCairorsquos Contested Garbage Sustainable Solid Waste Management and the Zabaleenrsquos Right to the Cityrdquo Sustainability Vol 2 (6) pp 1765-1783 Available at httpswwwmdpicom2071-1050261765 (last accessed 18 August 2020)
193
C Farvacque-Vitkovic and A Sinet (2014) ldquoAchieving greater transparency and accountabilityrdquo Municipal Finances A Handbook for Local Governments Chapter 8 Box 86 Available at httpdocuments1worldbankorgcurateden403951468180872451pdfMunicipal-finances-a-handbook-for-local-governmentspdf (last accessed on 8 October 2020)
M Filipovic (2019) ldquoRijeka ndash Smart City experiences and plans for the futurerdquo Available at httpwwwseecitieseuseecitieseuPortals0ImagesUploadDocumentsC2CCity20to20City20Dialogue20-20Cities20Drivers20of20Economy20Vision202030Day2021120Rijeka20-20Smart20Citypdfver=2019-05-08-100821-320 (last accessed on 8 October 2020)
Financial Times (2019) ldquoNumber 214 to Highgate leads UKrsquos electric bus charge ndash British companies use Chinese technology to power up in new age of public transportrdquo Financial Times website November 2019 Available at httpswwwftcomcontent5c81dee4-ffe1-11e9-b7bcf3fa4e77dd47 (last accessed 18 August 2020)
FIRE (2018) ldquoItalian white certificates the new rulesrdquo Federazione Italiana per luso Razionale dellEnergia wwwbuildupeu 20 November 2018 Available at httpswwwbuildupeuenpracticespublicationsitalian-white-certificates-new-rules (last accessed 28 September 2020)
J Fitzgerald (2016) ldquoWhat city planners can learn from Malmorsquos eco-districtsrdquo Available at httpsblogslseacukeuroppblog2016040237589 (last accessed 12 July 2019)
C Ford (2017) ldquoSlovenia has been named the greenest country in the world and this is whyrdquo Available at httpswwwcontikicomsix-twoslovenia-has-been-named-the-greenest-country-in-the-world-and-this-is-why (last accessed on 9 July 2019)
M Galindo Fernandez C Roger-Lacan U Gaumlhrs and V Umaitre (2016) ldquoEfficient district heating and cooling systems in the EUrdquo Available at httppublicationsjrceceuropaeurepositorybitstreamJRC104437study20on20efficient20dhc20systems20in20the20eu20-dec2016_final20-20public20report6pdf (last accessed 11 October 2020)
GEF and UNDP (2010) ldquoPromoting Energy Efficiency in Buildings Lessons Learned From International Experiencerdquo Available at httpswwwthegeforgsitesdefaultfilespublicationsEEBuilding_WEB_2pdf (last accessed 8 October 2020)
Gianni-Origoni amp Grippo-Cappelli Partners (2017) ldquoIl nuovo regime dei certificate bianchi cosa cambiardquo Available at httpwwwgopitdoc_pubblicazioni652_3j1fi3dkur_itapdf (last accessed 8 October 2020)
GIZ (2012) ldquoRecovering resources creating opportunities Integrating the informal sector into solid waste managementrdquo GIZ on behalf of the German Federal Ministry for Economic Cooperation and Development Available at httpswwwgizdededownloadsgiz2011-en-recyclingpartnerships-informal-sector-final-reportpdf (last accessed 18 August 2020)
Global Opportunity Explorer (2018) ldquoCape Town Industrial Resource Exchanges Reduce CO2rdquo Available at httpsgoexplorerorgcape-town-industrial-resource-exchanges-reduce-co2 (last accessed on 30 September 2020)
Global Platform for Sustainable Cities and World Bank (2018) Urban Sustainability Framework (USF) First edition Washington DC Available at httpdocumentsworldbankorgcurateden339851517836894370pdf123149-Urban-Sustainability-Frameworkpdf (last accessed 18 August 2020)
Go to Burgas (2020) ldquoPublic Transportrdquo Available at httpswwwgotoburgascomenindexstatic24 (last accessed on 20 October 2020)
Government of Alberta (2020) ldquoIntermunicipal Collaboration Frameworksrdquo web page Available at httpswwwalbertacaintermunicipalcollaboration-frameworkaspx (last accessed 18 August 2020)
Government of Estonia (2019) Estoniarsquos 2030 National Energy and Climate Plan Final version 19 December 2019 Available at httpseceuropaeuenergysitesenerfilesdocumentsee_final_necp_main_enpdf (last accessed 12 October 2020)
GreenCape (2018) ldquoWISP Case Study Banners to Bagsrdquo Available at httpswwwgreencapecozaassetsUploadsGC3-20181005-
WISPCaseStudy-BannerstoBags-Webpdf (last accessed on 30 September 2020)
J Groszlige N B Groth C Fertner J Tamm and K Alev (2015) Urban energy planning in Tartu [PLEEC Report D42 Tartu] EU-FP7 project PLEEC Available at httpscuriskudkwsfiles142223033D42_Tartu_2015_01_14_finalpdf (last accessed 12 October 2020)
K Heinrich (2018) ldquoParmarsquos journey to world-class food waste recycling levelsrdquo in Beyondfoodwastecom 22 August 2018 Available at httpsbeyondfoodwastecomparmas-journey-to-world-class-food-waste-recycling-levels (last accessed 25 October 2020)
Herne Hill (2015) ldquoHerne Hill Flood Alleviation Scheme Shortlisted for Awardrdquo April 2015 Available at httpwwwhernehillorguknewsherne-hill-flood-alleviation-scheme-shortlisted-award (last accessed 18 August 2020)
M Holder (2018) ldquoBMW takes full ownership of DriveNow carsharing schemerdquo March 2018 Business Green website Available at httpswwwbusinessgreencombgnews3028696bmw-takes-full-ownership-ofdrivenow-carsharing-service (last accessed 18 August 2020)
S Howell (2012) ldquoLocal authorities must break down silos to deliver better public servicesrdquo The Guardian website September 2012 Available at httpswwwtheguardiancomlocal-government-network2012sep14localis-report-public-service-delivery (last accessed 18 August 2020)
ICLEI (nd) ldquoLjubljana (Slovenia)rdquo Available at httpsiclei-europeorgmember-in-the-spotlightpreviousljubljana-slovenia (last accessed on 20 October 2020)
ICLEI (2011a) ldquoFreiburg Successfully reducing automobile trafficrdquo Available at httpoldicleiorgfileadminPUBLICATIONSCase_Stories4_EcoMobilityICLEI_CaseStories_EcoMobility_Freiburgpdf (last accessed on 2 July 2019)
ICLEI (2011b) ldquoLund Sweden An ambitious city of ideas and innovationrdquo Available at httpssustainablemobilityicleiorgwpdm-packagelund-sweden-an-ambitious-city-of-ideas-and-innovation (last accessed on 26 June 2019)
ICLEI (2014) ldquoAmman Jordan ndash Urban agriculture finding multi-purpose Urban NEXUS solutions through collaborative actionrdquo Urban Nexus case story August 2014 Available at httpoldicleiorgfileadminPUBLICATIONSCase_StoriesUrban_NEXUS26_Urban_NEXUS_Case_Story_Amman_ICLEI-GIZ_2014pdf (last accessed 18 August 2020)
ICLEI ndash Local Governments for Sustainability (2016) ldquoBurgas Bulgariardquo Available at httpssustainablemobilityicleiorgecomobility-alliance-back-upburgas-bulgaria (last accessed on 19 October 2020)
ICLEI and GIZ (2014) ldquoOperationalizing the Urban NEXUS ndash Towards resource-efficient and integrated cities and metropolitan regionsrdquo Deutsche Gesellschaft fuumlr Internationale Zusammenarbeit and ICLEI ndash Local Governments for Sustainability Available at httpswwwsustainable-urbanisationorgsitessgupfilespublicationsoperationalising_the_urban_nexuspdf (last accessed 18 August 2020)
IFC (nd) ldquoBucharest Water and Sanitationrdquo Urban Water Available at httpslibrarypppknowledgelaborgdocuments4722download (last accessed on 30 September 2020)
Inclusive Design Research Centre (nd) ldquoCo-designing Inclusive Citiesrdquo IDRC website Available at httpscitiesinclusivedesignca (last accessed 16 April 2019)
Innovative Governance of Large Urban Systems (2017) ldquoThe Greater Moscow Region on its shifting way from transportation to mobilityrdquo S Maltcev IGLUS website July 2017 Available at httpsiglusorgthe-greater-moscow-region-on-its-shifting-way-from-transportation-to-mobility (last accessed 18 August 2020)
Institute for Building Efficiency (2010a) ldquoEnergy Performance Contracting in the European Union Introduction Barriers and Prospectsrdquo Issue Brief August 2010 Available at httpwwwbuildupeusitesdefaultfilescontentInstitute20BE20-20Energy20Performance20Contracting20in20the20European20Unionpdf (last accessed 18 August 2020)
Institute for Building Efficiency (2010b) ldquoEnergy Performance Contracting in the European Union Creating Common lsquoModelrsquo Definitions Processes
194
and Contractsrdquo Issue Brief September 2010 Available at httpwwwbuildupeusitesdefaultfilescontentInstitute20BE-Energy20Performance20Contracting20in20the20EU-20Common20models20definitions2C20Contracts2C20Processespdf (last accessed 18 August 2020)
ITDP (2015) ldquoWhatrsquos Stopping Carsharing 4 Challenges Holding Emerging Markets Backrdquo December 2015 Institute for Transportation and Development Policy Available at httpswwwitdporg20151217whats-stoppingcarsharing-4-challenges-holding-emerging-markets-back (last accessed 18 August 2020)
Institute of Public Administration (2012) ldquoStrategic collaboration in local governmentrdquo Local Government research Series Report no 2 January 2012 Available at httpswwwipaie_fileUploadDocumentsStrategicCollaborationpdf (last accessed 18 August 2020)
Institute on Municipal Finance and Governance (2013) ldquoTrading Density for Benefits Toronto and Vancouver Comparedrdquo Munk School of Global Affairs IMFG Papers on Municipal Finance and Governance No 13 Available at httpsmunkschoolutorontocaimfguploads220imfg_no_13_moorer3_online_finalpdf (last accessed 18 August 2020)
International Bank for Reconstruction and Development and World Bank (2017) ldquoRepublic of Armenia Support to Armeniarsquos Second-Generation Water PPPsrdquo Available at httpsppiaforgdocuments5694download (last accessed on 28 September 2020)
International Transport Forum (2016) ldquoMoscow wins international transport award for tackling traffic gridlockrdquo Available at httpswwwitf-oecdorgmoscow-wins-international-transport-award-tackling-traffic-gridlock (last accessed on 20 October 2020)
International Water Association (2018) Wastewater Report 2018 The Reuse Opportunity Available at httpwwwiwa-networkorgwp-contentuploads201802OFID-Wastewater-report-2018pdf (last accessed on 8 August 2019)
Interreg Danube Transnational Programme (2018) ldquoSummary of all the ATTRACTIVE DANUBE National Workshopsrdquo Available at wwwinterreg-danubeeunews-and-eventsproject-news2322 (last accessed on 16 October 2020)
M Islam (2012) ldquoKey Factors and Readiness Perception Indicators Appraisal Public-Private Partnership in Infrastructure Development Project in Bangladeshrdquo Available at httpscoreacukdownloadpdf61803306pdf (last accessed on 26 October 2020)
S Istenič (2016) ldquoReviving Public Spaces through Cycling and Gardening Ljubljana ndash European Green Capital 2016rdquo in Etnološka tribina Godišnjak Hrvatskog etnološkog društva Vol 46 No 39 2016 Available at httpswwwresearchgatenetpublication311863407_Reviving_Public_Spaces_through_Cycling_and_Gardening_Ljubljana_-_European_Green_Capital_2016 (last accessed 20 October 2020)
C Johnson (2014) ldquoSharing City Seoul A Model for the Worldrdquo Available at httpswwwshareablenetsharing-city-seoul-a-model-for-the-world (last accessed on 30 September 2020)
B Jovičić (2019) ldquoSEE parliamentarians visit Ljubljana ndash European Green Capital and regional leader in sustainable urban mobilityrdquo Available at httpswwwtransformative-mobilityorgnewssee-parliamentarians-visit-ljubljana-european-green-capital-and-regional-leader-in-sustainable-urban-mobility (last accessed on 20 October 2020)
M Kahn (2017) ldquoConstruction begins on Atlantarsquos Proctor Creek Greenwayrdquo Curbed Atlanta website August 2017 Available at httpsatlantacurbedcom201782116176662proctor-creek-greenwayphase-one-construction-starts (last accessed 18 August 2020)
J Kanters and M Wall (2018) ldquoExperiences from the urban planning process of a solar neighbourhood in Malmouml Sweden Urban Planning and Transport Researchrdquo Available at httpswwwtandfonlinecomdoipdf1010802165002020181478323 (last accessed 8 October 2020)
A Kassam (2014) ldquoSmarter urban water how Spainrsquos Zaragoza learned to use lessrdquo The Guardian Available at httpswwwtheguardiancomlifeandstyle2014jul30zaragoza-smarter-urban-water-zaragoza-spain-learned-to-use-less (last accessed on 29 September 2020)
The Korea Times (2018) ldquoSeoul to generate 1 GW of energy from solar by 2022rdquo Korea Times 26 November 2018 Available at httpm
koreatimescokrpagesarticleaspnewsIdx=259295 (last accessed 22 July 2019)
M Kulesza (nd) ldquoMethods and Techniques of Managing Decentralization Reforms in CEE Countries The Polish Experiencerdquo Pennsylvania State University Available at httpciteseerxistpsueduviewdocdownloaddoi=10111118460amprep=rep1amptype=pdf (last accessed 18 August 2020)
A Kumar and R Fester (2019) ldquoFiscal Futures Is there a Space for Better Fiscal Accountability in South Africarsquos Metropolitan Municipalitiesrdquo International Budget Partnership website March 2019 Available at httpswwwinternationalbudgetorg201903fiscal-futures-is-therespace-for-better-fiscal-accountability-in-south-africas-metropolitanmunicipalities (last accessed 18 August 2020)
A Laszek and R Trzeciakowski (2018) ldquoState Decentralization in Poland Has Been Successful but There is Still Room for Improvementrdquo Available at http4libertyeuwp-contentuploads201811ALEKSANDER-C581ASZEK-RAFAC581-TRZECIAKOWSKI_STATE-DECENTRALIZATION-IN-POLAND-HASpdf (last accessed 9 August 2019)
LEGCO (2017) ldquoFeed-in tariff for solar power in selected placesrdquo Available at httpswwwlegcogovhkresearch-publicationsenglish1718in04-feed-in-tariff-for-solar-power-in-selected-places-20180117-epdf (last accessed 22 July 2019)
U Lehrer and P Pantalone (2018) ldquoThe sky is not the limit Negotiating height and density in Torontorsquos condominium boomrdquo from Spaces of Urban Politics pp 85-95 Available at httpswwwresearchgatenetpublication326547999_The_sky_is_not_the_limit_Negotiating_height_and_density_in_Toronto27s_condominium_boom (last accessed on 29 September 2020)
LGB (nd) ldquoSNAGA Development and maintenance of a geospatial information system for service managementrdquo Available at httpswwwlgbsienprojectssnaga (last accessed on 1 October 2020)
M Liksutov (2018a) ldquoModernising Moscow How the Russian capital is transforming its transport servicesrdquo Intelligent Transport 4 October 2018 Available at httpswwwintelligenttransportcomtransport-articles72221moscow-public-transport-network (last accessed on 19 October 2020)
M Liksutov (2018b) ldquoBuilding Smart Transport in Moscowrdquo Interview by McKinsey Available at httpswwwmckinseycomindustriescapital-projects-and-infrastructureour-insightsbuilding-smart-transport-in-moscow (last accessed on 19 July 2019)
M Liksutov (2020) ldquoCity Snapshot Mobility in Moscowrdquo Intelligent Transport 28 January 2020 Available at httpswwwintelligenttransportcomtransport-articles95256city-snapshot-mobility-in-moscow (last accessed on 20 October 2020)
A Linder (2019) ldquoThe formalisation of South African waste pickers in a globalised recycling economyrdquo lecture May 2019 Available at httpswwwlawoxacukeventsformalisation-south-african-waste-pickersglobalised-recycling-economy (last accessed 18 August 2020)
LSE Cities ICLEI and GGGI (2013) Going Green How cities are leading the next economy Available at httpswwwlseacukcitiespublicationsresearch-reportsGoing-Green-How-cities-are-leading-the-next-economy (last accessed on 25 October 2020)
LSE Cities UN-Habitat and United Cities and Local Governments (2016) ldquoHow cities are governed Building a local database for current models of urban governancerdquo Available at httpsurbangovernancenet (last accessed 18 August 2020)
A Magni and W Guumlnther (2014) ldquoCooperatives of waste pickers as an alternative to social exclusion and its relationship with the homeless populationrdquo in Sauacutede e Sociedade vol 23 no1 Satildeo Paulo Jan-Mar 2014 Available at httpswwwscielobrscielophppid=S0104-12902014000100146ampscript=sci_arttextamptlng=en (last accessed on 25 October 2020)
S Maltcev (2017) ldquoThe Greater Moscow Region on its shifting way from transportation to mobilityrdquo Igluscom 9 July 2017 Available at httpsiglusorgthe-greater-moscow-region-on-its-shifting-way-from-transportation-to-mobility (last accessed on 20 October 2020)
195
P Marin M Dambudzo and A Andreasyan (2017) Review of Armeniarsquos Experience with Water Public-Private Partnerships World Bank Group Washington DC Available at httpdocumentsworldbankorgcurateden117301510813106522pdfReview-of-Armenia-s-experience-withwater-public-private-partnershipspdf (last accessed 18 August 2020)
A Marshal (2019) ldquoWhy electric buses havenrsquot taken over the world ndash yetrdquo Wired June 2019 Available at httpswwwwiredcomstoryelectricbuses-havent-taken-over-world (last accessed 18 August 2020)
C Marshall (2016) ldquoWhere is the worldrsquos most hi-tech city (And itrsquos not San Francisco)rdquo The Guardian website October 2016 Available at httpswwwtheguardiancomcities2016oct19where-world-most-hi-tech-city-not-san-francisco (last accessed 18 August 2020)
McKinsey amp Company (2013) ldquoTen quick steps to unlocking tax-revenue collection in rapidly growing marketsrdquo July 2013 Available at httpswwwmckinseycomindustriespublic-sectorour-insightsten-quicksteps-to-unlocking-tax-revenue-collection-in-rapidly-growing-markets (last accessed 18 August 2020)
H Mees (2014) ldquoEntire cities could benefit from green roofsrdquo Delta RotterdamUtrecht University Available at httpsdspacelibraryuunlbitstreamhandle1874306732websitepdfsequence=1ampisAllowed=y (last accessed on 15 July 2020)
Metro (2019) ldquoMetro partners with Getaround to offer car sharing at 27 transit stationsrdquo metronet website page February 2019 The Source blog Available at httpsthesourcemetronet20190207metro-partnerswith-getaround-to-offer-car-sharing-at-27-transit-stations (last accessed 5 May 2019)
RE Millward amp Associates Ltd (2013) ldquoSecuring Cultural Benefits Approaches to the Use of Section 37 for Arts and Culture Facilitiesrdquo Available at httpswwwtorontocalegdocsmmis2013edbgrdbackgroundfile-62975pdf (last accessed on 15 July 2019)
Ministry of Finance of the Slovak Republic (nd) ldquoPlatobny mechanizmus vychadzajuci zo Vzorovej zmluvy o energetickej efektivnosti s garantovanou usporou energierdquo Available at httpswwwmhsrskuploadsfilesCqkpdgoUpdf (last accessed 18 August 2020)
T Misra (2016) ldquoHow to Build Inclusive Citiesrdquo Bloomberg CityLab June 2016 Available at httpswwwcitylabcomequity201606how-tobuild-inclusive-cities487322 (last accessed 18 August 2020)
A Moore (2013) for Institute on Municipal Finance and Governance ldquoTrading Density for Benefits Toronto and Vancouver Comparedrdquo Available at httpsmunkschoolutorontocaimfguploads220imfg_no_13_moorer3_online_finalpdf (last accessed on 15 July 2019)
Moscow Transport (2017) ldquoMoscow Transport strategy main goals and achievementsrdquo Available at httpswwwuneceorgfileadminDAMtransdoc2017wp52_5Sept2017_Ms_Maltsevapdf (last accessed on 19 October 2020)
N Mueller D Rojas-Rueda H Khreis M Cirach D Andreacutes J Ballester X Bartoll C Daher A Deluca C Echave C Milagrave S Maacuterquez J Palou K Peacuterez C Tonne M Stevenson S Rueda and M Nieuwenhuijsen (2020) ldquoChanging the urban design of cities for health The superblock modelrdquo Environment International Vol 134 Available at httpswwwsciencedirectcomsciencearticlepiiS0160412019315223 (last accessed on 29 September 2020)
Municipal Department MA 18 ndash Urban Development and Planning (2018) Monitoring Report 2017 Smart City Wien Framework Strategy Available at httpswwwwiengvatstadtentwicklungstudienpdfb008520pdf (last accessed 16 October 2020)
A Natarajan (2020) ldquoMetro Waterrsquos 10 big promises for Chennai citizens in 2020rdquo Available at httpschennaicitizenmattersinmetro-water-promises-for-chennai-2020-13822 (last accessed on 29 October 2020)
National Assembly for Wales (2018) ldquoLow Carbon Housing the Challengerdquo Climate Change Environment and Rural Affairs Committee August 2018 Available at httpswwwassemblywaleslaid20documentscrld11711cr-ld11711-epdf (last accessed 18 August 2020)
National Lottery Heritage Fund (2014) ldquoPublic parks under threatrdquo June 2014 Heritage Fund website Available at httpswwwheritagefundorguknewspublic-parks-under-threat (last accessed 18 August 2020)
Y Nishida (2013) ldquoEnergy Efficiency in Buildings Policy and Programs in Policy and Programs in Tokyordquo Available at httpswwweu-japaneusiteseu-japaneufilesNishidapdf (last accessed 11 October 2020)
D Norris-Tirrell and JA Clay (2010) Strategic Collaboration in Public and Nonprofit Administration ndash A Practice-Based Approach to Solving Shared Problems Routledge Abingdon and New York Available at httpswwwroutledgecomStrategic-Collaboration-in-Public-and-Nonprofit-Administration-A-Practice-BasedNorris-Tirrell-Claypbook9781420088755 (last accessed on 26 November 2020)
E Oblak (2019) ldquoThe story of Ljubljana Case studyrdquo Available at httpszerowasteeuropeeudownloadscase-study-5-ljubljana-2 (last accessed on 1 October 2020)
S OrsquoCarroll J Wallace C Pineo L Basson J Woodcock R Daniel and C Mouton (2016) ldquoThe Western Cape Industrial Symbiosis Programme (WISP) An Innovative Approach to Resource Efficiency and Waste Minimisation for South African Businessesrdquo from Proceedings of the 20th WasteCon Conference 6-10 October 2014 Somerset West Cape Town Available at httpswww3smediacozainfrastructurenewswp-contentuploadssites4201601Oe28099Carroll-S-et-al-80pdf (last accessed on 30 September 2020)
OECD (nda) ldquoBreaking out of silos Joining up policy locallyrdquo F Froy OECD website Available at httpwwwoecdorgregionalleed43056251pdf (last accessed 18 August 2020)
OECD (ndb) ldquoMixes of policy instrumentsrdquo OECD website Available at httpwwwoecdorgenvtools-evaluationmixesofpolicyinstrumentshtm (last accessed 18 August 2020)
OECD and ICLEI (2016) ldquoGreen Cities Programme Methodologyrdquo Final Report May 2016 Available at httpswwwebrdgreencitiescomassetsUploadsPDF436b87ef46Green-City-Action-Plan-Methodology-Englishpdf (last accessed 18 August 2020)
100 Resilient Cities (nd) 100 Resilient Cities website Available at httpswww100resilientcitiesorg (last accessed 18 August 2020)
100 Resilient Cities (2018) ldquoAtlantarsquos Proctor Creek Greenway delivers multiple co-benefits from a single interventionrdquo Available at httpswww100resilientcitiesorgatlantas-proctor-creek-greenway-deliversmultiple-co-benefits-from-a-single-intervention (last accessed 18 August 2020)
Opensignal (2017) ldquoGlobal State of Mobile Networks (February 2017)rdquo Opensignal website Available at httpswwwopensignalcomreports201702global-state-of-the-mobile-network (last accessed 18 August 2020)
P Pantale (2014) ldquoDensity Bonusing and Development in Torontordquo Available at httpsfesyorkucawp-contentuploads201810Peter-Pantalone-Major-Research-Paper-FINALpdf (last accessed on 15 July 2019)
J Park (2016) ldquoHow the citizens of Seoul benefit from a sharing culture and an enhanced listening policyrdquo Available at httpssocialinnovationexchangeorginsightshow-citizens-seoul-benefit-sharing-culture-and-enhanced-listening-policy (last accessed on 30 September 2020)
Parma Futuro Smart (2020a) ldquoPesatura rifiuti smartrdquo in parmafuturosmartcomuneparmait Available at httpparmafuturosmartcomuneparmaitprogettisistemi-smart-per-pesatura-rifiuti (last accessed on 25 October 2020)
I Petek (2016) ldquoLjubljana Sloveniardquo in IMPACTPAPERECEU Available at httpsimpactpapereceuenfacts-figurescase-studiesljubljana-slovenia (last accessed 25 October 2020)
N Pietzsch JL Duarte Ribeiro J Fleith de Medeiros (2017) ldquoBenefits challenges and critical factors of success for Zero Waste A systematic literature reviewrdquo Waste Management Vol 67 pp 324-353
The Princersquos Foundation for the Built Environment (nd) ldquoStrasbourg Regaining the public realmrdquo Available at httpswwwacademiaedu23526879Strasbourg_Regaining_the_public_realm (last accessed on 19 October 2020)
196
Proračun Grada Rijeke (2018) ldquoProracun(ajme)rdquo Available at httpswwwvojko-obersnelcomhrproracunaj-me2018 (last accessed 15 October 2020)
PublicSpace (2018) ldquoPoblenou ldquoSuperblockrdquo Barcelona (Spain) 2018rdquo Available at httpswwwpublicspaceorgworks-projectk081-poblenou-s-superblock (last accessed on 29 September 2020)
Push-Pull Parking (2015) ldquoCatalogue on Case Studies for Parking Management Solutionsrdquo push-pull-parkingeu Available at httpwwweltisorgsitesdefaultfilestrainingmaterialspp_pm_catalogue_01062015_finalpdf (last accessed 18 August 2020)
Qualenergiait (2017) ldquoPrezzo die TEE alle stells lsquoeffetto Governo e GSErsquordquo Available at httpswwwqualenergiaitarticoli20170316-prezzo-dei-tee-alle-stelle-effetto-governo-e-gse (last accessed 8 October 2020)
S Raghavan (2019) ldquoThe success and failure of Water management in Chennairdquo Future Directions Available at httpswwwfuturedirectionsorgaupublicationthe-success-and-failure-of-water-management-in-chennai (last accessed on 29 September 2020)
Railway Gazette (2020) ldquoLund tramway gets revised launch daterdquo Available at railwaygazettecomprojects-and-planninglund-tramway-gets-revised-launch-date55881article (last accessed on 20 October 2020)
A Rabi (2013) ldquoReview and Analysis of Private Sector Participation Modalities in Water Service Delivery with Emphasis on the Southern Mediterranean Regionrdquo Available at httpwwwswim-smeuindexphpenresourcescategory76-assessments-en (last accessed on 29 September 2020)
M Raud (2020) ldquoLow temperature heating project in Tarturdquo in RELaTEDProjecteu Available at httpwwwrelatedprojecteuwp-contentuploads202004RELaTED-moreinfo-Fortum-Tartu-v2pdf (last accessed 12 October 2020)
Regions4recycling (2014) ldquoGood practice Tallinn Waste awareness educational campaigns for children and adultsrdquo Available at httpdocplayernet22211005-Good-practice-tallinn-waste-awarenesseducational-campaigns-for-children-and-adults-june-2014html (last accessed 18 August 2020)
M Ricci (2020) ldquoFood waste collection and recycling in Italyrdquo webinar presentation for the Bio-based and Biodegradable Industries Association 14 May 2020 Available at httpsbbiaorgukwp-contentuploads202006RICCI-BBIA-FW-Collection-IT-Webinar-2020-0514pdf (last accessed 25 October 2020)
ROCK (2019) ldquoCluj-Napoca Romania Imagine the future of the cityrdquo Participatory Approaches and Social Inclusion in Cultural Heritage Regeneration and Optimisation of Cultural Heritage in Creative and Knowledge Cities Horizon 2020 programme July 2019 Available at httpsinddadobecomview4c399cc1-0836-488c-83d4-fe21588c819b (last accessed 16 October 2020)
N Rogers (2017) ldquoDriving Fee Rolls Back Asthma Attacks in Stockholmrdquo Inside Science website February 2017 Available at httpswwwinsidescienceorgnewsdriving-fee-rolls-back-asthma-attacks-stockholm (last accessed 18 August 2020)
N Rolander (2018) ldquoBMWrsquos DriveNow Car-Sharing Services Bite the Dust in Stockholmrdquo July 2018 Bloomberg website Available at httpswwwbloombergcomnewsarticles2018-07-18bmw-s-drivenow-car-sharingservice-bites-the-dust-in-stockholm (last accessed 18 August 2020)
M Rousseau (2009) ldquoRe-imaging the City Centre for the Middle Classes Regeneration Gentrification and Symbolic Policies in lsquoLoser Citiesrsquordquo in International Journal of Urban and Regional Research Vol 33 (3) September 2009 pp 770-880 Available at httpsonlinelibrarywileycomdoiepdf101111j1468-2427200900889x (last accessed on 21st October 2020)
RUAF Foundation (2016) ldquoFrom strategies to operational goals for the Gent en Garderdquo Available at httpsruaforgassets201911Gent-en-Gardepdf (last accessed 18 August 2020)
G Ruggieri (2017) ldquoThe State of Art of Copenhagenrsquos Cycling Infrastructure and Possible Application in Other Urban Contextsrdquo Available at httpswwwpolitesipolimiitbitstream1058913415812017_04_RUGGIERIpdf (last accessed on 16 July 2019)
C Sabatino (2017) ldquoSolid Waste Management Systems through Social Inclusion The case of Belo Horizonte Brazilrdquo Available at httpwwwglobaldeliveryinitiativeorglibrarycase-studiessolid-waste-management-systems-through-social-inclusion-case-belo-horizonte (last accessed on 25 October 2020)
M Schiffbauer and G Varela (2019) ldquoMacro and Micro Features of Successful Economic Convergence The Case of Polandrdquo Available at httpdocuments1worldbankorgcurateden704781547133350911pdf133617-MTI-Discussion-Paper-11-Fixedpdf (last accessed 10 August 2019)
SEE Cities (2018) ldquoUPP Technical Workshop on Municipal Finance and Urban Auditrdquo Available at httpwwwseecitieseuseecitieseuUAitemid84amid549 (last accessed on 8 October 2020)
Seoul Metropolitan Government (2017) ldquoOne in three houses in Seoul to have photovoltaic facilityrdquo November 2017 Available at httpenglishseoulgokrone-three-houses-seoul-photovoltaic-facility (last accessed 18 August 2020)
Seoul Metropolitan Government (2018a) ldquolsquoSolar Cityrsquo Seoulrsquos future energy to be promoted at Seoul Solar Expordquo Available at httpenglishseoulgokrsolar-city-seouls-future-energy-to-be-promoted-at-seoul-solar-expo (last accessed 22 July 2019)
Seoul Metropolitan Government (2018b) ldquoSeoul Energy Corporation has launched Seoul Solar Centers in 5 regionsrdquo Available at httpenglishseoulgokrseoul-energy-corporation-launched-seoul-solar-centers-5-regions-providing-support-installment-post-m (last accessed 22 July 2019)
A Serena A Tob-Ogu and A Genovese (2018) ldquoTransitioning Urban Consolidation Centres initiatives in successful operations A Collection of EU case experiencesrdquo The University of Sheffield Available at httpwwwprosfeteuPROSFETwp-contentuploads201805Transitioning-Urban-Consolidation-Centres-initiatives-in-successful-operationspdf (last accessed on 29 September 2020)
I Šerić (2017) ldquoThe EPC market in Croatia and the new Eurostat rules on EPC accountingrdquo European Union November 2017 Available at httpseceuropaeuenergysitesenerfilesdocuments018_1b_ivan_seric_seif_milan_16-11-17pdf (last accessed 18 August 2020)
SF Environment (2019) ldquoCheckout Bag Charge and Recyclable or Compostable Pre-Checkout Bag Ordinancerdquo San Francisco Department of the Environment Available at httpssfenvironmentorgcheckout-bagordinance (last accessed 18 August 2020)
Shareable (2013) ldquoIs Seoul the Next Great Sharing Cityrdquo Available at httpswwwshareablenetis-seoul-the-next-great-sharing-city (last accessed on 25 September 2020)
SmartCities World (2019) ldquoVienna ranked top for smart city strategyrdquo SmartCitiesWorldnet 14 March 2019 Available at httpswwwsmartcitiesworldnetnewsnewsvienna-ranked-top-for-smart-city-strategy-3965 (last accessed 24 September 2020)
N Smedby (2015) ldquoAssessing local governance experiments for building energy efficiency ndash the case of Malmouml Swedenrdquo Available at httpsjournalssagepubcomdoipdf1011770263774X15614176 (last accessed 12 July 2019)
M Smith and J Castellano (2015) ldquoCosts associated with nonresidential electric vehicle supply equipment Factors to consider in the implementation of electric vehicle charging stationsrdquo US Department of Energy Available at httpstridtrborgview1377403 (last accessed 18 August 2020)
Snaga Ljubljana (2018) ldquoSnaga Ljubljana the biggest Slovenian waste management companyrdquo Available at httpsissuucomsnaga4docssnaga_ljubljana_eng (last accessed on 9 July 2019)
Sofia Municipality (2018) ldquoSofia Municipal Budgetrdquo February 2018 Available at httpswwwsofiabgwebsofia-municipalitystart-asset_publisherHMYVGw6PDFKhcontentthe-budget-of-sofia-is-now-uploaded-to-the-open-data-portalinheritRedirect=false (last accessed 18 August 2020)
D Staničić (2019) Jožef Stefan Institute Energy Efficiency Centre presentation 28 March 2019 slide 3
197
Z Stoyanova (2014) ldquoSustainable Urban Mobility Plan of Burgas 2014 ndash 2020rdquo Available at httpwwwsoutheast-europenetdocumentcmtid=842 (last accessed on 19 October 2020)
Strasbourg Eurometropole (2015) ldquo20 years of active policy supporting mobility within Strasbourg Eurometropolerdquo Available at Strasbourgeu eurometropole (2015) (last accessed on 19 October 2020)
Sustainable Australia Fund (2020) ldquoAbout usrdquo Available at httpssustainableaustraliafundcomauwho-we-are (last accessed on 8 October 2020)
Sustainable Cities (nd) ldquoOrbital Forest a Balance Between the City and Nature Rediscoveredrdquo Sustainable Cities website Available at httpwwwsustainablecitieseutransformative-actionsdatabasec=searchampaction_id=eu2ii6rw (last accessed 18 August 2020)
Sustainable Cities (2018) ldquoAlba Iulia Smart City Pilot Projectrdquo Sustainable Cities website Available at httpwwwsustainablecitieseutransformative-actions-databasec=searchampaction_id=ixgrulm3 (last accessed 18 August 2020)
Sustainable Development Solutions Network (2016) ldquoGetting Started with the SDGs in Citiesrdquo Available at httpsresourcesunsdsnorggettingstarted-with-the-sdgs-in-cities (last accessed 18 August 2020)
Sustainable Water Integrated Management (SWIM) Support Mechanism (2013) ldquoDocumentation of best practices in non-revenue water management in selected Mediterranean countriesrdquo European Union-funded project February 2013 Available at httpwwwswim-smeufilesBest_Practices_in_non-revenue_water_EN_Finalpdf (last accessed 18 August 2020)
SWITCH (Sustainable Water Management Improves Tomorrow Cities Health) project (2014) ldquoZaragoza combining awareness raising and financial measures to ensure water efficiencyrdquo Available at httpsclimate-adapteeaeuropaeumetadatacase-studieszaragoza-combining-awareness-raising-and-financial-measures-to-enhance-water-efficiency (last accessed on 8 August 2019)
D Szescilo (nd) ldquoStrengthening fiscal capacities for subnational public investment The case of Polandrdquo Available at httpwwwoecdorgregionalregional-policyStrengthening-Fiscal-Capacities-Poland-ENGpdf (last accessed 9 August 2019)
D Szescilo and M Kulesza (2012) ldquoLocal Government in Polandrdquo Local Government in the Member States of the European Union A Comparative Legal Perspective Madrid Available at httpswwwresearchgatenetpublication283568884_Local_government_in_Poland (last accessed 15 October 2020)
S Thomas et al (2014) Energy Efficiency Watch Energy Efficiency Policies in Europe Case Study Energy Manager Obligation and White Certificate Scheme ndash Italy Available at httpwwwfedareneorgwp-contentuploads201603Case_Study_Manager_White-Certificates_Italy_finalpdf (last accessed 10 October 2020)
S M Tica P Živanović S Bajčetić S Gavrilović and S Filipović (2012) ldquoOrganization and Management of Complex Interoperable Tariff and Fare Collection Systems-Example of the City of Belgraderdquo Proceedings of the International Conference on Traffic and Transport Engineering p 259 Belgrade Available at httpsbibirbhrdatoteka629846ICTTE_Belgrade_2012_Proceedingspdfpage=268 (last accessed 18 August 2020)
Tokyo Development Learning Centre (2017) ldquoAddressing Solid Waste Management through the 3R Approachrdquo Available at httpsprogrammeworldwaterweekorgContentProposalResourcesPDF2017pdf-2017-7137-5-Japan20Project20Brief_Yokohama3RPDF (last accessed on 1 October 2020)
Tokyo Metropolitan Government (2018) ldquoTokyo Carbon Reporting Program for SMFsrdquo Available at httpwwwkankyometrotokyojpenclimatetokyo_carbonhtml (last accessed 10 October 2020)
TomTom (nd) ldquoTraffic Index 2019rdquo TomTom website Available at httpswwwtomtomcomen_gbtraffic-indexranking (last accessed 18 August 2020)
TomTom (2020) ldquoMoscow region (oblast) trafficrdquo Available at httpswwwtomtomcomen_gbtraffic-indexmoscow-traffic (last accessed on 20 October 2020)
Transparency International and UN-Habitat (2004) ldquoTools to Support Transparency in Local Governancerdquo March 2004 Urban Governance Toolkit Series Available at httpswwwtransparencyorgenpublicationstools-to-support-transparency-in-local-governance (last accessed 23 August 2020)
Transport and Environment (2017) ldquoDoes sharing cars really reduce car userdquo June 2017 briefing note Available at httpswwwtransportenvironmentorgsitestefilespublicationsDoes-sharing-carsreally-reduce-car-use-June202017pdf (last accessed 18 August 2020)
Transport for London (2014) ldquoInternational Cycling Infrastructure Best Practice Study Appendix ndash City Summariesrdquo Available at httpcontenttflgovukinternational-cycling-infrastructure-best-practice-study-appendixpdf (last accessed on 20 October 2020)
A Trivedi and M Chertock (2019) ldquoResponding to Day Zero Equitably Water Crisis Lessons from Cape Town and Chennairdquo Available at httpswwwwriorgblog201910responding-day-zero-equitably-water-crisis-lessons-cape-town-and-chennai (last accessed on 23 October 2020)
J L Trujillo and J Parilla (2016) ldquoRedefining Global Cities ndash The Seven Types of Global Metro Economiesrdquo Global Cities Initiative The Brookings Institution Available at httpswwwbrookingseduresearchredefiningglobal-cities (last accessed 18 August 2020)
2020 Collectors Project (2020) ldquoCase Study Parma Italyrdquo Available at httpswwwcollectors2020euwp-contentuploads202008Case_Integration_Summary_Parmapdf (last accessed on 2 October 2020)
2030 Water Resources Group (2013) ldquoManaging Water Use in Scarce Environments A Catalogue of Case Studiesrdquo August 2013 Available at httpswwwwaterscarcitysolutionsorgwp-contentuploads201508WRG-Managing-Water-Scarcity-Cataloguepdf (last accessed 18 August 2020)
2030 Water Resources Group (2015) ldquoManaging Water Use in Scarce Environments A Catalogue of Case Studiesrdquo Available at httpswwwwaterscarcitysolutionsorgwp-contentuploads201508WRG-Managing-Water-Scarcity-Cataloguepdf (last accessed on 29 September 2020)
UCLG and World Bank (2009) ldquoDecentralization and Local Democracy in the World First Global Report by United Cities and Local Governments 2008rdquo Available at httpsopenknowledgeworldbankorghandle109862609 (last accessed 18 August 2020)
UK Department for Business Energy and Industrial Strategy (2019) ldquoSmart Meter Roll-Out Cost-Benefit Analysis (2019)rdquo September 2019 Available at httpsassetspublishingservicegovukgovernmentuploadssystemuploadsattachment_datafile831716smart-meter-roll-out-cost-benefit-analysis-2019pdf (last accessed 18 August 2020)
UK Parliament (2013) ldquoWarm Front Schemerdquo Commons Research Briefing SN06231 House of Commons Library August 2013 Available at httpsresearchbriefingsparliamentukResearchBriefingSummarySN06231 (last accessed 18 August 2020)
UN (nd) ldquoCities and Pollution contribute to climate changerdquo Available at httpswwwunorgenclimatechangecitiespollutionshtml~text=Cities20are20major20contributors20tocent20of20the20Earths20surface (last accessed 19 August 2020)
UN (2018a) ldquo68 per cent of the world population projected to live in urban areas by 2050 says UNrdquo Available at httpswwwunorgdevelopmentdesaennewspopulation2018-revision-of-world-urbanizationprospectshtml (last accessed 18 August 2020)
UN (2018b) World Urbanization Prospects The 2018 Revision Department of Economic and Social Affairs New York Available at httpspopulationunorgwupPublicationsFilesWUP2018-Reportpdf (last accessed 18 August 2020)
UN (2020) ldquoGoal 11 Make cities inclusive safe resilient and sustainablerdquo Available at httpswwwunorgsustainabledevelopmentcities (last accessed 18 August 2020)
198
UNDP (2009) Capacity Development A UNDP Primer United Nations Development Programme New York
UN Environment Programme (2017) ldquoWinter is coming for fossil fuel heating in Banja Lukardquo November 2017 Available at httpswwwunenvironmentorgnews-and-storiespress-releasewinter-comingfossil-fuel-heating-banja-luka (last accessed 18 August 2020)
UN Environment Programme (2019) ldquoSustainable Citiesrdquo Available at httpswwwunenvironmentorgregionsasia-and-pacificregionalinitiativessupporting-resource-efficiencysustainable-cities (last accessed 18 August 2020)
UNFCC (2017) ldquoSweden Plans to Be Carbon Neutral by 2045rdquo Available at httpsunfcccintnewssweden-plans-to-be-carbon-neutral-by-2045 (last accessed on 26 June 2019)
UN-Habitat (2009) International Guidelines on Decentralization and Access to Basic Services for All United Nations Human Settlements Programme Nairobi Available at httpsunhabitatorgsitesdefaultfilesdownload-manager-filesInternational20Guidelines20on20Decentralization20and20Access20to20Basic20Services20for20allpdf (last accessed 18 August 2020)
UN-Habitat (2013) State of the Worldrsquos Cities 20122013 Prosperity of Cities United Nations Human Settlements Programme Nairobi (last accessed 18 August 2020)
UN-Habitat (2017) ldquoHow to improve residential energy efficiency in South Eastern Europe and CISrdquo Policy Discussion Brief for national governments and international organizations April 2017 Available at httpswwwhabitatorgsitesdefaultfilesHow20to20improve20REE_policy20brief_FINAL_0pdf (last accessed 18 August 2020)
Urban Innovation Vienna (2020) ldquoSmart City Agencyrdquo Available at httpswwwurbaninnovationatenSmart-City-Agency (last accessed 24 September 2020)
Urban Sustainability Exchange (nda) ldquoThe City of Copenhagenrsquos Bicycle Strategyrdquo Available at httpsusemetropolisorgcase-studiescycling-in-copenhagencasestudydetail (last accessed on 16 July 2019)
Urban sustainability exchange (ndb) ldquoThe Sharing City Seoul Projectrdquo Available at httpsusemetropolisorgcase-studiesthe-sharing-city-seoul-project (last accessed on 21 October 2020)
UrbaSofia (2018) Results of the ATTRACTIVE DANUBE 3rd National Workshop Available at httpsurbasofiaeuenresults-of-the-attractive-danube-3rd-national-workshop (last accessed on 16 October 2020)
URBED and the Joseph Rowntree Foundation (2006) ldquoMaking Connections Transforming People and Places in Europe Case Study of Roubaix Lille (France)rdquo updated December 2007 Available at httpurbedcoopsitesdefaultfilesCase20Study20of20Roubaix20Lillepdf (last accessed 18 August 2020)
VivaCity2020 Cities Institute LondonMet (nd) ldquoThe Generation of Diversity Mixed Use and Urban Sustainability Clerkenwell (L B Islington) Case Studyrdquo Available at httpwwwvivacity2020coukMembersVivaCity20WP220Case20Study20Clerkenwellpdf (last accessed 18 August 2020)
J Warren (2010) ldquoCivilising the Streets How strong leadership can deliver high quality of life and vibrant public spacesrdquo Available at httptransformscotlandorgukwpwp-contentuploads201412Civilising-the-Streetspdf (last accessed on 20 October 2020)
Water Time (2005) ldquoBucharestrdquo Available at httpwwwwatertimenetwt_cs_cit_ncrhtmlRomania (last accessed on 29 September 2020)
M Wattenbarger (2018) ldquoThe Mexican town that refused to become a smart cityrdquo The Guardian website October 2016 Available at httpswwwtheguardiancomcities2018oct16the-mexican-town-that-refused-to-become-a-smart-city (last accessed 18 August 2020)
R Webb G Avram J Buron Garcia and A Joyce (2018) ldquoTransforming Cities by Designing with Communitiesrdquo The Hackable City pp 95-117 M de Lange and M de Waal (eds) Springer Link
Western Cape Government (nd) ldquoWestern Cape Industrial Symbiosis Programmerdquo Available at httpswwwwesterncapegovza110greenprojectswestern-cape-industrial-symbiosis-programme (last accessed on 24 September 2020)
M White (2019) ldquoVeolia and Leon trial deposit return scheme in Londonrdquo FoodBev Media website page March 2019 Available at httpswwwfoodbevcomnewsveolia-and-leon-trial-deposit-return-scheme-inlondon (last accessed 18 August 2020)
J Whitelegg (2014) ldquoCycles of change three bike-friendly European cities with lessons for the UKrdquo Available at httpswwwtheguardiancomlocal-government-network2014jan29cycling-rates-european-cities-lessons-for-uk (last accessed on 20 October 2020)
WHO (nd) ldquoWHO European Healthy Cities Networkrdquo World Health Organization Regional Office for Europe website Available at httpwwweurowhointenhealth-topicsenvironment-and-healthurban-healthwho-european-healthy-cities-network (last accessed 11 April 2019)
WHO and UN Environment (2017) ldquoCities Transport health and environmentrdquo Available at httpwwweurowhoint__dataassetspdf_file0019341128Fact-Sheet-1-City-Transport-health-and-environmentpdfua=1 (last accessed 11 April 2019)
K Willsher (2018) ldquoFrancersquos art deco jewel is reborn to make an even bigger splashrdquo The Guardian 21 October 2018 Available at httpswwwtheguardiancomartanddesign2018oct21france-art-deco-jewel-swimming-pool-art-gallery-reopens (last accessed on 30th September 2020)
D C Wilson C Velis and C Cheeseman (2006) ldquoRole of informal sector recycling in waste management in developing countriesrdquo Habitat International Vol 30 (4) pp 797-808
World Bank (nd) ldquoInclusive Citiesrdquo World Bank website page Available at httpswwwworldbankorgentopicinclusive-cities (last accessed 24 May 2019)
World Bank (2009) ldquoUnlocking Land Values to Finance Urban Infrastructurerdquo Available at httpdocumentsworldbankorgcurateden723411468139800644pdf461290PUB0Box3101OFFICIAL0USE0ONLY1pdf (last accessed on 6 August 2019)
World Bank (2013) ldquoCity of Rijeka MFSA summary 2013rdquo Available at httppubdocsworldbankorgen366021438191576243City-of-Rijeka-MFSA-summary-24-12-2013pdf (last accessed on 8 October 2020)
World Bank (2014) ldquoOvercoming constraints in the financing of infrastructurerdquo Available at httpwwwg20utorontoca2014WBG_IIWG_Success_Stories_Overcoming_Constraints_to_the_Financing_of_Infrastructurepdf (last accessed on 30 September 2020)
The World Bank (2016) ldquoPPI Project Summary Romania Bucharest ndash Concession Agreement for Water and Sanitation Servicesrdquo Available at httpspppworldbankorgpublic-private-partnershipppi-project-summary-romania-bucharest-concession-agreement-water-and-sanitation-services (last accessed on 29 September 2020)
World Bank (2017) ldquoImproving Local Governance in Belizersquos Municipalitiesrdquo Results Briefs Available at httpswwwworldbankorgenresults20171020improving-local-governance-in-belizesmunicipalities (last accessed 18 August 2020)
World Bank (2018) ldquoArmenia - Municipal Water Projectrdquo Independent Evaluation Group Project Performance Assessment Report 127226 Available at httpsiegworldbankgrouporgsitesdefaultfilesDatareportsppar_armeniawaterpdf (last accessed on 28 September 2020)
World Bank (2019) ldquoSolid Waste Managementrdquo Brief September 2019 Available at httpswwwworldbankorgentopicurbandevelopmentbriefsolid-waste-management (last accessed 18 August 2020)
World Bank Group (2017) ldquoLessons from Poland Insights for Poland A Sustainable and Inclusive Transition to High Income Statusrdquo World Bank Washington DC Available at httpsopenknowledgeworldbankorghandle1098628960 (last accessed 15 October 2020)
World Bank Group (2018) ldquoProject Appraisal Document on a Proposed Loan in the Amount of US$ 50 Million to the Republic of Albania for
199
a Regional and Local Roads Connectivity Projectrdquo Available at httpdocumentsworldbankorgcurateden133741523301183905pdfAlbania-Roads-Project-Appraisal-Document-PAD-Revised-04052018pdf (last accessed 18 August 2020)
World Bank Group (2020) ldquoUrban Development ndash Overviewrdquo Available at httpswwwworldbankorgentopicurbandevelopmentoverview (last accessed 18 August 2020)
World Bank Group and Government of Austria (2018) ldquoUrban Partnership Program (UPP) Improving Local Government Capacityrdquo Available at httpdocumentsworldbankorgcurateden613241525861852694pdfMFSA-Booklet-City-data-sheets-022018pdf (last accessed 18 August 2020)
World Bank Institute (2013) ldquoImproving Local Governments Capacity The Experience of Municipal Finances Self-Assessment (MFSA) in South-East Europerdquo Available at httpwwwseecitieseuPortals0ImagesStoriesPublicationsMFSA20-20onlinepdf (last accessed 18 August 2020)
World Economic Forum (2017) ldquoCollaboration in Cities From Sharing to lsquoSharing Economyrsquordquo White paper December 2017 Available at httpwww3weforumorgdocsWhite_Paper_Collaboration_in_Cities_report_2017pdf (last accessed 18 August 2020)
World Energy Council and Arup (2016) ldquoPerspective input into the World Energy Council Scenarios lsquoInnovating Urban Energyrsquordquo October 2016 Available at httpswwwarupcomperspectivespublicationsresearchsectionperspective-input-into-the-world-energy-council-scenariosinnovating-urban-energy (last accessed 18 August 2020)
World Habitat Awards (2013) ldquo30 Years of Planning Continuity in Freiburg Germanyrdquo Available at httpswwwworld-habitatorgworld-habitat-awardswinners-and-finalists30-years-of-planning-continuity-in-freiburg-germany (last accessed on 20 October 2020)
WRI (2016) ldquoLocalizing Open Government Reformsrdquo World Resources Institute website December 2016 Available at httpswwwwriorgblog201612localizing-open-government-reforms (last accessed 18 August 2020)
WWF (nd) ldquoAustriardquo Available at httpswwfpandaorgget_involvedlive_greentravelon_vacationeco_tipsaustria (last accessed 4 June 2019)
WWF (2012) ldquoStuttgart green corridorsrdquo Available at httpwwfpandaorg204461Stuttgart-green-corridors (last accessed on 15 July 2020)
M Xylia S Leduc P Patrizio F Kraxner and S Silveira (2017) ldquoLocating charging infrastructure for electric buses in Stockholmrdquo Transportation Research Part C Emerging Technologies Vol 78 pp 183-200 Available at httpswwwresearchgatenetpublication315066457_Locating_charging_infrastructure_for_electric_buses_in_Stockholm (last accessed 18 August 2020)
Zero Waste Europe (2016) ldquoThe Story of Parmardquo Available at httpssmartnetniuaorgsitesdefaultfilesresourcescs7-parma-webpdf (last accessed on 2 October 2020)
Zero Waste Europe (2019) ldquoThe story of Ljubljana Case study 5rdquo Available at httpszerowasteeuropeeudownloadscase-study-5-ljubljana-2 (last accessed 18 August 2020)
Zero Waste Scotland (nd) ldquoScheme Administratorsrdquo Zero Waste Scotland website page Available at httpsdepositreturnschemezerowastescotlandorgukscheme-administrators (last accessed 18 August 2020)
200
Abbreviations and acronyms
AfDB African Development Bank
ADB Asian Development Bank
CDP corporate development programme
CEE central and eastern Europe
CTCN Climate Technology Centre and Network
DH district heating
the EBRD the Bank European Bank for Reconstruction and Development
EIB European Investment Bank
EPC energy performance contracting
ESCO energy service company
EVSE electric vehicle supply equipment
EU European Union
GCAP Green City Action Plan
GDP gross domestic product
GHG greenhouse gas
GIZ Deutsche Gesellschaft fuumlr Internationale Zusammenarbeit
ICLEI ICLEI - Local Governments for Sustainability
IDB Inter-American Development Bank
ITDP Institute for Transportation and Development Policy
IT information technology
JSC joint stock company
OECD Organisation for Economic Co-operation and Development
LCV light commercial vehicle
LSE London School of Economics and Political Science
NGO non-governmental organisation
PM particulate matter
PPP public-private partnership
PSC public service contract
SEE south-eastern Europe
SEMED southern and eastern Mediterranean
UCLG United Cities and Local Governments
UN United Nations
UNDP United Nations Development Programme
WHO World Health Organization
201
The contents of this publication reflect the opinions of individual authors and do not necessarily reflect the views of the EBRD
Terms names and images used in this report to refer to geographical or other territories political and economic groupings and units do not constitute and should not be construed as constituting an express or implied position endorsement acceptance or expression of opinion by the European Bank for Reconstruction and Development or its members concerning the status of any country territory grouping and unit or delimitation of its borders or sovereignty
copy European Bank for Reconstruction and Development One Exchange Square London EC2A 2JN United Kingdom wwwebrdcom
All rights reserved No part of this publication may be reproduced or transmitted in any form or by any means including photocopying and recording without the written permission of the copyright holder Such written permission must also be obtained before any part of this publication is stored in a retrieval system of any nature
Photography copy EBRD and iStockphoto
Designed and produced by Pimclick and the EBRD
1272 Effective policy options for green cities