Embed Size (px)
Citation preview
Research ArticleEffective Pneumothorax Detection for Chest X-Ray Images UsingLocal Binary Pattern and Support Vector Machine
Yuan-Hao Chan1 Yong-Zhi Zeng2 Hsien-Chu Wu 23 Ming-Chi Wu4
and Hung-Min Sun 15
1Institute of Information Systems and Applications National Tsing Hua University Hsinchu Taiwan2Department of Computer Science and Information Engineering National Taichung University of Science and TechnologyTaichung Taiwan3Department of Computer Science and Information Engineering National Chin-Yi University of Technology Taichung Taiwan4School of Medicine Chung Shan Medical University Taichung Taiwan5Research Center for Information Technology Innovation Academia Sinica Taipei Taiwan
Correspondence should be addressed to Hsien-Chu Wu wuhcnutcedutw
Received 29 September 2017 Revised 21 January 2018 Accepted 19 February 2018 Published 3 April 2018
Academic Editor Weide Chang
Copyright copy 2018 Yuan-Hao Chan et al This is an open access article distributed under the Creative Commons AttributionLicense which permits unrestricted use distribution and reproduction in any medium provided the original work is properlycited
Automatic image segmentation and feature analysis can assist doctors in the treatment and diagnosis of diseases more accuratelyAutomatic medical image segmentation is difficult due to the varying image quality among equipment In this paper the automaticmethod employed image multiscale intensity texture analysis and segmentation to solve this problem In this paper firstly SVM isapplied to identify common pneumothorax Features are extracted from lung images with the LBP (local binary pattern) Thenclassification of pneumothorax is determined by SVM Secondly the proposed automatic pneumothorax detection method isbased on multiscale intensity texture segmentation by removing the background and noises in chest images for segmentingabnormal lung regions The segmentation of abnormal regions is used for texture transformed from computing multipleoverlapping blocks The rib boundaries are identified with Sobel edge detection Finally in obtaining a complete disease regionthe rib boundary is filled up and located between the abnormal regions
1 Introduction
Medical imaging refers to the technical and processing ofnoninvasive acquisition of internal tissue images of a partof the human or human body for medical or medicalresearch It is a kind of inverse reasoning calculation Asa science medical images belong to biological imagesand include imaging diagnostics radiology endoscopymedical thermography medical photography and micro-scopes In addition techniques such as brainwave mappingand magnetoencephalography although focusing on mea-surement and recording do not show significant imagesbut because of the locating characteristics (ie containingpositional information) of the resulting data it can beconsidered as another form of medical image
In clinical application also known as medical imaging orimaging medicine some hospitals will have to have a medicalimaging center medical imaging department or medicalimaging department set up related equipment and preparefor dedicated nurses radiologists and physicians responsiblefor the operation of instrumentation interpretation anddiagnosis of images which is different from radiation therapyfor radiology
In medical science medical engineering medical physicsand biomedical information science medical imaging usuallyrefers to the science of researching and developing images andcapturing and storing technologies and equipment Researchon how to interpret and diagnose medical images is a supple-mentary science belonging to the radiology department orother medical fields (eg neurology cardiovascular diseases)
HindawiJournal of Healthcare EngineeringVolume 2018 Article ID 2908517 11 pageshttpsdoiorg10115520182908517
Digital image processing has been widely applied in themedical domain However most of the methods still requiremanual processing Automatic image segmentation andfeatures analysis can assist doctors in the treatment and diag-nosis of diseases with higher accuracy accelerate diagnosisprocess and improve efficiency Automatic medical imagesegmentation is difficult due to the varied image qualitycaused by equipment and dosage In this paper theautomatic method employed image multiscale intensitytexture analysis and segmentation to solve this problemThe proposed methods automatically recognize and classifyabnormal region without manual segmentation Generallyautomatic identification is based on the difference of texturesand organ shapes or any pathological changes of the lungarea Therefore the important features could be retained toidentify abnormal areas
In this paper the chest X-ray images are utilized foridentifying lung-related health issues The first proposedidentifying common pneumothorax classification method isbased on SVM Features are extracted from the lung imageby the local binary pattern Then classification of pneumo-thorax is determined by support vector machines Thesecond proposed automatic pneumothorax detection is basedon multiscale intensity texture segmentation The back-ground and noises in the chest images are removed forsegmenting the abnormal lung region Since the area of ribboundaries can be affected easily the rib boundaries areidentified by Sobel edge detection Finally in order to coverthe complete disease region abnormal regions are located
Medical imaging serves as an important source of infor-mation for anatomy and organ function along with the diag-nosis of diseases The integration of image processingtechniques to medical imaging with machine learningmethods has led to the development of computer-aided diag-nostic and decision-making tools The X-rays have theadvantages of rapid reproducibility and low cost
Among them pneumothorax is a common and easyrelapse disease in the diagnosis of chest X-rays The pneumo-thorax is an abnormal accumulating of air in the pleural space
and leads lung discrete from the chest wall [1 2] In generalsymptoms range from asymptomatic to life-threateningrespiratory distress If the pneumothorax is significant itcan cause a shift of the mediastinum and compromise hemo-dynamic stability There are several types of pneumothoraxprimary spontaneous pneumothorax secondary spontane-ous pneumothorax and iatrogenictraumatic pneumothoraxHowever conditions such as smoking a common cold and afamily history of pneumothorax may cause spontaneouspneumothorax On the other hand the blunt traumapenetration trauma and surgery would result in traumaticpneumothorax According to the United States researchpneumothorax is prevalently occurring in humans andits relapse ratio is 35 in men [3] Furthermore criticalpneumothorax may lead to hypoxia shock and evendeath [4]
The chest radiograph has been used as a general adjunctfor pneumothorax screening and diagnosis According toionizing radiation form of X-rays the chest images have beengenerated with the absorption of different spectrums basedon the tissue density [5] Chest radiograph scans the wholechest and produces abundant information and radiologistshave to review the data [6] However the pneumothoraxmay be missed or misclassified as other diseases easily inusing chest radiographs because pneumothorax has thecharacteristics of curved contour and smooth regions withindark region against the chest wall and ribs and clavicles mayoverlap [7] Previous work [7] that proposed the method isbased on the image processing gradient-histogram analysisand its use of many methods is quite complicated and evenmany steps that require manual adjustment of parametersin the patent did not put forward the prediction of pneumo-thorax picture accuracy This study mainly uses SVM LBPSobel edge detection and other methods to automate smallsample prediction and achieve 858 accuracy on patch size5times 5 blocks If clinicians use the method proposed in thisstudy there is considerable confidence in automation andefficiency Examples of abnormality for normal chest andpneumothorax are shown in Figure 1
(a) (b)
Figure 1 Chest radiographs of (a) normal and (b) pneumothorax
2 Journal of Healthcare Engineering
In the analysis of radiographs the doctor diagnosedpneumothorax mainly through the main observation of theaffected area will have a visceral pleural line the outer periph-ery of the pleura line because of the gas so in the imagecannot be seen by the pulmonary blood vessels constitutelung markings and mediastinal displacement defined in theBritish Thoracic Society guideline as chest wall largerthan 2 cm for large pneumothorax and less than 2 cm forsmall pneumothorax
The advantage of X-ray is the fast and inexpensiveimaging and experienced physicians can quickly identifythe pneumothorax from the images In this study themethods used by these physicians were considered expertknowledge to serve as the machine learning direction forimage processing
The computer-aided diagnosis (CAD) has the potentialfor improving the diagnostic accuracy of radiologists to dis-tinguish between pneumothorax and other conditions [8]Several automated analysis of chest radiograph imagealgorithms had been developed [9] Geva et al [10] proposeda visual bag-of-words representation for classification ofchest radiograph with different pathologies Based on thelocal and global texture signature scheme the chest radio-graph was used to generate localized texture analysis forthe detection of local abnormalities The method appliedtraining and detection of the abnormality by using GentleAdaBoost to classify normal and abnormal images suggestedby Geva et al [10]
Previous researchers were mostly developed for the diag-nosis of the chest radiograph not for image segmentationand detection for abnormal location These methods whichconcentrate on diagnosis are viable only on significantly dif-ferent diseases Moreover the location of abnormal regiondetection is necessary for evaluating treatment guidelines ofsymptoms and acute disease indicators For the purpose ofdetecting the location of abnormal regions this paper pro-posed an image segmentation based on texture and intensitydistribution for the chest radiograph The method uses thetexture analysis based on intensity and gradient for regionsegmentation to find out the pneumothorax regions
At present there are skin cancers and tuberculosis onthe automatic recognition of machine learning or depthlearning algorithms This research focuses on pneumotho-rax machine learning classification At present there is noliterature that has focused on pneumothorax medical imageclassification The reasons for choosing Sobel edge detectionis that it calculates very fast and efficiently on the edge of themedical images This study uses SVM for its high classifi-cation efficiency and deals with high-dimensional spatialdata effectively
2 Identifying Pneumothorax Using MachineLearning Algorithms
The SVM-based identifying common pneumothorax methodusing local binary pattern is explained step by step as follows
21 The Proposed Scheme This paper presents identifyingcommon pneumothorax system consisting of lung object
identification feature computation and training and classifi-cation Lung region identification processes the originalimage to determine the mean intensity of global lung regionsFeature computation processes the multiblock uniformlocal binary pattern (ULBP) to calculate each pixel of lungregions and count on the histogram Finally support vectormachines train and classify normal lungs from abnormallungs using ULBP features The flowchart of the supportvector machine- (SVM-) based common pneumothoraxidentification is shown in Figure 2
22 Identification of Lung Regions The lung region identifi-cation is used to segment the objective global lung regionsfrom original X-ray chest image After image loading themean intensity values of the original image have to beenhanced to the range of intensity from 0 to 1 based ongamma correction to provide useful image intensity detailsthrough adjustment of the gamma value [11] In this processwe assign normalized gamma value to be 2 because thenormalized gamma function can use the pixel intensity toprovide multiequalization darkness preservation Conse-quently the higher gamma parameter generates a moresignificant adjustment to display the lung region Theenhancement formula is described as follows
enh hw =I hw
Max graylevel num
γ
1
where I hw is the pixel value of the original image Max_graylevel_num is the number of the original intensity rangeand γ is the gamma value Figure 3(a) shows an example oforiginal image and Figure 3(b) shows enhancement resultBecause several lighter pixels surrounded by dark pixels lead
Decision support
Classification
Feature computation
Lung regionidentification
Trainedclassifier
Figure 2 The flowchart of the proposed SVM-based lungclassification
3Journal of Healthcare Engineering
to generate holes of intensity pixels in the enhanced imagethe connect-component method is applied to fill the holesin the lighter pixels surrounded by dark pixels [12]
Finally the enhanced image defines the integrated lungregions via the Otsu algorithm [13] and transforms into abinary image and then the lung regions are identified basedon 8-connected neighborhood method to find two maximumobjects that are able to fill the empty spaces within theregions Figure 3 shows an example
23 Local Binary Pattern Feature Extraction By following thelung region identification local binary pattern (LBP) is theprimary technique in the section LBP is a local texture oper-ation technique that is considered to be a simple and efficienttexture operator LBP operator uses the center as threshold-ing for each pixel and compares with neighbor pixel thenthe results transformed into the value of binary Each resultof binary value is counted on a histogram For exampleoriginal values are shown in Figure 4(a) in the 3times 3-sized
(a) (b)
(c) (d)
Figure 3 The results of an example (a) original image (b) the enhanced image (c) enhanced by hole-filling image and (d) image lungregion identification
121
46
51
255
110
111
60
10
105
(a)
1
0
0
1
C
1
0
0
1
(b)
Figure 4 An example of LBP This result values encoded as 11001100 by starting from the upper left and reading clockwise
4 Journal of Healthcare Engineering
block Figure 4(b) uses the center as the threshold in the3times 3-sized block Finally each 8-bit LBP is counted on256-bin histogram
In addition LBP operator could adopt the uniformpatterns to reduce the length of the feature vector andimplement rotation invariant descriptor in a simple way Inthis section the features are calculated through a uniformlocal binary pattern (ULBP) Uniform pattern is containedat most two bitwise transitions from 0 to 1 For examplethe patterns 00000000 (0 transitions) 01111100 (2 transi-tions) and 11001111 (2 transitions) are uniform And thepatterns 11001101 (4 transitions) and 01010110 (6 transi-tions) are not uniform Computation of the ULBP histogramhas a separate bin (eg the pattern 01000000 and the pattern00100000 have the same bin)
There are 8 bins for each combination with no more thantwo conversions (eg 10000000gt 01000000 hellipgt 0000000111000000gt 01100000gthellipgt 0000001111100000gt 0111000-0gthellipgt 00000111) and each will have 8 patterns for everyuniform pattern And all nonuniform patterns are assignedto a single bin ULBP image is constructed by dtimes d sizeULBP operator is used for overlapping and scanninglung regions then generates pattern histogram from thelung image for overlapping and scanning lung regionsin lung identification The neighboring correlation of pixelpattern histogram after encoding transformation in amoving window is defined as
Xn = h
i=1w
j=1H ULBP i j == k n emspn = 1 2hellip 58 2
where Xn is the number of the nth bin in the histogram h isthe height of the lung image and w is the width of the lungimage k is a set which includes 58 uniform binary patternscorresponding to the integers 0 1 2 3 4 6 7 8 12 14 1516 24 28 30 31 32 48 56 60 62 63 64 96 112 120124 126 127 128 129 131 135 143 159 191 192 193195 199 207 223 224 225 227 231 239 240 241 243247 248 249 251 252 253 254 and 255 i and j are the pixelcoordinates of the lung image HS is equal to 1 if S is trueand HS is equal to 0 if S is false H is the part of the histo-gram and n is the value of bin that judging (i j) as the centerof the ULBP value is equal to which bin in the histogramcorresponding position accumulation
ULBP i j =minROT
0 le b lt 8LBP i j b 3
ROT is a function fixed with the central pixel while theneighbors are circularly rotated b is the number of bthrotations An example is shown in Figure 5
LBP i j = d
k=02kWin xk minus xc
Win xk minus xc =1 if xk ge xc
0 otherwise
4
where LBP is a function value where xc is a center of the dtimes d-sized block and xk is the neighboring pixel Win is abinary thresholding function Calculate the LBP straightxc as the center point with the adjacent point xk compar-ison if greater than or equal to the adjacent point set to 1and vice versa 0
24 Machine Learning Algorithm After feature computa-tion the classification of common pneumothorax is deter-mined by support vector machines Generally classificationincludes input data and divides into training and testing setsThe training set has one label value (class labels) in each lungimage in which normal lung image is set to 0 otherwise is setto 1 And each lung image has multiple attributes (features)The attributes are equal to each bin value on ULBP histogramfrom the feature computation The features obtained 118dimensions by using ULBP operator with the 9 times 9-sizedblock and 11 times 11-sized block These constitute the trainingvectors through the use of the RBF kernel function FinallySVM constructs a model classification for normal lung orabnormal lung
3 Rapid Pathology Detection for Chest X-RayImages Using Texture Segmentation Method
31 The Proposed Scheme The multiscale intensity texturesegmentation algorithm is composed of lung object identifi-cation target region texture analysis multiscale regionsegmentation and target region detection from chest X-rayimages The lung object identification processes the originalimage to discover the global lung regions The target regiontexture analysis processes the global lung regions to calculatethe texture distribution and defines the initial target regionsbased on the local binary pattern (LBP) [14] The identifica-tion of the multiscale region definition the smooth complexregions and the rib boundaries is performed by the differ-ent direction intensity distribution of global lung regionsFinally the target region detection processes the initial tar-get regions and results of multiscale region segmentationto estimate the relationships and to detect the final targetregions The flowchart of the proposed multiscale intensitytexture segmentation is shown in Figure 6
32 Identification of Lung Regions The lung region identifi-cation is used to segment the objective global lung regionsfrom original X-ray chest image After image loading themean intensity values of the original image have to beenhanced to the range of intensity from 0 to 1 based ongamma correction to obtain the useful enhanced image
B C D
I A E
H G F
I B C
H A D
G F E
C D E
B A F
I H G
ROT ldquoABCDEFGHIrdquo ldquoAIBCDEFGHrdquo ldquoACDEFGHIBrdquohellip
997935 997935
Figure 5 The ROT function as the same type in the case ofclockwise rotation
5Journal of Healthcare Engineering
through adjustment of the gamma value [11] Finally theenhanced image defines the integrated lung regions via theOtsu algorithm [13] to transform the binary image and thenthe lung regions are identified based on 8-connected neigh-borhood method to find two maximum objects that are ableto fill empty spaces within the regions
33 Texture Analysis of Abnormal Regions Radiographconstruction according to X-ray radiation and interactionswith human tissue are composed of 12 bits per pixel whosevalue corresponds to 0ndash4095 [15] The high-density humantissue such as the bones and lung can display light intensityby using absorption spectrum Reversely the low-densityhuman tissue such as pneumothorax displayed dark inten-sity using attenuation spectrum The pixel intensity distribu-tion of the original image between 0 and 4095 has sufficientinformation to describe human tissues but that may lead tohighlight noise Based on the reason the 12 bits of theoriginal image are transformed to 8-bit image to reduce thenoise for subsequent processing
By following lung region identification the abnormalregions are recognized by target region texture analysiswithin the low density of the abnormal region The proposedtarget region texture analysis according to the local binarypattern (LBP) defines the smooth and complex regionsLBP image is constructed by dtimes d-sized LBP operator foroverlapping and scanning lung regions then generatespattern histogram from neighboring correlation of patcheswith RtimesR size for overlapping and scanning lung regionsin lung identification The neighboring correlation of pixel
pattern histogram patchPatternRdX0X1hellipX255 after deci-mal transformation in a moving window is defined as
Target patch xc yc =1 if patchPatternRd X0 = R times R
0 otherwise5
where patch xc yc is a patch with center xc yc andR times R-sized block and if the value of patchPattern X0 isequal to RtimesR then Target patch xc yc is set to 1 other-wise Target patch xc yc is 0 The center point of 1 inthe RtimesR region will be marked as 1 It is judged thatthe matrix sum of the size RtimesR centering on xc and xyis set to 1 if it is equal to R times R and conversely 0
Xk = R
i=1R
j=1H LBP i j == k emspk = 0 1hellip 255 6
where Xk is the number of the kth pattern i and j are pixelpositions of a patch HS is equal to 1 if S is true andHS is equal to 0 if S is false
LBP i j = d
k=02kWin xk minus xc
Win xk minus xc =1 if xk minus xc ge 5
0 otherwise
7
where LBP is a function value where xc is a center of thedtimes d-sized block and xk is the neighboring point pixel
Lung regionidentification
Image
Target regiontexture analysis
Multiscale regionsegmentation
Target regiondetection
Result
Figure 6 The flowchart of the proposed multiscale intensity texture segmentation
6 Journal of Healthcare Engineering
Win is a binary thresholding function An example isshown in Figure 7
And the formula is similar to (4) but after subtracting theabsolute value to see whether greater than or equal to 5 is setto 1 instead of 0
34 Multiscale Region Segmentation After lung regionidentification the noise of lung regions is eliminated byGaussian filter [16] with 5times 5 mask and standard deviationset as 6 to smooth boundaries of the lung regions The inten-sity distributions of horizontal and vertical patterns areconstructed from calculating difference values of gradientsof horizontal and vertical direction through the Gaussian-filtered image To segment the regions of different pixelintensity distributions the constructing patterns ofhorizontal and vertical direction pattern set are employedfor region segmentation
The noise elimination of image is to calculate the differ-ence of intensity between adjacent pixels at horizontal andvertical directions respectively for the difference value isable to describe the distribution of pixel intensity Whenconcerning the horizontal direction the distribution of pixelintensity is smooth if the difference of value is positive whilethe distribution of pixel intensity is complicated if the dif-ference of value is negative When the distribution of pixelintensity is equal to zero the distribution of pixel intensityis invariant At the vertical direction the distribution ofpixel intensity is regarded as the upper boundary of therib (V1) if the difference of value is positive while thedistribution of pixel intensity is regarded as the lowerboundary of the rib (V2) if the difference of value isnegative The results are shown in Figures 8(d) and 8(c)The different parts of the lung tissue have different pixelintensity distribution
Next smooth region complex region and rib boundaryare determined using the intensity distribution of horizontalscanning and vertical scanning individually based on the
patch of 5times 5 According to the calculation of differencevalues a positive value is set to 1 and a negative value is setto minus1 In the horizontal direction if the number of 1rsquos islarger the centroid point of the patch is set to 1 Reverselyif the number of minus1rsquos is larger the centroid point of the patchis set to minus1 Otherwise the centroid point of the patch is set to0 The points set to 1 are defined as H1 region and the pointsset to minus1 are defined as H2 region The results are shown inFigures 8(b) and 8(c) Finally consider the intersectionregion of the target and H1 and the intersection region ofthe target and H2 The results which are larger are regardedas smooth regions and the rest are complex regions Theresult of V1 union V2 is rib boundary
35 Detection of Abnormal Regions After lung regions aredetermined the intersection of smooth regions and com-plex regions will be labeled Then more precise smoothregions constructed by calculating difference value of thestandard deviation of the target regions and overlappingregion can be spotted Firstly combine the V1 and V2 pat-terns to generate the rib boundaries and remove the ribboundaries for smooth regions and complex regions asshown in Figures 9(a) and 9(b) Because the rib bound-aries do not belong to smooth or complex regions theprocess leads to identifying the overlapping regions ofsmooth and complex regions as shown in Figure 9(d)For the definition of the new overlapping regions considerthe standard deviation of the overlapping region and thetarget region This process calculates the standard devia-tion for all regions Because the intensity distribution ofthe overlapping regions and intensity distribution of thetarget regions are similar their standard deviation is natu-rally similar Therefore use the standard deviation of thetarget region to redefine and determine the overlappingregion to be smooth or complex region If the standarddeviation of overlapping region is less than plus or minus10 percent of the target region the overlapping region is
110 121 122
108 100 104
97 100 99
(a)
10 21 22
8 4
minus3 0 minus1
(b)
0 0 0
0 1
1 1 1
(c)
0 times 20 0 times 21 0 times 22
0 times 27 1 times 23
1 times 26 1 times 25 1 times 24
pattern=0 times 20 + 0 times 21 + 0 times 22 + 1 times 23 + 1 times 24 +
1 times 25 + 1 times 26 + 0 times 27 = 120
(d)
Figure 7 An example of the pattern generation (a) the original pixel values (b) difference value of the neighboring point and centerpoint (c) result of the Win function and (d) the pattern value of the LBP function
7Journal of Healthcare Engineering
recognized as the smooth region otherwise the overlap-ping region is removed from the smooth region Finallyeach smooth region is determined as a pneumothorax regionIn the rib boundary that is located between the pneumotho-rax regions as shown in Figure 9(e) the morphologyoperations are applied to remove the noises for obtainingfinal pneumothorax region as shown in Figure 9(e) Theresults are then marked on the original image as shown inFigures 9(g) and 9(h)
4 Experimental Results
41 Data Exploratory 32 chest radiographs includingtraumatic pneumothorax and spontaneous pneumothoraxfrom 32 patients (age range 18ndash65 years) and 10 normalchest radiographs used in this study are acquired from theDepartment of Medical Imaging Chung Shan MedicalUniversity Hospital in Taichung Taiwan The dataset was
approved by the Institutional Review Board of the ChungShan Medical University Hospital in Taichung Taiwan
42 Pneumothorax Prediction Accuracy The ULBP histo-gram for 11times 11 block and 9times 9 block merged into the finalhistogram is calculated by using SVM for training and classi-fication With a sample of 42 images each image was dividedinto two lung images (A total of 32 pneumothorax lung casesand 52 normal lung cases) 70 lung cases (36 normal casesand 22 pneumothorax cases) were used for the trainingphase while 30 lung cases (16 normal cases and 10 pneu-mothorax cases) were used for the testing phase The 5-foldcross-validation result with accuracy (Acc) variation from769ndash884 is shown Table 1
43 Pneumothorax Segmentation Accuracy The multi-scale intensity texture is calculated by the intensity ofeach pixel in each block Finally the pneumothoraxregion is detected through standard deviation to evaluate
(a) (b) (c)
(d) (e)
Figure 8 The segmentation results (a) target region (b) H1 intensity distribution pattern set (c) H2 intensity distribution pattern set (d) V1intensity distribution pattern set and (e) V2 intensity distribution pattern set
8 Journal of Healthcare Engineering
the final recognition of the region of pneumothoraxThree objective evaluations of the accuracy precision andsensitivity ratio for comparing the segmentation effects aredefined as
Accuracy =TP + TN
TP + TN + FP + FN
Precision =TP
TP + FP
Sensitivity =TP
TP + FN
8
where TP is when both the prediction outcome and the actualvalue are positive TN is when both the prediction outcomeand the actual value are negative FP is when the prediction
outcome is positive while the actual value is negative andFN is when the prediction outcome is negative while theactual value is positive
Figure 10 shows the comparison between the area that ismanually depicted of radiologists and the proposed methodFigures 10(a) and 10(d) are original images (b) and (e) arepneumothorax regions by manual of radiologists and (c)and (f) are pneumothorax regions by the proposed methodThe accuracy precision and sensitivity of all dataset imagesby using the proposed method are shown in Figure 11
44 Comparisons of the Proposed Method From the experi-mental results in Figure 11 the accuracy is affected to discernthe region between smooth and complex areas in differentblock sizes The block sizes of different judgments of theimage intensity provide different information the segmenta-tion will be different in the result In particular the imageintensity at the boundary and in the vicinity of the clavicleis relatively complicated In Table 2 the average accuracy ofthe 5times 5 block compared to the 11times 11 block decreases from
(a) (b) (c) (d)
(e) (f) (g) (h)
Figure 9 The results of an example of (a) smooth regions (b) complex regions (c) rib boundary regions (d) intersection region betweensmooth and complex regions (e)ndash(f) final segmentation region and (g)ndash(h) original image
Table 1 5-fold cross-validation result
Fold 1 2 3 4 5 Acc
Acc 769 884 884 807 769 822
9Journal of Healthcare Engineering
(a) (b) (c)
(d) (e) (f)
Figure 10 Comparison between the area that is manually depicted of radiologists and the proposedmethod (andashc) Segmentation results of theleft lung (dndashf) segmentation results of the right lung
00
200
400
600
800
1000
1 3 5 7 9 11 13 15 17 19 21 23 25 27 29 31
Perfo
rman
ce (
)
Number of cases
AccuracyRecallPrecision
Figure 11 Accuracy precision and sensitivity of all dataset image using the proposed method
10 Journal of Healthcare Engineering
858 to 811 However the block size is too small to beused because the region will reveal too little informationand then the pneumothorax region cannot be accuratelyjudged And the block size will increase when the precisionincreases but the sensitivity reduces for the evaluation ofthe precision it referenced FP and TP and the sensitivityreferenced FN and TP In the results when the size of theselected block is larger the FP decreases but the FN increasesIn conclusion the final cutout pneumothorax regionprovides a better result for 5times 5 size of the patch
5 Conclusion
The primary method in the paper is to segment the lungin the abnormal region through multiple overlappingblocks The abnormal region is found by texture trans-formed from computing multiple overlapping blocksFinally this method effectively analyses lung diseases ofthe area in the chest X-ray image and improves the possiblediagnosis of the missing problem of the pneumothorax areaThis increases the efficiency for physicians to assess theextent of the treatment of pneumothorax so as to supportthe radiologist to reduce workload
This study presents a novel framework for automaticpneumothorax detection in CXRs The texture analysis isbased on intensity and gradient for pneumothorax detectionThe pneumothorax case was a difficult judgment whenpneumothorax region is extremely stenotic and close to thechest boundaries In addition pixels located near the chestboundaries tend to have less discriminative texture on imageindication because the bones and pleura existed in obviousedges which reduced their correspondence of texturesConsequently the texture characteristic in chest boundariesarea is not as prominent as in the inner lung region Discrim-ination in different lung regions and adding the textureweight may be the future research focus The segmentationcan increase the accuracy rate for the segmentation ofpneumothorax region
Conflicts of Interest
The authors declare that there is no conflict of interestregarding the publication of this paper
References
[1] M Noppen and T De Keukeleire ldquoPneumothoraxrdquo Respira-tion vol 76 no 2 pp 121ndash127 2008
[2] A MacDuff A Arnold J Harvey and on behalf of the BTSPleural Disease Guideline Group ldquoManagement of spontane-ous pneumothorax British Thoracic Society pleural diseaseguideline 2010rdquo Thorax vol 65 Supplement 2 pp ii18ndashii312010
[3] A P Wakai ldquoSpontaneous Pneumothoraxrdquo BMJ ClinicalEvidence 2011 httpswwwncbinlmnihgovpmcarticlesPMC3275306
[4] N Bellaviti F Bini L Pennacchi et al ldquoIncreased incidence ofspontaneous pneumothorax in very young people observa-tions and treatmentrdquo Chest vol 150 no 4 p 560A 2016
[5] T Weber F Bayer W Haas et al Investigation of the Signa-ture of Lung Tissue in X-Ray Grating-Based Phase-ContrastImaging 2012 httparxivorgabs12125031
[6] L Cardinale G Volpicelli A Lamorte and J Martino ldquoRevi-siting signs strengths and weaknesses of standard chest radi-ography in patients of acute dyspnea in the emergencydepartmentrdquo Journal of Thoracic Disease vol 4 no 4pp 398ndash407 2012
[7] K Doi and S SanadaMethod and System for Automatic Detec-tion of Ribs and Pneumothorax in Digital Chest Radiograph-sUS Patent 5668888 1997
[8] K Doi ldquoComputer-aided diagnosis in medical imaginghistorical review current status and future potentialrdquo Com-puterized Medical Imaging and Graphics vol 31 no 4-5pp 198ndash211 2007
[9] U Avni H Greenspan E Konen M Sharon andJ Goldberger ldquoX-ray categorization and retrieval on the organand pathology level using patch-based visual wordsrdquo IEEETransactions on Medical Imaging vol 30 no 3 pp 733ndash7462011
[10] O Geva G Zimmerman-Moreno S Lieberman E Konenand H Greenspan ldquoPneumothorax detection in chest radio-graphs using local and global texture signaturesrdquo in MedicalImaging 2015 Computer-Aided Diagnosis RenaissanceOrlando Florida at SeaWorld March 2015
[11] S C Huang F C Cheng and Y S Chiu ldquoEfficient contrastenhancement using adaptive gamma correction with weight-ing distributionrdquo IEEE Transactions on Image Processingvol 22 no 3 pp 1032ndash1041 2013
[12] A Bush H Gray and D M Denison ldquoDiagnosis of pulmo-nary hypertension from radiographic estimates of pulmonaryarterial sizerdquo Thorax vol 43 no 2 pp 127ndash131 1988
[13] N Otsu ldquoA threshold selection method from gray-level histo-gramsrdquo IEEE Transactions on Systems Man and Cyberneticsvol 9 no 1 pp 62ndash66 1979
[14] T Ahonen A Hadid and M Pietikainen ldquoFace descriptionwith local binary patterns application to face recognitionrdquoIEEE Transactions on Pattern Analysis and Machine Intelli-gence vol 28 no 12 pp 2037ndash2041 2006
[15] T Kimpe and T Tuytschaever ldquoIncreasing the number of grayshades in medical display systemsmdashhow much is enoughrdquoJournal of Digital Imaging vol 20 no 4 pp 422ndash432 2007
[16] C Bouman and K Sauer ldquoA generalized Gaussian imagemodel for edge-preserving MAP estimationrdquo IEEE Transac-tions on Image Processing vol 2 no 3 pp 296ndash310 1993
Table 2 Comparisons of the accuracy precision and sensitivity fordifferent patch sizes of the proposed method
Patch size Accuracy Precision Sensitivity
5times 5 858 836 874
7times 7 841 844 855
9times 9 832 851 823
11times 11 811 862 816
11Journal of Healthcare Engineering
International Journal of
AerospaceEngineeringHindawiwwwhindawicom Volume 2018
RoboticsJournal of
Hindawiwwwhindawicom Volume 2018
Hindawiwwwhindawicom Volume 2018
Active and Passive Electronic Components
VLSI Design
Hindawiwwwhindawicom Volume 2018
Hindawiwwwhindawicom Volume 2018
Shock and Vibration
Hindawiwwwhindawicom Volume 2018
Civil EngineeringAdvances in
Acoustics and VibrationAdvances in
Hindawiwwwhindawicom Volume 2018
Hindawiwwwhindawicom Volume 2018
Electrical and Computer Engineering
Journal of
Advances inOptoElectronics
Hindawiwwwhindawicom
Volume 2018
Hindawi Publishing Corporation httpwwwhindawicom Volume 2013Hindawiwwwhindawicom
The Scientific World Journal
Volume 2018
Control Scienceand Engineering
Journal of
Hindawiwwwhindawicom Volume 2018
Hindawiwwwhindawicom
Journal ofEngineeringVolume 2018
SensorsJournal of
Hindawiwwwhindawicom Volume 2018
International Journal of
RotatingMachinery
Hindawiwwwhindawicom Volume 2018
Modelling ampSimulationin EngineeringHindawiwwwhindawicom Volume 2018
Hindawiwwwhindawicom Volume 2018
Chemical EngineeringInternational Journal of Antennas and
Propagation
International Journal of
Hindawiwwwhindawicom Volume 2018
Hindawiwwwhindawicom Volume 2018
Navigation and Observation
International Journal of
Hindawi
wwwhindawicom Volume 2018
Advances in
Multimedia
Submit your manuscripts atwwwhindawicom
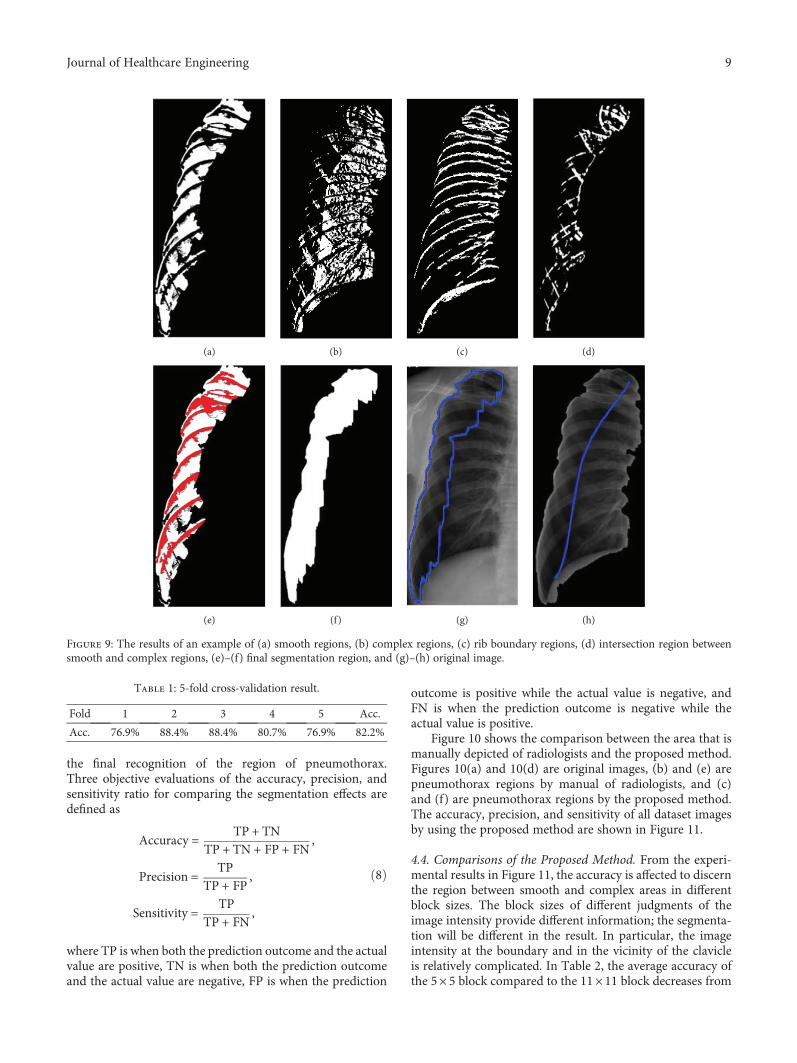

International Journal of
AerospaceEngineeringHindawiwwwhindawicom Volume 2018
RoboticsJournal of
Hindawiwwwhindawicom Volume 2018
Hindawiwwwhindawicom Volume 2018
Active and Passive Electronic Components
VLSI Design
Hindawiwwwhindawicom Volume 2018
Hindawiwwwhindawicom Volume 2018
Shock and Vibration
Hindawiwwwhindawicom Volume 2018
Civil EngineeringAdvances in
Acoustics and VibrationAdvances in
Hindawiwwwhindawicom Volume 2018
Hindawiwwwhindawicom Volume 2018
Electrical and Computer Engineering
Journal of
Advances inOptoElectronics
Hindawiwwwhindawicom
Volume 2018
Hindawi Publishing Corporation httpwwwhindawicom Volume 2013Hindawiwwwhindawicom
The Scientific World Journal
Volume 2018
Control Scienceand Engineering
Journal of
Hindawiwwwhindawicom Volume 2018
Hindawiwwwhindawicom
Journal ofEngineeringVolume 2018
SensorsJournal of
Hindawiwwwhindawicom Volume 2018
International Journal of
RotatingMachinery
Hindawiwwwhindawicom Volume 2018
Modelling ampSimulationin EngineeringHindawiwwwhindawicom Volume 2018
Hindawiwwwhindawicom Volume 2018
Chemical EngineeringInternational Journal of Antennas and
Propagation
International Journal of
Hindawiwwwhindawicom Volume 2018
Hindawiwwwhindawicom Volume 2018
Navigation and Observation
International Journal of
Hindawi
wwwhindawicom Volume 2018
Advances in
Multimedia
Submit your manuscripts atwwwhindawicom