Embed Size (px)
Citation preview

Effective implementation of process safety management
K Naicker
Dissertation submitted in fulfilment of the requirements for the degree Master in Engineering at the Potchefstroom Campus of the North-West University
Supervisor: Prof PW Stoker
May 2014

ii
Abstract
Title: Effective implementation of process safety management
Key Words: Process Safety Management, Safety Culture, Leadership Commitment, Employee
Participation, Mechanical Integrity
Process Safety Management (PSM) is concerned with the safe handling of products, safe
production of products and the safe operation of the process as confirmed by Thrower (2013).
The Occupational Safety and Health Administration (OSHA) (2012) promulgated the PSM
standard in 1992, which incorporated fourteen elements, to decrease the occurrence of process
safety incidents.
Walt and Frank (2007) described the cracks in the implementation of PSM programs, emanating
from major process safety incidents and compliance audits. This was confirmed by the decaying
process safety performance observed in recent years. It was thus proposed that an analysis into
the diverse process safety incident causes and its comparison against the implemented OSHA
PSM program, would suggest its associated shortcomings.
The aim of the study was to determine the most effective approach to implement and sustain
PSM in an organisation to prevent and manage the occurrence of major industrial catastrophes.
A semi-qualitative study was conducted through the employment of a survey questionnaire and
published incident investigation reports. A total of fifty random process safety incidents were
interpreted from published and accredited secondary literature. Most of the secondary literature
was obtained from the Health and Safety Executive (HSE) and Centre for Chemical Process
Safety (CCPS) databases.
From the study findings, Mechanical Integrity (MI) failures were found to significantly and
consistently contribute to process safety incidents. Further analysis specifically concluded that
equipment or control failure was the significant cause. Employee Participation (EP) was found
to statistically correlate with the other elements. The researcher found that literature agreed with

iii
the aforementioned findings and this study verified that the EP element was instrumental in the
implementation of the other elements.
The researcher used literature to confirm that safety culture and leadership commitment was
crucial to effective and sustainable PSM programs. The case study analysis validated this
observation. Therefore the most effective approach to implement and sustain PSM was to adopt
the DuPont, Centre for Chemical Process Safety (CCPS), Risk Based PSM framework or
Energy Institute (EI) models. To conclude, this study was effective as all the objectives and the
aim was achieved.

iv
Acknowledgements
I wish to acknowledge my study leader, for his constructive and objective contributions which
guided me to complete this study.
I wish to express my sincere gratitude to my fiancé and families for their consistent motivation
and dedicated support.
v
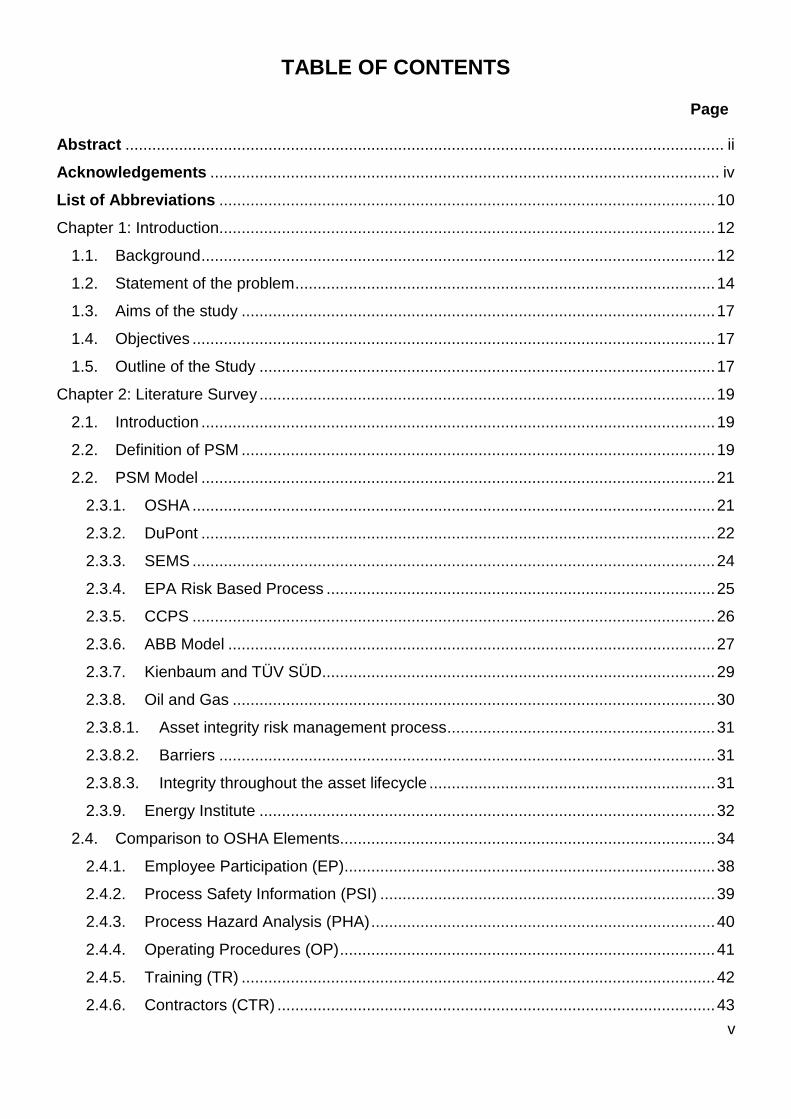
TABLE OF CONTENTS
Page
Abstract ...................................................................................................................................... ii
Acknowledgements .................................................................................................................. iv
List of Abbreviations ............................................................................................................... 10
Chapter 1: Introduction............................................................................................................... 12
1.1. Background ................................................................................................................... 12
1.2. Statement of the problem .............................................................................................. 14
1.3. Aims of the study .......................................................................................................... 17
1.4. Objectives ..................................................................................................................... 17
1.5. Outline of the Study ...................................................................................................... 17
Chapter 2: Literature Survey ...................................................................................................... 19
2.1. Introduction ................................................................................................................... 19
2.2. Definition of PSM .......................................................................................................... 19
2.2. PSM Model ................................................................................................................... 21
2.3.1. OSHA ..................................................................................................................... 21
2.3.2. DuPont ................................................................................................................... 22
2.3.3. SEMS ..................................................................................................................... 24
2.3.4. EPA Risk Based Process ....................................................................................... 25
2.3.5. CCPS ..................................................................................................................... 26
2.3.6. ABB Model ............................................................................................................. 27
2.3.7. Kienbaum and TÜV SÜD........................................................................................ 29
2.3.8. Oil and Gas ............................................................................................................ 30
2.3.8.1. Asset integrity risk management process ............................................................ 31
2.3.8.2. Barriers ............................................................................................................... 31
2.3.8.3. Integrity throughout the asset lifecycle ................................................................ 31
2.3.9. Energy Institute ...................................................................................................... 32
2.4. Comparison to OSHA Elements.................................................................................... 34
2.4.1. Employee Participation (EP)................................................................................... 38
2.4.2. Process Safety Information (PSI) ........................................................................... 39
2.4.3. Process Hazard Analysis (PHA) ............................................................................. 40
2.4.4. Operating Procedures (OP) .................................................................................... 41
2.4.5. Training (TR) .......................................................................................................... 42
2.4.6. Contractors (CTR) .................................................................................................. 43

vi
2.4.7. Pre Start-up Safety Review (PSSR) ....................................................................... 44
2.4.8. Hot Work Permit (HWP) ......................................................................................... 44
2.4.9. Mechanical Integrity (MI) ........................................................................................ 45
2.4.10. Management of Change ...................................................................................... 47
2.4.11. Incident Investigation .......................................................................................... 48
2.4.12. Emergency Planning and Response (EPR) ........................................................ 49
2.4.13. Compliance Audits .............................................................................................. 49
2.4.14. Trade Secrets ..................................................................................................... 50
2.5. Manufacturing Industry Overview.................................................................................. 51
2.5.1. Metallurgical Industry ............................................................................................. 51
2.5.2. Chemical Industry ................................................................................................... 51
2.5.3. Food Processing Industry ....................................................................................... 51
2.5.4. Agricultural ............................................................................................................. 52
2.5.5. Nuclear ................................................................................................................... 52
2.6. Case Studies: Company Profiles .................................................................................. 53
2.6.1. Sasol ...................................................................................................................... 53
2.6.2. British Petroleum (BP) ............................................................................................ 53
2.6.3. Shell ....................................................................................................................... 53
Chapter 3: Empirical Investigation ............................................................................................. 55
3.1. Introduction ................................................................................................................... 55
3.2. Data Gathering.............................................................................................................. 55
3.3. Survey Development ..................................................................................................... 56
3.3.1. Survey Validation ................................................................................................... 56
3.3.2. Survey Questionnaire ............................................................................................. 57
Chapter 4: Findings and Discussion .......................................................................................... 58
4.1. Introduction ................................................................................................................... 58
4.2. The Study Population .................................................................................................... 58
4.3. Overall OSHA PSM Element Effectiveness .................................................................. 60
4.4. Pre and Post OSHA element performance ................................................................... 62
4.5. Statistical Analysis ........................................................................................................ 68
4.5.1. Element Correlations .............................................................................................. 69
4.5.2. Element Cross Tabulation ...................................................................................... 71
4.5.2.1. PSM Elements .................................................................................................... 71
4.5.2.2. Pre and Post OSHA PSM Implementation Comparison ...................................... 72
4.5.2.3. Five Yearly OSHA PSM Comparison .................................................................. 72

vii
4.5.2.4. Element Dependencies ....................................................................................... 73
4.6. Limitations ..................................................................................................................... 79
4.7. Case Study Findings ..................................................................................................... 79
4.7.1. Sasol ...................................................................................................................... 79
4.7.2. British Petroleum (BP) ............................................................................................ 80
4.7.3. Shell ....................................................................................................................... 81
Chapter 5: Conclusions and Recommendations ........................................................................ 87
5.1. Introduction ................................................................................................................... 87
5.2. Objectives ..................................................................................................................... 87
5.3. Aim ................................................................................................................................ 88
5.4. Recommendation to improve this study ........................................................................ 88
5.5. Recommendations for further research ......................................................................... 89
List of References ...................................................................................................................... 90
Appendix A – Survey Questionnaire ........................................................................................ 101
Appendix B – Discussion Information ...................................................................................... 104
Appendix C – Incident Information ........................................................................................... 105

8
List of Tables
Table 1 – Cost of Non-Compliance (IRC, 2006) ......................................................................... 14
Table 2 – Overview of the OSHA Elements (OSHA, 2012) ........................................................ 36
Table 3 – EP Requirements (EPA, 1999)................................................................................... 39
Table 4 – PSI Requirements (EPA, 1999).................................................................................. 40
Table 5 – PHA Requirements (EPA, 1999) ................................................................................ 41
Table 6 – OP Requirements (EPA, 1999) .................................................................................. 42
Table 7 – CTR Requirements (EPA, 1999) ................................................................................ 43
Table 8 – PSSR Requirements (EPA, 1999) .............................................................................. 44
Table 9 – HWP Requirements (EPA, 1999) ............................................................................... 45
Table 10 – MI Requirements (EPA, 1999) ................................................................................. 46
Table 11 – MOC Requirements (EPA, 1999) ............................................................................. 47
Table 12 – II Requirements (EPA, 1999) ................................................................................... 49
Table 13 – OSHA’s NEP Citations (Barab, 2012) ...................................................................... 61
Table 14 – Sustaining PSM Implementation (IRC, 2006) ........................................................... 66
Table 15 – Spearman’s rho Correlations.................................................................................... 70
Table 16 – Cross Tabulation ...................................................................................................... 71
Table 17 – OSHA Implementation Comparison ......................................................................... 72
Table 18 – Five Yearly Comparisons ......................................................................................... 73
Table 19 – Five parameters of safety culture (EPSC, 2012) ...................................................... 76
Table 20 – HSSE PSM Framework (Den Bakker, 2012) ............................................................ 82
Table 21 – Nuclear Safety Fundamentals (HSE, 2006) ............................................................. 85
Table 22 – Survey Questionnaire ............................................................................................. 101
Table 23 – CCPS Incident Severity Categories (Overton,2008) .............................................. 104
Table 24 – Incident Report Summary ...................................................................................... 105

9
List of Figures
Figure 1 – Relationship between Process safety and occupational safety (ABB, 2013) ............ 12
Figure 2 – Major incidents in the last decades (Schouwenaars, 2008) ...................................... 13
Figure 3- Major Process Industry Companies' Occupational Safety Performance ..................... 15
Figure 4–DuPont Process Safety incident history (DuPont, 2008) ............................................. 16
Figure 5 – PSM Overview (Thrower, 2013) ................................................................................ 21
Figure 6 – OSHA Model (OSHA, 2012) ..................................................................................... 22
Figure 7 – DuPont PSM Model (DuPont, 2008) ......................................................................... 23
Figure 8 – Key SEMS Elements (Maher, 2011) ......................................................................... 25
Figure 9 – Risk Based PSM Framework (Bradshaw, 2012) ....................................................... 26
Figure 10 - CCPS Model (OSHA, 2012) .................................................................................... 27
Figure 11 – ABB Approach (ABB, 2012) .................................................................................... 28
Figure 12 – ABB Approach (ABB, 2012) .................................................................................... 28
Figure 13–KT PSM Model (Kienbaum & SÜD, 2013) ................................................................ 29
Figure 14–KT PSM Model (Kienbaum & SÜD, 2013) ................................................................ 30
Figure 15 – Hazard Identification Techniques (WorkSafe, 2011) ............................................... 40
Figure 16 – Causes of Incidents (Thrower, 2013) ...................................................................... 48
Figure 17 – Graph of Incident yearly frequency ......................................................................... 58
Figure 18 – Graph of Incident Distribution per Continent ........................................................... 59
Figure 19 – Element frequencies ............................................................................................... 60
Figure 20 – Element performance after implementation ............................................................ 62
Figure 21 – Interrelationship of characteristics (McCavit et al., 2013) ........................................ 63
Figure 22 – Element performance in 5 yearly intervals .............................................................. 66
Figure 23 – Mechanical Integrity Failures .................................................................................. 67
Figure 24 – DuPont’s Mechanical Integrity and Quality Assurance Model (Peon, 2008) ........... 68
Figure 25 – Controlling Human Factor Errors (Bridges & Tew, 2010) ........................................ 74
Figure 26 – Behavioural Model (EPSC, 2012) ........................................................................... 75
Figure 27 – Journey to PSM implementation (Den Bakker, 2012) ............................................. 77
Figure 28 – Essential PSM Elements (OECD, 2012) ................................................................. 78
Figure 29 – Shell’s PSM Overview (Den Bakker, 2012) ............................................................ 82
Figure 30 – Plant lifecycle and PSM Overview (Neely, 2013) .................................................... 84
Figure 31 – PSM element dependency ...................................................................................... 86
10
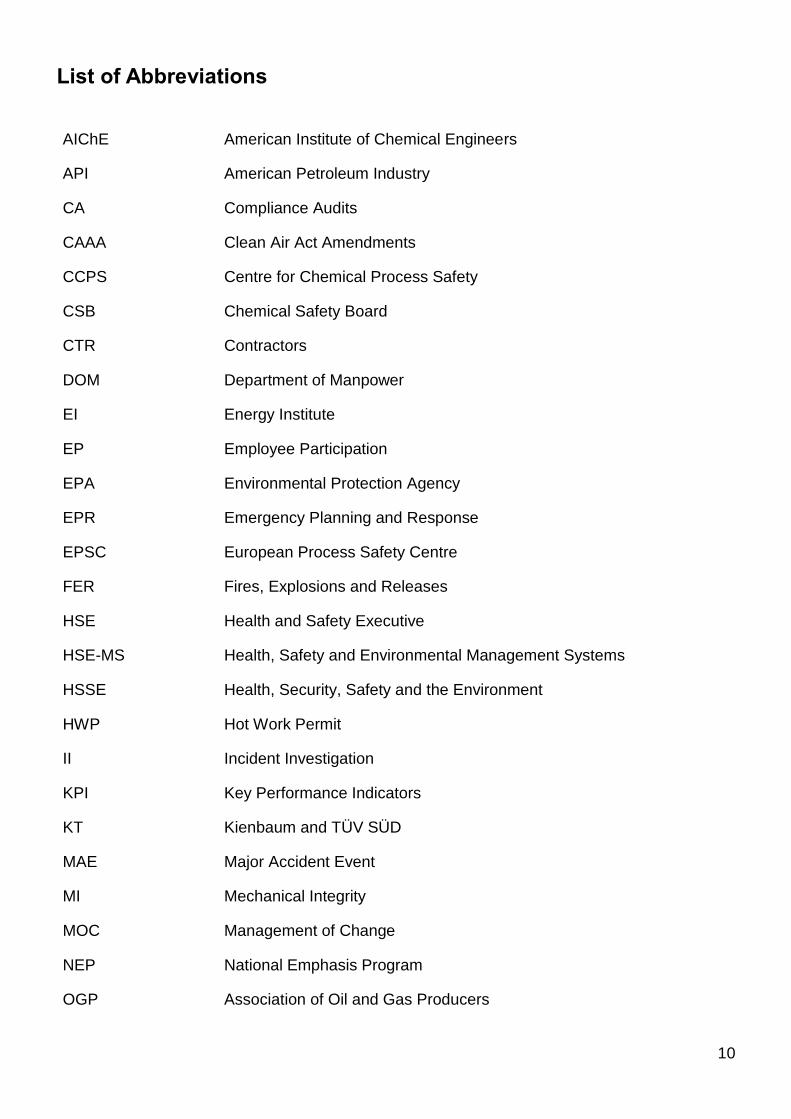
List of Abbreviations
AIChE American Institute of Chemical Engineers
API American Petroleum Industry
CA Compliance Audits
CAAA Clean Air Act Amendments
CCPS Centre for Chemical Process Safety
CSB Chemical Safety Board
CTR Contractors
DOM Department of Manpower
EI Energy Institute
EP Employee Participation
EPA Environmental Protection Agency
EPR Emergency Planning and Response
EPSC European Process Safety Centre
FER Fires, Explosions and Releases
HSE Health and Safety Executive
HSE-MS Health, Safety and Environmental Management Systems
HSSE Health, Security, Safety and the Environment
HWP Hot Work Permit
II Incident Investigation
KPI Key Performance Indicators
KT Kienbaum and TÜV SÜD
MAE Major Accident Event
MI Mechanical Integrity
MOC Management of Change
NEP National Emphasis Program
OGP Association of Oil and Gas Producers

11
OHS Occupational Health and Safety
OP Operating Procedures
OSHA Occupational Safety and Health Administration
PHA Process Hazard Analysis
PQV Program Quality Verification
PSI Process Safety Information
PSM Process Safety Management
PSSR Pre Start-up Safety Review
SHE Safety, Health and Environment
TR Training
TS Trade Secrets

12
Chapter 1: Introduction
1.1. Background
Several decades ago as early as the 1920s, in South Africa alone the Department of Manpower
(DOM) reported figures on injuries and fatalities. Further in the 1950s and 1960s as a result of
the industrial revolution on an international scale, a new generation of chemical plants were
commissioned (Hawksley, 1984). This promoted economic growth and created new job
opportunities.
Unfortunately this boom was largely concentrated on achieving significant economic gains
rather than safer operations. These newer plants were operated at higher pressures and
temperatures, with increased inventories of flammable or toxic chemicals. The consequence
was an increase in the occurrence of safety, health and environmental (SHE) incidents as
described by Hawksley (1984).
Figure 1 – Relationship between Process safety and occupational safety (ABB, 2013)
There are two main categories of safety incidents; namely process safety and occupational
safety incidents. The above diagram, Figure 1, depicts the relationship between these two types
of safety incidents. Occupational safety incidents consist of the more routine slips, trips and
falls. These incidents are considered to be low severity and high probability incidents (ABB,
2013). ABB (2013) described process safety incidents as high severity and low probability major
accidents resulting in fire, explosions and releases (FER). Therefore process safety incidents
commonly resulted with SHE consequences.

13
Both occupational and process safety is equally important, with each requiring its own approach
and management. Numerous good practices and guidance notes are available for occupational
safety. However, process safety had not always received the attention it deserved, therefore the
adoption of a new approach was necessitated (ABB, 2013).
Figure 2 – Major incidents in the last decades (Schouwenaars, 2008)
Figure 2 illustrates an overview of the diverse major accidents in refinery and chemical sites
across the world over the last thirty years. Taking Action on Risk (2012) further described some
of these pivotal process safety incidents. As a result of this devastating trend, Process Safety
Management (PSM) was conceived soon after the Bhopal incident. The American Institute of
Chemical Engineers (AIChE) was tasked with the challenge, to lead this collaborative effort to
eliminate catastrophic process incidents (AlChE, 2012).
Reviewing recent safety performance, the annual report published by the Health and Safety
Executive (HSE) for the period of 2010 to 2011, noted 175 work related fatalities and over
200,000 reportable injuries (HSE, 2011a). The Chemical Safety Board (CSB, 2012) also
described some of the more recent process safety incidents that occurred; an explosion in
Yeosu at a chemical plant which killed seven employees, a release of toxic chlorine gas in
Korea that hospitalized eleven employees and a fire in an underground mine in China that killed
eleven employees.

14
Thus despite the fact that over twenty years had passed since the conception of PSM, process
safety incidents, namely FERs, still remain very relevant in this industrial age.
1.2. Statement of the problem
A business’s success is dependent on low operational costs which can allude to increased profit
margins. These lower operational costs mostly manifested in managerial short-cuts, as
previously indicated by Hawksley (1984) and Schouwenaars (2008) with the major industrial
incidents. Therefore it was evident that this low perception of risk coupled with high risk
appetite, resulted in the mismanagement of highly hazardous processes. This led to the
occurrence of SHE incidents.
Consequently industry safety governance was promulgated mandating the implementation and
management of PSM programs to prevent SHE incidents (AlChE, 2012). Walt and Frank (2007:
1) stated that, “Unfortunately, serious incident and audits all too frequently point to gaps in PSM
implementation”. Non-conformances with respect to PSM element requirements resulted in
severe penalties as illustrated in Table 1.
Table 1 – Cost of Non-Compliance (IRC, 2006)
Violation Description Fine
Other-than-Serious
A violation directly related to job safety and health, but likely not to cause death or serious physical harm.
Up to $7,000 per violation
Serious A violation where there is substantial probability that death or serious physical harm and that the employer knew, or should have known, of the hazard.
Up to $7,000 per violation
Wilful A violation involves an employer intentionally and knowingly committing or a violation that the employer commits with plain indifference to the law. The employer either knows what they are doing constitutes a violation, or is aware that a hazardous condition existed and made no reasonable effort to eliminate it.
Up to $70,000 per violation, with a minimum of $5,000 per violation
Repeated A violation where OSHA finds a substantially similar violation during a re-inspection.
Up to $70,000 for each repeat
Failure to Abate Employer failing to correct a previously cited violation beyond the prescribed abatement date.
Up to $7,000 per day
In this new industrial era, business’s competitiveness and legislative compliance is respectively
becoming increasingly more rife and stringent as detailed by the HSE (2012) and OHS (2012).
This was confirmed by the Chemical Industries Association (2008: 2) who stated that, “The
threat of legal action for non-compliance is a very real inducement, but the threat of serious
injury or fatalities to staff, loss of production and income, damage to company’s reputation, the
15
potential for increased insurance premiums and the loss of valuable production assets are
equally good reasons even though they may not involve the law directly”.
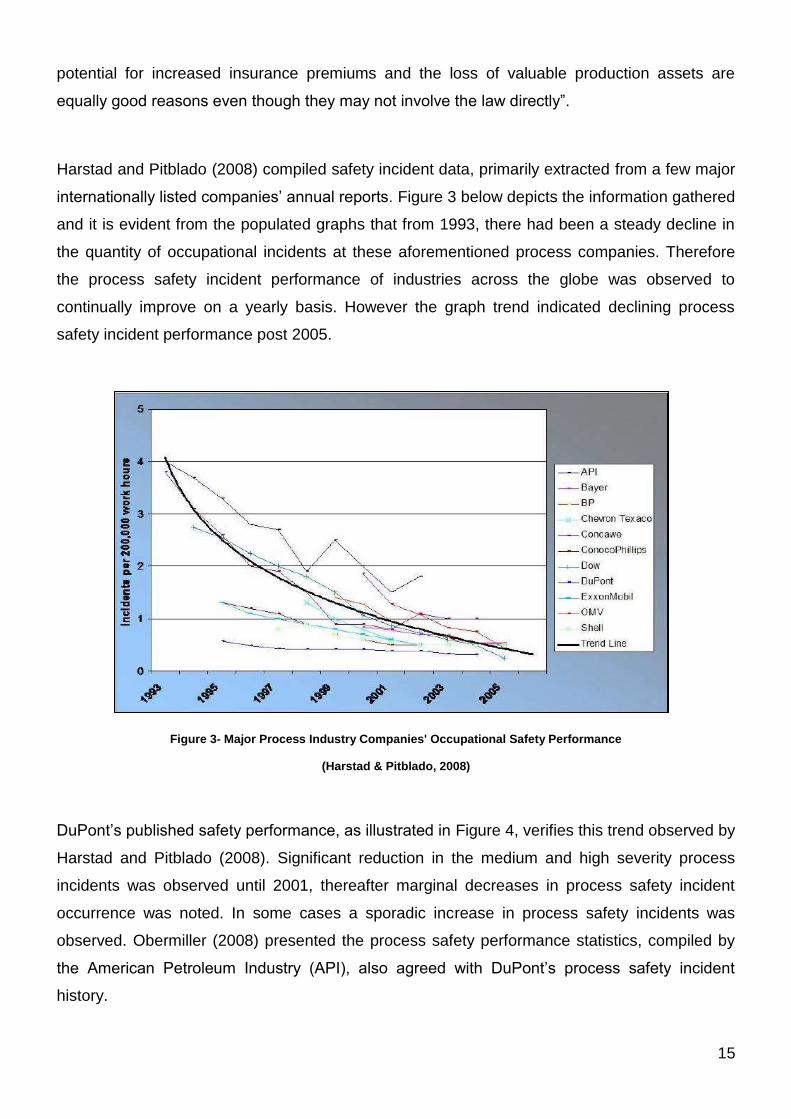
Harstad and Pitblado (2008) compiled safety incident data, primarily extracted from a few major
internationally listed companies’ annual reports. Figure 3 below depicts the information gathered
and it is evident from the populated graphs that from 1993, there had been a steady decline in
the quantity of occupational incidents at these aforementioned process companies. Therefore
the process safety incident performance of industries across the globe was observed to
continually improve on a yearly basis. However the graph trend indicated declining process
safety incident performance post 2005.
Figure 3- Major Process Industry Companies' Occupational Safety Performance
(Harstad & Pitblado, 2008)
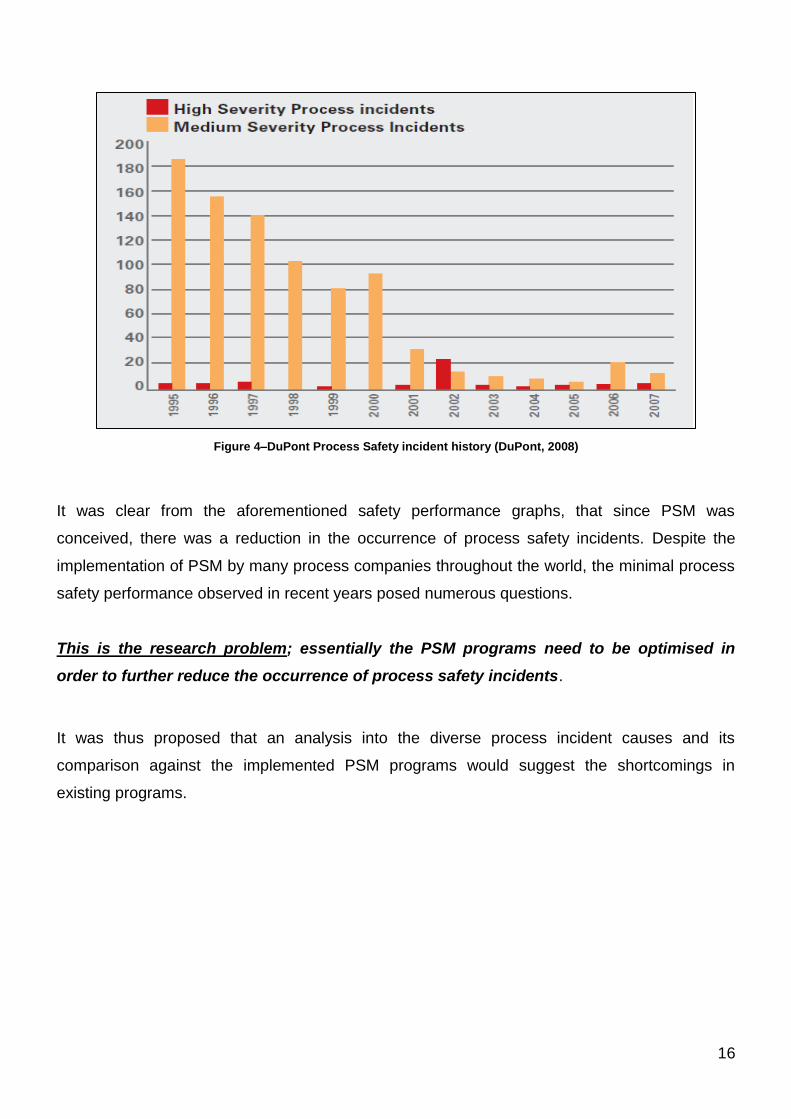
DuPont’s published safety performance, as illustrated in Figure 4, verifies this trend observed by
Harstad and Pitblado (2008). Significant reduction in the medium and high severity process
incidents was observed until 2001, thereafter marginal decreases in process safety incident
occurrence was noted. In some cases a sporadic increase in process safety incidents was
observed. Obermiller (2008) presented the process safety performance statistics, compiled by
the American Petroleum Industry (API), also agreed with DuPont’s process safety incident
history.
16
Figure 4–DuPont Process Safety incident history (DuPont, 2008)
It was clear from the aforementioned safety performance graphs, that since PSM was
conceived, there was a reduction in the occurrence of process safety incidents. Despite the
implementation of PSM by many process companies throughout the world, the minimal process
safety performance observed in recent years posed numerous questions.
This is the research problem; essentially the PSM programs need to be optimised in
order to further reduce the occurrence of process safety incidents.
It was thus proposed that an analysis into the diverse process incident causes and its
comparison against the implemented PSM programs would suggest the shortcomings in
existing programs.

17
1.3. Aims of the study
The aim of the study was to determine the most effective approach to implement and sustain
PSM in an organisation, to prevent and manage the occurrence of major industrial
catastrophes.
1.4. Objectives
The following research objectives were set for the study:
To determine the PSM elements that significantly contributed to the occurrence of
process safety incidents;
To identify the PSM elements’ failures that resulted in process safety incidents;
To identify any relationships between the PSM elements in order to improve
implementation effectiveness; and
To perform case study analysis on three international companies’ approach to PSM.
1.5. Outline of the Study
It was imperative to identify the gaps in the existing PSM programs in order to propose an
effective PSM program. A semi-qualitative study was conducted through the employment of a
survey questionnaire and published incident investigation reports. This study consisted of five
chapters which are described below.
Chapter 1 introduces the reader to the background of PSM and its associated global
performance in curbing process safety incidents. The research problem is also presented, along
with the study’s aim and objectives.
Chapter 2 deliberates over the different PSM models and its associated transformation over the
years. These PSM models are also compared to the Occupational Safety and Health
Administration (OSHA) PSM model, to assess their merits. Literature is consulted and
summarised for the purpose of the study arguments. The investigated companies’ profiles and
their operational processes are discussed.

18
Chapter 3 discusses the methodology applied to gather the PSM incident causes and to identify
the associated element failures.
The findings are presented and interpreted in Chapter 4. Literature is cited to confirm or
contradict the findings raised.
The accomplishments with respect to the prescribed aims and objectives are concluded in
Chapter 5. Further study recommendations are also stated. These recommendations are
postulated to uplift the merits of this study alluding to more defined findings.

19
Chapter 2: Literature Survey
2.1. Introduction
The approach to the literature survey encompassed the identification and reviewing of works by
acknowledged authorities on PSM and its associated programs. Numerous sources of literature
was identified, however limited scholarly articles was surveyed.
The definition of PSM was investigated, as well as several implemented PSM programs
throughout the world. This was conducted to understand the origins of the PSM programs and
its associated transformation through the decades. These PSM programs were compared and
further analysed to gauge their approach.
The implementation of PSM in three global chemical processing companies was studied. This
was undertaken to determine the effectiveness of their respective implementations. Therefore
the literature survey entailed the understanding of these companies’ profiles and scale of
operations.
2.2. Definition of PSM
There were numerous descriptions of PSM, PSM incidents and as to what a PSM program
entailed. Many similarities in these definitions and underlying principles were observed as
illustrated by the following examples.
DuPont (2008: 1), a global leader in PSM implementation and compliance, stated that, “Process
Safety Management (PSM) is the application of programs, procedures, audits and evaluations
to a manufacturing or industrial process to identify understand and control process hazard risks,
creating systematic business improvements and safety standards”.
The United States Chemical Manufacturers’ Association (CMA, 1985) indicated that, “process
safety is the control of hazards which are caused by maloperation or malfunction of the

20
processes used to convert raw materials into finished products, which may lead to the
unplanned release of hazardous material”.
Shimada et al. (2009: 1) defined PSM as, “Process safety management (PSM) is a
management system that is focused on prevention of, preparedness for, mitigation of, response
to, and restoration from catastrophic releases of chemicals or energy from a process associated
with a facility”.
Kelly (2010: 2) described PSM as, “Process Safety Management is a comprehensive framework
of activities for managing the integrity of a hazardous (chemical) operation. Its goal is to
eliminate (prevent and mitigate) loss of containment incidents. Loss of containment events can
lead to fire, explosion or toxic effects and may result in large numbers of casualties”.
Kraus (2011) defined PSM as, “Whenever there are processes that employ temperature and
pressure to change the molecular structure or create new products from chemicals, the
possibility exists for fires, explosions or releases of flammable or toxic liquids, vapours, gases or
process chemicals. The control of these undesired events requires a special science called
process safety management. The terms process safety and process safety management are
most commonly used to describe the protection of employees, the public and the environment
from the consequences of undesirable major incidents involving flammable liquids and highly
hazardous materials”.
“The proactive and systematic identification, evaluation, and mitigation or prevention of
chemical releases that could occur as a result of failures in process, procedures, or equipment”,
as stated by Toups (2003: 11).
There were common points in the PSM descriptions as follows:
Maintaining the integrity of process equipment;
Compilation and institutionalisation of safe operating procedures; and
Identification of process risks and its respective prevention and mitigation.
21
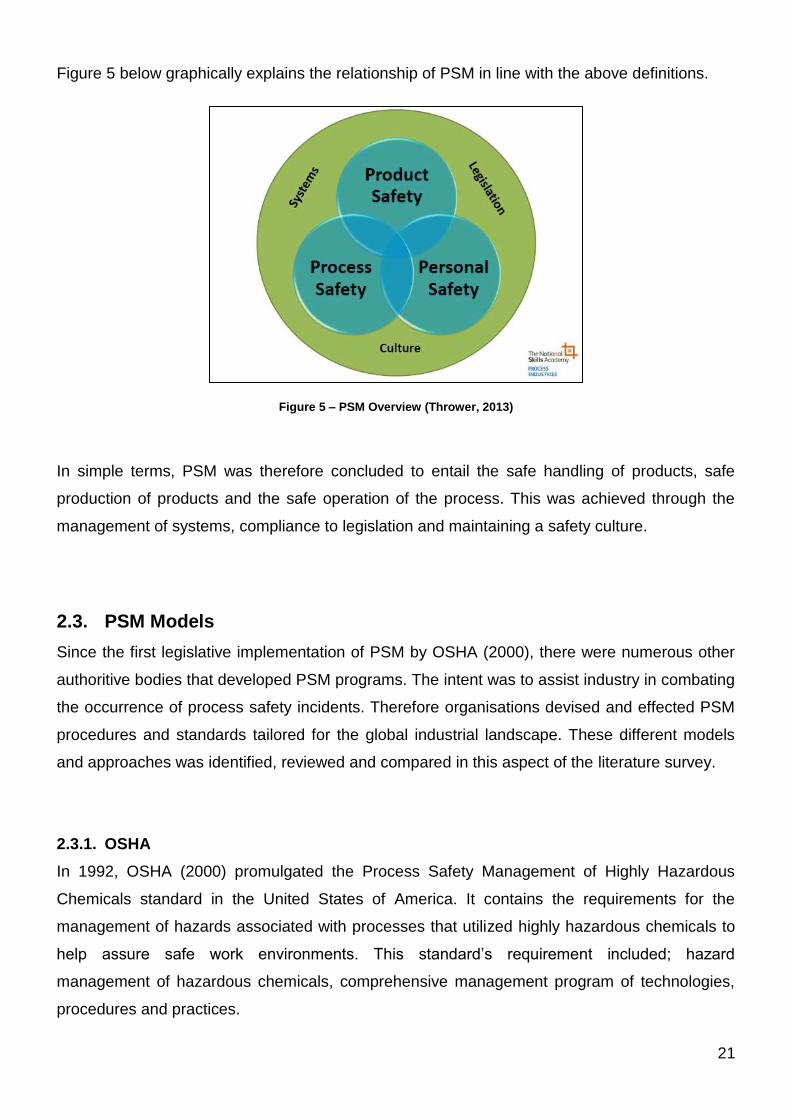
Figure 5 below graphically explains the relationship of PSM in line with the above definitions.
Figure 5 – PSM Overview (Thrower, 2013)
In simple terms, PSM was therefore concluded to entail the safe handling of products, safe
production of products and the safe operation of the process. This was achieved through the
management of systems, compliance to legislation and maintaining a safety culture.
2.3. PSM Models
Since the first legislative implementation of PSM by OSHA (2000), there were numerous other
authoritive bodies that developed PSM programs. The intent was to assist industry in combating
the occurrence of process safety incidents. Therefore organisations devised and effected PSM
procedures and standards tailored for the global industrial landscape. These different models
and approaches was identified, reviewed and compared in this aspect of the literature survey.
2.3.1. OSHA
In 1992, OSHA (2000) promulgated the Process Safety Management of Highly Hazardous
Chemicals standard in the United States of America. It contains the requirements for the
management of hazards associated with processes that utilized highly hazardous chemicals to
help assure safe work environments. This standard’s requirement included; hazard
management of hazardous chemicals, comprehensive management program of technologies,
procedures and practices.

22
There are fourteen elements apart of this PSM model, which covered diverse aspects, with
respect to the management of an operational facility and process environment as illustrated in
Figure 6. It involves (OSHA, 2000) the management and training of employees and service
providers, conducting safety risk assessments, management of work and modifications
conducted in the operational areas, maintenance of the plant equipment and incident
management.
Figure 6 – OSHA Model (OSHA, 2012)
2.3.2. DuPont
DuPont (2008) pioneered the concepts and implementation of a PSM system in the 1960s. For
over two hundred years, rigorous management of risk and process safety was at the foundation
of their operating culture. By the late 1980s, OSHA and Environmental Protection Agency (EPA)
recognised the benefits of the DuPont system and procured their services to develop the PSM
regulations that currently govern industry (DuPont, 2008). DuPont consists of 175 operations in
70 countries (DuPont, 2008).
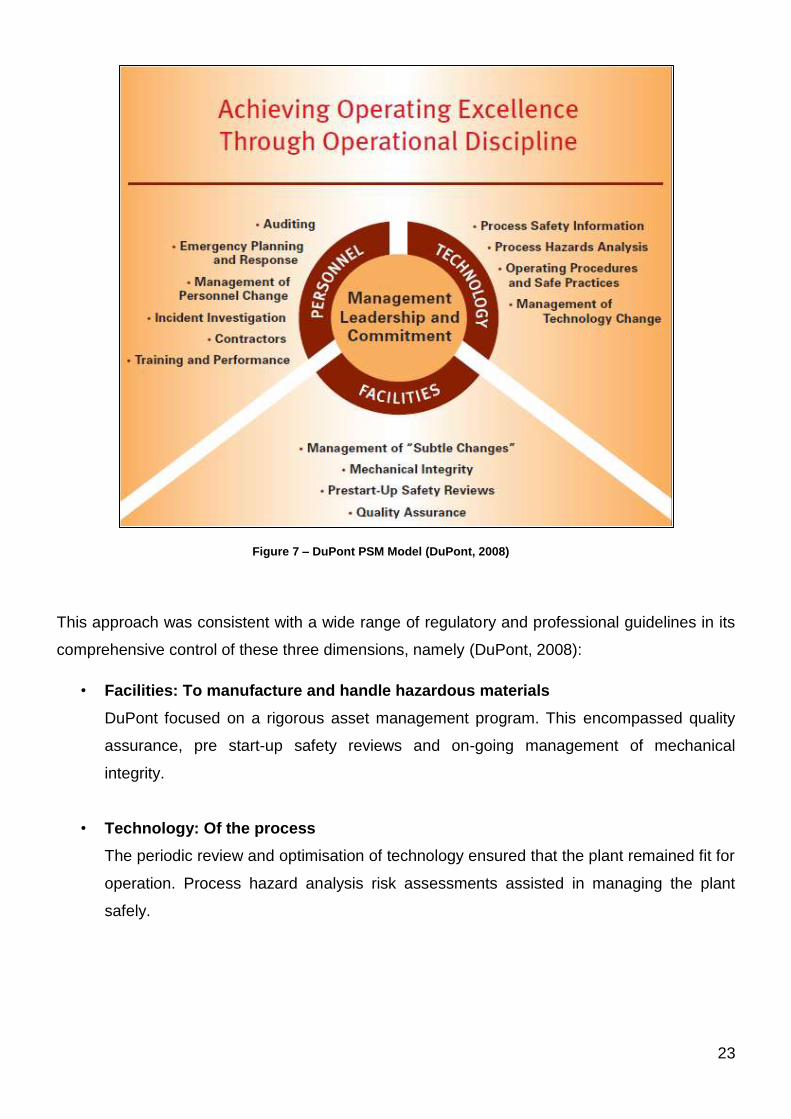
The DuPont PSM model is illustrated in Figure 7. At the cornerstone of this model, were the
three fundamental aspects, namely; management, leadership and commitment. It is further
segregated into three broad dimensions, consisting of their respective fourteen sub-elements
reminiscent of the OSHA model.
23
Figure 7 – DuPont PSM Model (DuPont, 2008)
This approach was consistent with a wide range of regulatory and professional guidelines in its
comprehensive control of these three dimensions, namely (DuPont, 2008):
• Facilities: To manufacture and handle hazardous materials
DuPont focused on a rigorous asset management program. This encompassed quality
assurance, pre start-up safety reviews and on-going management of mechanical
integrity.
• Technology: Of the process
The periodic review and optimisation of technology ensured that the plant remained fit for
operation. Process hazard analysis risk assessments assisted in managing the plant
safely.

24
• Personnel: Who operate, maintain, and support the process.
The level of personnel competence and experience was vital as the human element was
interwoven through all the elements of PSM. Training of employees and compliance to
developed operating procedures was necessary to assure safe operation of equipment.
It is evident that DuPont’s PSM model closely resembled the OSHA model. The similarity of this
model to the OSHA model can be attributed to the fact that DuPont assisted OSHA in
developing its PSM model (DuPont, 2008).
2.3.3. SEMS
After the 2010 BP oil spillage tragedy, also known as the Deepwater Horizon, a review of safety
management systems was undertaken. The outcome was the formulation of regulatory
requirements in the form of a Safety & Environmental Management System (SEMS) for offshore
facilities. Although SEMS was developed for off-shore application, the insights could be applied
to onshore facilities.
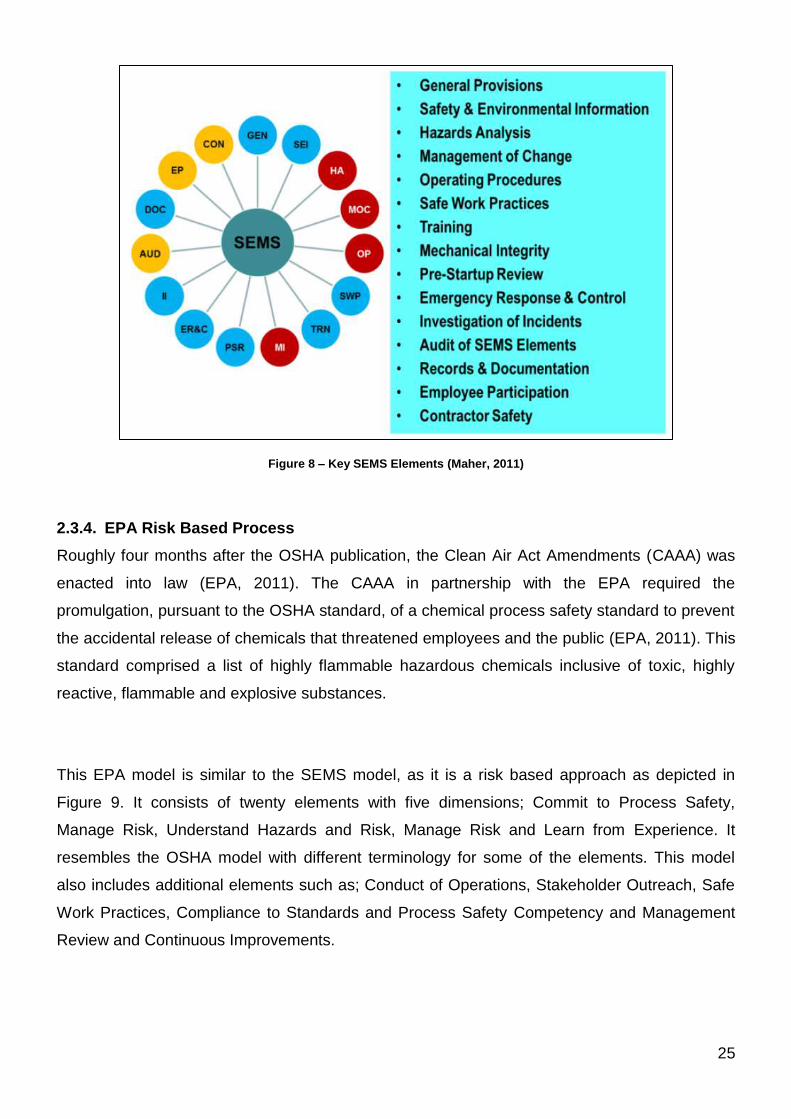
There are fifteen elements in SEMS as depicted in Figure 8. This model also closely resembles
the OSHA PSM model with the inclusion of the following elements; general provisions, records
and documentation and safe work practices.
The Safe Work Practices and the Operating Procedure elements were deemed to respectively
address the occupational task risks and the safe operation of the facility. The Records and
Documentation, Safety and Environment Information and General Provisions were considered
to fall under the OSHA Process Safety Information (PSI) element.
25
Figure 8 – Key SEMS Elements (Maher, 2011)
2.3.4. EPA Risk Based Process
Roughly four months after the OSHA publication, the Clean Air Act Amendments (CAAA) was
enacted into law (EPA, 2011). The CAAA in partnership with the EPA required the
promulgation, pursuant to the OSHA standard, of a chemical process safety standard to prevent
the accidental release of chemicals that threatened employees and the public (EPA, 2011). This
standard comprised a list of highly flammable hazardous chemicals inclusive of toxic, highly
reactive, flammable and explosive substances.
This EPA model is similar to the SEMS model, as it is a risk based approach as depicted in
Figure 9. It consists of twenty elements with five dimensions; Commit to Process Safety,
Manage Risk, Understand Hazards and Risk, Manage Risk and Learn from Experience. It
resembles the OSHA model with different terminology for some of the elements. This model
also includes additional elements such as; Conduct of Operations, Stakeholder Outreach, Safe
Work Practices, Compliance to Standards and Process Safety Competency and Management
Review and Continuous Improvements.

26
Figure 9 – Risk Based PSM Framework (Bradshaw, 2012)
The additional elements were considered to focus on the compliance to procedures, training
and competency of the facility employee. This alluded to the emphasis placed on the human
involvement in PSM. This was strengthened through the Workforce Involvement, Stakeholder
Outreach, Conduct of Operations and Contractor Management elements. Compliance and
effectiveness of operations was ascertained through audits of standards and general audits.
2.3.5. CCPS
The chemical industry tasked AIChE leadership to commence and lead a collaborative effort to
eliminate catastrophic process incidents. This undertaking incorporated the following objectives
as described by AIChE (2012); to achieve the advancement of technology, management
practices, serving as the foremost resource for information on process safety, support process
safety in engineering and promoting process safety.
In 1985 the Centre for Chemical Process Safety (CCPS) was formed under the supervision of
AIChE (2012). The CCPS published more than a dozen process safety guideline books and
procedures within the first five years of inception (AlChE, 2012). Seventeen charter member
companies and several other companies adopted and committed to the CCPS approaches to
govern their processes.
27
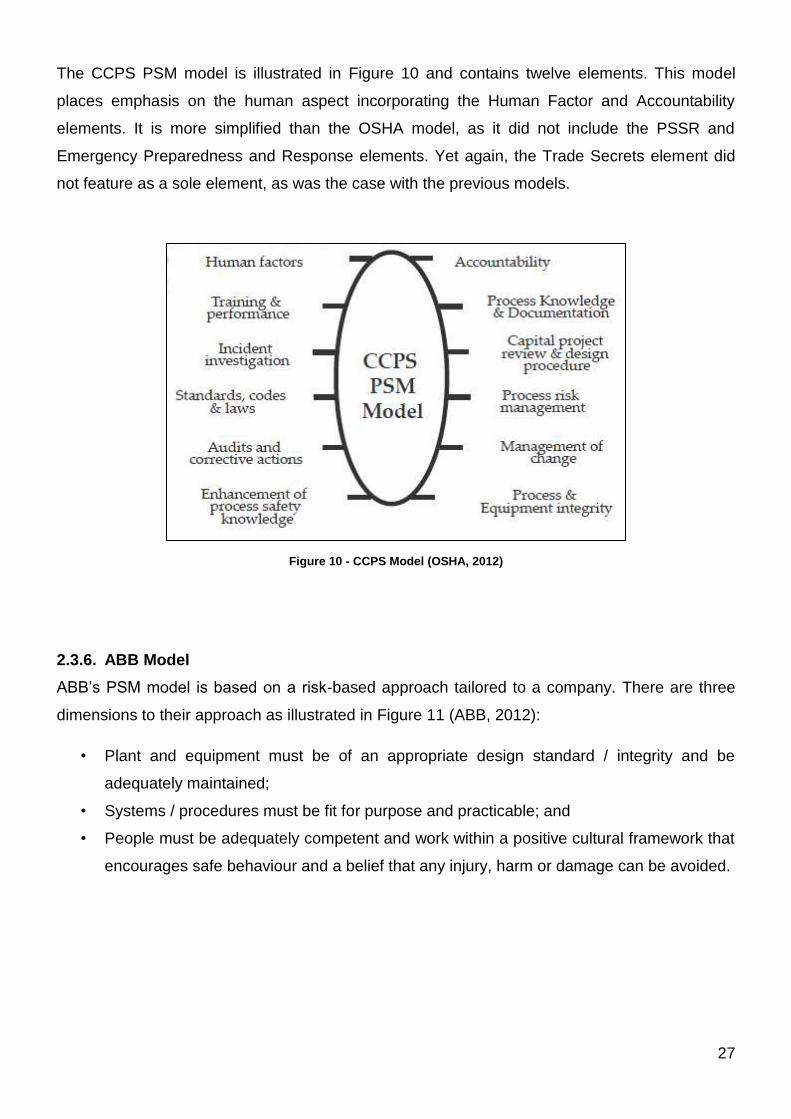
The CCPS PSM model is illustrated in Figure 10 and contains twelve elements. This model
places emphasis on the human aspect incorporating the Human Factor and Accountability
elements. It is more simplified than the OSHA model, as it did not include the PSSR and
Emergency Preparedness and Response elements. Yet again, the Trade Secrets element did
not feature as a sole element, as was the case with the previous models.
Figure 10 - CCPS Model (OSHA, 2012)
2.3.6. ABB Model
ABB’s PSM model is based on a risk-based approach tailored to a company. There are three
dimensions to their approach as illustrated in Figure 11 (ABB, 2012):
• Plant and equipment must be of an appropriate design standard / integrity and be
adequately maintained;
• Systems / procedures must be fit for purpose and practicable; and
• People must be adequately competent and work within a positive cultural framework that
encourages safe behaviour and a belief that any injury, harm or damage can be avoided.

28
Figure 11 – ABB Approach (ABB, 2012)
Sustainable risk reductions are the foundations of this approach as depicted in Figure 12. This
model is very different to the OSHA model and focuses more on a few OSHA PSM elements.
These elements include the Process Hazard Analysis (PHA), Process Safety Information (PSI),
Management of Change (MOC) and Mechanical Integrity (MI) elements. Recalling DuPont’s
model, ABB’s model resembled this segregation approach into three dimensions. Both ABB and
DuPont provided consultancy and compliance services, therefore their model resemblances
were attributed to their comprehensive knowledge of PSM implementation and effectiveness in
industry.
Figure 12 – ABB Approach (ABB, 2012)
Plant & Equipment Design Integrity
Systems/ Procedures
Fit for Purpose
People Competence
Culture

29
2.3.7. Kienbaum and TÜV SÜD
Kienbaum and TÜV SÜD (KT) developed a Process Safety Excellence model as depicted in
Figure 13. It consists of two legs, namely; Asset Safety Integrity and Process Safety
Management. Again, this segregation into dimensions resembled the DuPont and ABB models.
KT indicated that Process Safety Excellence assisted in the management of risks (Kienbaum &
SÜD, 2013)
Figure 13–KT PSM Model (Kienbaum & SÜD, 2013)
Therefore this approach is similar to the ABB and SEMS models as it is also a risk based
approach. Asset Safety Integrity entailed the safe operation, management and maintenance of
the facility equipment. The PSM aspect is concerned with the management, skills, compliance
and performance of the human involvement.
Essentially, KT had divided the OSHA PSM model and combined these elements, to form their
new model which contained six elements. Each of these six elements contained another five
sub-elements, which summated to thirty sub-elements as illustrated in Figure 14. This model is
considered to encompass the most comprehensive list of elements from all the surveyed PSM
models. However the intricacy of this model may result in its ineffective implementation in
industry.

30
Figure 14–KT PSM Model (Kienbaum & SÜD, 2013)
2.3.8. Oil and Gas
The International Association of Oil and Gas Producers (OGP) is a global forum, tasked with
identifying and sharing industrial best practices to ultimately operate safer. OGP (2013) was
formed in 1974, to develop effective communications between the international regulators and
upstream industry. OGP (2013) is composed of the world’s leading industry associations,
private, publicly traded and state owned oil and gas companies. The management committee is
represented by BP PLC, Chevron Corporation, Exxon Mobil, ConocoPhilips, PetróleoBrasileiro
SA, Shell International Exploration & Production BV, Statoil, Total and Schlumberger (OGP,
2013). The Managing Major Incident Risk Task Force of OGP (2013) published asset integrity
guidance, to assist organisations to reduce major incident risks. It focuses on asset integrity
management on both new and existing assets at every lifecycle stage.
OGP (2008: 3) defined asset integrity as, “…an outcome of good design, construction and
operating practices. It is achieved when fatalities are structurally and mechanically sound and
perform the processes and produce the products for which they were designed’’. Therefore
OGP’s (2008) approach over the past two decades consisted of the development and
31
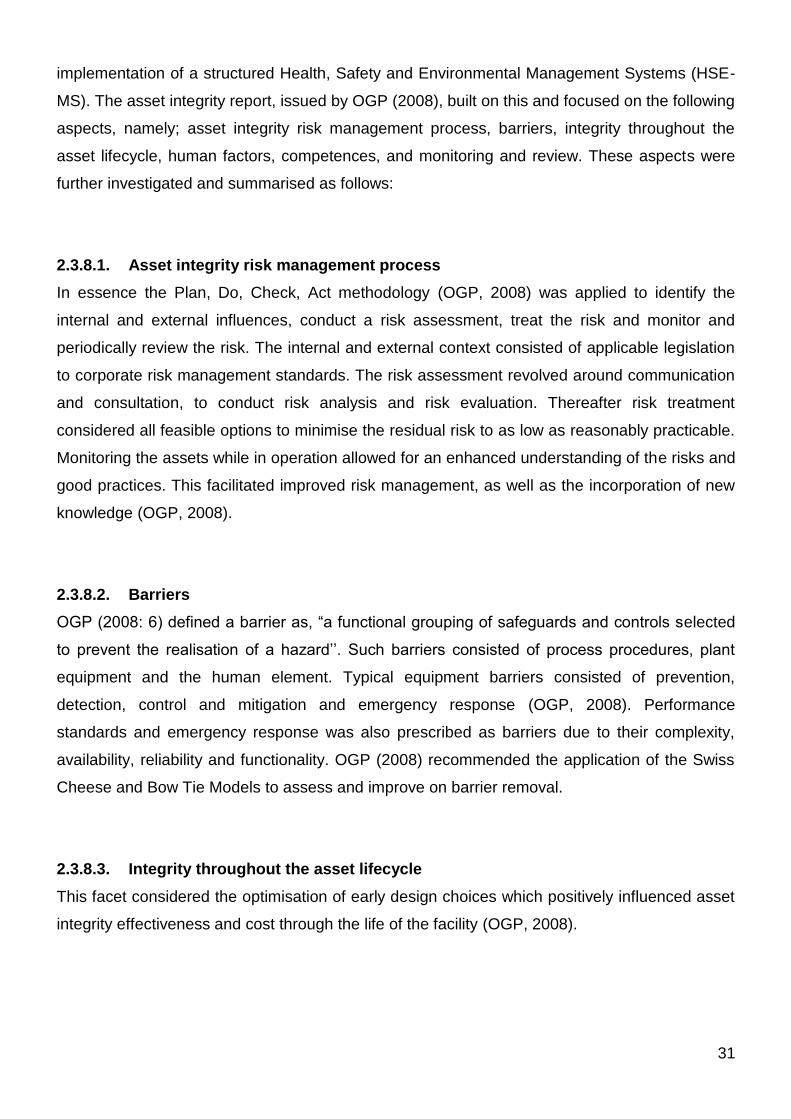
implementation of a structured Health, Safety and Environmental Management Systems (HSE-
MS). The asset integrity report, issued by OGP (2008), built on this and focused on the following
aspects, namely; asset integrity risk management process, barriers, integrity throughout the
asset lifecycle, human factors, competences, and monitoring and review. These aspects were
further investigated and summarised as follows:
2.3.8.1. Asset integrity risk management process
In essence the Plan, Do, Check, Act methodology (OGP, 2008) was applied to identify the
internal and external influences, conduct a risk assessment, treat the risk and monitor and
periodically review the risk. The internal and external context consisted of applicable legislation
to corporate risk management standards. The risk assessment revolved around communication
and consultation, to conduct risk analysis and risk evaluation. Thereafter risk treatment
considered all feasible options to minimise the residual risk to as low as reasonably practicable.
Monitoring the assets while in operation allowed for an enhanced understanding of the risks and
good practices. This facilitated improved risk management, as well as the incorporation of new
knowledge (OGP, 2008).
2.3.8.2. Barriers
OGP (2008: 6) defined a barrier as, “a functional grouping of safeguards and controls selected
to prevent the realisation of a hazard’’. Such barriers consisted of process procedures, plant
equipment and the human element. Typical equipment barriers consisted of prevention,
detection, control and mitigation and emergency response (OGP, 2008). Performance
standards and emergency response was also prescribed as barriers due to their complexity,
availability, reliability and functionality. OGP (2008) recommended the application of the Swiss
Cheese and Bow Tie Models to assess and improve on barrier removal.
2.3.8.3. Integrity throughout the asset lifecycle
This facet considered the optimisation of early design choices which positively influenced asset
integrity effectiveness and cost through the life of the facility (OGP, 2008).

32
Therefore this model resembled the KT model’s two legged segregation, with the addition of the
Barrier element to individually address risk management. The asset lifecycle element strongly
involved the human aspect. This was a recurring theme in many of the PSM models.
2.3.9. Energy Institute
The Energy Institute (EI) is the leading chartered professional membership across the energy
industry for both individuals and organisations. Its membership includes over 13,500 individuals
and 300 companies in 100 countries (EI, 2010). As a Royal Charter organisation it focuses
predominantly on promoting safe and environmentally responsible and efficient supply and use
of energy in all applications and forms (EI, 2010).
The EI Process Safety Committee compiled a high level framework for PSM across the energy
industry sectors. EI considered this as a simple and systematic approach applicable to both
small and large energy sectors (EI, 2010). This approach highlighted key aspects in order to
assure integrity of operations inclusive of maintenance, technical, operational and
organisational and human factors. This framework consisted of three dimensions, namely PSM
Focus Areas, PSM Elements and PSM Expectations. Each level was further explored and
interpreted as follows (EI, 2010):
2.3.9.1. PSM Focus Areas
This set out the imperative high level components of the PSM framework. These focus areas
were composed of the following (EI, 2010):
2.3.9.1.1. Process Safety Leadership
This area described how an organisation should define, communicate and
implement the level of performance necessitated.
2.3.9.1.2. Risk Identification and Assessment
This area addressed how an organisation should identify and assess the risks to
assure integrity of operations.

33
2.3.9.1.3. Risk Management
This area defined how an organisation should implement and manage the control
measures identified in the previous focus area.
2.3.9.1.4. Review and Improvement
This focus area described how the organisation should measure, review and
improve from compliance assessment on the EI framework.
2.3.9.2. PSM Elements and Expectations
Within each focus area were a variety of elements, which further divulged into the requirements
to assure its integrity. These elements prescribed the expectations of the organisation and
compliance thereof. EI (2012) described twenty elements inclusive of expectations which were
incorporated into the focus areas.
Although this model contained elements from the OSHA model, it closely resembled the KT and
EPA Risk Based models in terms of element comprehensiveness and intricacy. It further agreed
with DuPont’s cornerstone dimensions in terms of its PSM focus areas.
To recap, since its inception the OSHA PSM model had evolved over the years, through the
various new PSM models. This was attributed to the diverse incidents that shook the process
safety arena. In summary, several strong themes were observed to emerge from these PSM
models. These themes were described as follows:
Constant maintenance and inspections to assure asset integrity;
Workforce involvement entailed establishing the correct safety culture to eliminate human
factor errors;
Continuous population of comprehensive process safety information and its incorporation
into operation procedures and risk analysis;
Strong leadership with commitment to safety; and
Rigorous identification and risk analysis. Thereafter the compilation, implementation and
monitoring of preventative and mitigating control measures.

34
2.4. Comparison to OSHA Elements
As deliberated, the OSHA PSM model paved the road for the development of further PSM
models. In this part of the literature survey, these PSM models were further investigated to
determine their approach in relation to each OSHA PSM element. Before comparative studies
were undertaken, the OSHA PSM model was thoroughly reviewed and summarised.
The CAAA required OSHA’s process safety standard to govern the processing of highly
hazardous chemicals, inclusive of; toxic, flammable, highly reactive and explosive substances.
Further CAAA specified fourteen minimum fundamentals to be included in the OSHA standard
which was described as follows (OSHA, 2012):
(1) Develop and maintain written safety information identifying workplace chemical and process
hazards, equipment used in the processes, and technology used in the processes;
(2) Perform a workplace hazard assessment, including, as appropriate, identification of potential
sources of accidental releases, identification of any previous release within the facility that had a
potential for catastrophic consequences in the workplace, estimation of workplace effects of a
range of releases, and estimation of the health and safety effects of such a range on
employees;
(3) Consult with employees and their representatives on the development and conduct of
hazard assessments and the development of chemical accident prevention plans and provide
access to these and other records required under the standard;
(4) Establish a system to respond to the workplace hazard assessment findings, which shall
address prevention, mitigation, and emergency responses;
(5) Periodically review the workplace hazard assessment and response system;
(6) Develop and implement written operating procedures for the chemical processes, including
procedures for each operating phase, operating limitations, and safety and health
considerations;
(7) Provide written safety and operating information for employees and employee training in
operating procedures, by emphasizing hazards and safe practices that must be developed and
made available;

35
(8) Ensure contractors and contract employees are provided with appropriate information and
training;
(9) Train and educate employees and contractors in emergency response procedures in a
manner as comprehensive and effective as that required by the regulations promulgated;
(10) Establish a quality assurance program to ensure that initial process-related equipment,
maintenance materials, and spare parts are fabricated and installed consistent with design
specifications;
(11) Establish maintenance systems for critical process-related equipment, including written
procedures, employee training, appropriate inspections, and testing of such equipment to
ensure on-going mechanical integrity;
(12) Conduct pre-start-up safety reviews of all newly installed or modified equipment;
(13) Establish and implement written procedures managing change to process chemicals,
technology, equipment and facilities; and
(14) Investigate every incident that resulted in or could have resulted in a major accident in the
workplace, with any findings to be reviewed by operating personnel and modifications made, if
appropriate.
These guidelines were a collection of diverse practices that culminated toward PSM
institutionalization. This minimum specification was incorporated into the PSM standard by
deriving their respective element. Table 2 summarises these OSHA PSM elements with their
associated prescriptions (OSHA, 2000):

36
Table 2 – Overview of the OSHA Elements (OSHA, 2012)
Element Requirement
Employee Participation
(EP)
Required employee involvement in developing and
executing a PSM program, particularly in the area of hazard
evaluation.
Process Safety
Information (PSI)
Required the employer to compile information related to the
nature of the chemical (or flammable) hazards involved,
process technology, and process equipment.
Process Hazard Analysis
(PHA)
Required the employer to conduct a careful analysis of
hazards involved with the process. Using one of several
formal hazard analysis techniques, a team identified,
evaluated, and recommended measures to eliminate,
mitigate, or control hazards.
Operating Procedures
(OP)
Required the employer to develop and implement written
operating procedures for the covered process over all
phases of its operation including safe work practices.
Training (TR)
Required employers to train all involved (including
contractors) in operating the covered process on the
hazards, operating procedures (normal & emergency), and
safe work practices. The training was required for each
person before they begin operating a covered process.
Contractors (CTR)
For all contractors involved directly and in areas adjacent to
covered processes, the employers need to evaluate the
contractor’s capabilities and safety history to assess their
suitability for safe performance. In addition, all contractors
expected to become involved in operating the covered
process must receive training prior to their involvement in
the operation.
Pre Start-up Safety
Review (PSSR)
Required that employers perform a detailed review of a new
or modified (changed) system to insure the design is
appropriate, construction adhered to design specifications,
operating procedures was available, training was complete,
process hazard analysis was completed, and all process
safety information was current
Mechanical Integrity (MI)
Required that employers develop and implement a
methodical program for performing appropriate maintenance
and equipment inspection/testing at proper frequencies to
uncover equipment deficiencies before they fail.

37
Table 2 – Overview of the OSHA Elements (OSHA, 2012) (Continued)
Element Requirement
Hot Work Permit (HWP)
Required that employers develop a formal program to
prevent fire and explosions from occurring while conducting
hot work (welding, cutting, brazing, grinding, etc.) in and
around the covered process.
Management of Change
(MOC)
Institute documented procedures aimed at insuring safe
system operation as changes to the system occurred. The
management of change process guided updates or
development to process safety information, process hazard
analyses, operating procedures, and training to insure all
elements of the PSM program are current.
Incident Investigation (II)
Required that employers investigated actual incidents or
near-misses to understand the factors that contributed to the
incident and to develop/resolve recommendations aimed at
preventing their future occurrence. A formal incident
investigation needed to begin with 48 hours of an incident.
Emergency Planning and
Response (EPR)
Required that employers conducted pre-planning for
emergencies that may arise at the facility. At a minimum, the
emergency planning needed to include notification
procedures, escape routes, alarm systems and plant-wide
training. More intensive efforts were required for situations
where employees are expected to actively become involved
in mitigating incidents.
Compliance Audits (CA)
Involved critically evaluating a PSM program and the extent
of its implementation at least every three years. The audit
must certify the plant was in compliance with the standard or
identify areas of non-compliance that the plant needed to
address to bring the program back into compliance.
Trade Secrets (TS) This allowed employers to protect those aspects of their
covered process considered a trade secret.
The above OSHA elements were used as the baseline PSM elements in terms of comparative
studies. This was due to the fact that OSHA formalised and promulgated the first PSM system.
Only the OGP and EI models were considered to be unique and acknowledged approaches.
Therefore the following analysis described the differences between the OGP and EI PSM
models against the OSHA PSM model. A summary of the expectations of each element was
described.
38
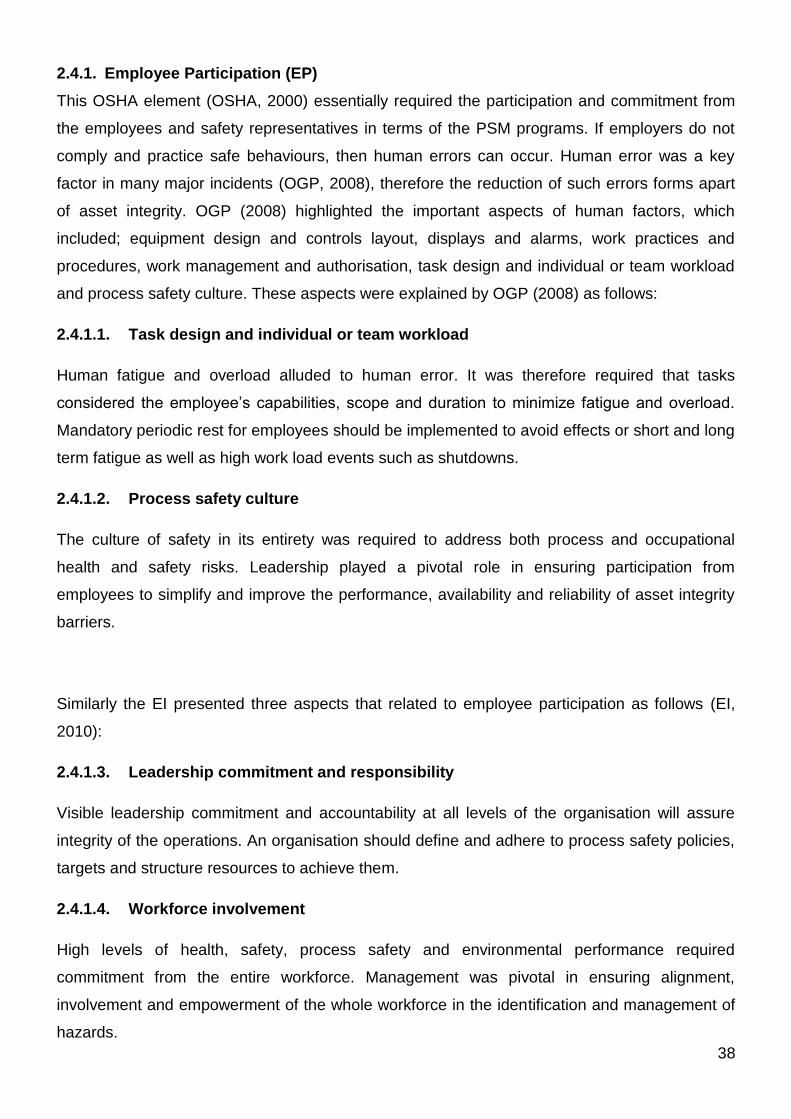
2.4.1. Employee Participation (EP)
This OSHA element (OSHA, 2000) essentially required the participation and commitment from
the employees and safety representatives in terms of the PSM programs. If employers do not
comply and practice safe behaviours, then human errors can occur. Human error was a key
factor in many major incidents (OGP, 2008), therefore the reduction of such errors forms apart
of asset integrity. OGP (2008) highlighted the important aspects of human factors, which
included; equipment design and controls layout, displays and alarms, work practices and
procedures, work management and authorisation, task design and individual or team workload
and process safety culture. These aspects were explained by OGP (2008) as follows:
2.4.1.1. Task design and individual or team workload
Human fatigue and overload alluded to human error. It was therefore required that tasks
considered the employee’s capabilities, scope and duration to minimize fatigue and overload.
Mandatory periodic rest for employees should be implemented to avoid effects or short and long
term fatigue as well as high work load events such as shutdowns.
2.4.1.2. Process safety culture
The culture of safety in its entirety was required to address both process and occupational
health and safety risks. Leadership played a pivotal role in ensuring participation from
employees to simplify and improve the performance, availability and reliability of asset integrity
barriers.
Similarly the EI presented three aspects that related to employee participation as follows (EI,
2010):
2.4.1.3. Leadership commitment and responsibility
Visible leadership commitment and accountability at all levels of the organisation will assure
integrity of the operations. An organisation should define and adhere to process safety policies,
targets and structure resources to achieve them.
2.4.1.4. Workforce involvement
High levels of health, safety, process safety and environmental performance required
commitment from the entire workforce. Management was pivotal in ensuring alignment,
involvement and empowerment of the whole workforce in the identification and management of
hazards.

39
2.4.1.5. Process and operational status monitoring and handover
Comprehensive process and operational monitoring should be conducted, along with effective
handover between working groups. This ensured safe operational continuity.
Therefore two common themes emerged from OGP and EI, namely; leadership commitment
and safety culture. Table 3 summarises the EP requirements as described by EPA (1999):
Table 3 – EP Requirements (EPA, 1999)
2.4.2. Process Safety Information (PSI)
PSI considered the process and equipment specifications to manage the plant in terms of
maintenance and operability as follows (OSHA, 2000):
2.4.2.1. Process Chemical Hazards
The plant required a comprehensive acquisition of all the raw, intermediate and final materials,
chemicals and products safety data sheets involved in the process.
2.4.2.2. Process Technology
The operability and process parameters needed to be well documented. This further included
the safety operational limits, process schematics and troubleshooting procedures.
2.4.2.3. Process Equipment
Piping and instrument diagrams, mechanical flow diagrams, isometrics and equipment data
sheets needed to be collected and documented for ease of reference and access. OGP (2008)
built on OSHA’s requirements and prescribed that sufficient process operating information,
needed to be communicated to the process operator, to alert them of abnormal conditions.
Therefore alarm management was included as well as the response time for action.
40
EI (2010) further described that applicable legislation needed to be comprehensively identified,
fully understood and complied with, as it was a fundamental requirement. Also concise records
and information was required to support safe operations. The longevity, accessibility and
availability of such documentation must be instilled by an organisation. These models
respectively increased the PSI requirements. Table 4 summarises the PSI requirements as
described by EPA (1999):
Table 4 – PSI Requirements (EPA, 1999)
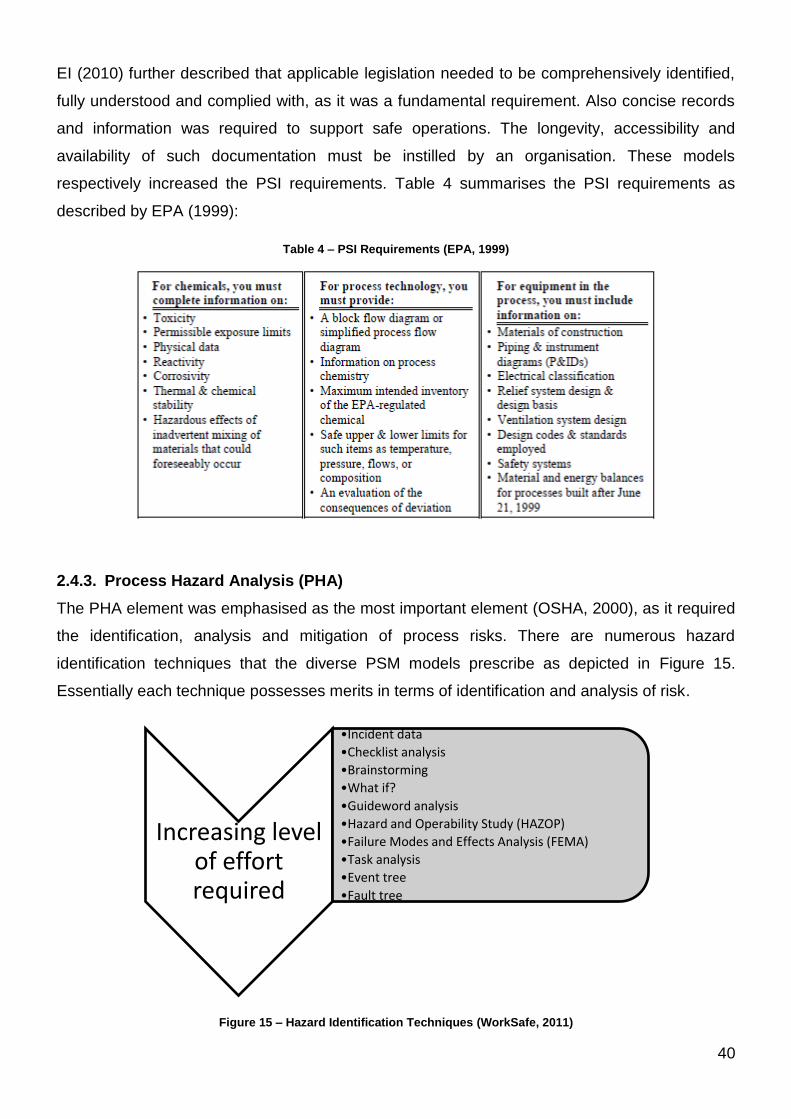
2.4.3. Process Hazard Analysis (PHA)
The PHA element was emphasised as the most important element (OSHA, 2000), as it required
the identification, analysis and mitigation of process risks. There are numerous hazard
identification techniques that the diverse PSM models prescribe as depicted in Figure 15.
Essentially each technique possesses merits in terms of identification and analysis of risk.
Figure 15 – Hazard Identification Techniques (WorkSafe, 2011)
Increasing level of effort required
•Incident data
•Checklist analysis
•Brainstorming
•What if?
•Guideword analysis
•Hazard and Operability Study (HAZOP)
•Failure Modes and Effects Analysis (FEMA)
•Task analysis
•Event tree
•Fault tree
41
Similarly OGP (2008) confirmed that an organisation must ensure that a comprehensive risk
assessment process was implemented to manage arising operational risks. EI (2010) further
recommended that the selected Key Performance Indicators (KPIs) should be aligned with the
risk management process for the facility. Since there were numerous KPIs that an organisation
can apply, much thought must be placed in the selection of the most value adding KPIs, for a
specific industry based on its nature of operation. Therefore these models prescribed similar
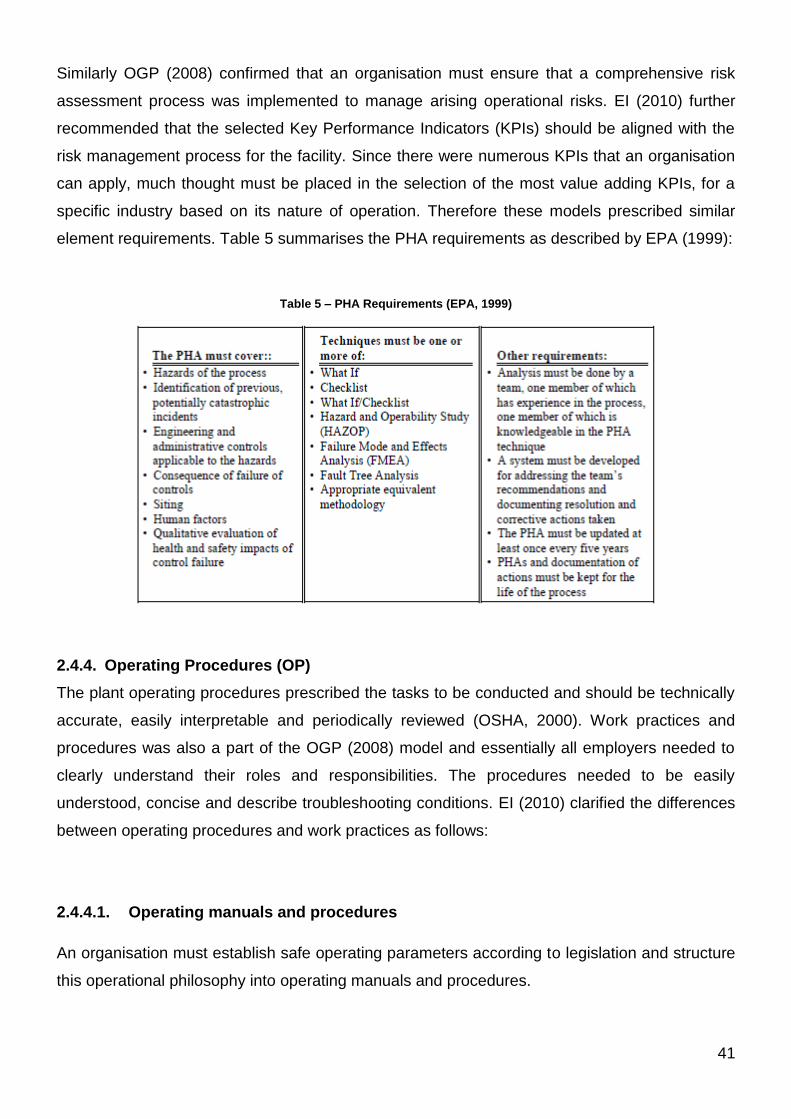
element requirements. Table 5 summarises the PHA requirements as described by EPA (1999):
Table 5 – PHA Requirements (EPA, 1999)
2.4.4. Operating Procedures (OP)
The plant operating procedures prescribed the tasks to be conducted and should be technically
accurate, easily interpretable and periodically reviewed (OSHA, 2000). Work practices and
procedures was also a part of the OGP (2008) model and essentially all employers needed to
clearly understand their roles and responsibilities. The procedures needed to be easily
understood, concise and describe troubleshooting conditions. EI (2010) clarified the differences
between operating procedures and work practices as follows:
2.4.4.1. Operating manuals and procedures
An organisation must establish safe operating parameters according to legislation and structure
this operational philosophy into operating manuals and procedures.

42
2.4.4.2. Standards and practices
Robust standards and safe working practices enhance the health, safety, process safety and
environmental performance. Therefore an organisation was to ensure that required work
practices and standards to support maintenance, projects and operational activities are
identified, developed and consistently applied.
Thus these models contained many overlapping requirements. Table 6 summarises the OP
requirements as described by EPA (1999):
Table 6 – OP Requirements (EPA, 1999)
2.4.5. Training (TR)
This element defined the quality of necessary training programs, delivered to various disciplines
of employees and contractors, inclusive of competency declarations (OSHA, 2000). Competent
and proficient resources needed to be recruited and strategically placed in the diverse
organisational positions, in order to effectively control the operation. Therefore EI (2010)
described that employee selection; placement, competency and health assurance are key
aspects when training employees.
Each position needed a defined range of skills, knowledge and personal attributes (OGP, 2008)
which would enable that employee to successfully execute their tasks. The organisation may
also specify training and proficient levels as deemed by formal qualifications. However an
organisation will need to assure such training and verify proficiency. Periodic review of

43
competence can include refresher training. Thus competent employees in diverse positions
within the facility enabled the operation to perform effectively.
2.4.6. Contractors (CTR)
The effective selection and management of contractors was essential to reduce their risks from
being introduced into a plant. The contractors needed to adopt the plant safety principles
(OSHA, 2000). This was aligned with the EP, PHA and TR requirements. Establishing and
maintaining stakeholders’ confidence was important in order to maintain an organisation’s
license to operate (EI, 2010). Therefore an organisation was required to sustain good working
relationships between stakeholders, in order to understand and address their concerns.
Operational interfaces of third parties, such as service providers, utilities or products needed to
be identified, assessed and managed. The third parties that perform work within the operation
need to adhere to the organisations safety requirements in a manner that was consistent and
compatible. No clear requirements from OGP were observed. Therefore both the OSHA and EI
models concluded that contractor management was vital to assure that an organisation’s risk
profile remained the same. Table 7 summarises the CTR requirements as described by EPA
(1999):
Table 7 – CTR Requirements (EPA, 1999)
44
2.4.7. Pre Start-up Safety Review (PSSR)
The commissioning of existing, modified or new equipment and plants posed risk to an
operation. Therefore it was mandatory for a new plant or modification to be subjected to a risk
study prior to it being commissioned. This PSSR was generally performed as a checklist to
identify any potential failures during commissioning (OSHA, 2000). The EI (2010) accounted for
operational readiness and process start-up, and prescribed the implementation of a systematic
process to verify that the plant or equipment was safe to operate. Again no clear requirements
from OGP were observed.
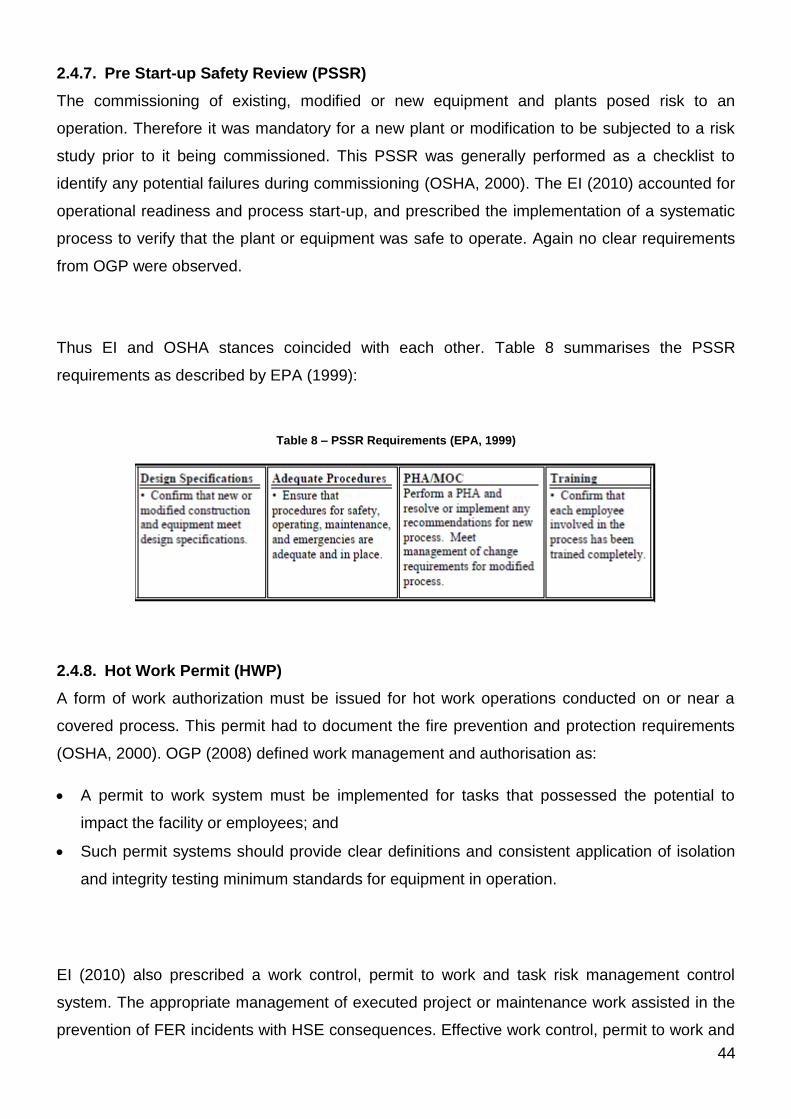
Thus EI and OSHA stances coincided with each other. Table 8 summarises the PSSR
requirements as described by EPA (1999):
Table 8 – PSSR Requirements (EPA, 1999)
2.4.8. Hot Work Permit (HWP)
A form of work authorization must be issued for hot work operations conducted on or near a
covered process. This permit had to document the fire prevention and protection requirements
(OSHA, 2000). OGP (2008) defined work management and authorisation as:
A permit to work system must be implemented for tasks that possessed the potential to
impact the facility or employees; and
Such permit systems should provide clear definitions and consistent application of isolation
and integrity testing minimum standards for equipment in operation.
EI (2010) also prescribed a work control, permit to work and task risk management control
system. The appropriate management of executed project or maintenance work assisted in the
prevention of FER incidents with HSE consequences. Effective work control, permit to work and

45
task risk management arrangements should be implemented and followed. It was evident that
EI, OSHA and OGP’s position on HWP was aligned. Table 9 summarises the HWP
requirements as described by EPA (1999):
Table 9 – HWP Requirements (EPA, 1999)
2.4.9. Mechanical Integrity (MI)
This standard entailed the review of maintenance programs and schedules, on the equipment
that store or process highly flammable or toxic products (OSHA, 2000). OGP (2008) indicated
that changes to asset design, operating limits or maintenance aspects, should be subjected to a
change control and reviewed by a competent technical authority. Further the instituting of
metrics on equipment assisted in the evaluation of asset integrity performance against
predefined goals. OGP (2008) described the lifecycle management of equipment as follows:
2.4.9.1. Acquisition
The asset integrity information must be included in the acquisition and absorbed by such costs.
2.4.9.2. Equipment design and controls layout
This focused on the arrangement of equipment in terms of ease of access. It also considered
the labelling of controls, colour schemes and ease of activation of control systems.
46
2.4.9.3. Performance standard verification
The operational facility itself should be subjected to direct assessment at frequent intervals. This
entailed the inspection of physical conditions to check for evidence of deterioration in equipment
through to emergency equipment.
2.4.9.4. Decommissioning, dismantling and removal
This was a crucial stage, as the normal operational barriers may be compromised or eliminated.
Therefore process materials from equipment and the site must be removed for safety.
EI (2010) stated that necessary inspection and maintenance requirements must be identified
and executed to sustain safe operations. Legislative requirements and maintenance
philosophies needed to be identified and adhered to. Safety critical equipment and devices
assisted in preventing FER incidents with HSE consequences. Such devices and equipment
needed to be identified, monitored and maintained for operation.
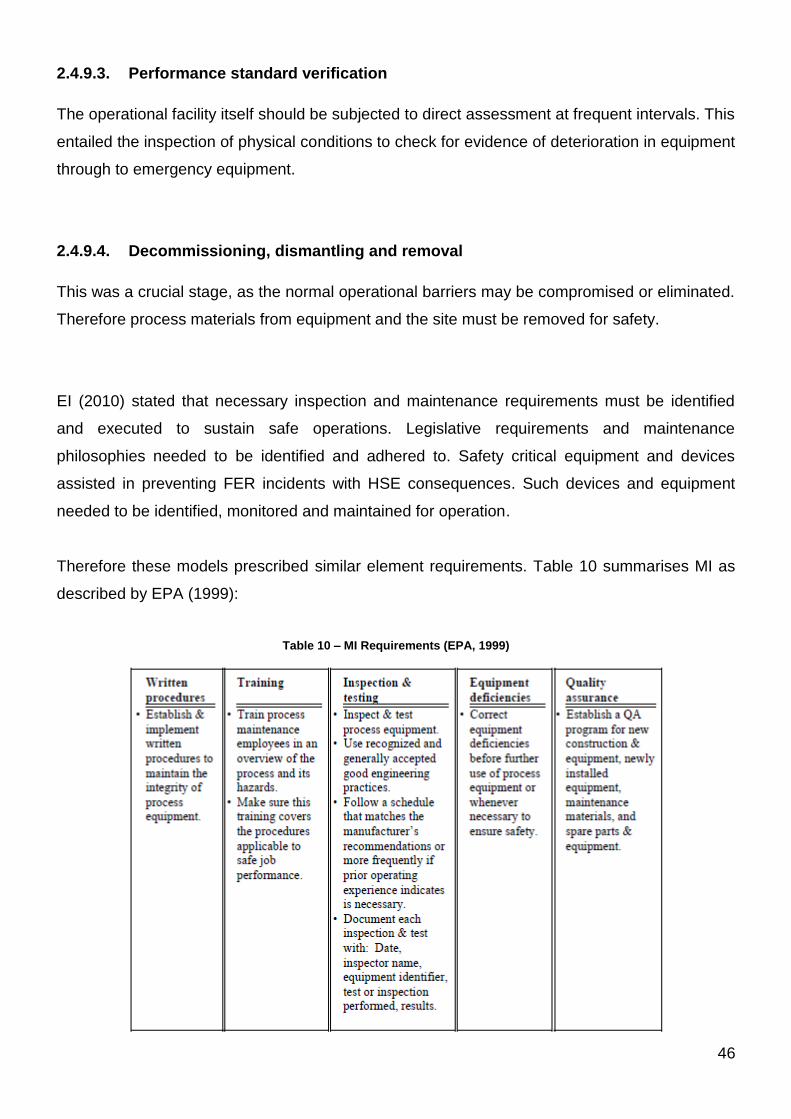
Therefore these models prescribed similar element requirements. Table 10 summarises MI as
described by EPA (1999):
Table 10 – MI Requirements (EPA, 1999)

47
2.4.10. Management of Change
This aspect detailed the procedures for managing changes to processes. The anticipated
changes to a process must be thoroughly evaluated in order to comprehensively assess the
impact on the business and employee safety and health (OSHA, 2000). EI (2010) also agreed
with this approach as any change that can impact the organisation, needed to undergo a risk
assessment to ensure that it supported the organisation.
OGP (2008) practiced inherently reliable concepts as this would avoid the management of
difficult asset integrity concerns. While the asset design was being populated, the asset integrity
barriers for maintenance needed to be developed in parallel. Poor detailed design may
considerably reduce asset integrity by making barriers ineffective.
Complete documentation was needed to describe the asset design, operating and maintenance
strategies which alluded to the importance of PSI. The finalisation of all procedures that
comprised operating, maintenance and testing was mandated. Further competent personnel
must be recruited and trained as described in the TR element. This training must incorporate
functional performance testing of equipment. Therefore OSHA, EI and OGP were deemed to
align their approach. Table 11 summarises MOC as described by EPA (1999):
Table 11 – MOC Requirements (EPA, 1999)

48
2.4.11. Incident Investigation
OSHA (2000) stated that all incidents needed to undergo a thorough investigation to identify the
sequence of events and causes. This enabled the determination and application of effective
corrective measures.
Figure 16 – Causes of Incidents (Thrower, 2013)
OGP (2008) was aligned with this approach and required that all incidents be tracked and
assessed, even minor incidents. They further prescribed both lagging and leading indicators.
Figure 16 illustrates an example of an incident investigation process as well as the three facets
of an incident, namely; initiating cause, loss of containment and consequences. EI (2010)
described the communication and inclusion of learning’s in OPs and PHAs. Thus alignment
between OSHA, OGP and EI was again observed. Table 12 summarises II as described by
EPA (1999):

49
Table 12 – II Requirements (EPA, 1999)
2.4.12. Emergency Planning and Response (EPR)
Unfortunately despite the best planning, the occurrence of an incident was still probable.
Therefore it was necessary that emergency pre-planning and training of employees was
undertaken. This ensured prompt reaction from all stakeholders to control the emergency
(OSHA, 2000).
Likewise EI (2010) prescribed that in the event of an emergency, the organisation must be
appropriately prepared to contain the consequences thereof. Emergency equipment, response
plans and training formed a part of this preparedness. OGP (2008) confirmed this approach.
2.4.13. Compliance Audits
OSHA (2000) prescribed periodic compliance audits to verify the effectiveness of PSM
implementation and adherence. These audits needed to be conducted by competent and
experienced personnel, so that areas of improvement was identified and remedied. Similarly EI
(2010) stated that periodic internal and external review and audit of PSM framework compliance

50
was essential to ensure sustained performance in the prevention of FER incidents with HSE
consequences.
OGP (2008) required management to manage and review asset integrity performance to assure
sustained performance. This activity considered the findings from all the aforementioned
elements, inclusive of good industry practices and incident lessons. Management could then
conclude informed decisions to improve the overall asset integrity. The risk profile of an asset
dictated the type and occurrence of an audit. The asset integrity management system elements
were essentially reviewed to gauge the implementation and effectiveness. Further improvement
areas could be identified to maintain performance. Therefore all these models prescribed similar
element requirements.
2.4.14. Trade Secrets
OSHA (2000) stated that all employers needed to make information available, namely PSI. The
information extended from OP to EPR, essentially covering all the elements. However,
confidentiality agreements and access control can be imposed so that such imperative
information was not disclosed to other parties. It was concluded that only the OSHA PSM model
prescribed this requirement in the form of an element.
In conclusion, comparative studies were conducted on the OSHA PSM model against the OGP
and EI models. Many similarities were observed with respect to each element and model.
Alignment between the models’ element prerequisites was attributed to the good practices
industry adopted to prevent process safety incidents.

51
2.5. Manufacturing Industry Overview
The study extracted the cause information from incidents that occurred in industry. These
process safety incidents occurred in many diverse industries, which manufactured products in
large quantities. Essentially these industries processed raw materials into more valuable
products. The study comprised of five industries and overviews of these industries are
presented below.
2.5.1. Metallurgical Industry
This industry was concerned with the refining, alloying and fabrication of metals (EPA, 2009). It
was classified as a heavy manufacturing industry due to the capital intensity and large scale of
operations (BLS, 2013). Steel and iron was predominantly processed due to its requirement as
raw material in the production of further valuable products.
2.5.2. Chemical Industry
This industry had evolved over the decades due to the increased demand for economic activity
(Chartered Technofunctional Institute, 2012). It was divided into three categories, namely;
heavy chemicals, pharmaceuticals and petrochemicals (Wetfeet , 2012). Heavy Chemicals
processed mineral deposits or by-products and involved mining activities. Pharmaceuticals
involved the manufacturing of drugs and medicines. Petrochemicals involved the processing of
chemicals attained from fuel sources. Incidents that occurred on oil rigs and ships that
transported crude oil, was grouped a part of this industry.
2.5.3. Food Processing Industry
This industry entailed the processing of raw materials into food products, food preservation and
food packaging. Similarly the food products can be used as raw material to produce another
high valuable product. An example of this was the use of refined sugar in baking to produce
cakes. It was classified as a light manufacturing industry as it involved consumer products
(Zahie, n.d.).
52
2.5.4. Agricultural
This massive industry was responsible for providing mankind with sustenance (MSU, 2013). It
mainly consisted of growing food crops and raising livestock, however field crops such as
tobacco and cotton was also included. This industry also contained support functions, namely;
pest management and animal husbandry. Therefore fertilizer and pesticide products were
grouped a part of this industry.
2.5.5. Nuclear
This industry generated electricity and was considered to be an alternate source of energy. In
this application, Uranium, a natural mined metal, undergoes fission which splits its nuclei
thereby releasing energy in the form of heat (Nuclear Energy , 2011). This excessive heat was
then absorbed by water, which was then converted into steam. The steam would drive turbines
which in turn drive generators to produce electricity. Stringent legislation had been implemented
for nuclear operations as it was a high risk facility. This form of energy was considerable
cheaper than the coal derived energy source.
These identified manufacturing industries unfortunately had process safety incidents which
occurred whilst in operation. Their respective process safety incidents were surveyed to obtain
all causes of the incident. The examination of diverse industry incidents assisted in a broad
understanding of PSM effectiveness. However the practical application and sustainability of
PSM implementation required investigation. Therefore case studies were conducted, in order to
understand the effectiveness of PSM in industry. The succeeding chapter presented an
overview on the selected companies for the case study.

53
2.6. Case Studies: Company Profiles
The institutionalization of PSM in industry was key in understanding the diverse approaches to
PSM implementation and sustainability. Therefore case studies were conducted on three
international companies with high risk operations. The chemical industry was selected with
emphasis placed on the Petrochemical division. The following Petrochemical companies were
investigated; Sasol, Shell and British Petroleum (BP). An overview of these companies’ profiles
and scale of operations was presented below:
2.6.1. Sasol
Sasol is an integrated chemical and energy company with global operations. They employ over
34 000 people that work in 38 countries (Sasol, 2012), which allude to the enormity of the
company. Sasol (2012) stated that safety was a top priority and a core valve. They committed to
achieve a safety goal of zero harm thereby eliminating incidents, minimising risk and promoting
operational performance excellence (Sasol, 2012). Sasol procured the services of DuPont, to
ascertain its PSM compliance.
2.6.2. British Petroleum (BP)
BP is also one the world’s leading oil and gas companies, with operations in over 80 countries
that employ over 85,900 people (BP, 2013a). The history of BP extended far back as 1908 (BP,
2013a). BP currently possess a stake in 16 refineries which roughly produce 2,354 thousand
barrels per day (BP, 2013a).
2.6.3. Shell
Shell is a global group which is composed of energy and petrochemical companies. They
employ about 87,000 people in more than 70 countries (Shell, 2012b). Shell’s objective is to
assist and meet the energy demands of society in a manner that is economically,
environmentally and socially responsible (Shell, 2012b).
Shell and BP employ more resources and managed more global operations in comparison to
Sasol. Their operations were significantly larger, almost double in comparison to Sasol.
However these companies’ mission statements contain much resemblance.

54
In summary, Chapter 2 had covered vast amounts of literature depicting the numerous PSM
models and pitting them against the OSHA model. The industries that formed a part of the study
were also discussed. Similarly, a concise overview of the case study company profiles was
presented.
Upon concluding the literature study on the PSM model and its individual elements, the
development of an empirical investigation was undertaken. The information gathered from the
literature study, was utilized to generate the empirical design. It was also applied in the analysis
of the study findings. The next chapter presents the concept and merits of the empirical
investigation approach and survey questionnaire.

55
Chapter 3: Empirical Investigation
3.1. Introduction
In this chapter, the approach utilized to gather and analyse the data in the study is described. A
semi-qualitative research methodology was conducted and its specific elements are discussed.
3.2. Data Gathering
The author is employed at a Petrochemical company during the compilation of this dissertation,
therefore the author had the opportunity to analyse the implementation of PSM at his employer.
However an analysis of PSM on this one company would return an analysis solely based on
said company. Further, research into this one company’s incident causes would reveal
challenges in terms of the PSM program only within this company. The research problem was
on a global scale; hence an analysis on an individual company will not adequately address the
problem.
To objectively identify gaps in the PSM program, interpretation of global process safety
incidents would provide a concise and effective analysis. Numerous process safety incident
reports were published throughout the years from diverse process industries. Such reports were
public knowledge, in an effort to share lessons learnt and prevent similar incidents from
occurring. Therefore information on incident causes was readily available.
Process safety incidents do not discriminate and occurred in diverse countries, from third world
to first world as indicated by Schouwenaars (2008). Therefore the PSM landscape was
randomly selected across the globe and across process industries. The study population
comprised of fifty global manufacturing and processing industries over a span of forty years.
The reviewed incidents were randomly selected from both small and large scale operations to
effectively gauge PSM implementations on a broader scope.
56
3.3. Survey Development
Research into random past incidents and their causes was the predominant avenue of data
collection. Incident causes were initially segmented into the following categories, namely; direct
causes, root causes and contributing causes. However due to the unavailability of abundant
comprehensive incident reports as discussed in Chapter 4, only cause and no cause categories
were incorporated into the survey questionnaire. These incidents were thoroughly investigated
and their identified causes were definitive. Therefore an aspect of this study was considered to
be quantitative.
A set of constructs is defined to enable the numerical analysis of the obtained data. The survey
questionnaire was devised on the foundation of the OSHA PSM model. Thus two constructs,
namely incident information and PSM elements was developed employing the literature study
information in Chapter 2.
Incident Information was gathered to understand the study population. Upon conclusion of the
research into the OSHA PSM elements and their associated requirements, sub-element
questions were populated. These key sub-element questions essentially alluded to the
challenges within a particular element. Therefore this aspect of the study was considered to be
qualitative. Since the overall study was qualitatively based, this study was fundamentally
considered to be a semi-qualitative study.
3.3.1. Survey Validation
Major, significant, moderate and minor PSM process incidents, as described in chapter 1 and
other incidents, were reviewed to gather the generic causes. The study comprised of both off-
shore and on-shore incidents.
This data was reviewed and interpreted according to the survey questionnaire. The initial survey
questionnaire was also reviewed by an independent statistician, whom provided valuable
insights in terms of strengthening the validity of the survey.
57
As previously discussed, numerous lessons to prevent the re-occurrence of process safety
incidents were published and readily available. Therefore the identified causes were identified
and verified from credible sources. These literature references were depicted in Appendix C –
Incident Information, Table 24.
3.3.2. Survey Questionnaire
The intent of this survey questionnaire, as illustrated in Appendix A, Table 22 was to examine
diverse process incidents and to obtain the commonly identified causes. These causes were
interpreted against the OSHA PSM elements as previously discussed. The imperative PSM
elements were determined based on their contribution to the incident occurrence.
This empirical investigation discussed and concluded on the employed research methodology.
This approach entailed the surveying of a hundred incident reports. However only fifty incidents
were utilized in the study and the remaining fifty incident reports were used for cause
verification purposes. The next chapter presents the findings obtained from this study. These
findings are discussed and verified against literature.
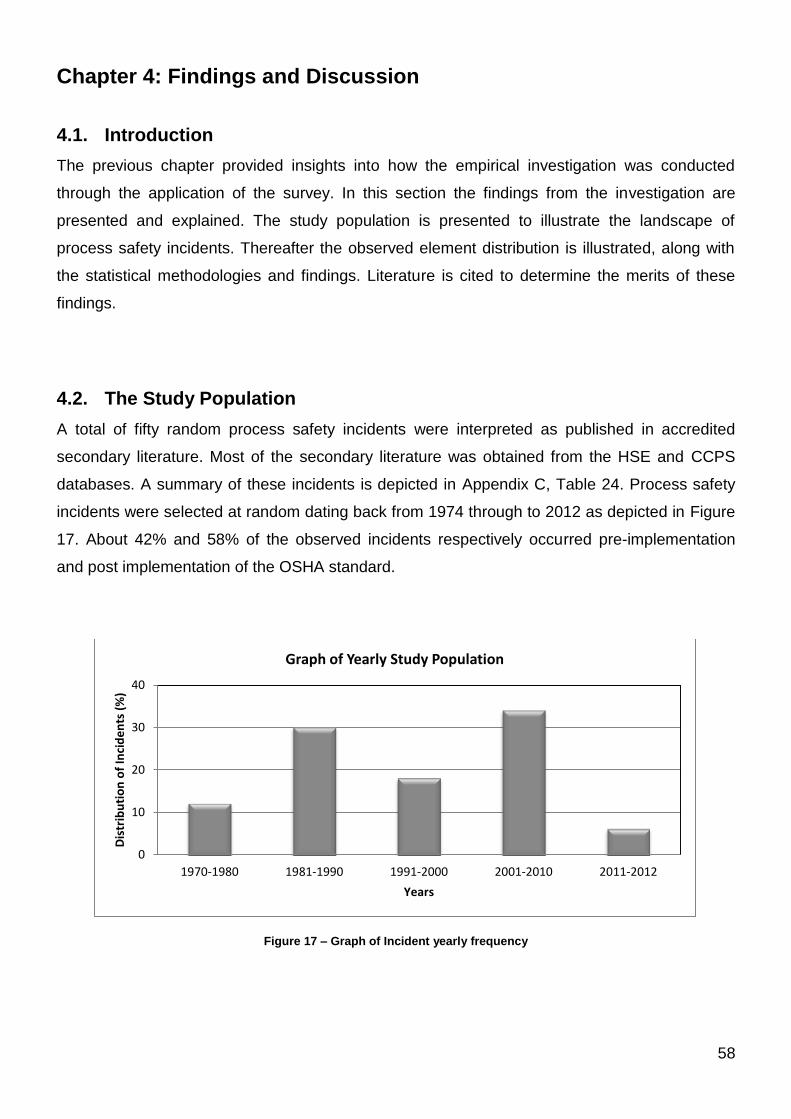
58
Chapter 4: Findings and Discussion
4.1. Introduction
The previous chapter provided insights into how the empirical investigation was conducted
through the application of the survey. In this section the findings from the investigation are
presented and explained. The study population is presented to illustrate the landscape of
process safety incidents. Thereafter the observed element distribution is illustrated, along with
the statistical methodologies and findings. Literature is cited to determine the merits of these
findings.
4.2. The Study Population
A total of fifty random process safety incidents were interpreted as published in accredited
secondary literature. Most of the secondary literature was obtained from the HSE and CCPS
databases. A summary of these incidents is depicted in Appendix C, Table 24. Process safety
incidents were selected at random dating back from 1974 through to 2012 as depicted in Figure
17. About 42% and 58% of the observed incidents respectively occurred pre-implementation
and post implementation of the OSHA standard.
Figure 17 – Graph of Incident yearly frequency
0
10
20
30
40
1970-1980 1981-1990 1991-2000 2001-2010 2011-2012
Dis
trib
uti
on
of
Inci
de
nts
(%
)
Years
Graph of Yearly Study Population

59
The observed study population consists of incidents spanning the globe as illustrated in Figure
18. The study incidents occur mostly in America and Europe. This was attributed to the Seveso
Directive and OSHA legislation, which required the publication and sharing of process safety
incident investigations.
Figure 18 – Graph of Incident Distribution per Continent
The process safety incidents are classified according to Appendix B Table 23, as described by
Overton (2008). A good distribution of incident severity should allude to attaining an enhanced
insight, into diverse incident causation of diverse proportions. However the observed incident
distribution consisted mainly of 90% Level 1, 8% Level 2, 2% Level 3 and no Level 4 incidents.
This was due to the limitations in the secondary literature that was available. These incidents
were also classified according to their respective type, namely FER. About 88% fire and
explosion incidents were observed according to the distribution.
The observed industry distribution included 84% chemical industry incidents. The study
methodology was therefore strengthened by adopting the OSHA PSM model, as most of the
incidents resulted in North America in the chemical industry post implementation of the OSHA
standard.
0
10
20
30
40
50
Europe NorthAmerica
South America Asia Africa Australia
Inci
de
nt
pe
r C
on
tin
en
t (%
)
Continents
Graph of Incident Distribution per Continent
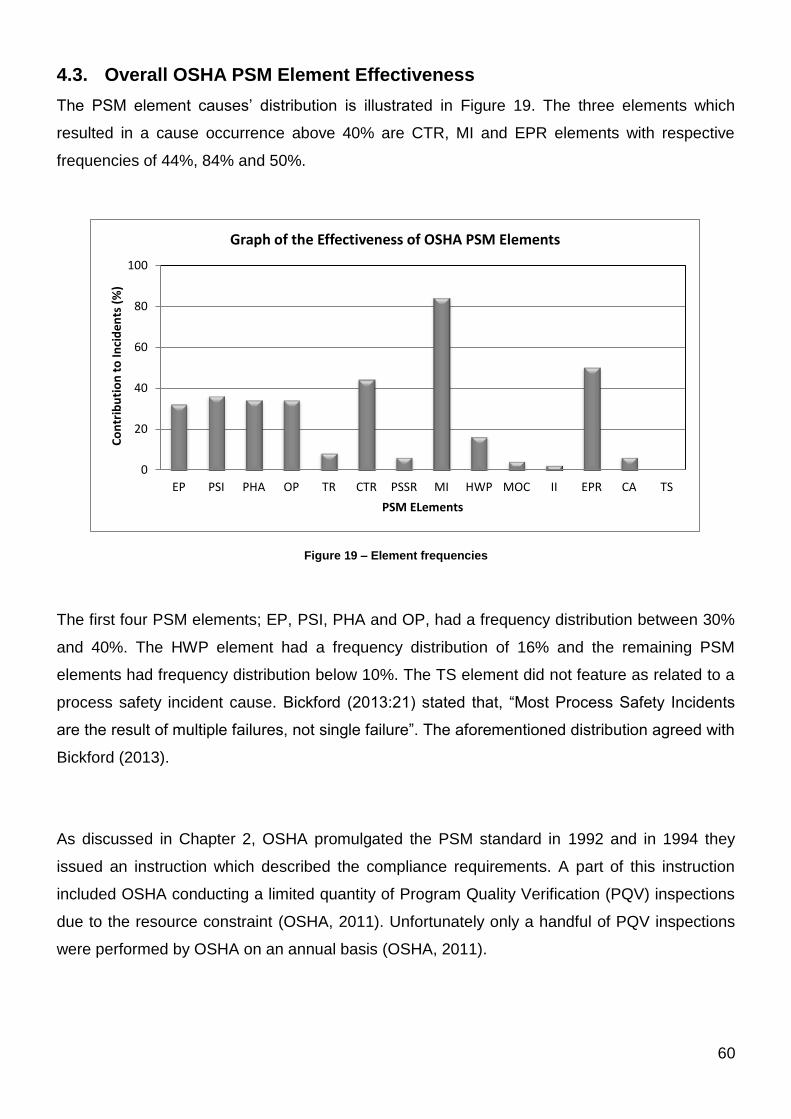
60
4.3. Overall OSHA PSM Element Effectiveness
The PSM element causes’ distribution is illustrated in Figure 19. The three elements which
resulted in a cause occurrence above 40% are CTR, MI and EPR elements with respective
frequencies of 44%, 84% and 50%.
Figure 19 – Element frequencies
The first four PSM elements; EP, PSI, PHA and OP, had a frequency distribution between 30%
and 40%. The HWP element had a frequency distribution of 16% and the remaining PSM
elements had frequency distribution below 10%. The TS element did not feature as related to a
process safety incident cause. Bickford (2013:21) stated that, “Most Process Safety Incidents
are the result of multiple failures, not single failure”. The aforementioned distribution agreed with
Bickford (2013).
As discussed in Chapter 2, OSHA promulgated the PSM standard in 1992 and in 1994 they
issued an instruction which described the compliance requirements. A part of this instruction
included OSHA conducting a limited quantity of Program Quality Verification (PQV) inspections
due to the resource constraint (OSHA, 2011). Unfortunately only a handful of PQV inspections
were performed by OSHA on an annual basis (OSHA, 2011).
0
20
40
60
80
100
EP PSI PHA OP TR CTR PSSR MI HWP MOC II EPR CA TS
Co
ntr
ibu
tio
n t
o In
cid
en
ts (
%)
PSM ELements
Graph of the Effectiveness of OSHA PSM Elements

61
In order to address this gap, in 2009 OSHA implemented the pilot National Emphasis Program
(NEP) for chemical facilities. This new approach to inspections, catered for a greater quantity of
inspections while employing effective use of OSHA resources. Therefore the NEP initiative
expanded and was considered to be the most significant PSM enforcement engagement since
the inception of the standard (Barab, 2012).
OSHA issued citations to companies for their respective PSM element non-conformances.
There were citations issued to 173 pilot inspections, with the majority of violations in the
General Industry sector, and PSM contributed to 60% of the total violations (Lay, 2012). These
NEP citations are accounted against each element as tabulated in Table 13.
Table 13 – OSHA’s NEP Citations (Barab, 2012)
Significant citations were issued for the following elements; MI, PSI, PHA and OP as displayed
above. Only MI is in agreement with the study finding as depicted in Figure 19. The remaining
elements, to a degree, agreed with this NEP analysis, however it was deemed to be

62
0
20
40
60
80
100
EP PSI PHA OP TR CTR PSSR MI HWP MOC II EPR CA TS
Co
ntr
ibu
tio
n t
o In
cid
en
ts (
%)
PSM Elements
Graph of the Efectiveness of Pre and Post OSHA PSM Elements
Pre OSHA
Post OSHA
inconclusive. From the NEP, the CTR and EPR elements was insignificant, therefore this
contradicted the study findings.
4.4. Pre and Post OSHA element performance
An analysis into the effectiveness of the implemented OSHA PSM elements was investigated
against the pre-implementation phase. Figure 20 indicates the incident cause distribution with
respect to each PSM element, in terms of pre and post OSHA implementation. As depicted, the
MI element featured significantly both pre and post OSHA implementation. However CTR and
EPR element failures decreased by as much as 21% post OSHA implementation. This
performance was in line with the hypothesis as the implementation of the OSHA PSM standard
was intended to drive down the occurrence of process safety incidents. The remaining
elements’ performance did not feature significantly, hence these were deemed negligible.
Figure 20 – Element performance after implementation
PSM focus areas, based on specific elements, were identified and reviewed from literature. This
focus placed on such elements, implied declining performance which required urgent attention.

63
NOPSA (2009) adopted four focus areas for 2009/2010, which was related to the OSHA PSM
elements; Process Safety Leadership in MAE prevention (EP), Asset Integrity (MI), Contractor
Management (CTR) and Emergency Response (EPR). Whereas the 2010 Global Congress on
Process Safety (Bickford, 2013) indicated the top ranking causes for loss of containment which
were related to the OSHA PSM elements as follows:
Design concerns - PSI
Preventive maintenance and reliability - MI
Procedures and training - OP and TR
Operating discipline - EP
The CCPS Vision 2020 was an initiative intended to improve process safety performance
through this decade (McCavit et al., 2013). It comprised of a roadmap to the year 2020, which
mandated the characteristics that companies will require in order to achieve great process
safety performance. This initiative was twofold, as it also focused on the roles of four societal
themes, namely; the government, public, industry and labour sectors. For the purposes of this
discussion, the former aspect of this initiative was investigated. There are five characteristics
identified for companies to develop and sustain as illustrated in Figure 21.
Figure 21 – Interrelationship of characteristics (McCavit et al., 2013)
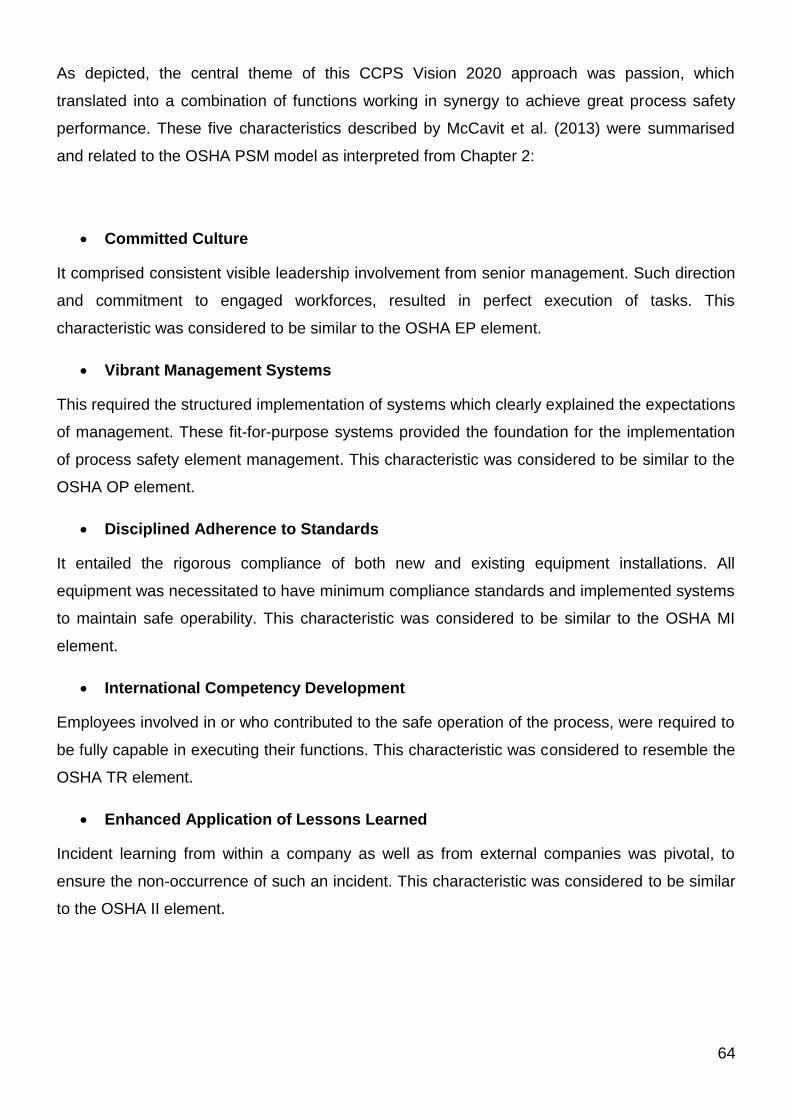
64
As depicted, the central theme of this CCPS Vision 2020 approach was passion, which
translated into a combination of functions working in synergy to achieve great process safety
performance. These five characteristics described by McCavit et al. (2013) were summarised
and related to the OSHA PSM model as interpreted from Chapter 2:
Committed Culture
It comprised consistent visible leadership involvement from senior management. Such direction
and commitment to engaged workforces, resulted in perfect execution of tasks. This
characteristic was considered to be similar to the OSHA EP element.
Vibrant Management Systems
This required the structured implementation of systems which clearly explained the expectations
of management. These fit-for-purpose systems provided the foundation for the implementation
of process safety element management. This characteristic was considered to be similar to the
OSHA OP element.
Disciplined Adherence to Standards
It entailed the rigorous compliance of both new and existing equipment installations. All
equipment was necessitated to have minimum compliance standards and implemented systems
to maintain safe operability. This characteristic was considered to be similar to the OSHA MI
element.
International Competency Development
Employees involved in or who contributed to the safe operation of the process, were required to
be fully capable in executing their functions. This characteristic was considered to resemble the
OSHA TR element.
Enhanced Application of Lessons Learned
Incident learning from within a company as well as from external companies was pivotal, to
ensure the non-occurrence of such an incident. This characteristic was considered to be similar
to the OSHA II element.
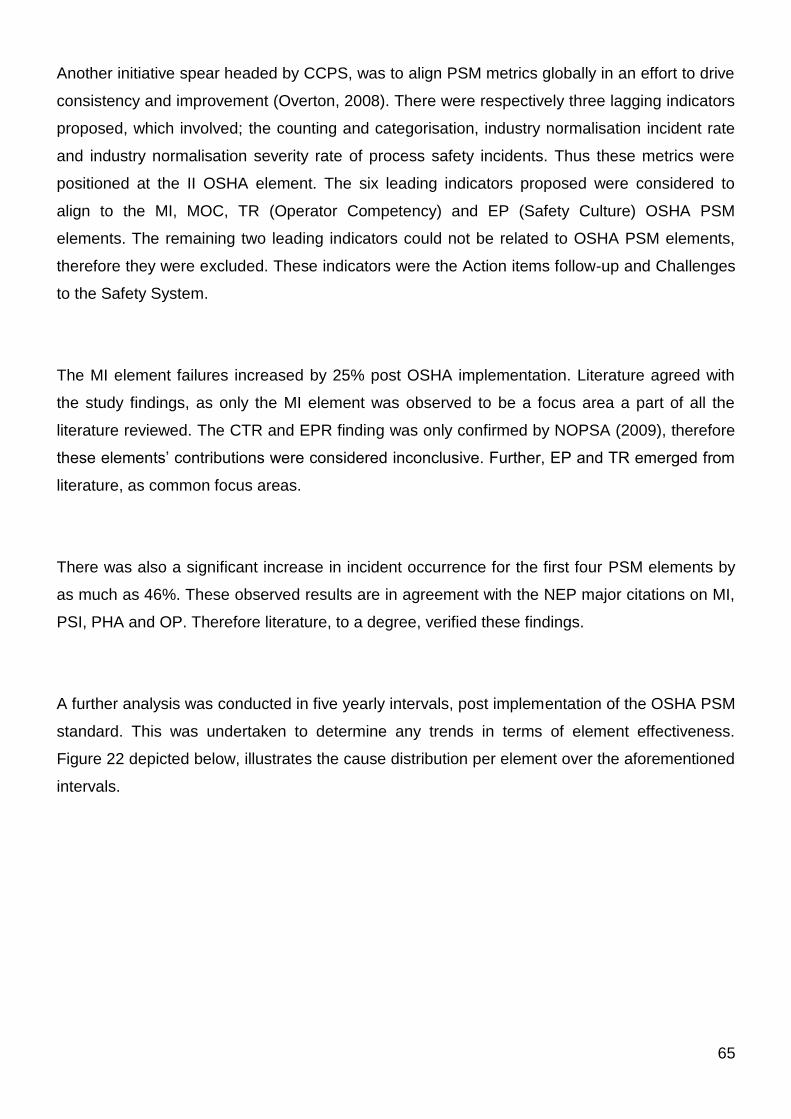
65
Another initiative spear headed by CCPS, was to align PSM metrics globally in an effort to drive
consistency and improvement (Overton, 2008). There were respectively three lagging indicators
proposed, which involved; the counting and categorisation, industry normalisation incident rate
and industry normalisation severity rate of process safety incidents. Thus these metrics were
positioned at the II OSHA element. The six leading indicators proposed were considered to
align to the MI, MOC, TR (Operator Competency) and EP (Safety Culture) OSHA PSM
elements. The remaining two leading indicators could not be related to OSHA PSM elements,
therefore they were excluded. These indicators were the Action items follow-up and Challenges
to the Safety System.
The MI element failures increased by 25% post OSHA implementation. Literature agreed with
the study findings, as only the MI element was observed to be a focus area a part of all the
literature reviewed. The CTR and EPR finding was only confirmed by NOPSA (2009), therefore
these elements’ contributions were considered inconclusive. Further, EP and TR emerged from
literature, as common focus areas.
There was also a significant increase in incident occurrence for the first four PSM elements by
as much as 46%. These observed results are in agreement with the NEP major citations on MI,
PSI, PHA and OP. Therefore literature, to a degree, verified these findings.
A further analysis was conducted in five yearly intervals, post implementation of the OSHA PSM
standard. This was undertaken to determine any trends in terms of element effectiveness.
Figure 22 depicted below, illustrates the cause distribution per element over the aforementioned
intervals.

66
Figure 22 – Element performance in 5 yearly intervals
Only the MI element consistently featured significantly over the five year intervals. This analysis
revealed that, to a degree, the effectiveness of this element was increasing. This finding was
deemed to contradict literature. The remaining elements’ trends were considered insignificant,
which was in line with Figure 20 and the previous discussion.
Once a PSM program was developed and integrally implemented into a facility, continuous
maintenance of the system was required to ensure its sustainability. Table 14 was compiled by
the IRC (2006) to guide management toward sustainable PSM. It indicates the activities within
each element that required on-going support (IRC, 2006).
Table 14 – Sustaining PSM Implementation (IRC, 2006)
0
20
40
60
80
100
EP PSI PHA OP TR CTR PSSR MI HWP MOC II EPR CA TS
Co
ntr
ibu
tio
n t
oIn
cid
en
ts (
%)
PSM ELements
Graph of the Effectiveness of OSHA PSM Elements at 5 Yearly Intervals
1974-1991
1992-1996
1997-2001
2002-2006
2007-2012
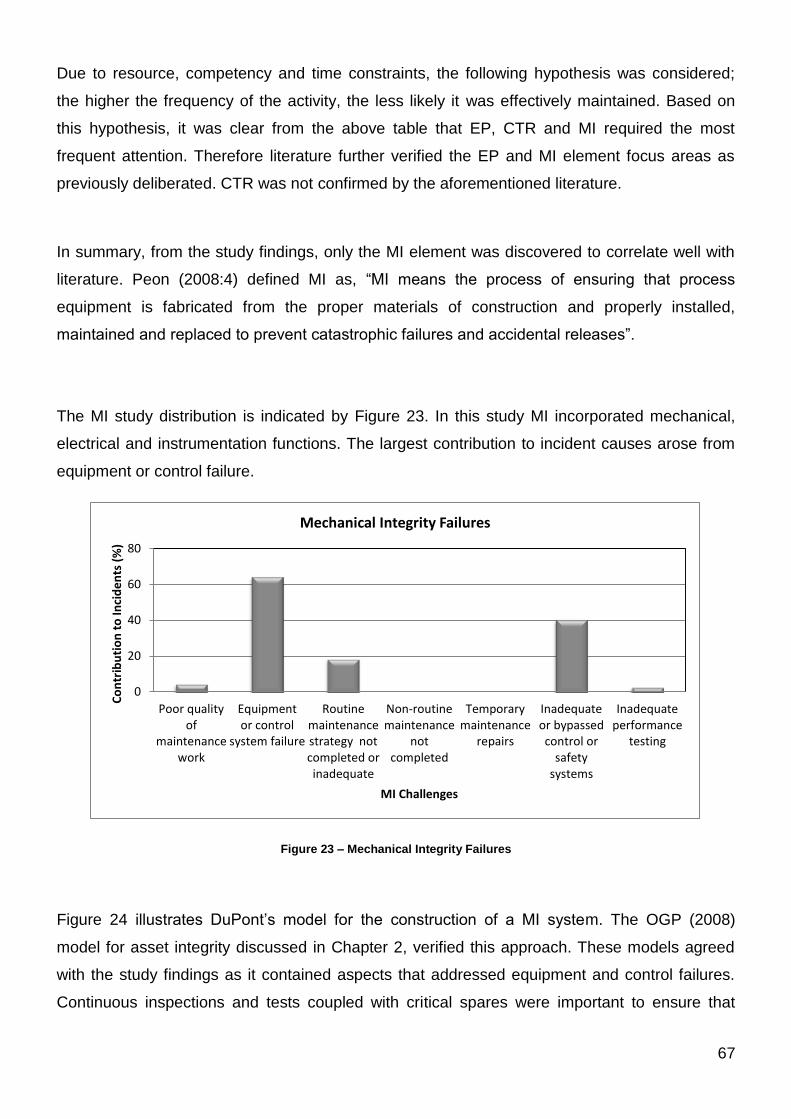
67
Due to resource, competency and time constraints, the following hypothesis was considered;
the higher the frequency of the activity, the less likely it was effectively maintained. Based on
this hypothesis, it was clear from the above table that EP, CTR and MI required the most
frequent attention. Therefore literature further verified the EP and MI element focus areas as
previously deliberated. CTR was not confirmed by the aforementioned literature.
In summary, from the study findings, only the MI element was discovered to correlate well with
literature. Peon (2008:4) defined MI as, “MI means the process of ensuring that process
equipment is fabricated from the proper materials of construction and properly installed,
maintained and replaced to prevent catastrophic failures and accidental releases”.
The MI study distribution is indicated by Figure 23. In this study MI incorporated mechanical,
electrical and instrumentation functions. The largest contribution to incident causes arose from
equipment or control failure.
Figure 23 – Mechanical Integrity Failures
Figure 24 illustrates DuPont’s model for the construction of a MI system. The OGP (2008)
model for asset integrity discussed in Chapter 2, verified this approach. These models agreed
with the study findings as it contained aspects that addressed equipment and control failures.
Continuous inspections and tests coupled with critical spares were important to ensure that
0
20
40
60
80
Poor qualityof
maintenancework
Equipmentor control
system failure
Routinemaintenancestrategy notcompleted orinadequate
Non-routinemaintenance
notcompleted
Temporarymaintenance
repairs
Inadequateor bypassedcontrol or
safetysystems
Inadequateperformance
testing
Co
ntr
ibu
tio
n t
o In
cid
en
ts (
%)
MI Challenges
Mechanical Integrity Failures

68
equipment was always operated safely with increased reliability and availability (Peon, 2008).
This would prevent the occurrence of FER incidents with HSE consequences.
DuPont’s model focused on the sustainability of the MI element, ensuring that the maintenance
executor was competent, trained and guided by procedures to execute a task (Peon, 2008).
Quality assurance was also included to ensure a second independent evaluation of the work.
Lax et al (2013) confirmed that numerous good practices incorporated the EP, TR and MI
elements. However this was not emphasised in the study.
Figure 24 – DuPont’s Mechanical Integrity and Quality Assurance Model (Peon, 2008)
4.5. Statistical Analysis
A statistical analysis was conducted on the observed data to identify any relationships between
each of the PSM elements. The incident cause reports as attained through secondary literature,
was not adequately formulated in terms of direct, root and contributing causes. The majority of
these reports indicated the general causes. Due to this limitation, an in-depth cause analysis
could not be undertaken. Thus the observed cause data was more indicative of a true and false

69
data base. The observed data consisted of summarised counts of qualitative data which was
divided into the element groups, therefore it was categorical data.
There was no premise for the characteristic structure between the PSM elements. The
observed data was deemed to be ordinal, as it consisted of discrete items which belonged to a
common category ranked by the year of occurrence. The observed data was classified as
descriptive (Trochim, 2006), thus non-parametric statistics was conducted. These statistics do
not depend and assume that the data had any characteristic structure; however they do assume
that the data was measured at the nominal or ordinal level. Descriptive statistics was applied in
order to describe the relationships between the PSM elements.
4.5.1. Element Correlations
The Spearman’s rho correlation was utilized, as it is a non-parametric measure of statistical
dependence between two variables. It was assumed that the underlying elements’ relationship
was monotonic. The hypothesis tested was that each PSM element correlated to another PSM
element. Spearman’s rho returned values between -1 and +1, which respectively represented
negative and positive correlations (White & Korotayev, 2004). Therefore the following scale was
adopted for Spearman’s rho:
0.50 to 1.00 = Strong positive relationship
0.01 to 0.50 = Weak positive relationship
-0.01 to -0.50 = Strong negative relationship
-0.50 to -1.00 = Weak negative relationship
Two tailed significance was applied to test the null hypothesis that there was no relation
between the PSM elements. This probability test consisted of the two significance levels,
namely; 5% and 1% level of significance (White & Korotayev, 2004). Therefore the following
scale was adopted for the significance level:
0.00 to 0.01 = Highly significant
0.01 to 0.03 = Moderately significant
0.03 to 0.05 = Significant
0.05 to 1.00 = Not significant
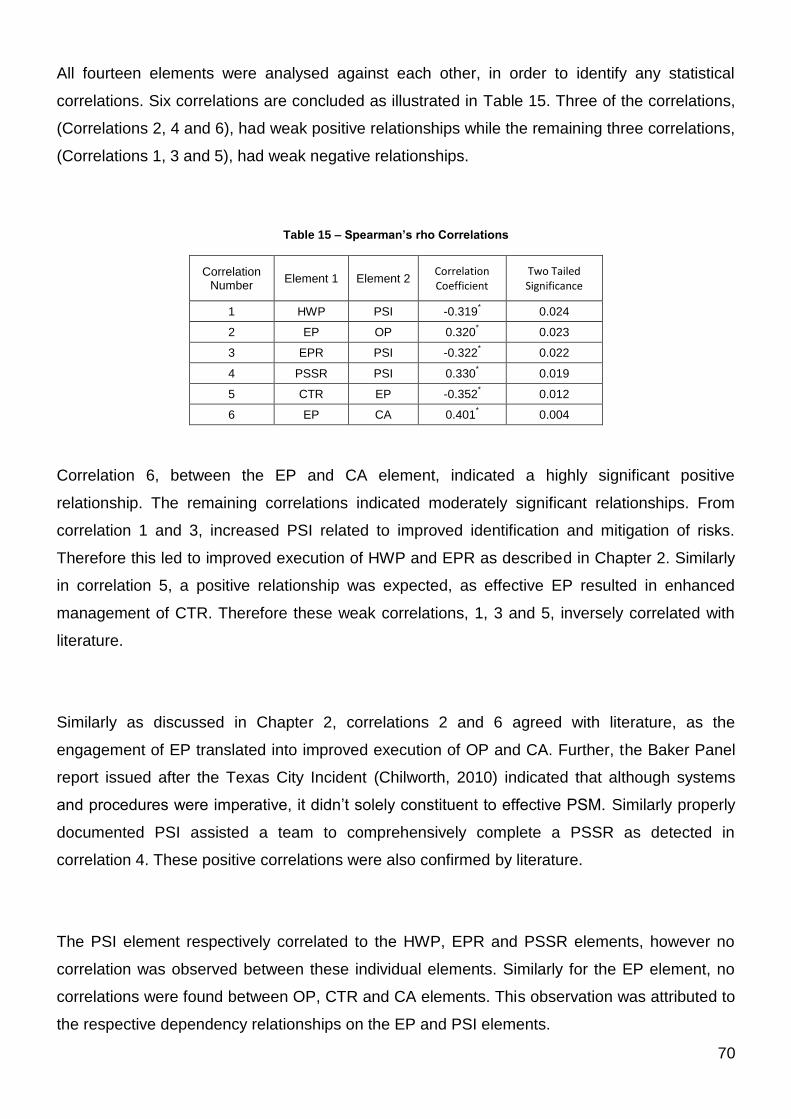
70
All fourteen elements were analysed against each other, in order to identify any statistical
correlations. Six correlations are concluded as illustrated in Table 15. Three of the correlations,
(Correlations 2, 4 and 6), had weak positive relationships while the remaining three correlations,
(Correlations 1, 3 and 5), had weak negative relationships.
Table 15 – Spearman’s rho Correlations
Correlation Number
Element 1 Element 2 Correlation Coefficient
Two Tailed Significance
1 HWP PSI -0.319* 0.024
2 EP OP 0.320* 0.023
3 EPR PSI -0.322* 0.022
4 PSSR PSI 0.330* 0.019
5 CTR EP -0.352* 0.012
6 EP CA 0.401* 0.004
Correlation 6, between the EP and CA element, indicated a highly significant positive
relationship. The remaining correlations indicated moderately significant relationships. From
correlation 1 and 3, increased PSI related to improved identification and mitigation of risks.
Therefore this led to improved execution of HWP and EPR as described in Chapter 2. Similarly
in correlation 5, a positive relationship was expected, as effective EP resulted in enhanced
management of CTR. Therefore these weak correlations, 1, 3 and 5, inversely correlated with
literature.
Similarly as discussed in Chapter 2, correlations 2 and 6 agreed with literature, as the
engagement of EP translated into improved execution of OP and CA. Further, the Baker Panel
report issued after the Texas City Incident (Chilworth, 2010) indicated that although systems
and procedures were imperative, it didn’t solely constituent to effective PSM. Similarly properly
documented PSI assisted a team to comprehensively complete a PSSR as detected in
correlation 4. These positive correlations were also confirmed by literature.
The PSI element respectively correlated to the HWP, EPR and PSSR elements, however no
correlation was observed between these individual elements. Similarly for the EP element, no
correlations were found between OP, CTR and CA elements. This observation was attributed to
the respective dependency relationships on the EP and PSI elements.
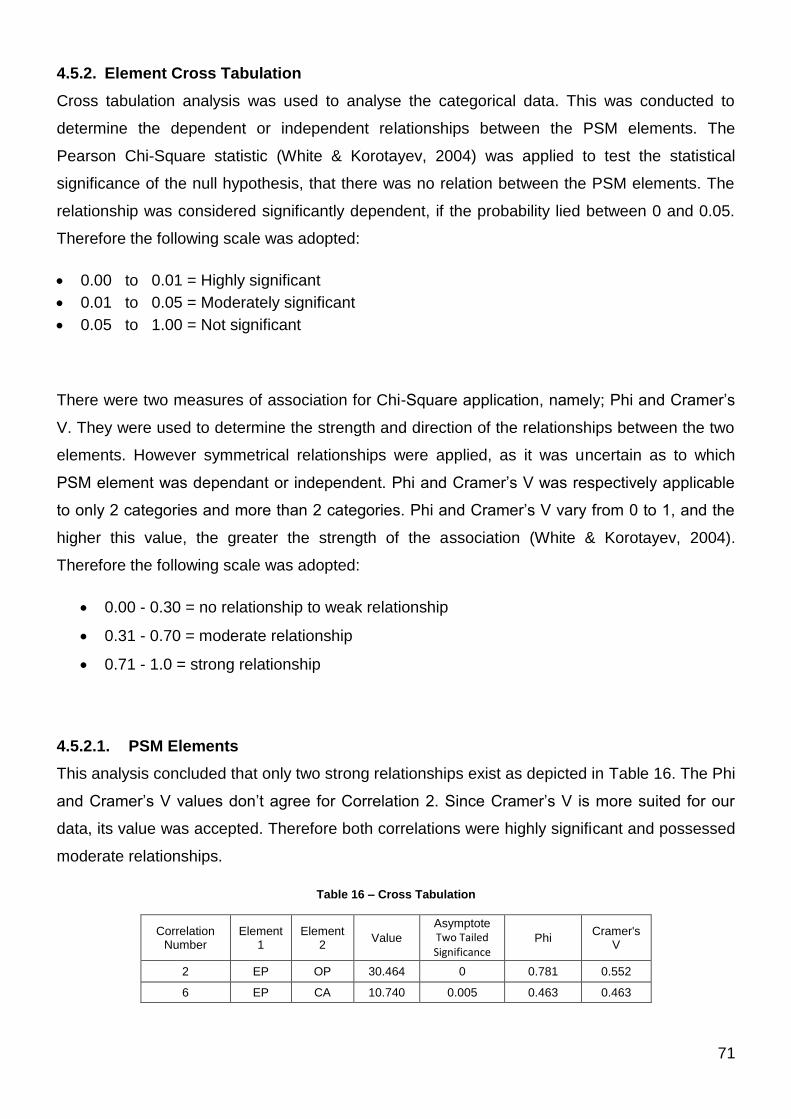
71
4.5.2. Element Cross Tabulation
Cross tabulation analysis was used to analyse the categorical data. This was conducted to
determine the dependent or independent relationships between the PSM elements. The
Pearson Chi-Square statistic (White & Korotayev, 2004) was applied to test the statistical
significance of the null hypothesis, that there was no relation between the PSM elements. The
relationship was considered significantly dependent, if the probability lied between 0 and 0.05.
Therefore the following scale was adopted:
0.00 to 0.01 = Highly significant
0.01 to 0.05 = Moderately significant
0.05 to 1.00 = Not significant
There were two measures of association for Chi-Square application, namely; Phi and Cramer’s
V. They were used to determine the strength and direction of the relationships between the two
elements. However symmetrical relationships were applied, as it was uncertain as to which
PSM element was dependant or independent. Phi and Cramer’s V was respectively applicable
to only 2 categories and more than 2 categories. Phi and Cramer’s V vary from 0 to 1, and the
higher this value, the greater the strength of the association (White & Korotayev, 2004).
Therefore the following scale was adopted:
0.00 - 0.30 = no relationship to weak relationship
0.31 - 0.70 = moderate relationship
0.71 - 1.0 = strong relationship
4.5.2.1. PSM Elements
This analysis concluded that only two strong relationships exist as depicted in Table 16. The Phi
and Cramer’s V values don’t agree for Correlation 2. Since Cramer’s V is more suited for our
data, its value was accepted. Therefore both correlations were highly significant and possessed
moderate relationships.
Table 16 – Cross Tabulation
Correlation Number
Element 1
Element 2
Value
Asymptote Two Tailed Significance
Phi Cramer's
V
2 EP OP 30.464 0 0.781 0.552
6 EP CA 10.740 0.005 0.463 0.463

72
The cross tabulation correlations 2 and 6 reaffirmed and built on the Spearman’s rho
correlations. As previously discussed, these correlations agreed with literature. Again no
relationships were observed between the CA and OP elements, which endorsed its respective
dependence on the EP element.
4.5.2.2. Pre and Post OSHA PSM Implementation Comparison
A statistical analysis was conducted to determine if any relationship existed per PSM element
against pre and post implementation of the OSHA standard. Three PSM elements are identified
with relationships as shown in Table 17.
Table 17 – OSHA Implementation Comparison
PSM Element Asymptote Two
Tailed Significance
Phi Cramer's V
EP 0.040 0.358 0.358
CTR 0.009 0.481 0.481
EPR 0.009 0.480 0.480
Both CTR and EPR were highly significant correlations with moderate relationships. EP was
moderately significant with a moderate relationship. The Phi and Cramer’s V values for all three
elements were also equal.
The observed distribution as indicated in Figure 20 confirms the CTR and EPR elements’
relationship. MI was also prominent in this distribution, however no relation was observed in the
cross tabulation. In accordance with the NOPSA, Global Congress on Process Safety, CCPS
Vision 2020 and Metric Alignment Initiative review, only EP was considered to agree in
literature. However CTR was found to be inclusive of EP (McCavit et al., 2013). Therefore EP
and CTR relationships were confirmed by literature.
4.5.2.3. Five Yearly OSHA PSM Comparison
Another statistical analysis was conducted to determine if any relationship existed per PSM
element, at its respective five yearly intervals, post implementation of the OSHA standard. Only

73
the CTR element features in this statistical analysis, as a highly significant and strong
relationship as shown Table 18.
Table 18 – Five Yearly Comparisons
PSM Element
Asymptote Two Tailed Significance
Phi Cramer's V
CTR 0.003 0.769 0.444
Figure 22 illustrates that the EP, PSI, PHA, OP, CTR, MI and EPR possess a strong
distribution. The CTR relationship was attributed to increased focus or enhanced management.
NOPSA (2009) agreed with this relationship, as CTR was a focus area.
4.5.2.4. Element Dependencies
It is evident from the aforementioned statistical analysis, that significant relationships were
observed with the EP and PSI elements. These element dependencies, as indicated in Table
15, are discussed and interpreted against literature. Therefore EP correlated with the OP, CTR
and CA elements. While PSI correlated with the PSSR, HWP and EPR elements. Bickford
(2013) alluded to a relationship between the EP and MI elements. However this dependency
between EP and MI was not observed.
Similarly, Perez (2011) described the importance of the plant engineers’ role in PSM. Plant
engineers were required to facilitate and/or participate in the PSM elements, such as PHA, MI
and MOC. In order to effectively complete this, these plant engineers needed to be trained and
competent. Therefore crucial missing links was that PSI related to EP and TR. However it was
the human that identified and populated the PSI and executed the PSSR and HWP element
tasks.
Soczek (2010: 2) stated that, “It is important to note that successful implementation of PSM
alone cannot guarantee success in eliminating major incidents and achieving a culture of safety.
Actions of people are critically important”. Thus these aforementioned elements were concluded
to also depend on the EP element. Consequently, more emphasis was placed to identify the
constraints of the EP element.

74
The EP element was considered to embody human factors. As discussed by Bridges and Tew
(2010), process safety was concerned over controlling risk of errors and failures. Related to this
risk, was the risk of human error. Human factors played a crucial role in process safety as it was
the foundation of each element. Knegtering (2002) confirmed the interrelations of the PSM
elements.
Bridges and Tew (2010) further stated that human factors were instrumental in nearly all of the
major accidents over the past thirty years. Figure 25 illustrates the different management
systems that involved the control of human errors. It illustrated the implementation level
relationship of; OP to Procedures and Training, CTR was related to Behavioural Habit Control
and CA related to Audits and Performance Measurement.
Figure 25 – Controlling Human Factor Errors (Bridges & Tew, 2010)
Therefore the author used literature to confirm the dependency of EP in relation to OP, CTR
and CA. Bridges and Tew (2010) specified that a PSM model should incorporate a dedicated
human factor element, as this placed emphasis on its importance. In Chapter 2, many newer
PSM models were observed to include a human factor element. Therefore the Risk Based PSM
framework model was best suited to this approach.

75
Literature was investigated to determine the cause for the EP element failure. The EPSC (2012)
published insights into the importance of the cultural aspects of PSM. Investigations into
disasters were attributed by the action or inaction of the people operating the system (EPSC,
2012).
Figure 26 – Behavioural Model (EPSC, 2012)
The above model, Figure 26, depicts the misconception that recruiting competent employees
will result in adherence to the management systems. This agreed with the study, as no
relationship between OP and TR was observed. Essentially, this model indicated that there are
gaps that can emerge in the way in which a workforce behaved and how the managers and the
business expected the workforce to conduct itself (EPSC, 2012).
These gaps are classified into five parameters of safety culture (EPSC, 2012) as illustrated in
Table 19. Therefore the challenge to align all employees toward a uniform safety culture arose
due to the diverse backgrounds of the employees, in terms of social and educational
background. EPSC (2012) stated there was a direct relationship between recruiting a new
employee and instilling a positive safety culture, as after time that worker adopted the safe
working behaviours.

76
Table 19 – Five parameters of safety culture (EPSC, 2012)
In summary, EP was concluded to form the foundation of an effective PSM program. However a
safety culture was imperative to ensure that EP was entrenched in a company. As illustrated in
Figure 27, Den Bakker (2012) defines the journey to PSM with the commencement of a
pathological and reactive level. Thereafter this transitioned into a calculative level in which
efforts resulted in the adherence to minimum requirements. This was considered as the
implementation phase. However in order to sustain the program, proactive and generative
levels were deemed essential to achieve desired PSM performance.
Elke (n.d: 2) stated that, “Management commitment, process safety information and hazard
identification are the core elements in a successful safety management program. However, an
effective Process Safety Management Program requires a systematic evaluation of the whole
process”. Therefore the PSM performance could decline, if the system was not diligently
monitored and tracked. Consequently, Den Bakker (2012) described that a PSM system
required explicit sustainability to assure it was effectively embedded in leadership, people,
process, structures and culture. Canso (2008) also agreed with the importance of safety culture.
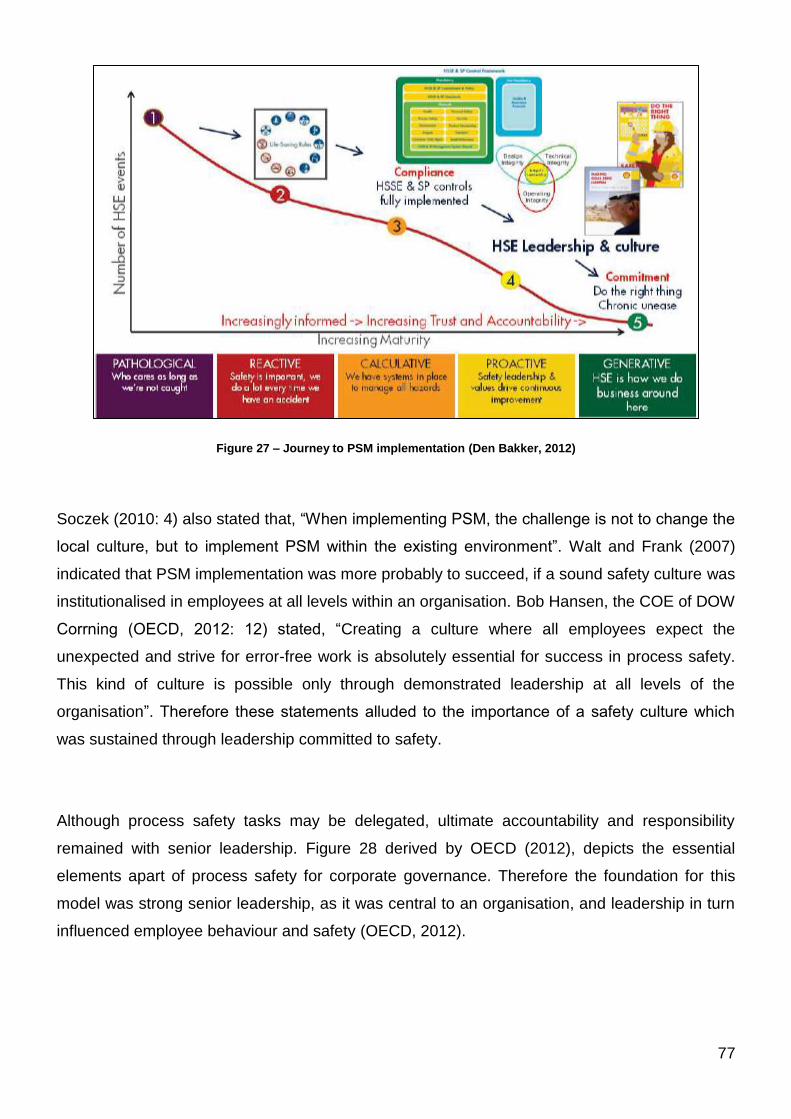
77
Figure 27 – Journey to PSM implementation (Den Bakker, 2012)
Soczek (2010: 4) also stated that, “When implementing PSM, the challenge is not to change the
local culture, but to implement PSM within the existing environment”. Walt and Frank (2007)
indicated that PSM implementation was more probably to succeed, if a sound safety culture was
institutionalised in employees at all levels within an organisation. Bob Hansen, the COE of DOW
Corrning (OECD, 2012: 12) stated, “Creating a culture where all employees expect the
unexpected and strive for error-free work is absolutely essential for success in process safety.
This kind of culture is possible only through demonstrated leadership at all levels of the
organisation”. Therefore these statements alluded to the importance of a safety culture which
was sustained through leadership committed to safety.
Although process safety tasks may be delegated, ultimate accountability and responsibility
remained with senior leadership. Figure 28 derived by OECD (2012), depicts the essential
elements apart of process safety for corporate governance. Therefore the foundation for this
model was strong senior leadership, as it was central to an organisation, and leadership in turn
influenced employee behaviour and safety (OECD, 2012).

78
Figure 28 – Essential PSM Elements (OECD, 2012)
Arising from legislation, an organisation’s management was held legally accountable for
process safety incident impacts (DuPont, 2008). McGrady (2013) indicated that nearly all safety
incidents arose from poor management. DuPont (2008) confirmed that major process incidents,
resulted from failures in management systems and control. MacDonald (n.d) also confirmed the
merits of Process Safety Leadership which was vital to a PSM program. Therefore fundamental
to EP was a strong safety culture which was sustained by committed leadership.

79
4.6. Limitations
Unfortunately abundant and comprehensive process safety incident investigative cause reports
were not freely available in literature. These causes were also seldom classified into direct, root
and contributing causes. Therefore many of the investigative reports stated all causes with no
distinction between the levels of causation.
Generally only major process safety incidents, namely Level 1 incidents, were investigated at
depth and reports published with the aforementioned cause categories. The other process
safety incidents with severity levels of 2, 3 and 4, could have been thoroughly investigated,
however these reports were not published and available for public access.
Near miss incidents were generally not published or investigated in sufficient detail. Further past
incident investigative reports were not available or published at depths as compared to more
recent incident investigative reports.
4.7. Case Study Findings
The identification of major industrial role players that employed PSM, assisted in gauging how
established companies selected their most effective implementation. Therefore these case
studies served as a means to validate the previously discussed findings. The petroleum industry
was investigated and the following companies were selected; Sasol, Shell and British Petroleum
(BP). These companies were found to openly publish their PSM implementation programs as
well as statistics indicating their safety performance.
4.7.1. Sasol
PSM was implemented in each of their ventures. Sasol focused on highlighting two PSM
elements in their annual reports, namely; PHA and Incident Management. They stated that PHA
studies were undertaken and that all significant safety incidents are reported and thoroughly
investigated (Sasol, 2012).
External safety compliance audits were a part of Sasol’s strategy to identify gaps and improve
PSM effectiveness. DuPont conducted such a PSM audit on Sasol in 2005. Only selected South
80
African operational facilities were a part of this audit scope. DuPont’s PSM model as described
in Chapter 2, was used to evaluate Sasol’s OSHA derived PSM program (DuPont, 2005).
DuPont (2005) recognised the management teams of Sasol for their commitment and safety
culture in improving safety performance on the different sites. They discovered that PSM was
implemented to varying degrees amongst Sasol’s operational facilities. Therefore DuPont
(2005) prescribed sustained efforts and periodic internal compliance audits. DuPont (2005)
identified areas of improvement in Sasol’s developed best practices, namely; zero tolerance,
hazard identification, internal/ external resource competence.
Sasol’s Chief Executive Officer (CEO) attributed the company’s long term success on the safety
behaviours from their employees (Sasol, 2012). However the 2012 safety performance
indicated a decline in the quantity of significant Fires, Explosions and Releases (FER), to 42
compared with 52 in 2011 (Sasol, 2012). In 2010 this figure stood at 60 which was directly on
Sasol’s target, however the succeeding years depicted Sasol not achieving their respective
targets of 50 and 35 in 2011 and 2012 (Sasol, 2012). Therefore marginal improvements were
noted in the safety performance of Sasol over the last 2 years. Thus Sasol’s CEO assured
commitment to excel on this performance (Sasol, 2012).
4.7.2. British Petroleum (BP)
BP stated that they were serious about the welfare of their staff and strived to create and
maintain safe and healthy working environments (BP, 2013b). BP committed to prevent,
mitigate and ensure preparedness to respond to incidents across all operations. The
foundations of BP’s risk and safety management approaches was based on the learning derived
from the Texas City refinery explosion in 2005, Deepwater Horizon oil spill in 2010, other
incident investigation, audits and risk reviews (BP, 2013b).
BP also focused on the application of the processes and practices by the employees, as it
ensured the strength of the safety culture and workforce capability. Therefore Leadership and
Culture was one of the imperatives for BP’s operational leaders to excel as safety leaders. This
included developmental programmes on operating management system, process safety and
risk and safety leadership for all leaders (BP, 2013b). There were three different types of

81
programmes, namely; Operations Academy, Managing Operations and Operating Essentials
ranging respectively from Senior level leaders to Mid-level leaders and Frontline leaders.
BP measured a number of process safety metrics, however reported API tier 1 and tier 2
process safety events. BP (2013c) described the tier 1 events as, “the losses from primary
containment, from a process of greatest consequence causing harm to a member of the
workforce or costly damage to equipment, or exceeding defined quantities’’. This was
considered as level 1 and 2 process safety incidents. Similarly BP (2013c) described the tier 2
events as, the “losses of primary containment, from a process, of lesser consequence’’. This
was considered as level 3 and 4 process safety incidents.
In 2012, BP reported 43 tier 1 process safety events as compared to a more consistent 74
events reported in 2010 and 2011 (BP, 2013c). There were 154 tier 2 safety events reported for
2012 (BP, 2013c). This was the first year that BP reported tier 2 events externally; therefore no
prior company history was available.
4.7.3. Shell
Shell (2010) believed that given the nature of the risks associated with their operation, safety
and integrity of their assets was of paramount to them. This company simplified process safety
as essentially being composed of; ensuring facilities are well designed, safely operated,
properly inspected and properly maintained. Shell also strived to prevent safety incidents to
employees, facilities, neighbours and the environment (Shell, 2010).
Since 2006, Shell invested $6 Billion in a PSM programme to improve the safety of their
facilities (Shell, 2012a). Regular training was a key aspect of this programme for employees,
whom managed and operated their facilities. Further Shell invested about $1 Billion in the safety
and reliability of the refineries, chemical plant and distribution facilities (Shell, 2012a).

82
Table 20 – HSSE PSM Framework (Den Bakker, 2012)
A Health, Security, Safety and the Environment (HSSE) framework was initiated by Shell in
2009 (Shell, 2010). It included all past standards and manuals and was a mandatory source for
rules covering process safety. This framework is composed of 22 elements as depicted in Table
20. Shell (2010) further devised 4 pillars of integrity, which encompassed process safety
management. They include Design Integrity, Technical Integrity, Operating Integrity and
Leadership Integrity as illustrated in Figure 29.
Figure 29 – Shell’s PSM Overview (Den Bakker, 2012)
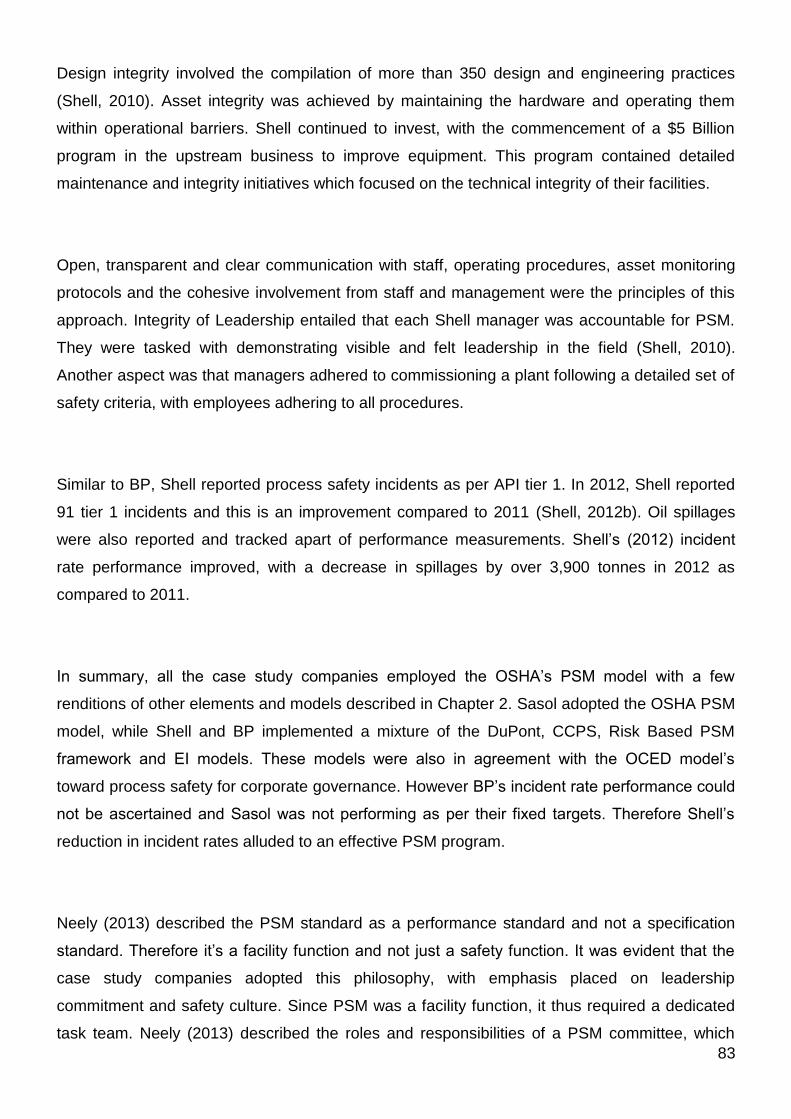
83
Design integrity involved the compilation of more than 350 design and engineering practices
(Shell, 2010). Asset integrity was achieved by maintaining the hardware and operating them
within operational barriers. Shell continued to invest, with the commencement of a $5 Billion
program in the upstream business to improve equipment. This program contained detailed
maintenance and integrity initiatives which focused on the technical integrity of their facilities.
Open, transparent and clear communication with staff, operating procedures, asset monitoring
protocols and the cohesive involvement from staff and management were the principles of this
approach. Integrity of Leadership entailed that each Shell manager was accountable for PSM.
They were tasked with demonstrating visible and felt leadership in the field (Shell, 2010).
Another aspect was that managers adhered to commissioning a plant following a detailed set of
safety criteria, with employees adhering to all procedures.
Similar to BP, Shell reported process safety incidents as per API tier 1. In 2012, Shell reported
91 tier 1 incidents and this is an improvement compared to 2011 (Shell, 2012b). Oil spillages
were also reported and tracked apart of performance measurements. Shell’s (2012) incident
rate performance improved, with a decrease in spillages by over 3,900 tonnes in 2012 as
compared to 2011.
In summary, all the case study companies employed the OSHA’s PSM model with a few
renditions of other elements and models described in Chapter 2. Sasol adopted the OSHA PSM
model, while Shell and BP implemented a mixture of the DuPont, CCPS, Risk Based PSM
framework and EI models. These models were also in agreement with the OCED model’s
toward process safety for corporate governance. However BP’s incident rate performance could
not be ascertained and Sasol was not performing as per their fixed targets. Therefore Shell’s
reduction in incident rates alluded to an effective PSM program.
Neely (2013) described the PSM standard as a performance standard and not a specification
standard. Therefore it’s a facility function and not just a safety function. It was evident that the
case study companies adopted this philosophy, with emphasis placed on leadership
commitment and safety culture. Since PSM was a facility function, it thus required a dedicated
task team. Neely (2013) described the roles and responsibilities of a PSM committee, which
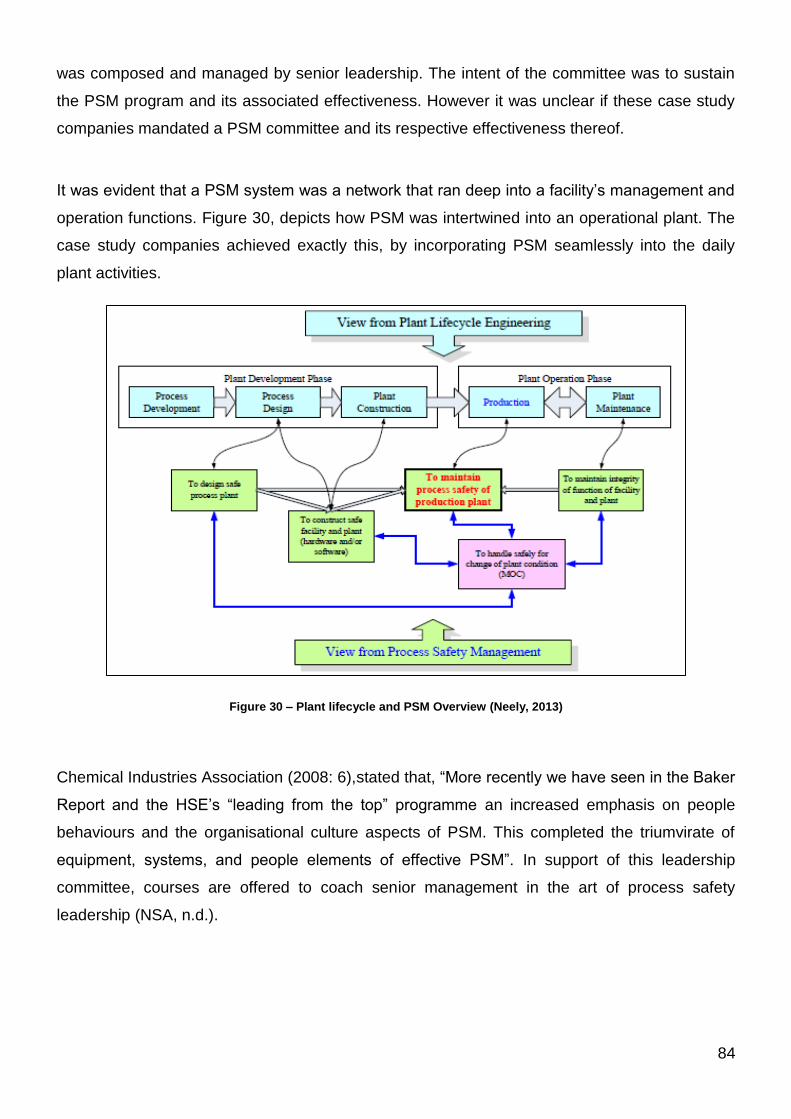
84
was composed and managed by senior leadership. The intent of the committee was to sustain
the PSM program and its associated effectiveness. However it was unclear if these case study
companies mandated a PSM committee and its respective effectiveness thereof.
It was evident that a PSM system was a network that ran deep into a facility’s management and
operation functions. Figure 30, depicts how PSM was intertwined into an operational plant. The
case study companies achieved exactly this, by incorporating PSM seamlessly into the daily
plant activities.
Figure 30 – Plant lifecycle and PSM Overview (Neely, 2013)
Chemical Industries Association (2008: 6),stated that, “More recently we have seen in the Baker
Report and the HSE’s “leading from the top” programme an increased emphasis on people
behaviours and the organisational culture aspects of PSM. This completed the triumvirate of
equipment, systems, and people elements of effective PSM”. In support of this leadership
committee, courses are offered to coach senior management in the art of process safety
leadership (NSA, n.d.).
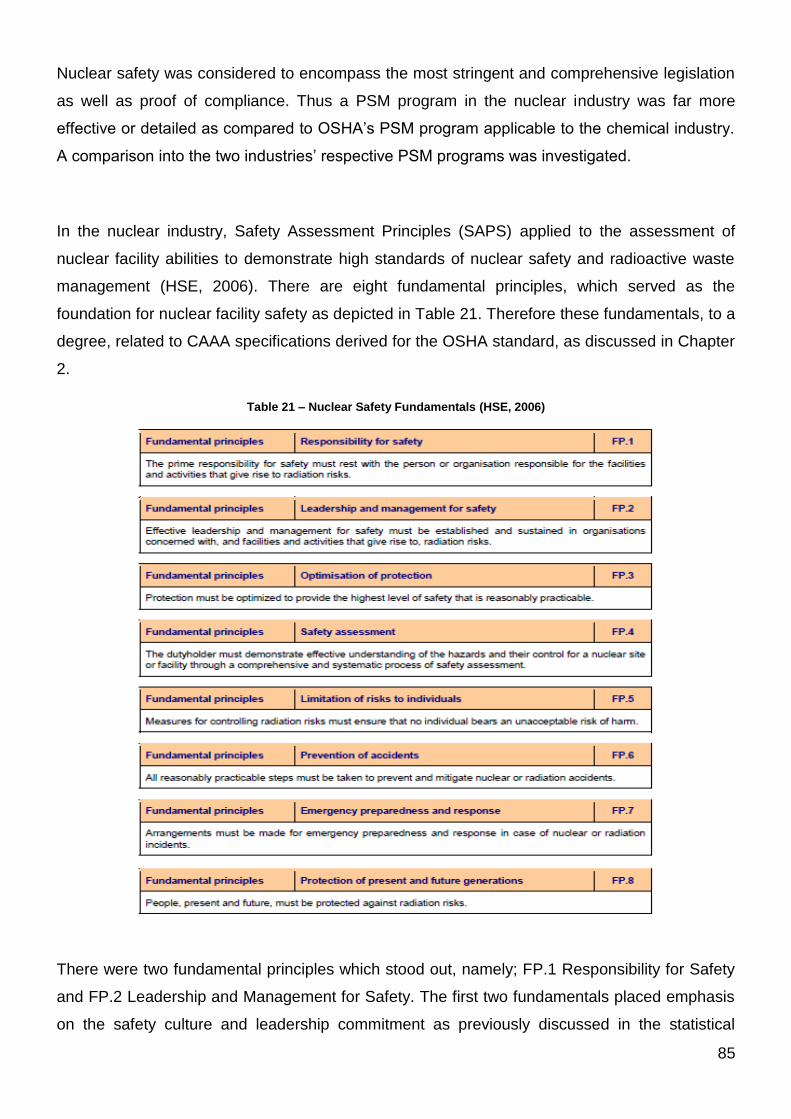
85
Nuclear safety was considered to encompass the most stringent and comprehensive legislation
as well as proof of compliance. Thus a PSM program in the nuclear industry was far more
effective or detailed as compared to OSHA’s PSM program applicable to the chemical industry.
A comparison into the two industries’ respective PSM programs was investigated.
In the nuclear industry, Safety Assessment Principles (SAPS) applied to the assessment of
nuclear facility abilities to demonstrate high standards of nuclear safety and radioactive waste
management (HSE, 2006). There are eight fundamental principles, which served as the
foundation for nuclear facility safety as depicted in Table 21. Therefore these fundamentals, to a
degree, related to CAAA specifications derived for the OSHA standard, as discussed in Chapter
2.
Table 21 – Nuclear Safety Fundamentals (HSE, 2006)
There were two fundamental principles which stood out, namely; FP.1 Responsibility for Safety
and FP.2 Leadership and Management for Safety. The first two fundamentals placed emphasis
on the safety culture and leadership commitment as previously discussed in the statistical

86
analysis. INSAG (1991: 1) defined a safety culture as, “that assembly of characteristics and
attitudes in organizations and individuals which establishes that, as an overriding priority,
nuclear plant safety issues received the attention warranted by their significance”.
Therefore these two fundamentals alluded to the importance of the EP element. HSE (2011)
confirmed the importance of EP, by requesting enhanced commitment from leadership. Further
the common themes from the PSM models survey in Chapter 2, agreed with the imperativeness
of a safety culture and leadership aspects. Therefore literature verified the requirement of a
safety culture and leadership commitment in a PSM model.
At the core of these case study companies’ PSM model, was the inclusion of a safety culture
and leadership commitment. This validated the statistical analysis, whereby EP was found to be
central to a PSM program. The EP and CTR elements involved the human aspect. Therefore an
EP and CTR element dependency was devised and proposed as illustrated in Figure 31.
Figure 31 – PSM element dependency
This element dependency culminated from all the study findings and reviewed literature. The
next chapter concluded on the findings as previously conversed. The study’s goals and
associated effectiveness was discussed. Recommendations from this study were also
prescribed.

87
Chapter 5: Conclusions and Recommendations
5.1. Introduction
In this chapter the conclusions are presented based on the objectives and aim as set out in
Chapter 1. This was conducted employing the study findings attained and their associated
comparison and verification to literature. Further study recommendations are proposed based
on the study limitations and conclusions as discussed. These recommendations are postulated
to uplift the merits of this study alluding to more defined findings.
5.2. Objectives
There were four objectives set forth for this study as follows:
1. To determine the PSM elements that significantly contributed to the occurrence of
process safety incidents
2. To identify the PSM elements’ failures that resulted in process safety incidents
3. To identify any relationships between the PSM elements in order to improve
implementation effectiveness
4. To perform case study analysis on three international companies’ approach to PSM
NOPSA, Global Congress on Process Safety, NEP, CCPS Vision 2020 and the Metric
alignment initiative placed focus on the following overlapping OSHA elements, namely; MI, TR,
EP and the II. However only the MI element was concluded to arise as a significant focus area
as verified by literature. Therefore objective 1 was achieved as MI was found to significantly and
consistently contribute to process safety incidents. Similarly objective 2 was completed, as
further analysis into MI concluded that equipment or control failure was the significant cause.
Techniques to improve the MI element were described by Peon (2008) and OGP (2008).
Objective 3 was also achieved, as literature was found to verify the dependency of OP, CTR
and CA to EP and of PSSR, HWP and EPR to PSI. PSI was also deemed dependant on EP,
which was not evident in the study, however was confirmed by literature. Two strong themes
emerged from the literature, namely; safety culture and leadership commitment. These themes
involved a key PSM element, which was the EP element. Therefore EP was confirmed to be
foundation of a PSM program.

88
The case studies validated the findings from objective 3. An effective PSM program was
observed by Shell and BP, as they incorporated the aforementioned themes into their PSM
model. Therefore objective 4 was also achieved.
5.3. Aim
The aim of this study was to determine the most effective approach to implement and sustain
PSM in an organisation to prevent and manage the occurrence of major industrial catastrophes.
As previously deliberated, the statistical analysis verified by literature, indicated that the EP
element was the foundation for the other elements. Literature also confirmed that the safety
culture and leadership commitment aspects were imperative in order to achieve an effective and
sustainable PSM program. This was validated by the case study analysis. The following PSM
models from Chapter 2 were observed to contain these aspects, namely; DuPont, CCPS, Risk
Based PSM framework and EI models.
These models were quite comprehensive and also incorporated the OSHA’s PSM model. The
TS element was confirmed as an insignificant element as it was included in PSI. As previously
discussed in Chapter 4, the strength of the study methodology by employing the OSHA PSM
model was confirmed. Therefore an effective approach was considered to employ OSHA’s
thirteen elements, with the exception of TS, and incorporation of the safety culture and
leadership commitment aspects. Thus the most effective approach to implement and sustain
PSM was to adopt the DuPont, CCPS, Risk Based PSM framework or EI models. To conclude,
this study was effective as all the objectives and the aim was achieved.
5.4. Recommendation to improve this study
A safety culture and leadership commitment was concluded to be fundamental in an effective
and sustainable PSM program. The DuPont, CCPS, Risk Based PSM framework and EI models
were determined to best incorporate these fundamentals. Therefore the recommendation was to
determine how these fundamental aspects can be entrenched into an organisation. Further, a
new PSM program could be proposed, incorporating these fundamental aspects that would
achieve an effective and sustainable PSM program.

89
5.5. Recommendations for further research
This study population was casted over a broad network of industries. The intention was to find
common element constraints and relationships applicable to a wide group of industries. This
would assure a uniform “one way” approach to sustainable PSM.
As deliberated in Chapter 4, there were many limitations to this study. The recommendation to
improve the strength of this study; is to analyse incidents post millennium with particularly focus
on incidents post 2005. Due to restrained competence and knowledge of PSM pre millennium,
comprehensive cause analysis was not adequately defined. Divulging into cause analysis
depths, namely; direct causes, root causes and contributing causes would uplift the detail and
findings of this study.

90
List of References
ABB, 2012. Process Safety Management. ABB Brochure.
ABB, 2013. Process Safety Management Best Practice. ABB Consulting.
AcuSafe, 2002. Update on Phillips 66 K-Resin Plant Incident. [Online] Available at:
http://www.acutech-consulting.com/acusafe/Newsletter/Stories/0500News-Phillips.htm
[Accessed 3 September 2013].
Akiyama, N., 2012. The Fukushima Nuclear Accident and Crisis Management. Tokyo: The
Sasakawa Peace Foundation.
AlChE, 2012. History. American Institute of Chemical Engineers.
Almanac of Policy Issues, 2002. Accident at Three Mile Island. [Online] Available at:
http://www.policyalmanac.org/environment/archive/three_mile_island.shtml [Accessed 9 July
2013].
ARIA, 2007. Explosion in a Fertilizer Plant - September 21st, 2001. French Ministry of the
Environment, pp.1-12.
ARIA, 2008. Catastrophic Explosion of a Cyclohexane Cloud. Ministry of the Environment,
(5611), pp.1-9.
BAPE, 2004. Algerian LNG Plant Explosion. Energy Commission.
Barab, J., 2012. OSHA’s Refinery and Chemical National Emphasis Programs. USDOL-OSHA
Directorate of Enforcement Programs.
BBC, 2012a. 1986: Chemical spill turns Rhine red. [Online] Available at:
http://news.bbc.co.uk/onthisday/hi/dates/stories/november/1/newsid_4679000/4679789.stm
[Accessed 4 October 2013].
BBC, 2012b. Chevron Blast: Two questioned over Pembroke Refinery Deaths. [Online]
Available at: http://www.bbc.co.uk/news/uk-wales-south-west-wales-16949100 [Accessed 2
September 2013].
Beitler, S., 2008. Romeoville, IL Refinery Explosions, July 1984. [Online] Available at:
http://www3.gendisasters.com/illinois/6895/romeoville-il-refinery-explosions-july-1984
[Accessed 10 July 2013].
Bickford, A., 2013. Process Safety/Operational Stewardship.
BLS, 2013. Industries at a Glance. [Online] Bureau of Labor Statistics (BLS) Available at:
http://www.bls.gov/iag/tgs/iag31-33.htm [Accessed 10 September 2013].
91
BP, 2013a. BP at a Glance. [Online] Available at:
http://www.bp.com/sectiongenericarticle.do?categoryId=3&contentId=2006926 [Accessed 30
March 2013].
BP, 2013b. Claims Information. [Online] Available at: http://www.bp.com [Accessed 13 June
2013].
BP, 2013c. Safety Performance. [Online] Available at:
http://www.bp.com/sectiongenericarticle800.do?categoryId=9048961&contentId=7083156
[Accessed 30 March 2013].
Bradshaw, W.M.B., 2012. Process Safety Management. ABS Consulting.
Bravo, L., n.d. Conclusions Drawn from the Toulose Accident: Application to Loss Estimation for
Explosions. Trebol, pp.4-7.
Bridges, W. & Tew, R., 2010. Human Factors Elements Missing from Process Safety
Management (PSM). Process Improvement Institute.
Burns, S., 2010. Hungarian Alumina Refinery Disaster. [Online] Available at:
http://agmetalminer.com/2010/10/07/hungarian-alumina-refinery-disaster-what-exactly-this-red-
mud/ [Accessed 3 September 2013].
Canso, 2008. Safety Culture Definition and Enhancement Process. Civil air navigation services
organisation (CANSO).
CBC, 2013. Toronto Propane Firm Guilty In Fatal 2008 Blast. [Online] Available at:
http://www.cbc.ca/news/canada/toronto/toronto-propane-firm-guilty-in-fatal-2008-blast-
1.1301145 [Accessed 3 September 2013].
CCPS, 2005. Piper Alpha Case History. Center for Chemical Process Safety of the ALChE,
pp.1-6.
Chartered Technofunctional Institute, 2012. Sector Chemical Industry. [Online] Available at:
http://www.technofunc.com/index.php/domain-knowledge/chemicals-industry/item/sectors-of-
chemical-industry [Accessed 9 September 2013].
Chemical, I.A., 2008. Process safety leadership in the chemicals industry.
Chilworth, 2010. A strategic guide to process safety. Chilworth Technology Ltd.
China Labour Bulletin, 2003. Gas Well Accident Kills at Least 191 People in the Chuandongbei
Gas Field. [Online] Available at: http://www.clb.org.hk/en/content/gas-well-accident-kills-least-
191-people-chuandongbei-gas-field [Accessed 3 September 2013].
CMA, 1985. Process Safety Management (Control of Acute Hazards). Chemical Manufacturers
Association.
CNN, 2010. Five killed in Connecticut power plant blast. [Online] Available at:
http://edition.cnn.com/2010/US/02/07/connecticut.explosion/ [Accessed 9 October 2013].
COMAH, n.d. Buncefield: Why Did It Happen? Control of Major Accident Hazards, pp.1-36.

92
CSB, 2004. West Pharmaceutical Services Dust Explosion and Fire. [Online] Available at:
http://www.csb.gov/west-pharmaceutical-services-dust-explosion-and-fire [Accessed 9 October
2013].
CSB, 2012. Home. [Online] Available at: http://www.csb.gov [Accessed 12 October 2013].
CSHIB, 2001. Investigation Report - Refinery Fire Incident. US Chemical Safety and Hazard
Investigation Board, pp.1-72.
CSHIB, 2005. CSB Considers National Safety Issues as West Pharmaceutical Investigation
Continues One Year after Explosion. [Online] Available at: http://www.csb.gov/csb-considers-
national-safety-issues-as-west-pharmaceutical-investigation-continues-one-year-after-
explosion/ [Accessed 3 September 2013].
CSHIB, 2007. Investigation Report - Refinery Explosion and Fire. US Chemical Safety and
Hazard Investigation Board, pp.1-341.
CSHIB, 2008. CSB Investigation into Massive 2006 CAI Explosion in Danvers, Massachusetts.
[Online] Available at: http://www.csb.gov/csb-investigation-into-massive-2006-cai-explosion-in-
danvers-massachusetts-concludes-lack-of-company-safeguards-allowed-solvent-vapor-to-
accumulate-when-ink-mixing-tank-was-left-heating-overnight/ [Accessed 3 September 2013].
CSHIB, 2009. Investigation Report - Sugar Dust Explosion and Fire. US Chemical Safety and
Hazard Investigation Board, pp.1-90.
CSHIB, 2010. Urgent Recommendations. US Chemical Safety and Hazard Investigation Board,
pp.1-20.
CSHIB, 2013. History. [Online] Available at: http://www.csb.gov [Accessed 30 March 2013].
Den Bakker, K., 2012. Process Safety Management – A Journey Towards Operational
Excellence in LNG. Shell Global Solutions International B.V.
Dugal, J., 1999. Guadalajara Gas Explosion Disaster. [Online] Available at:
http://www.drj.com/drworld/content/w2_028.htm [Accessed 2 September 2013].
DuPont, 2005. Key Findings & Recommendations from External Process Safety Management &
Occupational Safety Management review of Sasol Operations(South Africa).
DuPont, 2008. Operating on the Edge, Process Safety Management.
DuPont, 2013. A World Leader in Market-Driven Innovation and Science. [Online] E.I. du Pont
de Nemours and Company Available at: http://www2.dupont.com/corp/en-us/our-
company/index.htm [Accessed 30 March 2013].
Durando, J., 2009. BP: 'Sequence of failures' Caused Gulf oil spill. [Online] Available at:
http://content.usatoday.com/communities/greenhouse/post/2010/09/bp-oil-spill-report/1
[Accessed 3 September 2013].
Dutta, S., 2002. The Bhopal Gas Tragedy. ICFAI Center for Management Research, 702-006,
pp.1-9.

93
Eames, P., 2010. The Challenge of Dealing with Recommendations from Process Safety
Reviews of Existing Assets. In Energy Institute Process Safety Management Conference.
London, 2010. ABB Global Consulting.
Ecodefence, 2011. Chernobyl: Chronology of a Disaster. World Information Service on Energy,
724.
Edelparke, 2010. Basel, Switzerland November 1986.
EI, 2010. High Level Framework for Process Safety Management. London: Energy Institute.
Elke, H.C., n.d. Global Application of the Process Safety Management Standard.
EPA, 1998. Tosco Avon Refinery Martinez. EPA Chemical Accident Investigation Report, pp.1-
105.
EPA, 1999. Chapter 7, Prevention Program ( Program 3).
EPA, 2011. Guidance for Conducting Risk Management Program Inspections under Clean Air
Act Section 112(r).
EPA, 2013. AP 42, Fifth Edition, Volume 1 Chapter 12: Metallurgical Industry. [Online]
Technology Transfer Network Available at: http://www.epa.gov/ttn/chief/ap42/ch12/ [Accessed
09 September 2013].
EPSC, 2012. Process Safety Culture, Position Paper. European Process Safety Centre.
ERCB, 1980. Pipeline failure inquiry : Mill Woods area, Edmonton : Post-inquiry progress
review. Calgary: Energy Resources Conservation Board (ERCB).
ERCO, 1982. Ixtoc Oil Spill Assessment. Cambridge, MA: Environmental Sciences Division.
Explosions Hazards Ltd, 2011. The Risks of Explosion. [Online] Available at:
http://www.explosionhazards.co.uk/the-risks-of-explosion [Accessed 3 September 2013].
Fact Sheets, 2010. Nuclear Energy Institute. [Online] Available at: http://www.nei.org/Master-
Document-Folder/Backgrounders/Fact-Sheets/The-Tmi-2-Accident-Its-Impact-Its-Lessons
[Accessed 9 July 2013].
FEMA, 2009. Puerto Rico Explosions and Fire (EM-3306). [Online] Available at:
http://www.fema.gov/disaster/3306 [Accessed 3 September 2013].
Globe, 2006. Explosion rocks Danvers, Several Hurt. [Online] Available at:
http://www.boston.com/news/local/massachusetts/articles/2006/11/22/explosion_rocks_danvers
_several_hurt_none_seriously/ [Accessed 3 September 2013].
Goodman, P.S., 2003. 191 Killed In China Gas Field Explosion. [Online] Available at:
http://www.wsws.org/en/articles/2003/12/chin-d31.html [Accessed 3 September 2013].
Groves, A., 2006. Union Oil Company Refinery Fire, Romeoville: July 23, 1984.
Hackitt, J., 2008. The Buncefield Incident 11 December 2005. 1st ed. Crown.
94
Harstad, E. & Pitblado, R., 2008. Converting Major Hazards into Minor Risks – A 21st Century
Approach. 19th World Petroleum Congress.
Hawksley, J.L., 1984. Proceedings of the CHEMRAWN III World Conference. The Hague.
HM, 1982. The explosion and fire at Chemstar Limited. London: Crown.
Hoffman, C., 2013. Oil Rig Explosion Was Likely a Blowout. [Online] Available at:
http://www.popularmechanics.com/science/energy/coal-oil-gas/bp-offshore-oil-rig-explosion
[Accessed 10 July 2013].
Hopkins, A., 2000. Lessons from Esso's Gas Plant Explosion at Longford. Longford: Australian
National University.
HSE, 1975. Flixborough (Nypro UK) Explosion 1st June 1974. [Online] Available at:
http://www.hse.gov.uk/comah/sragtech/caseflixboroug74.htm [Accessed 9 July 2013].
HSE, 1980. Pipeline Failure Inquiry -Mill Woods Area, Canada. March 1976. [Online] Available
at: http://www.hse.gov.uk/comah/sragtech/casemillwoods76.htm [Accessed 3 September
2013].
HSE, 1982. The Explosion and Fire at Chemstar Limited. 6th September 1981. [Online]
Available at: http://www.hse.gov.uk/comah/sragtech/casechemstar81.htm [Accessed 3
September 2013].
HSE, 1989. The Fire at BP Oil, Grangemouth Refinery. 13th March 1987. [Online] Available at:
http://www.hse.gov.uk/comah/sragtech/casebpgrang87b.htm [Accessed 2 September 2013].
HSE, 1993. Release of Chemicals from International Biosynthetics Limited. Widnes. 7th
December 1991. [Online] Available at:
http://www.hse.gov.uk/comah/sragtech/casebiosynthey91.htm [Accessed 10 July 2013].
HSE, 1996a. BASF, Wilton Teeside. 9th October 1995. [Online] Available at:
http://www.hse.gov.uk/comah/sragtech/casebasf95.htm [Accessed 3 September 2013].
HSE, 1996b. Explosion and Fire at DSM, Beek. 7th November 1975. [Online] Available at:
http://www.hse.gov.uk/comah/sragtech/casebeek75.htm [Accessed 3 September 2013].
HSE, 1996c. Explosion and Fire at Shell, Stanlow. 20th March 1990. [Online] Available at:
http://www.hse.gov.uk/comah/sragtech/casestanlow90.htm [Accessed 3 September 2013].
HSE, 1996d. Icmesa Chemical Company, Seveso, Italy. 10th July 1976. [Online] Available at:
http://www.hse.gov.uk/comah/sragtech/caseseveso76.htm [Accessed 9 July 2013].
HSE, 1996e. PEMEX LPG Terminal, Mexico City, Mexico. 19th November 1984. [Online]
Available at: http://www.hse.gov.uk/comah/sragtech/casepemex84.htm [Accessed 10 July
2013].
HSE, 1996f. Phillips 66, Pasadena, USA. 23rd October 1989. [Online] Available at:
http://www.hse.gov.uk/comah/sragtech/casepasadena89.htm [Accessed 10 July 2013].
95
HSE, 1996g. The Chemical Release and Fire at the Associated Octel Company Limited,
Ellesmere Port, Cheshire. 1st February 1994. [Online] Available at:
http://www.hse.gov.uk/comah/sragtech/caseoctel94.htm [Accessed 3 September 2013].
HSE, 1999. The Fire at Albright and Wilson, Avonmouth. 3rd October 1996. [Online] Available
at: http://www.hse.gov.uk/comah/sragtech/casealbright96.htm [Accessed 3 September 2013].
HSE, 2005. HSE Publishes Investigation Report into Major Incident at ConocoPhillips Humber
Refinery. [Online] Available at: http://www.hse.gov.uk/press/2005/e05159.htm [Accessed 3
September 2013].
HSE, 2006. Safety Assessment Principles for Nuclear Facilities. Health and Safety Executive
(HSE).
HSE, 2011a. Leading Health and Safety at Work, Leadership actions for directors and board
members. Institute of Directors and Health and Safety executive.
HSE, 2011b. Statistics. [Online] Available at: http://www.hse.gov.uk [Accessed 12 June 2013].
HSE, 2012. Guidance. [Online] Available at: http://www.hse.gov.uk [Accessed 12 October
2013].
HSE, n.d. a. Explosion and Fire: Chevron Pembroke Refinery, 2 June 2011. [Online] Available
at: http://www.hse.gov.uk/comah/chevron-refinery.htm [Accessed 2 September 2013].
HSE, n.d. b. Public Report of the Fire and Explosion at the Conocophillips Humber Refinery.
Health & Safety Executive, pp.1-30.
HSE, n.d. c. Rupture of a Liquid Nitrogen Storage Tank, Japan. 28th August 1992. [Online]
Available at: http://www.hse.gov.uk/comah/sragtech/caseliqnitro92.htm [Accessed 10 July
2013].
ICIS, 1991. Acetic acid impurity led to explosion, says Shell. [Online] Available at:
http://www.icis.com/Articles/1991/02/25/37367/acetic-acid-impurity-led-to-explosion-says-
shell.html [Accessed 9 October 2013].
INSAG, 1991. Safety Culture, Safety Series No. 75-INSAG-4. Vienna: International Nuclear
Safety Advisory Group.
IRC, 2006. A Manager’s Guide to Process Safety Management. The Industrial Refrigeration
Consortium.
Ixtoc Oil Spill, n.d. Causes. [Online] Available at: https://sites.google.com/a/asu.edu/ixtoc-oil-
spill/home/causes [Accessed 2 September 2013].
Jager, R., 2012. Preventing Process Safety Events in the New Zealand Oil and Gas Sector –
The Role for Senior Leaders. Shell Companies in New Zealand.
Javor, B. & Hargitai, M., eds., 2011. The Kolontar Report Causes and Lessons from the Red
Mud Disaster. Budapest.

96
Jianhong, L., 2007. Some Deaths are More Equal Than Others. In Accountability for Past
Injustices. pp.190-94.
Kalelkar, A.S. & Little, A.D., 1988. Investigation of Large-Magnitude Incidents: Bhopal as a
Case Study. London: Union Carbide Corp.
Kelly, B.D., 2010. Process Safety Management and its Impact on the Engineering Community.
BriRisk Consulting Ltd.
Kienbaum & SÜD, T., 2013. Process Safety Excellence.
Kinney, J.A. & Mosley, W.G., 1990. Death on a Job. The Multinational Monitor, 11(4).
KMS, n.d. Case Study - 1998 Esso Longford Gas Explosion. Knowledge Management Systems.
Knegtering, B., 2002. ISBN 90-386-1747-X Safety Lifecycle Management In The Process
Industries, The development of a qualitative safety-related information analysis technique.
Dissertation.
Kobayashi, H., n.d. Case Details. [Online] Available at:
http://www.sozogaku.com/fkd/en/cfen/CB1011017.html [Accessed 9 October 2013].
Kobayashi, M. & Tamura, M., n.d. Explosion of Chemical Plant in Seveso, Italy. Tokyo:
University of Tokyo.
Kraus, R.S., 2011. Developing a Process Safety Management Program. [Online] International
Labor Organisation Available at: http://www.ilo.org/oschenc/part-xii/chemical-processing/
[Accessed 30 September 2013].
Lax, S.K., Ljäs, A.S. & Leva, K.M.H., 2013. Good Practices for Managing Process Safety in
Major Hazard Installations and Their Networks. The Italian Association of Chemical Engineering
(AIDIC).
Lay, J., 2012. OSHA’s PSM Covered Chemical Facility National Emphasis Program. In Oil and
Gas Safety Conference., 2012. OSHA Office of Chemical Process Safety.
Legal Watch, 2004. Sub-contractors’ errors – who is responsible? [Online] Available at:
http://business.virgin.net/olwen.cox/pubs/A&W.htm [Accessed 9 October 2013].
Maher, S.T., 2011. Paradigm Shift in the Regulatory Application of Safety Management
Systems to Offshore Facilities. Chicago: 7th Global Congress on Process Safety.
Masher, S.T., Long, G.D. & Cromartie, R.S., 2011. Paradigm Shift in the Regulatory Application
of Safety Management Systems to Offshore Facilities. Chicago: 7th Global Congress on
Process Safety.
McCavit, J., Scott, B. & Nara, L., 2013. CCPS’s Vision 2020: Characteristics of Companies with
Great Process Safety Performance. AIDIC.
McDonald, G., n.d. Process Safety Leadership. Health and Safety Executive (HSE).

97
McGrady, S., 2013. How Good Process Safety Management Makes Good Sense – Reflections
on GSK’s Process Safety Journey. GlazoSmithKline.
Mishra, K.B., Wehrstedt, K.D. & Krebs, H., 2012. Lessons Learned from Recent Fuel Storage
Fires. International Conference on Combustion and Energy Utilization (ICCEU), pp.1-10.
Mniszewski, K.R., 1995. The Pepcon Plant Fire/Explosion. Triodyne Inc., 10(3).
Mogford, J., 2005. Isomerization Unit Explosion Final Report. Fatal Accident Investigation
Report, pp.1-192.
Moya, D., 2013. Venezuela Refinery Blast Report Highlights PDVSA Operational Risks. [Online]
Available at:
http://www.downstreamtoday.com/news/article.aspx?a_id=40471&AspxAutoDetectCookieSupp
ort=1 [Accessed 3 September 2013].
MSU, 2013. Agriculture: Introduction. [Online] Michigan State University (MSU) Available at:
http://globaledge.msu.edu/industries/agriculture [Accessed 10 September 2013].
NAIIC, 2012. The Fukushima Nuclear Accident Independent Investigation Commission. The
National Diet of Japan.
NASA, 2011. System Failure Case Studies - Porthole to Failure. National Aeronautics and
Space Administration, 5(12), p.4.
NASA, 2012. The PEPCON Ammonium Perchlorate Plant Explosion. National Aeronautics and
Space Administration, 6(9), pp.1-4.
Neely, D., 2013. Process Safety Management, The System, The Challenge.
NOPSA, 2009. Process Safety Leadership in Major Accident Event (MAE) Prevention. National
Offshore Petroleum safety Authority (NOPSA).
NSA, n.d. Process Safety Leadership course for Senior Executive. The National Skills Academy
(NSA).
Nuclear Energy , 2011. Atoms for Peace, Nuclear Energy and Science for the Twenty-First
Century. [Online] Available at: http://www.ifpaenergyconference.com/Nuclear-Energy.html
[Accessed 10 September 2013].
Obermiller, J., 2008. 2007 Process Safety Performance Measurement Report. American
Petroleum Institute.
O'Connor, B. & Harkins, W.B., 2011. Dust to Dust: Imperial Sugar Company Dust Explosion.
National Aeronautics and Space Administration, pp.1-6.
OECD, 2012. Corporate Governance for Process Safety, Guidance for Senior Leaders in High
Hazard Industries, Environment, Health and Safety. Chemical Accidents Programme.
OGP, 2008. Asset Integrity-The Key to Managing Major Incident Risks. International Association
of Oil and Gas Producers, (415).
98
OGP, 2012. Ocean Ranger Task Force Report. [Online] Available at:
http://www.ogp.org.uk/publications/safety-committee/ocean-ranger-task-force-report/ [Accessed
9 October 2013].
OGP, 2013. About OGP. [Online] Available at: http://www.ogp.org.uk/about-ogp/ [Accessed 30
March 2013].
Oil & Gas Journal, 1991. ARCO Spells Out Cause of Channelview Blast. [Online] Available at:
http://www.ogj.com/articles/print/volume-89/issue-2/in-this-issue/gas-processing/arco-spells-out-
cause-of-channelview-blast.html [Accessed 10 July 2013].
OSC, 2011. Deep Water - The Gulf Oil Disaster and the Future of Offshore Drilling. National
Commission on the BP Deepwater Horizon.
OSH, 2012. Safety Accident/Injury Statistics. [Online] Available at:
http://www.osh.net/directory/safety/safety_01.htm [Accessed 12 October 2013].
OSHA, 2000. Process Safety Management. U.S. Department of Labour, Occupational Safety
and Health Administration, 3142, pp.7-30.
OSHA, 2010. Accident: 110318540. [Online] Available at:
https://www.osha.gov/pls/imis/accidentsearch.accident_detail?id=110318540 [Accessed 10
July 2013].
OSHA, 2011. PSM Covered Chemical Facilities National Emphasis Program. U.S. Department
of Labour, Occupational Safety and Health Administration.
OSHA, 2012. Process Safety Management Guidelines for Compliance. [Online] US Department
of Labour Available at: http://www.osha.gov/Publications/osha3133.html [Accessed 12 October
2013].
Overton, T., 2008. Driving Consistency and Improvement, Global Consistency and
Improvement. In AICHE Spring Meeting/CCPS Conference., 2008.
Pate-Cornell, M.E., 1993. Learning from Piper Alpha Accident. Risk Analysis, 13(2), pp.215-32.
Paulin, R.L. & Santman, L.D., n.d. Report on San Juan Ixhautepec, Mexico LPG Accident.
PennWell Public Safety, 2013. Toronto Propane Explosion Update. [Online] Available at:
http://firegeezer.com/2013/09/29/propane-ka-boom-injures-16-firefighters-in-germany/
[Accessed 3 September 2013].
Peon, A.I., 2008. Mechanical Integrity as an element of Process Safety Management.
Perez, J.T., 2011. The Obvious-to-Obscure Process Safety Checklist for Plant Engineers.
AIChE.
Poten, 2004. Explosion at Sonatrach's Skikda LNG Export Plant.
Ralph, R., n.d. Operating within Strict Environment Agency Levels. TOXCAT, 2(14), pp.1-4.

99
Rueda, J., 2012. Refinery Explosion Kills 39 in Venezuela. [Online] Available at:
http://www.csmonitor.com/World/Latest-News-Wires/2012/0826/Refinery-explosion-kills-39-in-
Venezuela [Accessed 3 September 2013].
Sasol, 2012. Sustainable Development Report. [Online] Available at:
http://sasol.investoreports.com/sasol_sdr_2012/addressing-our-material-sustainability-
challenges/promoting-safety-health-and-wellbeing/ [Accessed 30 March 2013].
Schouwenaars, E., 2008. The Risks Arising From Major Accident Hazards. Copenhagen: Det
Norske Veritas Energy Refining Management Forum.
Seghers, M., 2013. Corroded Pipe Caused Explosion that Killed Seven. [Online] Available at:
http://www.apnewsarchive.com/1988/Corroded-Pipe-Caused-Explosion-That-Killed-Seven/id-
56b36f633a1b3ceee7c259cf864a1670 [Accessed 10 July 2013].
SEPA, 2003. Major Incident: BP Grangemouth Scotland. Crown.
Shell, 2010. Process Safety in Shell. The Hague.
Shell, 2012a. Personal and process safety. [Online] Available at:
http://www.shell.com/global/environment-society/safety/personal-process-safety.html
[Accessed 30 March 2013].
Shell, 2012b. Sustainability Report. Royal Dutch Shell PLC Sustainability Report.
Shimada, Y., Kitajima, T. & Takeda, K., 2009. Practical Framework for Process Safety
Management based on Plant Life Cycle Engineering. In 3rd International Conference on
Integrity, Reliability and Failure. Portugal, 2009.
Soczek, C.A., 2010. Implementation of Process Safety Management into Diverse Corporate
Cultures. DuPont Safety Resources.
Speller, P., 2009. Release of Chemicals from International Biosynthetics Ltd. Health & Safety
Executive, pp.1-16.
Stargardter, G. & Garcia, D.A., n.d. Mexico Blast. [Online] Available at:
http://www.reuters.com/article/2013/02/01/us-mexico-pemex-idUSBRE90U1FF20130201
[Accessed 3 September 2013].
Taking Action on Risk, 2012. Top 10 Major Accidents that Influenced the World. [Online] World
Press Available at: http://www.actiononrisk.com/2011/01/top-10-major-accidents-that-
influenced-the-world [Accessed 12 June 2013].
Thrower, K., 2013. Process Safety Leadership for the Anaerobic Digestion Industry. National
Skills Academy.
Toups, H.J., 2003. Hazards, Accidents, Process Safety management and Process Hazard
Analysis. LSU Department of Chemical Engineering .
Trnka, O., Vesel´y, V., Hartman, M. & Beran, Z., 2000. Identification of the State of a Fluidized
Bed. AIChE Journal, 46(3), pp.509-14.

100
Trochim, W.M.K., 2006. Descriptive Statistics. [Online] Available at:
http://www.socialresearchmethods.net/kb/statdesc.php [Accessed 30 September 2013].
Uaphawou, 2008. Qinghe Special Steel Corporation disaster. [Online] Available at:
http://maldizeresdaberty.blogspot.com/2008/10/qinghe-special-steel-corporation.html
[Accessed 9 October 2013].
Van Wingerden, K., Salvesen, H.C. & Perbal, R., 1995. Simulation of an Accidental Vapor
Cloud Explosion. Process Safety Progress, 14(3), pp.1-9.
Vindhani, A., n.d. Huge Fire at IOC Oil Depot, Jaipur India on 29 Oct 2009. Qatar.
Waichman, P., 2009. Puerto Rico Explosion Investigation Points to Defective Fuel Monitor.
[Online] [Accessed 3 September 2013].
Walter, M., 2002. June 28, 1988: Worst Confined-Space Industrial Accident. [Online] Available
at: http://auburnindiana.yuku.com/topic/522/June-28-1988-Worst-ConfinedSpace-Industrial-
Accident [Accessed 10 July 2013].
Walt, L. & Frank, P.E., 2007. Process safety culture: Why is it so important? ABS Consulting.
Watterson, A. & Taylor, P., 2007. The ICL/Stockline Disaster. Universities of Strathclyde and
Stirling.
Wetfeet , 2012. Industry Overview: Manufacturing. [Online] Available at:
https://www.wetfeet.com/articles/industry-overview-manufacturing [Accessed 10 September
2013].
White, J., 2000. Phillips Petroleum plant explosion: the latest in a series of deadly accidents at
Houston facility. [Online] Available at: http://www.wsws.org/en/articles/2000/03/expl-m30.html
[Accessed 9 October 2013].
White, D. & Korotayev, A., 2004. Chapter 5. In Statistical Analysis of Cross-Tabs. pp.2-18.
Wisemann, G., n.d. BASF Hit by U.K. Blaze. Chemical Week, 157(14), p.20.
WorkSafe, 2011. Hazard Identification at a Major Hazard Facility.
World Nuclear Association, 2013. Chernobyl Accident 1986. [Online] Available at:
http://www.world-nuclear.org/info/Safety-and-Security/Safety-of-Plants/Chernobyl-Accident/
[Accessed 10 July 2013].
Yates, J., 1989. Phillips Petroleum Chemical Plant Explosion and Fire. US Fire
Administration/Technical Report Series, 035, pp.1-87.
Yoon, E.S., 2012. Introduction to Process Safety Management.
Zahie, n.d. Types of Manufacturing Industries. [Online] Available at:
http://www.zahie.com/categories/details/social-studies/types-of-manufacturing-industries.html
[Accessed 10 September 2013].

101
Appendix A – Survey Questionnaire
Table 22 – Survey Questionnaire
Incident Information Description of Incident Continent
Year
Consequence Industry Incident Classification Cause Analysis Cause No Cause
PSM Elements
Employee Participation (EP) Senior Management Participation
First Line Management Participation
Floor level Participation Management Inspections Poor safety culture
Process Safety Information (PSI)
Codes and Standards not Identified
Inadequate design
Risks not identified Poor records of plant Drawings
Poor records of plant equipment data
Process Hazard Analysis (PHA)
Risks not identified Ineffective Control Measures
Poor risk perception Control measures not implemented
Operating Procedures (OP)
Deviation from procedures
Procedures not updated
Risks not included in the SOP
Training (TR)
Employees not trained

102
Table 22 – Survey Questionnaire(Continued)
Inadequate training
Inadequate experience
Contractors (CTR) Personnel not aware of Hazards
Inadequate training
Inadequate experience
Pre Start-up Safety Review (PSSR)
Inspection of maintenance
Poor quality of Maintenance
Deviations from SOP start- Up
Senior operating management not present during start-up
Mechanical Integrity (MI)
Poor quality of maintenance work
Inferior or defective equipment used
Routine maintenance not Completed
Non-routine maintenance not completed
Temporary maintenance Repairs
Hot Work Program (HWP) Inadequate safe making of Equipment
Inadequate monitoring of process environment
Hazards not identified
Deviation of control Measures
Management of Change (MOC)
No personnel change Procedure
No project change Procedure
Risks not identified

103
Table 22 – Survey Questionnaire (Continued)
Temporary modifications
Control measures not Adequate
Incident Investigation (II) Past incident not Investigated
Corrective actions not Implemented
Inadequate depth of Investigation
Poor investigative Techniques
Not all causes identified
Emergency Planning and Response (EPR)
Equipment non-functional
Personnel not trained
Scenario not included in plan
Personnel not prepared for response
Compliance Audits (CA) Management inspection not done
Disciplinary inspections not done
Poor quality of assessment execution
Non-comprehensive assessments
Trade Secrets (TS)
Confidential information not known
Selective information shared
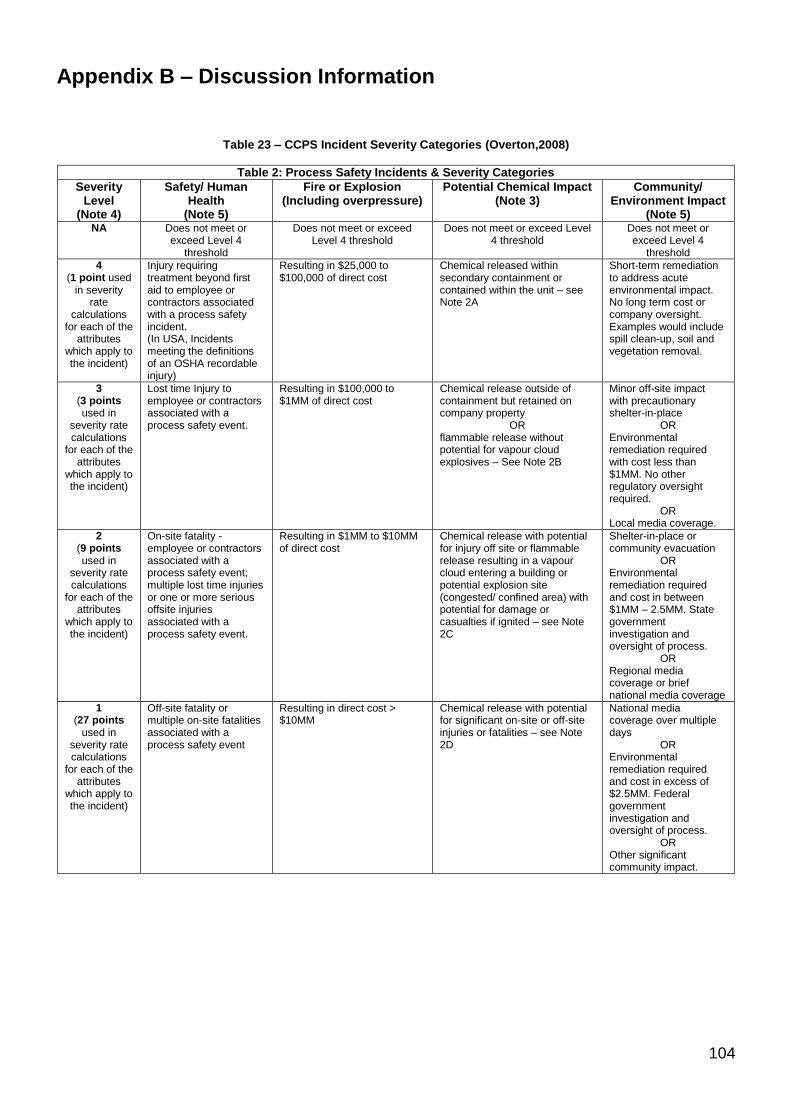
104
Appendix B – Discussion Information
Table 23 – CCPS Incident Severity Categories (Overton,2008)
Table 2: Process Safety Incidents & Severity Categories
Severity Level
(Note 4)
Safety/ Human Health
(Note 5)
Fire or Explosion (Including overpressure)
Potential Chemical Impact (Note 3)
Community/ Environment Impact
(Note 5) NA Does not meet or
exceed Level 4 threshold
Does not meet or exceed Level 4 threshold
Does not meet or exceed Level 4 threshold
Does not meet or exceed Level 4
threshold
4 (1 point used
in severity rate
calculations for each of the
attributes which apply to the incident)
Injury requiring treatment beyond first aid to employee or contractors associated with a process safety incident. (In USA, Incidents meeting the definitions of an OSHA recordable injury)
Resulting in $25,000 to $100,000 of direct cost
Chemical released within secondary containment or contained within the unit – see Note 2A
Short-term remediation to address acute environmental impact. No long term cost or company oversight. Examples would include spill clean-up, soil and vegetation removal.
3 (3 points used in
severity rate calculations
for each of the attributes
which apply to the incident)
Lost time Injury to employee or contractors associated with a process safety event.
Resulting in $100,000 to $1MM of direct cost
Chemical release outside of containment but retained on company property
OR flammable release without potential for vapour cloud explosives – See Note 2B
Minor off-site impact with precautionary shelter-in-place
OR Environmental remediation required with cost less than $1MM. No other regulatory oversight required.
OR Local media coverage.
2 (9 points used in
severity rate calculations
for each of the attributes
which apply to the incident)
On-site fatality - employee or contractors associated with a process safety event; multiple lost time injuries or one or more serious offsite injuries associated with a process safety event.
Resulting in $1MM to $10MM of direct cost
Chemical release with potential for injury off site or flammable release resulting in a vapour cloud entering a building or potential explosion site (congested/ confined area) with potential for damage or casualties if ignited – see Note 2C
Shelter-in-place or community evacuation
OR Environmental remediation required and cost in between $1MM – 2.5MM. State government investigation and oversight of process.
OR Regional media coverage or brief national media coverage
1 (27 points
used in severity rate calculations
for each of the attributes
which apply to the incident)
Off-site fatality or multiple on-site fatalities associated with a process safety event
Resulting in direct cost > $10MM
Chemical release with potential for significant on-site or off-site injuries or fatalities – see Note 2D
National media coverage over multiple days
OR Environmental remediation required and cost in excess of $2.5MM. Federal government investigation and oversight of process.
OR Other significant community impact.

105
Appendix C – Incident Information
Table 24 – Incident Report Summary
No. Description of Incident Continent Year Consequence Industry
Classification Incident
Classification Reference
Validated By
1 A cyclohexane vapour cloud explosion occurred when a bypassed system ruptured
Europe 1974 Explosion and
Fire Chemical 1 (ARIA, 2008) (HSE, 1975)
2
A vapour cloud explosion occurred when a vapour was released from a depropaniser
Europe 1975 Explosion and
Fire Chemical 1
(Van Wingerden et
al., 1995)
(HSE, 1996b)
3 Dioxin was released after a disc ruptured
Europe 1976 Release Agricultural 1 (Kobayashi & Tamura, n.d.)
(HSE, 1996d)
4 Propane was released after a pipeline failed
North America
1976 Release Chemical 1 (ERCB, 1980) (HSE, 1980)
5
Small amounts of radioactive gases and iodine was released after a partial nuclear meltdown
North America
1979 Release Nuclear 1 (Almanac of Policy Issues,
2002)
(Fact Sheets, 2010)
6 A fire on the platform resulted from released oil and gas
North America
1979 Release Chemical 1 (ERCO, 1982) (Ixtoc Oil Spill, n.d.)
7
An explosion occurred when the water supply to the hexane still condenser was interrupted
Europe 1981 Explosion and
Fire Chemical 3 (HM, 1982) (HSE, 1982)
8
An explosion and fire resulted from water short-circuiting the power to the platform control panel
North America
1982 Explosion and
Fire Chemical 1 (NASA, 2011) (OGP, 2012)
9 Released Liquefied Petroleum Gas ignited from a ruptured pipeline
North America
1984 Explosion and
Fire Chemical 1
(Paulin & Santman,
n.d.)
(HSE, 1996e)
10 Methyl Isocyanate was released after a relief valve on a storage tank lifted
Asia 1984 Release Agricultural 1 (Dutta, 2002) (Kalelkar & Little, 1988)
11
An explosion occurred after flammable vapours were released from a hair line crack
North America
1984 Explosion and
Fire Chemical 1
(Beitler, 2008)
(Groves, 2006)
12 A warehouse fire resulted in chemicals being released into the River Rhine.
Europe 1986 Release Chemical 1 (Edelparke,
2010) (BBC,
2012a)
13 A nuclear meltdown occurred from loss of control during a test.
Europe 1986 Explosion and
Fire Nuclear 1
(Ecodefence, 2011)
(World Nuclear
Association, 2013)
14
A vapour cloud explosion resulted from the release of the Hydrocracker Unit's flammable liquid
Europe 1987 Explosion and
Fire Chemical 2 (SEPA, 2003) (HSE, 1989)
15
A hydrocarbon gas explosion resulted from a corroded catalytic cracker pipe
North America
1988 Explosion and
Fire Chemical 1
(Hoffman, 2013)
(Seghers, 2013)
16 An explosion and fire occurred on a platform
Europe 1988 Explosion and
Fire Chemical 1 (CCPS, 2005)
(Pate-Cornell, 1993)
17
An explosion occurred at an ammonium perchlorate plant that produced rocket fuel
North America
1988 Explosion and
Fire Chemical 1
(Mniszewski, 1995)
(NASA, 2012)
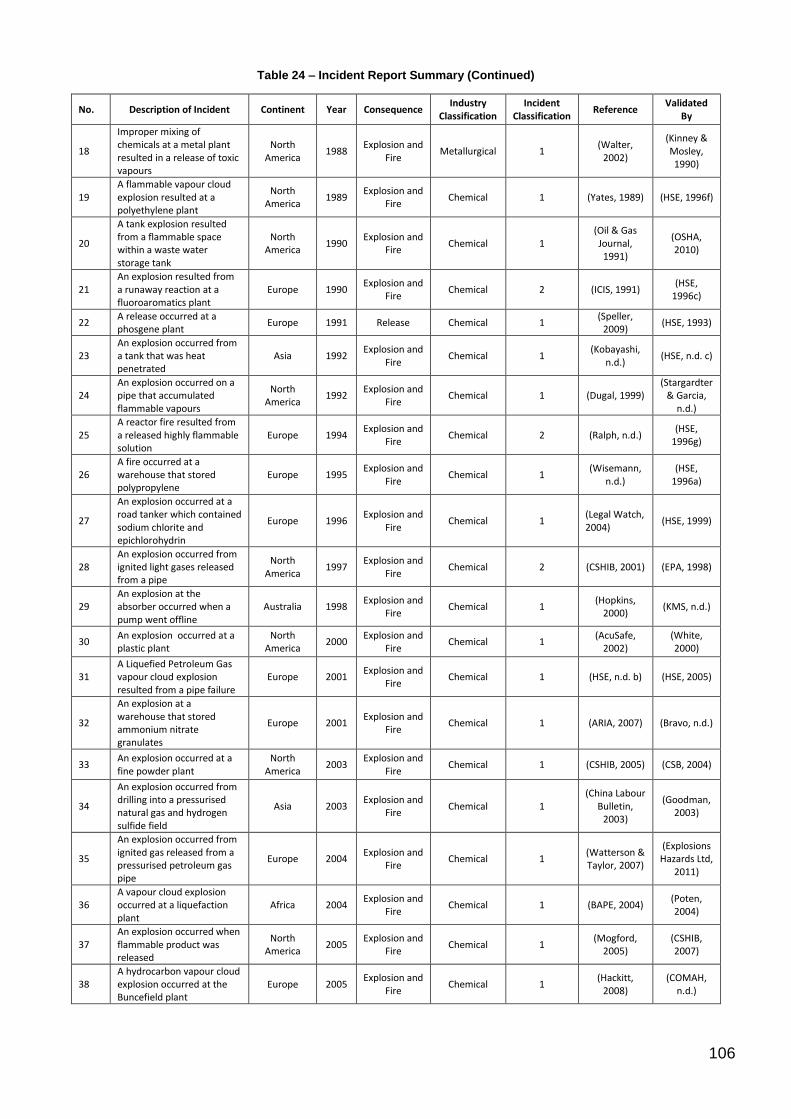
106
Table 24 – Incident Report Summary (Continued)
No. Description of Incident Continent Year Consequence Industry
Classification Incident
Classification Reference
Validated By
18
Improper mixing of chemicals at a metal plant resulted in a release of toxic vapours
North America
1988 Explosion and
Fire Metallurgical 1
(Walter, 2002)
(Kinney & Mosley, 1990)
19 A flammable vapour cloud explosion resulted at a polyethylene plant
North America
1989 Explosion and
Fire Chemical 1 (Yates, 1989) (HSE, 1996f)
20
A tank explosion resulted from a flammable space within a waste water storage tank
North America
1990 Explosion and
Fire Chemical 1
(Oil & Gas Journal, 1991)
(OSHA, 2010)
21 An explosion resulted from a runaway reaction at a fluoroaromatics plant
Europe 1990 Explosion and
Fire Chemical 2 (ICIS, 1991)
(HSE, 1996c)
22 A release occurred at a phosgene plant
Europe 1991 Release Chemical 1 (Speller,
2009) (HSE, 1993)
23 An explosion occurred from a tank that was heat penetrated
Asia 1992 Explosion and
Fire Chemical 1
(Kobayashi, n.d.)
(HSE, n.d. c)
24 An explosion occurred on a pipe that accumulated flammable vapours
North America
1992 Explosion and
Fire Chemical 1 (Dugal, 1999)
(Stargardter & Garcia,
n.d.)
25 A reactor fire resulted from a released highly flammable solution
Europe 1994 Explosion and
Fire Chemical 2 (Ralph, n.d.)
(HSE, 1996g)
26 A fire occurred at a warehouse that stored polypropylene
Europe 1995 Explosion and
Fire Chemical 1
(Wisemann, n.d.)
(HSE, 1996a)
27
An explosion occurred at a road tanker which contained sodium chlorite and epichlorohydrin
Europe 1996 Explosion and
Fire Chemical 1
(Legal Watch, 2004)
(HSE, 1999)
28 An explosion occurred from ignited light gases released from a pipe
North America
1997 Explosion and
Fire Chemical 2 (CSHIB, 2001) (EPA, 1998)
29 An explosion at the absorber occurred when a pump went offline
Australia 1998 Explosion and
Fire Chemical 1
(Hopkins, 2000)
(KMS, n.d.)
30 An explosion occurred at a plastic plant
North America
2000 Explosion and
Fire Chemical 1
(AcuSafe, 2002)
(White, 2000)
31 A Liquefied Petroleum Gas vapour cloud explosion resulted from a pipe failure
Europe 2001 Explosion and
Fire Chemical 1 (HSE, n.d. b) (HSE, 2005)
32
An explosion at a warehouse that stored ammonium nitrate granulates
Europe 2001 Explosion and
Fire Chemical 1 (ARIA, 2007) (Bravo, n.d.)
33 An explosion occurred at a fine powder plant
North America
2003 Explosion and
Fire Chemical 1 (CSHIB, 2005) (CSB, 2004)
34
An explosion occurred from drilling into a pressurised natural gas and hydrogen sulfide field
Asia 2003 Explosion and
Fire Chemical 1
(China Labour Bulletin,
2003)
(Goodman, 2003)
35
An explosion occurred from ignited gas released from a pressurised petroleum gas pipe
Europe 2004 Explosion and
Fire Chemical 1
(Watterson & Taylor, 2007)
(Explosions Hazards Ltd,
2011)
36 A vapour cloud explosion occurred at a liquefaction plant
Africa 2004 Explosion and
Fire Chemical 1 (BAPE, 2004)
(Poten, 2004)
37 An explosion occurred when flammable product was released
North America
2005 Explosion and
Fire Chemical 1
(Mogford, 2005)
(CSHIB, 2007)
38 A hydrocarbon vapour cloud explosion occurred at the Buncefield plant
Europe 2005 Explosion and
Fire Chemical 1
(Hackitt, 2008)
(COMAH, n.d.)
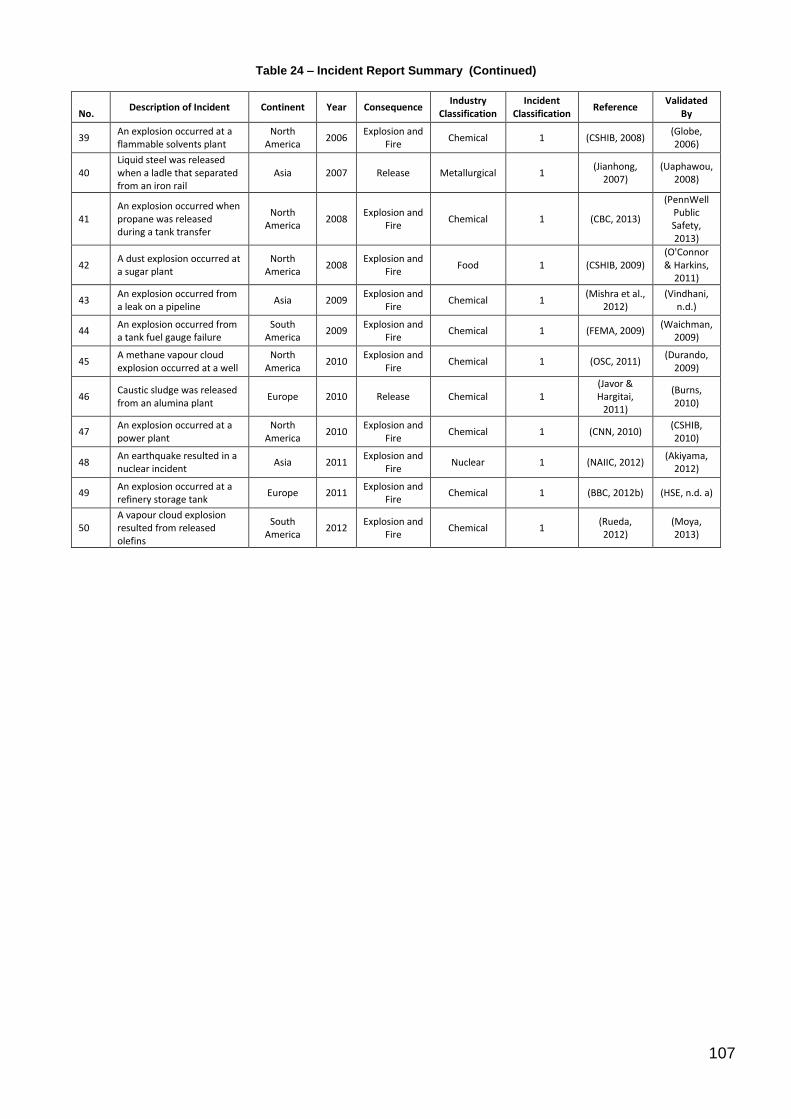
107
Table 24 – Incident Report Summary (Continued)
No.
Description of Incident Continent Year Consequence Industry
Classification Incident
Classification Reference
Validated By
39 An explosion occurred at a flammable solvents plant
North America
2006 Explosion and
Fire Chemical 1 (CSHIB, 2008)
(Globe, 2006)
40 Liquid steel was released when a ladle that separated from an iron rail
Asia 2007 Release Metallurgical 1 (Jianhong,
2007) (Uaphawou,
2008)
41 An explosion occurred when propane was released during a tank transfer
North America
2008 Explosion and
Fire Chemical 1 (CBC, 2013)
(PennWell Public Safety, 2013)
42 A dust explosion occurred at a sugar plant
North America
2008 Explosion and
Fire Food 1 (CSHIB, 2009)
(O'Connor & Harkins,
2011)
43 An explosion occurred from a leak on a pipeline
Asia 2009 Explosion and
Fire Chemical 1
(Mishra et al., 2012)
(Vindhani, n.d.)
44 An explosion occurred from a tank fuel gauge failure
South America
2009 Explosion and
Fire Chemical 1 (FEMA, 2009)
(Waichman, 2009)
45 A methane vapour cloud explosion occurred at a well
North America
2010 Explosion and
Fire Chemical 1 (OSC, 2011)
(Durando, 2009)
46 Caustic sludge was released from an alumina plant
Europe 2010 Release Chemical 1 (Javor & Hargitai,
2011)
(Burns, 2010)
47 An explosion occurred at a power plant
North America
2010 Explosion and
Fire Chemical 1 (CNN, 2010)
(CSHIB, 2010)
48 An earthquake resulted in a nuclear incident
Asia 2011 Explosion and
Fire Nuclear 1 (NAIIC, 2012)
(Akiyama, 2012)
49 An explosion occurred at a refinery storage tank
Europe 2011 Explosion and
Fire Chemical 1 (BBC, 2012b) (HSE, n.d. a)
50 A vapour cloud explosion resulted from released olefins
South America
2012 Explosion and
Fire Chemical 1
(Rueda, 2012)
(Moya, 2013)