Embed Size (px)
Citation preview

EFFECT OF'CINNAMIC ACID ON THE GROWTH AND ULTRASTRUCTURE
OF CHLORELLA VULGARIS (BEIJERINCK)
by
LINDA LEE CHAMBERLIN, B.A.
A THESIS
IN
BOTANY
Submitted to the Graduate Faculty of Texas Tech University in Partial Fulfillment of the Requirements for
the Degree of
MASTER OF SCIENCE
Approved _
Accepted
D e ^ of thfe praduati^ School
August, 1975

(- AC 805 T3
No.lU Cop. a.
^5T-<3/'~7r
ACKNOWLEDGMENTS
I am deeply indebted to Dr. Jerry D. Berlin for
his direction of this thesis.
11
CONTENTS
ACKNOWLEDGMENTS ii
Chapter
I. HISTORICAL REVIEW AND INTRODUCTION 1
II. MATERIALS AND METHODS 4
III. RESULTS 7
IV. DISCUSSION AND CONCLUSION 11
LITERATURE CITED 16
APPENDIX 19
• • •
111

CHAPTER I
HISTORICAL REVIEW AND INTRODUCTION
The premise that plants produced toxic substances
originated in 1832 when DeCandolle noted that some species
of plants appeared to be inhibitory to other species
(Bonner, 1950). Twenty years later, Liebig discounted
DeCandolle's hypothesis, and interest in the subject waned
until the early 1900's (Bonner, 1950) when Schreiner and
Reed (1908) first isolated toxic substances produced by
plants and identified the inhibitory chemicals as phenols.
Interest again lagged for many years because the phenomenon
was believed to occur in only a few instances in nature.
It was not until recently that the widespread nature of
these toxic substances was recognized. From the mid
1930's until the present, many cases of plant inhibition
have been studied and documented (Bonner, 1950; Whittaker
and Feeny, 1971; Pickett and Baskin, 1973).
Chemical characterization of these toxic compounds
showed them to arise from the amino acids tyrosine and
phenylalanine via the shikimic acid pathway (Neish, 1960;
Stafford, 1974). The combination of these aromatic
compounds with various other plant metabolites produced
a myriad of phenolic products. Of these products, cinnamic
acid is of interest due to its widespread distribution in

the plant kingdom. It has been found in higher plants such
as ferns, gymnosperms, and angiosperms (Glass, 1973). By
the processes of rainwash from leaves, root exudation,
decomposition of plant materials, and volatilization,
cinnamic acid derivitives accumulated in soils (Wang, Yang,
and Chuang, 1967). Cinnamic acid was shown to inhibit the
uptake of phosphate and potassium ions by barley roots
(Glass, 1973, 1974). Growth of Avena coleoptiles was
found to be inhibited by cinnamic acid (Marines and Hemberg,
1960). Dedonder and Van Sumere (1971) found that growth
of Chlorella vulgaris and Saccharomyces cerevisiae was
inhibited by cinnamic acid and some of its derivitives. In
a later study, they reported that cinnamic acid inhibited
14 uptake of C labelled phenylalanine (Van Sumere and
Dedonder, 1971). Low concentrations of cinnamic acid also
inhibited Paul's scarlet rose cell cultures (Danks, Fletcher
and Rice, 1975) and tobacco callus growth (Lee and Skoog,
1965).
At present, the mechanism of action of cinnamic acid
on these organisms is not known. Some studies point to
cinnamic acid as being an uncoupler of oxidative phos
phorylation (Van Sumere, Cottenie, De Greef, and Kint,
1972; Stenlid and Saddik, 1962), while others have shown
that cinnamic acid is probably a weak uncoupler of oxidative
phosphorylation but the effect could not totally account
for the strong inhibitory effect observed (Tillberg, 1970).
In still another study. Glass and Dunlop (1974) demonstrated
that cinnamic acid caused a rapid, strong depolarization
of the membranes of barley roots, and they suggested that
this depolarization would account for inhibition of uptake
of inorganic ions. Sikka, Saxena, and Zweig (1973) found
14 that Chlorella pyrenoidosa which had incorporated C,
rapidly lost all labelled material after treatment with
quinone pesticides which were similar in structure to
plant phenols.
In spite of mounting evidence pointing to massive
membrane involvement, apparently no electron microscopic
studies have been conducted on living materials exposed
to cinnamic acid. Chlorella vulgaris was chosen as the
experimental organism for this study for several reasons.
First, Chlorella has been shown to be sensitive to cinnamic
acid (Dedonder and Van Sumere, 1971). Secondly, the use
of a unicellular plant disposed of the problems of cell to
cell transport and cellular location of the cinnamic acid
in the plant body. Finally, the glucosylation reaction
which acts as a detoxification process on introduced foreign
phenols in higher plants was absent in algae (Pridham, 1964)

CHAPTER II
MATERIALS AND METHODS
A culture of Chlorella vulgaris (Beijerinck) number 260
was obtained from the Algae Culture Collection at Indiana
University, Bloomington, Indiana. All cultures were grown
in 500 ml Erlenmeyer flasks containing 250 ml of sterile
modified Knop's solution with the following composition:
1.2 g KNO^, 2.5 g MgSO^-7 H2O, 1.1 g KH2PO-, 1 ml solution A
and 1 ml of solution B/1 (solution A contained 26.75 g
ferri ammoniumcitrate/1; solution B contained 1.32 g H^BO^,
2.05 g MnSO^-4 H2O, 0.10 g ZnCl2/ ^'^^ ^ CuCl2# 0.016 g
M0O-/I). The pH of the medium was 4.5 (Dedonder and
Van Sumere, 1971). Both stock and experimental cultures
were maintained at 25° C in an American Optical water bath
and filtered, prehumidified air was bubbled continuously
through all cultures. Overhead illumination was provided
by two 15 inch Gro-Lux fluorescent tubes (Sylvania) so that
light intensity at the glass surface was approximately
3000 lux. Cinnamic acid was obtained from Sigma Chemical -3
Company. Growth medium containing 10 M cinnamic acid
-4 was sterilized by filtration. Concentrations of 10 and
-5 -3 10 M cinnamic acid were prepared by diluting the 10 M stock solution with autoclaved modified Knop's solution.

Cultures for growth inhibition study were inoculated
with cells from an actively growing culture that was 7-10
days old to give a final concentration of 1- 1.5 x 10^
cells/ml of medium (Hase, Morimura, and Tamiya, 1957;
Zweig, Hitt, and McMahon, 1968; Van Sumere and Dedonder,
1971). Samples were withdrawn asceptically for analysis.
Growth of the culture was determined by two methods, first
using an Improved Neubauer hemacytometer for direct cell
counts, and second, by following optical density of the
culture on a Bausch and Lomb Spectronic 20 spectrophotometer
set at 640 nm.
Samples for electron microscopy were secured at time
intervals of 1 and 30 minutes and at 1, 12, 24, and 48
hours after incubation. These samples were centrifuged for
3 minutes at 1850 rpm in an International Clinical centrifuge
The supernatants were discarded and the cells were
resuspended in culture medium at pH 4.5 containing 5%
glutaraldehyde. The cells were fixed overnight at 4o C and
then post-fixed for one hour in 1% osmium tetroxide in 0.02 M
citrate buffer at pH 4.5 (Gomori, 1952). The samples were
dehydrated through a series of alcohols and propylene oxide
and embedded in Epon (Luft, 1961). Sections were cut on
an LKB Ultratome II microtome with a Du Pont dicimond knife
euid picked up on uncoated grids. The sections were stained
with uranyl acetate and post-stained with lead citrate

(Reynolds, 1963). The grids were viewed on an Hitachi
HS-8-2 electron microscope operating at 50 KV and an
Hitachi-llE-1 microscope operating at 75 KV.
CHAPTER III
RESULTS
Growth of the Chlorella was followed in two ways:
by cell counts done on a hemacytometer and by changes in
optical density of the culture (Figures 1 and 2). After
an initial lag period of 3 days, the control culture began
— 5 to grow rapidly. The culture in 10 M cinnamic acid also
lagged for 2 days and then began to grow rapidly. The
— 5 control culture and the culture with 10 M cinnamic acid
— 5 both seemed to grow at the same rates and 10 M cinnamic
acid did not inhibit the growth of the Chlorella. The
-4 culture containing 10 M cinnamic acid showed little change
prior to the fifth day post-inoculation. Five days after
inoculation both cell counts and optical density showed a -3
slight increase. The culture grown in 10 M cinnamic acid
showed virtually no change in cell number and the optical
density remained the same to the end of the experiment.
Twelve hours after inoculation, the culture containing -3
10 M cinncunic acid appeared bleached and had only a
vestige of green coloration. Within two days all traces
of green color were lost and the cells appeared white. -4 The culture with 10 M cinnamic acid began to lose
coloration after one day and faded gradually until only a
trace of green color was left by the third day after

8
inoculation. This culture never completely lost its faint _3
green color as did the culture exposed to 10 M cinnamic
acid. Neither the control culture nor the culture with
-5 10 M cinnamic acid lost any color and both remained
similar in color throughout all experiments.
Control cells exhibited normal ultrastructural
morphology (Figures 3 and 4). The cells had a large central
vacuole and the cytoplasm was distributed around the
periphery of the cell. Most cells had at least one
chloroplast usually containing a large pyrenoid surrounded
by starch plates. The chloroplasts were formed from
flattened stacks of thylakoid membranes and very often
starch grains could be seen accumulating within the
chloroplast (Figure 4). The nucleus was always adjacent
to the chloroplast and had dispersed electron dense areas.
The Golgi apparatus was located between the nucleus and the
plasma membrane (Figure 4). Small mitochondria with
tubular cristae were scattered in the cell.
Ultrastructural changes were not detected after
— 5 exposure of the Chlorella to 10 M cinnamic acid for 12
hours (Figures 5 and 6). The chloroplasts were normal in
appearance and starch was seen accumulating (Figure 5).
The nuclei were not changed nor were the mitochondria
(Figures 5 and 6). After two days of exposure to the
cinnamic acid, there were no observable differences between

-5 cells grown in 10 M cinnamic acid and the cells grown in
the control medium (Figures 7 and 8). The Chlorella grew
-5 well in 10 M cinnamic acid and cells which had finished
dividing and were bursting free from the mother cell wall
can be seen in Figure 7. Those cells were active photo-
synthetically as evidenced by the large accumulations of
starch in the daughter cells. In Figure 8, the chloroplast
has divided in preparation for cell division. Several
mitochondria were at the periphery of the cell and there's
a single nucleus.
After exposure for one minute to a concentration of
-4 10 M cinnamic acid, there were no apparent morphological
changes (Figure 9). The chloroplast and nucleus appeared
normal and the mitochondria were unaltered. A twelve hour
exposure to 10~ M cinnamic acid resulted in several
morphological types. Some cells appeared normal (Figure 10)
with no changes in the organelles, but other cells showed
severe damage (Figure 11). The plasma membrane was no longer
continuous and the thylakoid membranes were no longer
compact as in Figure 9 but appear to have spread out.
Membrane bound vesicles were seen at the periphery of the
cell. These vesicles were most likely plasma membrane
derived but could also have come from nuclear, chloroplast
or mitochondrial membranes. The nucleus and mitochondria
were no longer observable but may not have been in this

10
particular section. The pyrenoid and starch plates were
unchanged. A two day exposure to lO" M cinnamic acid
resulted in cells with disrupted thylakoid membranes.
Membrane fragments were seen in peripheral areas of the
cells (Figure 12). What appeared to be a degenerated
nucleus was found in the center of a cell, and the nuclear
envelope was no longer present.
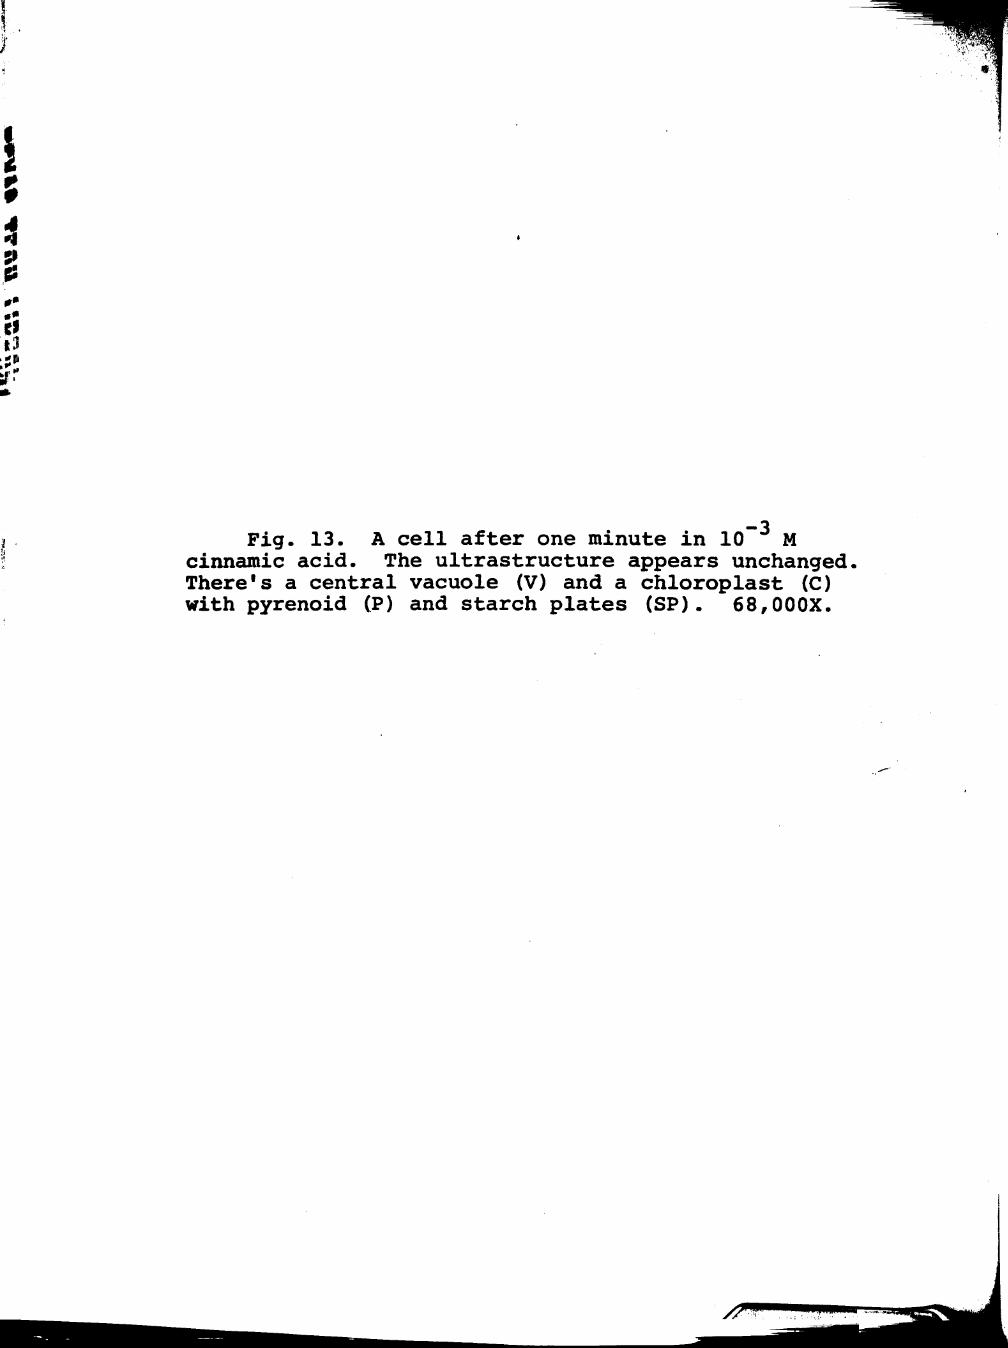
No morphological changes occurred after one minute -3
exposure to a concentration of 10 M cinnamic acid
(Figure 13). The membranes were not affected and the
chloroplast appeared normal with a large pyrenoid body.
After one hour, the plasma membrane was fragmented and the
thylakoid membranes were spreading apart in the chloroplast.
Nuclei and mitochondria were not observed in these cells.
Again the pyrenoid body and the starch grains were not
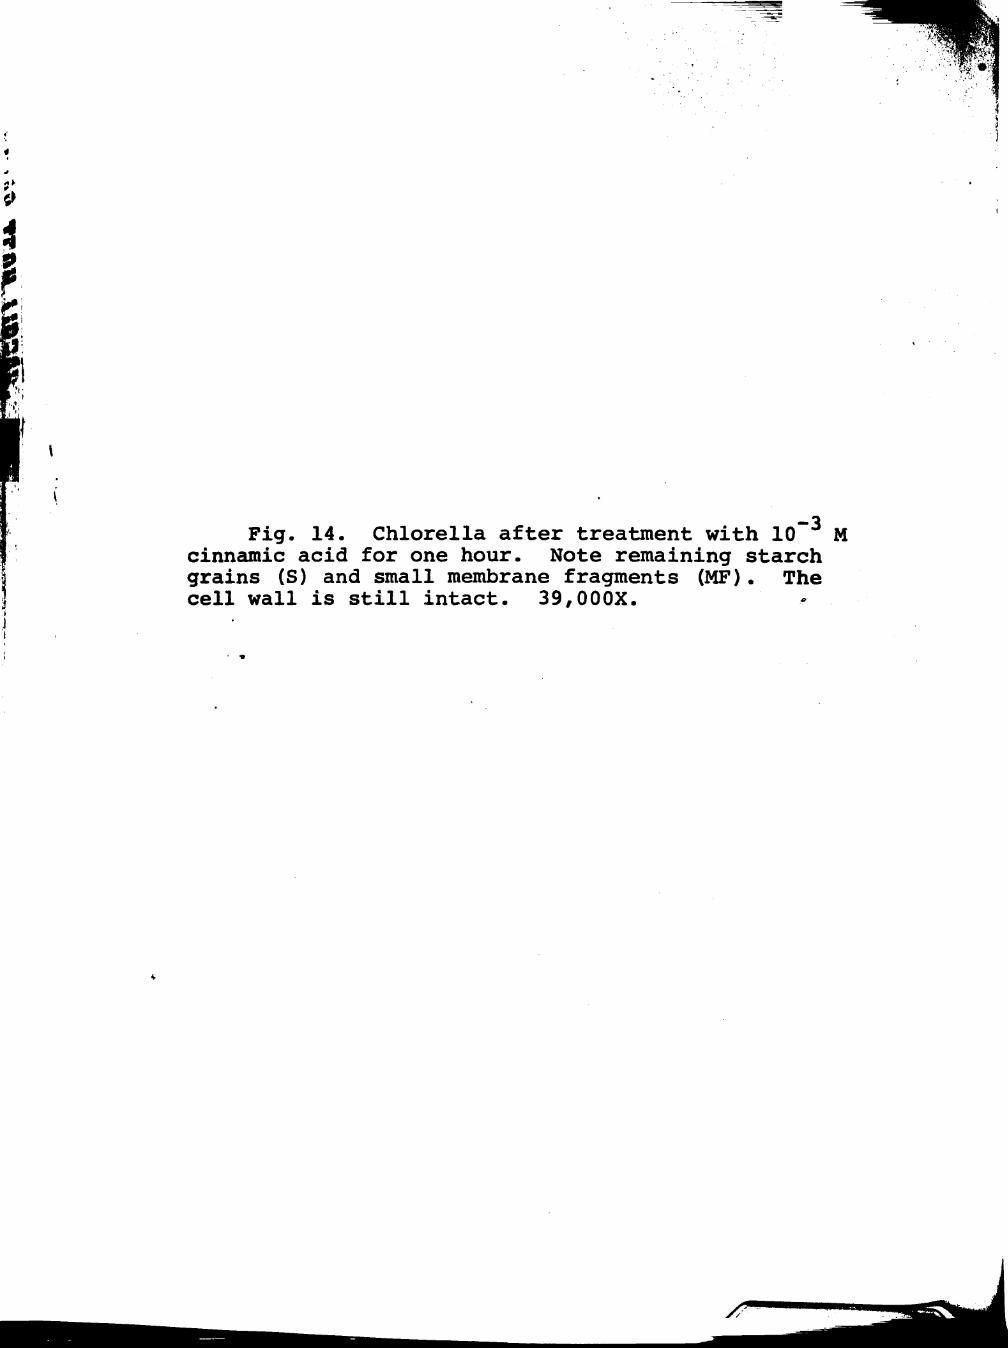
altered. In other cells taken after one hour, short
membrane fragments were found (Figure 14). Large amounts
of starch were seen in these cells indicating that they
were photosynthetically active. By 12 hours, there was a
loss in the integrity of the thylakoid membranes of all
the cells and the only structures remaining without any
effects were the pyrenoid and the starch grains (Figure 15).
Short membrane fragments were found throughout the cells.
In Figure 16, membrane fragments were seen next to the
starch grains and in the pyrenoid. These fragments were
probably derived from the thylakoid membranes.

CHAPTER IV
DISCUSSION AND CONCLUSION
In the growth experiments, the lO""̂ M concentration of
cinnamic acid appeared to be lethal. Cell numbers and
optical density of the culture did not change after initial
inoculation. The culture turned white after 12 hours and
this phenomenon was consistently observed in all experiments. _3
After one minute, the cells in the 10 M cinnamic acid
culture revealed no morphological changes detected by
electron microscopy, but after one hour, the cells were
badly damaged. This damage was manifested by vesiculated
and fragmented plasma membranes while the delimiting outer
chloroplast membrane was disrupted. The inner thylakoid
membranes of the chloroplast appeared intact and similar
to the control cultures in ultrastructure. After 12 hours -3
of culture in 10 M cinnamic acid, the thylakoid membranes
had degenerated and, short lengths of a trilaminar structure
were seen in the cells. These fragments presumably were
membrane remnants most probably derived from disrupted
plasma, chloroplast, mitochondrial, or nuclear membrane
systems.
The loss of green pigmentation of the culture coincided
with the loss of integrity of the thylakoid membranes. In
studies involving photooxidation or bleaching of Chlorella
11

12
(Sironval and Kandler, 1958; Kandler and Sironval, 1959),
it was found that an induction period preceeded the photo-
oxidation of chlorophyll. These investigators suspected
that proteins which stabilized the chlorophyll molecules
were altered and this alteration led to a photooxidation
effect. In this study, the bleaching of cells exposed to
cinnamic acid was probably due to photooxidation of the
chlorophyll in the thylakoid membranes. Cinnamic acid
destroyed the thylakoid membranes where chlorophyll was
located and subsequently this membrane disruption led to
breakdown of the chlorophyll. The rate of chlorophyll
destruction was dependent upon the concentration of
cinnaonic acid. Bleaching occurred rapidly in those cells _3
that were exposed to 10 M cinnamic acid while those in
-4 10 M cinnamic acid bleached more slowly. A concentration
of 10 M had no bleaching effect. Studies involving
exposure of Chlorella pyrenoidosa to different quinone
pesticides resulted in a similar bleaching effect that
was concentration dependent with weaker concentrations
of the pesticides requiring a longer time for bleaching
of the chlorophyll to occur (Zweig, et al, 1968).
Despite the fact that cinnamic acid stimulates
respiration (Tillberg, 1970; Dedonder and Van Sumere, 1971),
-3 many starch grains were evident in cells treated with 10
M cinnamic acid. This would indicate that cell destruction

13
occurred so rapidly that even with increased respiration
rates, the starch was not broken down. Cultures treated
-4 with 10 M cinnamic acid had very little or no starch
remaining in their cells.
There were no apparent ultrastructural changes in
cultures treated with 10 M cinnamic acid until after 12
hours of culture. The treated algal cells displayed a
spectrum of effects, ranging from cells similar in
appearance to untreated cells to cells which were obviously
damaged. One explanation for this variation in degree of
-4 damage could have been that cells in the culture with 10
M cinnamic acid were of different ages and in different
stages of their division cycle. A second explanation was
that some cells had a detoxification mechanism which could
-4 have coped with a concentration of 10 M cinnamic acid.
Vance and Smith (1969) found that some strains of Chlorella
were resistant to the effects of some chlorophenoxyacetic
herbicides but the mechanism of resistance was not known.
Possibly the same type of resistance was operating in this
study. By the sixth day after inoculation, there was a
slight increase in both cell numbers and optical density
of the culture which indicated that some cells could have
survived the treatment and subsequently undergone division.
The number of cells which were able to survive was
extremely small as most cells after 2 days of exposure to

14
-4
10 M cinnamic acid displayed disintegration of chloroplasts
and other organelles were no longer recognizable.
Cultures exposed to 10~ M cinnamic acid appeared
similar to the control, and the nuclei, chloroplasts and
other organelles did not appear to be affected by this
concentration of cinnamic acid. Van Sumere and Dedonder — 5 (1971) had previously found that 10 M cinnamic acid had
an inhibitory effect on the strain of Chlorella vulgaris
(Pirson strain). Danks et al (1975) found that this
concentration inhibited Paul's scarlet rose cells. The
strain of Chlorella (IU-260) used for these ultrastructural
studies was not inhibited by 10 M cinnamic acid.
Cinnamic acid severely altered the plasma membranes
of Chlorella as evidenced by the loss of plasma membrane -3 -4 continuity in the 10 and 10 M treated cells. Fragments
of membranes could be seen in those cells. Since the
fragments were found in all parts of the cells, they
probably originated from several membranes including
chloroplast, mitochondrial, and nuclear membranes. That
total membrane structure was not destroyed indicated that
membranes were disrupted only at certain points along
their length. Apparently all the membrane systems were
affected. Similar destructive effects were found when
2, 4-dinitrophenol was applied to Chlorella pyrenoidosa
Chick cultures; chloroplast lamellae showed extreme

15
separation and derangement (Bertagnolli and Nadakavukaren,
1970). Cinnamic acid and 2, 4-dinitrophenol have similar
chemical structures and both may act similarly on Chlorella
membranes.
Glass and Bohm (1971) suggested that phenolic compounds
were not taken up by a specific transport carrier but
entered barley roots by passive movement through plasma
membranes. According to Glass (1973) there was a correlation
between lipid solubility of some phenols and their inhibitory
properties. He further suggested that when such compounds
passed through the plasma membrane, they altered some
membrane component and thereby changed the permeability of
those membranes.
Evidence presented in this paper showed that membrane
damage resulted from exposure to cinnamic acid and could
have accounted for the inhibitory effects exerted by other
phenolic acids. Phenolic acids play a role in the phenomenon
of allelopathy whereby a species of plant can inhibit the
distribution of other species by releasing phenolic acids
to the environment. Membrane damage to roots would certainly
be an effective method to inhibit growth. A better under
standing of the mechanisms of allelopathy could lead to
development of crop species which would have a competitive
advantages over certain weeds.

LITERATURE CITED
Bertagnolli, B. L. and M. J. Nadakavukaren. 1970. Effect of 2, 4-dinitrophenoxyacetic acid on the fine structure of Chlorella vulgaris Chick. J. Phycol. 6:98-100.
Bonner, J. 1950. The role of toxic substances in the interactions of higher plants. Bot. Rev. 16:51-65.
Danks, M. L., J. S. Fletcher, and E. L. Rice. 1975. Effects of phenolic inhibitors on growth and metabolism of glucose-UL--*-̂ C in Paul's scarlet rose cell-suspension cultures. Amer. J. Bot. 62:311-317.
Dedonder, A. and C. F. Van Sumere. 1971. The effect of phenolics and related compounds on the growth and respiration of Chlorella vulgaris. Z. Pflanzenphysiol. 65:70-80.
Glass, A. D. M. 1973. Influence of phenolic acids on ion uptake. I. Inhibition of phosphate uptake. Plant Physiol. 51:1037-1041.
Glass, A. D. M. 1974. Influence of phenolic acids upon ion uptake. III. Inhibition of potassium absorption. J. Exp. Bot. 25:1104-1113.
Glass, A. D. M. and B. A. Bohm. 1971. The uptake of simple phenols by barley roots. Planta. 100:93-105.
Glass, A. D. M. and J. Dunlop. 1974. Influence of phenolic acids on ion uptake. IV. Depolarization of membrane potentials. Plant Physiol. 54:855-858.
Gomori, G. 1958. Microscopic histochemistry. University of Chicago Press. Chicago, Illinois, p. 219.
Hase, E., Y. Morimura, and H. Tamiya. 1957. Some data on the growth physiology of chlorella studied by the technique of synchronous culture. Arch. Biochem. Biophys. 69:149-165.
Kandler, O. and C. Sironval. 1959. Photooxidation processes in normal green chlorella cells. II. Effects on metabolism. Biochim. Biophys. Acta 32:207-215.
Lee, T. T. and K. Skoog. 1965. Effects of substituted phenols on bud formation and growth of tobacco tissue culture. Physiol. Plant. 18:386-402.
16
17
Luft, J. H. 1961. Improvements in epoxy resin embedding methods. J. Biophys. Biochem. Cytol. 9:409-414.
Marines, N. G. and T. Hemberg. 1960. Observations on a possible mechanism of the inhibitor-B complex. Physiol. Plant. 13:571-581.
Neish, A. C. 1960. Biosynthetic pathways of aromatic compounds. Ann. Rev. Plant Physiol. 2:55-80.
Pickett, II, S. T. and J. M. Baskin. 1973. Allelopathy and its role in the ecology of higher plants. The Biologist (Phi* Sigma Soc). 55:49-73.
Pridham, J. B. 1964. The phenol glucosylation reaction in the plant kingdom. Phytochemistry 3:493-497.
Reynolds, E. S. 1963. The use of lead citrate at high pH as an electron-opaque stain in electron microscopy. J. Cell Biol. 17:208-212.
Schreiner, O. and H. S. Reed. 1908. The toxic action of certain organic plant constituents. Bot. Gaz. 45:73-102.
Sikka, H. C , J. Saxena, and G. Zweig. 1973. Alteration in cell permeability as a mechanism of action of certain quinone pesticides. Plant Physiol. 51:363-367.
Sironval, C. and O. Kandler. 1958. Photooxidation processes in normal green chlorella cells. I. The bleaching process. Biochim. Biophys. Acta 29:359-368.
Stafford, H. A. 1974. The metabolism of aromatic compounds. Ann. Rev. Plant Physiol. 25:459-486.
Stenlid, G. and K. Saddik. 1962. The effect of some growth regulators and uncoupling agents upon oxidative phosphorylation in mitochondria of cucumber hypocotyls. Physiol. Plant. 15:369-379.
Tillberg, J. 1970. Effects of abscisic acid, salicyclic acid and transcinnamic acid on phosphate uptake, ATP-level, and oxygen evolution in scenedesmus. Physiol. Plant. 23:647-653.
Vance, B. D. and D. L. Smith. 1969. Effects of five herbicides on three green algae. Tex. J. Sci. 20:329-337.

18
Van Sumere, C. F. and A. Dedonder. 1971. The effect of some naturally occurring and synthetic phenolics and related compounds on the uptake and incorporation of phenyla-lanine-l-14c by Chlorella vulgaris. Z. Pflanzenphysiol. 65:159-175.
Van Sumere, C. F., J. Cottenie, J. De Greef, and J. Kint. 1972. Biochemical studies in relation to the possible germination regulatory role of naturally occurring coumarin and phenolics. V. C. Runeckles and J. E. Watkin (ed.). Advances in Phytochemistry. Appleton-Crofts, New York. p. 165-221,
Wang, T. S. C., T. Yang, and T. Chuang. 1967. Soil phenolic acids as plant growth inhibitors. Soil Sci. 103:239-246.
Whittaker, R. H. and P. P. Feeny. 1971. Allelocheraics: chemical interactions between species. Science. 171: 757-770.
Zweig, G., J. E. Hitt and R. McMahon. 1968. Effect of certain quinones, diquat, and diuron on Chlorella pyrenoidosa Chick. (Emerson strain). Weed Sci. 16:69 73.

APPENDIX
19

20

m
I
Fig. 1. Graph showing log of the cell count per ml of culture for each cinnamic acid treatment. The counts were taken daily for one week.

21
p-K
—<D
- i n
— ^
CO
< o
liJ DC
- C O
111 CD <
—CM
'̂ cj o! h- K
o,d>cq K (O iq f^tOiD <o (6 (d
I I I I iO)00 h-
r I CO
( O CO
T CM
(D (6
- o
1W/lNnOO 1130 do 901

22

—3 Fig. 2. Graph showing the absorbance of 10 , 10 and 10"^ M cinnamic acid treated cultures at 640 nm. The readings were taken daily for one week.
-4
/r

30Nvauosav

24

Fig. 3. An electron micrograph of a control cell displaying normal morphology. Note the large central vacuole (V), nucleus (N) with electron dense areas, and chloroplast (C) containing a pyrenoid (P) with accompanying starch plates (SP). Small mitochondria (M) with poorly defined cristae are found in the cell periphery. 112,000X.

25
V̂

26

Fig. 4. A control cell showing large chloroplast (C) with starch grains. The Golgi apparatus (G) is located parallel to an elongated nucleus (N). 65,000X,
y < ^

27 I

28
3S

—5 Fig. 5. A cell which had been exposed to 10 cinnamic acid for 12 hours. The nucleus (N) and mitochondria (M) appear normal as does the pyrenoid (P) with starch plates (SP) and acciamulating starch grains (S). 45,000X.
M
/ ^

29
' ^ O

30

Fig. 6. A cell taken after 12 hours culture in lO" M cinnamic acid. Note the two chloroplasts and large central vacuole (V) with adjacent nucleus (N). Note also small mitochondria (M) with tubular cristae 44,000X.
/ ^

31

32
• I i '

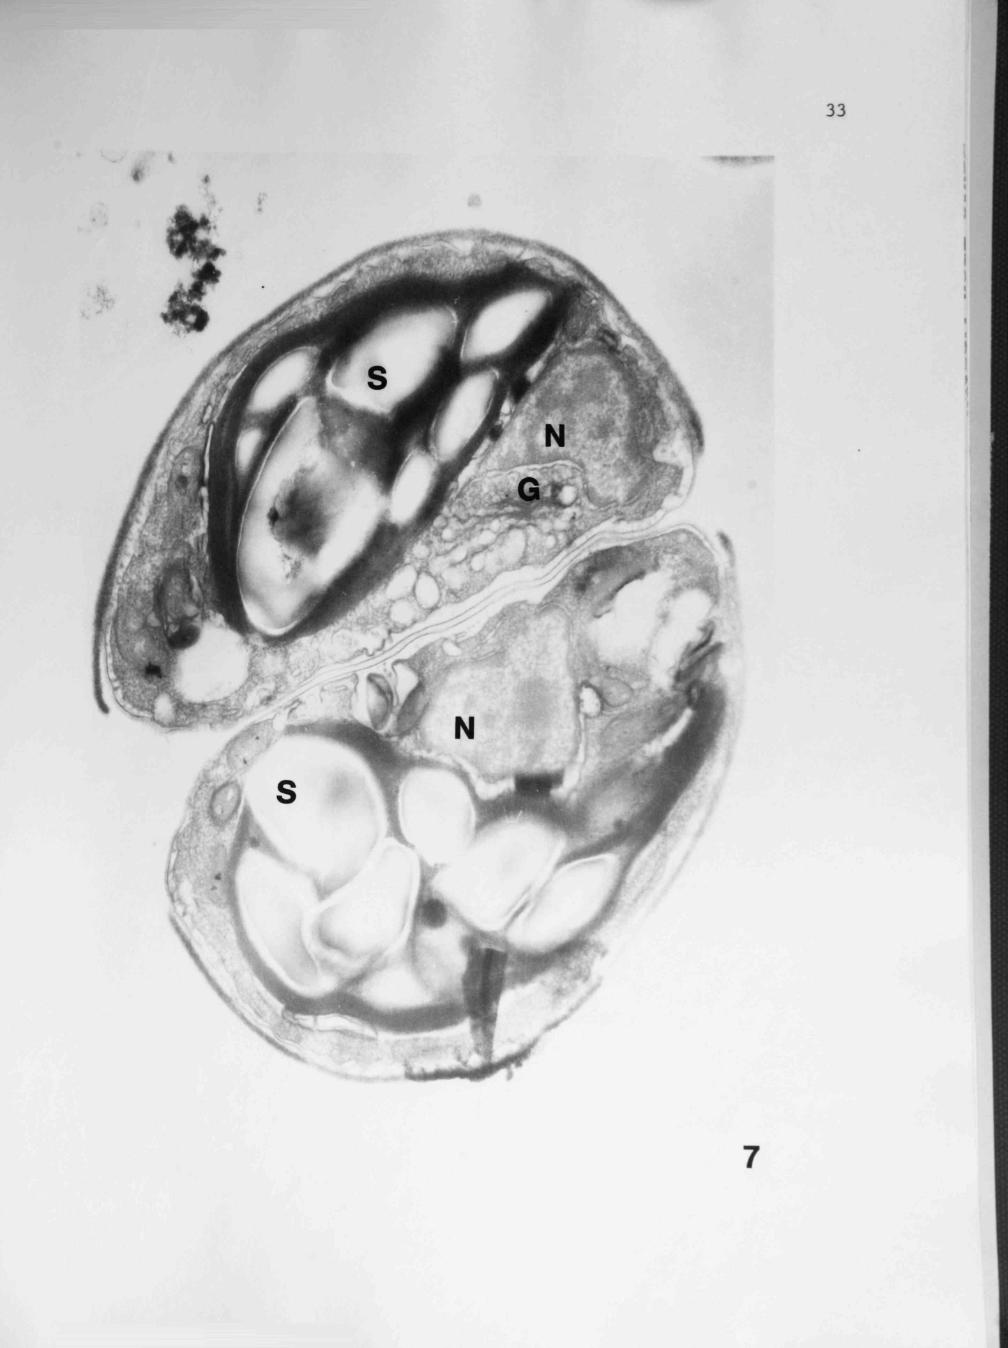
— 5 Fig. 7. These cells were cultivated in 10/ M cinnamic acid for two days. Note large accumulations of starch (S) and an active Golgi complex (G) in the region of the nucleus (N). 31,000X.
33

34
l l i

II n
S R
t:
-5 Fig. 8. A cell exposed to 10 M cinnamic acid for two days. Note two large chloroplasts (C) with pyrenoids (P). A single nucleus (N) and many small mitochondria (M) are shown. 41,GOOX.
y^

35
/ . ^
8

36

i
m
Hj n\ SI 6!
M IIunit
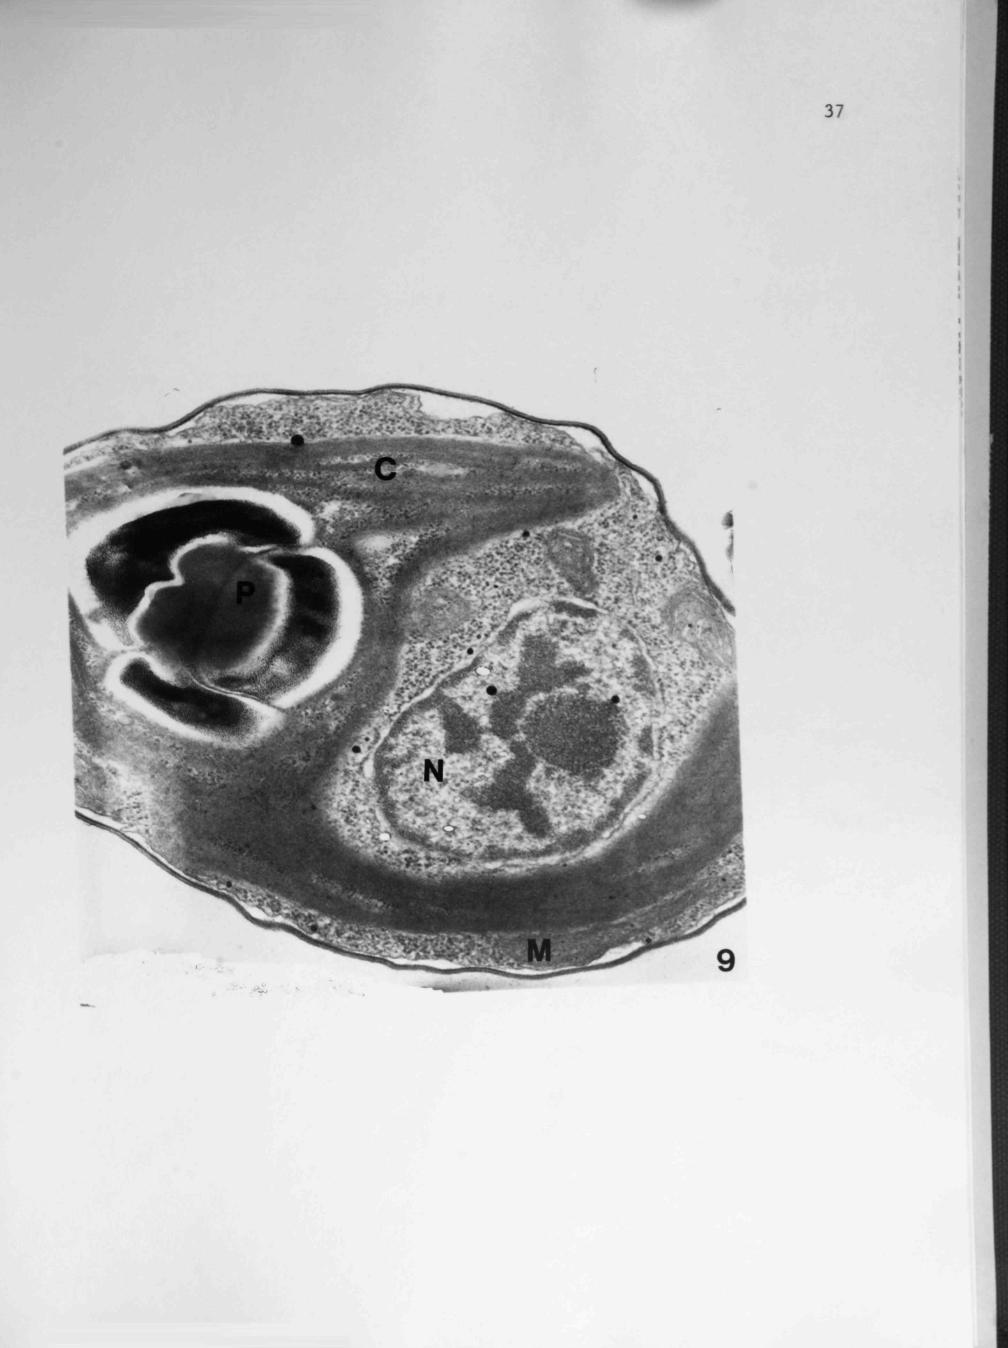
Fig. 9. A Chlorella cell treated for one minute with 10~^ M cinnamic acid. Note single chloroplast (C) with stacked thylakoid membranes and pyrenoid (P). The nucleus (N) is large and an elongated mitochondrion (M) appears below the chloroplast. 108,000X.
*t^
I, 37

38

i
I 01
Fig. 10. A cell after a 12 hour exposure to 10 M cinnamic acid. The morphology appears normal in this cell with a chloroplast (C) and a large pyrenoid (P). The vacuole (V) is small in this view and small mitochondria (M) are in the peripheral areas. 49,000X.
-4

39
40

0^
Fig. 11. A cell also taken from a 12 hour culture containing 10"^ M cinnamic acid. Note that plasma membrane is discontinuous and thylakoid membranes (TM) in the chloroplast are spread apart. The pyrenoid (P) and starch plates (SP) appear normal. Small membrane-bound vesicles (VES) are found in the outer areas of the cell. 69,000X.

41

42
i

i I
«3I
Fig. 12. A cell after 12 hours exposure to 10 M cinnamic acid. Note membrane fragments (MF) and a degenerating nucleus (N). The pyrenoid (P) appears unaffected. 86,000X.
-4
y^

43

44
1!
i i
••Bi
-3 Fig. 13. A cell after one minute in 10 M
cinnamic acid. The ultrastructure appears unchanged There's a central vacuole (V) and a chloroplast (C) with pyrenoid (P) and starch plates (SP). 68,000X.

45
13

46
i g
I! 71-
-3 Fig. 14. Chlorella after treatment with 10 M
cinneunic acid for one hour. Note remaining starch grains (S) and small membrane fragments (MF). The cell wall is still intact. 39,000X.

47

48

-3 Fig. 15- After one hour in 10 M cinnamic acid,
the starch grains (S), starch plates (SP) and pyrenoid (P) are unaltered. Small membrane fragments (MF) are found through the cell. 46,00OX.

49
^^^ •^ \
• r r . ' ^ * r*
- \ V

, u •il
f
H
1 Fig. 16. A cell after 12 hours treatment with
lO" M cinnamic acid. Note many small membrane fragments (MF) found next to the starch grains (S) and within the pyrenoid (P). 67,000X.

51