Embed Size (px)
Citation preview
Effect of welding processes on AA2219 aluminium alloy joint properties
S. MALARVIZHI, V. BALASUBRAMANIAN
Centre for Materials Joining & Research (CEMAJOR), Department of Manufacturing Engineering,
Annamalai University, Annamalai Nagar 608 002, India
Received 11 May 2010; accepted 18 November 2010
Abstract: AA2219 aluminium alloy square butt joints without filler metal addition were fabricated using gas tungsten arc welding (GTAW), electron beam welding (EBW) and friction stir welding (FSW) processes. The effects of three welding processes on the tensile, fatigue and corrosion behaviour were studied. Microstructure analysis was carried out using optical and electron microscopes. The results show that the FSW joints exhibit superior tensile and fatigue properties compared to EBW and GTAW joints. It is also found that the friction stir welds show lower corrosion resistance than EB and GTA welds. This is mainly due to the presence of finer grains and uniform distribution of strengthening precipitates in the weld metal of FSW joints. Key words: AA2219 aluminium alloy; gas tungsten arc welding; electron beam welding; friction stir welding; tensile properties; fatigue properties; pitting corrosion 1 Introduction
AA2219 alloy is an Al-Cu-Mn ternary alloy with excellent cryogenic properties. It has a unique combination of properties such as good weldability and high specific strength. The preferred welding processes for AA2219 aluminium alloy are frequently gas metal arc welding (GMAW) and gas tungsten arc welding (GTAW) due to their comparatively easier applicability and better economy. Plasma arc welding (PAW) with a positive polarity electrode and high welding current allows aluminium components to be joined economically with excellent weld quality[1]. In comparison with electric arcs, electron beam is characterized by a higher power density and thus permits a single pass welding speed up to more than 1 m/min of square butt joints with thickness up to approximately 8 mm in a flat position at welding. The electron beam welds of most weldable materials including aluminium alloys exhibit superior mechanical properties compared to the welds made using GTAW[2].
Though AA2219 alloy has better weldability compared to other grades of age hardenable aluminium alloys, it also suffers from poor welded joint strength. This is true both in autogenous welds as well as those welded with the matching filler. The loss of strength is
due to the melting and quick resolidification, which renders all the strengthening precipitates to dissolve and thus the material is as good as a cast material with solute segregation and large columnar grains[3−4]. Compared to many fusion welding processes that are routinely used for joining structural alloys, friction stir welding (FSW) is an emerging solid state joining process in which the material being welded does not melt or recast[5]. Also, FSW process is widely applied in joining of most aluminium alloys and is observed to offer several advantages over fusion welding due to the absence of parent metal melting. During welding, the frictional heat associated with thermal cycle varies in transverse direction of the weld. Maximum temperature observed in the FSP zone causes alteration in the precipitate distribution present in the base material due to the stirring of the plasticized material. These changes in the heat and temperature distribution in welding process alter the strength and ductility of the joints[6]. In this investigation, the tensile, fatigue and corrosion behaviours of GTAW, EBW and FSW joints of AA2219 aluminium alloy were compared. 2 Experimental
The rolled plates of AA2219-T87 aluminium alloy were cut and machined to a size of 300 mm×150 mm×
Foundation item: Project DRAO/08/1061356/M1 supported by Aeronautical Research & Development Board (ARDB), New Delhi, India Corresponding author: V. BALASUBRAMANIAN; Tel: +91-4144-239734; Fax: +91-4144-239734/238275; E-mail: [email protected] DOI: 10.1016/S1003-6326(11)60808-X

S. MALARVIZHI, et al/Trans. Nonferrous Met. Soc. China 21(2011) 962−973 963
5 mm by power hacksaw cutting and grinding. The chemical composition of base metal is listed in Table 1. Square butt joints were prepared to fabricate GTAW, EBW and FSW joints without filler metal additions, and the dimensions are shown in Fig.1(a). GTAW joints were fabricated using Lincoln welding machine (USA) with a capacity of 400 A. EBW joints were fabricated using an electron beam welding machine (Techmeta, France) with a capacity of 100 kV. FSW joints were fabricated using an indigenously designed and developed FSW machine (11 190 W; 3000 r/min; 50 kN) using a non-consumable high carbon steel tool. Welding conditions were optimized to fabricate the joints without defects. The welding conditions and process parameters are presented in Table 2.
The welded joints were sliced using power hacksaw and then machined to the required dimensions. Two types of tensile test specimens, smooth unnotched and notched specimens were prepared as per the ASTM E8M-04 specification. Tensile test was carried out on an electro-mechanically controlled universal testing machine at 100 kN (FIE, India; UNITECH 94001). The 0.2% offset yield strength, ultimate tensile strength, elongation and joint efficiency were recorded from unnotched specimen, and the dimensions are shown in Fig.1(b). Notch tensile strength and notch strength ratio were evaluated using notched specimen, and the dimensions are shown in Fig.1(c). Table 1 Chemical composition of base metal (mass fraction, %)
Cu Mn Fe Zr V Si Ti Zn Al
6.33 0.34 0.13 0.12 0.07 0.06 0.04 0.02 Bal. Table 2 Welding conditions and process parameters
Parameter GTAW EBW FSW Current 150 A 51 mA Voltage 30 V 50 kV Speed 3 mm/s 16 mm/s
Polarity AC DC − Vacuum − 10 Pa
Shielding gas 99.99% Ar − −
Gas flow rate 14 L/min − −
Tool rotational speed
1400 r/min
Welding speed 1.5 mm/s
Axial force 12 kN
FSW tool details
Threaded pin with size of
d6 mm×4.8 mm made of high carbon steel
Fig.1 Dimensions of various test specimens (Unit: mm): (a) Square butt joint; (b) Unnotched tensile/fatigue specimen; (c) Notched tensile/fatigue specimen; (d) Centre cracked tensile (CCT) specimen; (e) Pitting corrosion specimen
Unnotched (smooth) specimens were taken from welded joints in transverse direction (normal to the welding direction) to evaluate the fatigue life, and the dimensions are shown in Fig.1(b). Notched specimens were also taken from welded joints to evaluate the fatigue notch factor and notch sensitivity factor, and the dimensions are shown in Fig.1(c). The fatigue testing experiments were conducted at different stress levels and all the experiments were conducted under uniaxial tensile loading condition (stress ratio=0) using servo hydraulic fatigue testing machine (INSTRON, UK; Model: 8801). At each stress levels three specimens were tested and the average values of the test results were used to plot S—N

S. MALARVIZHI, et al/Trans. Nonferrous Met. Soc. China 21(2011) 962−973 964
curves. Centre cracked tension (CCT) fatigue crack growth
test specimen were prepared with the dimensions as shown in Fig.1(d). The slices derived from the single pass welded joints were reduced to a thickness of 4 mm by shaping and grinding processes to obtain flat and required surface roughness. Then the sharp notch was machined in the weld metal region to required length using a wire cut electric-discharge machine (EDM). Procedures prescribed by the ASTM E647-04 standard were followed in the preparation of specimens.
Fatigue crack growth experiment was conducted using a servohydraulic controlled, 100 kN capacity UTM (INSTRON, UK; Model: 8801) with a frequency of 10 Hz under constant amplitude loading (stress ratio=σmin/σmax=0). Fatigue crack growth experiments were carried out at four different stress levels of 25, 50, 75 and 100 MPa, respectively. Before loading, the specimen surface was polished by metallographic procedures and illuminated suitably to enable the crack growth measurement. A traveling microscope (MITUTOYA; Model: 5010) was used to monitor the crack growth with an accuracy of 0.01 mm. In this investigation, the applied stress cycle was in the tensile mode (the minimum stress was kept zero) as the compressive mode usually closes the fatigue crack. The data points measured with an accuracy of 0.01 mm were fitted with a smooth curve in the form of crack length L vs number of cycles N.
For pitting corrosion test, specimens with size of 20 mm×30 mm were prepared to ensure an exposure circular area with diameter of 6 mm in the weld region to the electrolyte. The rest of the area was covered with an acid resistant lacquer. Standard metallographic procedures were followed to prepare the specimens. The dimensions of the specimen are shown in Fig.1(e).
Vicker’s microhardness testing machine (Shimadzu, Japan) was employed to measure the hardness across the joint under 0.49 N load. Microstructural analysis was carried out using a light optical microscope (MEIJI, Japan, Model: ML7100) incorporated with an image analyzing software (Clemex-Vision). The specimens for microstructural analysis that were sectioned to required size from the joint comprising weld metal, HAZ and base metal regions were polished using different grades of emery papers. Final polishing was done using the diamond compound with particle size of 1 μm in the disc-polishing machine. Specimens were etched with Kellers reagent to reveal the microstructure.
Since most of the joints were failed in the weld region, the weld zone of the joints alone were analysed using transmission electron microscope (PHILIPS, Model: CM20) to get more information about the size and distribution of the precipitates. Electron dispersive
X-ray (EDX) analysis was also undertaken to identify the composition of specific precipitates. Scanning electron microscope (JEOL, Japan; Model: 5610LV) at higher magnification was used to study the fracture morphology of tensile tested specimens to establish the nature of the fracture. 3 Results 3.1 Tensile properties
The experimentally evaluated transverse tensile properties of welded AA 2219 aluminium alloy joints are presented in Table 3 and all the data are the average of three measured values. The unwelded parent metal shows a yield strength and tensile strength of 390 and 470 MPa, respectively. Of the three welded joints, the GTAW joints show the lowest yield strength and tensile strength of 220 and 242 MPa, respectively. This suggests that there is a 50% reduction in strength values due to GTA welding. FSW joints show the highest yield strength and tensile strength of 305 and 342 MPa, respectively. Though these values are lower than those of the base metal, the strength values are 40% higher than those of GTAW joints. EBW joints show yield strength and tensile strength of 265 and 304 MPa, respectively, which are 30% higher than those of GTAW joints but 15% lower than those of FSW joints. Table 3 Transverse tensile properties of welded joints
Property BM GTAW EBW FSWYield strength/MPa 390 220 265 305
Ultimate tensile strength/MPa
470 242 304 342
Elongation/% 15.0 8.8 10.4 12.2
Reduction in cross sectional area/%
10.5 6.2 7.5 8.6
Notch tensile strength/MPa
442 182 243 291
Notch strength ratio 0.93 0.75 0.80 0.85Joint efficiency/% − 51 64 72
The unwelded parent metal shows an elongation and
reduction in cross sectional area (CSA) of 15% and 10.5%, respectively. Of the three welded joints, the GTAW joints show the lowest elongation and reduction in cross sectional area of 8.8% and 6.2%, respectively. This suggests that there is a 40% reduction in ductility values due to GTA welding. FSW joints show the highest elongation and reduction in cross sectional area of 12.2% and 8.6%, respectively. Though these values are lower than those of the base metal, the ductility values are 40% higher than those of GTAW joints. EBW joints also show the elongation and reduction in cross

S. MALARVIZHI, et al/Trans. Nonferrous Met. Soc. China 21(2011) 962−973 965
sectional area of 10.4% and 7.5%, respectively, which are 20% higher than those of GTAW joints but 15% lower than those of FSW joints.
Notch strength ratio (NSR) is the ratio between tensile strength of notched specimen and that of unnotched specimen. The NSR value of unwelded base plate and welded joints is less than 1. From these results, it can be inferred that the AA2219 alloy is sensitive to notches and it falls into the notch brittle materials category. Of the three welded joints, FSW joints show the highest NSR of 0.85 (sensitivity to notches is lower) and GTAW joints show the lowest NSR of 0.75 (sensitivity to notches is higher). Of the three welded joints, the FSW joints show the highest joint efficiency of 72%, which is 20% higher than that of GTAW joints and 12% higher than that of EBW joints. 3.2 Fatigue properties
Figure 2 shows the S—N curves of unnotched and notched specimens. The effect of welding processes on fatigue life of the joints is revealed by these figures. When comparing the fatigue strength of different welded joints subjected to similar loading, it is convenient to express fatigue strength in terms of particular lives corresponding to the stresses, on the mean S—N curve. The choice of reference life is quite arbitrary, 2×10⁶
Fig.2 S—N curves of unnotched (a) and notched (b) specimens
cycles is used, and indeed some design codes refer to their S—N curves in terms of the corresponding stress range[7]. For these reasons, in this investigation, fatigue strength of welded joints at 2×10⁶ cycles was taken as the endurance limit for comparison. The endurance limit was evaluated for all the joints and they are presented in Table 4. Table 4 Fatigue properties of joints
Jointtype
Fatigue strength of unnotched
specimens at 2×10⁶
cycles/MPa
Fatigue strength of notched specimens at 2×10⁶
cycles/MPa
Fatiguenotchfactor(Kf)
Notch sensitivity
factor(q)
BM 200 110 1.82 0.33
GTAW 110 50 3.21 0.75
EBW 150 55 2.73 0.69
FSW 180 80 2.19 0.48
The fatigue strength of unwelded AA2219
aluminium alloy is 200 MPa. All the three welding processes are found to be detrimental on the fatigue strength of AA2219 aluminium alloy and it is clearly evident from Fig.2(a). Of the three joints, the joints fabricated by FSW process exhibit very high fatigue strength. The fatigue strength of FSW joint is 180 MPa, which is 10% lower compared to that of the base metal. EBW joints show a fatigue strength of 150 MPa, which is 25% lower than that of the base metal. GTAW joints show the lowest fatigue strength of 110 MPa, which is 45% lower than that of the base metal.
The effect of notches on fatigue strength is determined by comparing the S—N curves of notched and unnotched specimens. The data for notched specimens are usually plotted in terms of nominal stress based on the net section of the specimen. The effect of the notch in decreasing the fatigue limit is expressed by the fatigue strength reduction factor or fatigue notch factor Kf. The fatigue notch factor for all the joints is evaluated using the following expression[8] and given in Table 4. Kf=Fatigue limit of unnotched specimen/Fatigue limit of notched specimen (1)
The notch sensitivity of a material in fatigue is expressed by a notch sensitivity factor q which can be evaluated as[8]: q=(Kf−1)/(Kt−1) (2) where Kt is the theoretical stress concentration factor and it is the ratio of maximum stress to nominal stress. Using the above expression, the fatigue notch sensitivity factor ‘q’ is evaluated for all the joints and is presented in Table 4.

S. MALARVIZHI, et al/Trans. Nonferrous Met. Soc. China 21(2011) 962−973 966
The fatigue notch factor of unwelded AA2219 aluminium alloy is 1.82, and that of as welded (AW) joint is 2.73. Of the three joints, the joint fabricated by FSW process exhibits very low fatigue notch factor and the joint fabricated by GTAW process shows very high fatigue notch factor. Similar trend is observed in notch sensitivity factor since it is derived from fatigue notch factor values. Generally, if the fatigue notch factor is lower, then the fatigue life of the joints is higher and vice versa[8]. 3.3 Fatigue crack growth behaviour
The measured variations in crack length (2a) and the corresponding number of cycles (N) endured under the action of particular applied stress range for all the joints are plotted in Fig.3. The fracture mechanics based on Paris Power equation[9] is used to analyse the experimental results as: da/dN=C(ΔK)m (3) where da/dN is the crack growth rate; ΔK is the stress intensity factor (SIF) range; C and m are constants.
Fig.3 Crack growth curves of joints with applied stress of 100 MPa
The SIF value ΔK is calculated from different growing fatigue crack length 2a as[10]:
aK π)Δ(Δ σφ= (4)
where φ is the geometry factor for the CCT specimen, ∆σ is the applied stress, it is calculated as: φ=F(α)=sec{(α)/2} (5) where α=a/W and W is the width of the specimen.
The crack growth rate da/dN for the propagation stage is calculated for steady state growth regime at different intervals of crack length increment which is against the associated number of cycles to propagation and explained in the earlier section. The relationship between SIF range and the corresponding crack growth
rate in terms of best fit lines for all joints is shown in Fig.4. The data points plotted in the graph mostly correspond to the second stage of Paris sigmoidal relationship (10−6 to 10−3 mm/cycle). The exponent m, which is the slope of the line on log-log plot, and the intercept C of the line were determined and shown in Table 5.
Fig.4 Relationship between crack growth rate and SIF range Table 5 Fatigue crack growth parameters
Joint type
Crack growth exponent, m
Intercept, C/10−8
Threshold SIF range, ΔKth/
(MPa·m1/2)
Critical SIF range, ΔKcr/
(MPa·m1/2)BM 2.85 2.44 4.0 30
GTAW 4.10 3.40 2.3 10 EBW 3.76 3.98 2.5 12 FSW 3.57 1.68 3.0 20
At higher crack growth rate, around 10−3 mm/cycle,
unstable crack growth occurs and hence corresponding ΔK value is taken as critical SIF range (ΔKcr). At lower crack growth rate (below 10−6 mm/cycle), the crack growth is found to be dormant and hence the corresponding ΔK is taken as threshold SIF (ΔKth). The values of ΔKcr and ΔKth for all the joints are evaluated and presented in Table 5.
The crack growth exponent m, which is derived from the relationship existing between crack growth rate (da/dN) and SIF range, is an important parameter to evaluate the fatigue crack growth behaviour of materials since it decides the fatigue crack propagation life of the materials[11]. The fatigue crack growth exponent of unwelded AA2219 aluminium alloy is 2.85. Of the three welded joints, the FSW joint exhibits a very low fatigue crack growth exponent value. The fatigue crack growth exponent of FSW joint is 3.57, which is approximately 25% higher than that of the base metal. The fatigue crack growth exponent of EBW joint is 3.76, which is 33%

S. MALARVIZHI, et al/Trans. Nonferrous Met. Soc. China 21(2011) 962−973 967
higher than that of the base metal. The fatigue crack growth exponent of GTAW joint is 4.10, which is 45% higher than that of the base metal. If the fatigue crack growth exponent is larger, then the crack growth rate will be higher and the corresponding fatigue life will be lower. 3.4 Pitting corrosion behaviour
The polarization studies of the weld specimens were carried out in non-deaerated 3.5% NaCl solution with pH values of 4, 7 and 11. A potentiostat (Gill AC) was used in conjunction with an ASTM standard cell and personal computer. The potentiostat typical polarization curves for the welded joints are obtained individually and then compiled in an order, as shown in Fig.5. Pitting potential (φpit) is taken as the criterion for comparison of pitting corrosion resistance. φpit values for all the joints are experimentally determined and the values are presented in Table 6. Joints exhibiting lower negative potential (i.e., higher positive potential) values of pitting potential are considered to be more corrosion resistant.
Fig.5 Polarization curves obtained at 3.5% NaCl solution with pH value of 4 Table 6 Pitting potential values of joints (mV)
Joint type BM GTAW EBW FSW
pH=4 −200 −145 −250 −350
pH=7 −475 −425 −525 −575
pH=11 −575 −530 −620 −700
3.5 Hardness
The base metal (unwelded parent metal) in its initial T87 condition shows a hardness of HV 140. The hardness is greatly reduced in the weld metal, irrespective of welding processes. This is one of the reasons for the invariable locations of failure at the weld metal. GTAW joint shows the lowest hardness of HV 90 at weld center. This suggests that the hardness is reduced by HV 50 in the weld center due to welding heat. FSW joint shows
the highest hardness of HV 110 at the weld centre. Though this value is much lower than that of the base metal, it is HV 20 higher than that of GTAW joint and HV 5 higher than that of EBW joint. 3.6 Microstructure
Optical micrographs of the joints in weld metal are shown in Fig.6. The base metal contains coarse and elongated grains in the rolling direction (Fig.6(a)). The weld metal of GTAW joint shows coarse and elongated grains normal to the welding direction (Fig.6(b)). The weld metal of EBW joint contains smaller grains than GTAW joint (Fig.6(c)). The weld metal of FSW joint contains finer grains (Fig.6(d)) compared to GTAW and EBW joints. However, the size and distribution of strengthening precipitates are not seen clearly in the optical micrographs, and hence the weld metal of the joints was further analyzed using transmission electron microscope. The evenly distributed fine precipitate, as shown in Fig.7(a) is one of the reasons for higher strength of AA2219 aluminium alloy. In GTAW joint, the precipitates are completely dissolved in the matrix and very few particles are seen, as shown in Fig.7(b). The weld metal of EBW joint experiences a fast cooling rate and the resulting material is like solutionized material (see Fig.7(c)) with a little amount of undissolved precipitates. In FSW joint, the particles are fine and uniformly distributed throughout the matrix (see Fig.7(d)), which almost matches the base metal micrograph.
Electron dispersive X-ray analysis (EDAX) was carried out to identify the precipitates. Figure 8 shows the EDAX results and it is confirmed that all the precipitates are Al-Cu type. The left out precipitates in as welded GTAW joint (Fig.8(a)) contain 5.2% copper and 94.4% aluminium (mass fraction). The undissolved precipitates of as welded EBW joint contain 8% copper and 92% aluminium (Fig.8(b)). The precipitates of as welded FSW joint (Fig.8(c)) contain 14.7% copper and 85.3% aluminium.
Figure 9 shows the dislocation cell structure observed in the weld region at high magnification. The as welded GTAW joint (Fig.9(b)) exhibits widely spaced and less dense dislocation cell structure in the weld region. The as welded EBW joint (Fig.9(c)) exhibits evenly spaced and less dense dislocation cell structure in the weld region. The as welded FSW joint exhibits (Fig.9(d)) closely spaced and dense dislocation cell structure. 3.7 Fracture surface
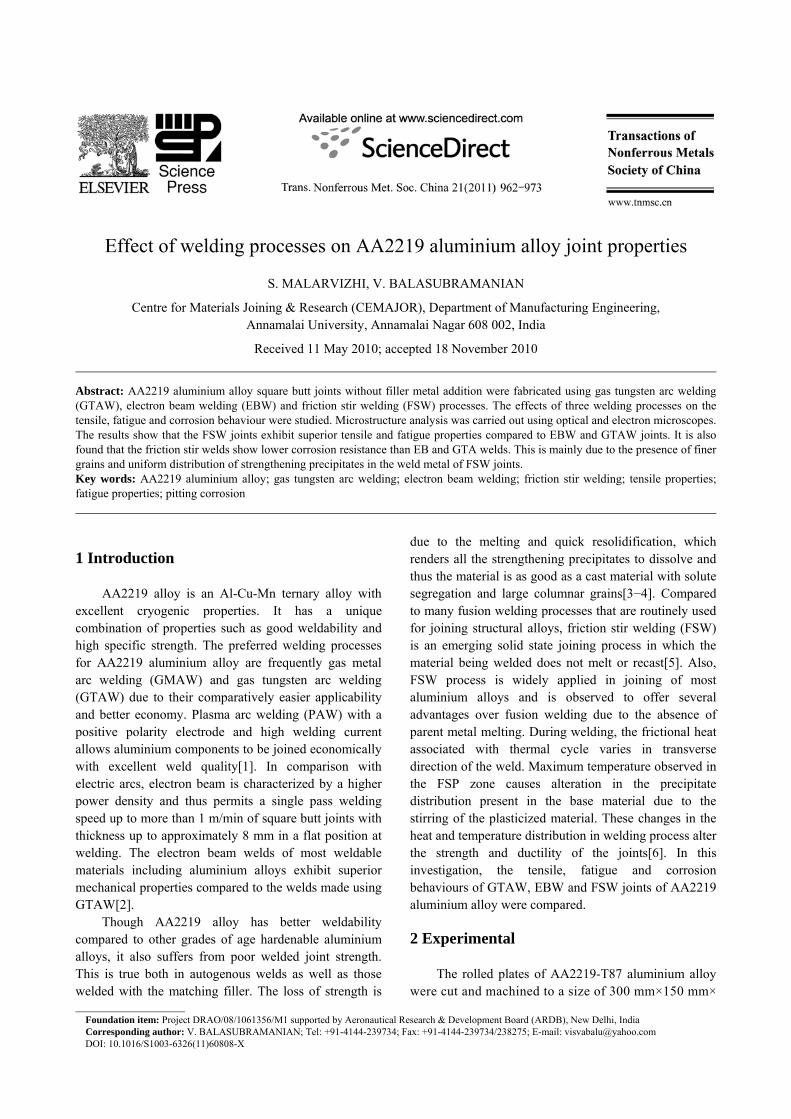
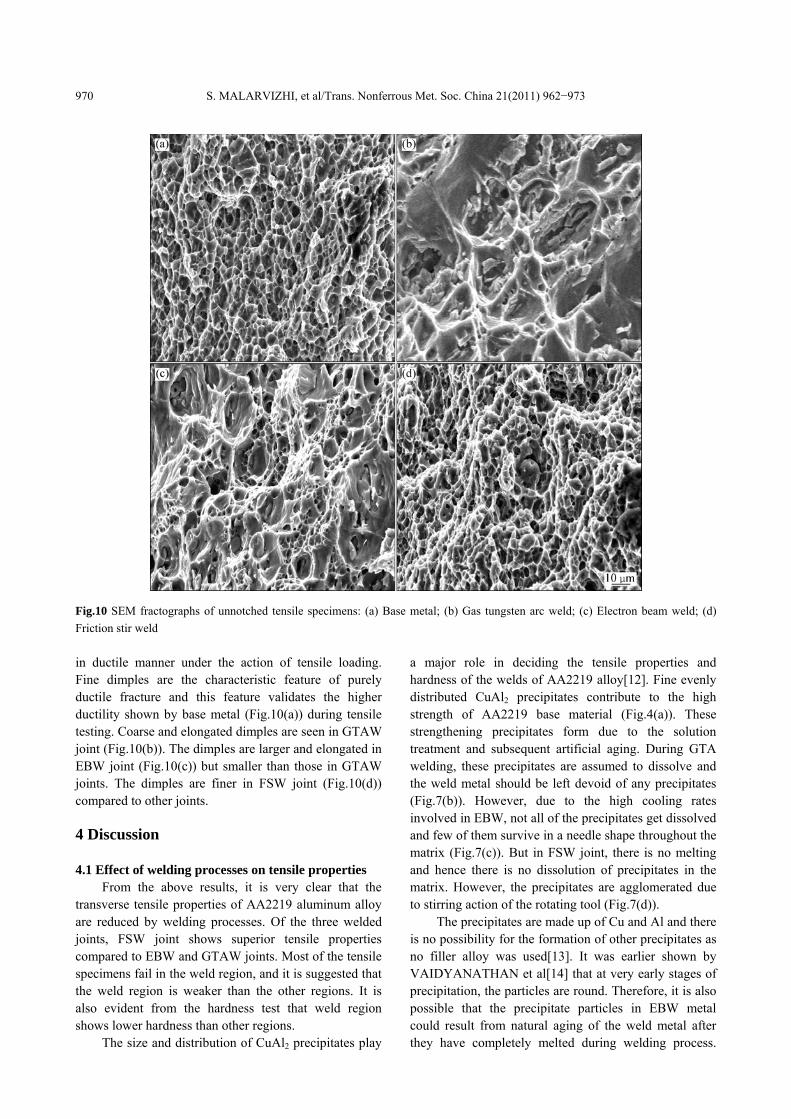
The fractographs of fatigue specimens are shown in Fig.10 and they invariably consist of dimples, which is an indication that most of the unnotched specimens fail

S. MALARVIZHI, et al/Trans. Nonferrous Met. Soc. China 21(2011) 962−973 968
Fig.6 Optical micrographs of base metal (a), gas tungsten arc weld (GTAW) metal (b), electron beam weld (EBW) metal (c) and friction stir weld (FSW) metal (d)
Fig.7 TEM images of base metal (a), gas tungsten arc weld metal (b), electron beam weld metal (c) and friction stir weld metal (d)

S. MALARVIZHI, et al/Trans. Nonferrous Met. Soc. China 21(2011) 962−973 969
Fig.8 EDAX results of base metal (a), gas tungsten arc weld metal (b), electron beam weld metal (c) and friction stir weld metal (d)
Fig.9 TEM images of dislocation cell structures in base metal (a), gas tungsten arc weld (b), electron beam weld (c) and friction stir weld (d)
S. MALARVIZHI, et al/Trans. Nonferrous Met. Soc. China 21(2011) 962−973 970
Fig.10 SEM fractographs of unnotched tensile specimens: (a) Base metal; (b) Gas tungsten arc weld; (c) Electron beam weld; (d) Friction stir weld in ductile manner under the action of tensile loading. Fine dimples are the characteristic feature of purely ductile fracture and this feature validates the higher ductility shown by base metal (Fig.10(a)) during tensile testing. Coarse and elongated dimples are seen in GTAW joint (Fig.10(b)). The dimples are larger and elongated in EBW joint (Fig.10(c)) but smaller than those in GTAW joints. The dimples are finer in FSW joint (Fig.10(d)) compared to other joints.
4 Discussion 4.1 Effect of welding processes on tensile properties
From the above results, it is very clear that the transverse tensile properties of AA2219 aluminum alloy are reduced by welding processes. Of the three welded joints, FSW joint shows superior tensile properties compared to EBW and GTAW joints. Most of the tensile specimens fail in the weld region, and it is suggested that the weld region is weaker than the other regions. It is also evident from the hardness test that weld region shows lower hardness than other regions.
The size and distribution of CuAl2 precipitates play
a major role in deciding the tensile properties and hardness of the welds of AA2219 alloy[12]. Fine evenly distributed CuAl2 precipitates contribute to the high strength of AA2219 base material (Fig.4(a)). These strengthening precipitates form due to the solution treatment and subsequent artificial aging. During GTA welding, these precipitates are assumed to dissolve and the weld metal should be left devoid of any precipitates (Fig.7(b)). However, due to the high cooling rates involved in EBW, not all of the precipitates get dissolved and few of them survive in a needle shape throughout the matrix (Fig.7(c)). But in FSW joint, there is no melting and hence there is no dissolution of precipitates in the matrix. However, the precipitates are agglomerated due to stirring action of the rotating tool (Fig.7(d)).
The precipitates are made up of Cu and Al and there is no possibility for the formation of other precipitates as no filler alloy was used[13]. It was earlier shown by VAIDYANATHAN et al[14] that at very early stages of precipitation, the particles are round. Therefore, it is also possible that the precipitate particles in EBW metal could result from natural aging of the weld metal after they have completely melted during welding process.

S. MALARVIZHI, et al/Trans. Nonferrous Met. Soc. China 21(2011) 962−973 971
There is a slight coarsening of the precipitates due to the welding heat in the case of EB welds.
BONDAREV[15] found that the coagulation of secondary phase particles in GTAW joint could also explain its lower strength than that of the EBW joint. There are no oxide film inclusion and pores in EBW joint and the structure in the heat affected zone (HAZ) is slightly changed, and the structural and chemical heterogeneity in fusion region is lower. Hence the tensile strength of the joint is 20% greater than that of GTAW. Both GTAW and EBW result in precipitate free zone (PFZ) due to the solution treatment of the weld zone by sufficient heat input caused by thermal cycle during welding[16]. Since the PFZ is soft, strain concentration will be extremely high even though the macroscopic strain is very low. This produces voids which then grow and coalesce along the PFZ leaving a coarse dimpled structure. Hence, the matrix of the weld zone comprising precipitate free zone results in the lowest hardness in the weld zone when compared to FSW joint with correspondingly poor tensile properties.
Fine equiaxed grains in the FSW region imply that dynamic recrystallization has taken place during FSW due to plastic deformation at elevated temperature. In heat treatable alloys, the static properties of the friction stir welds are dependent on the distribution of strengthening precipitates rather than the grain size[17]. The frictional heat and mechanical working of the plasticized material in the weld zone result in coarse and agglomerated precipitates in some areas and the distribution of few needle shaped precipitates in the weld nugget, which leads to considerable softening in contrast to the base metal. This decreases the hardness in FSW joints considerably and yields lower tensile strength than base metal. 4.2 Effect of welding processes on fatigue properties
From the fatigue results, it is very clear that the fatigue properties of AA2219 aluminum alloy are greatly reduced by welding processes. Of the three welded joints, FSW joint shows better fatigue performance compared to EBW and GTAW joints. The reasons for the better fatigue performance of the FSW joint are: 1) superior tensile properties of the welded joints, 2) favorable microstructure in the weld region and 3) preferable size and distribution of strengthening precipitates.
FSW joint with higher yield strength and tensile strength is greatly used to enhance the endurance limit of these joints, and hence the fatigue crack initiation is delayed. Larger elongation (higher ductility) of the FSW joints also impart greater resistance to fatigue crack propagation and hence fatigue crack growth rate is comparatively slow. The combined effect of higher yield strength and higher ductility of the FSW joint offers
enhanced resistance to crack initiation and crack propagation and hence the fatigue performance of the FSW joint is superior compared to other joints. Similarly, the uniformly distributed, very fine particles might impede the growing fatigue cracks and hence the fatigue crack growth rate is delayed[18] and subsequently the resistance to the fatigue crack propagation is enhanced compared to other joints.
In the weld metal with lower strength, as in the case of GTAW joint, since the deformation and the yielding are mainly concentrated in the weld metal zone, the extension of the plastic zone is limited within the weld metal. As soon as the plastic zone reaches the fusion line, plasticity keeps on developing along the interface between the parent material and the weld metal[19]. The triaxial state of stress is high in the weld metal and the relaxation of this stress is poor. The crack driving force needed for crack extension is small, so the fracture toughness of the weld metal with lower strength is not high. On the other hand, if the strength of the weld metal is more or less equal to the base metal, as in the case of FSW joint, the plastic zone can easily extend into the parent material because the deformation and yielding occur in both weld metal and the base metal. The stress relaxation can easily take place in the crack tip region, so more crack driving force is needed for crack extension and the fracture resistance of the weld metal with higher strength is greater than that of the lower strength[20]. This is also one of the reasons for the better fatigue performance of the FSW joint.
Of the three welded joints, the weld region of FSW joint consists of finer dynamically recrystallized grains (resultant of thermo mechanical processing caused by the process) than EBW and GTAW joints. The GTAW joint contains coarse and elongated grains in the weld region (resultant of high heat input of the process). The material with finer grains obviously has large grain boundary area, which in turn will offer more resistance to the growing fatigue cracks. The grain boundaries which are rich in stored energy offer more resistance to the growing fatigue cracks than grain interior. This may be one of the reasons for superior fatigue crack growth resistance of FSW joints compared to EBW and GTAW joints.
Not only the grain size influences the fatigue crack growth resistance, but also the size and distribution of strengthening precipitates influence the fatigue crack growth behaviour of welded joints[21]. FSW joint contains fine and uniformly distributed precipitates throughout the matrix compared to EBW and GTAW joints. The PFZ is very small in FSW joint, which is attributed to the superior high tensile and hardness of FSW joints. The uniformly distributed, very fine particles might impede the growing fatigue cracks and hence the fatigue crack growth rate is delayed and

S. MALARVIZHI, et al/Trans. Nonferrous Met. Soc. China 21(2011) 962−973 972
subsequently the resistance to the fatigue crack propagation is enhanced compared to EBW and GTAW joints. The combined effect of very fine, dynamically recrystallized grains and uniformly distributed strengthening precipitates enhances the resistance to crack initiation and propagation, and hence the fatigue performance of the FSW joint is superior as compared to EBW and GTAW joints. 4.3 Effect of welding processes on pitting corrosion
behaviour Intermetallics such as CuAl2, Al7Cu2Fe and
(Al,Cu)6(Fe,Cu) are the initiation sites for pitting in Al-Cu alloys. The pitting is due to local dissolution of the matrix or the intermetallics because there is galvanic coupling between intermetallics and matrix. The intermetallics containing Cu and Fe are cathodic with respect to matrix and promote the dissolution of the matrix, while Cu-rich intermetallics are anodic with respect to the matrix and dissolve preferentially[22].
In the GTAW joint, less precipitates are available due to partial dissolution of precipitates during welding, and hence the available preferential nucleation sites for pitting corrosion are less. This may be the reason for better pitting corrosion resistance of GTAW joint compared to EBW and FSW joints. But in EBW joint, the formation of precipitates is inevitable due to the above reasons, and hence the preferential nucleation sites for pitting corrosion are relatively more than those of the GTAW joints. This may be attributed to the poor corrosion resistance of EBW joint compared to GTAW joint. In FSW joint, the intermetallics are finer in size and more in number compared to that in GTAW and EBW joints due to thermo-mechanical processing. Hence, more initiation sites for pitting corrosion are available and this may be one of the reasons for the deteriorated pitting corrosion resistance of FSW joints. 5 Conclusions
1) Of the three welded joints, FSW joint shows superior tensile and fatigue properties, but GTAW joint exhibits better pitting corrosion resistance compared to their counterparts.
2) FSW joint shows the highest joint efficiency of 72%, which is 20% higher than that of GTAW joint and 12% higher than that of EBW joint. The fatigue strength of FSW joint is 180 MPa, which is 20% higher than that of EBW joint and 60% higher than that of GTAW joint. GTAW joint exhibits higher pitting corrosion resistance than EBW and FSW joints.
3) The formation of fine equiaxed grains (due to dynamic recrystallization), less precipitate free zone and dense dislocation cell structure in the weld region are the
main reasons for the superior tensile and fatigue properties of FSW joints and the deteriorating pitting corrosion resistance of FSW joints. Acknowledgements
The authors are grateful to Mr. N. VISWANATHAN, Retired Scientist of Defence Research & Development Laboratory (DRDL), Hyderabad for providing EBW facility to carry out this investigation. References [1] TOSTO S, NENCI F, HU J. Microstructure and properties of
Electron Beam welded and Post Welded 2219 Aluminium alloy [J]. Material Science and Technology, 1996, 12(4): 323−328.
[2] HARTMAN J A, BEIL R J, HAHN G T. Effect of copper rich regions on tensile properties of VPPA weldments of 2219-T87 aluminum [J]. Welding Journal, 1987, 1: 73−83.
[3] KOTESWARA R S R, MADHUSUDHANA R G, SRINIVASA R K, KAMARAJ M, PRASAD R K. Reasons for superior mechanical and corrosion properties of 2219 aluminum alloy electron beam welds [J]. Materials Characterization, 2006, 40(4−5): 236−248.
[4] MALARVIZHI S, RAGHUKANDAN K, VISWANATHAN N. Effect of post weld aging treatment on tensile properties of electron beam welded AA2219 aluminium alloy [J]. International Journal of Advanced Manufacturing Technology, 2008, 37(3): 294−301.
[5] CHEN Ying-chun, LIU Hui-jie, FENG Ji-cai. Friction stir welding characteristics of different heat-treated-state 2219 aluminium alloy plates [J]. Mater Sci Eng A, 2006, 420(1−2): 21−25.
[6] ELANGOVAN K, BALASUBRAMANIAN V. Influences of pin profile and rotational speed of the tool on the formation of friction stir processing zone in AA2219 aluminium alloy [J]. Mater Sci Eng A, 2007, 422(1−2): 19−32.
[7] MADDOX S J. Review of fatigue assessment procedures for welded aluminium structures [J]. International Journal of Fatigue, 2003, 25(12): 1359−1378.
[8] HOBBACHER A. Recommendations for assessment of weld imperfections in respect to fatigue [C]//Doc XIII, 1266-1288/ XV659-88, 1988.
[9] JACCARD R. Fatigue crack propagation in aluminium [C]//Doc XIII, 1990: 1377−1390.
[10] DIETER G E. Mechanical metallurgy [M]. 4th ed. New York: Tata McGraw Hill, 1988: 352−355.
[11] SONSINO C M. Fatigue assessment of welded joints in Al-Mg- 4.5Mn aluminium alloy AA 5083 by local approaches [J]. International Journal of Fatigue, 1999, 21: 985−999.
[12] HUANG C, KOU S. Partially melted zone in aluminium welds-planar and cellular solidification [J]. Welding Journal, 2001, 80(1): s46−s53.
[13] KOSTRIVAS A, LIPPOLD J C. A method of studying weld fusion boundary microstructure evolution in Aluminium alloys [J]. Welding Journal, 2000, 79(1): s1−s8.
[14] VAIDYANATHAN V, WOLVERTON C, CHEN L Q. Multiscale modeling of ‘θ’ precipitation in Al-Cu binary alloys [J]. Acta Materialia, 2004, 52(10): 2973−2987.
[15] BONDAREV A A. Electron beam welding of an Al-Cu-Mn alloy [J]. Avt Svarka, 1974, 2(1): 23−26.
[16] LIU H J, CHEN Y C, FENG J C. Effect of zigzag line on the mechanical properties of friction stir welded joints of an Al-Cu alloy [J]. Scripta Materialia, 2006, 55(3): 231−234.
[17] ATTALLAH M M, HANADI G SALEM. Friction stir welding

S. MALARVIZHI, et al/Trans. Nonferrous Met. Soc. China 21(2011) 962−973 973
parameters: a tool for controlling abnormal grain growth during subsequent heat treatment [J]. Mater Sci Eng A, 2004, 391(1−2): 51−59.
[18] HUANG C, KOU S. Liquation cracking in full penetration Al-Cu welds [J]. Welding Journal, 2004, 83: s50−s58.
[19] ERIPRET C, HORNET P. Prediction of overmatching effects on the fracture of stainless steel cracked welds, Mis-matching of welds [M]. ESIS 17. SCHWALBE K H, KOCAK M, ed. London: Mechanical Engineering publications, 1994: 685−708.
[20] POTLURI N B, GHOSH P K, GUPTA P C, REDDY Y S. Studies on
weld metal characteristics and their influences on tensile and fatigue properties of pulsed current GMA welded Al-Zn-Mg alloy [J]. Welding Research, 1996(Supplement): s62−s70.
[21] STANZN-TSCHEGG S E, PLASSER O, TSCHEGG E K, VASUDEVAN A K. Influence of microstructure and load ratio on fatigue threshold behaviour in 7075 alloys [J]. International Journal of Fatigue, 1999, 21(1): s255−s262.
[22] FRAZIER W E. High-strength, corrosion resistant aerospace aluminium alloys [J]. JOM, 2003, 55(1): 44−51.
焊接方法对AA2219铝合金接头性能的影响
S. MALARVIZHI, V. BALASUBRAMANIAN
Centre for Materials Joining & Research (CEMAJOR), Department of Manufacturing Engineering, Annamalai University, Annamalai Nagar 608 002, India
摘 要:使用钨电极惰性气体保护焊接、电子束焊接和搅拌摩擦焊接技术制备无填充金属的AA2219铝合金对焊
接头。研究三种焊接工艺对材料拉伸、疲劳和腐蚀行为的影响。使用光学和电子显微镜研究显微结构。结果表
明,与钨电极惰性气体保护焊和电子束焊接相比,搅拌摩擦焊制备的接头具有较高的拉伸和疲劳性能与较低的
耐蚀性能,这主要是由于其中的细化晶粒和均匀分布的强化析出相所引起的。
关键词:AA2219 铝合金;钨电极惰性气体保护焊接;电子束焊接;搅拌摩擦焊接;拉伸性能;疲劳性能;点
蚀
(Edited by FANG Jing-hua)