Embed Size (px)
Citation preview

8/9/2019 Effect of Weld Metal Strength
http://slidepdf.com/reader/full/effect-of-weld-metal-strength 1/70
UILU ENG 91 2002
CIVIL ENGINEERING STUDIES
STRUCTURAL RESEARCH SERIES NO. 559
ISSN: 0069 4274
THE EFFECT OF WELD METAL STRENGTH
MISMATCH ON THE DEFORMATION AND
FRACTURE BEHAVIOR OF STEEL
BUTT WELDMENTS
y
MARKT. KIRK
ROBERT
H.
DODDS
JR.
A Report on a Research Project
Sponsored
by
the
DAVID
TAYLOR
RESEARCH CENTER
METALS AND WELDING DIVISION
ANNAPOLIS MARYLAND
DEPARTMENT
OF CIVIL
ENGINEERING
UNIVERSITY OF
ILLINOIS
AT
URBANA-CHAMPAIGN
URBANA
illiNOiS
JANUARY
1991

8/9/2019 Effect of Weld Metal Strength
http://slidepdf.com/reader/full/effect-of-weld-metal-strength 2/70

8/9/2019 Effect of Weld Metal Strength
http://slidepdf.com/reader/full/effect-of-weld-metal-strength 3/70
50272-101
REPORT DOCUMENTATION
PAGE
4. Title and Subtitl e
1. REPORT NO.
UILU-ENG-91-2002
2.
3. Recipient's
Accnslon
No.
5. Report Date
The Effect of Weld Metal Strength Mismatch on the Deformation
and Fracture Behavior
of
Steel Butt Weldments
6
January 1991
7. Author(s)
Mark T. Kirk
and
Robert H. Dodds, Jr.
9. Per10nnlng Organization
Name
and Address
University
of
Illinois at Urbana-Champaign
Department of Civil Engineering
205 N.
Mathews Avenue
Urbana, Illinois
61801
12. Sponsoring Organization Name and Addr.
David Taylor Research Center
Metal and Welding Division, Code 281
Annapolis, Maryland 21402
15.Suppfementary
Notes
16.Abatract (Umlt:
200
worda)
8. Per1orm1ng OrganIza tIon Report No.
SRS
559
10. Project/Taak/WOf1( Unit
No.
11.
Contract
C) or
Grant
G)
No.
13. Type of Report Period Covered
Interim: 9-1-90 to 1-1-91
14
Considerable Naval and industrial experience dating from the explosion bulge studies
of
Pellini and Hart
bower in the early 1950s has indicated the engineering utility of using weld metal having strength greater
than the plates being joined (overmatching). This practice shields the weld region, which typically has lower
toughness
than
the plate and
is
often the site
of
defects, from the high strains that develop during an over
load. This practical advantage, coupled with the ease of achieving overmatch in lower strength steel alloys
80 ksi yield strength or less) has led to codification of overmatching as a requirement in most structural
design codes and fabrication specifications. However, overmatching has certain economic and technical dis
advantages which undermatched (weld metal strength less than plate strength) systems might alleviate. Ex
amples
of
undermatch benefits discussed in the literature include reduction of the preheat needed to avoid
hydrogen cracking and increase of weld metal deposition rate relative to overmatched practice. Such
changes could reduce the need to hold electrodes at an elevated temperature prior to use, extend the weld
er s duty cycle, reduce the lack of fusion / lack of penetration defect rate, reduce restraint stresses, and in
crease weld metal toughness. This information suggests that overmatched welds, while quite effective for
low strength steel construction, may not be as advantageous when fabricating structures from higher
strength grades. However, undermatched welds cannot be immediately adopted for use due to the much
greater strains that would have to be borne
by
the weld metal. Undermatched welds will require greater
toughness to provide the same safety margin against fracture as overmatched construction. To quantify the
toughness / matching combinations which provide acceptable service performance, information regarding
how over and under matching influences the stresses and strains in a weld joint is needed. Additionally,
procedures for quantifying the fracture toughness of candidate weld metals and their heat affected zones
will be required. In support of the further development of such information and procedures, this report re
views investigations concerning the deformation and fracture characteristics of Simple mechanical test spec
imens containing butt welds, focusing on how the relative strength of the weld deposit and the plate in
fluences these characteristics.
17. Document Analysis
a
Descrtptors
Weldments, Undermatching, Overmatching, Fracture Mechanics
b. Identlfters/Open-Ended Tenna
c. COSATI Reid/Group
18. AvaJIabDlly Statement
19.5ecurtty (This Report)
UNCLASSIFIED
Release U nlimi ted
20. Securtty (ThIs Page)
UNCLASSIFIED
Se.
ANSI-Z39.18)
21. No. of Pag
49
22. Price
OPTIONAL FORM 272 (4-7
Department of Commerce

8/9/2019 Effect of Weld Metal Strength
http://slidepdf.com/reader/full/effect-of-weld-metal-strength 4/70

8/9/2019 Effect of Weld Metal Strength
http://slidepdf.com/reader/full/effect-of-weld-metal-strength 5/70
THE EFFECT OF WELD MET L STRENGTH
MISM TCH ON THE DEFORM TION
ND
FR CTURE BEH VIOR OF STEEL
BUTT WELDMENTS
y
Mark T Kirk
Robert H. Dodds Jr.
Department
of
Civil
Engineering
University
of
Illinois
A
Report
on a Research
Project
Sponsored by the
DAVID TAYLOR RESEARCH CENTER
METALS
ND
WELDING DIVISION
Annapolis Maryland 21402
University of Illinois
Urbana Illinois
January 1991

8/9/2019 Effect of Weld Metal Strength
http://slidepdf.com/reader/full/effect-of-weld-metal-strength 6/70

8/9/2019 Effect of Weld Metal Strength
http://slidepdf.com/reader/full/effect-of-weld-metal-strength 7/70
BSTR CT
Considerable
Naval and industrial experience dating from the explosion bulge studies
of
Pel-
lini and
Hartbower
in the early 1950s has indicated the engineering utility
of
using weld metal
having strength greater than the plates being joined (overmatching). This practice shields the
weld region which typically has lower toughness than the plate
and
is often
the
site of defects,
from
the
high strains that develop during an overload. This practical advantage, coupled with
the ease of achieving overmatch in lower strength steel alloys (80 ksi yield strength or less) has
led to codification
of
overmatching as a requirement in most structural design codes and fab-
rication specifications. However, overmatching has certain economic and technical disadvan-
tages which undermatched (weld metal strength less than plate strength) systems might allevi-
ate.
Examples
of undermatch benefits discussed in the literature include reduction of the pre-
heat needed to avoid hydrogen cracking and increase
of
weld metal deposition rate relative to
overmatched
practice. Such changes could reduce the need to hold electrodes
at an
elevated
temperature prior
to
use, extend the welder s duty cycle, reduce the lack
of
fusion / lack
of
penetration defect rate, reduce restraint stresses, and increase weld metal toughness. This
information suggests that overmatched welds, while quite effective for low strength steel con-
struction, may not be as advantageous when fabricating structures from higher strength
grades. However, undermatched welds cannot
be
immediately
adopted
for use due to the
much greater
strains
that
would have
to
be borne by the weld metal.
Undermatched
welds will
require
greater
toughness to provide
the
same safety margin against fracture as overmatched
construction.
o
quantify the toughness / matching combinations which provide acceptable
service performance, information regarding how over and under matching influences the
stresses
and
strains in a weld joint is needed. Additionally, procedures for quantifying
the
frac-
ture toughness
of
candidate weld metals and their
heat
affected zones will
be
required. In
support of the further development
of
such information and procedures, this
report
reviews
investigations concerning the deformation and fracture characteristics
of
simple mechanical
test specimens containing butt welds, focusing on how the relative strength
of
the weld deposit
and
the plate
influences these characteristics.

8/9/2019 Effect of Weld Metal Strength
http://slidepdf.com/reader/full/effect-of-weld-metal-strength 8/70

8/9/2019 Effect of Weld Metal Strength
http://slidepdf.com/reader/full/effect-of-weld-metal-strength 9/70
ACKNOWLEDGMENTS
This
report
was prepared as
part
of the Surface Ship and Submarine Materials Block under
the sponsorship of I L. Caplan David Thylor Research Center, Code 011.5). The work of the
author
was performed in the Civil Engineering Department at the University of Illinois as part
of
an
extended term training program. The work supports DTRC Program Element 62234N,
Thsk rea RS345S50.
Reproduction of this report was made possible by the David Thylor Research Center, Con
tract No. N61533-90-K-0059.

8/9/2019 Effect of Weld Metal Strength
http://slidepdf.com/reader/full/effect-of-weld-metal-strength 10/70

8/9/2019 Effect of Weld Metal Strength
http://slidepdf.com/reader/full/effect-of-weld-metal-strength 11/70
TABLE
OF
CONTENTS
Section No.
Page
1. Introduction . . . . . . . . . . . . . . . . . . . . . . . . . . . . . . . . . . . . . . . . . . . . . . . . . . 1
2. Weldment Deformation 3
2.1 1951 - Hartbower and Pellini - Explosion Bulge Tests 3
2.2 1970 to 1978 - Satoh Toyoda and Co-Workers - Tensile and
Wide Plate Tests 5
2.3 1983 -
Patchett and Bellow - Tensile Tests . . . . . . . . . . . . . . . . . . . . . .
7
2.4 Summary and Closure 7
3. Weldment Fracture 8
3.1 Weld Strength Matching Effects on Applied 1[ and 8 . . . . . . . . . . . . . . 9
3.1.1 Single Edge Notch Specimens 9
3.1.2 Single Edge Notch Specimens . . . . . . . . . . . 13
3.2 Weld Strength Matching Effects on Fracture Toughness 16
4 Summary and Conclusions . . . . . . . . . . . . . . . . . . . . . . . . . . . . . . . . . . . . . . . 17
5. References . . . . . . . . . . . . . . . . . . . . . . . . . . . . . . . . . . . . . . . . . . . . . . . . . . . . . 46
- iv -

8/9/2019 Effect of Weld Metal Strength
http://slidepdf.com/reader/full/effect-of-weld-metal-strength 12/70

8/9/2019 Effect of Weld Metal Strength
http://slidepdf.com/reader/full/effect-of-weld-metal-strength 13/70
LIST
OF
TABLES
Table No.
Page
1 Effect
of
Weld Joint Geometry on Strain Localization in Elliptical
Explosion Bulge Tests
of
Overmatched Welds. 19
2 Finite
lement
Results of Bleackley et al.Illustrating the Effects of
Weld Joint Geometry on Applied JI 19
3 Wide Plate Conditions Investigated
y
Dong and Gordon 20
4 Wide Plate Conditions Investigated
y
Zhang et al. 20

8/9/2019 Effect of Weld Metal Strength
http://slidepdf.com/reader/full/effect-of-weld-metal-strength 14/70

8/9/2019 Effect of Weld Metal Strength
http://slidepdf.com/reader/full/effect-of-weld-metal-strength 15/70
LIST OF FIGURES
Figure No.
Page
1
Common
microstructural and toughness variations in a single pass steel
weldment, condensed from Kerr [1976]. . 2
2
Expanded
view of experimental set-up for explosion bulge tests
[Hartbower and Pellini, 1951 a) and 1951 b)] 22
3 Strain distribution transverse
to
double-V groove weldments in explosion
bulge test panels [Hartbower and Pellini, 1951 a)] 23
4 Influence of weld layer thickness gap between plates joined) on the
ultimate tensile strength of the weldment for round bar specimens [Satoh
and
Toyoda, 1970 a)]. Below
an
x-axis value
of
0.4, the strength
of
all
specimens approaches the strength of the plate different for each percent
undermatch). . . . . . . . . . . . . . . . . . . . . . . . . . . . . . . . . . . . . . . . . . . . . . . . . . . . . . 24
5 Influence of weld layer thickness gap between plates joined) / bar
diameter X value) on the failure strain F) and strain
at
maximum load
M) for 50 undermatched round bar specimens
[Satoh and Toyoda, 1970 a)] 25
6 Effect
of
testpiece aspect ratio
on
the weldment ultimate tensile strength
[Satoh and Toyoda, 1970 b)]. . 26
7 Effect
of
weld groove geometry and panel width on the ultimate tensile
strength and ultimate tensile elongation of 70mm thick HT80 weldments
[Satoh
and
Toyoda, 1975]. . 27
8 Effect
of
weld layer thickness
on
weldment yield and ultimate tensile
strength for rectangular cross section tension specimens width
to
thickness
ratio of 1.5:1) cut from stress relieved ASTM A516 Grade 70 weldments
[Patchett and Bellow, 1983]. . 28
9 Schematic diagram
of
testpieces for fracture mechanics tests of weldments. . 29
- vi -

8/9/2019 Effect of Weld Metal Strength
http://slidepdf.com/reader/full/effect-of-weld-metal-strength 16/70

8/9/2019 Effect of Weld Metal Strength
http://slidepdf.com/reader/full/effect-of-weld-metal-strength 17/70
10 Schematic diagram of Engineering J design curve format [Thrner, 1983] 30
11 Effect of strength matching ratio on the variation of with applied strain
for
0.1
a/W SE(B) specimens [Cray, et
aI.,
1989]. .
31
12 Plastic strain distribution in 30 undermatched double-V butt weldments
loaded in remote tension (top) and in remote bending (bottom). Crack
depth was 10 of panel thickness. [Cray,
et aI.,
1989] 32
13 Effect of crack depth, loading mode, and strength matching ratio on the
Engineering-J design curve slope of single edge notch specimens once
yielding has occurred. (a) SE(B) specimens. (b) SE(T) specimens.
[Cray, et aI., 1989]
33
14 Effect of crack depth on applied
]
for SE(B) specimens with 25
overmatched butt welds [Dong and Gordon, 1990] 34
15 Schematic diagram of instrumentation plan for J contour measurements
on surface cracked wide plate testpieces [Read and Petrovski, 1990]. . 35
16 Effect of strength matching ratio on the applied
]
value developed by a
wide plate tension specimen 75 mm x 15 mm cross section) having a
surface crack 10 mm long x 3 mm deep on the centerline of a double-V
utt
weld. Weld and crack were both oriented perpendicular to the
loading direction [Read and Petrovski, 1990]. . 36
17 Effect of strength matching ratio on the applied ] value developed by a
wide plate tension specimen 75 mm x 15 mm cross section) having a
surface crack 25 mm long x 6 mm deep on the centerline of a double-V
utt weld. Weld and crack were both oriented perpendicular to the
loading direction [Read and Petrovski, 1990]. . 37
18 Effect of weld layer thickness (h) to crack length (2a) ratio on applied
]
developed in wide plates made from square-groove 37 overmatched butt
weldments containing a central through crack cutting 20
of
the panel
width. Both crack and weld are oriented perpendicular to loading direction
[Weidian, et aI., 1989]. . 38
19
Effect of strength matching ratio on applied
]
for welded wide plates
having through cracks of 5 of the panel width [Dong and Gordon, 1990] 39
- vii -

8/9/2019 Effect of Weld Metal Strength
http://slidepdf.com/reader/full/effect-of-weld-metal-strength 18/70

8/9/2019 Effect of Weld Metal Strength
http://slidepdf.com/reader/full/effect-of-weld-metal-strength 19/70
20
Effect of
strength matching ratio on applied J for welded wide plates
having through cracks
of
20
of
the panel width.
[Dong
and Gordon, 1990]. . 40
21 Variation
of
effective yield stress with the ratio
of
weld layer thickness to
crack
length for wide plates made from square-groove
butt
weldments
containing a central through crack cutting 40 of the
panel
width.
Both crack and weld are oriented perpendicular to loading direction.
(a) 20 Undermatched. (b) 25 Overmatched. [Zhang, et aI., 1990]. .
41
22 Variation of effective strain hardening exponent with the ratio of weld
layer
thickness and hardening matching ratio to crack length for wide
plates made from square-groove butt weldments containing a central
through
crack cutting 40 of the panel width. Both crack and weld
are
oriented
perpendicular to loading direction. (a) 20 Undermatched.
(b) 25 Overmatched. [Zhang, et aI., 1990]. . 42
23 Consolidated plot from the results of Zhang, et
aI
[1990] showing the
variation of effective strain hardening exponent with the ratio of weld
layer thickness for common ferritic-pearlitic and martensitic steels.
Undermatched
welds (on strength) are overmatched for strain hardening,
while overmatched welds (on strength) are undermatched for strain
hardening.
43
24
Effect
of
strength matching (23 undermatched
vs
1 over)
on
critical
fracture toughness (8d values determined by testing deeply notched SE(B)
specimens cut from 50 mm thick HT80 steel weldments
[Satoh, et aI., 1979]. . 44
25 Effect of strength matching ratio on critical fracture toughness (minimum
of three 8
e
values at + 10°C) for various self shielded flux core weldments
between
BS 4360 grade 50D plate [Cunha and Pope]. . 45
- viii -

8/9/2019 Effect of Weld Metal Strength
http://slidepdf.com/reader/full/effect-of-weld-metal-strength 20/70

8/9/2019 Effect of Weld Metal Strength
http://slidepdf.com/reader/full/effect-of-weld-metal-strength 21/70
The Effect o Weld Metal Strength Mismatch on the
Deformation and Fracture ehavior o Steel utt
Weldments
1
Introduction
Steel civil and marine engineering structures are often fusion welded to achieve the greatest
construction economy. The fracture integrity of such structures depends on both the loads
carried by and the resistance to fracture fracture toughness) of the various structural compo-
nents. Neither the weld deposit or the heat affected zone HAZ) dt the weld metal base
plate interface has fracture properties that are as well controlled or as high in general) as
that
of
the plates
or
shapes being joined.
The need to make weldments in the field, rather than in the more controlled environ-
ment
of a steel mill complicates control ofweldment toughness. Further, variables that signif-
icantly influence weldment toughness, such s peak temperature and cooling rate, cannot be
economically monitored during welding. Instead, these variables are controlled indirectly by
specifying allowable ranges on variables the welder can control e.g. welding current, welding
voltage, travel speed, arc length, etc.). However, construction costs increase quickly if these
allowable ranges are too small. Finally, weldments are influenced to a much greater degree
than plate and shape production by the workmanship of an individual tradesman. Designers
sometimes make maintaining high quality workmanship difficult by placing welds in re-
stricted access locations. However, even elimination of such details cannot insure good work-
manship in all instances because factors such
s weather, worker morale, and workload influ-
ence workmanship. These factors are beyond the control of the design engineer.
The fracture toughness of steel weldments is characteristically heterogeneous. For a
fixed chemistry, the local thermal history controls the room temperature fracture toughness
at each location in the weldment [Kerr, 1976]. Figure 1 presents a schematic diagram of a
single pass weldment in a mild steel plate and shows the relation between the
peak
tempera-
ture, the microstructure at room temperature, and the fracture toughness properties of each
region. The specific relation of plate toughness to that
of the various HAZs and of the weld
metal depends on the the type of steel welded. In some cases certain regions of the HAZ may
1

8/9/2019 Effect of Weld Metal Strength
http://slidepdf.com/reader/full/effect-of-weld-metal-strength 22/70
have improved fracture toughness relative to the plates joined. For example, the grain refined
H Z
will have better toughness than most mild steels because
of
grain refinement
l
In con
trast, the grain refined H Z in a microalloyed steel will have inferior toughness to the plate
because this type of steel has a fine grain structure before welding. What can be said in general
is that certain regions of the weldment
will
always have inferior toughness relative to the
plate. Specifically, these include the coarse grain H Z owing to the large grain size) and the
weld metal owing to the as-cast structure). In multi-pass welds, the various regions shown
in Figure 1 interact due to re-thermal cycling by subsequent weld passes. The toughness of
some regions are improved
by
this thermal cycling while some
are
degraded. In the HAZ,
a coarse grain structure reheated into the intercritical region experiences incomplete trans
formation to austenite and, upon cooling, has a coarse grained, dual phase microstructure
of extremely low toughness [Machida, et aI. 1990]. The weld metal region
of
a multi-pass
weldment retains some
of
the as-cast structure, but also includes microstructures characteris
tic
of
all
of
the different heat affected zones due to thermal cycling effects. Thus, the solidified
weld metal may contain regions of higher toughness than the plate,
but
will certainly contain
lower toughness regions as well.
In
addition to causing quality control difficulties and introducing low toughness regions,
welding can also produce defects whose presence must be considered to insure structural in
tegrity against fracture.
Such defects are either planer / crack-like e.g. cold cracking, lack
of fusion, hot tearing, lack
of
penetration,
or
undercut) or volumetric e.g. porosity, en
trapped slag) and may be either undetectable or not economically detectable using non-des
tructive techniques. Some defects are serious on their own, while others serve as initiation
sites for fatigue cracking during service. Taken together, these various factors provide the de
signer with considerable incentive to prevent development of high strains in welded regions.
For this reason, many codes require use
of
weld metals whose strength exceeds that
of
the
plates joined [ASME, 1980; AWS 1980; USDOT; 1979]; a practice referred to as
overm t h-
ing
Overmatched welds are believed to force plastic deformation into the lower strength
plate where better fracture resistance and fewer defects are expected, thus shielding the weld
ment from large strains.
1. A reduction
of
grain size in steels generally increases fracture toughness
..

8/9/2019 Effect of Weld Metal Strength
http://slidepdf.com/reader/full/effect-of-weld-metal-strength 23/70
Unfortunately, overmatching weld metal strength has certain economic and technical
disadvantages which undermatched (weld metal strength less than plate strength) systems
might alleviate. For example, welding
of
high strength steels usually requires preheat
to
avoid
hydrogen cracking. Satoh and co-workers [1978] demonstrated that preheat requirements
could be cut in half by welding HT-80 steel (80 kg mm2 nominal tensile strength) with an
undermatched electrode
AWS
E9016G) rather than with an overmatched electrode (AWS
E11016G). Not only did this change realize a significant energy savings,
but
it also increased
productivity because the lower preheat temperature allowed extension of the welder's duty
cycle in this application (underground penstocks). Howden,
et
al. [1983] pointed out that, for
welding Y steels (80 to 130 ksi nominal yield strength), the use of undermatched welds also
increases weld metal deposition rate relative to overmatched practice. Such changes would
reduce the need to hold electrodes at an elevated temperature prior to use, reduce the lack
of fusion I lack
of
penetration defect rate (higher heat inputs tend to have better penetration
characteristics), reduce restraint stresses, and increase weld metal toughness. This informa
tion suggests that overmatched welds, while quite effective for low strength steel construction,
may not be as advantageous when fabricating structures from higher strength grades. Howev
er, undermatched welds cannot be immediately adopted for use due to the much greater
strains that would have to be borne
by
the weld metal. This report reviews investigations into
the deformation and fracture characteristics of simple mechanical test specimens containing
butt welds, focusing on how the relative strength of the weld deposit and the plate influences
these characteristics.
2 Weldment eformation
Several experimental studies concerning the deformation behavior ofwelded testpieces were
conducted between 1951 and 1983. Earlier works regarding welded structures [Parker, 1957]
focused on design details, welding practice, and quality control and are therefore
not
ger
mane to understanding the influence of weld metal strength on weldment deformation and
fracture. The different investigations from 1951 through 1983 are discussed chronologically.
2.1 1951 -
artbower and
Pellini -
Explosion
ulge
Tests
Hartbower and Pellini [1951(a), 1951(b)] discussed an explosion bulge test used to study
the deformation and fracture behavior ofweldments for high-rate, multi-axial loading condi-
3

8/9/2019 Effect of Weld Metal Strength
http://slidepdf.com/reader/full/effect-of-weld-metal-strength 24/70
tions. Figure 2 illustrates the experimental set-up used; dies having either circular or elliptical
cutouts allowed different biaxiality ratios to
be
investigated. The test plates measured 22-in
ches wide by 20-inches long with a butt weld in the center of the plate parallel to
the
20-inch
dimension. Test plate thicknesses ranged from 0.65 to I-inch; both double V and square
groove joints were used. Use of several grades
of
steel plate and welding consumables al-
lowed investigation of strength matching conditions ranging from 17 undermatched to 82
overmatched
2
•
Plate thickness reduction was used to measure the set strain distribution in
and
around
the weld developed during explosive loading. Figure 3 presents some
of
these
results from a test series of circular bulges illustrating the effect
of
changing weld metal while
holding base metal constant, and vice versa. Further, it appears that undermatching elevates
the strain local to the weld above the globally applied level while overmatching has the oppo
site effect. Together, these results indicate that the strength of the weld metal relative to the
plate controls whether the weld will shed or concentrate strain, not the absolute strength of
either constituent. Results of a separate study on elliptical bulges indicate that the geometry
of the
weld joint influences the· effectiveness
of
overmatching in shielding the weld from glob
al strains. These data, summarized in Table
1
show that an increase in the overmatching ratio
of 31 did not offset the effect of the
Double
V groove on increasing the proportion of glob
ally applied strain that reached the weld centerline.
Beyond their studies of weldment deformation characteristics, Hartbower and Pellini
also commented on fracture patterns that developed in the explosion bulge tests. While
strength matching effects on fracture are discussed in a subsequent section, this is mentioned
here to help explain the historical bias in favor of overmatching. In their study, Hartbower
and Pellini ranked weldment fracture performance by the amount the bulge plate could thin
prior to fracture. Invariably, the thinning capacity of the overmatched bulges did not drop
off suddenly until much lower temperatures than it did for undermatched bulges. This indi
cated that, at any fixed temperature, the overmatched weldments absorbed more energy, and
thus provided a more damage tolerant construction, than did the undermatched weldments.
Further, fractures of the undermatched weldments initiated in and propagated almost entirely
in the weld. Conversely, cracks initiated in the weld for only half of the overmatched weld-
2. These matching ratios represent a ratio of the difference between the weld metal and plate stress devel
oped at 0.05 strain divided by the plate stress at
0.05
strain as measured in a uniaxial tensile test.

8/9/2019 Effect of Weld Metal Strength
http://slidepdf.com/reader/full/effect-of-weld-metal-strength 25/70
ments, and all
of
these fractures propagated immediately into the plate. The different fracture
initiation locations were explained based on the strain concentration or shedding effects illus
trated in Figure 3. Cracks
l ~ y s
propagated perpendicular to the principal strain direction
(transverse
to
the weld for undermatched specimens
vs
along the weld for overmatched spec
imens). These data demonstrated that overmatching prevented many fractures from initiating
in the weld, an extremely beneficial feature because of the many natural notches welds can
contain (e.g. lack
of
penetration, lack of fusion, undercut, etc.). Further, even though this
shielding was only 50% effective, fractures that initiated in the weld ran directly into the
base metal and arrested. Thus, these data demonstrated that the fracture properties
of
the
plate would govern the fracture resistance
of
a structure fabricated from overmatched welds.
The
(relative) ease
of
controlling plate toughness during production makes this very desir
able.
2 2 1970 to 1978 - Satoh
Toyoda
and Co-UVrkers - Tensile and
Wide
Plate Tests
Satoh, Toyoda, and their co-workers published a series
of
papers concerning the deformation
behavior of
round bar and flat plate tension coupons having a zone
of
low strength material
perpendicular to the loading axis
3
. These investigators sought to reduce the 150°C preheat
needed to produce overmatched welds in HT80 steel (a 80 kg/mm2 tensile strength, quenched
and tempered plate) without developing hydrogen assisted root cracks [Satoh,
et
aI., 1978].
Use of an undermatched welding consumable was expected to significantly reduce the needed
preheat. Therefore, Satoh and Toyoda investigated the strength and ductility achievable with
undermatched weldments.
Satoh and Toyoda [1970(a)] idealized undermatched weldments as a parallel sided layer
of low yield strength material imbedded between
two
higher yield strength materials. They
used both flash-butt and narrow gap welds to match this idealization as closely as possible.
These experiments addressed the effects of strength matching ratio, joint layer thickness, and
testpiece size
on
ultimate strength and ductility. Figure 4 shows the results
of
a series
of
round
bar
specimens that undermatched plate yield strength by 28% to 66%. These tests showed
3
The
approach used and conclusions arrived at by these researchers follows
the
workof two Soviet research
ers, hron and Bakshi [1962(a), 1962(b)], very closely. Comparing the work descnbed above to the 1962
studies,
it
is apparent that Satoh and Toyoda modelled their initial experiments and theories after the pre
vious Soviet work. However, because Satoh and lbyoda carried the research farther, attention s restricted
to their
work
n
this review.
5

8/9/2019 Effect of Weld Metal Strength
http://slidepdf.com/reader/full/effect-of-weld-metal-strength 26/70
that weldment ultimate strength approaches that of the plate as joint thickness decreases, in
dicating
that
joint strength depends on both joint geometry and flow properties.
In
these -
periments, joint strength increased due to constriction of plastic flow in the weld layer by the
nearby higher strength plate material. Thus, this strengthening occurred by the same mecha
nism as in notched tensile tests where the notch produces a tri-axial stress state. However,
while tri-axiality elevates flow properties, it also reduces ductility. Therefore, these investiga
tors also noted a reduction in both the ultimate strain to failure and the strain at maximum
load with reduced joint width. Figure 5 presents these data.
In a follow-on study, Satoh and Toyoda [1970(b)] investigateJ the effect
of
specimen
geometry
on
their previous findings. Figure 6 shows that plate type specimens had higher ulti
mate
strengths than round bar specimens. Constraint of plastic flow also explains this result.
In the round bar, the higher strength plate restricts axial plastic flow
of
the lower strength
weld metal, but deformation can occur in both perpendicular directions. However, the large
ness
of width relative to thickness in the plate specimen restricts plastic flow in the width di
rection also. As with the round bar specimens, the ultimate ductility
of
the plates reduced
with reducing weld layer thickness. Thus, the flat plate and round bar specimens produced
identical trends.
In their final paper, Satoh and Toyoda [1975] studied the
double-V
and
double-U
groove joints commonly used in construction to see if the trends determined from the ideal
ized models applied to production weldments. Figure 7 details the results of these experi
ments. These tests demonstrated that, for this particular set
of
geometric conditions, a weld
deposit havingan ultimate strength 10 below the plate strength could achieve the same ulti
mate strength properties as an overmatched weldment. Additionally, these data show that
undermatching more strongly affects ultimate ductility than ultimate strength. For example,
a
34
undermatched weldment retained 94 of the ultimate strength
of
an overmatched
weldment but only 29 of its ultimate ductility. Thus, ductility requirements will most likely
limit the acceptability
of
undermatched welds for service more than strength requirements.

8/9/2019 Effect of Weld Metal Strength
http://slidepdf.com/reader/full/effect-of-weld-metal-strength 27/70
2.3 1983 -
Patchett
nd
Bellow - Tensile ests
Patchett and Bellow [1983] conducted a series of tensile tests on undermatched narrow-gap
submerged arc weldments
SAW) of
an ASTM
A5 6
Grade 70 pressure vessel steel oys
=
299 MPa,
Outs
=
496 MPa transverse to the rolling direction). The performance
of
under
matched weldments concerned these investigators because post-weld heat treatments often
reduce the ultimate strength
of
this alloy below the requirements
of
the American Society
of
Mechanical Engineers ASME) Boiler and Pressure Vessel Code [1980]. Their results are
similar
to
those
of
Satoh and Toyoda, and are mentioned only because they reported the effect
of
weld layer thickness on yield strength as well as on ultimate strength. As shown in Figure
8, these data indicate that reduced layer thickness only elevates the ultimate strength of a
weldment,
not
the yield strength. This suggests that reducing the joint thickness cannot post
pone
the beginning of a fracture process that depends on plastic flow.
2 4 Summary nd Closure
he
major findings from the investigations discussed in this section regarding the effects of
weld metal strength on the deformation behavior of weldments are as follows:
• Relative to the globally applied strain measured far away from a weldment,
the strains local to a weldment are lower in overmatched welds and higher
in undermatched welds.
• Weld joint geometry influences the strains which accumulate there.
• As weld layer thickness decreases, undermatched welds can sustain higher
loads but less deformation prior to failure.
• The weld layer thickness does not effect the stress
at
which the weld metal
begins to yield in undermatched welds.
laken
together, these findings indicate that, at a given global strain level, undermatched
weld deposits are more highly strained than overmatched weld deposits. These results seem
to indicate the superiority
of
overmatched welds for resisting fracture. However, as indicated
by
the
motivations of these investigators, other considerations, such as the need to prevent
hydrogen cracks from developing, the need to eliminate preheat,
or
the need to allow stress
relief may increase the attractiveness
of
undermatched weldments. Further the suitability
of
either overmatched
or
undermatched weldments requires consideration of both the driving
force to fracture and fracture resistance because weldments can contain crack-like welding

8/9/2019 Effect of Weld Metal Strength
http://slidepdf.com/reader/full/effect-of-weld-metal-strength 28/70
defects, or will most likely develop fatigue cracks during service. These considerations are
discussed in the following section.
3.
Weldment racture
The resistance of a material to fracture from a pre-existing defect fracture toughness) and
the driving force to fracture caused by structural loads are both quantified by a crack tip char
acterizing parameter. The stress intensity factor KI) due to Irwin [1962] is used when linear
elastic conditions prevail. However, if the crack tip plastic zone is not vanishingly small com
pared to other dimensions e.g. thickness, crack depth), then use
of
KI is not appropriate. In
this regime, the non-linear fracture mechanics NLFM) crack tip characterizing parameters
of
crack tip opening displacement
8)
due to Wells [1961; 1963],
or
the
J integral
JI)
intro
duced by Rice [1967] are both appropriate. For linear elastic loading conditions, all three
parameters are related [Rice, 1968], while for post yield loading 8andJ are related by materi
al flow properti,es and a geometry factor [Shih, 1983; Wellman, et aI., 1984]. These parame
ters all measure the intensity of the crack tip deformation fields [Rice, 1968] and, within cer
tain limitations, are geometry independent [Shih, 1985; Dodds,
et
aI., 1990]. Thus, NLFM
provides a framework for using the value of the crack tip characterizing parameter at crack
initiation in a simple laboratory specimen to predict the maximum safe load
of
a flawed struc
ture.
Experimental procedures for estimating critical values
of
KI,
8, and JI using laboratory
specimens [ASTM E399, ASTM E1290, ASTM E813] are well established for homogeneous
plate materials. Additionally, guidelines exist for performing structural fracture safety asses
smentsusing these values [PD6493, 1980; Harrison, etaI., 1980; Kumar, v. 1981; Ibid; 1984].
Unfortunately, similar experimental procedures and guidelines are not established for test
specimens and structures containingweldments
4
•
The following section summarizes research
concerning strength mismatch effects on applied
JI
and 8 values. Subsequently, a section re
garding studies
of
strength mismatch effects on critical fracture toughness is presented.
4. It should
be noted that the
crack tip opening displacement design curve
[PD
6493, 1980]
and Central
Elec
tricity Generating Board [Harrison, et aI., 1980] fracture safety assessment
procedures.do
attempt to ac
count for the
presence of
welds by including design factors for res idual st ress and guidance on what consti
tutive properties plate vs. weld metal) should be used in the analysis. However, these
are
empirical factors,
they
do not have a theoretically justified basis.

8/9/2019 Effect of Weld Metal Strength
http://slidepdf.com/reader/full/effect-of-weld-metal-strength 29/70
3 1
l ld
Strength Matching Effects on Applied J] and 8
Various investigators have conducted finite element analyses of
single edge notched speci
mens loaded in tension SE T», loaded in bending SE B», and of.tension loaded wide plates.
These
testpieces are illustrated in Figure
9
Standard experimental procedures employ the
SE B) and SE T) testpieces to estimate the fracture toughness of metallic materials. In con
trast, the wide plate usually serves as a structural scale proof test because the loading mode
remote tension) and size of the crack relative to the cross sectional area very small) more
closely model a structure than can a SE B) or SE T) specimen.
The analyses reviewed in this section all model the testpiece as a bi-material made up
of weld and plate material. The weld and the plate have the same elastic modus but different
post
yield flow properties in these models. However, fusion weldments have a
heat
affected
zone of rapidly varying constitutive properties distinct from both the plate and the weld metal.
Therefore,
the assumed model does not exactly match the problem. However, for intermedi
ate to thick section say 3/4-inch to 2-inches) mUlti-pass welds, the HAZ is thin compared
to the size of the weld deposit and the plate thickness. Additionally, compared to the size of
the
zone over which the fracture process occurs 38) [Hutchinson, 1983], the HAZ is very far
away from the crack tip located on the weld deposit centerline. Thus, except for narrow welds
or
thin plates, the bi-material assumption should not significantly effect the values
of
J]
or
8 est imated by the finite element analyses.
In the following two sections, work concerning test specimens SE B) and SE T» and
wide plates
are
discussed separately. In each section, the initial discussion concerns results
which lend insight regarding the effect
of
mismatched welds
on
appliedJ] Subsequent discus
sions focus
on
the work of researchers who have proposed methods
to
model or account for
these dependencies in a simple J-estimation scheme.
3 1 1 Single Edge Notch Specimens
Tests of single edge notch specimens provide estimates of the fracture toughness of welded
materials. Bend tests require lower loads and less elaborate fixturing than tension tests and
are
therefore more common. Values
of
applied load, load line displacement
~ L L ) ,
and the
increasing separation
of
the notch surfaces at the specimen edge crack opening displace
ment, or COD) are monitored during an experiment as loading progresses to the time of crack
9

8/9/2019 Effect of Weld Metal Strength
http://slidepdf.com/reader/full/effect-of-weld-metal-strength 30/70
initiation by either cleavage brittle fracture) or microvoid coalescence ductile fracture). Fig
ure 9 indicates the various measured quantities. These measurements are used to estimate
the critical fracture toughness valuesJ/c and / or 8
e
using equations appropriate for un-welded
specimens presented in the testing standards [ASTM E1290, ASTM E813]. t is therefore of
interest to determine if ignoring the presence of the weld produces significant errors in the
]e
and 8
e
estimates, and if so, under what conditions.
Bleackley, Jones, and Luxmoore [1986] investigated the effect of weld joint geometry
for 15 undermatched 0.1 a/W ratio of crack depth, a, to testpiece width, W) SE T) speci
mens. These investigators presented their results by plotting the applied
]
versus load point
displacement; the same format as the Engineering-J design curve originally proposed by
Turner [1983]. Figure 10 shows the shape of this curve. The initial parabolic variation corre
sponds to globally linear response and is therefore not significantly significantly influenced
by weld metal matching
or
joint geometry. Conversely, the slope
of
the curve for gross section
yielding GSY, the linear portion) may depend strongly on weld metal matching and joint
geometry because both factors influence the development of yielding in the specimen. Thus,
the value GSY slope indexes the effect of different matching / weld joint geometry conditions
on the applied or 8
5
,
with higher values indicating a more severe fracture driving force.
Table 2 presents the results due to Bleackley, et al. These data indicate that weld joint geome
try can significantly influence the relation between experimentally measurable values e.g
.6.LL and the crack tip driving forceJ]. In particular, the appliedJ] for the single-V and square
groove welds agreed reasonably well to that estimated for a monolithic specimen made en
tirely of weld metal. Conversely, the double-V groove weld had much less applied ] than
predicted by this simple model. The reduction of applied ] for the double-V groove relative
to the other joint geometries occurred because the width of the joint caused high strains to
concentrate inside the weld along the weld metal - plate interface, but these strains did not
spread to engulf the crack tip. A later analysis of this same situation by Cray, Luxmore, and
Sumpter [1989] explains this in greater detail. This paper is reviewed in
the
following para
graph.
5.
As indicated on Figure 10, the
abscissa
of this plot can
also
be expressed
in
terms of load, strain, or displace
ment. The GSY slope
will have
the
same
properties indicated above
so long as
the axes are nondirnensio
nalized appropriately.
H\

8/9/2019 Effect of Weld Metal Strength
http://slidepdf.com/reader/full/effect-of-weld-metal-strength 31/70
Cray, Luxmoore, and Sumpter [1989] and Lee and Luxmoore [1990] investigated the
effect
of matching ratio and crack depth to specimen width ratio on SE B)
and
SE T) speci
mens made from double-V groove welds. They used the same groove geometry and constitu
tive
properties
as did Bleackley,
et
al. Figure
11
presents their results in
Engineering-J
design
curve format for SE B) specimens at 0.1 alW. In virtually every case;
under or
overmatched,
tension
or bending; no correspondence exists between the homogeneous
and
the welded
specimens indicating that application
of
equations in the testing standards will produce erro
neousJ[ estimates. The trends
are
as expected based on work concerning effects ofweld metal
matching on the deformation behavior of un-cracked welded joints reviewed earlier. The
strain concentration by the undermatched welds increases the appliedJ[ relative to plain plate
while strain shedding by the overmatched welds reduces the appliedJ[. Conversely, the SE T)
results
of
Cray,
et
al. indicate
that b Q1h
under and overmatching reduce
the
applied
J[
relative
to
plain
plate in general yielding, with undermatching causing
the
greatest reduction. Ex
amining the different plastic strain distributions developed in tension and in bending Figure
12 helps explain this unexpected behavior. These plots show
that
undermatching concen
trated plastic deformation into the weld in both tension and bending,
but
in tension the width
of
the joint allowed the high strains to focus into slip bands along the weld / plate interface.
This
deformation pat tern kept strains around the crack tip low and, consequently, reduced
the
applied JI
Cray, et al. also performed finite element analyses for four different
a/W
ratios ranging
from
0.05 to 0.20. Figure
13
shows the effect
of
loading mode, matching ratio, and
a/Won
the GSY
design curve slope. In bending, these data show
that
overmatching considerably re
duces the toughness needed for shallow cracks to resist fracture relative to an undermatched
condition. However, increasing the crack depth mitigates this advantage. The trends shown
by
the
tension loaded results
are
influenced by the deformation concentration along the weld
/
plate
interface.
t
is
not
possible to draw any general conclusions from the tension
data
short
of noting that consideration of the presence
of
the mismatched weld is essential to obtain a
reasonable
estimate of the applied J[
Dong
and
Gordon
[1990] have also investigatedJI relations for welded
bend
specimens.
Their work focused on determining how well J[ values calculated for monolithic bend speci-
11

8/9/2019 Effect of Weld Metal Strength
http://slidepdf.com/reader/full/effect-of-weld-metal-strength 32/70
mens made entirely of weld metal or base metal compare to the applied calculated for an
overmatched square groove welded SE B) specimen. Figure
4
presents these results. The
results for 0.1 a W indicate that neither simple homogeneous model gives sufficient accuracy.
This finding agrees qualitatively with that of Cray, et al. for double-V grooves. Conversely,
the homogeneous model for a deep crack a/W
=
0.5) achieved good accuracy by using the
constitutive properties
of
the weld metal. This may occur because the deep crack confines
yielding to the net ligament and thereby to the weld metal. If this explanation is correct, it
suggests that accurate estimates of applied for a deeply cracked undermatched weld are
also possible using this procedure. For the undermatched weld, both the loading mode and
the undermatching focus deformation into the weld. However, for welds that are very narrow
in
the
remaining ligament of the SE B) specimen e.g. a narrow groove weld
or
a double-V
with a small bevel angle) the width of the yielded zone in the ligament of the SE B) may ex-
ceed the width
of
the weld and the homogeneous approximation
will
most likely break down.
Single Edge Notch Specimens. Summary
The major findings of the investigations summarized above regarding the effect of
a weld on the applied developed in SE B) or SE T) specimen are as follows:
• Fixing the matching ratio, crack depth, and remote loading mode, weld
groove detail has some effect on the rate at which applied increases
with increasing remote load.
• In bending, undermatching increases the rate
at
which applied in
creases with increasing remote load relative to an unwelded specimen.
Overmatching has the opposite effect. This difference between over
and in undermatched welds reduces as crack depth increases.
•
The
effects
of
weld metal matching on SE T) specimens is
not
well es
tablished because the only analysis of this specimen type performed to
date was for a weld joint that focused deformation into the weld but at
the weld metal plate interface rather than at the crack.
•
The
applied calculated using established estimation formulas for a
monolithic SE B) made entirely of weld metal provides a reasonable
approximation of the applied for a deeply cracked overmatched weld
ment. Provided that this occurs because the bend geometry confines
post-yield stresses to the
weld
metal in the unbroken ligament, then this
result should apply in general to any weld tested as a deeply cracked
SE B) if the weld has sufficient width to contain all of the plasticity.
Taken together, this information indicates that experimental investigations con-
cerning weld strength matching effects using deeply notched SE B) specimens will
2

8/9/2019 Effect of Weld Metal Strength
http://slidepdf.com/reader/full/effect-of-weld-metal-strength 33/70
probably give reasonably accurate results. Conversely, experimental trends and
conclusions based on shallow crack fracture tests are questionable if the applied
1
is estimated based on homogeneous estimation formulas.
3.1.2 Wide Plate Specimens
Investigators employing the wide plate specimen commonly use it as a structural scale proof
test because the loading mode (remote tension) and size of the crack relative to the cross sec
tional area (very small) more closely model structural characteristics than can laboratory
specimen. Wide plate specimens often contain a semi-elliptical surface crack of
size as large
as that which might occur in serVice [Denys, 1990]. However, only
one
analytical result exists
for a semi-elliptical surface crack, while the others all address centrally located through
cracks. Investigation
of
the semi-elliptical crack will be discussed first. All
of
the analyses
discussed in this section concern plates with welds containing cracks oriented symmetrically
in the middle
of
the weld and on its centerline. Welds are always perpendicular to the loading
direction.
Reed and Petrovski [1990] used the instrumented contour illustrated in Figure 5 to esti
mate the applied J of semi-elliptic surface flaws in double-V welds made between two 5
mm thick plates
of
HSLA-80 steel. Their study included three matching ratios ranging from
37 undermatched to 17 overmatched and two crack depth to plate thickness a/t) ratios,
0.2 and 0.4. Figure
6
indicates that, for the smaller crack in the undermatched welds, the
rate
of
increase
of
applied J with increasing applied strain becomes quite rapid for strains
exceeding 1.5 times the yield strain. In contrast, the applied J assumes a constant value for
all strains above this level in the overmatched weld. This figure provides dramatic evidence
for the advantages
of
weld metal overmatching. However, the advantage breaks down for
deeper
cracks, as demonstrated by the results for alt
=
0.4 shown in Figure 17. These data
indicate that all wide plates reached a very high appliedJ/ irrespective ofweld metal matching.
Thus, while overmatching shields shallow cracks in welds from high applied h values, over
matching has only limited advantage for deep cracks. Bearing in mind that adequate non-des
tructive inspection and evaluation procedures should keep the crack size in structures small
compared to the thickness, these data indicate that overmatching has considerable potential
for enhancing structural fracture integrity.
3

8/9/2019 Effect of Weld Metal Strength
http://slidepdf.com/reader/full/effect-of-weld-metal-strength 34/70
Weidian, et al. [1989] performed a finite element analysis of a 37 overmatched wide
plate with a square groove joint containing a middle crack severing 20 of the panel width.
These
investigators studied the effect of the layer thickness (distance between the welded
plates) on the applied
J[
Figure
18
presents their findings which indicate that widening the
grooves
of
an overmatched weld reduces the applied J[ because this removes the highly
strained lower strength plate material from the crack tip.
ong
and Gordon [1990] performed finite element analyses of wide plates having the
same crack / weld geometry as used by Weidian, et al. However, these researchers studied
a
broader
range
of
conditions, as detailed in Thble 3. These results are presented in Figure
19
for
alW
=
0.05 and in Figure 20 for a/W
=
0.20. At both crack lengths, the undermatched
welds experienced a slightly higher applied J[ than did the overmatched welds once yielding
occurred. Further, the applied J[ for a panel made entirely of the plate material provided a
reasonable approximation
of
the appliedJ[ for all of the weldments studied. Finally, no strong
effect of the ratio of the weld layer thickness to crack length (2h/2a) existed for the range of
conditions investigated. These latter two conclusions will be discussed in view
of
the work
of
Zhang, et al. [1989].
Zhang, et al. [1989] performed a comprehensive finite element study
of
the effects
of
strength mismatch and strain hardening mismatch on appliedJ[. They investigated wide plates
with square groove butt welds containing cracks 40 of the panel width. Table 4 summarizes
the conditions studied. These investigators introduced the concept of an equivalent yield stress
0eo
and an equivalent str in hardening exponent n
eo
. The values e and ne
are
defined as
those that produce the same appliedJ[ in a monolithic wide plate having the equivalent consti-
tutive properties as in a welded wide plate
of
interest. Figure
21
shows the variation
of
e
with 2h/2a for both over and under matched (on strength) welded wide plates. These data
indicate that if the weld layer thickness (2h) exceeds 1.5 times the crack length (2a) the equiva-
lent yield strength nearly equals the weld metal yield strength. As the ratio
of
2h/2a ap-
proaches zero (as the weld disappears), the equivalent yield strength approaches the base
metal yield strength. These findings agree qualitatively with the results of Dong and Gordon,
who reported close agreement (within 12 ) between the J[ from weldments with 2h/2a
<
0.3 and the
J[
for a monolithic wide plate having base metal properties.
14

8/9/2019 Effect of Weld Metal Strength
http://slidepdf.com/reader/full/effect-of-weld-metal-strength 35/70
Figure 22 presents the variation
of
effective strain hardening exponent with 2h
I
2a re
ported by Zhang
et
al. These data again indicate that, especially for undermatched welds,
when the weld layer thickness exceeds 1.5 times the crack length the equivalent hardening
exponent will nearly equal that
of
the weld metal. At the other extreme, as the weld disappears
and
2h/2a
approaches zero, the equivalent hardening exponent approaches the base metal
hardening exponent. For a wide variety
of
ferritic-pearlitic and martensitic steels, Barsom
and Rolfe [1987] indicate that the strain hardening rate typically increases with reducing yield
strength (in ksi) according to Equation 1). Thus, some
of
the strain hardening matching ratios
_ [
s]
15
1)
in Figure 22 do not occur in practice. This equation indicates that under strength welds are
most likely overmatched for strain hardening while over strength welds are undermatched
for strain hardening. This allows condensation of Figure 22 into one graph (Figure 23) for
common ferritic-pearlitic and martensitic steels. This graph bet ter supports the conclusion
that the equivalent strain hardening exponent for a welded joint equals that
of
the weld metal
when the weld layer thickness exceeds 1.5 times the crack length.
While Zhang s concept of an equivalent yield stress and strain hardening exponent for
a welded joint appears to work well, certain limitations do exist. For example, the work of
Read
and Petrovski and
of
Cray, et al. demonstrated that, for small cracks in welded panels,
certain situations can arise where the appliedJI does not increase with increasing applied dis
placement because strains begin to accumulate
at
the fusion boundary.
Under
such condi
tions, the equivalent yield stress
I
strain hardening exponent concept cannot work because
the applied
J
in a monolithic panel
will
not plateau for the same reason
6
•
Therefore, applica
tion of Zhang s equivalent yield stress I strain hardening concept should be restricted to situa
tions where
J
cannot plateau
or
has yet to plateau. This . imits applicability
of
the concept
to cracks
of
adequate depth to prevent plateauing and to shallow cracks at loads not much
above the limit load.
6. Read [1988] observed, and Dodds and Read [1989] explained, that the applied
J
for a small crack in a mono
lithic tensile panel can plateau with increasing strain. In this instance, however, J plateaus because
of
an
asymmetric in plane yielding phenomena (similar to Luders straining in
un notched
specimens)
that
occurs
between net and gross section yield. This is not the same mechanism observed in welded cracked panels,
where
the
applied J plateaus due to strain accumulation at the fusion boundary of
the
weld joint.
15

8/9/2019 Effect of Weld Metal Strength
http://slidepdf.com/reader/full/effect-of-weld-metal-strength 36/70
Wide Plate Specimens. Summary
The
major findings of the investigations discussed above regarding the effect
of
a
weld on the applied
J
developed in a wide plate specimen are as follows:
• Overmatching the strength
of
a welded joint significantly reduces the
applied that develops at a fixed remote loading relative to an under
matched condition. Sufficient overmatching will result in strain accu
mulation in the plate at the fusion boundary. This causes the applied
J to plateau once yielding occurs and not increase further even though
applied displacement continues to increase. However, crack size in
fluences this advantage of overmatching.
Once the crack is of adequate
size relative to the panel, the plateau does not occur and the applied
J
will increase rapidly with increasing strain after net section yield even
in an overmatched weldment.
• If the true variation
of
applied
J
with remote displacement for a
cracked weldment does not experience a plateau due to strain accumu
lation
at
the fusion boundary, Zhang s equivalent yield stress and strain
hardening concept should provide a reasonable estimate
of
the applied
J for the weldment. This concept uses a monolithic cracked panel hav
ing an effective yield stress and strain hardening exponent to model the
weldment. If the weld layer thickness exceeds 1.5 times the crack size,
these equivalent values become the same as the weld metal properties.
At the other extreme, welds
of
thickness much smaller than the crack
size behave as if made entirely of the plate material. Between these two
extremes a form of the rule
of
mixtures applies.
These results indicate that overmatched weldments generallywill need less weld metal tough-
ness to prevent crack initiation than will an undermatched weld. The equivalent yield stress
- strain hardening exponent concept of Zhang, et al. appears valid providedJI cannot plateau
with increasing strain. However, because cracks in structures are typically shallow, the utility
of
this concept for use in structural fracture safety assessments is likely to be limited.
3 2
mi Strength Matching ffects on Fracture Toughness
No definitive experimental studies concerning the effect of weld metal matching
on
fracture
toughness have yet been conducted
7
• Figures 24 and 25 present the two data sets available,
due to Satoh, et al. [1979] and Cunha and Pope [1986], respectively. These investigators did
7 Recent experimental fracture studies of weldments seem entirely focused on measuring H Z toughness
as
part
of
local brittle zone investigations. While arguably
an
important engineering problem,
H Z
frac
ture
toughness testing stands on even less solid ground than does weld metal fracture toughness testing.
A total
of
four papers concerning the applied
J[
for a crack in the heat affected zone have been published
to
date [Muller and Veith, 1986; Ibid, 1988; Heuser,
et
el., 1987; Hayashi,
et
ai., 1990]. All four papers con
cerned cracks in compact tension specimens, while almost without exception experimental investigations
of H Z
toughness
are
conducted using SE(B) specimens.
h

8/9/2019 Effect of Weld Metal Strength
http://slidepdf.com/reader/full/effect-of-weld-metal-strength 37/70
not hold all other variables constant and change only the weld metal flow properties. Satoh,
et
al. changed the weld metal flow properties by changing the electrode type, while Cunha
nd Pope varied weld metal strength
by
changing the electrode type, the heat input, and the
post
weld heat treatment. Thus, the apparent iridependence of fracture toughness and mis-
m tch indicated in Figures
24
and 25 may be real or a true dependency may exist that is
m sked by toughness variations produced by other variables not controlled in these experi-
ments. Such a lack of dependence would be surprising, given the considerable body of evi-
dence for plate materials which indicates that toughness is inversely related to strength for
a fixed alloy system.
4.
Summary
and onclusions
This report presented a summary of research concerning the effect of weld metal strength
mismatch on the deformation an fracture behavior of welded butt joints. All analytical and
experimental evidence available indicates that plastic strain concentrates into the zone of the
lowest material strength in a transversely loaded weldment. Thus, plastic strains in under-
matched weldments concentrate in the weld deposit while in overmatched weldments they
concentrate in the plate. Data for both remote bending and for remote tension loading indi-
cates that the driving force to fracture
JI)
for a crack in an undermatched weldment generally
increases
t
a much faster rate with increasing plastic strain than for a crack in an under-
matched weldment. This effect of weld mismatch
is
most pronounced for cracks that are ei-
ther
shallow with respect to the testpiece thickness (less than approximately 30 through
wall) or small with respect to the gross load bearing cross section (less than between 4 and
21 re reduction). The implications of these trends are summarized below:
Fracture Toughness Testing Single
Edge
Notch Bend Specimens
• Shallow Cracks: Accurate
JI
estimates cannot be derived from experimental
test records without explicitly accounting for the presence and mismatch of
the weldment. No
JI
estimation schemes yet exist for this specimen type.
• Deep Cracks:By treating the weldment as a monolithic sample made entire-
ly of the weld metal, it may be possible to obtain JI estimates of reasonable
accuracy from experimental data records. Only one set of finite element re-
sults supports this position, however it appears that this approximation will
hold provided that only the weld deposit deforms plastically during testing.
7

8/9/2019 Effect of Weld Metal Strength
http://slidepdf.com/reader/full/effect-of-weld-metal-strength 38/70
Wzde late
Tension
pecimens
• Shallow (or Small) Cracks: The shielding of cracks in welds from high
applied
J
by overmatching is most pronounced in this instance. Over
matched weldments experience a plateau
at
a certain plastic strain level af
ter which no appreciable increase of appliedJI occurs. Undermatched weld
ments exhibit no such plateau. Thus, if non-destructive controls can ensure
that cracks in structures remain small, then overmatched weld deposits re
quire considerably less toughness to prevent failure than do undermatched
weldments. In fact, specifying a fracture toughness somewhat higher than
the J plateau for the largest crack likely to exist in a structure would be a
rational first approximation
of
a toughness criteria based on performance
requirements. However, no simple
J
estimation schemes yet exist for this
specimen type.
•
eep
(or Large) Cracks: The rate ofJ increase with increasing plastic strain
s
still less rapid for cracks in overmatched welds than for cracks in under
matched welds, however no
J
plateau occurs for overmatched weldments
in this instance. The applied J can be estimated with formulas for a mono
lithic plate of the same geometry made of a material having the equivalent
yield stress and strain hardening exponent proposed by Zhang, et al. These
equivalent properties become those of the plate material when the weld lay
er thickness becomes small compared to the crack length (weld layer thick
ness crack length approaching zero). At the other extreme, the equivalent
properties become those
of
the weld metal when the weld layer thickness
becomes large compared to the crack length (weld layer thickness crack
length above 1.5).
Some evidence suggests that weld groove geometryinfiuencesJI values but does not drastical
ly
alter the trends noted above.
Only very limited experimental evidence exists concerning the effects of weld strength
mismatch on weld metal toughness. Available data indicates no significant toughness varia
tion with strength matching ratio. If correct, this indicates that undermatching can only reduce
the factor of safety against fracture for any particular structure. However, such a lack
of
de
pendence would
be
surprising, given the considerable body
of
evidence for plate materials
which indicates that toughness is inversely related to strength for a fixed alloy system.
1

8/9/2019 Effect of Weld Metal Strength
http://slidepdf.com/reader/full/effect-of-weld-metal-strength 39/70
Table 1: Effect of Weld Joint Geometry on
Strain
Localization
in
Elliptical
Explosion Bulge Tests of Overmatched Welds.
Weld Joint
Strength
Global Radial
Local
Strain
Local Strain I
Geometry Matching Strain
at
Weld Global
Strain
Ratio
l
Centerline
[ ]
Square Groove
58
Gap
= Plate
Overmatch
0.066
0.016
24
Thickness
Double-V 89
0.091
0.030
33
60° Bevel Overmatch
Note: 1 - Ratio of uniaxial stresses at an applied strain of 0.05.
Thble 2: Finite Element Results of Bleackley, et al.IlIustrating the Effects of
Weld Joint Geometry on Applied
II
Gross Section Yielding
Joint Geometry Joint Description
Design Curve Slope
Of.
J]
I LlLL
Double
- V Groove
93
0
included angle
35
15.3 mm root gap
Single - V Groove
49
0
included angle
92
5.1 mm root gap
Square Groove 10.2 mm wide groove
114
Homogeneous using
N/A
82
Plate
Flow Properties
Homogeneous using
N/A
94
Weld Flow Properties
Common Features: l Cracks located at weld centerline in weld cap
2.
a W
=
0.1
3.
W = 51 mm
4.
Weld models are 15 undermatched
5. Equal strain hardening rate in weld and plate
19

8/9/2019 Effect of Weld Metal Strength
http://slidepdf.com/reader/full/effect-of-weld-metal-strength 40/70
Table 3:
Wide Plate Conditions Investigated
by
Dong and Gordon.
Matching Conditions
Under 25 Even Even Over 25
alW
All Base Metal
All Weld Metal
0.05
1/2
X
X
1/2
0.20
1/8 and 3/10 X
X
1/8 and 3/10
Comments:
1
Thble entries give ratio
of
weld layer thickness
to
crack length
(2h/2a).
An
'X'
indicates that an analysis was
performed
assuming
the entire panel to be made from the material indicated.
2.
A
Ramberg-Osgood
strain hardening exponent
of
10 was used for all
materials.
Table 4:
Wide Plate Conditions Investigated
by
Zhang, et
ale
Variable
Range Investigated
Strength Matching Ratio
20
Undermatched
to
a weld a plate) I 0
plate
25 Overmatched
s
ys
ys
Hardening Matching Ratio
1
66 Overmatched to
npIate
_ n
weld)
I
nplate
100
Undermatched
Weld
Layer
Thickness
I
Crack Length Ratio
o
o
1.5
2h
2a
Notes:
1.
n is the
Ramberg-Osgood
strain hardening exponent, which
approaches
1 for
linear elasticity and infinity for perfect plasticity. The hardening matching ratio
i l l
be negative (undermatched) if the weld hardens less
than the
plate
and
posi-
tive (overmatched) if the weld hardens more than the plate.

8/9/2019 Effect of Weld Metal Strength
http://slidepdf.com/reader/full/effect-of-weld-metal-strength 41/70
- - . . . .
Weld Metal
• as-cast microstructure
• peak temperature above 1650 C
toughness
highly situation dependent.
Microstructurally inferior to plate, but may have
better toughness through enriched chemistry.
Grain Coarsened HAZ
• large prior austenite grains
• peak temperature above 1100
0
C
toughness
much worse than plate
Grain Retined
H Z
• small prior austenite grains
• peak temperature above 900
0
C
toughness
close to, or better than, plate
Inter-critical
H l
• duplex microstructure
• peak temperature above 723
0
C
toughness
depends on grain size and
microstructural constituents
ubcritjcal
H Z
• spherodized, or same structure as plate
• peak temperature between 600
0
C and 723
0
C
toughness
embrittled (worse than plate) in rimmed
or semi-killed plate due to strain aging
tempered (better than plate) for martensitic plate
spherodized (better than plate) in fully killed plate
Unaffected plate
• peak temperature
below
600
0
C
Figure : Common microstructural and toughness variations in a single pass steel weld-
ment condensed from Kerr [1976].
2

8/9/2019 Effect of Weld Metal Strength
http://slidepdf.com/reader/full/effect-of-weld-metal-strength 42/70
Explosive
Charge
Stand Off
Maintainance
Device
Welded
Bulge
Plate
Support
Die
Figure : Expanded view of experimental set-up for explosion bulge tests [Hartbower and
Pellini, 1951 a) and 1951 b)].

8/9/2019 Effect of Weld Metal Strength
http://slidepdf.com/reader/full/effect-of-weld-metal-strength 43/70
E12016 133 ksi
1 4 0 ~ r ~
2 3 4
0
E6010 84 ksi
1 1 ~ l l ; ~ n ~ ~ L
IoU
:z
I
' = ~ I I ~
o
I
Z
:
n
::;
ClI.A.J
z
_
= J
-
2 3
2
3
4
Radial Distance from Weld Centerline [inches]
Figure 3: Strain distribution transverse to double-V groove weldments in explosion bulge
test panels [Hartbower and Pellini, 1951(a)].

8/9/2019 Effect of Weld Metal Strength
http://slidepdf.com/reader/full/effect-of-weld-metal-strength 44/70
3.0
Undermatch
•
66
2.6
•
r:.
50
.r:.
en
en
•
28
c
c
CI)
CI)
J)
A
J)
22
iii
\
iii
c
C
{E
E.
,.
CI)
~
CI)
.T
ftS
\
ftS
E
E
1.8
ta
E
; :
\ ~ ~
5
c;
c
....
CI)
CI)
.
.
:E
'C
'C
1.4
~
;
a;
3:
3:
1.0
...
L i
•
•
0.4
08
1.2
1.6
Weld Layer Thickness / Bar Diameter
Figure 4: Influence
of
weld layer thickness gap between plates joined) on the ultimate ten
sile strength
of
the weldment for round
bar
specimens [Satoh and Toyoda,
1970 a)]. Below an x-axis value
of
0.4, the strength of all specimens approaches
the strength of the plate different for each percent undermatch).

8/9/2019 Effect of Weld Metal Strength
http://slidepdf.com/reader/full/effect-of-weld-metal-strength 45/70
tJ
tJ
UJ
a::
F
~ 4 [ ~ 4 ~ ~ ~ = ~ ~ ~ ~ ~ ~
-
<
~ 2 { - - - - - ~ - - - - ~ - - - - - + - - - - - + - - - - ~
0.5
1.0
1. 2.0 2.5
ENGINEERING
STR IN
£ _
Figure 5: Influence
of
weld layer thickness (gap between plates joined) bar diameter X
value) on the failure strain (F) and strain at maximum load (M) for 50 under-
matched round bar specimens [Satoh and Toyoda, 1970(a)].
25

8/9/2019 Effect of Weld Metal Strength
http://slidepdf.com/reader/full/effect-of-weld-metal-strength 46/70

8/9/2019 Effect of Weld Metal Strength
http://slidepdf.com/reader/full/effect-of-weld-metal-strength 47/70
2.5
•
47 Undermatched
t
Rectangular Plates
c
c
(Width/Thickness
=
3:1)
C
2.0
c
c
47 Undermatched
CD
CD
•
Round Bars
n
n
.
.
iii
iii
c
c
CD
CD
1.5
«S
«S
E
E
E
E
::;,
::;
C6
c
D
CD
E
:
1.0
C
C
i )
Q
3:
3:
o 0.2 0.4 0.6 0.8
1
0 1.2 1.4 1 6
Weld Layer Thickness / Bar Diameter
Figure
6:
Effect of testpiece aspect ratio on the weldment ultimate tensile strength [Satoh
and Toyoda, 1970(b)]
,Fa

8/9/2019 Effect of Weld Metal Strength
http://slidepdf.com/reader/full/effect-of-weld-metal-strength 48/70
'
E10
El£I ctrod£l
E (E7016)(E9016G) (Ell016 G
,
/ /
i
I
T s i H T 6 ~ HT
. cr
~ ~ ~ ~ ~ ~ ~ ~
baD ~ ~ u
I
~
~
. ii
c
0
0
Groove
w.
U
70
X
70
U
500
~ 4
0
X
500
o r- I t
o J 40 . 60 80
Strength of weld metal,
cr: kg/mm
2
Wo
Groove
•
500
U
•
X
.
.
~ 70
I U J
L ~
X
(W.=500)
~
\
Electrode
Base metal
H T 5 1 H T 6 r HT80/
I •
0 (W.=70)
•
W.=500mm
o I I I
o
oJ
40
6
8 1 0
Strength of weld rretal ,0-: . k9/
fTYTl2
Figure : Effect
of
weld groove geometry and panel width on the ultimate tensile strength
and ultimate tensile elongation of 70mm thick HT80 weldments [Satoh and
Toy-
oda 1975].

8/9/2019 Effect of Weld Metal Strength
http://slidepdf.com/reader/full/effect-of-weld-metal-strength 49/70
1
o
76
mm wide
6 38
mm
wide
twist wire
0.2 0.4
0 6
0.8
Aspect ratio weld gap t plate thickness)
Figure 8: Effect of weld layer thickness on weldment yield and ultimate tensile strength
for rectangular cross section tension specimens width
to
thickness ratio
of
1.5:1)
cut from stress relieved ASTM A516 Grade 70 weldments [Patchett and Bellow,
1983].
8

8/9/2019 Effect of Weld Metal Strength
http://slidepdf.com/reader/full/effect-of-weld-metal-strength 50/70
Single Edge Notch Bend, SE{B ,
Specimen
LO D
Single Edge Notch Tension, SE{T ,
Specimen
Wide Plate Specimen
Figure
9:
Schematic diagram of testpieces for fracture mechanics tests of weldments
9

8/9/2019 Effect of Weld Metal Strength
http://slidepdf.com/reader/full/effect-of-weld-metal-strength 51/70
Normalized J Integral
J.E/
a
Applied Strain / Yield Strain
Applied Displacement / Yield Displacement
Applied Load / Limit Load
Figure
1 :
Schematic diagram of Engineering-J design curve format [Turner 1983].
3

8/9/2019 Effect of Weld Metal Strength
http://slidepdf.com/reader/full/effect-of-weld-metal-strength 52/70
;
0
Q)
c
E
o
z
100
A
30 Overmatched
Z 15 Overmatched
o
Homogeneous
•
15 Undermatched
75
. 30 Undermatched
5
25
o ~ ~ ~ ~ ~ ~ ~ ~
o 23
pplied Strain / Yield Strain e/8y
Figure 11: Effect of strength matching ratio on the variation
of
J with applied strain for
0 1
a/W SE B) specimens [Cray, et aI., 1989].

8/9/2019 Effect of Weld Metal Strength
http://slidepdf.com/reader/full/effect-of-weld-metal-strength 53/70
Plastic
str in 0/0
<0.1 0.1 5
5 15
_
> 5
Figure
12:
Plastic strain distribution in 30 undermatched double-V butt weldments
loaded in remote tension (top) and in remote bending (bottom). Crack depth
was 10
of
panel thickness. [Cray, et aI., 1989]
32

8/9/2019 Effect of Weld Metal Strength
http://slidepdf.com/reader/full/effect-of-weld-metal-strength 54/70
60
50
8
0
40
in
30
::J
0
C
.
20
10
0
0.00
60
50
8
0
40
in
.
30
::J
0
C
.
20
m
t
10
0
0.00
Remote Bending
30
Undermatched
Z 30 Overmatched
0.05 0.10 0.15 0.20 0.25
Normalized Crack Depth
a W
a)
Remote Tension
30
Undermatched
Z 30 Overmatched
0.05 0.10 0.15
0.20 0.25
Normalized Crack Depth
a W
b)
Figure
13:
Effect of crack depth, loading mode, and strength matching ratio on the Engi
neering-J design curve slope of single edge notch specimens once yielding has
occurred. a) SE B) specimens. b) SE T) specimens. [Cray,
et aI.,
1989]
"''''

8/9/2019 Effect of Weld Metal Strength
http://slidepdf.com/reader/full/effect-of-weld-metal-strength 55/70
250
200
........
Z
150
100
J
I
50
o
o
250
200
150
Z
t I
100
-
50
o
0.0
P
I /W = 0.1
T
W
1-
0 .1
= 500MPa.
DI = n
D
= 10.
o,.D = 4-00MPa,
01
= aD = 1
- -
._
1
2
Parent metal
h/W
=
0.5
Weld metal
3
4
5
P
KN)
P
I /ff = 0.5
o J = 500llPa.
n
l
= DD = 10.
o,.D
=
4-00MPa
01 =
aD
= 1
Parent metal
-
-
h/W = 0.5
._-------.-
Weld
metal
0.5
1 0
1.5
P KN)
6 7
8
9
2.0 .
2.5
3.0
Figure 14: Effect
of
crack depth on applied J1 for SE(B) specimens with 25 overmatched
butt welds [Dong and Gordon, 1990]. In the figures, solid lines indicate J1 values
calculated for a testpiece made entirely of plate material, short dashes indicate
JI values calculated for a testpiece made entirely of weld metal, and long dashes
indicate J1 values calculated for a welded testpiece.
34
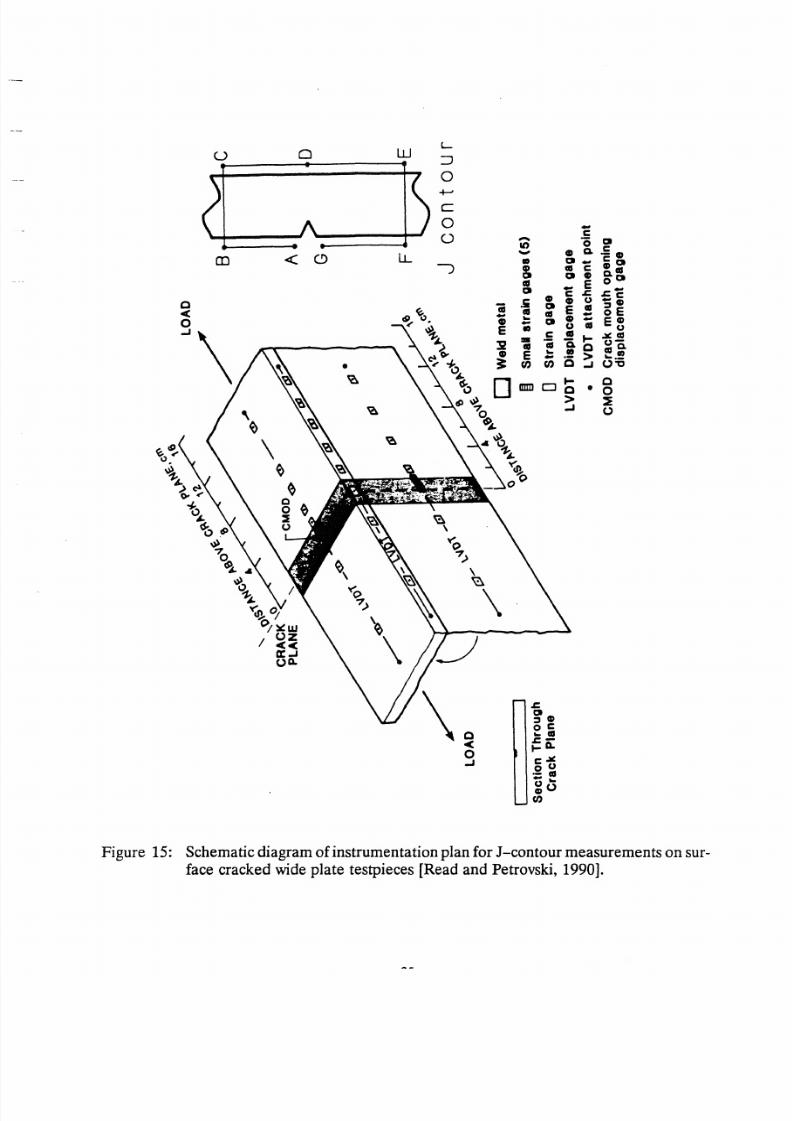
8/9/2019 Effect of Weld Metal Strength
http://slidepdf.com/reader/full/effect-of-weld-metal-strength 56/70
u
o
CD
<
w
L
J
o
c
o
o
o
<
o
..J
D
Q
as
CI
C
i
I
CJ
.e
::J C
fas
.e
a
c:Jtf
OU
-co
~
go
U
;
CI
a. e D
CI _ C
Q
IS
C
D as
CI D a CI
E 0
C
.e
. e
D
U
_c
::JCD
E
as
oE
D
ECD
u
as
u
.
:Jtf as
u
i o
as a
.- >
~ ~
O..J ~
0
0
•
0
>
: :
..J
0
Figure 15: Schematic diagram of instrumentation plan for J-contour measurements on sur
face cracked wide plate testpieces [Read and Petrovski, 1990].
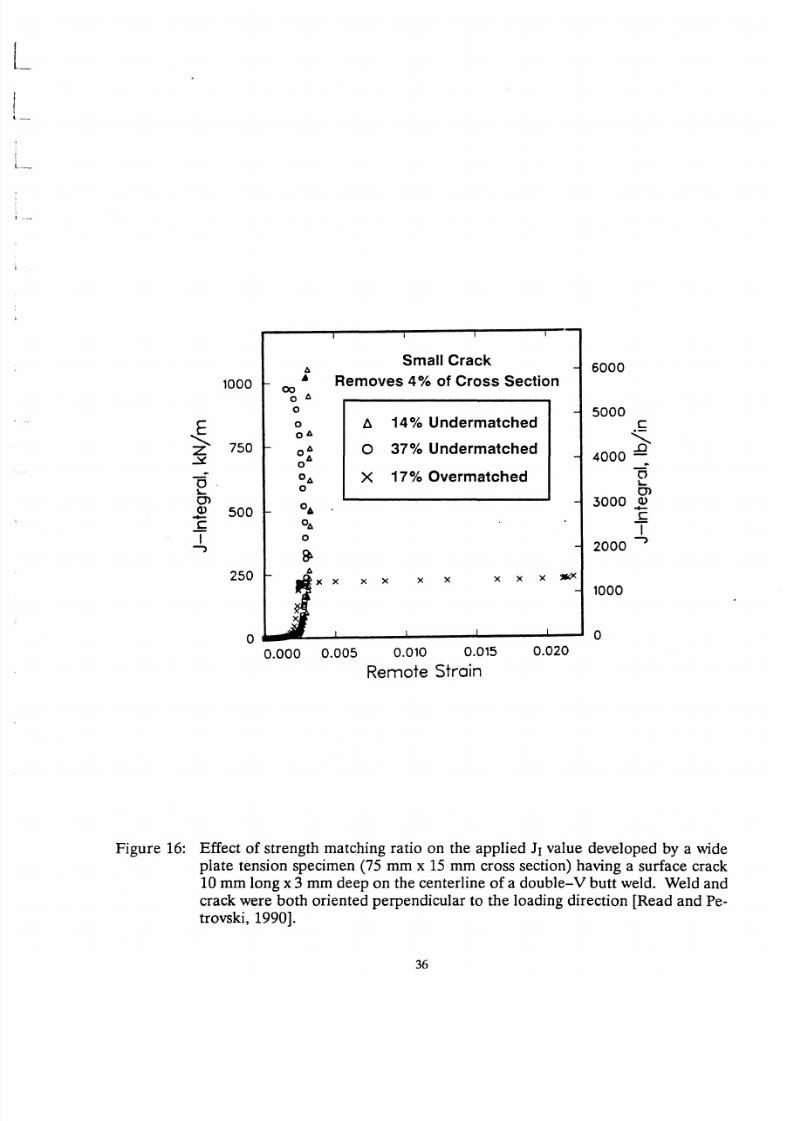
8/9/2019 Effect of Weld Metal Strength
http://slidepdf.com/reader/full/effect-of-weld-metal-strength 57/70
I
I
I
I
Small Crack
-
6000
1000
•
Removes 4
of
Cross Section
00
o A
0
-
5000
~
0
II
14 Undermatched
c
OA
750
OA
0
37 Undermatched
:::t OA
-
4000 :
0
°A
X
17 Overmatched
J
0
0>
l
0
-
3000
2
Q)
500 -
c
£;
°A
T
I
0
2000
-
-
250
A
x
x
x
x
x
x
x
x
-
1000
I
I
I
I
0
0
0.000
0.005
0.010
0.015
0.020
Remote Strain
Figure 16: Effect of strength matching ratio on the applied
JI
value developed by a wide
plate tension specimen 75 mm x 15 mm cross section) having a surface crack
1 mm long x 3 mm deep on the centerline of a double-V butt weld. Weld and
crack were both oriented perpendicular to the loading direction [Read and Pe
trovski, 1990].
36

8/9/2019 Effect of Weld Metal Strength
http://slidepdf.com/reader/full/effect-of-weld-metal-strength 58/70
I
I
I
I
Large
Crack
1000
f
Removes 2 of Cross
Section
x
0
II
14
Undermatched
) :-
Z
750
-
0
37 Undermatched
.::t.
x
OA
X
17
Overmatched
0
xA
L
A
Q
b
Q
500
f
C
x
A
I
xo
- ,
x
A
A
250
f-
0
0
J;
I
I I
I
0.000
0.005 0.010 0.015 0.020
Remote Strain
-
6000
-
5000
c
-
4000
-
0
L
0>
-
3000 2
C
I
-
2000 - ,
- 1000
o
0.025
Figure 17: Effect of strength matching ratio on the applied
JI
value developed by a wide
plate tension specimen 75 mm x
15
mm cross section) having a surface crack
25
mm long x 6 mm deep on the centerline of a double-V butt weld. Weld and
crack were both oriented perpendicular to the loading direction [Read and Pe
trovski, 1990].
8/9/2019 Effect of Weld Metal Strength
http://slidepdf.com/reader/full/effect-of-weld-metal-strength 59/70
-
m
tn
Q)
.....
c:
...
-c
Q)
N
m
E
o
z
16.0
4.0
o
h/2a 1
1:
0.00 ......
2
2:
0.25 I
:
0.50
/
4: 1.00 /
5:
2.00
/
£...____ 3
. ?
....
.... -.-.-. 5
2.0
4.0
q I a
6.0
Normalized pplied Displacement
Figure
18: Effect of weld layer thickness h) to crack length 2a) ratio on applied
r
devel
oped
in wide plates made from square-groove 37 overmatched butt weld
ments containing a central through crack cutting 20 of the panel width. Both
crack and weld are oriented perpendicular to loading direction [Weidian, et aI.,
1989].
38
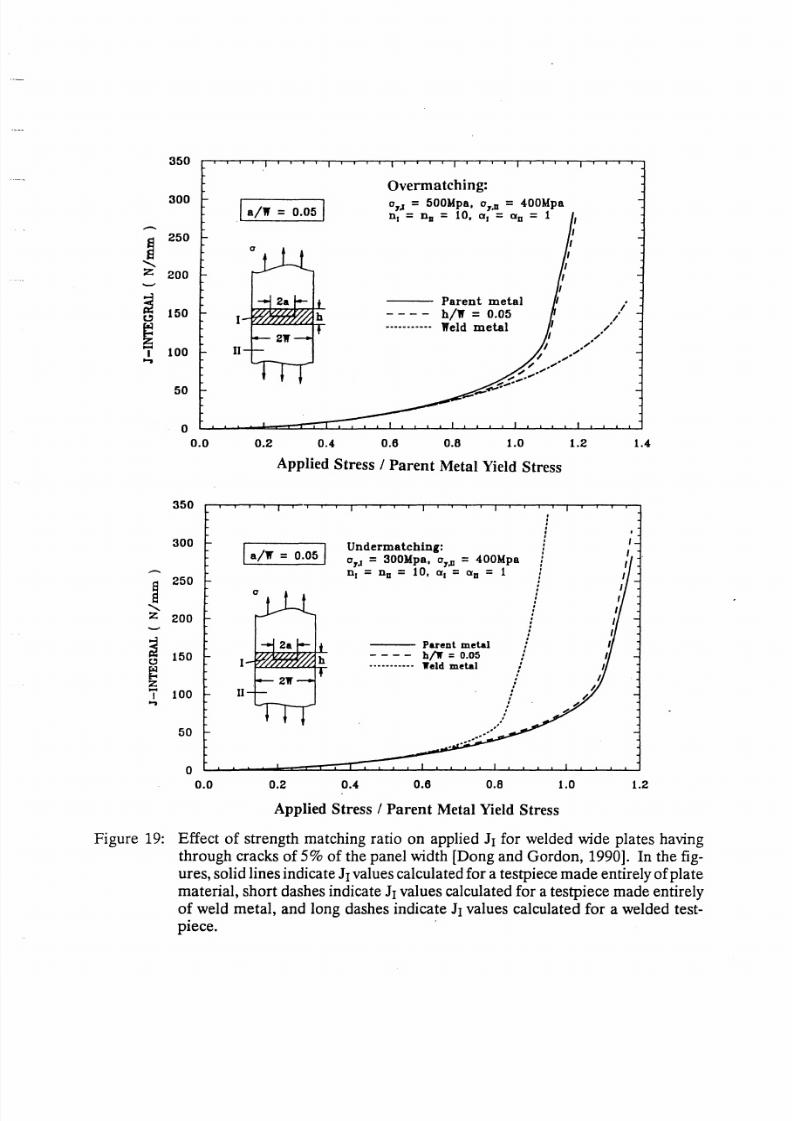
8/9/2019 Effect of Weld Metal Strength
http://slidepdf.com/reader/full/effect-of-weld-metal-strength 60/70
350
300
-
250
-
Z
200
150
100
50
o
0.0
350
300
250
Z
200
150
t l
Z
-
100
50
0
0.0
Overmatching:
1
a/W
= 0.051
OJ. = 500Mpa. 0 . 0 = 400Mpa
n
l
=
no
=
10, a
l
=
aD
=
1
II
Parent
metal
h/W = 0.05
eld
metal
0.2 0.4 0.6 0.8 1.0 1.2
Applied Stress / Parent Metal Yield Stress
,
I /W
= 0.05
I
Undermatchin :
",:
0,.,1
=
300Ypa
o . u
=
4-00Mpa
II
0.2
DI
=
Do = 10, a
l
=
ClIO
=
1
0.4
Parent metal
- - - h lr = 0.05
----------- 1reld metal
...
0.6
. _ 1
0.8
Applied Stress /
Parent
Metal Yield Stress
1.0
1.4
1.2
Figure 19: Effect of strength matching ratio on applied J1 for welded wide plates having
through cracks of 5%
of
the panel width [Dong and Gordon, 1990]. In the fig-
ures, solid lines indicate
J1
values calculated for a testpiece made entirely of plate
material, short dashes indicate J1 values calculated for a testpiece made entirely
of weld metal, and long dashes indicate J1 values calculated for a welded test
pIece.

8/9/2019 Effect of Weld Metal Strength
http://slidepdf.com/reader/full/effect-of-weld-metal-strength 61/70
350
300
250
'
200
150
0
100
50
0
0.2
350
300
250
'
200
150
0
100
..
50
0
0.2
I
/W
= 0.2
II
0.3
0.4
Overmatching:
0, ,1
=
500Mpa, o,.D
=
400Mpa
I =
Du
= 10,
a
l
= Xu = 1
Parent
metal
- - -
hi 0 05
h/W = 0.12
Weld
metal
0.5
0.6 0.7 O B
0.9
Applied Stress /
Parent
Metal Yield Stress
I /l( = 0.2
n
0.3
0.4
Undermatching:
0,.1 =300Jdpa, 0y.D =
400Mpa
I =nu =
10,
al = au = 1
,I;
I -
11/
'Il
l /
•
Weld
metal
1/ 1
. 1/
- - - -
h/W
= 0.12 'h/
h/W =
0.05 0 /
,/.,
- Parent
metal
17 /
~
/
0.5
0.6
0.7
O B
0.9
Applied Stress /
Parent
Metal Yield Stress
1.0
1 0
Figure 20: Effect of strength matching ratio on applied
JI for
welded wide plates having
through cracks of
20
of the panel width [Dong and Gordon, 1990]. In the fig
ures, solid lines indicate Jl values calculated for a testpiece made entirely
of
plate
material, long-short-Iong dashes indicate Jl values calculated for a testpiece
made
entirely
of
weld metal, and
both
long and medium dashes indicate Jl values
calculated for a welded testpieces.
40
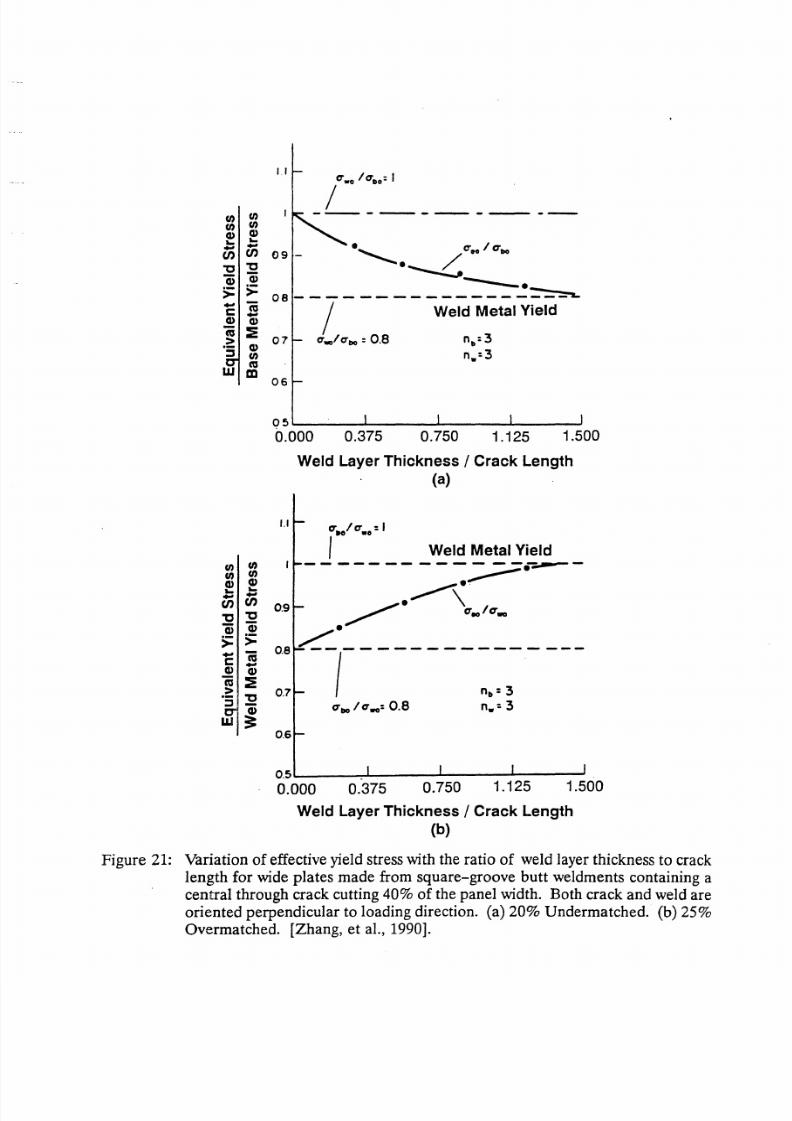
8/9/2019 Effect of Weld Metal Strength
http://slidepdf.com/reader/full/effect-of-weld-metal-strength 62/70
C/
C/
C/
C/
CD
CD
n
n
'C
'C
Ci
Ci
:;:
:;:
75
c
.
CD
cu
IE
CD
::s
C/
w
cu
m
C/ C/
C/
C/
CD
CD
n
n
"0
"0
Ci
Ci
:;:
>=
..,
75
c
CD
CD
75
:s
>
oS
'C
Ci
W
==
1.1
9
e
___
_
08
- - - - - -
___ :"'L
/ Weld Metal Yield
7 t w
trbO :
0.8 nb: 3
n.:3
06
Q 5 ~ ~ ~ ~ ~ ~
0.000
0.375 0.750
1.125
1.500
0 6
Weld Layer Thickness /
Crack
Length
(a)
0.5
L
__ ~ - - . . . . . . J - - - - - - . . - - - - - - - - '
0.000 0.375
0.750
1.125 1.500
Weld Layer Thickness / Crack Length
(b)
Figure 21: Variation
of
effective yield stress with the ratio
of
weld layer thickness
to
crack
length for wide plates
made
from square-groove
butt
weldments containing a
central through crack cutting 40
of
the panel width. Both crack
and
weld
are
oriented perpendicular to loading direction. (a)
20%
Undermatched. (b) 25
Overmatched. [Zhang,
et
aI., 1990].

8/9/2019 Effect of Weld Metal Strength
http://slidepdf.com/reader/full/effect-of-weld-metal-strength 63/70

8/9/2019 Effect of Weld Metal Strength
http://slidepdf.com/reader/full/effect-of-weld-metal-strength 64/70
2
C
C
CI)
CI)
C C
0
0
Co
)
1.5
W
C
c
c
2
2
I)
CI)
C
C
C'CS
C'CS
r;
r;
c
c
co
co
n
n
....
'is
05
C
n z
3
Q Q
'is
:E
>
S
C
a;
w
3:
0.000.
0.375
0.750
1.125
1.500
Weld Layer Thickness / Crack Length
Figure 23: Consolidated plot from the results of Zhang, et al. [1990] showing the variation
of effective strain hardening exponent with the ratio of weld layer thickness for
common ferritic-pearlitic and martensitic steels. Undermatched welds (on
strength) are overmatched for strain hardening, while overmatched welds (on
strength) are undermatched for strain hardening.

8/9/2019 Effect of Weld Metal Strength
http://slidepdf.com/reader/full/effect-of-weld-metal-strength 65/70
. . ; . u . . ~ W e l d i n 9
process
.
SMAW
OvermofchinQ
• E 110 16-G
o
SMAW UndermatchinQ
E 9016- G )
E
E
u
1.0
<..0
•
0 5
c
0
u
0
u
0.1
u
0 05
T
f
0
C )
empero ure
igure
24: Effect of strength matching 23
%
undermatched vs. 1
%
over) on critical fracture
toughness 8
e
) values determined by testing deeply notched SE(B) specimens cut
from 50
mm
thick HT80 steel weldments [Satoh, et a ., 1979].

8/9/2019 Effect of Weld Metal Strength
http://slidepdf.com/reader/full/effect-of-weld-metal-strength 66/70
1 5
1 3
-
•
•
E
5
1 0
c
0 8
,
I
t
E
::J
E
0 5
-
•
·2
0 3
•
·
..
~
0 0
I
I I
10
0 1 20 30
4
Weld
etal
strength
Over or
Under atch
Figure 25: Effect
o
strength matching ratio on critical fracture toughness minimum
o
three
Be
values at
+ IO°C
for various self shielded flux core weldments between
BS 4360 grade
SO
plate [Cunha and Pope].

8/9/2019 Effect of Weld Metal Strength
http://slidepdf.com/reader/full/effect-of-weld-metal-strength 67/70
5 eferences
ASTM Standard Test Method for Plane-Strain Fracture Toughness of Metallic Materials,
E399-83.
ASTM Standard Test Method for Crack-Tip Opening Displacement (CTOD) Fracture
Toughness Measurement, E1290-89.
ASTM Standard Test Method for JIe A Measure of Fracture Toughness, E813-89.
American Society of Mechanical Engineers, Boiler and Pressure Vessel Code, Section III,
Nuclear Power Plant Components, 1980.
American Welding Society, Dl.l-80, Structural Welding Code, 1980.
Barsom, J .M., and Rolfe, S.T. Fracture and Fatigue Control in Structures -ApplicationsofFrac-
ture Mechanics p. 265, 1987.
Bleackley, M.H., Jones, R.D., and LUXITIoore A.R., Path Dependency
of
the Rice J-Integral
in Weld Geometries, in
Proceedings of he Sixth
European Conference on
Fracture: Frac-
ture Control in Engineering
Structures
pp. 643-654, 1986.
Cray, M.J., Luxmoore, A.R., and Sumpter, J.D.G.,
The Effect of Weld Metal Mismatch on
J and CTOD, in
Proceedings
of
he European
Symposium on Elastic-Plastic
Fracture Me-
chanics
(to be published), Freiburg, ER.G., 1989.
Cunha, P.C.R., and Pope, A.M., Flux Cored Arc Welding Procedures for High Weld Metal
Toughness for Offshore Structures, in
Proceedings
of
he
Sixth European Conference on
Fracture: Fracture Control ofEngineering Structures
pp. 367-377, 1986.
Denys, R. M., Wide-Plate Testing ofWeldments: Part III - Heat-Affected Zone Wide-Plate
Studies, Fatigue and Fracture Testing
ofWeldments
STMSTP 1058 H.I. McHenry and
J.M. Potter, Eds., pp. 204-228, 1990.
Dodds, R.H., and Read, D.T. Experimental and Numerical Studies for the J-Integral for
a Surface Flaw, International Journal of Fracture Vol. xx No. yy 1989.
Dodds, R.H., et aI., Numerical Correlation of Size Effects on Elastic-Plastic Fracture
Toughness (J
e
),
in Numerical
Methods in Fracture
Mechanics LUXITIoore A.R., and
Owen, D.R.J., Eds., pp. 585-596, April 1990.
Dong,
P.
and Gordon, J .R., The Effect of Weld Mismatch on Structural Integrity Asses
sments, presented at the Sixth Annual North American Welding Research Conference,
Columbus,
Ohio, November 1990.
Harrison, R.P.,
et
aI.,
~ s e s s m e n t
of the Integrity of Structures Containing Defects, Central
Electricity Generating Board Report RIHIR6 Rev 2, April, 1980.
Hartbower, C.E., and Pellini,
W.S.
Explosion Bulge Test Studies
of
the Deformation
of
Weldments, Welding Journal - Welding Research Supplement pp. 307s-318s, June
1951(a).
46

8/9/2019 Effect of Weld Metal Strength
http://slidepdf.com/reader/full/effect-of-weld-metal-strength 68/70
Hartbower, C.E., and Pellini,
W.S.
Investigation of Factors which Determine the Perform
ance
of
Weldments,
Welding
Journal-
Welding Research
Supplement, pp. 499s-511s, Oc
tober
1951(b).
Hayashi, K.,
et
aI.,
~ p l i c a t i o n
of
the J-Integral to Welded Joints, Welding
International,
Vol. 4
No.2,
pp. 109-115, 1990.
Heuser, A., et aI., Experimental Investigations
of
the Failure Behavior
of
Welded Joints and
its Numerical Simulation by Using Elastic-Plastic Finite Element Calculations, The
Fracture Mechanics
o
l lds, EGF Pub. 2, J.G. Blauel and K.-H. Schwalbe, Eds., pp.
97-124, 1987.
Howden, et
aI., Effective use
of
Weld Metal Yield Strength for
HY
Steels, National Materi
als Advisory Board Report, Report No. NMAB-380, January 1983.
Hutchinson, J.w., Fundamentals of the Phenomenological Theory of Nonlinear Fracture
Mechanics,
1 Appl. Mechanics,
Vol.
50, pp. 1042-1051, December 1983.
Irwin,
G.R.,l
Appl. Mech.,
Vol.
29, pp. 651-654, 1962.
Kerr, W.H., A Review of Factors Affecting Toughness in Welded Steels, Int. 1
Pres.
ves.
Piping, Vol. 4, pp. 119-141, 1976.
Kumar, v. et aI.,
An
Engineering Approach for Elastic-Plastic Fracture Analysis,
EPRI
Report
NP-1931, Electric Power Research Institute, 1981.
Kumar, v. et aI., ~ d v a n c e s in Elastic-Plastic Fracture Analysis,
EPRI
Report NP-3607,
Electric Power Research Institute, 1984.
Lee, M.M.K., and Luxmoore, A.R., AnExperimental Study of the Elastic-Plastic Deforma
tion
of
Double
V
Butt Welds,
Journal o Strain
Analysis,
Vol.
25,
No.4,
1990.
Machida, S., et aI., Probabilistic Aspects of HAZ CTOD Value of Multipass Welded Joint
of Steel for Offshore Structure,
Proceedings o the
Ninth International Conference on
Offshore Mechanics and Arctic Engineering Vol. III, Part B, pp. 443-452, 1990.
Mull er,
w.
and Veith, H., Elastic-Plastic
FE
Calculations for a Fracture Mechanics Analysis
of a Weld in
the
Ligament of a CT Specimen, International Journal o Pressure vessels
and Piping Vol. 26, pp. 275-294, 1986.
Muller,
W.
and Veith, H., Influence of Weld Metal Properties on Fracture Mechanics Pa
rameters in Welds Analysed by FEM Calculations, International Journal
o Pressure ves-
sels and Piping Vol. 33, pp. 285-300, 1988.
Parker, Earl R.,
Brittle Behavior o Engineering Structures: Chapter
12 -
Welded Ship Failures
John Wiley and Sons, New York, 1957.
Patchett, B.M., and Bellow, D.G., Narrow Gap Welds Using Under Strength Weld Metal,
Proceedings of the Second International Conference on Welding and Energy Related
Problems, pp. 269-278, September 1983.
47

8/9/2019 Effect of Weld Metal Strength
http://slidepdf.com/reader/full/effect-of-weld-metal-strength 69/70
PD 6493, Guidance on Some Methods for the Derivation
of
Acceptable Levels for Defects
in
Fusion Welded Joints, British Standards Institution, March 1980.
Read, D.T., J-Integral Values for Small Cracks in Steel Panels,
Fracture
Mechanics:
Eigh-
teenth Symposium, ASTM STP
945, D.T. Read and
R.P.
Reed, Eds., pp. 151-163, 1988.
Read, D.T., and Petrovski, B.I., Elastic-Plastic Fracture at Surface Flaws in HSLA Weld
ments, Proceedings of he 9
th
International
Conference
on Offshore Mechanics andArctic
Engineering,
Volume
III, ASME, pp. 461-471, 1990.
Rice, J .R., A Path Independent Integral and the Approximate Analysis of Strain Concentra
tion by Notches and Cracks,
1
Appl. Mech.,
Vol.
34, pp. 237-246, 1967.
Rice, J .R., Mathematical Analysis in the Mechanics of Fracture, Vol. II, Chapter 3 of Frac-
ture An Advanced
Treatise
H. Liebowitz, Ed., pp. 191-311, 1968.
Satoh, K., and Toyoda, M., Static Tensile Properties of Welded Joints Including Soft Interlay
er,
Transactions
of
the
Japan Welding
Society
pp. 7-12, April 1970(a).
Satoh, K., and Toyoda, M., Static Strength of Welded Plates Including Soft Interlayer under
tension across a Weld Line, Transactions of
he
Japan Welding Society, pp. 10-17, Sep
tember 1970(b).
Satoh, K., and Toyoda, M., Joint Strength
of
Heavy Plates with Lower Strength Weld Metal,
Welding Joumal Welding Research
Supplement, pp. 311s-319s, September 1975.
Satoh,
et
aI., Prevention of Weld Crack in HT80 Heavy Plates with Undermatching Elec
trodes in Application to Fabricating Penstock,
Transactions of
he
Japan Welding Society
Vol. 9, No.1, pp. 17-21, April 1978.
Satoh, K., et aI., Undermatching Electrode Applied to HT80 Heavy Plates for Penstock,
Welding
Journal- Welding Research Supplement, pp. 25s-33s, February 1979.
Shih, C.F., Tables of Hutchinson-Rice-Rosengren Singular Field Quantities, Brown Uni
versity Report, Report No. MRL-E-147, June 1983.
Shih, C.F., J-Dominance under Plane Strain Fully Plastic Conditions: The Edge Crack Panel
Subject to Combined Bending and Tension,
Inti.
Fracture Vol. 29, pp. 73-84, 1985.
Shron, R.Z., and Bakshi, O.A., The Static Tensile Strength
of
Welded Joints with a Soft In
terlayer, Shar. Proiz. No.5, pp. 6-10, 1962(a), (English Translation in
Welding
Produc-
tion .
Shron, R.Z., and Bakshi, O.A, The Problem of Gauging the Strengths of Welded Joints in
which there is a Soft Interlayer, Shar. Proiz. No.9,
pp.II-14,
1962(b), (English 1tansla
tion in
Welding
Production .
Turner, C.E., Further Developments of a J-Based Design Curve and its Relationship to Oth
er Procedures, Elastic-Plastic Fracture: Second Symposium, Volume II -
Fracture
Resis-
tance Curves and Engineering Applications, ASTM STP 803 C.F. Shih and J.P. Gudas,
Eds., pp. ll-80-II-I02, 1983.
48

8/9/2019 Effect of Weld Metal Strength
http://slidepdf.com/reader/full/effect-of-weld-metal-strength 70/70
U.S. Department of1tansportation, Code of Federal Regulations, Title 49, Parts 191 and 192,
Regulations for the 'fransportation of Natural Gas and other Gases by Pipeline, 1979.
Weidian,
et
aI. Influence of Material Inhomogeneity of Overmatched Welded Joints on the
Crack Driving Force, in
Proceedings
o
I CF
7:
Advances in Fracture Research - Volume
I pp.
479-486,1989.
Wellman, G.w., et aI., Three Dimensional Elastic-Plastic Finite Element Analysis
of Three-
Point Bend Specimens, Welding Research Council Bulletin 299, pp.15-25, November
1984.
Wells, AA. Unstable Crack Propagation in Metals: Cleavage and Fast Fracture,
Proceed-
ings Crack Propagation Symposium Crans ield
pp. 210-230, 1961.
Wells,
A.A
~ p I i c a t i o n of Fracture Mechanics
at
and Beyond General Yielding, British
Welding Journal
Vol. 11, pp. 563-570, 1963.
Zhang, J .X., et aI., Studies on the Fracture Mechanics Parameters
of
Weldment with Me
chanical Heterogeneity,
Engineering Fracture Mechanics
Vol. 34, No. 5/6, pp.
1041-1050, 1990.