Embed Size (px)
Citation preview
I
MAXIMUM STRENGTH OF SHIP HULLS
EFFECT OF TORSION
ON STRENGTH
OF SHIP HULLS
fR1TZ ENGtNE:ER'NGLA60BATORY. UBAARY
BY
ALEXIS OSTAPENKO
YAOFENG CHEN
NOVEMBER 1982
REPORT NO. 468.11
Maritime Administration University Research Program
Report ,No. MA-RD-940-82076
EFFECT OF TORSION ONSTRENGTH OF SHIP HULL GIRDERS
Prepared by:
Alexis OstapenkoYaofeng Chen
LEHIGH UNIVERSITYFritz Engineering Laboratory
F.E.L. Report No. 468.11
November 1982
u. S. DEPARTMENT OF TRANSPORTATION, Maritime AdministrationOffice of Research and Development
468. 11
LEGAL NOTICE
This report was prepared as an account of government-sponsored work.Neither the United States, nor the Maritime Administration, nor any person acting on behalf of the Maritime Administration:
(A) make any warranty or representation, expressed or implied, wi threspect to the accuracy, completeness, or usefulness of the information contained in this report, or that the use of any information, apparatus, method, or process disclosed in this report maynot infringe privately owned rights; or
(B) assume any liabili ties wi th respect to the use of or for damageresul ting from the use of any information, appara tus, method, orprocess disclosed in this report.
As used in the above, "persons acting on behalf of the Mari timeAdministration" includes any employee or contractor of the Maritime Administration to the extent that such employee or co~tractor of theMaritime Administration prepares, handles, or distributes, or providesaccess to, any information pursuant to his employment or a contract withthe Maritime Administration.

50272 aJ 01
REPORT DOCUMENTATION I.J~REPORT NO.
PAGE MA-RD-940-81 076 I~ 3. Recipient's ~ccession No.
4. Title and Subtitle
EFFECT OF TORSION ON STRENGTH OF SHIP HULL GIRDERS5. Report Date
november 19S2~ - J
(C) MA-80-SAC-OI081
10.. Project/Task/Work Unit No.
468
8. Performing Organization Rept. No.
F.R.L. Rept No. 468.11
11. Contract(C) or Grant(G; No.
and Yaofeng Chen9. Performing Organization N.me and Address
Lehigh UniversityDept. of Civil EngineeringFritz Engineering Laboratory #13Bethlehem, PA 18015
I . ~ I I7. Author(s)
Alexis Ostapenko
12. SpOnsoring Organization Name and Address
Maritime Administration{I.S. Department of ~~3~~~Qr~ation
Washington, D.C. =C~
(G)
13.. Type of Report & Period Covered
FI~L.\L
14.
15. Supplementary Notes
-16. Abstract (Limit: 200 words)
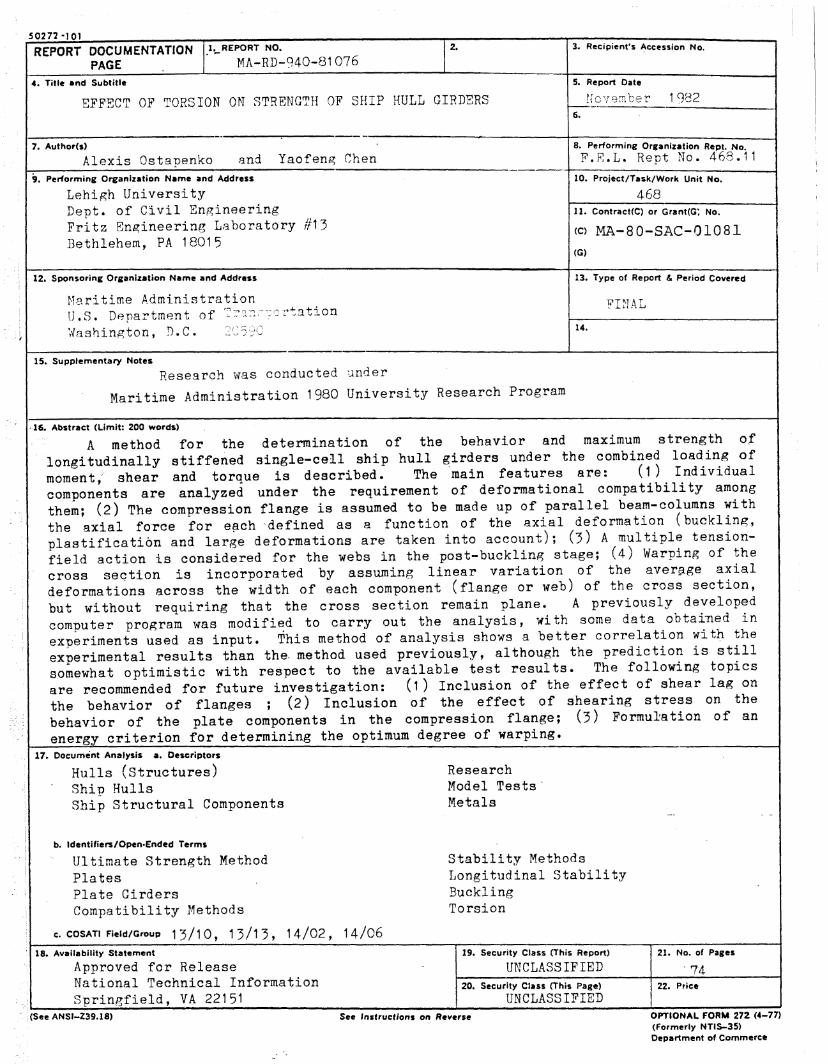
A method for the -determination of the behavior and maximum strength oflongitudinally stiffened single-cell ship hull girders under the combined loading ofmoment, shear and torque is described. The 'main features are: (1) Individualcomponents are analyzed under the requirement of deforma tional campa tibili ty amongthem; (2) The compression flange is assumed to be made up of parallel beam-columns withthe axial fo·rce for effch defined as a function of the axial deforma tion (buckling,plastificati6n and large deformations are taken into account); (3) A multiple tensionfield action is considered for the webs in the post-buckling stage; (4) Warping of thecross seqtion is incorporated by assuming linear variation of the averflge axialdeformations across the width of each component (flange or web) of the cross section,but wi thout requiring tha t the cross section remain plane. A previously developedcomputer program was modified to carry out the analysis, with some data obtained inexperiments used as input. This method of analysis shows a better correlation wit~ theexperimental results than the. method used previously, although the prediction is stillsomewhat optimistic with re~pect to the available test results. The following topicsare recommended for future investigation: (1) Inclusion of the effect of shear lag onthe behavior o.f flanges ; (2) Inclusion of the effect of shearing stress on thebehavior of the plate components in the compression flange; (3) Formul'ation of anenergy criterion for determining the optimum degree of warping.
Research was conducted under
Maritime Administration 1980 University Research Program
, 74.21. No. of Pages
22. Price
OPTIONAL FORM 272 (4-77)(Formerly NTIS-3S)Department of Commerce
19. Security Class (This Report)
UNCLASSIFIED20. Security Class (This Page)
UNCLASSIFIED
Researchr~odel Tests·Metals
Stability MethodsLongitudinal StabilityBucklingTorsion
See Instructions on Reverse
b. Identifiers/Open-Ended Terms
Ultimate Strength MethodPlatesPlate GirdersCompatibility Methods
c. COSATI Field/Group 13/10, 13/13, 14/02, 14/06
17. Document Analysis a .. Descriptors
Hulls (Structures)Ship HullsShip Structural Components
18. Availability Statement
Approved for ReleaseNational Technical InformationSpringfield, VA 22151
(See ANSI-Z39.18)
50272-101
REPORT DOCUMENTATION I.J~REPORT NO.
PAGE, MA-RD-940-81 0764. Title and Subtitle
EFFECT OF TORSION ON STRENGTH OF SHIP HULL GIRDERS
3. Recipient's ~ccession No.
5. Report Date
november 1982f..--.------.--- J6.
1-7-.-A-u-th-O-'(-.,-------------~-------~------------+-8-.-p-e-rf-Or-m-in-g-O-r-ga-n-iz-a-tio-n-R-e-p-t.-N-o-._--I
Alexis Ostapenko and Yaofeng Chen F.R.L. Rept No. 468.119. Performing Organization Name and Address
Lehigh UniversityDept. of Civil EngineeringFritz Engineering L~boratory #13Bethlehem, PA 18015
12. Sponsoring Organization Name and Address
Maritime AdministrationU.S. Department of ~~~.J.=:.,-~:<:;r-:ation
Washington, D.C. 2C~
15. SupPlementary Notes
Research was conducted ~nder
Maritime Administration 1980 University Research Program
-16. Abstract (Limit: 200 words)
10. Project/Task/Work Unit No.
46811. Contract(C) or Grant(G: No.
(C) MA-80-SAC-01081
(G)
13. Type of Report & Period Covered
FI~IAL
14.
A method for the ·determination of the behavior and maximum strength oflongitudinally stiffened single-cell ship hull girders under the combined loading ofmoment, shear and torque is described. The main features are: (1) Individualcomponents are analyzed under the requirement of deformational compatibili ty amongthem; (2) The compression flange is assumed to be made up of parallel beam-columns withthe axial fo·rce for efich "defined as a function of the axial deforma tion (buckling,plastificati6n and large de~rmationsare taken into account); (3) A multiple tensionfield action is considered for the webs in the post-buckling stage; (4) Warping of thecross seqtion is incorporated by assuming linear variation of the averf3.ge axialdeformations across the width of each component (flange or web) of the cross section,but wi thout requiring that the cross section remain plane. A previously developedcomputer program was modified to carry out the analysis, with some data obtained inexperiments used as input. This method of analysis shows a better correlation with theexperimental results than the. method used previously, although the prediction is stillsomewhat optimistic with re~pect to the available test results. The following topicsare recommended for future investigation: (1) Inclusion of the effect of shear lag onthe behavior o.f flanges ; (2) Inclusion of the effect of shearing stress on thebehavior of the plate components in the compression flange; (3) Formulation of anenergy criterion for determining the optimum degree of warping.
17. Document Analysis a. Descriptors
Hulls (structures)Ship HullsShip structural Components
b. Identifiers/Open·Ended Terms
Ultimate strength MethodPlatesPlate GirdersCompatibility Methods
c. COSATI Field/Group 13/10, 13/13, 14/02, 14/06, 18. Availability Statement
Approved for ReleaseNational Technical InformationSpringfield, VA 22151
Researchr~odel Tests'Metals
Stability MethodsLongitudinal StabilityBucklingTorsion
19. Security Class (This Report)
UNCLASSIFIED20. Security Class (This Page)
UNCLASSIFIED
21. No. of Pages
22. Price
. (See ANSI-Z39.18) See Instructions on Reverse OPTIONAL FORM 272 (4-77)(Formerly NTIS-3S)Department of Commerce
1. INTRODUCTION·
1.1 Background
In the conventional methods of ship design, the strength of a ship
hull is based on the linear elastic response of the hull components.
The section modulus plays an important role in computing the ship hull
bending strength. However, more often than not the strength of a ship
hull implied by the safety factor is not an accurate indicator of the
true ultimate strength. With the growing knowledge of wave loading
and the introduction 9£ novel ship types (large tankers, container and
special purpose ships), the need for a more realistic evaluation of
ship ultimate strength is becoming more important. .
Much research has been done on the ultimate strength of
individual ship hul·l components; plate (9, 11, 141, stiffened plate
and grillages (4, 6, 10, 20, 2~], and plate girders
~1, 2, '3, 8, 13, 15, 16, 21, 24, 261. Caldwell proposed a method of
considering the fully plastified cross section in computing the
bending moment, for which the post buckling plate strength would be
determined by using an effective width at the maximum plate capacity
[5J. In the method developed previously in the current research for
computing the ultimate strength of ship hull girder under moment,
shear and torque, the compression flange was treated as a series of
identical beam-columns having the same axial deformation. The
3

buckling and th~ post-buckling tension field action of the webs were
considered (17J. The method was found to be reasonably accurate for
moment and shear loading but Qver-optimistic for moment, shear and
torque. The method presented here represents a further development of
that method.
1.2 PurpQse and Soope
The main purpose of this research was to continue the development
of the. method fQr determining the ul timate strength of ship hull
girders under the general loading of bending moment, shear and torque.
Treatment of the individual components of the ship hull girder is the
same as in the previQus formulation. The ship hull girder is modeled
by a box girder stiffened both in the longitudinal and transverse
directions. A typical cross section is shown in Fig. 1 where the
transverse stiffeners represent transverse frames or bulkheads in the
ship hull and the lQngitudinal1y stiffened webs end flanges represent
the sides, the deck and the bQttom plating.
A fixed relationship between the cross-sectional farces (moment,
shear and torque) was assumed for the hull segment to exist at all
levels of loading. In analyzing the individual components of the ship
hull, the meth~ds derived in prior research were applied to determine
the behavior and the ultimate strength of ship bottom platin~ and side
4

plating. for the plating of the compression flange, a previously
developed computer program was adopted to obtain the axial load va.
average axial deformation relationship (22J. The following principal
improvements were made in the method of analysis of the hull girder:
(1) Inclusion of the effect of warping, by considering linearly
varying axial deformation across the wid th of the flanges; (2) An
equilibrium formulatian in which both, the axial force and the bending
moment about the vertical centroidal axis, should be equal to zero.
A test specimen from the ~revious research was analyzed by this
method and the oomputed Qutput was compared wi th the test resul ts.
The comparison indicates the direction for future research to more
accurately predict the behavior of ship hull girders.
5
2. THEORETICAL ANALYSIS
2.1 Elastic Analysis
2.1.1 IntrQduction
Althou~h elastic analysis is not applicable for computing the
ultimate and post-ultimate behavior, it is suitable for describing the
behavior of a hull girder under external loading up to the initiation
of non-linear effects due to buckling, yielding or second-order
deformations. Thus, linearly elastic analysis of a hull girder is
valid under the following conditions:
1. The material properties of all components are linearly elastic.
2. The member is st~aight and prismatic with the distortion of thecross section being negligible.
3- Residual stresses are small.
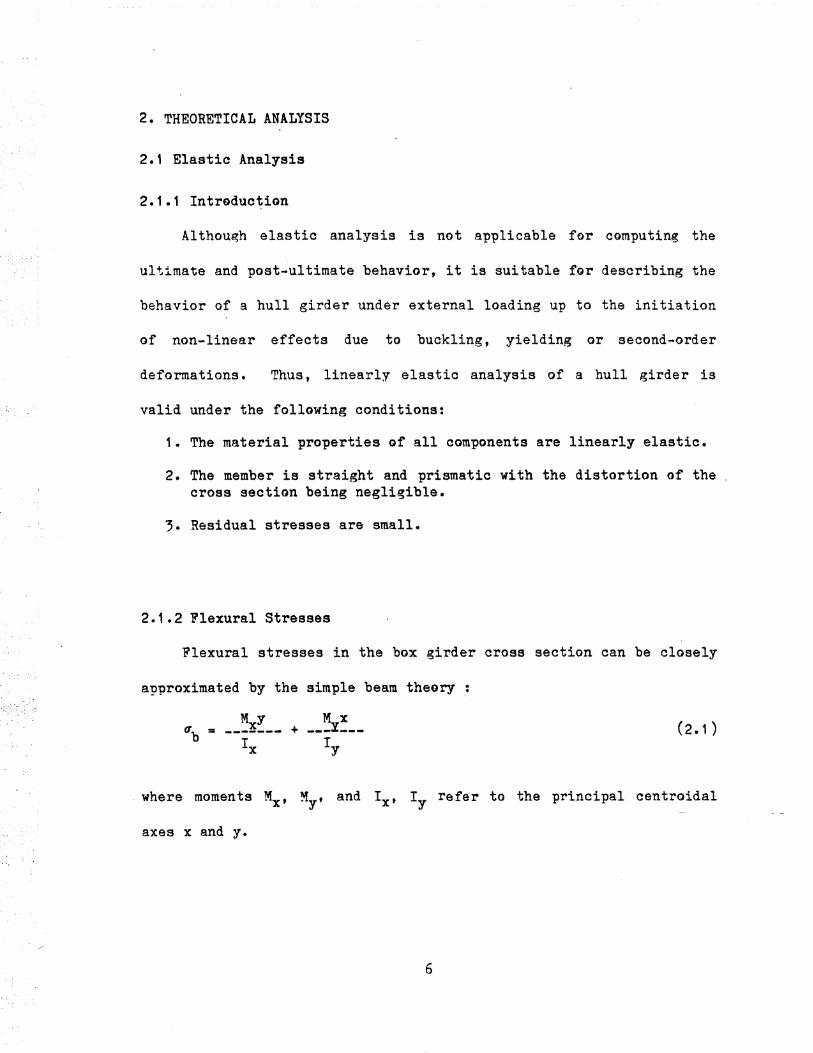
2.1.2 Flexural Stresses
Flexural stresses in the box girder cross section can be closely
ap~roximated by the simple beam theory :
M x+ I _
I y(2.1 )
where moments Mx ' M:y ' and Ix' I y refer to the principal centroidal
axes x and y.
6

2.1.3 Shearing S~resses
FGr single-cell thin-walled closed sections loaded in the plane
of symmetry the shearing stress is given by:
where t is the wall thickness, qapen is the shear flow for the open
section made by introducing an arbi trary cut in the closed section
(usually at the vertical axis of symmetry for a symmetrical section) '..
qQ is the additional shear flow in the plate required te maintain no
relative displacement between the two ed~es of' the cut.
homogeneous section, qo is given by:
f( Clo"pen/t )dsqo = ~d;7t)d;----
For a
where s is measured. from one end of the cut to the other C7 J. Note
that longitudinal stiffeners on the webs and flanges enter into the
computation of qopen' but only the plate components are involved in
the computation of ~(qopen/t)dt and J{ds/t)dS.
2.1.4 Tsrsional Stresses
Torsional moment is carried by the cross section in tWQ parts,
pure torsion (st. Venant torsion) and warping torsion
T = Tsv + Tw
7

For a general loading case, stresses caused by torque occur in
addition to the stresses caused by moment and shear. Uniform shear
stress results from the presence of pure torsion and is called St.
Venant torsional stress. Warping stresses occur in addition to the
St. Venant torsional stress in members of general cross section under
torsional loading. 'l1arping shear stress and warping normal stress
develop when the section is restrained from deplanation.
The differential equation for the deformation of a member
Bubjected to a concentrated torque is:
where G: shear modulus
E: modulus of elasticity
cP: angle of twist
z: the coordinate along the longitudinal axis
I w: warping moment of inertia
The solution for the angle of twist, expressed as a functiQn of
z, is
8
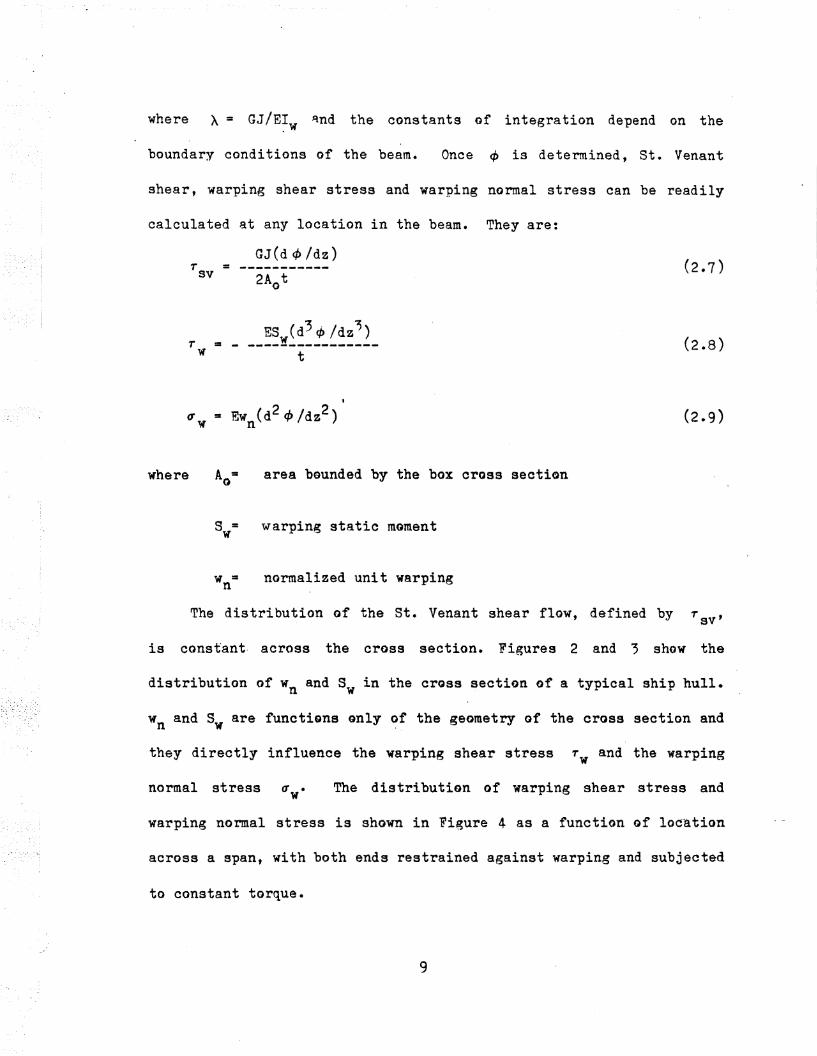
where X = GJ/E!w I\nd the constants of integration depend on the
boundary conditions of the beam. Once q, is determined, St. Venant
shear, warping shear stress and warping normal stress can be readily
calculated at any location in the beam. They are:
= ~-_ ...-------TSV
T ="II
GJ(dcP/dz)
where A =o area baunded by the box cross section
S = warping static momentw
w = normalized unit warpingn
The distribution of the st. Venant shear flow, defined by TSV
'
is constant· across the cross section. Figures 2 and '3 show the
distribution of wn and Sw in the cross section of a typical ship hull.
Wn and Sw are functions Qnly of the geometry of the cross section and
they directly influence the warping shear stress T W and the warping
normal stress iT •w The distribution of warping shear stress and
warping normal stress is shown in Figure 4 as a function of location
across a span, with both ends restrained against warping and subjected
to constant torque.
9

In an actual structure, there is neither free nor fully
restrained condition against warping, but the structures are
restrained partially. Thus, the actual distribution of stresses
caused by torque in a structure can be obtained only approximately,
the accuracy being dependent on the degree of torsional restraint at
the ends of the segment.
Figures 5 through 7 show the shearing stresses at the mid-length
of a typical box girder with lQngitudinal stiffeners, when the ends
are fully restrained against deplanation under the combined effects of
moment, shear and torque. Figures 8 through 10 show the normal stress
distributions in the same box girder at a cross section near the end.
2.2 NeD-Linear Behavi.r
With the assQ~ptions sta~ed in Art. 2.1.1, a ship hull girder has
linearly elastic behavior only until a. component buckles or starts
non-linear behavior.
cannot be applied.
After this, the principle of superposition
In the proposed method of analysis the following analytical
-_.
assumptions were used for individual components of the box girder:
1. The effect of shear on the behavior of the compression flange isnegligible.
2. Shear stress distribution is uniform in the individual web
10

subpanels.
3. After a web subpanel has buckled, it can no longer carry anyadditional normal stress.
The behavior of the hull girder is analyzed by considering the
behavior of individual components and enforcing compatibility at the
junctions between respective components. The compression flange is
under axial loading wi th or wi thout the presence. of lateral load.
Non-linearity of the compression flange arises from its
non-symmetrical nature; the longitudinal stiffeners are located on one
side of the compression flange. The behavior of the compression
flange can be modeled by parallel beam-columns hinged or fixed at the
transverses. In so doing, the large deformations and strain reversal
that take place in the compression flange can be taken into account.
In reality, there c.an either be lateral loading or no lateral load
acting on the compression flange, depending on whet~er the ship deck
plating or bottom plating is analyzed. At the present stage the
compression flange is assumed to have no lateral load
For the hull girder webs, shear and bending stresses can be
greatly reduced and a stress redistribution takes place. The
computed by simple beam theory as long as the web plate is flat and
capacity of the buckled subpanal to carry additional norma~ stress is
After buckling, thethere are no significant residual stresses.
11
/
additional normal stress caused by bending moment is then carried by
the flanges and the yet unbuckled subpanels. However, the buckled web
subpanel can still carry additional shear by the tension-field action.
The web subpenal is assumed not to carry any more loading when the
shear deformation reaches the point where the diagonal fiber in the
subpenal yields.
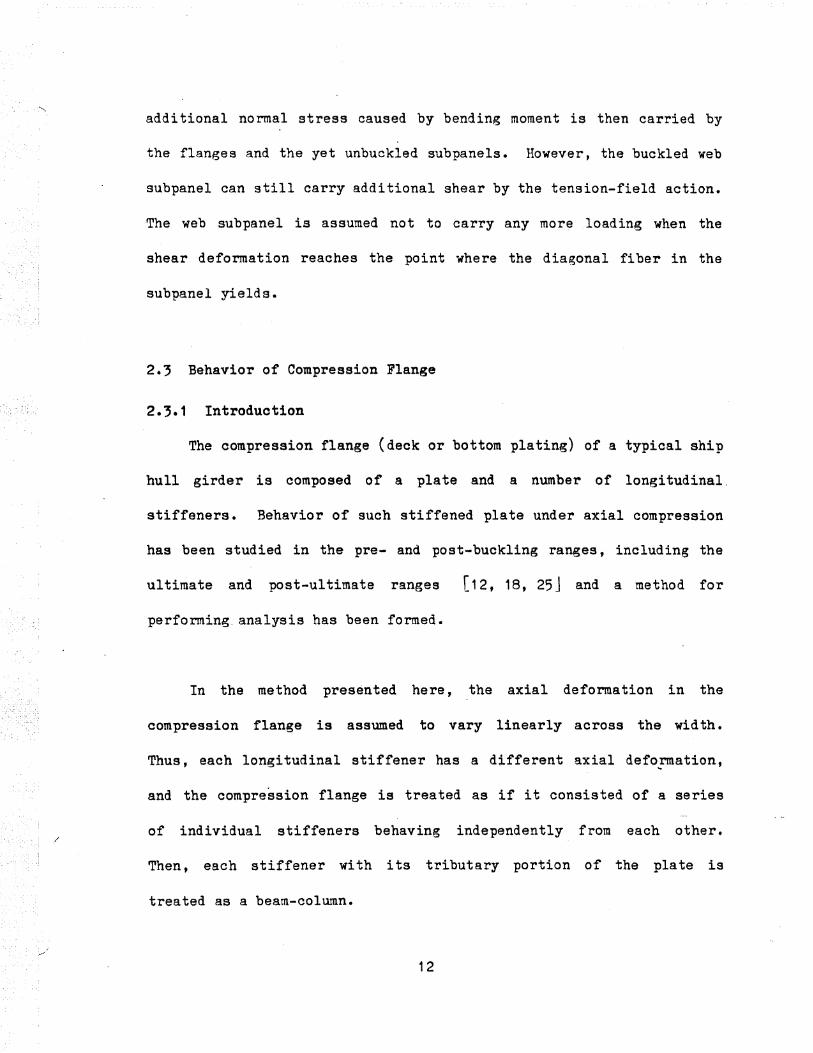
2.3 Behavior of Compression Flange
2.'.1 Introduction
The compression flange (deck or bottom plating) of a typical ship
hull girder is composed of a plate and a number of longitudinal,
stiffeners. Behavior of such stiffened plate under axial compression
has been studied in the pre- and post-buckling ranges, including the
ultimate and post-ultimate ranges [12, 18, 25J and a method for
performing. analysis has been formed.
In the method presented here, the axial deformation in the
compression flange is assumed to vary linearly across the wid th.
Thus, each longitudinal stiffener has a different axial defo:mation,
and the compression flange is treated as if it consisted of a series
of individual stiffeners behaving independently from each other.
Then, each stiffener wi th its tributary portion of the pIate is
treated as a beam-column.
12
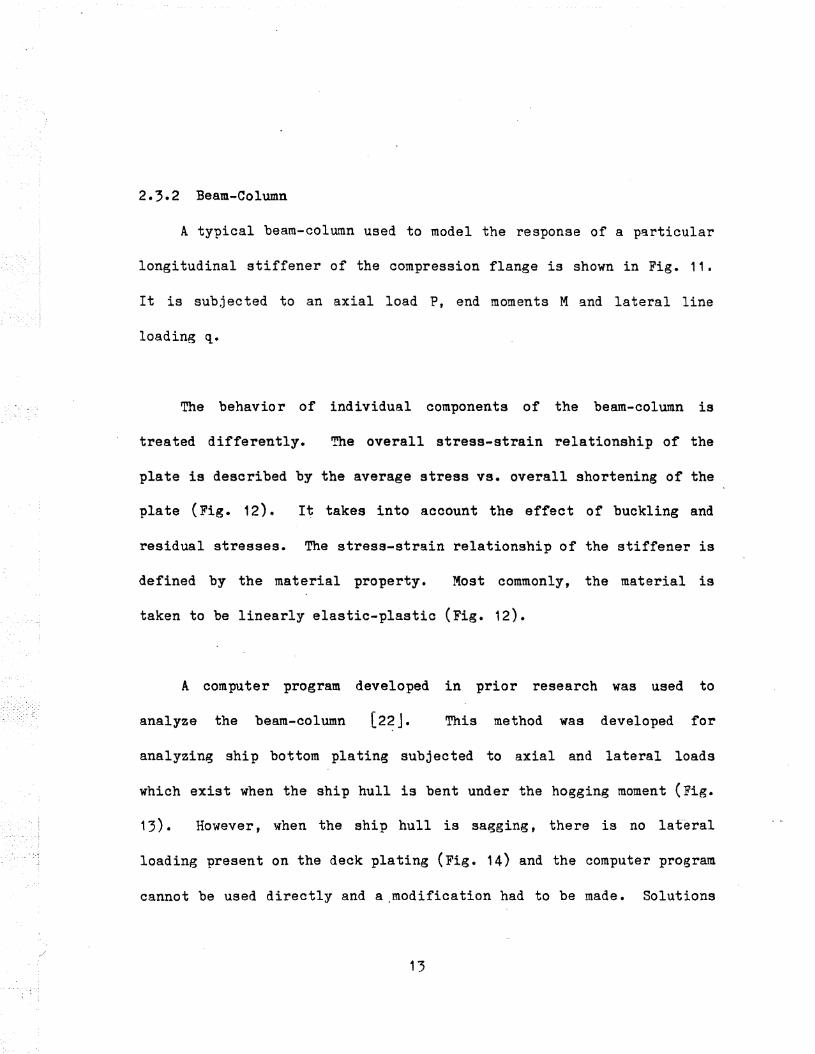
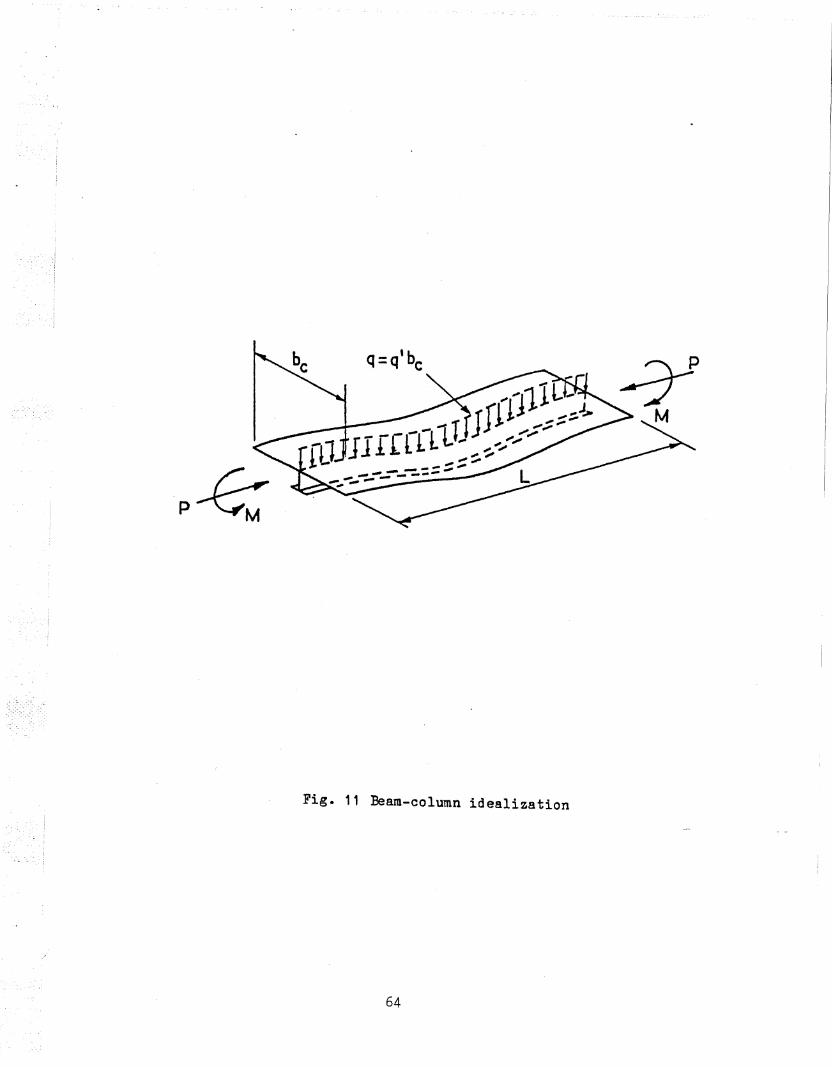
2.3.2 Beam-Column
A typical beam-col~~n used to model the response of a particular
longitudinal stiffener of the compression flange is shown in Fig. 11.
It is sub,jected to an axial load P, end moments M 9.nd lateral line
loading q.
The behavior of individual components of the beam-column is
treated differently. The overall stress-strain relationship of the
plate is described by the average stress VB. overall shortening of the
plate (Fig. 12). It takes into account the effect of buckling and
residual stresses. The stress-strain relationship of the stiffener is
defined by the material property. Most commonly, the material is
taken to be linearly elastic-plastic (Fig. 12).
A computer program developed in prior research was used to
analyze the beam-column [22J. This method was developed for
analyzing ship bottom plating subjected to axial and lateral loads
which exist when the ship hull is bent under the hogging moment (Fig.
13) • However, when the ship hull is sagging, there is no lat~eral
loading present on the deck plating (Fig. 14) and the computer program
cannot be used directly and a ,modification had to be made. Solutions
13
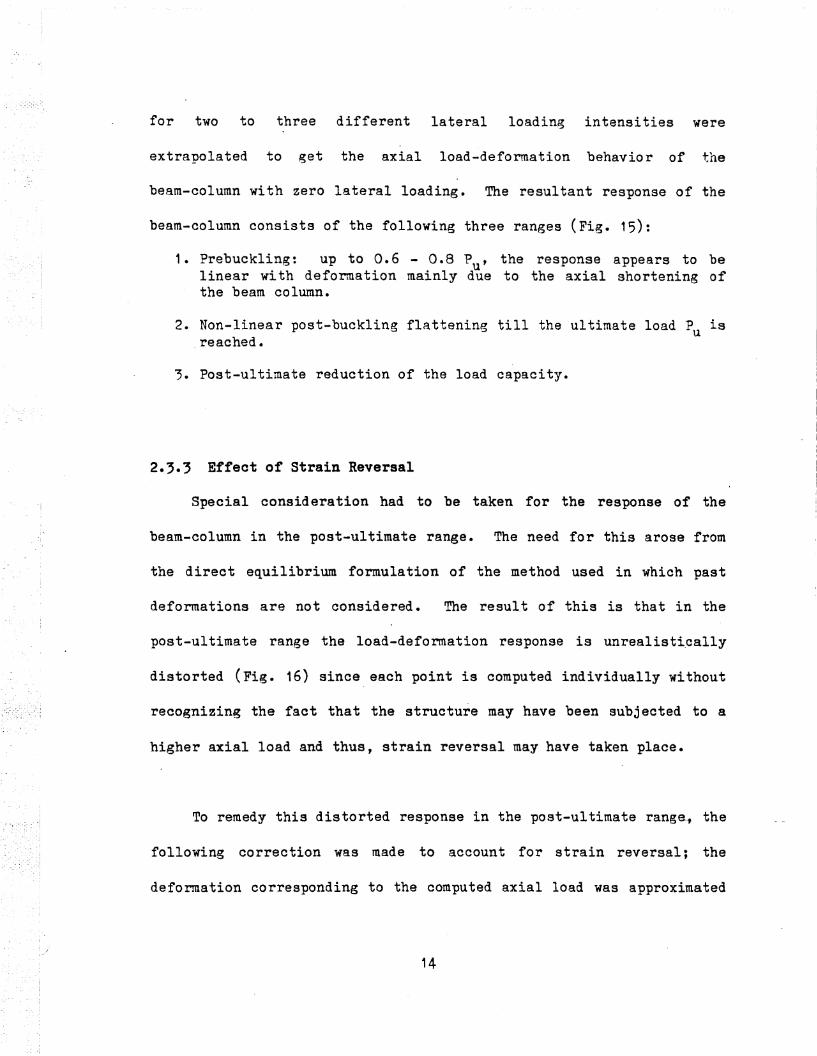
for two to three different lateral loading intensities were
extrapolated to get the axial load-deformation behavior of the
beam-column with zero lateral loading. The resultant response of the
beam-column consists of the following three ranges (Fig. 15):
1. Prebuckling: up to 0.6 - 0.8 Pu ' the response appears to belinear with deformation mainly due to the axial shortening ofthe beam column.
2. Non-linear post-buckling flattening till the ultimate load Pu is,reached.
,. Post-ultimate reduction of the load capacity.
2.3.3 Effect of Strain Reversal
Special consideration had to be taken for the response of the
beam-column in the post-ultimate range. The need for this arose from
the direct equilibrium formulation of the method used in which past
deformations are not considered. The resul.t of this is that in the
post-ultimate range the load-deformation response is unrealisti.cally
distorted (Fig. 16) since each point is computed individually without
recognizing the fact that the structure may have been subjected to a
higher axial load and thus, strain reversal may have taken place.
To remedy this distorted response in the post-ultimate range~ the
following correction was made to account for strain reversal; the
deformation corresponding to the computed axial load was approximated
14
by assuming;
~ -' ~pu + A c
where .:1 pu is the axial shortening at the ultimate load Pu • The
curvature shortening ~c is kept the same. The behavior computed this
way showed reasonable agreement with some test data. A more detailed
description of this effect can be found in Ref. [17J.
2.4 stresses in Web
2.4.1 Prebuckling and Buckling Behavior
For closed box sections under moment, shear and torque, the
stresses in the webs are the superimposed effects of moment, shear and
torque. Figures 7 and 10 show the normal and shearing stress
distributions. The buckling of the web plate or of the web subpenal
occurs when the bending, shearing and normal stresses satisfy the
following interaction expression:
O"bcri 2' ,C1ccri+ (-------) +(-------) = 1.0
Fbcri Fecri
Fccri are the buckling stresses of a plate panel under shearing,
is the cOffipression stress existing in the subpanel, and Fvcri ' Fbcri
The formulas
(1 •corl.
compression or bending stresses, each acting alone.
where Teri is the shear stress, abcri is the bending stress and
15
defining these c~itical buckling stresses are listed in Table 1. The
plate p~nels are conservatively assumed to be simply supported at all
four ed.ges.
2.4.2 Post-Buckling Behavior
In the post-buckling range, the strength of an individual web
subpanel was assumed to develop independently from other subpanels.
Thus, the shear force in a web is the sum of the shear capacities of
the individual subpanels.
Vweb = }; Vsubpanels
The subpanels can either be in the elastic, buckling or post-buckling
state depending on the stress level. After a 8ubpanel has buckled,
the normal stress in it is assumed to remain constant and therefore
not to contribute to the moment carrying capacity of the box section.
The addi tional shear capacity is computed according to the
tension-field action C1, 2, 15, 19J. -The ultimate shear strength of
the i-th web subpanel is then the sum of the shear stress at buckling
and the tension field action
.:..,/
T • =U~
where
Tcri + Ttfi
and are the ultimate
16
shear strength and the

tension-field action contributions to shear in the i-th subpanel,
respectively. The ultimate shear deformation of the i-th subpanel is
assumed to be reached when the diagonal fiber reaches the yield
strain l151. Thus,
F 1r . = -_Y- (a. + ----)
U1. E 1. a .1.
where rui is the ultimate shearing strain, and
a. =1.
a
d.1.
is the aspect ratio of the given 8ubpanel.
17
To simplify the problem, the shear stress-strain relation between.
stress-strain relationship, one has to keep in mind that,
With the assumed shear
1. After buckling of the subpanel the normal stress in a subpanelremains at the buckling stress level, and any additional normalstresses from the inc~ease in the external load must bedistributed to the yet unbuckled subpanels , longitudinalstiffeners and the flanges.
2. After the ultimate shear strain in a subpanel has been reached,the shear stress remains constant as the shear strain increases.
3. When the width-thickness ratio of a particular web subpanel issufficiently small, the subpanel will yield rather than buckle.The maximum octahedral shearing stress yield criterion (VonMises) was used to check the yielding condition.
zero, buckling and ultimate stresses.
assumed to be a straight line. As a result, the shear stress-strain
relationship for eaqh subpan~l is tri-linear defined by the points at
the buckling and ul timate levels of stress for each subpenel is
where T. and· ~ 1res"'Pect~ve y.
O"ci are the shearing and normal stresses
Since the shearing stresses in the two webs are different when
the box section is subjected to torque in addi tion to shear and
bending, the sequence of buckling for the web subpanels has to be
followed separately in each web.
18
3. EFFECT OF WARPING
3.1 Introduction
'-Then a simply supported beam is subjected only to moment and
shear, normal stresses in the linearly elastic range can be computed
by using Eq. (2.1). However, for a general case, when the torque is
also apTJlied, the addi tional torsional stresses must be considered.
~hese stresses are produced by both, the uniform (St. Venant) and the
non-uniform (Warping) torsional actions as discussed in Article 2.1.
The normal stress caused by the bending moment is uniform in the
top and bottom flanges of the cross section, whereas torsional actions,
produce a self-equilibrated and varying normal stress distribution in
the cross section. The fact that one is uniform and the other varying
provides clues as to whether warping was playing a significant role
before any buckling occurs. An '3.nalysis was performed on the test
segment of the specimen to see if the effect of warping was
significant even at small levels of Id~ding~
3.2 Elastic Analysis of Warping
Warping torsion results in normal and shear stresses, and their
distributions are similar to those shown in Figs. 2 and 3 for a hull
girder cross section as can be seen from Eq. (2.8) and Eq. (2.9).
W~rping stresses also vary along the segment depending on the
19

restraint to warping deformations at the ends~. Figure 4 shows the
distribution of warping normal and shear stresses along a prismatic
beam wi th the warping restrained at the ends. The final state of
stress in the box girder is the superimposed effect of the flexural
and warping stresses typified by a cross section of the test segment
as shown in Figures 7 and 10.
An elastic analysis was performed on the test segment with
various extreme boundary conditiona assumed to exist at the ends.
This was necessary since, for testing one particular segment, the ~
other two segments were reinforced with temporary stiffeners and thus
provided some unknown amount of restraint. Also, the end portions of
the specimen were composed of thicker plates than in the test segments
(Art. 6. 1) • The two extreme condi tiona assumed were: both ends
prevented from warping (torsionally fixed) or one end restrained and
the other end free to warp (torsionally simply supported).
In the case where the ends were restrained against warping at the
transverse stiffeners, the distribution of warping normal stress was
such that there were large normal stresses at the ends and zero
warping normal stress at the mid-length of the segment (Fig. 4). __.
The other case of the boundary condition was for one end of the
20
test segment, ~here there were reinforcements attached to the
transverse stiffeners to strengthen the already tested segment, to be
strong enough to keep the end from deplanation, and for the other end,
where only the plate thickness of the segment changed, free warping
was allowed. This lead to the maximum warping normal stress at the
mid-length of Test 3 of only 3.0 x 10⁻⁵ of the magnitude of the normal
stress caused by the bending moment. An analysis of the same boundary
conditions (one end fixed and the other end free) for the same test
set-up wi th the fixed end being at the location of the transverse
frame where the transverse load acted and the free end being one of
the support of the test specimen where the two X-rollers were located
(Fig. 19), gave even lower warping normal stress (10-9 of the amount
of flexural normal stress). All these assumed boundary condi tiona
seem to indicate that there would be negligible normal warping
stresses at the mid-length of the test segment. However, this does
not explain the observed strain distribution in the test segment which
showed significant variation of the normal stresses across ·the width
of the flanges. This behavior indicates that some other explanation
'.;0/
of the varia.tion of normal str~sses in the flange is needed for a
section under torsion, than warping.
Possible explanations are as follows:
1. The distortion of the cross section as the load applied mighthave been large enough so that the bending moment was acting on
21

a cross section other than the doubly symetrical which wasassumed. As a resul t, the normal stress under bending was nolonger uniform in the flanges.
2. The initial deformation of the plate panels might have been suchthat nonlinear inelastic behavior had already occurred duringthe early stages of loading so that elastic behavior wasprecluded.
Both these effects can be eliminated or minimized by using a
larger test specimen.
22

4. DESCRIPTION OF THE METHOD OF ANALYSIS
In the earlier research on the strength of ship hull girders, a
computer program was developed which used two strains as variables to
define the state of stress in the hull girder cross section. Under
the assumption that "a plane section remains plane", the condition of
equilibrium for the axial force was sufficient to determine the strain
in the tension flange for a particular value of the strain in the
com~ression flange. In other words, a uniform strain distribution was
assumed to exist in the compression and tension flanges. A comparison
of the computed results with the results of the tests showed that the
computer program could qUite accurately predict the ultimate strength
of a hull girder subjected to moment and shear. However, for the
,/
case of moment, shear and torque acting simultaneously, predictions of
the ultimate strength were over-estimating the observed results by as
much as 70~ L17].
It was found that, under the loading of moment, shear and torque,
the observed strain distribution was not uniform but had significant
and non-planar variation over the box cross section. This indicated
that warping took place when torque was applied.
In order to accommodate the deplanation of the cross section into
the computer programs, the varia tion of strains between the four
23

~orners had to be considered. As a starting point, linearly varying
deformations across the width of the individual cO~¥0ne..-TJ.tl8 of the cross
section were assumed. This line of approach created an immediate
difficulty since the number of variables changed from two (one strain
in the compression flange and one in the tension flange) to four (the
strains at the four corners). Yet, there were only two conditions,
viz, resultant axial force and the bending moment about the vertical
axis of the cross sec~ion to be equal to zero. It was thus necessary
to make the following modification to the computer program.
In the equilibrium formulation, the strain readings taken in the
test at two corners of the cross section are used as additional input
into the computer program in order to compensate for the lack of
equilibrium condi tions. Then, by enforcing the axial force and the
bending moment about vertical centroidal axis to be equal to zero
through an iterative process, the other two corner strains are
. computed. The load parameter corresponding to the computed corner
strains can be compared wi th the test load and to other resul ts
obtained in the test.
As a result of the assumption that there is a linearly varying
strain distribution across the width of individual components, the
formulation of the computer program underwent two major changes.
24

(1) Instead of treating the compression flange as a set of identical
beam-columns having the same axial deformation as was assumed in the
treated as if i"t were composed of identical beam-columns each wi th a
different deformation according to the linearly varyin~ strain. Then,
the respective axial force in each beam-column is determined from the
load-deflection relationship.
uniform strain distribution approach, the compression flange is
(2) In the uniform strain distribution appro~ch, buckling of the
corresponding web subpanels occurred in both webs at the same time.
'fuereas this is true for the loading condition of moment and shear
only, the analysis is seriously in error for the case of moment, shear
and torque when one web is loaded more heavily in shear than the other
(Fig. 6). This effect is taken into account in the present approach
by checking the buckling of each web subpanel independently as the
deformation in each subpanel increases.
Since in this method two strains are used as input, there is no
guaranty that the computed ~ (and the load parameter W) corresponds
to the true solution of th~ problem. Actually, the method gives an
upper bound solution,. that is, the computed 1\ (or W) should be
greater or, at best, equal to the actual moment Mx.
25

The scope o~ the present study has been mainly concerned with the
development of the many computational procedures needed in the
programming of the method and, thus, the approach was not checked for
a general case, but only for the specimens tested in the previous
phase of this research program.
26
5- COMPUTER PROGRAMS
5.1 Introduction
Two computer programs were used for analyzing the behavior and
ultimate strength of ship hull girders. The first program. developed
in previous years. was used to generate the axial load-deformation
response of longitudinally stiffened panels with fixed or simply
supported end conditions. Two to three axial load-deformation
relationships under different lateral loading were first produced and
then e~trapolated to the condition of zero lateral load.
The extrapolated axial load-deformation response modelled the
behavior of the compression flange of the box girder in the second
computer program which was used to analyze the load deformation
response of a typical ship hull girder segment subjected to a
simultaneous action of moment, shear and torque. The values of
moment. shear and torque were assumed to remain in the same ratio to
each other and thus. for convenience, were related to each other
through a load parameter equivalent to a concentrated load acting on a
simply supported beam. This load parameter is, for brevity, referred
to as the load in this presentation. The output was an array of load
(load parameter)values versus the average axial deformation values of
the compression flange.
27
Present effort was mainly concerned with the development of the
box girder program; the mergin~ of the two programs into one is
recommended for future work.
5.2 Computer Program for Stiffened Plate
5.2.1 Brief Description
An already developed computer program for analyzing the
load vs. deformation response of stiffened' panels was used L22J.
However, some modifications had to be made in order to use it in the
present study.
One of the modifications involved the programming of the
extrapolation of the output of two or three runs for different small
values of lateral lqading to the desired output corresponding to zero
lateral load. This extrapolation was needed for the case where the
compression flange of the box girder represented the deck plating and
had no lateral loading. The number of ,runs used depended on whether
linear or parabolic extrapolation was desired.
Detailed development of the original computer program is
described elsewhere l10, 22]. The important features of it include
the following.
1. The beam-column is composed of a plate and longitudinal
28-
stiffener. The stiffener may be with or without a flange.
2. While an average stress vs. overall strain relationship wasassQ~ed for the plate component, the longitudinal stiffener weband flange were assQ~ed to have a linearly elastic-plasticmaterial properties (Fig. 12) • The web and flange of thestiffener may have different yield stress values.
3. The effect of residual stresses in the plate can be included.
4. The ends of the beam-column can be fixed or si~ply-supported.
5.2.2 Extrapolation
The output obtained from the stiffened panel computer program was
an array of axial loads and deformations for a certain non-zero
lateral load. In order to model the response of the compression.
flange of the box girder when there was no lateral loading, the
behavior of the stiffener panel for some two or three small lateral
load values was extrapolated to the case of zero lateral load.
Normally, two to three axial load-deformation arrays associated
with lateral loading values between q = 0.03 to 0.15 produced good
extrapolated results.
ii = --~-i-o
where q: lateral loading per unit length of beam cO~.umn
r: radius of gyration of cross section
29
u: buckling stresso
A: area of cross section of beam-column
The resultant load-deformation relationship is in the following
fo rm ( Fig. 15 ) :
P-1'--y
Where ~ is the axial deformation of the beam-column.
The computational process of extrapolation involved first
selecting the array that had the minimum post-ultimate axial
deformation. The curve length of the selected array was determined
from the linear distances between one data point to 13Xt. Based
on this curve length, a set of new points with equal linear distance
were established on the curve. The number of these points defined the
number of. the desired extrapolation data points and their abscissae.
Wi th the abscissa of a desired data point known, seven data points
from one of the input data arrays were chosen around the neighborhood
of the point to be extrapolated, and a cubic curve fitting performed
-to determine its ordinate.
Following this same procedure for the second and the third array
around the selected abscissa value , either a linear or a parabolic
30

extrapolation was used to find the ordinate, which was the axial force
corresponding to a zero lateral loading. This extrapolation was
perfonned point by point until every axial force data point in the
extrapolated array was calculated.
The adoption of curve fi tting through seven points instead of
interpolating between the data points was necessary because the data
points computed by the stiffened plate computer program had a certain
degree of approximation and, thus, did not result in a smooth curve
passing through them. In consequence, when extrapolation was
performed through the points interpolated between two neighboring
computed points, the extrapolated points (for zero lateral loadng)
exhibi ted a ver'y erratic' pattern. Some such points even fell below all
the data points used for extrapolation, although they were expected to
be above. The use of the seven-point curve fi tting produced a
reasonably smooth extrapolated curve which was very close to. the
results obtained previously by manual extrapolation L17J.
5.' Box Girder Computer Program
·5.3.1 Background and Assumptions
The box 6irder c,omputer program performs the analyses of a
typical segment of ship hull girder bounded by two transverse
stiffener rings. The segment is of a single-cell box shape composed
31
of plating and longitudinal stiffeners in the flanges and webs. The
input to the computer program includes the hull girder geometry," the
response of the stiffened panel under compression as obtained from the
stress-strain relationships of the web plate, web stiffeners and the
torque in terms of their relationship to the load parameter, and the
computer program described above (Art. 5.2), the moment, shear and
The principal output consists of an array of thetension flange.
concurrent values of the load parameter and of the deformation defined
by the average of the axial strains at the two edges of the
compression flange. Supplementary optional output gives a detailed
picture of the stress and deformation conditions for each load value.
In the method used in the preceding research, it was assumed that
"a plane section remains plane" wi th the consequence that the axial
deformation in the flanges was uniform and only two deformation
parameters (top and bottom corner strains) were used as variables. In
the present program, three deformational parameters are involved, as
described in Chapter 4. Among the basic assumptions used in the new
computer program are the following:
1. The box girder segment is straight and prismatic, the crosssection is single-cell and symmetric about the vertical axis.
2. Effect of shear lag is neglected.
3. Variation of the axial deformation between the four corners islinear.
32

4. Warping shear is ne~ligible.
5. There are no gross residual stresses in the box girder section,and the effect of residua.l stresses on the behavior of thecompression flange is incorporated into the axial load vs.deformation relationship obtained by a separate computerprogram.
6. After a web subpanal has buckled, the normal stress is assumedto remain constant at the buckling level.
5.3.2 Computational Procedure
The program calculates the load parameter for successive input
values of edge strains. The deformation input consists of the edge
strains at the two corners of the box girder segment, E 1 and E 4 as
obtained from Test 3 (fig.21). The strain at the other two corners is
interpolated by enforcing equilibrium of the cross section with
respect to the axial load and the bending moment about the vertical
centroidal axis, both of which are zero in this case.
After the equilibrium of the cross section is achieved, the
moment about the horizon tal centroidal axis is calcula ted. This
moment gives the load parameter Wand the corresponding shear and
torque from the following moment(M), shear(V), torque(T) and load
parameter(W) relationships,
M = C1 W
V = C2 W
33
T = C, 'vi
The shear stresses, which include the effects of flexural shear and
St. Venant torsional shear, are distributed to the web subpanels. The
in~eraction of the bending stress, normal stress and shear stress is
then checked for each subpanal to see if they have made the subpenel
buckle. If no new subpanels have buckled t the calculated COrller
strains and the load parameter represent one state of response for the
hull girder under given loading. If one of the subpanels has buckled,
the overall strain is decreased and several cycles of iteration are
performed to get the theoretical buckling state before the next set of
corner strains is input. After a particular subpene! buckles, i ts
normal stress is kept at the value of buckling. The web subpanal can
continue to carry addi tional shear stress by means of the
tension-field action. Repeated strain input produces an array giving
the load response of the hull girder from zero load to the ultimate
and through the post-ultimate range.
In addi tion to checking buckling interaction due to bending,
normal and shearing stresses, the stress condition was checked against
von Mises yield criterion. In the post-ultimate range where the load
was decreasing wi th an increasing strain input, the corresponding
decrease in shear was assumed to be linearly elastic.
34

6. DESCRIPTION OF HULL GIRDER TESTS
6.1 Test Specimen
To check the soundness of the assumptions made in the analytical
method t a test specimen was fabricated and three tests ~onducted.
Figure 17 shows the test specimen and the location of the test
segments. In the first test, only moment and shear were applied while
torque was added in the second and third tests. The values of moment
shear ani torque are shown in terms of the load parameter.
Two of the tests (T1 - bending and shear, and T2 - bending, shear
and torque) are described in Reference 1.17]. The third test (T3
moment, shear and torque) was conducted later and is briefly
introduced here. A summary of this test program is outlined below.
The specimen was design~d to model a portion of a typical ship
hull girder. Figure 18 shows two 'views and two sections of the· test
specimen. Its overall dimensions were: length- 2972mm (117in.) t
width- 667mm (26.25in.), and depth- 508mm (20in.). In the middle
yortion l1;72mm long (54in.)], the plate thickness was
1.85mm(O.073in.). The end portions were 686mm(27in.) and 914mm(36in.)
lon~t and the thickness of the flange plate was 6.35mm(1/4in.) and of
the web plate 3.18mm(1!Sin.)
35-

were two longitudinal stiffeners of the same size as on the flanges,
located at 168rnm(6.625in.) from the top and bottom flange plates.
Four transverse stiffeners 51~m(2in.) by 9.53mm(;/8in.) divided
the mid-portion of the test specimen into three equal segments
457mm(18in.) long. In the test segments, there were five longitudinal
stiffeners 3.18mm(1/4in.) by 20m.1l(O.781in.) spaced evenly on the
outside of the compression and tension flanges. On the webs, there
Althou~h in an actual ship hull structure, all stiffeners would
be all located on the inside, in the test. specimen, the stiffeners
were put on the outside. This was done in consideration of the ease
of inspection during fabrication and the convenience of observation of
the behavior of the stiffeners, flanges and webs during testing.
6.2 Test Setup
At one.end (left end in Fig. 19), the box girder section was
supported on two X-rollers , one roller under each web. The X-rollers
made it possible for the specimen to rotate only in the longitudinal
direction. At the other end of the specimen (right end in Fig. 19),
an X-Y roller was used so that the specimen could pivot and move in
both the longitudinal and transverse directions. This support
arrangement was designed to make the girder simply supported for
bending moment and shear and to carryall the torque in the portion
36

between the load point and the end supported on the two X-rollers
(left end).
The extern9.1 load was applied by means of a hydraulic jack
positioned between the transverse test frame and a spreader beam which
was supported on two plates welded to the two vertical transverse
stiffeners on the test specimen. Thus, the load was applied to the
test segment through the webs. Torque was introduced by positioning
the jack with the specified eccentricity with respect to the centroid
of the girder.
During the testing of a particular segment, the yet untested
segments were protected by reinforcement to prevent undue distortions.
The already failed test segments were reinforced in order not to
interfere with the testing of the next segment L17J.
6.3 Loading Conditions
For the three tests conducted, there was constant proportionality
between the external load applied at the hydraulic jack and the
moment, shear and torque at the mid-span of each test segment. The
moment and shear were simply the moment and shear at the mid-length of
the test segment ~ue to the load applied to the whole specimen simply
supported at the ends (Fig. 17). In Test 1, the load was applied
37

at the center of the transverse frame so that no torque was produced.
The torque in Test 2 and Test 3 was achieved by applying the jack with
some prescribed eccentricity.
Constants C1, C2 and C3 as defined in Eq.(S.3) through Eq.(S.S)
related the moment shear and torque to the load parameter. In this
case, the vertical load W applied to the specimen was used as the load
parameter. The theoritical ultimate load, the ultimate load as
recorded in the experiment, and their ratios for all the three tests
are listed as follows:
Constants and Ultimate Loads
Test
M/W = 01 [m]
V/W = C2
T/W = c3
[m]
Load Wu
Wtheo[kN]
W [kN]exp
WtheolWexp
0.562
0.615
o
306.9
266.9
1.15
2
0.616
0.385
0.194
280.2
164.6
1 .70
3
0.615
0.5 ~
0.200
276.9
192'.9
1.44
The ratios of the theori tical and experimental ul timate loads
show that the estimate was good when torque has not introduced (only
15% overestimate), but considerable difference occurred when torque
38
was-applied.
6.4 Analysis of Test 3
As an illustration of the application of the developed computer
program, it is used here to analyze Test 3. The corner strain
readings at the edges of the compression flange (at the mid-length of
the test segment) were used as input to the computer program (Fig.
21 ) •
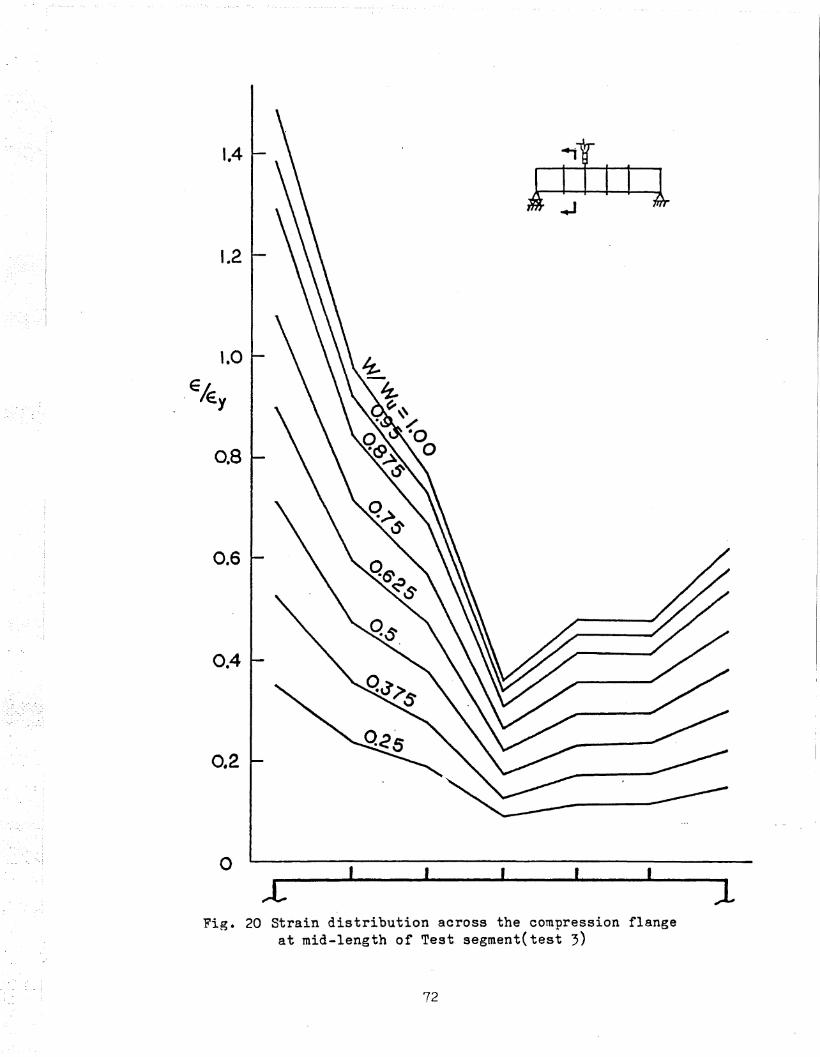
An examination of the strain distribution in the compression
flange of the test segment showed that there was a very large
variation (Fig. 20). If only the corner strains at the edges in the
compression flange were used and the large variation in-between
ignored, the resul ting axial force in the compression flange would
have appeared to be misleadingly larger than expected in reality.
In an attempt to compensate for -this variation of strains in the
test specimen, when only the corner strains had to be used in the
computer program, a linear fit of the strain readings in the
compression flange was performed to give an equivalent linearly
varying strain pattern. The relationship between the ratio of" the
reduced corner strains to those observed for the corresponding load
parameter appeared to be nearly constant (Fig. 21):
3.9
Ee 1 = o. 68 E 1
Ee2 = 0.38 E2
For a particular set of input strains, these two reduction
coefficients were applied to the edge strains in the compression
flange involved in the computation of forces. As for the other parts
of the cross section, they were still subjected to the same unreduced
strains. This approach gave the following results:
1. The computed E3 were almost twice as large as the E3 observed.
2. The computed E1 remained within 5% of the observed value for theloads up to the ultimate load. In the post-ultimate range, thecomputed f 1 showed a strain reversal that was contrary to thetest observation that the strain kept increasing in that range.
3. The computed ultimate load was 233.,kN(52.45kips) as compared tothe observed ultimate load of 177.9kN(40kips), which constitutedan 30~ over-estimate as compared to the 70% over-estimateobtained from the previous computer program.
The fact that the computed E; value was much larger than the
observed value can be partially explained by the following:
1. The strain gages measured only the strain on the plate surfacerather than the true average, thus, the accuracy of the strainreadings may be in question.
2. The fact that the compression flange deflected more at themid-portion than at the ends made the measured strain in thatpart less pronounced. Still, this could account only partly forthe unusually large variation of the observed strains (Fig. 20).Apparently, the effect of shear lag, which causes the same type
40

of strain distribution, should be considered to improve theaccuracy.
3. Distortion of the cross section, which was not accounted for inthe present analysis, could have affected the measured strainvalues.
4-1

7- SUMMARY, CONCLUSIONS AND RECOMMENDATIONS
7.1 Summary
A theoretical analysis was made of the behavior of ship hull
girder segments between two transverses. The main purpose was to
study t'he behavior in the pre- and post-ultimate ranges under the
combined loading of moment, shear and torque. The results predicted
by this analysis were compared to previously conducted test
observations to verify the assumptions of the proposed method.
The method adopted in the analysis consisted of considering the
behavior of the individual components comprising the ship hull girder
through continuous interaction among them from a zero load up to the
ultimate and post-ultimate stages of loading _ Compatibility was
maintained at the junctions between the components as the load
increased. The compression flange was modelled by parallel
beam-columns, each consisting of a longitudinal stiffener and the
tributary portion of the plate. Each beam-column was assumed to have
the axial deformation ,corresponding to a linear variation of the
strain across the wid th of the compression flange. Buckling and
post-buckling, plastification and residual stresses were all taken
into account. The webs were analyzed by considering the behavior of
individual web subpanels in the buckling, post-buckling and ultimate
ranges.
42
A previously developed computer program was considerably modified
in order to more pro.perly model the behavior of a ship hull girder
under combined loading.
following:
The principal modifications were the
1. The effect of warping of the ship hull cross section wasconsidered by assuming a linearly varying strain distributionbetween the junctions of the flanges and the webs. This feature
. was included as a reaul t of the observations in the previousl';i'conducted tests that under combined loa.ding there wassignificant warping of the cross section.
2. In the modelling of the behavior of the ship hull girder webs,the fact that the individual web subpanels buckle at differentstages of loading ~was recognized. Buckling of the web subpanelscould develop independently of each other.
The procedure of the method in the oomputer program relied on inputing
two corner strains. For expediency, the strains obtained from a test'
were u'sed. Using an average strain value in the compression flange,
the two cOMputed corner strains, together wi th the computed load
parameter consti tuted the reaul ts for comparison wi th the observed
results.
This comparison of the analytica·l and experimental reaul ts for
Test 3 showed that:
1. Predicted E1 strain values (Fi~. 21) follow closely the obtainedstrain up to the ultimate stage.
2. Predicted E, values ''Tere as much as twice of the values--- fromtest obsdrvation.
3. Computed ul timate strength of the test segment was 30% higherthan the observed value.
43

7.2 ·Conclusions
Results of the three tests conducted shows that for the loading
case of moment and shear, the prediction by the analytical method
comes close to the experimental resul ts but was optimistic (an 15%
over-estimate) • In the tests where torque was involved (Test 2 and
Test ,), the method utilized needs refining as it showed as much as
70~~over-estimate.
Considering that essentially arbitrary corner strains have to be
input in the present method to participate in the iteration to reach
equilibrium, there might be the same external load computed when
inputting another Bet of corner strains. This leads to the conclusion
that the calculated external load would be always larger than the
value obtained from a test and at best equal to it, i.e., the strains
produced by the external loadings in the experiment will always give
the lower bound of the potential energy provided by the particular
boundary conditiona in the test. Any other set of corner strains
producing the same external loading will have a potential energy
larger than that.
44

7.3 Recommendat~ons
The following recom~endations with regard to future research are
made:
1. Establishment of an energy criterion is needed to determine theminimum potential energy in the hull girder segment undervarious combinations of corner strain sets. This criterion willeliminate the present need of inputting two strains to computethe external load parameter.
2. Consideration of one web gradually becoming weaker as theexternal load increases to the point that the cross section, in~ffectt becomes an open section (relocation of the shearcenter).
3. Incorporation of the effect of shear on the behavior of thecompression flange plate subpanels.
4. Incorporation of the effect of shear lag into the behavior ofindividual plate components.
5. Tests on larger specimens so that the effect of geometricimperfections could be minimized.
45
8. NOMENCLATURE
A
Ao
C.1
E
F .CCrl
J
M
Mx,My
p
T
v
q
Area of cross section of the beRm-column
Area bounded by the walls of the box cross section
Integration const8nts for Eq.(2.6)Loading constants for Eqs.(5.3), (5.4), and (5.5)
Modulus of elasticity
Buckling stress of a plat~ under bending alone
Buckling stress of a plate under comnression alone
Buckling stress of a plate under shearing alone
Yield stress
Shear modulus
Warping moment of inertia
Moments of inertia with respect to axes x and y
Torsional section constant
Bending moment with respect to centroidal axes x and y
Axial force
Ultimate axial force
Axial force which causes full yielding of cross section
Warping static moment
Torsional moment
Torsional moment due to St. Venant torsion
Torsional moment due to warping torsion
Shear force
Lateral load per unit length of be~m-colurnn
Shear flow required to maintain compatibility of a closed thin
46

468.11
r
r ·Ul
s
t
X,Y,Z
~i
~bcri
C)ccri
~ri
walled cross section .
Shear flow in an open thin walled cross section
Radius of gyration of cross section
Ultimate shear strain of the i-th subpanel
Coordinate along the wall of open cross section
Wall thickness of cross section
Normalized unit warping
Coordinate axes
Axial shortening of beam-column
Axial shortening of beam-column due to curvature
Axial shortening of beam-column due to ultimate load Pu
Aspect ratio of the i-th web 8ubpanel
Edge strain at corner i
Reduced edge strain at corner i
Yield strain =F IEy
Torsional constant ratio (GJ/EIw)
Flexural stress
Bending stress in i-th 8ubpanel at buckling
Compression stress in i-th subpanel at buckling
Normal stress in the i-th subpanel at buckling
Column buckling stress
Normal stress due to warping
Shear stress due to transverse shear force on closed section
Shear stress in the i-th subpanel at buckling
Shear stress in the i-th subpanel
Shear stress due to st. Venant torsion
47

468.11
q;fi Tension-field action 'contribution to shear stress in thei-th subpanel
~ . Ultimate shear stress of the i-th subpanelU~
~ Shear stress due to warping torsionw
¢ Angle of twist
48
REFERENCES
[5]
(sJ
K. Basler.n strength of Plate Girders Under Combined Bending and Shear,"
Journal of the Struct. Div., ASCE, Vol. 87, No. ST7, Prac.Paper 2968, October 1961.
K. Basler."Strength of Plate Girders in Shear," Journal of the Struct.
Div., ASCE, Vol. 87, No. ST7, Proc. Paper 2967, October 1961.K. Basler and B. Thurlimann •.. Strength of Plate Girders in Bending,n Journal of the struct.
Div., ASeE, Vol. 87, No. ST7, Prac. Paper 2913, August 1961.H. Becker and A. Colao."Compressive Strength of Ship Hull Girders," (Part III, Theory
and Additional Experiments), sse No. 267, Ship structureCommittee, Washington, 1977.
J. B. Caldwell •.. Ul timate L9ngitudinal strength ,," Proceedings of the Royal
Institution of Naval Architects, Vol. 107, London, 1965.J. Dwight."Collapse of Steel Compression Panels," Trans. Developments in
Bridge Design and Construction, University College, Cardiff,1971.
T. V. Galambos •.. structural Members and Frames," Englewood Cliffs, N. J.,
Prentice Hall, 1968.M. Herzog."Ultimate Strength of Plate Girders From Tests, Journal of the
Struc. Div.,. ASeE, Vol. 100, No. ST5, Proc. Paper 10530, May1974.
W.T.Koiter."The Effective Width of Flat Plates for Various Longitudinal
Edge" Conditiona at Loads Fa.r Beyond Puckling Load, "NationalLuchtvaartlaboratorium, Netherlands, Rep. S287 (in Dutch),1943.
J. Kondo."Ultimate strength of Lon~itudinal1Y' Stiffened Plate Panels
Subjected to Combined Axial and Lateral Loading," FritzEngineering Laboratory Report No. 248.13, Lehigh University,1965.
T.T.Lee."Elastic-Plastic Analysis of Simply Supported Rectangular Plates
Under Combined Axial and Lateral Loading, tI Fri tz ..EngineeringLaboratory Report No. 248.7, Lehigh University,1961 •
A. E. Mansour."Charts for the B.1ckling and Post-Buckling Analysis of Stiffened
49
?lates ~nder Combined Loading," Technical and ResearchBulletin No. 2-22 Society of Naval Architects and MarineEngineers, July, 1976.
C131 Ch. Massonnet."Design of steel Plate and Fox Girder Bridges," Journal of
struc. Div., ASCE, Vol. 101, No. 11, Prac. Paper 11686,l' • 2477, 1975 •
(14J K.E. Moxham and C.D. Bradfield."The Strength .of Welded Steel Plates Under Inplane Compression,"
University of Cambridge, Department of Ehgineering, TechnicalReport No. CUED/C-struct/TR.65 , 1971.
(15J A. Ostapenko and C. Chern."Ultimate Strength of Longi tudillally stiffened Plate Girders
under Combined Loads", I_'BSEProceedings, Vol. 11, II,London, 1971.
~_ 16 J A. Ostapenko, C. Chern and S. Parsanej ad." Ul timate strength Design of Plate Girders 1t
, in Developments inBridge Design and Construction, Crosby, Lockwood .and Sbn,Ltd., University College, Cardiff, 1971.
(17J A. Ostapenko and A. Vaucher.nUl timate strength of Ehip Hull Girders under Moment, Shear and
Torque, It MAR.flD Report No. MA-RD-940- 80077 (Fri tz FllgineeringLaboratory Report No. 453.9), July 1980.
[18J A. Ostapenko."Ultimate Strength Design of Wide stiffened Plates Loaded
Axially and Normally," in Proceedings of Symposium onStructural Analysis, Non-Linear Behavior and Techniques,Transport and Road Research Laboratory (TTRL) SupplementaryReport 164 UC, p. 175, 1975.
~19J A. Ostapenko."Shear strength of Longitudinally stiffened Plate Girders,"
~roceedings of Structural Stability Research Council, 1980.~20] s. ?arsanejad and A. Ostapenko.
IITJ1timate strength Analysis of l?late Grillages under CombinedLoa.ds," Fritz Engineering Labo.ratory Report No. ;23.11,Lehigh University, 1972.
(21] K. C. Rockey, H.R. ENans and D. M. Porter."A Design Method for Predicting the Collapse Pehavior ("f Plate
Girders," 1?roc. Institution of Civil Ehgineers, Part 2, Vol.65, p. 85-112, March 1978.
~221 u. R. Rutledge."Computer Program for Ultimate Strength of Longitudinally
Stiffened Panels," Fritz Engineering Laboratory Report No.248.23, Lehigh University, 1968.
(231 D. R. Rutledge and A. Ostapenko.nUl timate strength of Longi tudinally stiffened Plate Panels
(Large and SnaIl bl t, General Material Properties) ,It Fri t z
50
Ehgineering Laboratory Report No. 248.24, Lehigh University,1968.
~24J W. Schueller and A. Ostapenko."Tests on a Trans~versely Stiffened and on a. Lon~i tudinally
Stiffened Unsymmetrical Plate Girder, WRC Bulletin No. 156,November 1970.
(25J c. S. Snith."Compressive Strength of \velded steel Ship Grillages, n
~roceedings of the Royal Institution of Naval Architects,Vol. 117, London, 1975.
1..26 J J. D. Vernarr."Comparison study of Plate Girder Ultimate Strength Methods, It
Report CE 481, Department of Civil Ehgineering, LehighUniversity, September 1977.
51
468.11
10. ACKNOWLEDGMENTS
This research was conducted at Fritz Engineering Laboratory, Lehigh
University, Bethlehem, Pennsylvania. Dr. D. A. VanHorn is Chairman of
the Civil Engineering Department and Dr. L. S. Beedle is Director of the
Laboratory.
The authors are grateful for the financial supnort provided by the
United States Department of Commerce through the Maritime Administration
University Research Program Contract MA-80-SAC-01081. They particularly
acknowledge the encouragement and advice given by Mr. Frederick Seibold,
the Program Manager of the Office of Maritime Technology, and Dr. Walter
M. Maclean, the Contract Officer's Technical Representative (COTR).
Many thanks are due to Mrs. Meng-Ling Chen and Miss Shirley Matlock
for processing the text of the report and to Messrs. Peter A. Ostapenko
and Adang Surahman for helping with the reduction of test data and other
technical tasks.
52

\1l\...)oJ
Table 1 Reference buckling stresses
Aspect Buckling Relative Plate For Buckling Streb~
Pure stress Ratio Coefficient Slenderness A Yield stressli::dAJ i k
~O.58Fvcr
=0.58Shear Fy.....-.6.-......-"""'-'
1 r-~
diJ:f~0.58 Fvcr I.IS
1 d- 5~ I k =5+- Av=O.ST E k ~1.41 Fy
0.58-0.357( AV-0.58)
1 L__ v ckL W v
1- -a ~--,>1.41 ;vcr =0.58( I/A~}~ ·1
y -
Bending>~
~0.65 Fbcr 2, , 3 kb 24di/twIlt ~1.5 Fy
0.072{ Ab-5.62) -0.78
).- -i ~ <: kb=24+73(~-J
b- 0.95 E kb:~cr =l/A~~1.5
"-
~0.65Axial Fccr 2.....-.. i'+-- >' k = 4 0.072 (Ac-5.62} -0.78I-----. ~
~1.5 F y~ ~c
_ di/tw~ Fy~ ~
~ ~
AC- 0.95 E kc~ 4--f---- ..-
I 2- Fccr~ ; ...-- <I ~1.52
~ ----- kc =( ct.+ (i") = I/AFy c

I"
b·~ II~
I
d l
I . d1-----t---- d
Transverse Stiffener
Longitudinal Stiffener
Fig. 1 Idealized ship cross section
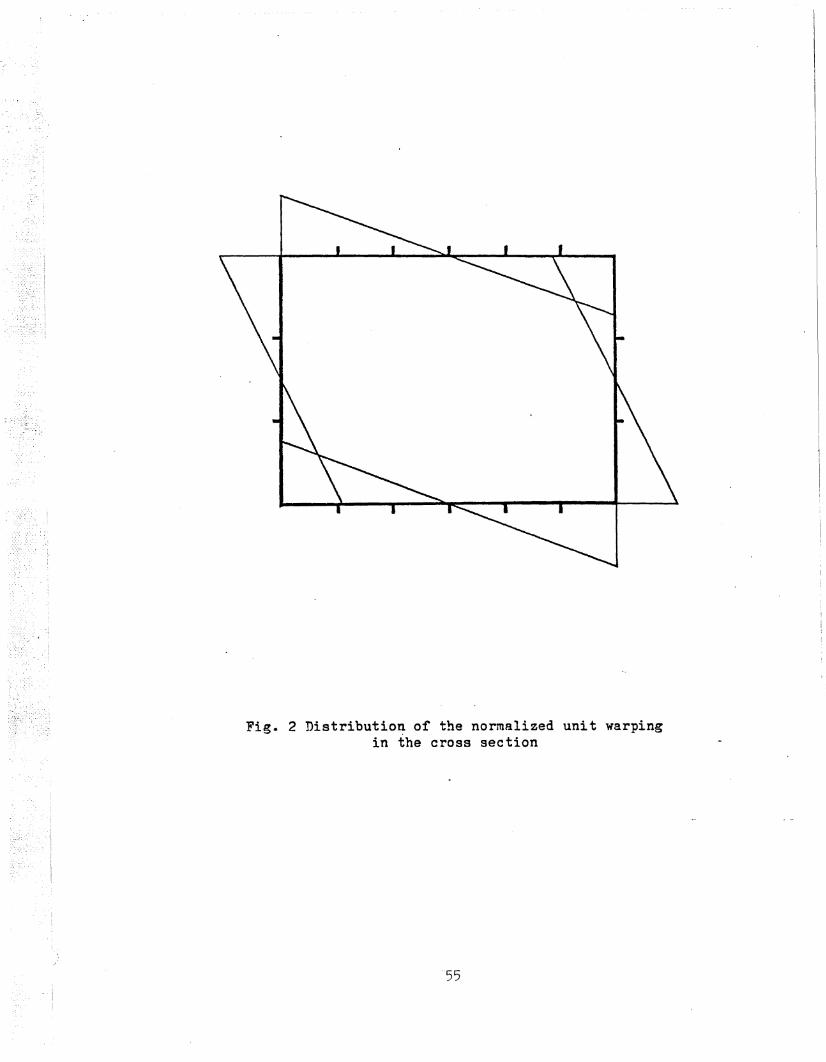
Fig. 2 Distribution of the normalized unit warpingin the cross section
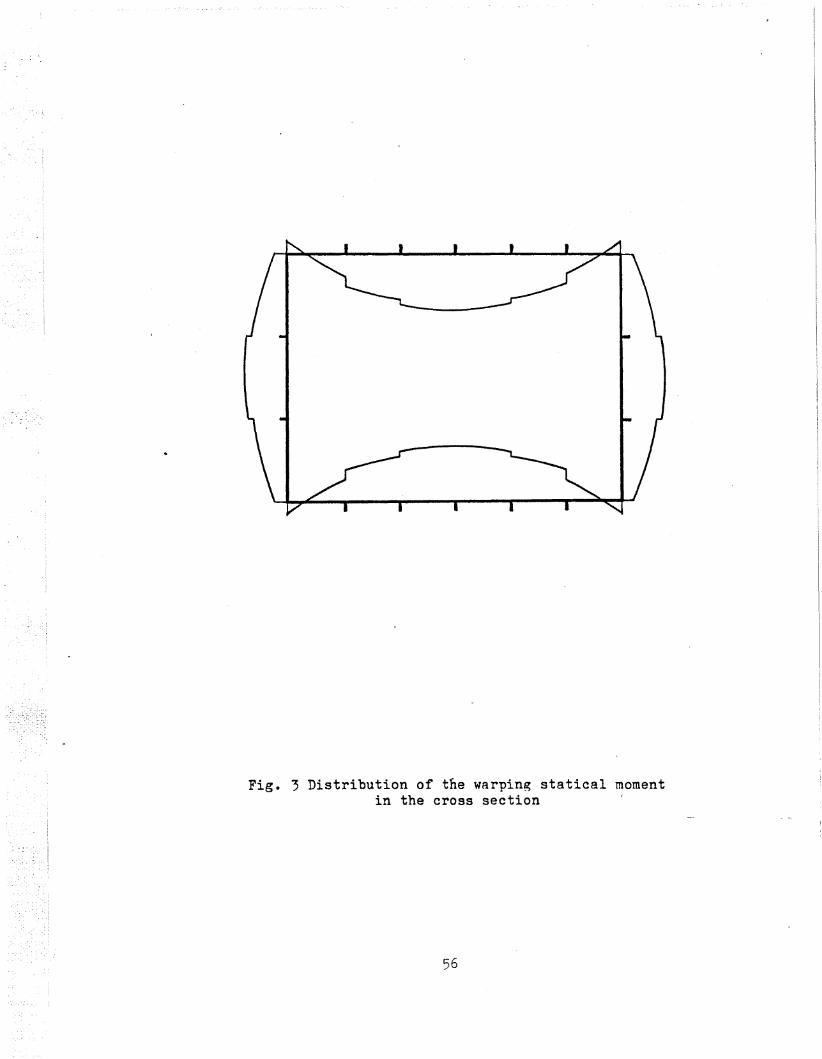
Fig. 3 Distribution of the warping statical momentin the cross section
56

L
~T__
I.AL= I 1.41
d1.ep (G J)dZ' T A
1.0
0.8
0.6
0.4
0.2l-~-:--~=----=:r:=====-I-_-+-_90.~6~0~.7=------=+:~~~~1.0
o 0.1 0.2 0.3 0.4 0.5~L -Q2
-0.4
-0.6
-·0.8-1.0
1.0
0.80.60.40.2
1.0
AL= t 1.41
0.3 0.4 0.5 0.6 0,7 0..8 0.9
Z/L
0.1o
1.0
0.8
0.6
0.4
0.2
Fig. 4 Distribution of warping normal stress andwarping shear stress along a span subjected to
constant torque with warpin~ deformation restrained
- 57

I I • I I..
- ...~
. " -...
1 1 1 I I
~O.
T T
~ OJ-(t/_ 457 ~
T =O.2W (kN-m)
y= O.538W(kN)
68IW(MPa)Sym.
Fig. 5 Distribution of st.Venant shear in the cross section
58
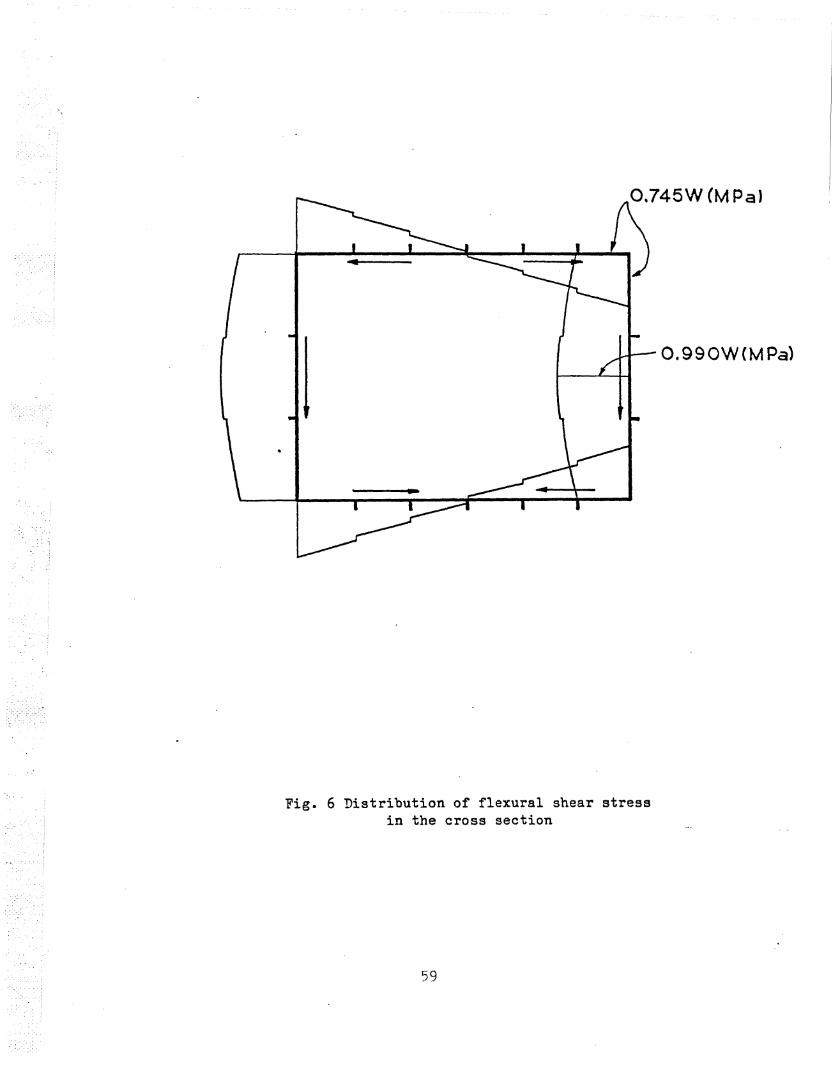
O.745W (M Pal
O.990WCMPa)
Fig. 6 Distribution of flexural shear stressin the cross section
59

1.426 W(MPa)
T =O.2W(kN - m)
v= O.538W(kN)
T T:rr 3r----ttI. 457 ~
1.67IW{MPa)
Fig. 7 Resultant shear stress in the cross section
60

3.23W(MPa)
3.23W(MPa)
i__T~I.. 457 ~I
T=O.2W(kN-m)
M=O.615WCkN- mO)
Fig. 8 Distribution of flexural normal stresses inthe cross section according to simple beam theory
61

1.77W (MPa)Sym.
Fig. 9 Distribution of warpin~ normal stressin the cross section
62

4.99W(MPa)
i-_T~
14 457 ..I
T=O.2W(kN-m)
M=O.615W(kN- m)
Fig. 10 Resultant normal stress in the cross section
63
q=q'bc
Fig. 11 Beam-column idealizat10n
64

Maferial stress - Strain Curve
----,--~ssumed
Stress-Strain Curve for 1he Plate
E or Eedge
/
Fig. 12 Average stress vs. strain relationshipfor plate under compression
65

~--~----'-----a __T j~ --- __a.._--.___
p 11tt1tttt· pq
(A) HOGGING MOMENT
Fig. 13 Hogging Moment
(B) SAGGING MOMENT
Fig. 14 Sa~ging Moment
66

0 0II ~.
0n
10- Ier'
J.40~
0 p..
C\J..r4.s::- CDs:::0
.r-4~
0cd
,.-.4
QQ)
~- s::0.,...~
~
0 ~~ 0
<t-t- . 0 Q)
"CI
r-4a1
0.,....><
<.0. ~
0 .'O'J>"0
0 Q.10
~ r-f
0 r-4Cd
.r4>4-<
0 U'"'
C'!0 .
bO.,...t
0.>-~
a:0 0 0 0 0
00 CO <0 ~ C\J.. ..d d
.- 0 0
67

OP/Py
.00·
Adj ust men.t
Longitudinally Sfiffe-ned
Plate Under Compression
/ q = 0.03 (adjusted fo.r
/ strain reversal)
0.800.600.400.20
DJItIfump--. ~ 1\~4-P_c.I.
L L -:fP.f ~(~/L)/E
K , , , , , , , d Y1.00 1.20 1.40 1.60o
0.20
0.60
0.40
0'\CD
Fig. 16 Axial load vs. deformation relationship whenstrain reversal is not considered in post-ultimate range

Test Segment
508
I·1829
~w
2972
M= O.562W(kN-m)
Y=O.615W(kN)
T=O (kN-m)
a) Test I : Moment + Shear
b) Test 2 : Moment + Shear + Torque
b) Test 3 : Moment + Shear + Torque
M:; 0.616W( kN- m)
V::: 0.385 W( kN)'
T=O.194 WCkN-m)
M=0.615 W( kN-m)
V=O.538W(kN)
T=O.20QW( kN-m)
Fig. 17 Test Segments (all dimensions are in mm)
69

I~ 3.2 Web ~ "I...A1 8)
1.6 Web It?. ,,1.. 3.2 Web It?; I
~ 19X3.2(tYPJ~~:~~~~~~.~~~I~
t.O
915152 152
3@457=1371 686
, ELEVATION
... 6.4 Flange II? 1.6 Flange ~ 6.4 Flange- ....,
--51 x9.5 (fXp.)----..
-
~~ x3.2-(typ.)l
----
r
<.0<0CD
I~ 915 3@ 457 1371 -I
SECTION B-B
OJg 3.2 3.2
6.4
TOP AND BOTTOM VIEWS
51 x 9.5(fyp.)
1.6 ctyp.l.
SECTION A-A
19 x3.2 Cfyp.)
Fig. 18 Test Specimen Scantlings (all dimensions are in mm)
70

d
Test Specimen
I
Test I and 2
~JdCk
lA Steel Plafe
- 2 x- RollerBearings
_~-y Roller~-.. Bearing
L
ELEVATiON
- d
SpreaderBeam
n----r---
I
Wood Bearing
Block
- d
I
--~-I
I
b
SECTION A-A<Tesi I) SECTiON A-A {Tes:t 2 and 3)
Fig. 1q Test Setu~
71
1.4
1.2
0.8
0.6
0.4
0.2
o I I
1Fig. 20 Strain distribution across the compression flange
at mid-length of Test segment(test 3)
72

o
o
! Ee~1 E~,/x
tI1I .'
0.2 0.4 0.6
Ee: edge strai ns obfainedby linear regression It hr oug h the sf ra i ns 0
at stiffeners I
1o
-31.0x 10
Fig. 21 Ratio of linearly fitted ed~e strains to observededge strain readings for increasing load W
as indicated by the value of f1 and E2
/
73