Embed Size (px)
Citation preview

EFFECT OF TEMPERATURE ON THE
CONDITIONING AND FLOTATION
OF AN ILMENITE ORE
Thesis
submitted to
London University
for the degree of Ph. D.
by
ERIC JOHN PARKINS
Mineral Technology Dept. Royal School of Mines, Imperial College, London University. 1975

TO THE RAINBOW IN THE BUBBLE

-1-
ABSTRACT
The effect of temperature on the conditioning and flotation of
an ilmenite ore with an oleic acid: kerosene collector mixutre has
been determined. The conditioning process was monitored by measuring
the power consumption of the conditioner motor. An increase in
temperature reduced the total conditioning time required for the optimum
flotation response, increased the ilmenite recovery and decreased the
ilmenite grade. Although temperature affected the conditioning process
by increasing bulk flocculation during conditioning it was not the
temperature of conditioning but the temperature of flotation that most
significantly affected the flotation response.
The adsorption of oleate from aqueous oleate solutions by
'pure' ilmenite and feldspar, and bubble contact angles on ilmenite and feldsparin aqueous oleate solutions, were measured at different temperatures
at pH 9.5 and 8.0. The results showed that the adsorption of oleate
by ilmenite at pH 9.5 was by an exothermic chemical reaction below
adsorption densities of 5.5 p mole/m 2
and by endothermic physical 22
adsorption above 5.5 ju mole/m At pH 8.0 and above 6p mole/m
the adsorption was physical and endothermic. The adsorption of oleate
by feldspar was physical and increased with temperature at pH 8.0, but
was unaffected by temperature at pH 9.5. Contact angles on ilmenite
and feldspar increased with temperature at a given oleate adsorption
density at pH 9.5 and 8.0. The results of the adsorption and contact
angle studies agree with the results of the conditioning and flotation
studies.
The effect of oxygen and mineral oxidation state on conditioning
and flotation and on adsorption of oleate by ilmenite was studied.

-2-
Complete absence of oxygen from the conditioning atmosphere prevented
bulk flocculation and resulted in poor flotation whilst excess oxygen
enhanced bulk flocculation but also resulted in poor flotation. Ilmenite
adsorbed more oleate from oxidised oleate solutions than from unoxidised
oleate solutions, and 'reduced' ilmenite adsorbed less oleate than oxidised
ilmenite.

-3-
ACKNOWLEDGMENTS
To Dr. H. L. Shergold the author would like to express
his sincere gratitude for the invaluable guidance, help and encouragement
which was received throughout this project.
The author is grateful to Titania A/S for the financial support
provided during the period of research.
Thanks are due to Dr. J. A. Kitchener, Mr. J. R. J. Burley,
and the academic and technical staff of the Mining and Mineral Technology
Department.
Finally, the author wishes to thank Mrs. M. Smit for
tYping this thesis.

-4-
LIST OF CONTENTS Pag
ABSTRACT 1
ACKNOWLEDGMENTS 3
LIST OF CONTENTS 4
LIST OF FIGURES 9
LIST OF PLATES 13
LIST OF TABLES 14
1 GENERAL INTRODUCTION 15
PART ONE 16
The effect of temperature on the conditioning and
flotation of an ilmenite ore with an oleic acid - kerosene collector mixture.
2 INTRODUCTION 17
2.1 The flotation of iron oxide ores with fatty acid collectors 17
2.2 The effect of temperature on the conditioning and 24
flotation of iron oxides with fatty acid collectors.
2.3 The object of part one 26
3 EXPERIMENTAL DETAIL 26
3.1 The ore 26
3.1.1 Preliminary examination of the ore 26
3.1.2 Textural composition of the ore 28
3.1.3 Ilmenite 31
3.1.4 Feldspar 31
3.1.5 Hypersthene 31
3.1.6 Liberation characteristics of the ore 34
3.2 Reagents 34
3.3 Apparatus 34
3.4 Elpatkical-Assembly- 36

-5-
3.5 Experimental procedure 37
3.6 Analysis for titanium 40
4 RESULTS 42
4.1 Preliminary testwork 42
4.1.1 Variation of power consumption with type of stirrer, 42
stirrer speed and pulp density (in the absence of
collector).
4.1.2 Reproducibility of the conditioning procedure 44
4.1.3 Effect of pulp density, collector dosage, and 47
stirrer speed on the power consumption curve.
4.1.4 Flotation response 49
4.1.5 Effect of slimes on flotation 51
4.1.6 Reproducibility of the power consumption curves 53
in relation to flotation response
4.1.7 The effect of small changes in pulp density on the 55
reproducibility of the power consumption curves
4.1.8 The desliming procedure 56
4.1.9 Conclusion 60
4.2 Conditioning and flotation at room temperature(200a 60
4.2.1 The presentation of flotation results 60
4.2.2 Observations during the flotation tests 62
4.3 The effect of temperature on conditioning and 66
flotation.
4.3.1 The effect of temperature on the power consumption 66
curve. 4.3.2 Conditioning and flotation at the same temperature 66
4.3.3 Conditioning and flotation at different temperatures 70
4.3.4 The effect of temperature on the mineralogical 70
composition of the flotation products.

-6-
5 DISCUSSION 74
5.1 Conditioning and flotation at room temperature 74
5.2 The effect of temperature on conditioning 79
5.3 The effect of temperature on flotation 80
PART TWO 82
Adsorption, Contact angle, and Oxidation Studies
6 INTRODUCTION 83
6.1 The effect of temperature on variables related to 83
flotation
6.2 The adsorption of fatty acid collectors by oxide 86
minerals 6.3 The effect of oxygen and the mineral oxidation state 89
on the adsorption of oleate by ilmenite.
6.4 The object of part two 92
7 EXPERIMENTAL DETAIL 93
7.1 Materials 93
7.2 Apparatus -1-9 6
7.3 Analysis for oleate 96
7. '4 Experimental procedure 98
7.4.1 Adsorption studies 98
7.4.2 Contact angle studies 99
7.5 Oxidation studies: The effect of oxygen and mineral 100
oxidation state on conditioning and flotation, and
adsorption of oleate by ilmenite.
7.5.1 Conditioning and flotation studies 101
7.5.2 Adsorption studies 101
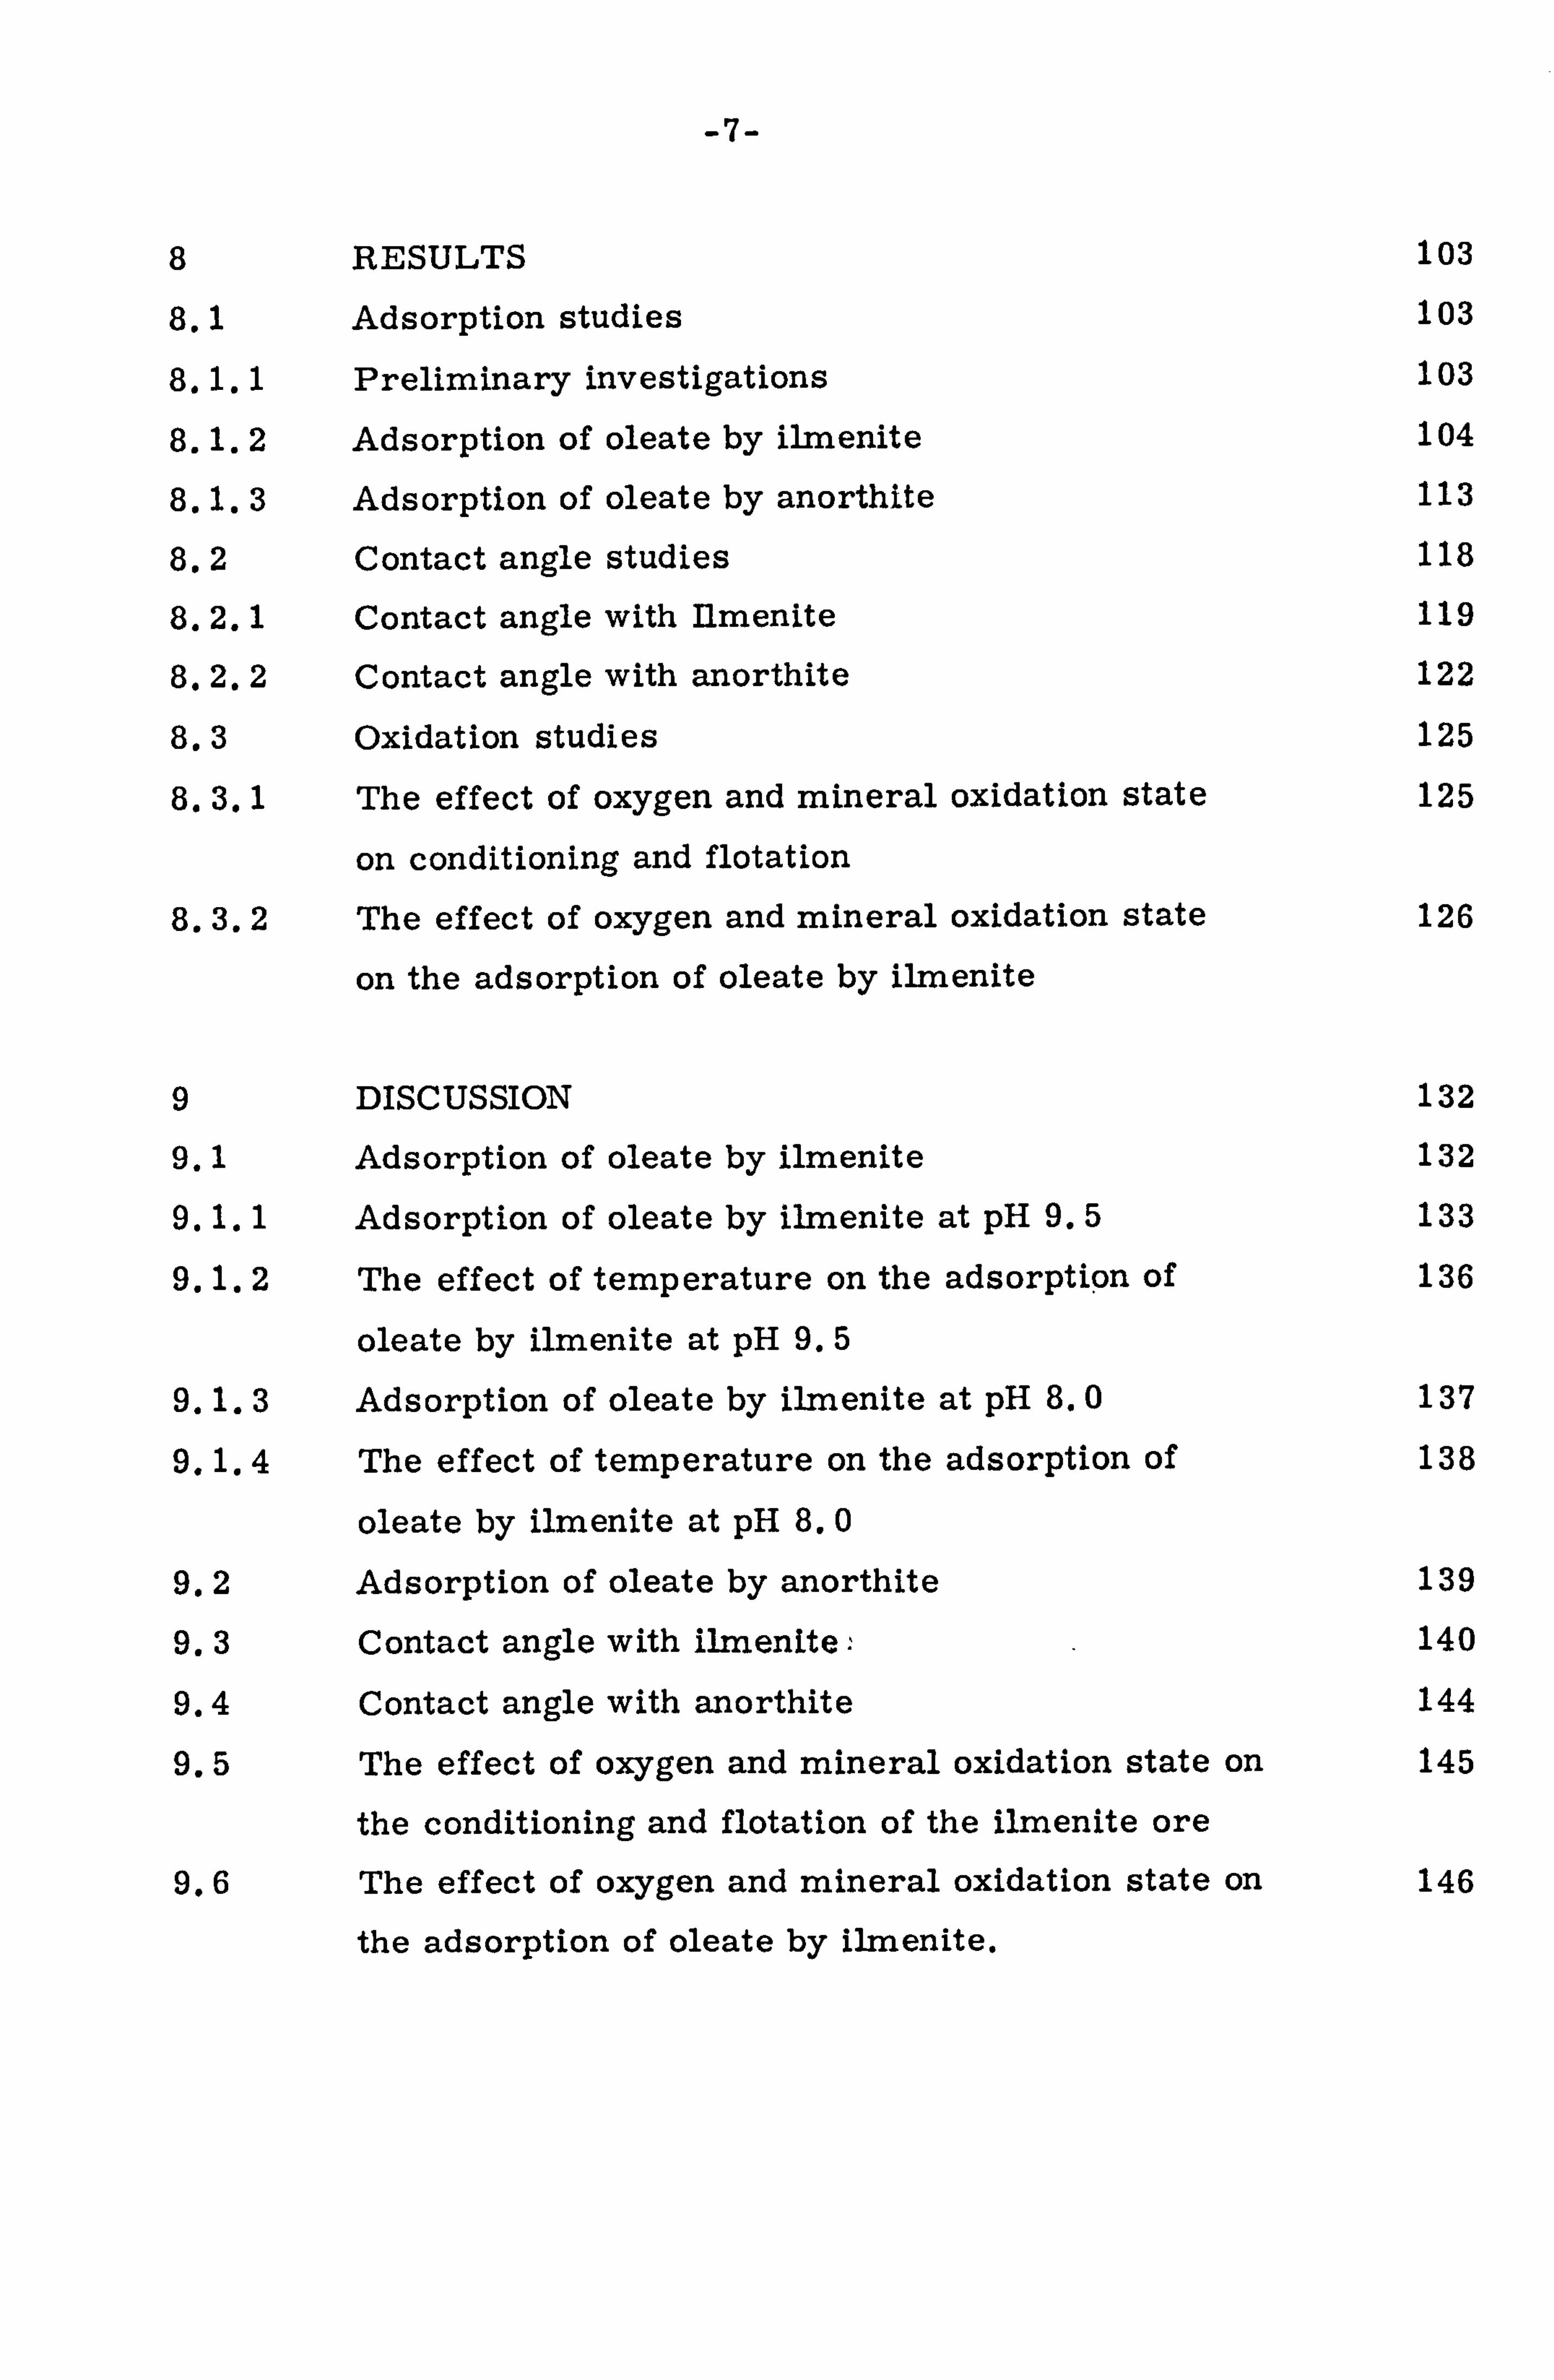
-7-
8 RESULTS 103
8.1 Adsorption studies 103
8.1.1 Preliminary investigations 103
8.1.2 Adsorption of oleate by ilmenite 104
8.1.3 Adsorption of oleate by anorthite 113
8.2 Contact angle studies 118
8.2.1 Contact angle with Ilmenite 119
8.2.2 Contact angle with anorthite 122
8.3 Oxidation studies 125
8.3.1 The effect of oxygen and mineral oxidation state 125
on conditioning and flotation
8.3.2 The effect of oxygen and mineral oxidation state 126
on the adsorption of oleate by ilmenite
9 DISCUSSION 132
9.1 Adsorption of oleate by ilmenite 132
9.1.1 Adsorption of oleate by ilmenite at pH 9.5 133
9.1.2 The effect of temperature on the adsorption of 136
oleate by ilmenite at pH 9.5
9.1.3 Adsorption of oleate by ilmenite at pH 8.0 137
9.1.4 The effect of temperature on the adsorption of 138
oleate by ilmenite at pH 8.0
9.2 Adsorption of oleate by anorthite 139
9.3 Contact angle with ilmenite 140
9.4 Contact angle with anorthite 144
9.5 The effect of oxygen and mineral oxidation state on 145
the conditioning and flotation of the ilmenite ore
9.6 The effect of oxygen and mineral oxidation state on 146
the adsorption of oleate by ilmenite.

-8-
10 GENERAL DISCUSSION AND CONCLUSIONS 149
10.1 The effect of temperature on conditioning and 149
flotation.
10.2 The conditioning and flotation process 151
10.3 Conclusions 154
APPENDIX 158
BIBLIOGRAPHY 161

-9-
LIST OF FIGURES Page
I Conditioning power consumption curve (Power 20
consumption versus conditioning time).
2 Ilmenite grade and recovery as a function of 20
conditioning time.
3 Electrical circuit of test assembly for conditioning 38
4a Stirrer S1 - 43
4b Stirrer S2 43
5 Power consumption versus stirrer speed at different 45
pulp densities in the absence of collector.
6 Power consumption versus pulp density at different 45
stirrer speeds in the absence of collector.
7 Power consumption versus conditioning time at 46
constant solids weight (W), pulp density (P),
collector dosage (C), stirrer speed (S) and pH.
8 Power consumption versus conditioning time at 46
various pulp densities for constant solids weight,
collector dosage, stirrer speed and pH.
9 Power consumption versus conditioning time at 48
different collector dosages for constant solids
weight, pulp density, stirrer speed and pH.
10 Power consumption versus conditioning time at 48
different stirrer speeds for constant solids weight,
pulp density, collector dosage and pH.
11 Ilmenite grade and recovery as a function of 50
conditioning time.
12 Ilmenite grade and recovery as a function of collector 50
dosage (20g of solid removed by desliming).
-. 10-
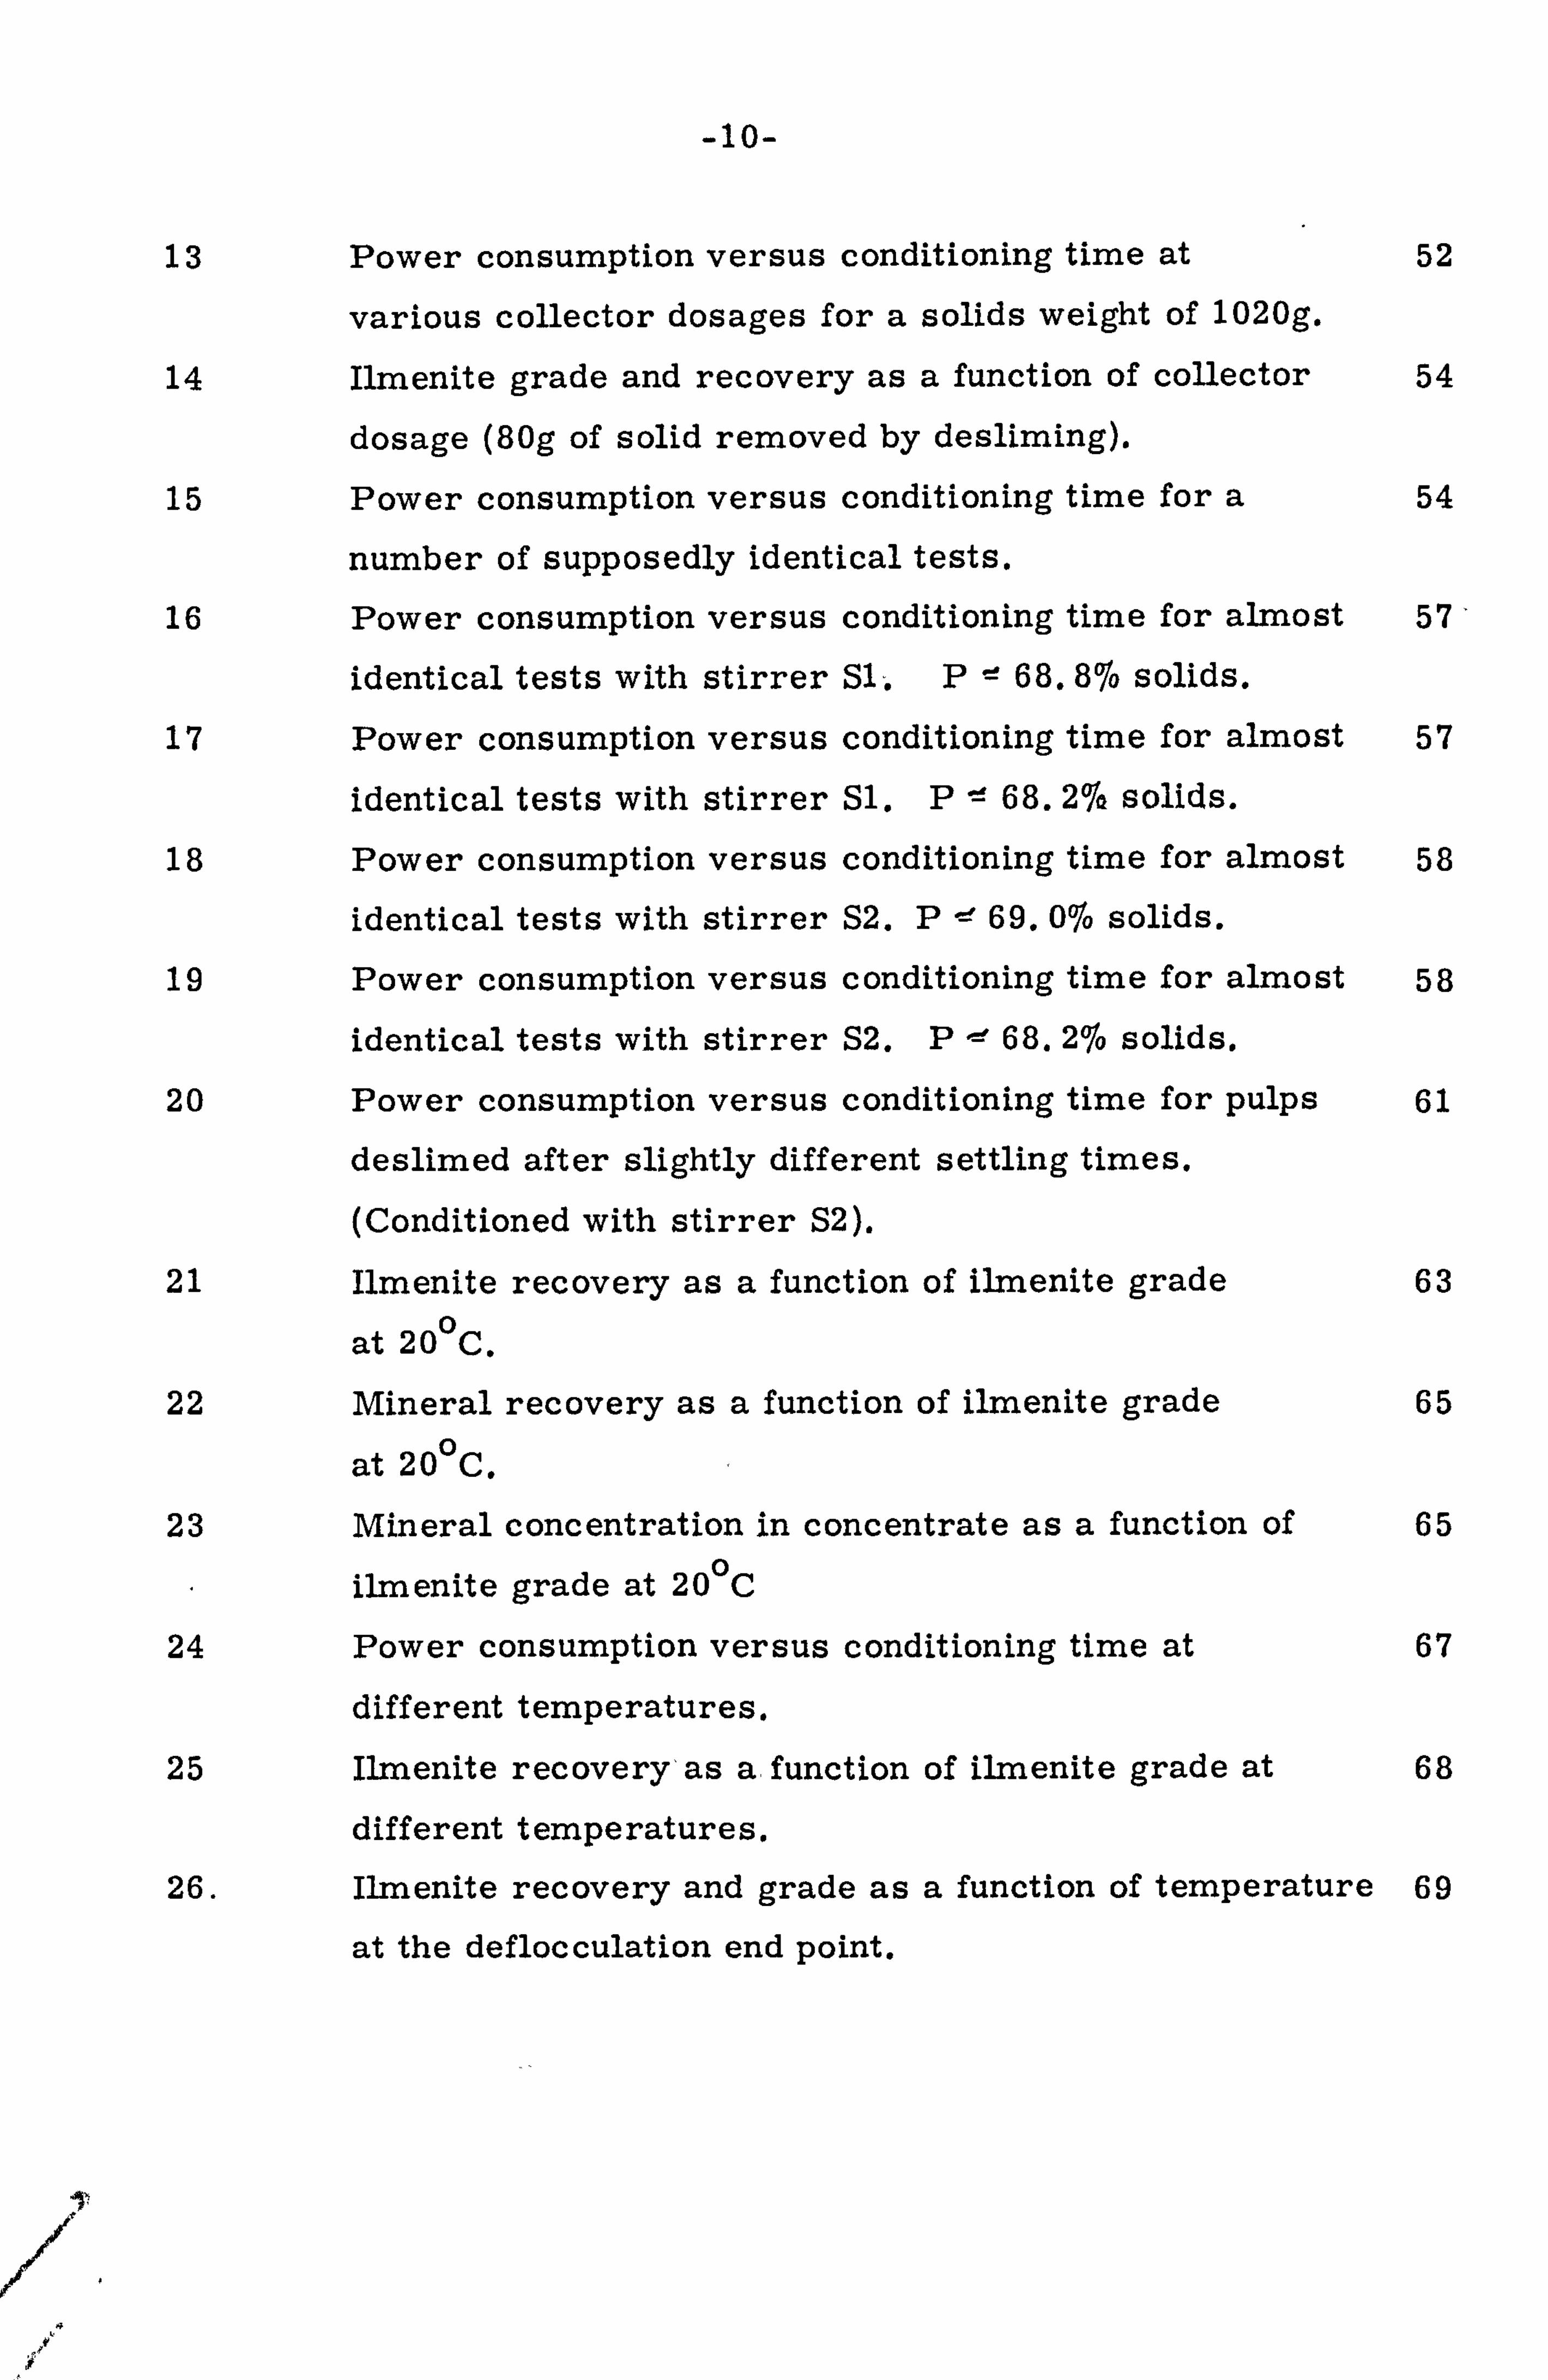
13 Power consumption versus conditioning time at 52
various collector dosages for a solids weight of 1020g.
14 Ilmenite grade and recovery as a function of collector 54
dosage (80g of solid removed by desliming).
15 Power consumption versus conditioning time for a 54
number of supposedly identical tests.
16 Power consumption versus conditioning time for almost 57'
identical tests with stirrer S1-. P %-- 68.876 solids.
17 Power consumption versus conditioning time for almost 57
identical tests with stirrer Sl. P,!! 68.27d solids.
18 Power consumption versus conditioning time for almost 58
identical tests with stirrer S2. P cý 69.076 solids.
19 Power consumption versus conditioning time for almost 58
identical tests with stirrer S2. P -- 68.276 solids.
20 Power consumption versus conditioning time for pulps 61
deslimed after slightly different settling times.
(Conditioned with stirrer S2).
21 Ilmenite recovery as a function of ilmenite grade 63
at 20 0 C.
22 Mineral recovery as a function of ilmenite grade 65
at 200C.
23 Mineral concentration in concentrate as a function of 65
ilmenite grade at 20 0C
24 Power consumption versus conditioning time at 67
different temperatures.
25 Ilmenite recovery'as a function of ilmenite grade at 68
different temperatures.
26. Ilmenite recovery and grade as a function of temperature 69
at the deflocculation end point.

-11-
27 Ilmenite recovery as a function of ilmenite grade for 71
pulps floated at a different temperature to that of
conditioning. 28 The effect of temperature on the weight of various 72
minerals reporting to the concentrate after flotation
at the deflocculation end point. 29 The effect of temperature on the concentration of 72
silicate minerals in the concentrate at the
deflocculation end point. 30 Adsorption density of OH- and H+ by ilmenite as 105
a function of pH at three temperatures.
31 Adsorption of oleate by ilmenite as a function of 106
pH at two oleate concentrations. 32 Oleate adsorption isotherms for ilmenite at pH 108
9.5 (Adsorption density versus log. equilibrium
concentration). 33 Oleate adsorption isotherms for ilmenite at pH 109
9.5 (Adsorption density versus equilibrium
concentration). 34 The reversibility of oleate adsorption at the 110
ilmenite/water interface with respect to
equilibrium concentration at pH 9.5 and 20 0 C.
35 The reversibility of oleate adsorption at the ill
ilmenite/water interface with respect to
temperature at pH 9.5.
36 Oleate adsorption isotherms for ilmenite at pH 114
8.0 (Adsorption density versus log, equilibrium
concentration). 37 The reversibility of oleate adsorption at the 115
ilmenite/water interface with respect to
equilibrium concentration at pH 8.0 and 75 0 C.

-12-
38 Adsorption of oleate by anorthite as a function 116
of pH at two oleate concentrations.
39 Oleate adsorption isotherms for anorthite 117
at pH 9.5 (Adsorption density versus log.
equilibrium concentration).
40 Oleate adsorption isotherms for anorthite at 117
pH 8.0 (Zdsorption density versus log. equilibrium
concentration).
41 Contact angles with ilmenite at pH 9.5 120
42 Contact angles with ilmenite at pH 8.0 120
43 Contact angle with ilmenite at pH 9.5 as a 121
function of oleate adsorption density.
44 Contact angle with ilmenite at pH 8.0 as a 121
funct ion of oleate adsorption density.
45 Contact angle with anorthite at pH 9.5. 123
46 Contact angle with anorthite at pH 8.0 123
47 Contact angle with anorthite at pH 9.5 as a 124
function of oleate adsorption density.
48 Contact angle with anorthite at pH 8.0 as a 124
function of oleate adsorption density.
49 The effect of oxygen and mineral oxidation state 127
on the conditioning power consumption curve
(at 200C).
50 The effect of oxygen and mineral oxidation state 130
on the adsorption of oleate by ilmenite at pH 9.5
51 The effect of oxygen and mineral oxidation state 131
on the adsorption of oleate by ilmenite at pH 8.0.
52 Motor speed and armature current as functions 160
of the armature voltage.
53 Idling power losses as a function of the motor 160
speed.

-13-
1
2
3
4
5
6
7
8
9
10
11
12
13
LIST OF PLATES
Typical texture of the ore. 29
Typical texture of the ore. 29
Typical texture of the ore. 30
Ilmenite at high magnification showing exsolution 32
phase. Ilmenite at very high magnification showing 32
exsolution phase.
Feldspar at high magnification showing needle like 33
iron oxide inclusions.
Feldspar at very high magnification showing tiny 33
iron oxide inclusions.
Schillerised hypersthene. 35
Schil-lerised hypersthene at high magnification 35
showing iron oxide inclusions.
Ilmenite sample for contact angle studies. 94
Ilmenite sample for contact angle studies. 94
Feldspar (anorthite) sample for contact angle 95
studies.
Feldspar (anorthite) sample for contact angle 95
studies.

-14-
LIST OF TABLES
1 Mineralogical Composition of Titania A/S Ore 27
2 Partial Elemental Content of the Ore 28
3 The Size Distribution of the Ground Ore 29
4 Comparison of assay values determined by the 41
atomic absorption analytical procedure and those
determined by Titania A/S
5 Analysis of the Desliming Results 59
6 Test Conditions for Oxidation Tests 128

-15-
1 GENERAL INTRODUCTION
The thesis is concerned with the effect of temperature on the
conditioning and flotation of an ilmenite ore. The work has been presented
in two distinct parts which are brought together by a general discussion
in section 10.
The first part of the work deals with the effect of temperature
on the thick pulp conditioning and flotation of an ilmenite ore with an
oleic acid: kerosene mixture as collector. During thick pulp conditioning
the pulp normally undergoes characteristic changes of flocculation,
deflocculation and dispersion. These changes were monitored by measuring
the power consumption of the conditioner motor. After the required
conditioning time the flotation response was determined by conventional
batch flotation tests.
The second part of the work is concerned firstly with providing
an explanation for the effect of temperature observed in part one, and
secondly with providing information about the adsorption of oleic acid
by ilmenite. In the second part the adsorption of oleate from aqueous
sodium oleate solutions by 'pure' ilmenite and feldspar was studied and
contact angles on ilmenite and feldspar in aqueous oleate solutions were
measured. A study was also made of the effect of oxygen and mineral
oxidation state on conditioning and flotation, and on the adsorption of
oleate by ilmenite. Throughout part two the investigations were carried
out at pH 8.0 and 9.5. A pH of 8.0 corresponds to the final conditioning
pH and pH of flotation in part one, whilst pH 9.5 corresponds to the i. e. p.
of the ilmenite.
The results of part one are compared with the results of part
two even though the test conditions of the two parts were different.

-16-
PART ONE
THE EFFECT OF TEMPERATURE ON THE CONDITIONING AND
FLOTATION OF AN ILMENITE ORE WITH AN OLEIC ACID-
KEROSENE COLLECTOR MIXTURE.

-17-
2. INTRODUCTION TO PART ONE
2.1 The Flotation of Iron Oxide Ores with Fatty Acid Collectors
Oxide ores such as those of ilmenite (FeTiO 3) and hematite
(Fe 203) can be treated by a variety of processes including gravity
concentration and froth flotation. Gravity concentration processes can be used on ores containing the valuable minerals at a relatively coarse liberation size but not on those that are finely disseminated; such finely
disseminated ores can, however, be treated by flotation.
Early attempts to treat iron oxide ores by flotation were based on the use of oleic acid as a collector. Altholigllthe[prqcess-was succes
on a small scale with a deslimed feed(l), on a plant scale there were
problems; high reagent dosages (about 0.6 Kg/tonne) were required and the process was very sensitive to slimes.
During the search for better coHector reagents it was found
that improved results were obtained when the fatty acids were mixed with
neutral oils such as fuel oil or kerosene. This led to the use of fatty
acid-fuel oil emulsions which were supposedly insensitive to the slime
content of the ore. (2)
Iron oxide flotation by fatty acid-fuel oil emulsions had certain (3) features which differed from the more conventional flotation processes
In particular, for high selectivity, a long conditioning time of 30 minutes to 1 hour was necessary after the emulsion addition. Furthermore, the
conditioning had to be carried out at a relatively high pulp density of 5016 solids by weight. An increase of the pulp density to 7076 made it
unnecessary to emulsify the fatty acid-fuel oil mixture prior to its (4)
addition It was thought that under such conditions emulsification

-18-
(4) was caused by the scrubbing action of the high density pulp Desliming
of the pulp was still necessary for selective flotation.
Although the flotation of iron oxides by this method was in
use by the early 1950 s, little was known about the role of fuel oil or
why it was necessary to have high intensity agitation and a long conditioning time. Runolinna (5)
considered that the fuel oil played an essential role both in flocculating the ilmenite and in removing fatty acid soap films
which had been deposited on the gangue during the early stages of
conditioning. Eidsmo and Mellgren (4)" however, held the opinion that
the fuel oil behaved as a froth modifier only.
An investigation of the conditioning process was carried out (6) by Kun Li, Livingstone and Lemke who showed that whereas the gangue
and values were flotable at the start of conditioning, only the values were flotable at the end. This was explained by a mechanism of reversible
reagent transfer between the values and gangue particles.
The discussion following the paper of Kun Li, Livingstone and Lemke prompted a more detailed examination of the conditioning process. Mellgren
(7) suggested that redistribution of collector between the
different minerals in a thick pulp would result in a change of pulp
viscosity. This, he suggested, would also cause the conditioning energy input, at a fixed stirrer speed, to vary with time. On the basis of these
possible changes in pulp viscosity Lapidot(8) investigated the conditioning
and flotation of an ilmenite ore with a fatty acid - fuel oil mixture as
collector. The changes in pulp viscosity, which resulted from flocculation
and deflocculation of the minerals comprising the pulp, were monitored by measuring the power consumption during conditioning. A correlation
was established between the conditioning power consumption and the
flotation response. The variation of power consumption observed

-19-
during a typical conditioning test is shown as a power consumption curve in Figure 1. This curve, is divided into five characteristic sections as defined by Lapidot. The five sections are: -
The induction period during which the viscosity and power
consumption were constant.
2 The flocculation period during which the viscosity and
power consumption increased rapidly to a maximum.
3 The flocculation peak which marked the end of the flocculation
period and during which the power consumption was
unchanged.
4 The deflocculation period during which the viscosity and
power consumption decreased rapidly.
5 The dispersion period during which the power consumption
remained essentially unchanged.
Lapidot showed that the flotation results were dependent on the
conditioning time. This point is demonstrated in Figure 2 where the
typical ilmenite flotation response is superimposed on the power consumption
curve. The flotation results can be summarized with reference to the
five characteristic sections of the power curve as follows. Throughout
the induction period only small quantities of minerals were floated,
there was no selectivity and the concentrate consisted mainly of fines.
Flotation during the floabtUatiop period resulted in an increased recovery but there was still little or no selectivity. At the flocculation peak the
recovery of both ilmenite and gangue was at a maximum, but during the
deflocculation period the gangue recovery decreased rapidly. Maximum selectivity was obtained at the end of the deflocculation period
49

-20-
40
30
20
0 04,
'. 41 Q) z
0
Fiaure 1- Conditioning power consumption curve (Power consumption versus conditioning time)
flocatation p eak
f to ccn. period
def I occn. period
i nduct i on per i od
dispersion period
Conditioning time
Figure 2 Ilmenite, grade and recovery a's a function of conditioning tim
i0b
80
CD
e- 60
40
10
0* 20
gangue recovery
.0
0 Conditioning time

-21-
where the ilmenite recovery was still near its maximum but where the
gangue recovery was low. During the dispersion period the ilmenite
recovery decreased.
As a result of their investigations Lapidot and Mellgren(9)
proposed the following mechanism to explain the ir observations. During
the induction period the reagents were dispersed throughout the pulp by
shearing forces and the reagent droplets were gradually captured by
the mineral particles in random collisions. - In this period the collector
was adsorbed by both the ilmenite and the gangue. During the flocculation
period more and more particles became collector coated and, as a result
of cohesive forces between the collector coated particles, they gradually
flocculated. It was considered that at the flocculation peak bulk
flocculation of the pulp occurred. Then, after the flocculation. peak,
a rapid redistribution of reagents between the gangue and the ilmenite
took place because of the greater affinity of the ilmenite for the collector. The pulp then deflocculated. At the end of the deflocculation period
only the ilmenite was considered to be collector coated and this was said
to explain why maximum selectivity was obtained under these conditions. It was thought that, in the thick pulp, the collector was removed from
the gangue by attrition and that this resulted in deflocculation of the
pulp. The decrease in ilmenite recovery was presented as evidence
of the attrition action, but in this instancEýofthe-c6llector from the
ilmenite surface.
Despite the work of Lapidot and Mellgren(9) there is still
considerable speculation about the reasons for the flocculation-
deflocculation cycle and the corresponding variation of flotation behaviour.
Kitchener (10)
suggested it was unlikely that mechanical action was
responsible for the removal of an oily film from the mineral grains -
such action might assist the retraction of the oil film from the minerals

-22-
but would not itself cause it. He also suggested that one possible
mechanism for retraction of the oil film might be solubilisation of metal
soaps of the fatty acids by the oils. Mackenzie has shown that the
change in recovery with conditioning time is not exclusive to emulsion
flotation and that it occurs in systems in the presence of, and absence of,
a neutral hydrocarbon oil. He therefore suggests that a detergency
process does not explain the data whereas an attrition mechanism does.
Although Lapidot and Mellgren(9) suggest that attrition is
the main reason for both deflocculation and selectivity their results are
open to another, quite different, interpretation. An increase in attrition
during conditioning would be caused by an increase in the shear force
throughout the pulp. Such a variation in the shear force would, however,
result from a change in the degree of flocculation of the pulp. Since
attrition is, in this way, dependent on the degree of flocculation, it is
unlikely that deflocculation of the pulp would be produced by attrition
alone.
For deflocculation to occur either the force of adhesion of
the collector to the mineral or the force of cohesion between the collector
'coated minerals must decrease and become smaller than the shear force.
It is not known how such a decrease in force of adhesion or force of
cohesion might take place. Lapidot and Mellgren(9) suggested that during
the flocculation peak some of the collector transferred from the gangue to
the ilmenite and at the end of the deflocculation period this transference
was complete. They thought that transference took place because the
collector had a greater affinity for the ilmenite than for the gangue.
However, the average thickness of the collector coating on the concentrate
particles was calculated as 3.74 x 10- 6 CM(8), which corresponds to about
20 layers of vertically oriented collector molecules. It is unlikely that

-23-
the ilmenite collector affinity would extend through so many layers to
remove the collector coating directly adsorbed on the gangue surface.
Another observation which suggests that complete transference of the
collector does not occur is the production of a second flocculation- (8)
deflocculation cycle on the addition of fuel oil to a deflocculated pulp
If the deflocculation of the pulp does not result from collector
transference from the gangue to the ilmenite then it must be caused by
a decrease in the force of cohesion between the collector coated particles. Such a decrease in cohesion could result from the following process. Initially the collector would be adsorbed by both the gangue and ilmenite, and
the adsorbed oleic acid would be more or less randomly oriented. As conditioning proceeded the collector on the ilmenite surface would
become more ordered than that on the feldspar because of the greater
affinity of the carboxylate head group for the ilmenite surface. At this
stage a gangue-ilmenite floccule could be held together by the weak
attractive forces between a partially ordered adsorbed layer on the ilmenite
and randomly oriented one on the feldspar. With more ordering of the
adsorbed layer on the ilmenite it is conceivable that these weak attractive forces would diminish and so allow deflocculation to occur. Alternatively
it is possible that the highly ordered layer on the ilmenite surface would (12)
cause the overlying layers to retract by autophobicity
Such a consideration of the results places much less importance
on the role of attrition in deflocculation and, furthermore, suggests
that the process by which selectivity is obtained does not involve the
removal of collector from either mineral species.
-24-
2.2 The Effect of Temperature on the Conditioning and Flotation
of Iron Oxides with Fatty Acid Collectors
Although a number of authors have studied the effect of temperature
on flotation, (13-17) the results that have been obtained are somewhat
contradictory. Strathmore, Cook and Choi (13)
studied the effect of
temperature on the soap flotation of an iron ore and showed that the
recovery and selectivity were improved at elevated temperatures. A
more relevant study was carried out by Laapas (14)
who investigated the
effect of temperature on the flotation of iron oxide minerals, including
ilmenite, with fatty acids. He found that although the recovery improved
with an increase in temperature, the concentrate grade decreased.
Hakki (15)
has suggested that an increase in temperature will result in
an improved recovery and selectivity. Of the many examples given by
Hukki,, one which is relevant to ilmenite flotation is the hematite flotation
plant at The Republic Mine, Michigan. Here a primary flotation concentrate
assaying 61.716 Fe is steam conditioned at 701o solids at boiling
temperatures, no new reagents being added. The selectivity was greatly
enhanced and reflotation at 60 0 to 70 0C produced a final concentrate
assaying 66.976 Fe with a 97.816 recovery in the hot cleaning circuit.
The effects of increasing the pulp temperature during thick
pulp conditioning are difficult to predict because of the complexity of ilmenite collection by fatty acid collectors. A decrease in the pulp
viscosity and hence power consumption might be expected and this in
turn would lead to more efficient reagent distribution. Furthermore, the
rate of adsorption and desorption of collector by the, ilmenite and gangue
should increase; an increase in the rate of collector adsorption could lead to a reduction of conditioning time whereas an increase in the rate
of desorption may give a higher degree of selectivity, especially if the
desorption rate for the gangue minerals is greater than that for the
ilmenite.

-25-
2.3 The Object of Part One
The oýject of part one of the project was to determine the
effect of temperature on the thick pulp conditioning and flotation of an ilmenite ore with a mixture of oleic acid and kerosene as collector.
The conditioning apparatus was similar to that used by
Lapidot (8)
but here a much more sensitive electrical assembly was used to measure the power consumption and control the stirrer speed. Before determining the effect of temperature it was necessary to
characterize the conditioning assembly and determine the optimum
conditions for flotation at room temperature. This necessarily involved (8)
repeating some of the work carried out by Lapidot.
A thorough mineralogical examination of the ore was carried
out and the liberation size of the ilmenite was determined.

-26-
3 EXPERIMENTAL DETAIL
3.1 The Ore
The ilmenite ore used throughout the conditioning and flotation
testwork was a sample of mill feed provided by TitaniaA/S and it came
from the Tellnes mine which is situated in the Egersund province of
south west Norway. A short geological description of this deposit
presented by Geis (18)
shows that the ilmenite is deposited in a norite host rock and is associated with small amounts of magnetite and sulphides.
A few pieces of rock were taken from the minus 10 cm. ore
received, and, from these, thin sections were prepared for microscopic
examination. The remainder of the ore was crushed to minus 1.7 mm and (19)
sampled into 1.1 kg. lots in accordance with good sampling procedure These 1.1 kg. lots were, after grinding, used in the conditioning and flotation tests.
3.1.1 Preliminary Examination of the Ore
A sample of crushed ore was ground to minus 210 pm and then
examined with the aid of the determinative mineral tables of Jones and (20)
Fleming Ilmenite, magnetite, pyrite, chalcopyrite, biotite and a large amount of silicates were observed. Microscopic examination.,
under transmitted and reflected light, of the polished thin sections of the natural ore and of different density fractions at different particle
sizespshowed that the composition of the ore was as presented in
Table 1.
-27-
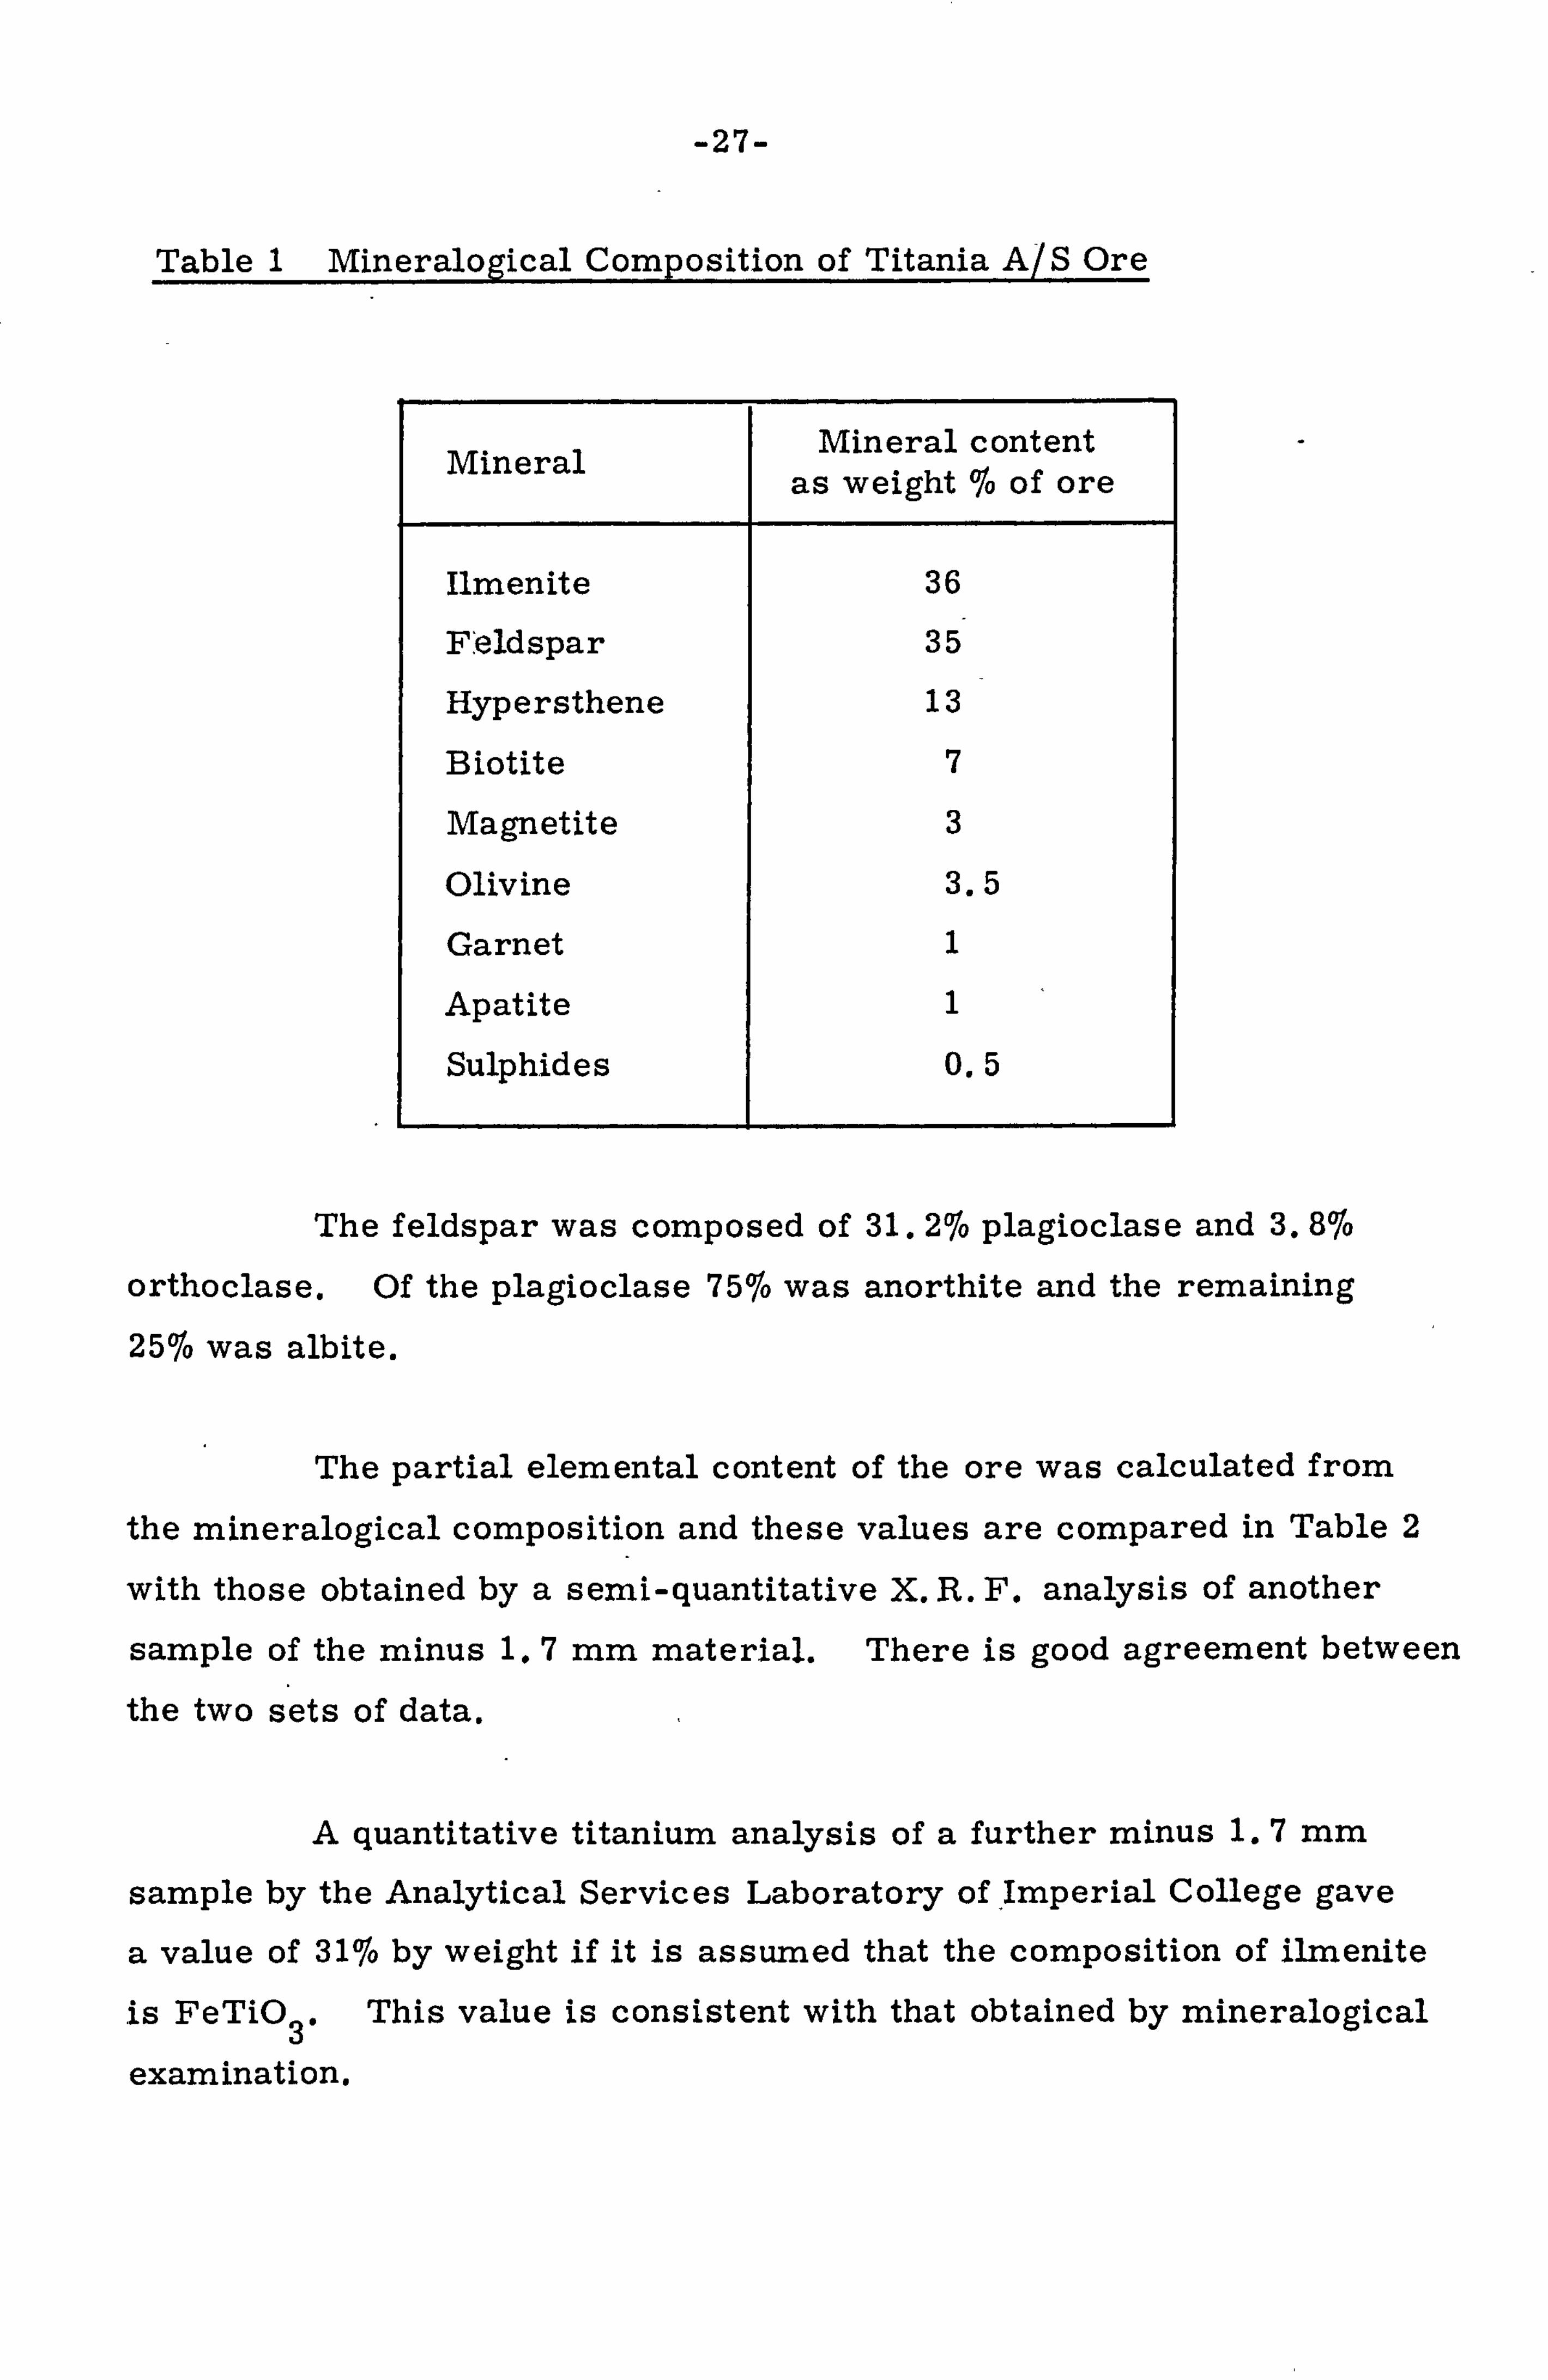
Table I Mineralogical Composition of Titania A/S Ore
Mineral Mineral content as weight Jo of ore
Ilmenite 36
Feldspar 35
Hypersthene 13
Biotite 7
Magnetite 3
Olivine 3.5
Garnet 1
Apatite 1
Sulphides 0.5
The feldspar was composed of 31.216 plagioclase and 3.8%
orthoclase. Of the plagioclase 75% was anorthite and the remaining 25jo was albite.
The partial elemental content of the ore was calculated from
the mineralogical composition and these values are compared in Table 2
with those obtained by a semi -quantitative X. R. F. analysis of another
sample of the minus 1.7 mm material. There is good agreement between
the two sets of data.
A quantitative titanium analysis of a further minus 1.7 mm
sample by the Analytical Services Laboratory of, Imperial College gave
a value of 31% by weight if it is assumed that the composition of ilmenite
is FeTiO 3' This value is consistent with that obtained by mineralogical
examination.

-28-
Table 2 Partial Elemental Content of the Ore
Elemental Concentration as wt.
Element From From X. R. F.
mineralo . gical determination
composition
Fe 17.0 10 - 20
Ti 11.5 5- 10
Al 6.5 2-5
Ca 3.5 1- *5
Si 14.0 10 - 20
Na 0.8
-K 0.27 0.3-0.8
Mg 4.7 3-7
3.1.2 Textural composition of the Ore
Plates 1 and 2 show the typical texture of the ore. The iron
oxides (ilmenite and magnetite) are concentrated in vein like bands which
are surrounded by feldspar, schillerised hypersthene, and biotite. Most
of the ilmenite was present as large grains which ought to be liberated
at a fairly coarse size (about 280 pm). Some of the feldspar, however,
contained small grains of ilmenite (plate 3) which would only be liberated
at 70 pm or less. Much of the olivine was weathered to chlorite and
goethite. The ilmenite and major silicate minerals were examined more
closely at high magnification.
d

-29-
Plate 1
Transmitted polarised light, 100 x magnification. Schillerised hypersthene ( h); striped phase is feldspar (f);
grey phase is biotite (b), black phase is ilmenite.
V.
4
Plate 2 Typical texture of the ore
Transmitted polarised light, 100 x magnification. Left hand side of plate shows mainly feldspar with ilmenite inclusion. Right hand side of plate shows schillerised hypersthene and biotite with ilmenite inclusion.
Typical texture of the ore

-30-
Plate 3 Typical texture of the ore
74
OV li
"p. 4 'b'
A
.0
Reflected light, 100 x magnification. Grey phase is silicate (s), white phase (i) is composed of iron oxides (ilmenite and magnetite).

-31-
3.1.3 Ilmenite (FeTiO 3)
Although the formula for ilmenite is given as FeTiO 3 it is
more fully expressed as (Fe, Mg, Mn)TiO 3 therefore in addition to titanium
and iron the ilmenite may contain magnesium and manganese. Furthermore
there is a solid solution series between ilmenite and hematite which allows
natural ilmenite to take up to 616 hematite in solid solution; hematite in
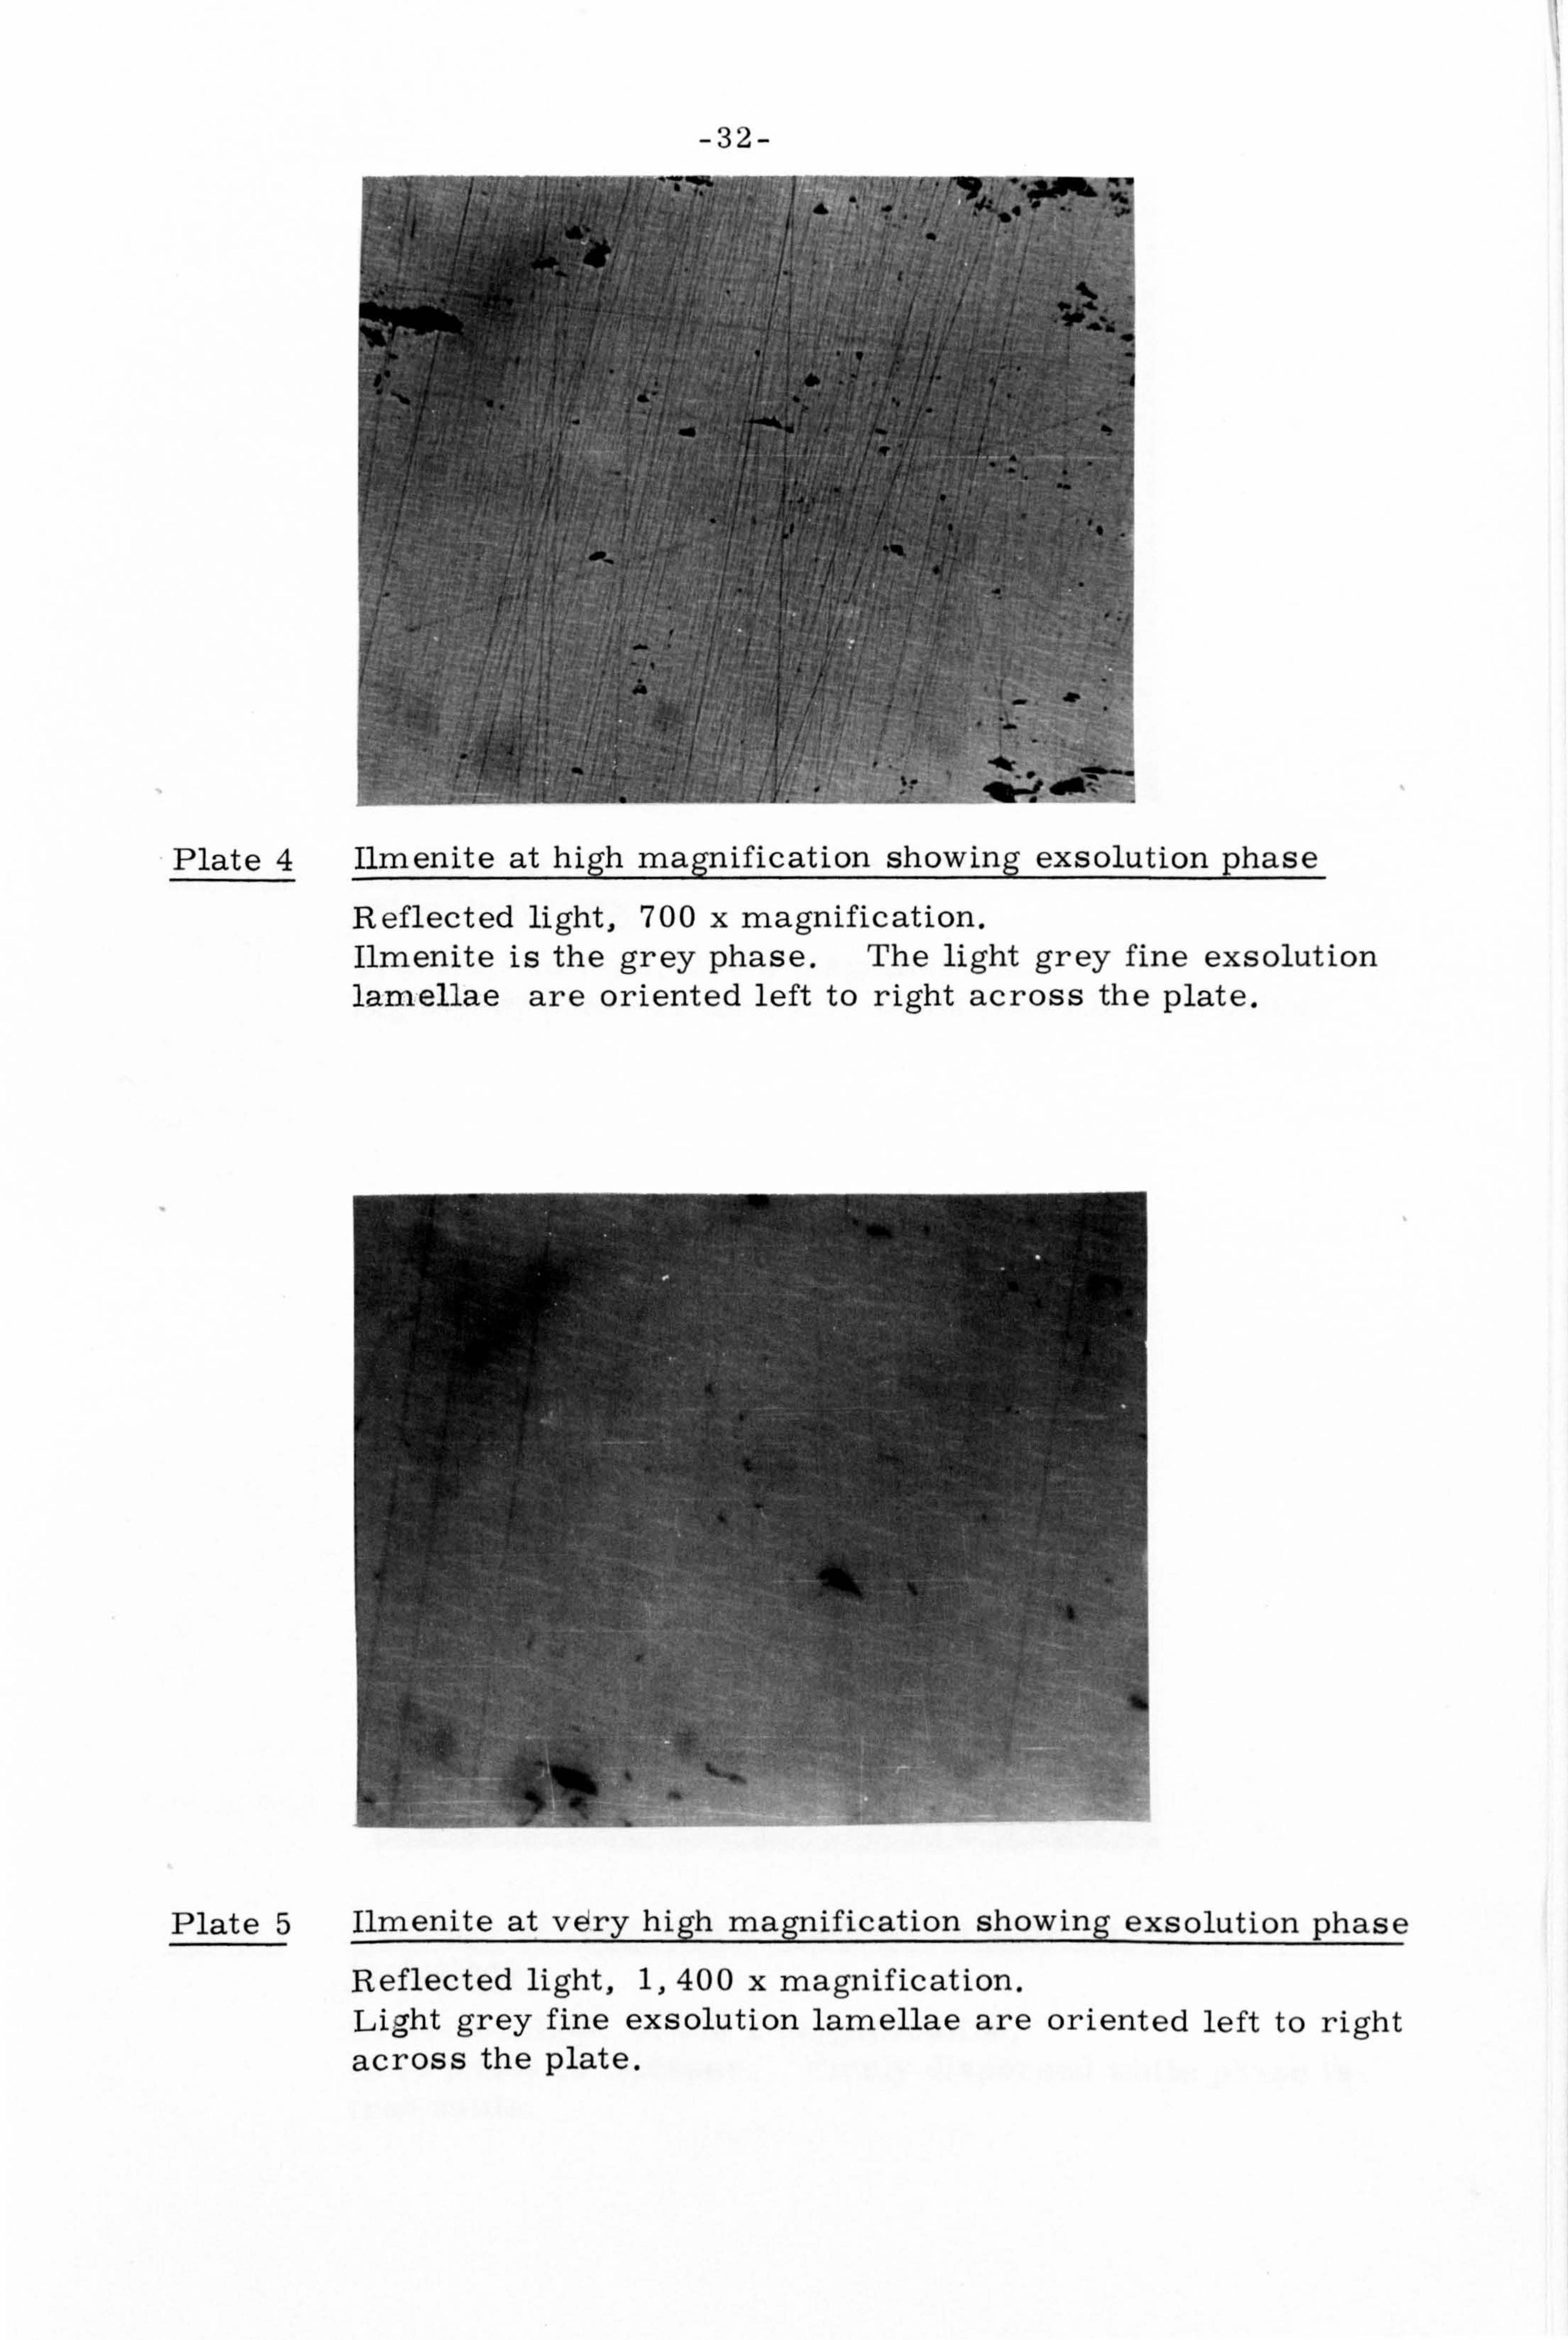
excess of this may exist as exsolution lamellae. Such an exsolution phase
was revealed by examination of a polished section of ore at high magnification
under reflected light (plates 4 and 5). The presence of exsolution hematite
in the Tellnes ilmenite has been reported by Geis (18)
.
3.1.4 Feldspar (CaAl 2
Si 208
(751o) + NaAlSi 308
(25%))
Classification of the host rock as a norite suggested that the
plagioclase would be composed mainly of anorthite. This was confirmed by examination of the feldspar under transmitted light which showed that
the plagioclase composition was 7516 anorthite and 25% albite.
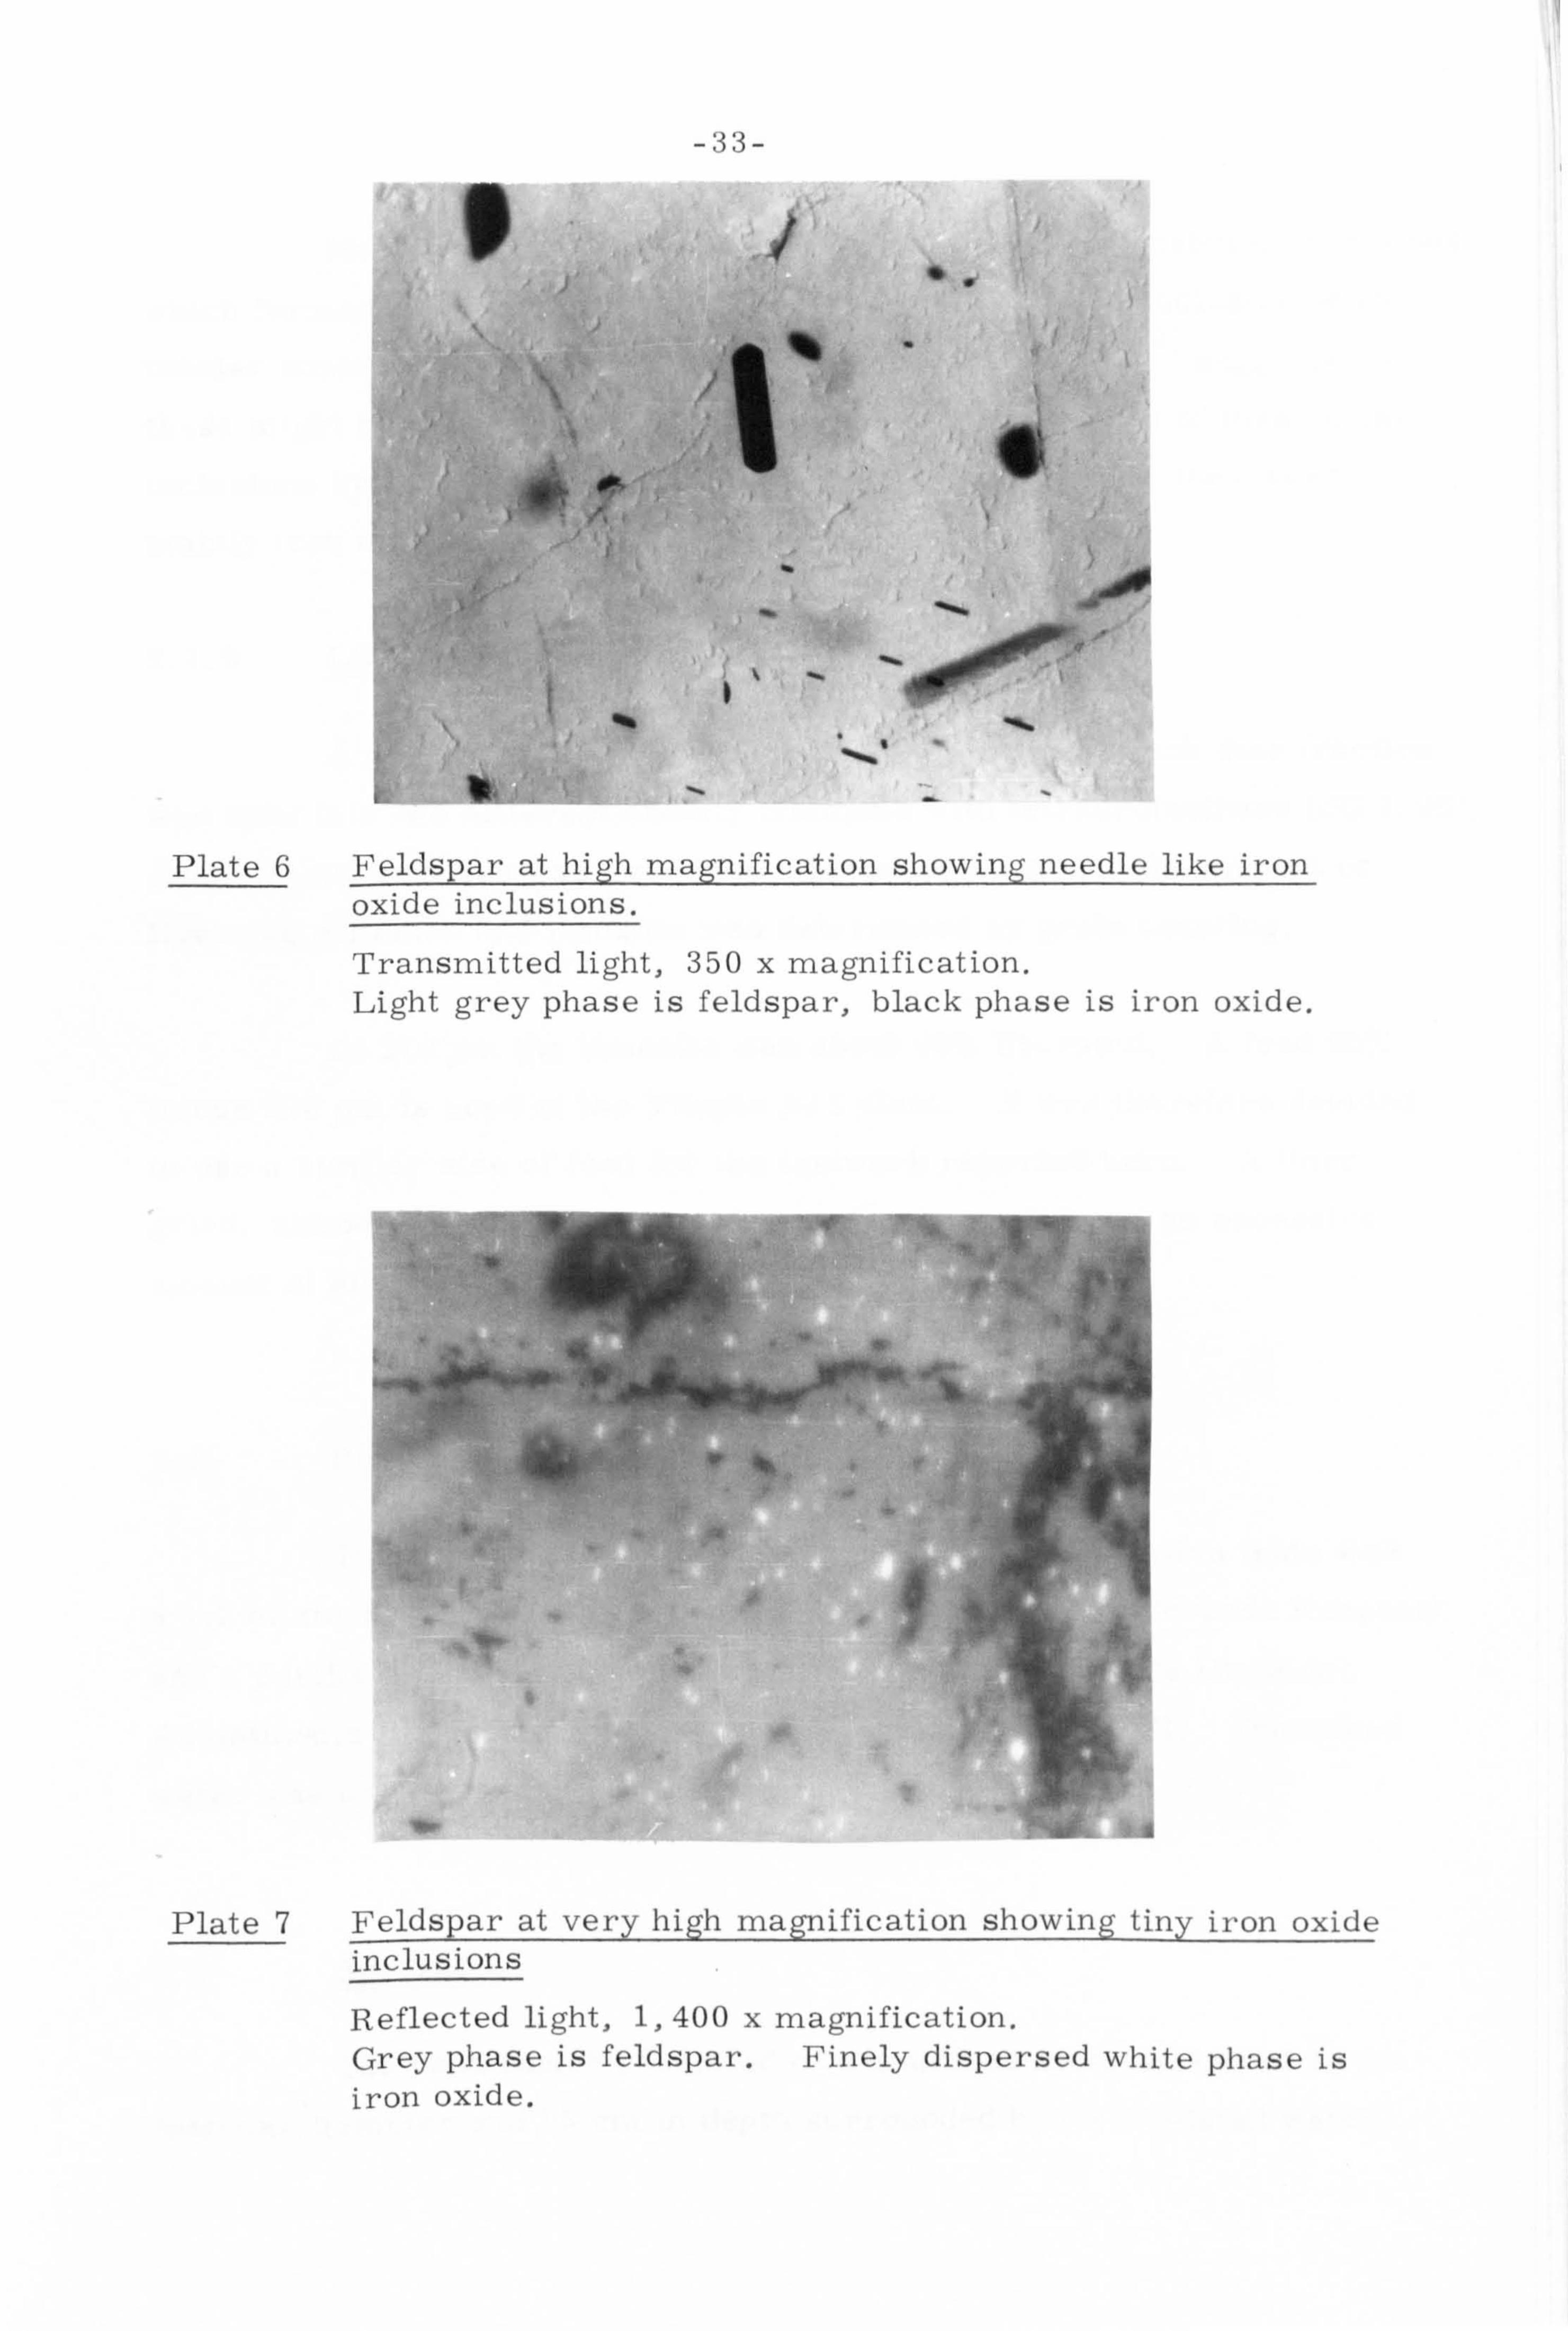
Most of the feldspar was essentially pure but some grains
contained small amounts of ilmenite (plate 3). In addition some tiny needle like opaque inclusions were observed (plates 6 and 7). It has been
(21) suggested that these are iron oxides
3.1.5 Hypersthene MgSiO 3
Under transmitted light the hypersthene had a pink colouration
characteristic of titanium and it was, therefore, probably of the titanaugite
variety.
-32- la
4L
40
4..
4.
'f .i-/ t.
Plate 4 Ilmenite at high magnification showing exsolution phase
Reflected light, 700 x magnification. Ilmenite is the grey phase. The light grey fine exsolution lamellae are oriented left to right across the plate.
I *k .
Plate 5 Ilmenite at very high magnification showing exsolution phase
Reflected light, 1,400 x magnification. Light grey fine exsolution lamellae are oriented left to right C3 across the plate.
-33-
/ S.
)
Plate 6 Feldspar at high magnification showing needle like iron oxide inclusions.
Transmitted light, 350 x magnification. Light grey phase is feldspar, black phase is iron oxide.
Plate 7 Feldspar at very high magnification showing tiny iron oxide inclusions
Reflected light, 1,400 x magnification. Grey phase is feldspar. Finely dispersed white phase is iron oxide.

-34-
Most of the hypersthene grains contained small tabular inclusions
which formed a Schiller structure (plates 8 and 9). The inclusion of such
tabular scales in hypersthene is quite common and Dana (22)
suggests that
these might be brookite, goethite or hematite. Inspection of these small inclusions by an electron probe microanalyser showed that they were
mainly iron oxides.
3.1.6 Liberation Characteristics of the Ore
A ground sample of the ore was screened and each size fraction
was split into two different density fractions with tetrabromethane (SG 2.96).
Each density fraction was examined microscopicaHy and the amount of liberated silicates and ilmenite was determined by grain counting.
At 210 pm the ilmenite was about 93jo liberated. A feed 9516
minus 210 pmis used at the, Titania A/S plant. It was therefore decided
to use a similar size of feed for the testwork reported here. A finer
grind, although liberating more of the ilmenite, produced an excessive
amount of slimes.
3.2 Reagents
The collector used for the conditioning and flotation tests was
a 1: 1 mixture by weight of oleic acid (a purified General Purpose Reagent)
and a purified kerosene (provided by Shell Special Products Division).
Adjustments of pH were made withAnalar H2 so 4 or NaOH. Deionised
water was used throughout the testwork.
3.3 Apparatus
The conditioner consisted of a stainless steel beaker- of 10 cm internal diameter and 15 cm in depth surrounded by an insulated water

-35-
Plate 8 Sciiiilerised hypersthene
Transmitted polarised light, 100 x magnification. Typical texture of ore showing a large area of schillerised hypersthene (h) containing fine iron oxide inclusions (i).
Plate 9 Schillerised hypersthene at high magnification showing iron oxide inclusions
Transmitted polarised light, 350 x magnification. Left hand side of plate shows black rhombic inclusions of iron oxide which form the schiller structure in the hypersthene.

-36-
jacket. A1 /15 h. p. shunt wound d. c. motor coupled to a stirrer shaft
provided power to agitate the conditioner contents. The stirrer blades
on the stirrer shaft were interchangeable.
The electrical assembly is described in section 3.4.
The flotation equipment consisted of a 'Denver' flotation
machine which was operated at 2000 rpm and a 2.5 L. stainless steel
'Denver' type cell surrounded by an insulated water jacket.
A 'Statiml constant temperature unit (range -40 to +50 0 C)
was used to pump water at a fixed temperature through the water jackets
of the conditioning and flotation cells. A separate heater and pump were
used to supply water at temperatures in excess of 50 0 C.
Measurements of pH were made with a 'Pye-Unicaml pH meter
model 292 Mk. 2 and a 'Pyel combined glass and calomel electrode which
was capable of sustained usage from 10 0 to 70 0C and intermittent usage 0000 from 0 to 10 C and 70 to 100 C. The pH meter was calibrated at
each temperature with the relevant buffer solutions and calibration tables.
3.4 Electrical Assembl
The stirrer used in the conditioning cell was driven by a
'ParvaluxI 1/15
h. p. shunt wound d. c. motor. This motor was chosen
because it provided the maximum power required during conditioning and
gave a sensitive response to the change in load produced by flocculation of
the pulp. A 'Pullin' d. c. tachogenerator (load 5000. rx, 10OOv) and a 'Bercol
controller unit were connected to the motor to keep the stirrer speed
constant. Complete power transmission from the motor to the stirrer and
tachogenerator was ensured by using non-slip couplings.

-37-
The temperature of the motor armature rose considerably when
the motor was subjected to an increased load during pulp flocculation.
To minimise any error in the calculated power consumption, which would
result from a change in temperature and hence resistance of the armature
coil, the temperature was kept constant by injecting compressed air into
the motor. The motor temperature was measured by a thermocouple
attached to an amplifier and digital voltmeter.
A diagram of the electrical circuit is presented in figure 3.
The net power consumed during conditioning was determined
by measuring the total power consumed and subtracting the idling power (23)
losses and ohmic losses under load. The net power consumption was
the product of the armature current and voltage whilst the ohmic loss
was the product of the armature resistance and the square of the armature
current. Idling power losses were determined in a series of preliminary
experiments described in the appendix. _
3.5 Experimental Procedure
A 1.1 Kg. sample of ore (minus 1.7 mm) was ground in a rod
mill at 501o solids for 3,0 minutes and at the end of this period the ore
was essentially 95T6 minus 210 pm. The size distribution of the ground
ore shown in Table 3 is similar to the -uriderslimed feed used in the plant
at Titania A/S.
The Ground ore (pulp) was deslimed by standardised settling
and syphoning and was later transferred to the conditioning cell where
the pulp density was adjusted as required. The desliming procedure

-38-
Figure 3 Electrical Circuit of Test Assembly for Conditionin
if
Al
t
Mains Supply
4.7 K
Tachogenerator coil
if field current -II, I
Ia armature current
it tachogenerator current
Vf field voltage
Va armature voltage
The tachogenerator current was calibrated against motor
speed with a stroboscope.
-39-
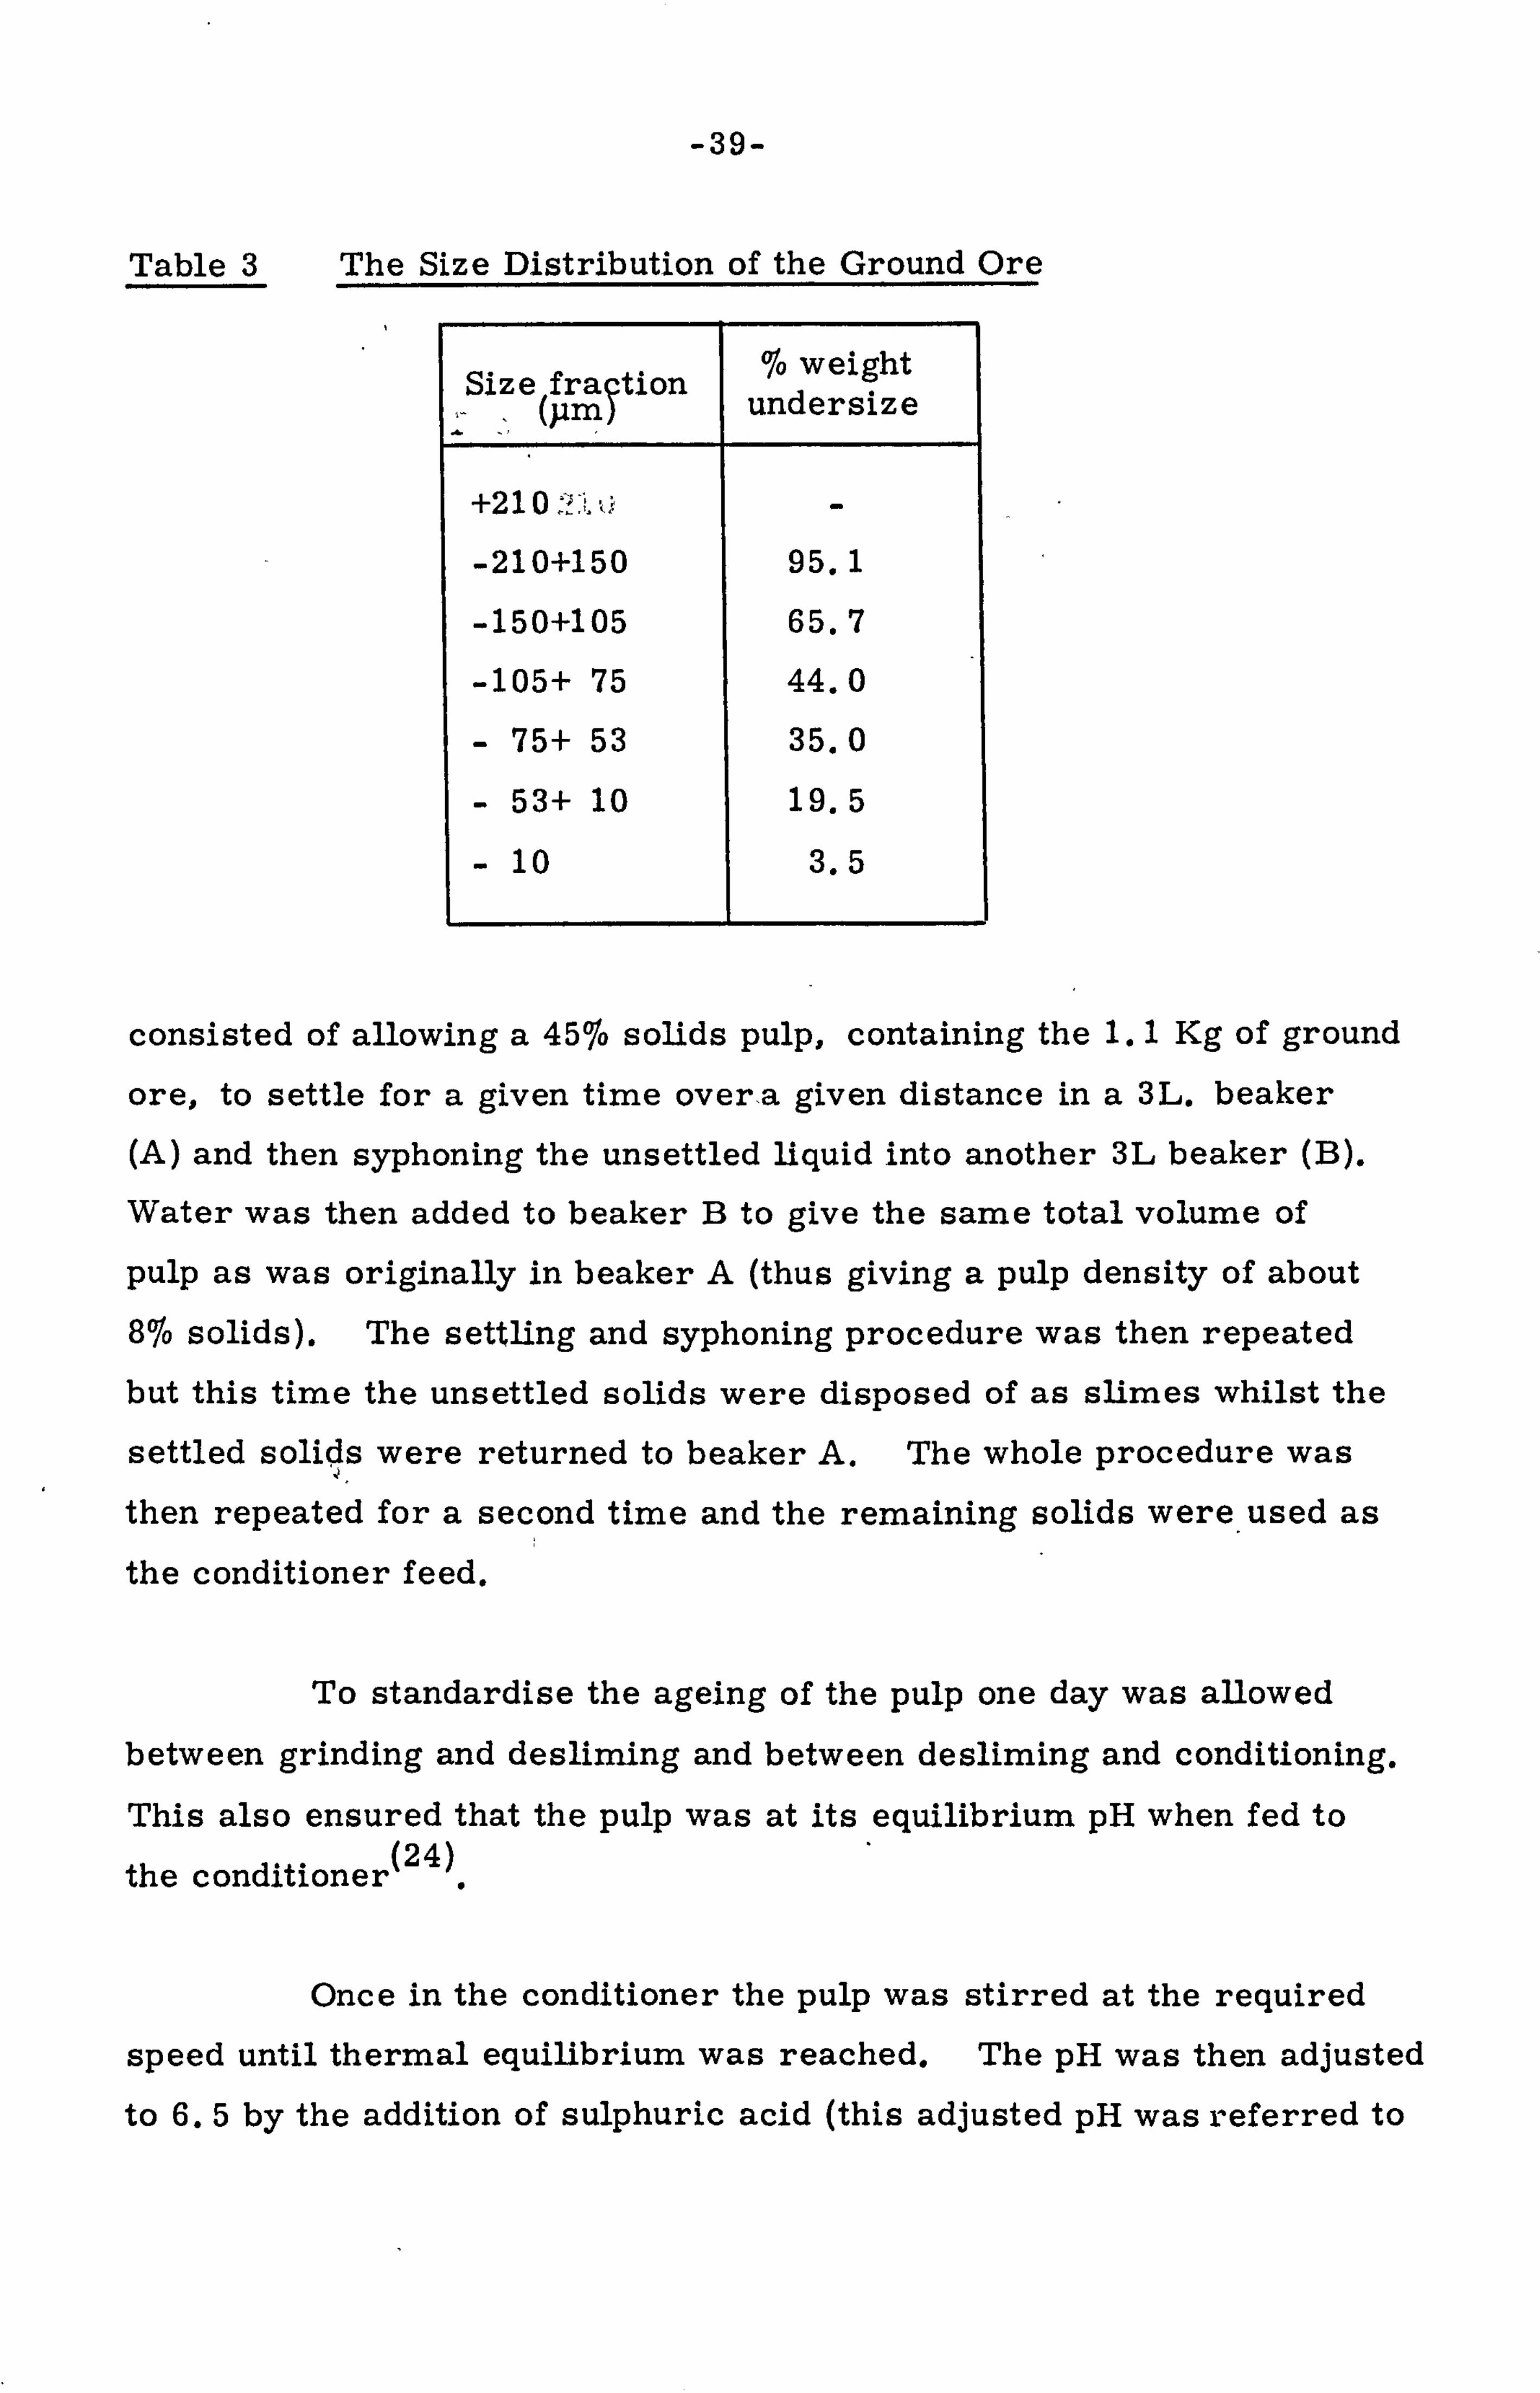
Table 3 The Size Distribution of the Ground Ore
Size fra (Jamýtion
% weight undersize
+210
-210+150 95.1
-150+105 65.7
-105+ 75 44.0
- 75+ 53 35.0
- 53+ 10 19.5
- 10 3.5
consisted of allowing a 4576 solids pulp, containing the 1.1 Kg of ground
ore, to settle for a given time over, a given distance in a 3L. beaker
(A) and then syphoning the unsettled liquid into another 3L beaker (B).
Water was then added to beaker B to give the same total volume of
pulp as was originally in beaker A (thus giving a pulp density of about 816 solids). The settling and syphoning procedure was then repeated but this time the unsettled solids were disposed of as slimes whilst the
settled solids were returned to beaker A. The whole procedure was
then repeated for a second time and the remaining solids were used as
the conditioner feed.
To standardise the ageing of the pulp one day was allowed
between grinding and desliming and between desliming and conditioning.
This also ensured that the pulp was at its equilibrium pH when fed to (24)
the conditioner
Once in the conditioner the pulp was stirred at the required
speed until thermal equilibrium was reached. The pH was then adjusted
to 6.5 by the addition of sulphuric acid (this adjusted pH was referred to

-40-
as the 'initial' pH),. Thirty seconds after the pH had been adjusted the
desired amount of collector was added by burette--. to the vortex centre of
the stirred pulp. During conditioning the armature voltage and current
were measured at frequent intervals. As conditioning progressed the
pulp pH gradually increased to between 7.5 and 8.3 depending on the
total conditioning time.
After the required conditioning time the pulp was transferred
to the flotation cel-1, diluted to 3076 solids with demineralised water at
pH 8.0 and the desired temperature, agitated for 1 minute with the air
inlet valve closed, and then floated. Flotation was carried out to the visual
end point as judged by the appearance bf a barren froth. The flotation
products were dried, weighLad, sampled and then assayed for titanium by
the procedure outlined in section 3.6. The percentage ilmenite was
calculated from the titanium content on the basis of an ilmenite composition
represented by FeTiO 3'
3.6 Analysis for Titanium
The procedure for determining the titanium content of various
samples consisted of dissolving 0.6g of pulverised sample in 100 cm 3
of
concentrated hydrochloric acid at 90 0 C. The resulting solution was diluted
with a solution containing 1. OM HCl and 2,000 ppm. Fe to a concentration
suitable for determination with a Perkin-Elmer 290B atomic absorption
spectrophotometer. Iron was added in excess to the solutions to prevent
interference from iron already in solution as a result of the ilmenite
dissolution. Titanium standards were prepared by dilution of a B. D. H.
volumetric standard solution of titanium sulphate with solutions of 1. OM
HCl and 2000 ppm Fe.

-41-
A head assay of 18,316 TiO 2 was obtained with this procedure
and this value compares favourably with 19.016 determined by Titania
AIS and 17.11% determined by the Analytical Services Laboratory at
Imperial College. The latter two values were determined by classical
wet methods involving a fusion stage.
The procedure was tested on two concentrate and two tailing
samples provided by Titania AIS. A comparison of the results is shown
in Table 4.
Table 4 Comparison of assay values determined by the
atomic absorption analytical procedure and
those determined by Titania A/S
TiO 2 To by TiO 2
To by Sample
atomic Titania A, /S adsorption
Conc. 1 42.7 43.5
Conc. 2 43.0 42.6
Tail 1 6.8 7.3
Tail 2 4.6 4.7
A fusion technique is used by Titania A/S to ensure that any
acid insoluble TiO 2 in the ore is not ignored in the analytical procedure.
The fact that such good agreement was obtained with the different techniques
indicates that there is very little acid insoluble TiO 2 in the Titania AIS
ore.

-42-
4 RESULTS
4.1 Prelimtnary Testwork
Preliminary testwork was carried out to determine.: -
a) the most suitable stirrer design and stirrer speed
for use in the conditioning tests,
the variation of power consumption with the stirrer
speed and pulp density. -, -t
c) the reproducibility of the experimental technique.
The ground ore used in these tests was deslimed at a particle
size of approximately 10, pm; this corresponded to the removal of about 20g of slimes. On the basis of the results obtained by Lapidot(8) a
collector mixture of kerosene and oleic acid (1: 1mixture by weight) and an initial pH of 6.5 were used for this testwork.
4.1.1 Variation of power consumption with type of stirrer, stirrer
speed and pulp density (in the absence of collector)
Tests were carried out to determine the type and size of
stirrer that would agitate an ilmenite ore pulp of 7016 solids (by weight)
over a wide range of speed. For each stirrer there was an upper and
lower speed limit. At high speeds, air intake at the stirrer blade plane
caused excessive fluctuation of the stirrer speed and power consumption,
whilst at low speeds the pulp was stirred inadequately and the solids settled
out. A stirrer (Sl) was chosen because of the relatively large speed
range between these limiting conditions. A diagram of this stirrer is
shown in figure 4a.

-43-
Figure 4a Stirrer Sl
25ý11 0 2 O'j
;r0.25"_, '1200
Figure 4b Stirrer S2
511 '11/1
-44-
The variation of net power consumption with stirrer speed at different pulp densities was determined in the absence of collector. The
results obtained are presented in figure 5 and show that the net power
consumption at a given pulp density. increased almost linearly with
stirrer speed, furthermore an increase in pulp density from 65. Ojo to
72.2% solids produced an increase in power consumption. This latter
point is illustrated more dlearly in figure 6 which shows that for a given increase in pulp density the resultant increase in power consumption was
greater at a high stirrer speed than at a low stirrer speed.
4.1.2 The reproducibility of the conditioning procedure
Three conditioning tests were carried out under almost identical
conditions. A collector dosage of 2.1 g/kg. was chosen as it gave a large power peak without excessive flocculation and resultant floc
settlement. The results are presented as power curves (net power
consumption -vs, conditioning time) in figure 7 and show good reproducibility. The shape of these power curves was basically the same as that observed by Lapidot and Mellgren(9) (figure 1). Each curve consisted of a short induction period where the power consumption did not change, a flocculation
period where the power increased as the pulp flocculated, a flocculation
peak where the power remained at a maximum and a deflocculation period
where the power returned to its original value as the pulp defloc culated. The duration of the flocculation peak in figure 7 was considerably longer
than that observed by Lapidot and Mellgren (9)
and the difference is
probably attributable to the very high collector dosage used in these
preliminary tests.

-45-
Figure 5 Power Consumption versus Stirrer Speed at Different Pulp Densities in the Absence of Collector
0
0
: i3 ri 0 C)
a) 0
4-a
a)
1
0
IIII
72.2 % sotids, 69.5-%
- . 0. " 65.0 %
200 300 400 500 600 700
Stiii6ý iiýed'(r-piii)"'
Figure 6 Power Consumption versus Pulp Density at Different Stirrer Speeds in the Absence of Collector
5
r-
91 0
:s
0
0 04
4a Q)
z 1
600 r. p. m. '
'01 500
4 00
300
62. "5- 65 67.5 70'- ' 72.5
Pulp density solids)

-46-
Figure 7 Power Consumption versus Conditioning Time at Constant Solids Weight (W), pulp Density (P), Collector Dosage Stirrer Speed (S) and pH.
zu
17.5
0 -4 15
0 Q 12.5
0 P4
4ý (D
: 2; lo
7.5
w 10809 P 7016 solids c 2.1 glKg S 600 rpm PH 6.5
0 20 40 60 80 90 loc
Conditioning time (min. )
Figure 8 Power Consumption versus Conditioning Time at Various Pulp Densities for Constant Solids Weight, Collector Dosage, Stirrer Speed and pH.
25
0 0 -. 4
20
w
15
10
72.2 solids'
69.5%
W 1080 c 2.1 glKg 640% s 600 rpm pH 6.5
iIII
0 20 40 60 80 100 120
Conditioning time (min. )
-47-
4.1.3 The effect of pulp density, collector dosage, and stirrer
speed on the power consumption curve
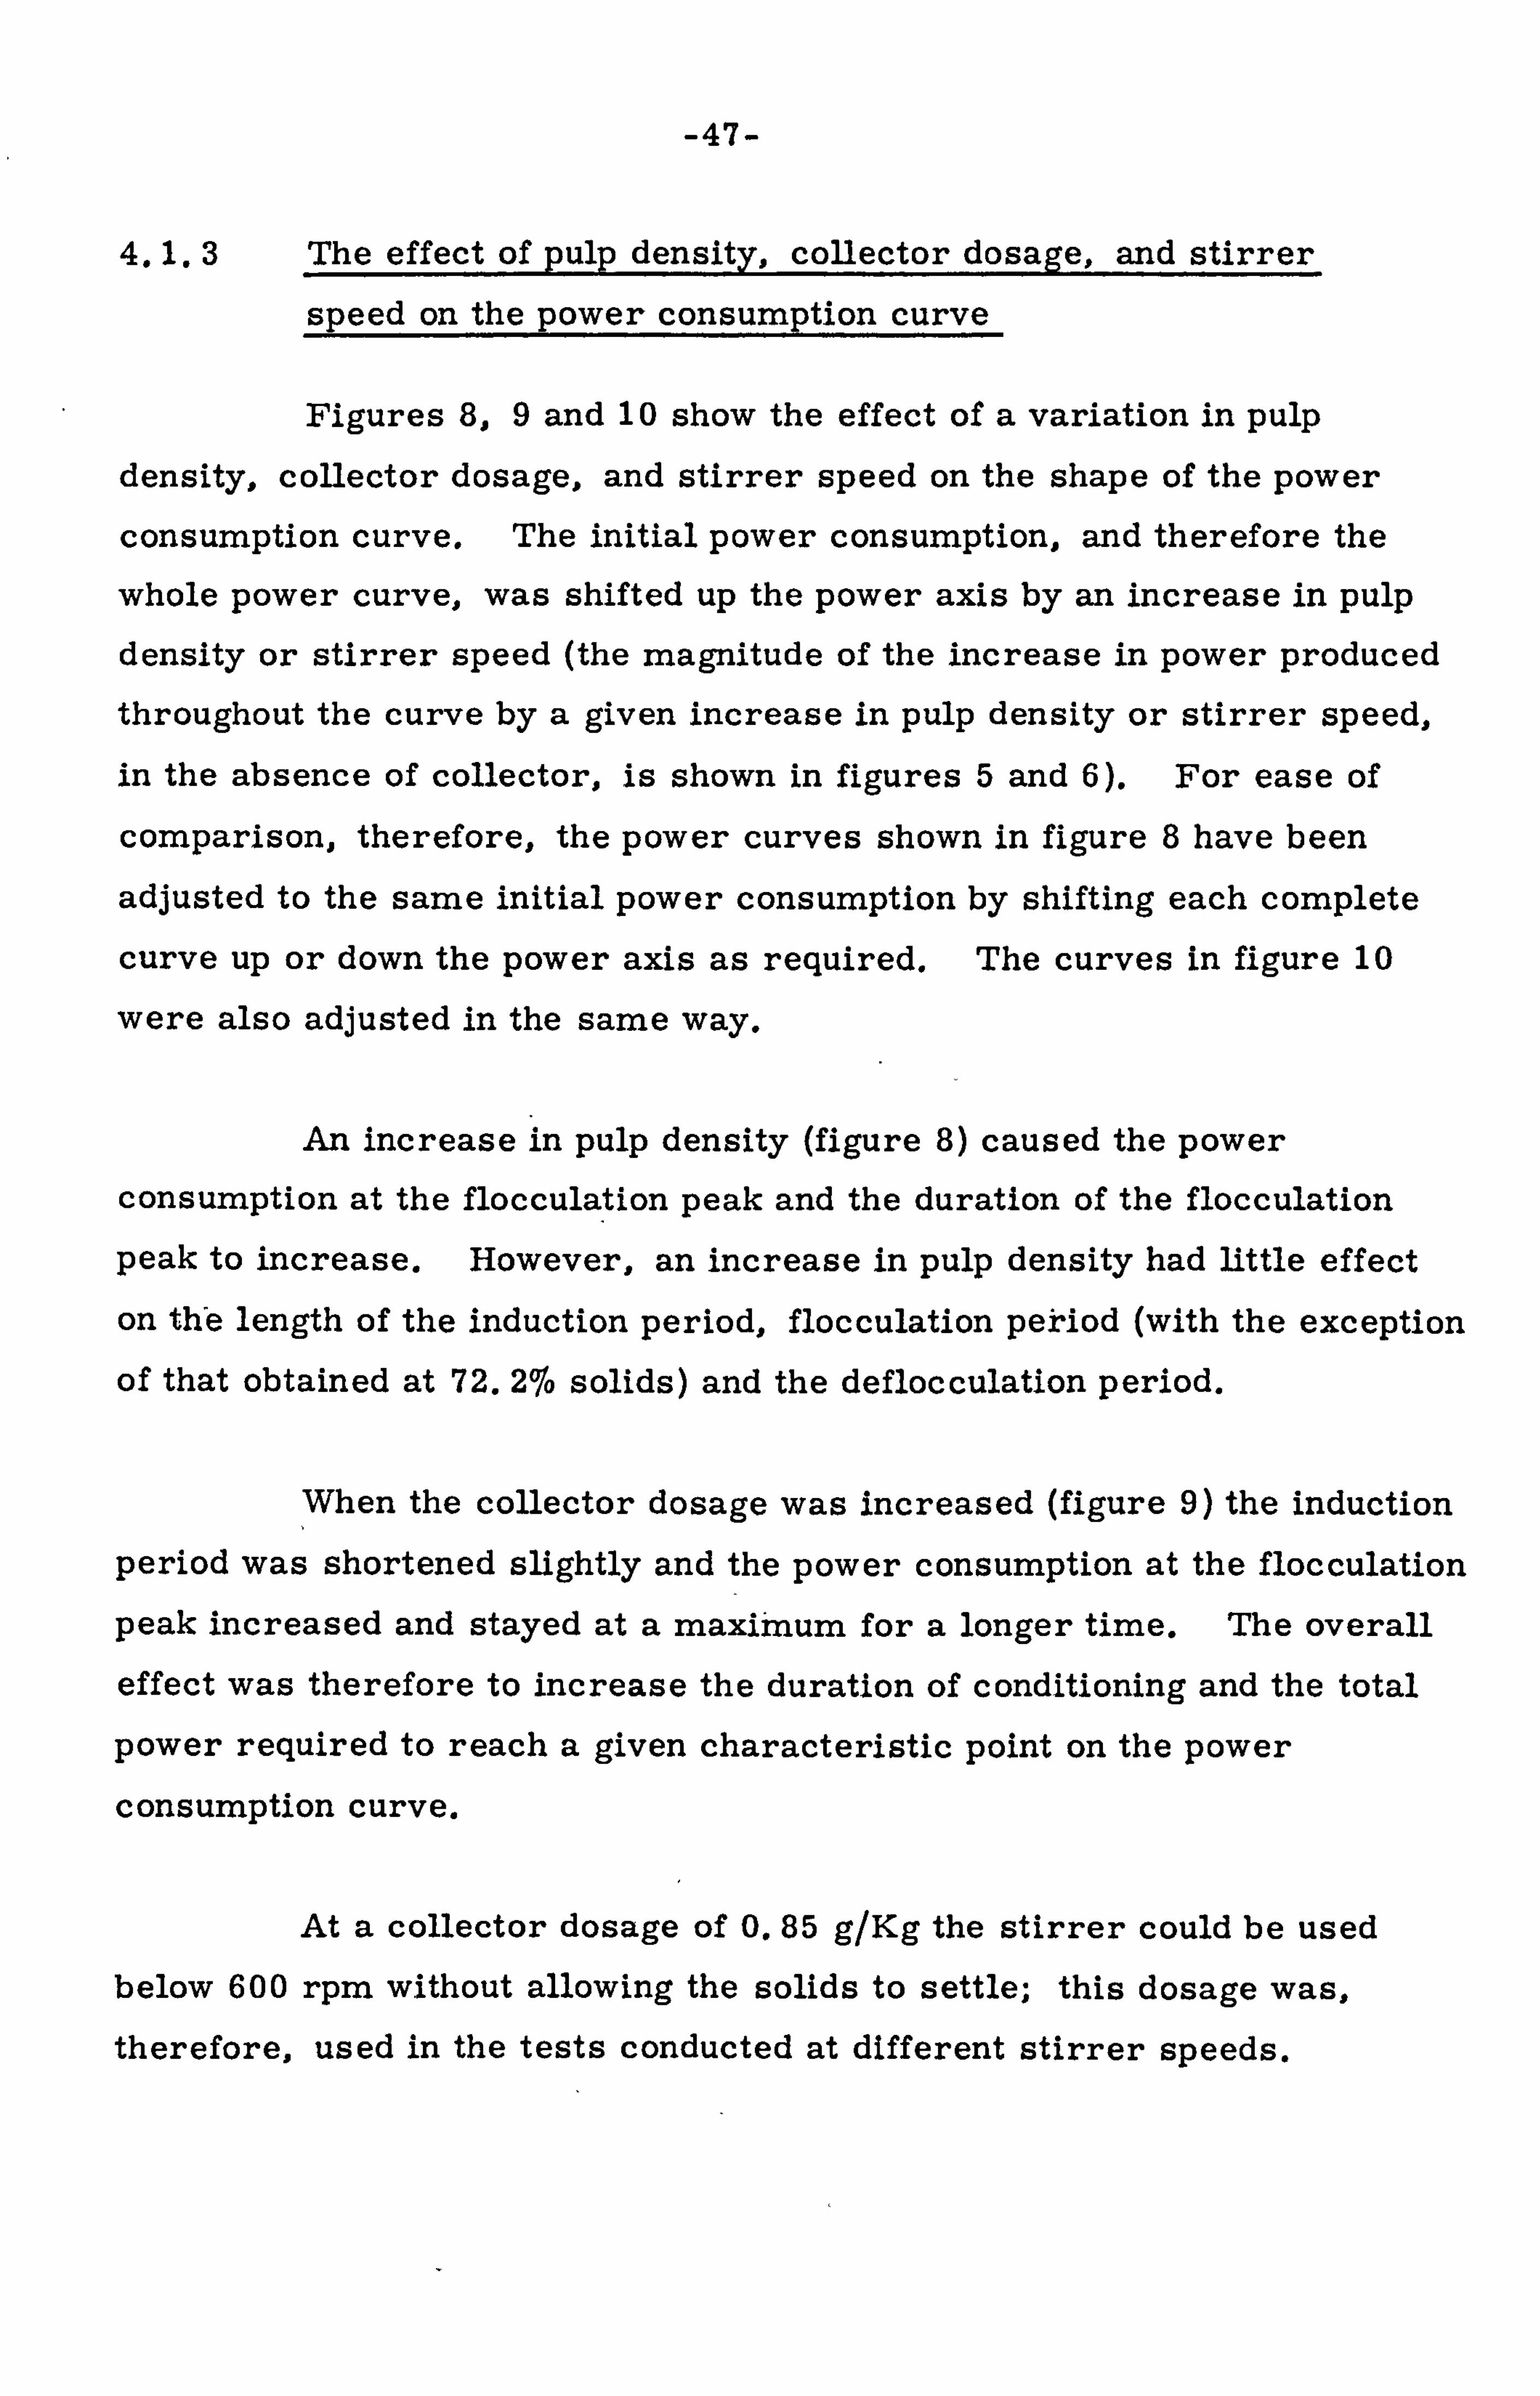
Figures 8,9 and 10 show the effect of a variation in pulp
density, collector dosage, and stirrer speed on the shape of the power
consumption curve. The initial power consumption, and therefore the
whole power curve, was shifted up the power axis by an increase in pulp density or stirrer speed (the magnitude of the increase in power produced
throughout the curve by a given increase in pulp density or stirrer speed,
in the absence of collector, is shown in figures 5 and 6). For ease of
comparison, therefore, the power curves shown in figure 8 have been
adjusted to the same initial power consumption by shifting each complete
curve up or down the power axis as required. The curves in figure 10
were also adjusted in the same way.
An increase in pulp density (figure 8) caused the power
consumption at the flocculation peak and the duration of the flocculation
peak to increase. However, an increase in pulp density had little effect
on the length of the induction period, flocculation pekiod (with the exception
of that obtained at 72.216 solids) and the deflocculation period.
When the collector dosage was increased (figure 9) the induction
period was shortened slightly and the power consumption at the flocculation
peak increased and stayed at a maximum for a longer time. The overall
effect was therefore to increase the duration of conditioning and the total
power required to reach a given characteristic point on the power
consumption curve.
At a collector dosage of 0.85 glKg the stirrer could be used below 600 rpm without allowing the solids to settle; this dosage was,
therefore, used in the tests conducted at different stirrer speeds.

-48. -
Figure 9 Power consumption, versus conditioning time at different collector dosages for constant solids weight, pulp density
17.5
0 -4 41 04
12.5 0 u ý4
0
10
z
7.5
Zl gl kg
1.75 ýg1 kg
1.4
0., b5. cjlkg 0 20 40 60 80 -1 100 -120
Conditioning, time (Min. )
Figure 10 Power consumption versus conditioning time at different stirrer speeds, for constant solids weight, pulp density, coHector dosage and pIL-
17.5 0 04
15 0 C. )
12.5
10
W= 1080g P= 7016 solids C=0.85g/Kg pH = 6.5
600 rpm.
400 rpm. 500 r. prrj
0 20 40 60 80 100 120 Conditioning time (Min. )

-49-
Figure 10 shows that as the stirrer speed was increased the
height of the flocculation peak increased whereas the duration of the induction
and deflocculation periods decreased. The total power consumed by
conditioning to the end of the deflocculation period was determined by
integration and was found to be more or less the same at each stirrer
speed.
4.1.4 Flotation response
A number of conditioning tests were conducted on similarly
prepared pulps at 7016 solids and for each test the conditioning was stopped
at a different point on the power consumption curve. The results of
the flotation tests carried out at these points and at a collector dosage of 1.4 glKg are shown in figure 11. The power consumption curve is also
shown in this figure to allow comparison of the flotation response with
the conditioning time on the power consumption curve.
During the induction period the recovery of ilmenite was low
and there was very little selectivity. At the start of the flocculation
period, however, an increase in the power consumption was accompanied by an increase in recovery while the grade of the flotation concentrate
remained constant. At the flocculation peak both the recovery and power
consumption reached a maximum but the grade was still unchanged.
Maximum grade was obtained only after the power consumption had decreased
and the pulp had deflocculated. Conditioning beyond this point decreased
the ilmenite recovery but did not change the grade.
These results are consistent with those of Lapidot and Mellgren(9).
In their work flotation tests carried out at the end of the deflocculation
period (here called the deflocculation end point) gave a maximum

-50-
Figure 11 Ilmenite grade and"recovery as a function of conditioning time
Solids weight (W) = 1080g Stirrer speed (S) = 600 rpm Pulp density (P) = 7016 solids Collector dosage (C) 1.4g/Kg
100
80
Tj o, 6
> 40 0
'20
0
pn = D. D
15
0
12.5
0
10.0-
0
04
z
7. -5
Conditioning time (min. )
Figure 12 Ilmenite grade and recovery as a function of collector dosage. (20g solids removed by desliming)
80
60
40 "0 Cd
20 0 C. ) Q) C4
grad e
recovery
W= 1080g P= 7016 solids S= 600 rpm pH 6.5
0 0.8 1.0 1.2 1.4 1.6
Collector dosage (g/Kg)

-51-
concentrate grade at an almost maximum ilmenite recovery. They also
showed that if the pulp was conditioned to the same point on the power
consumption curve the same flotation results were obtained irrespective
of pulp density and stirrer speed.
The effect of collector dosage on ilmenite flotation was determined
by conducting flotation tests after conditioning, at various collector dosages, for times corresponding to the deflocculation end point. The
results of these tests are shown in figure 12. An increase of the collector
dosage increased both the recovery and grade to maxima., of B. 076'and
57jo respectively at a collector dosage 1.4 g/Kg. These results are
similar to those of Lapidot and Mellgren(9) except that they obtained a
grade of 67% ilmenite. A possible explanation for this difference in
grade is that the slimes content of the pulp used in the current work was (9)
different to that in the work of Lapidot and Mellgren
4.1.5 The effect of slimes on flotation
To determine whether or not the slimes content of the pulp had a significant effect on the power consumption and flotation results, tests were conducted on pulps from which was removed 80g instead of 20g. The new pulp therefore contained 1020g instead of 1080g of solid.
To maintain the pulp density of 7076 solids the quantity of water added to
the conditioner was reduced accordingly.
Flotation tests were carried out with the new deslimed feed
at a number of points along the power consumption curve and at various
collector dosages. The power curves are presented in figure 13. A-
comparison of curves A and B in this figure shows that for a collector dosage of 1.2 glKg the power consumed at the flocculation peak for the
feed with 80g of slimes removed was higher and it extended over a much longer period than for the feed with 20g of slimes removed. This suggests

I
Figure 13 Power consumption- versus conditioning time at varioiis collector dosages for a solids weight of 1020g (80g of solid removed by desliming). (except in ciirve B
S6 00 rpm_ P* 70% solids pH =-, 6.5
16
14
12
"lo
6
-52-
32 g/kg, 0.6 (l 020 g) 0.5
C 'ditioning time (min. ) on

-53-
that a decrease in the slimes content of the pulp produced an increase in
the degree of flocculation.
Flotation tests were conducted on the 1020g pulps conditioned
to the deflocculation end point at different collector dosages. The results
are presented in figure 14. Comparison of figure 14 with figure 12 shows
that by removing 60g more slimes the maximum concentrate grade was
increased from 57jo to 6416 ilmenite and the recovery from 8016 to 9076.
Furthermore, the collector dosage required for maximum grade was
decreased from 1.4 to 0.72 glKg. The flotation results obtained with
the 1020g pulp were better than those with the 1080g pulp and were similar
to those of Lapidot and Mellgren(9). Consequently a collector dosage of
0.72 glKg and a 1020g solids pulp were used in future tests.
4.1.6 Reproducibility of the power curves in relation to flotation
response
Flotation tests conducted at the deflocculation end point are
done under the most favourable conditions for a maximum concentrate
grade and recovery. Consequently the deflocculation end point corresponds
to the best conditioning time at which to study the effect of such variables
as collector dosage, temperature etc. It is therefore necessary to
determine the position of the deflocculation end point accurately. However,
the conditioning and flotation tests on the 1020g pulps showed that although
the induction period, flocculation period, and flocculation peak were
reproducible, the position of the deflocculation end point was not. This
is demonstrated by the results in figure 15.
Comparison of the results presented in figures 9 and 13 shows
that the removal of more slimes made the power consumption curves more
sensitive to a variation in collector dosage. The irreproducible position

-54-
Figure 14 Ilmenite grade and recovery as a function of coUector dosage (80g of solid removed by desliming)
80
60 10 Cd
40
20
grade
W 1020g P 7016 solids
recovery S 600 rpm PH 6.5
0.4 0.6 0.8 1.0 1.2 1.4 Collector dosage (glKg)
Figure 15 Power consumption versus conditioning time for a number of supposedly identical tests. -
10
09
E
0 C)
a) 0
4. )
a) z
6
W 1020g P, 7076 solids S 600 rpm
IV- -- C=0.72 glKg. pH 6.5
0 10 20 40 60 80 Conditioning time (min. )

-55-
of the deflocculation end point was therefore thought to be related to
the system's sensitivity to small changes in pulp density and slimes content.
Two different stirrers Sl and S2 (shown in figures 4a and 4b)
were used for these tests. Stirrer S2 was used because in the preliminary
tests it produced sharper and higher power consumption curves although
only over a narrower speed range than Sl. It was thought that a sharper
power curve might permit easier location of the deflocculation end point.
The variation in slimes content of the pulps was minimised by
using a slightly modified desliming procedure; the settling and syphoning
was carried out at a constant temperature and was, using beakers A and
B, performed 3 times instead of 2 times. The weight of solid removed
in this modified procedure was 90g.
4.1.7 The effect of small changes in pulp density on the reproducibility
of the power consumption curves
To determine the effect of small changes in pulp density on the
power consumption curves it was necessary to ensure that there was a
constant weight of solids added to the conditioner after desliming.
Unfortunately there was no simple way of doing this because after desliming
the pulp was wet and the dry solids weight could not be determined
directly, furthermore it was considered undesirable to dry the pulp because
of the possible changes in the surface chemistry of the minerals. A
number of conditioning tests were therefore conducted and the solids weight determined after each test. Only the results of those tests containing the
same amount of solids were compared.

-56-
In figure 16 the power consumption curves are shown for tests
with pulps of density approximately 68.8% and in figure 17 three more
curves are shown but for pulps of density 68.2%. A comparison of these
two figures shows that a change of pulp density from 68.216 to 68.8% had
a marked effect on the power consumption. A slight variation in the pulp
density is therefore likely to have a noticeable effect on the power curves.
Similar results were obtained with stirrer S2 as is demonstrated
by figures 18 and 19. Despite the more accentuated power peak with
stirrer S2 location of the deflocculation end point was still difficult and
there was no improvement in reproducibility.
Each of the conditioning tests shown in figures 16 to 19 was
terminated at what was thought to be the deflocculation end point. The
results ofthe flotation tests carried out at these points are given in the
relevant figures and show that, although the ilmenite grades were more
or less the same, the recoveries varied considerably. These results
clearly show the effect of not locating the deflocculation end point
accurately.
A statistical analysis was carried out to determine whether
or not the curves obtained with a pulp containing 101 Og of solid were more
reproducible than those obtained (figure 15) with the 1020 g of solid.
The IF test' was used to compare the mean variance and pooled variance
at a number of points along the power curve. The results showed that
there was no significant improvement of the reproducibility.
4.1.8 The desliming procedure
In each conditioning test water was added after desliming to
give the required pulp density. The amount of water added was based

-57-
Figure 16 Power consumption'versds'conditioni-ng time'-for'almost identical tests with stirrer, Sl (P= 68.8% solids)
10 1aIIII
9
0 04
z
5
w lolog S 600 rpm C, =-0.72 glKg - PH = 6.5
Curve O/osolidý Grade Red. 1 68; 7 62 71 2 68.9 61 71 3 68. -8 61 60
05 10 15 20,25
Conditioning time (min. )
Figure 17 Power consumption versus 'conditioning time for almost identical tests with stirrer Sl. P= 68.216 solids
7.
0
Z 02 r3
0 CIO 44 a)
z4
05 10 ,, -_ -1
5. _-, ,, --
20-, _
25- 30 Conditioning time (min. )
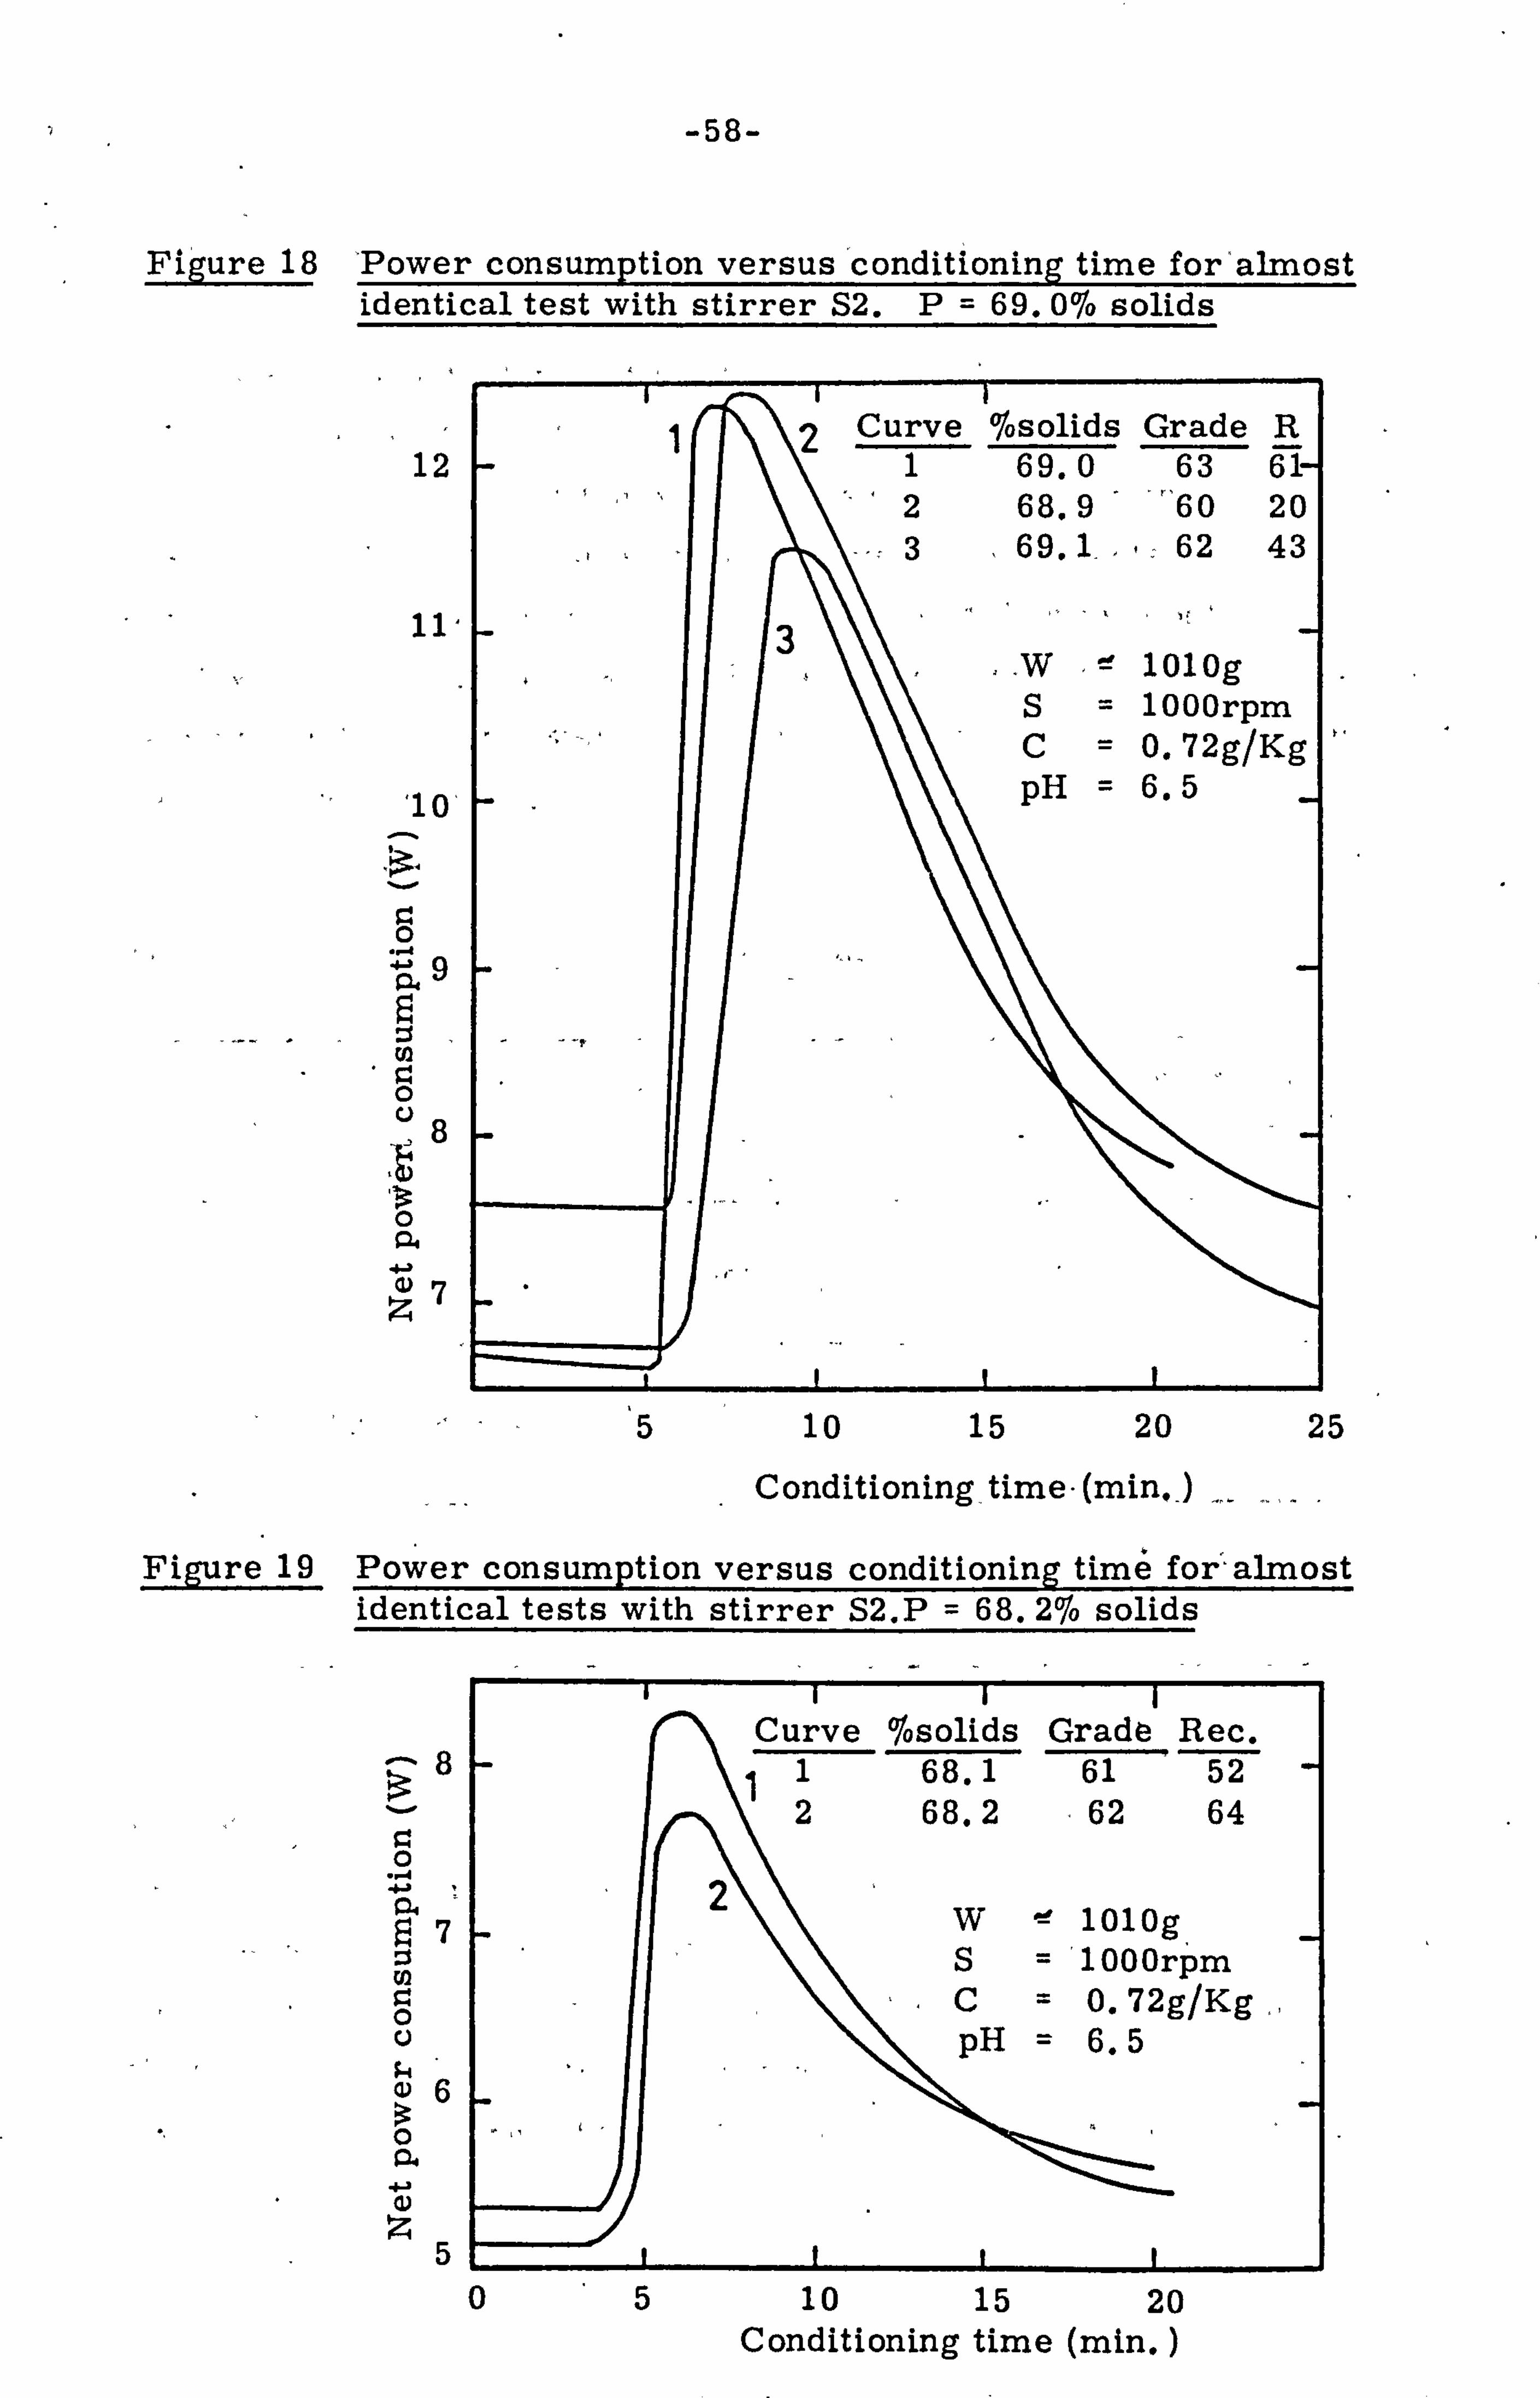
Figure 1 'Power consumption versus 'conditioning time for'almost
12
'10
: 5Z r. 0
-4 . 5.9
0
0 P4
44 , 7 z
1 Curve %solids urve 2 S! lu -rv
e Grade R ý 1 1 69.0 63 61- 2 2 68.9 "'60 20 3 3 69.1 62 43
\
W lolog S 10OOrpm C= 0.72g/Kg pH = 6.5
-4
5 10 15 20 25
Conditioning- time- (minj
Figure 19 Power consumption versus conditioning tim6 for'almost identical tests with stirrer S2. P = 68.276 solids
0
C', 0 0
5 05 10 15 20
Conditioning time (min. )

-59-
on the assumption that a standard amount of solid had been removed. The
reproducibility of the desliming procedure was therefore assessed by
considering the actual weight of slimes removed in all the tests done with
pulps containing 1080,1020, and 1010g of solid. From the variation about
the mean solid content of the pulp the resultant variation in pulp density
was estimated. The results of this analysis are presented in table 5 and
show that in the preliminary testwork (section 4.1) where only 20g of
solid was removed, there was little variation in both the amount of slimes
removed and the pulp density. Under these conditions good reproducibility
was obtained (figure 7).
Table 5 Analysis of the Desliming Results
-Solids Remaining Variation about Corresponding
after desliming mean wt variation about mean
mean wt. (g) . pulp density
1 080 (20g removed) 1001o 2g ±0.131o
1020 (80g removed) 90% 5g 701 3
±0.34% ±0 2% 6 g .
1010 (90g removed) 7376 5g 6976 3
±0.3476 ±0 2 0/6 g .
However, when 80g or 90g of solid was removed there was
a marked variation in pulp density (0.2 - 0.3416). This variatiom in
comparison *itli th4S results shown in figures 16 and 17, would clearly be large enough to affect the conditioning curve and thus prevent accurate location of the deflocculation end point. The results in table 5 also
show that the modified desliming procedure (90g removed) was not an improvement on the earlier one in which 80g of solid were removed.

-60-
To determine the effect of a variation in desliming a number
of conditioning tests were performed on pulps that had been deslimed
after slightly different settling times. The results are presented in
figure 20 and show the combined effect of a change in slimes content and
pulp density. Curves 2 and 3 are not markedly different and therefore show
that, to some extent, the effect of a change in slimes content is probably
counter balanced by the resultant change in pulp density. Curve 1,
however, is markedly different in that the induction period is completely
removed; this is not surprising in view of the large quantity of slimes
removed and the accompanying reduction in total mineral surface area.
4.1.9 Conclusion
To obtain a high grade and recoverydn the flotation of ilmenite
with an oleic acid - fuel oil collector it is necessary to deslime the pulp
thoroughly. Under such conditions the various stages in the conditioning
cycle, as determined by a power consumption curve, are highly sensitive
to small variations in pulp density. The unavoidable variation in the
amount of slimes removed during desliming, although small, is large
enough to produce a significant change in pulp density which results in
poorly reproducible power consumption curves. Such irreproducibility
of the power curves prevented location of the deflocculation end point by
reference to conditioning time alone. Some alternative method is
required.
4.2 Conditioning and Flotation at Room Temperature (20 0 C)
4.2.1 The presentation of flotation results
The problems encountered in determining the deflocculation
end point were overcome by presenting the flotation results, obtained at
various points along the conditioning curve, in the form of a percent

-61-
Figure 20 Power consumption versus conditioning Aime-for pulps, deslimed after slightly different settling times '(conditioned with stirrer S2)
12
10
6
Curve %solids solids wt. u u r 67.4 986g
2 69.7 1020g 3 69.1 1012g
S 10OOrpm p C 'ýý -0.72 g/Kg '
pH 6.5
05 10 15 20 25 Conditionirig tiMe (mins)
-62-
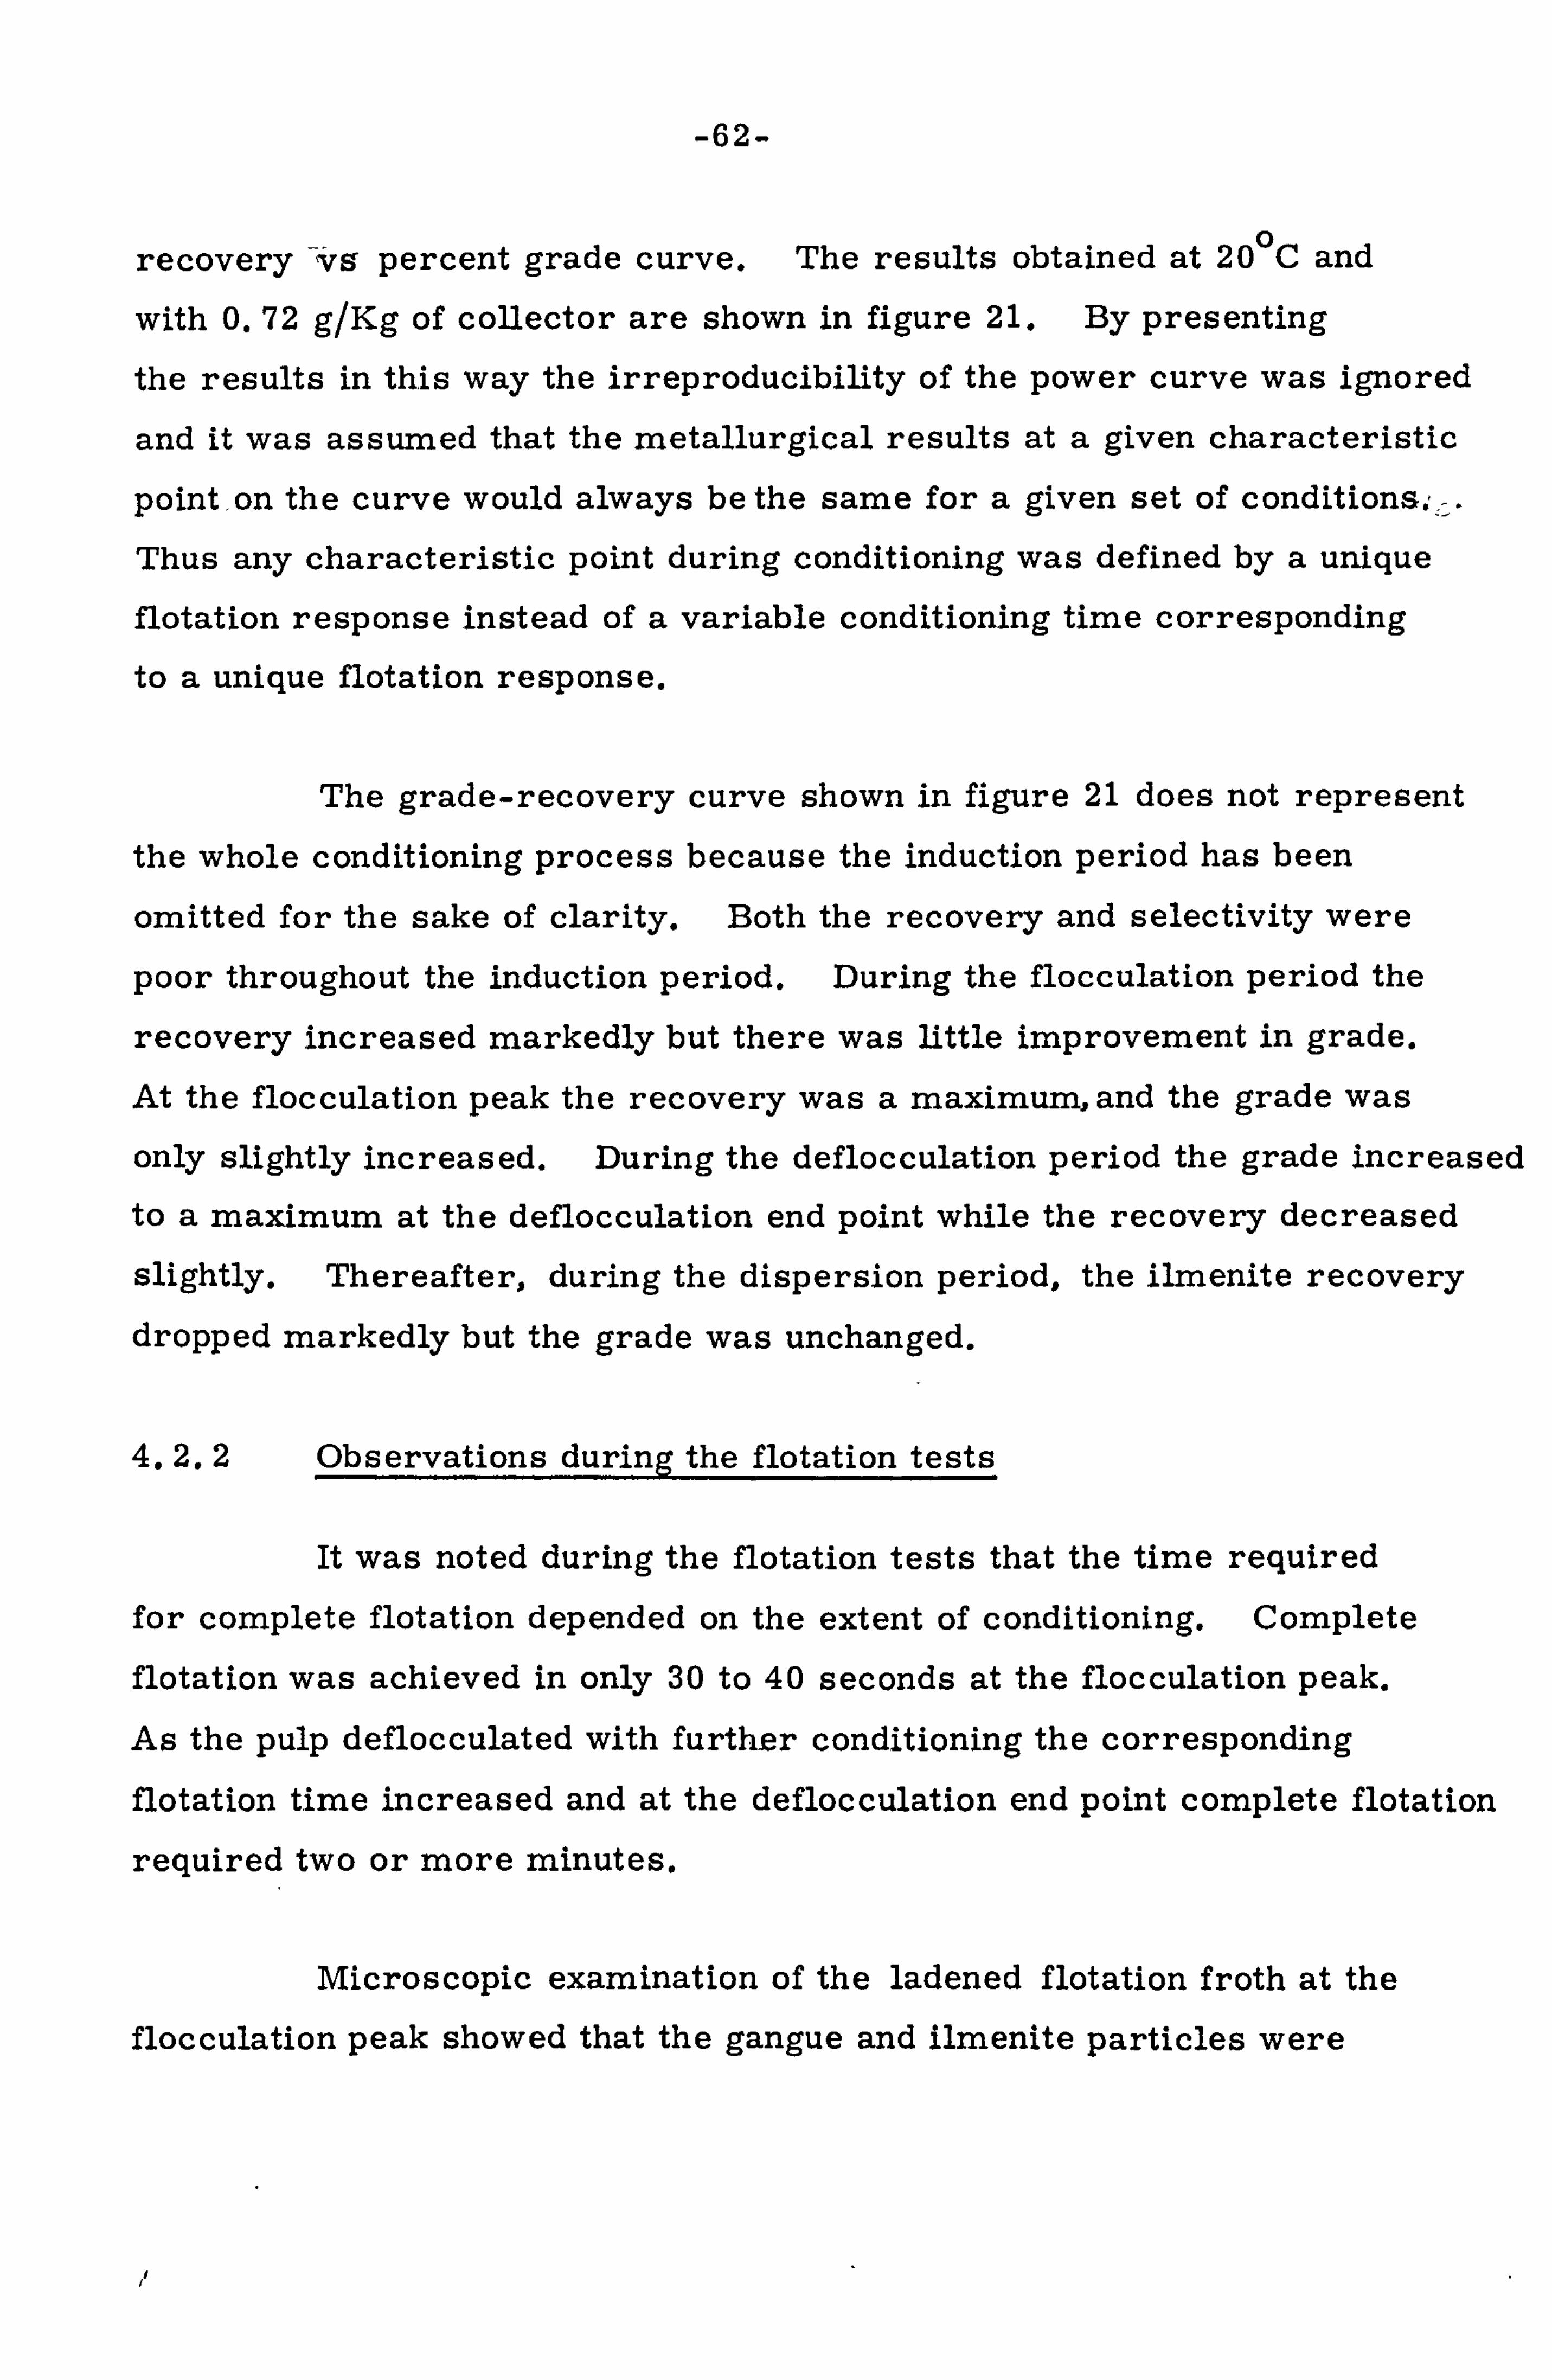
0 recovery vg percent grade curve. The results obtained at 20 C and
with 0.72 glKg of collector are shown in figure 21. By presenting
the results in this way the irreproducibility of the power curve was ignored
and it was assumed that the metallurgical results at a given characteristic
point, on the curve would always be the same for a given set of conditions,. ý, -. Thus any characteristic point during conditioning was defined by a unique
flotation response instead of a variable conditioning time corresponding
to a unique flotation response.
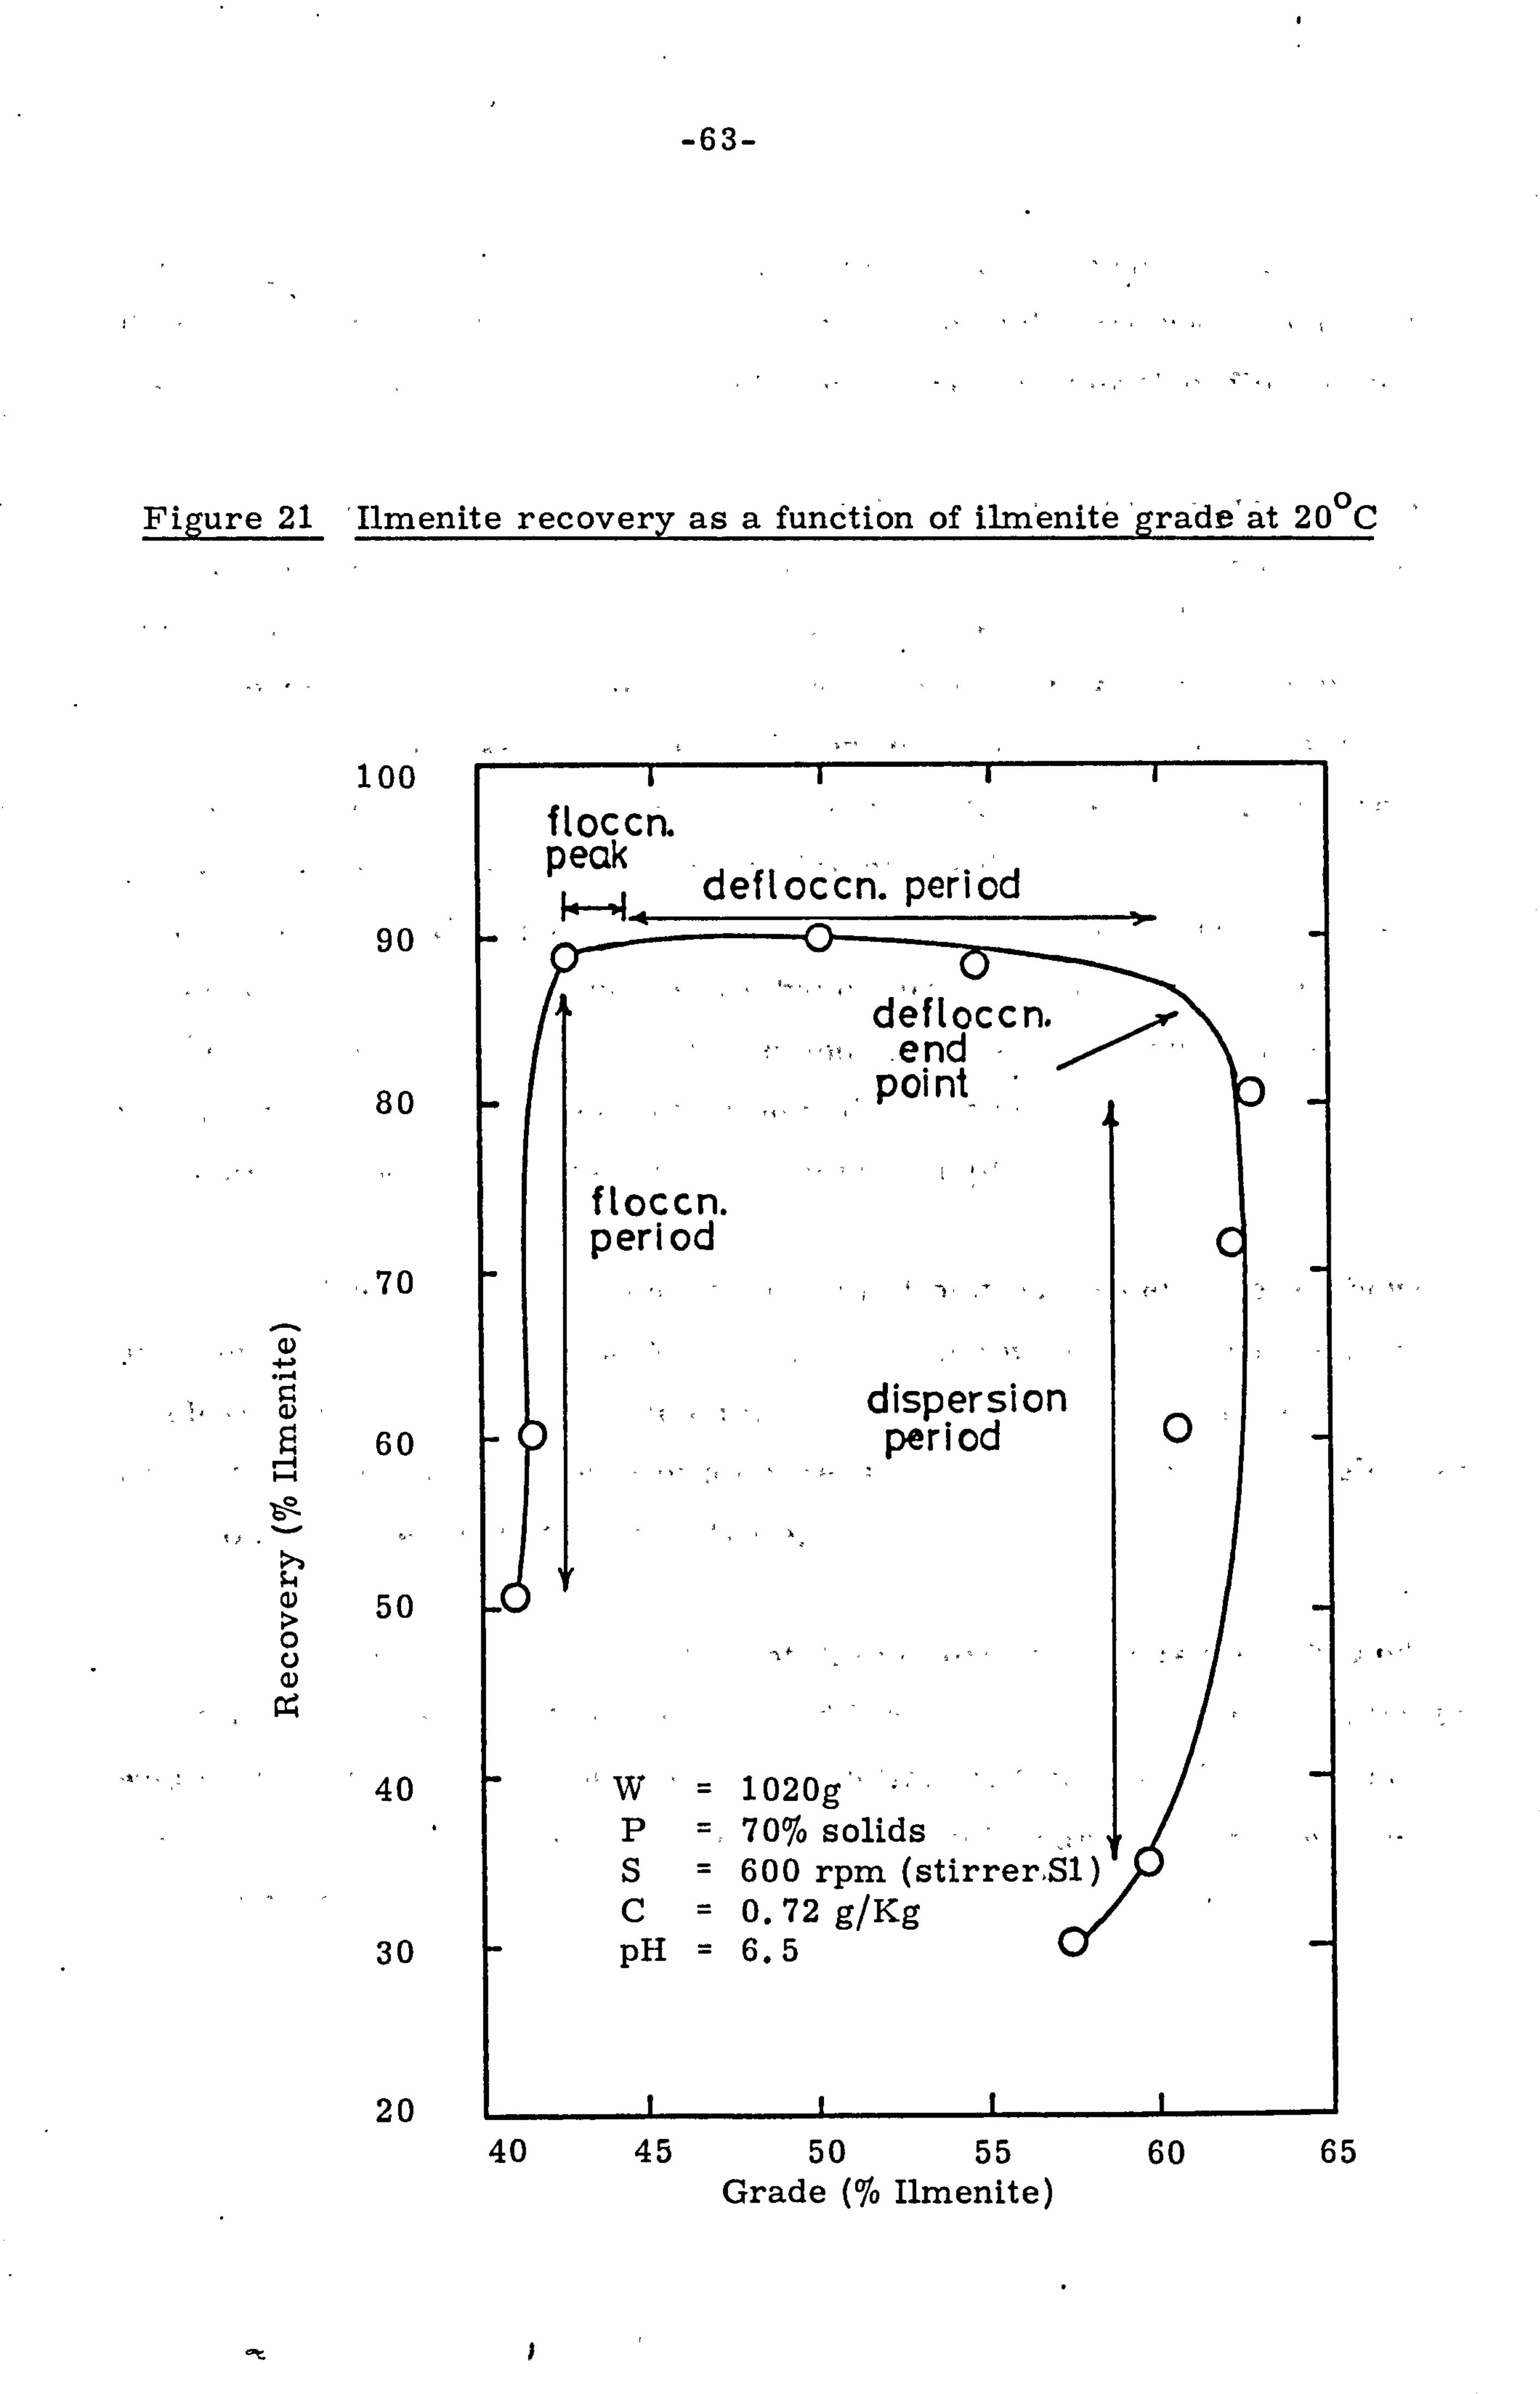
The grade-recovery curve shown in figure 21 does not represent
the whole conditioning process because the induction period has been
omitted for the sake of clarity. Both the recovery and selectivity were
poor throughout the induction period. During the flocculation period the
recovery increased markedly but there was little improvement in grade.
At the flocculation peak the recovery was a maximum, and the grade was
only slightly increased. During the deflocculation period the grade increased
to a maximum at the deflocculation end point while the recovery decreased
slightly. Thereafter, during the dispersion period, the ilmenite recovery dropped markedly but the grade was unchanged.
4.2.2 Observations during the flotation tests
It was noted during the flotation tests that the time required
for complete flotation depended on the extent of conditioning. Complete
flotation was achieved in only 30 to 40 seconds at the flocculation peak.
As the pulp deflocculated with further conditioning the corresponding
flotation time increased and at the deflocculation end point complete flotation
required two or more minutes.
Microscopic examination of the ladened flotation froth at the
flocculation peak showed that the gangue and ilmenite particles were
-63-
Figure 21 'Ilmenite recovery as a function of ilm'enit6'gra: de'at 20 0C
100
90
80
. 70
60
0) 50
40
30
20
V-
fI oc cn. peak defloccn. period
defloccn. d o, en
point_
f loccn. period c
dispersion 0 period
W 1020g" P 7076 solids S 600 rpm (stirrer, Slý) C= 0.72 glKg PH = 6.5 d
40 45 50 55 60 65 Grade (To Ilmenite)
I
0
-64-
coalesced in an oil film and floated together as an oil bound floc.
However, at the deflocculation end point and beyond there was a tendency
for the particles in the concentrate to be discrete rather than flocculated.
A mineralogical examination of the concentrate and tailing was
carried out on a number of flotation tests performed during the deflocculation
period for a 70% solids pulp with 0.72 glKg collector at 200C. The results
of this examination are presented in the form of graphs showing mineral
recovery and grade as a function of ilmenite content in figures 22 and 23.
For convenbýnce the hypersthene fraction includes hypersthene, olivine,
garnet and unliberated ilmenite particles of specific gravity > 3. The
total mineralogical concentration adds up to only 9676 in figure 23; this
is because the magnetite and apatite have been omitted. In figure 22
the results show that the hypersthene and ilmenite recovery behaved
similarly during the defloc culation. period, however, the biotite and feldspar recoveries decreased much more sharply.
The mineral concentration in the flotation concentrate is shown
as a function of ilmenite grade in figure 23 along with the corresponding
grade-recovery curve. These curves clearly show that the increase of ilmenite grade was the result of a decrease in the concentration of feldspar
and biotite in the ilmenite concentrate.
Microscopic examination of the mineral fractions also showed that the average size of the feldspar and biotite particles in the concentrate
was much larger at the beginning of the deflocculation period than at the
end of deflocculation where, of the biotite and feldspar, only the very small
particles were flotable.

-65-
Figure 22 - Mineral recovery. as a function of ilmenite grade at 20 0c (conditions as for figure 2)
100
0
80
60
40
20,
hypersthene
Ft m- 6Eýi t
biotite
f el dspar''
7m v -1 li 'JU VVuvv0
Grade (To Ilmenite)
Figure 23 Mine ral"conc'entr'atioii'in concentrate' as a function of ilmenite grade at 20-C (conditions as for figure 21)
1 nn LVU
Cd $4
r. 80 0
4-4 0
60 0 cd
41
40
0 Q Cd
20
II
itmerite -grcde -recovery curve
itmenite r
hypersthene
f eldspar biotite
0 L- 40 45 50 55 60
Grade (jo Ilmenite) 65

-66-
4.3 The Effect of Temperature on Conditioning and Flotation
4.3.1 The effect of temperature on the power consumption curve
Power consumption curves were obtained at six different
temperatures ranging from 20 to 750C. At each temperature several
power curves were obtained so that an average curve could be constructed.
These average power curves are presented in figure 24. As the
temperature was increased from 20 to 750C the duration of the induction
period and flocculation peak decreased. However, there was a tendency
for the deflocculation period to be extended. Although the initial power
consumption decreased with an increase in temperature the difference
between the initial and maximum power consumption was the same. The
net power consumption needed to reach any characteristic point -was
markedly reduced by an increase of temperature.
4.3.2 Conditioning and flotation at the same temperature
Flotation tests were conducted at various points along the power
consumption curves at different temperatures. The results are presented in figure 25 as ilmenite recovery *'Vs concentrate grade curves at the
six different temperatures. The part of the curve corresponding to the
induction period has been omitted for clarity.
An increase in the conditioning and flotation temperature from
20 to 75 0C produced an increase in the maximum ilmenite recovery and
a marked decrease in the maximum ilmenite grade.
The metallurgical results are shown more clearly as a function of temperature by extrapolation of the maximum grade and maximum
recovery plateaus, at each temperature, to their point of intersection;

-67-
ril
Cd
4ý
C+-4 4-4
10
4,
bX r.
-4 0 0
-4 -fý -4
0
ril
0 -4
0 PA
"14 cq
(2) $4
b. ( -, 4 Pri
eý
"o M bý
; =; ý ;.. ý4 0 a) --- bjD 02 $ý4 bO
0 $ý4 " Lo Fl -4 r-
, C) c) cp
4 t- C. 0 w
- (=; C;
u bjD
41 Cd ril W 0
4- a) -4 -4 0 "0
rA 4 E02 ; -4 0 -41
'0 ý, ý-l (1) -4 ;4 r-I -4 0 :ý
4 -
r-f r-I o
- - w 0-1 ul U
U
C-4 PCr4
LO
- -X- \-i - --il
0m 00 t- m LO
(M) uol; dTunsuoo jamod zaM
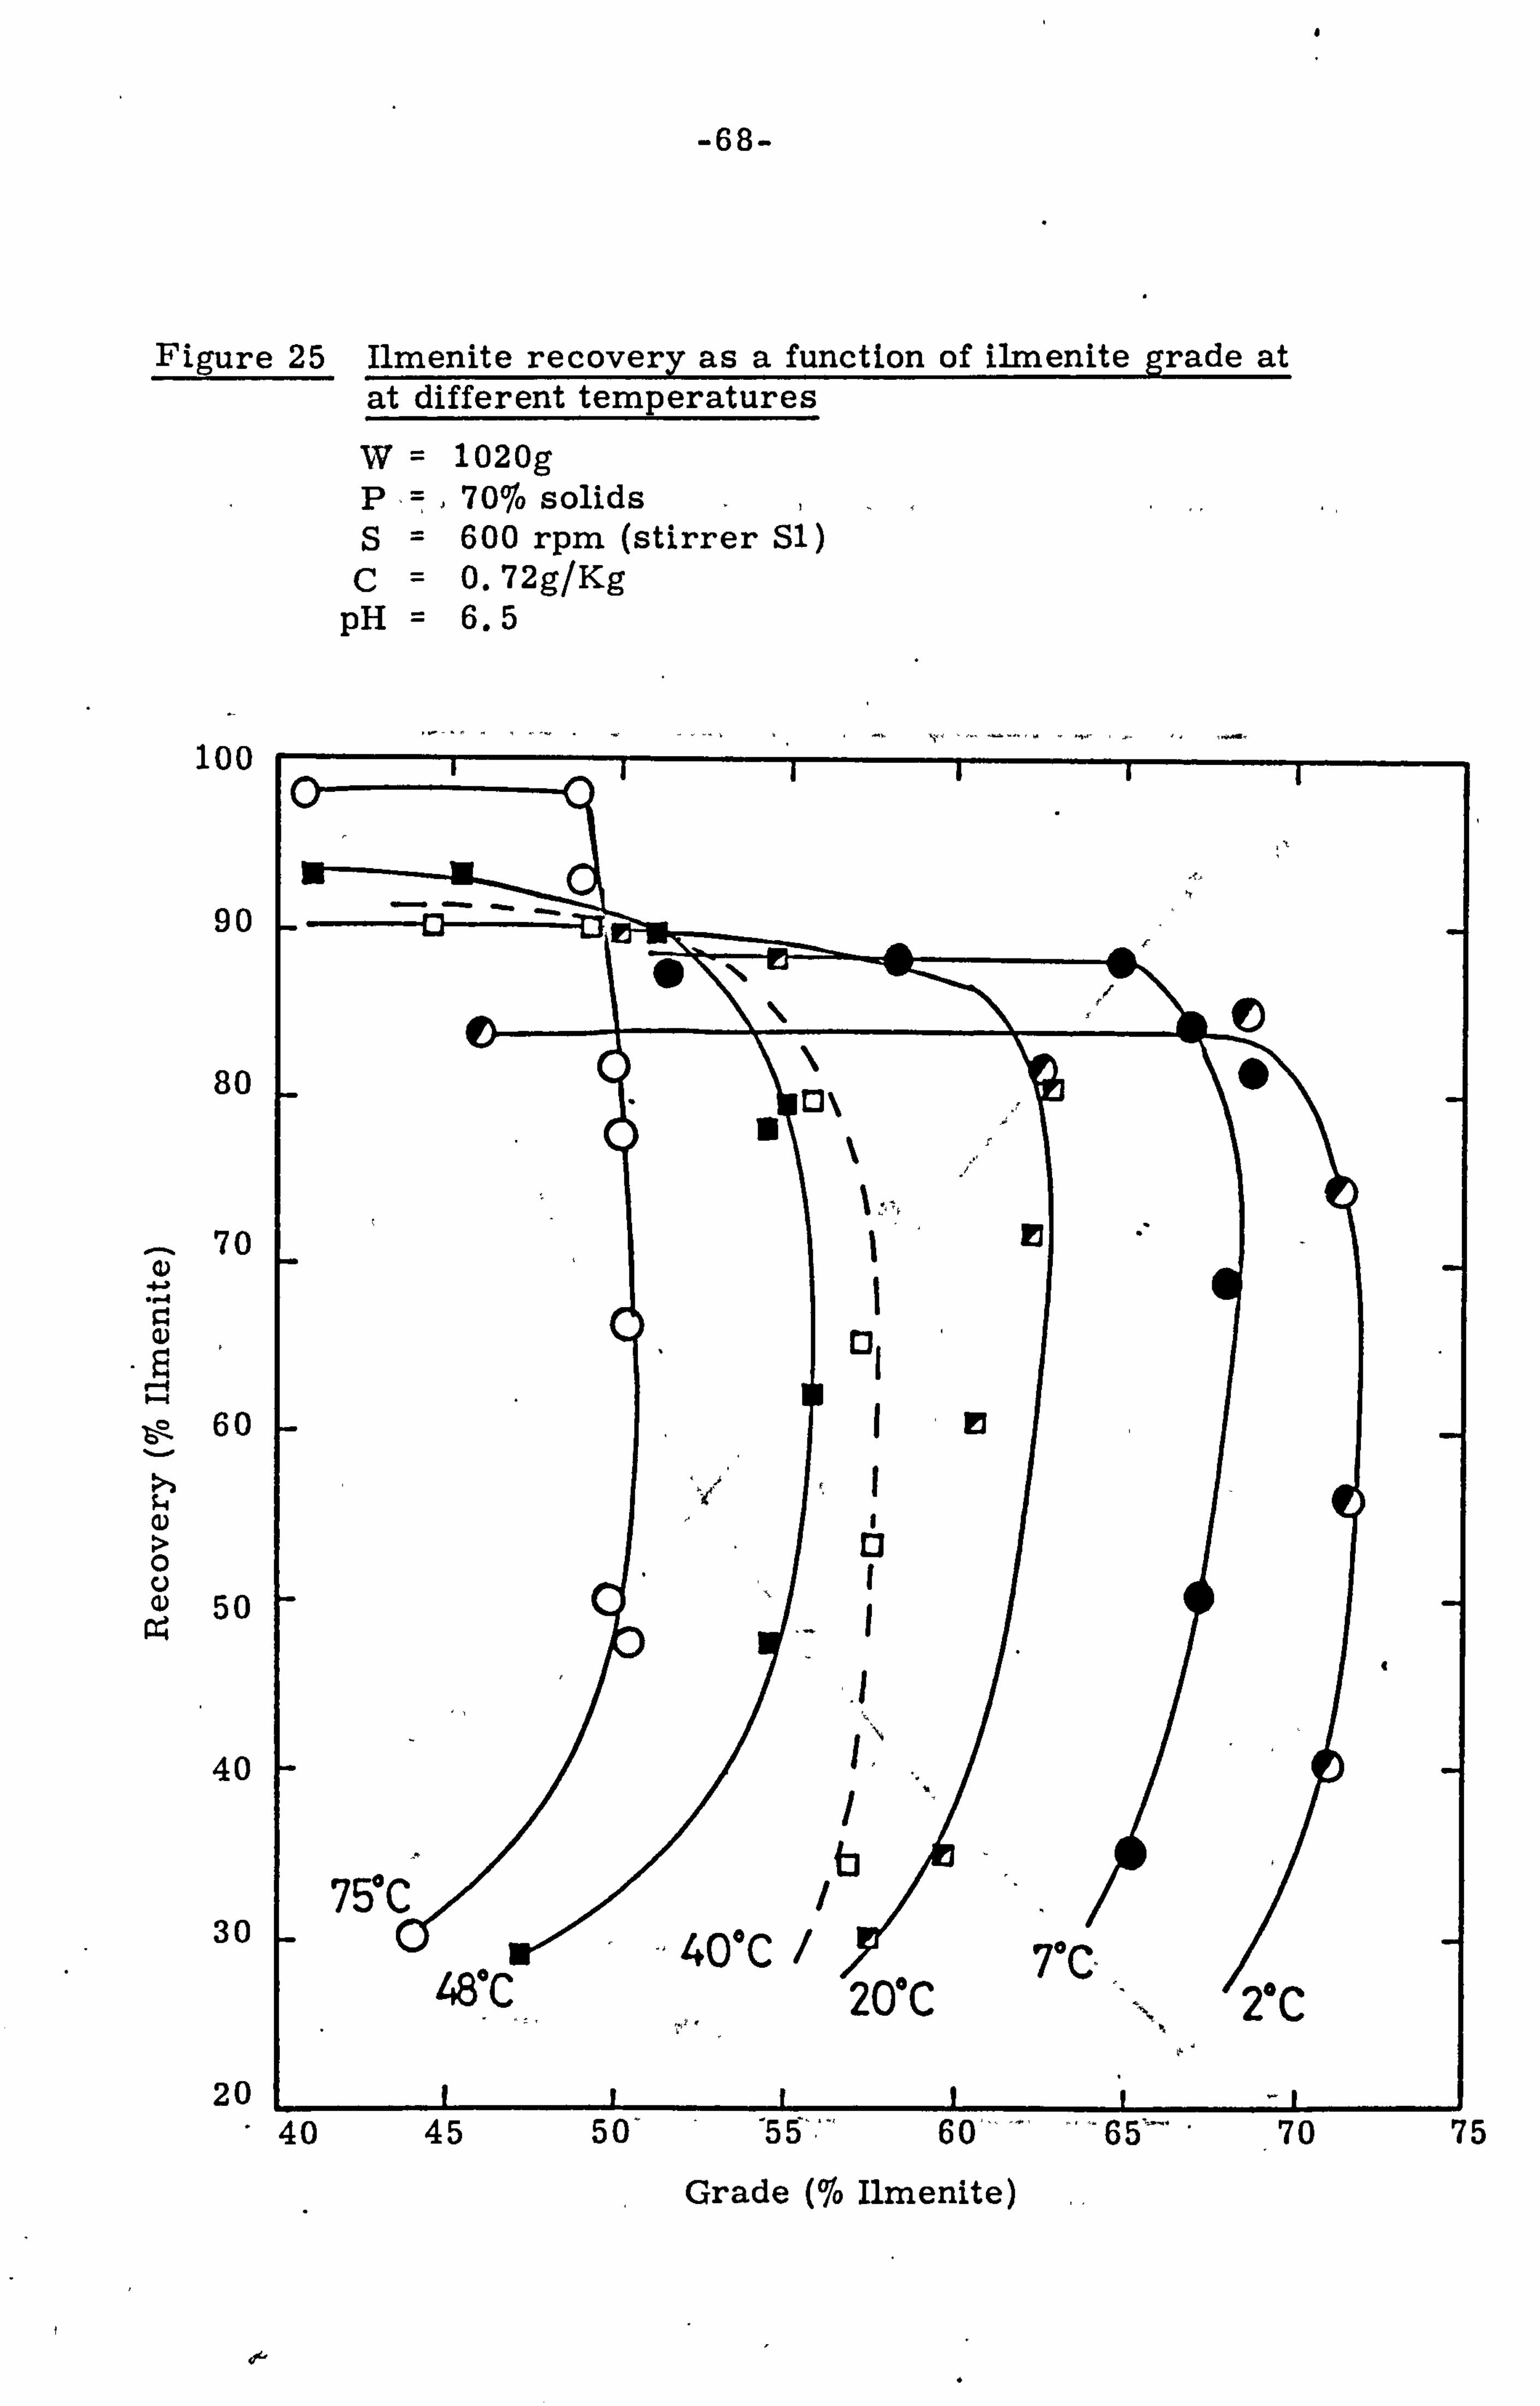
-68-
Figure 25 Ilmenite recovery as a function of ilmenite grade at at different temperatures
W= 1020g P, =, , 70% solids S= 600 rpm (stirrer Sl) c=0.72g/Kg
pH = 6.5
�C
C
E
r -4 cl)
cl)
cl)
0 0 a) r P4
40
30
20 40 45
Grade (To Ilmenite) ,,
70 75

-69-
Figure 26 Ilmenite recovery and grade as a'function of temperature at the deflocculation end point
72
70
68
66
64
62
60 10 Cd ý-4
58
100
98
96
94
92 -cu 41
90'
88
86,
'56 84
54 82
00 grad e 52 80
99 recovery 50 1111111.78
0 10 20 30 40 50 60 70 80
Conditioning and flotation temperature (OC)
-70-
the co-ordinates of this point will give the maximum grade and recovery
obtainable at each temperature. Values of grade and recovery determined
in this way are presented in figure 26 and show that an increase of
temperature from 20 to 750C resulted in an increase of recovery from
8316 to 9716 and a decrease in grade from 7216 to 51%.
4.3.3 Conditioning andflotation at different temperatures
The flotation response of pulps conditioned at one temperature
and floated at another are presented in figure 27. A comparison of
figures 25 and 27 shows that after the pulp had been conditioned at 75 0C
the flotation response at 70C was similar to that obtained after conditioning
and floating at 70C. Similarly after conditioning at 20C the flotation
response at 75 0C was more orless the same as that obtained by
conditioning and floating at 75 0 C. These results clearly show that the
metallurgical response was dependent on the temperature of flotation and
not the temperature of conditioning.
4.3.4 The effect of temperature on the mineralogical composition
of the flotation products
The flotation products from the flotation tests conducted in the 0,0
vicinity of the deflocculation end point at temperatures of 2,20 and
75 0C were mineralogically examined. The results are summarized
in figures 28 and 29. Figure 28 shows the weight of the silicate minerals
reporting to the concentrate at each temperature. Included also is -0 the variation of ilmenite recovery with temperature. Above 20 C the
ilmenite and hypersthene are parallel; any decrease in the ilmenite
grade above this temperature must therefore be the result of improved
flotability of the feldspar and biotite.

-71. -
Figure 27 Ilmenite recovery as a function of ilmenite grade for pulps floated at a different temperature to that of conditioning W= 1020g P= 70% solids S= 600 rpm (Stirrer, Sl) c=0.72 g/Kg pH 6.5
100
90
80
70
60
50
40
cj I /
conditioned at -20C and floated at- 75 0 C-
00 conditioned at 750C and'floated at 20C
30
20 11
40 45
0
50 55 60__ 65 70 75
Grade Ilmenite)

-72-
Figure 28 The effect of temperature* on the, weight of'various minerals reporting to the concentrate after flotation at the deflocculation end point (conditions as for figure 25)
IbU
r-I Cd
120
(D Cd u
-4
80 4-4 0
41
10 bD 4
(D 40
0
Conditioning temperature (uC)
Figure 29 The effect of temperature on the concentration of silicate minerals in the concentrate at the deflocculation end point
Cd IPO 4ý
0
C. ) 80
Cd C. ) 4 - r-I -4 60 w
4-4 0
Cd 40 0 0 -4
Cd
20
0 Q r-4 Cd 2
270
250
230
bD CD
41
'4-4 0
4ý 9.1 bD
10 20 30 40 50 60 70.80 Cqnditioning tý! mperature ( or)

-73-
The composition of the gangue reporting to the concentrate,
at a point corresponding closely to the deflocculation end point, is
shown as a function of temperature in figure 29. As the temperature
increased the percentage feldspar and biotite also increased whereas the
percentage of hypersthene decreased. This shows more clearly that
the decrease of ilmenite grade with an increase in temperature was the
result of an improved flotability of the feldspar and biotite.

-74-
5 DISCUSSION
5.1 Conditioning and Flotation at Room Temperature
The conditioning and flotation results are in agreement with
the observations of Lapidot and Mellgren(9) in that-the best flotation
response was obtained at the end of the deflocculation period. However,
in this study, because of the sensitivity of the conditioning process to
such variables as pulp density, it was not possible to locate the optimum
conditioning time by reference to a standard conditioning curve. The
deflocculation end point was therefore defined by its accompanying and
unique flotation response of maximum grade and maximum recovery at
that grade.
The increased height and length of the flocculation peak. observed
in figure 8, when the pulp density was increased from 65 to 69.576 solids,
indicates that the degree of flocculation was also increased. Unfortunately
the effect of pulp density on the conditioning process cannot be fully
assessed, because the change in power consumption, for a given degree
of flocculation, was dependent on the initial pulp density. Furthermore,
at such high pulp densities an increase in pulp density caused a change in
the mixing characteristics of the pulp. Consequently the power curve
at a pulp density of 72.276 solids cannot meaningfully be compared with
that at 69.5jo solids.
Figure 10 shows that an increase in stirrer speed shortened
the duration of the flocculation-deflocculation cycle but increased the
height of the flocculation peak. At high stirrer speeds the increased
agitation would more rapidly disperse the collector and so increase the
rate at which it would react with the minerals. Reduced induction and
flocculation periods would therefore be expected. The increased height
of the flocculation peak is, however, difficult to explain because it

-75-
implies that the degree of flocculation of the pulp increases with the
shear applied. Warren (25,26)
observed a similar effect in scheelite
pulps containing sodium oleate and called it shear flocculation. He
explained this phenomenon in the fol-lowing way:
under turbulent agitation the average energy of collision
is much greater than thermal energy therefore the
particles are allowed to approach more closely than
they would in a Brownian collision;
the formation of aggregates is favoured by an energy
of 'hydrophobic association' which comes into effect
if the collisions result in direct contact between
hydrophobic particles; and
it is likely that the resistance to thinning and removal
of the liquid separating the approaching particles
is less for hydrophobic particles than for hydrophilic
particles.
As expected an increase in collector dosage reduced the
induction period and increased the flocculation peak (figure 9). At high
collector dosages the interfacial conditions required for the onset of
flocculation would be obtained quicker than at lower concentrations.
Furthermore, at the flocculation peak bulk flocculation would be more
complete because of increased collector adsorption. That the
flocculation peak was longer at high collector dosages than at low
dosages suggests that the restructuring of the adsorbed layer, necessary
for deflocculation, takes longer for a thick adsorbed layer than for
a thin adsorbed layer. However, -once restructuring has occurred
the resultant deflocculation is independent of collector dosage.
-76-
The effect of a reduction in the slimes content of the pulp
on the power consumption curves (figures 13 and 20) was similar to that
observed for an increase in collector dosage. This is not surprising
because by removing more slimes from the pulp there would be an increase
in the amount of collector available per unit surface area of solid.
In the conditioning and flotation processes the variables can broadly be divided into physical ones, such as pulp density, stirrer speed
and stirrer geometry, and chemical ones, such as slimes content, collector
concentration and temperature. The flotation results for different
conditioning stirrer speeds and pulp densities, shown in. figures 16-19,
readily fit onto the flotation response curve for the same collector dosage
and temperature shown in figure 21. This shows that conditioning at different stirrer speeds or slightly different pulp densities has no effect
on the flotation response at a given characteristic point. These results
are in agreement with the observations of Kyosti (27)
who showed'that, for the thick pulp conditioning of an apatite ore, the flotation response
was independent of the physical variables but strongly dependent on the
chemical variables.
The amount of slimes in the pulp not only affected the conditioning
cycle but also the flotation response. A reduction of the collector dosage requirements and an improvement of grade and recovery was
obtained when the slimes content was decreased. In the absence of
slimes there would be more collector available for adsorption on the
coarser particles and, more important, the effects of slime entrainment
in the froth and the coating of coarser particles by slimes would be
minimised.

-77-
With increasing collector concentration the flotation grade and
recovery both increased until a plateau was reached at the maximum
grade'and recovery obtainable for, a given slimes content and temperature
(figures 12 and 14). As the collector concentration was increased more
collector would be available to coat the mineral particles and so render
them flotable. Eventually, however, there would be enough collector
to coat all the particles. Thereafter no increase in grade or recovery
would result from a further increase in collector dosage.
Selective flotation was not dependent on bulk flocculation of the
pulp as evidenced by the results shown in figure 17 where an ilmenite
grade of 62jo was obtained at the end of a period of conditioning during
which there was no flocculation peak. Lapidot and Mellgren(9) showed
that when an ilmenite ore was conditioned at pH 4.5 no flocculation-
deflocculation cycle was observed but flotation recoveries of 95% ilmenite
and 56% gangue were obtained at conditioning times approximately
corresponding to where the deflocculation end point would be. These
results suggest that either selective adsorption occurs at the ilmenite/
water interface or that collector is transferred from the gangue/water
interface to the ilmenite/water interface in the absence of bulk
flocculation. Both of these possibilities are in disagreement with the
conditioning mechanism proposed by Lapidot and Mellgren(9).
During conditioning the pH of the pulp gradually increased from
6.5 to between 7.5 and 8.3 depending on the duration of conditioning.
Gutierez (28)
also found that when ilmenite was conditioned with oleic acid for prolonged periods, until depression occurred, the pH in the conditioning
cell increased and approached the natural pH of an ilmenite in water
suspension. Further investigations, in which the ilmenite was conditioned
at a lower pH, showed that the ilmenite was still depressed after long
conditioning even though the final pH was lower than the natural pH of

-78-
ilmenite in water. He therefore concluded that the pH increase during
conditioning was the result, and not the cause, of ilmenite depression.
Furthermore, Sparks (29)
has shown that ilmenite and silicates both
flocculate more readily at a high pH (i. e. 8-9) when conditioned with
an oleic acid-kerosene mixture. It is, therefore, unlikely that the
observed pH change during conditioning would account for either deflocculation or the concurrent increase in selectivity; although it
might possibly contribute to the onset of flocculation. The fact that
Lapidot(8) conducted his conditioning tests at a constant pH supports this
theory.
The flotation response of the main mineral components of the
pulp presented in figures 22 and 23 showed that hypersthene responded
well to flotation by the fatty acid-fuel oil mixture. Read and Manser (30)
have shown that forsterite (Mg2SiO4 ) is readily flotable with oleic acid
and so it is quite probable that hypersthene (MgSiO 3) will also possess
some flotability. Inclusions of iron phases in the schillerised hypersthene
(which comprises most of the hypersthene in * this ore) would greatly
enhance such flotability. The persistent flotation of hypersthene observed during these tests was therefore not surprising. Olivine, chlorite, and
unliberated ilmenite included in the hypersthene fraction (for convenience)
would also be expected to adsorb oleic acid fairly st rongly. Feldspar
and biotite were, however, essentially free of iron oxides, and their
metallic cation content is much smaller than that of hypersthene, therefore
they ought not to adsorb, oleic acid strongly. Some iron activation might take place over the pH region of conditioning
(31) but there ought not to
(32) be any calcium or magnesium activation below about pH 9.5 The
fairly poor flotation response of the biotite, and particularly the feldspar,
was therefore as expected.

-79-
5.2 The Effect of Temperature on Conditionin
The overall effect of an increase in the temperature of
conditioning was a decrease in the duration of the flocculation- deflocculation
cycle.
At elevated temperatures the collector would be more soluble
and less viscous, therefore it would be dispersed throughout the pulp
more readily and spread more easily over the minerals than at low
temperatures. Probably the rate of mineral- collector interaction would
also increase with temperature. The overall effect would be a shorter
induction period with increased temperature.
The height of the flocculation peak (which largely represents
the degree of flocculation) was independent of temperature although the
initial power consumption decreased with an increase of temperature.
At the high pulp density used in this work the pulp was dilatantias
demonstrated by the results shown in figure 6. The increase in viscosity
caused by, flocculation would therefore have to be greater at 75 0C than at
20C for the flocculation peaks to be the same height. This suggests that,
although the flocculation peaks were independent of temperature, the
degree of flocculation increased with temperature. Such an increase
in flocculation could result from either increased collector adsorption or
more fruitful interactions between colliding collector coated particles.
The shorter flocculation peak but longer deflocculation period
observed at high temperatures indicates that although the changes
responsible for the onset of deflocculation occurred more rapidly,
deflocculation took longer. The latter is consistent with increased
flocculation at high temperature.

-80-
The total energy consumed by the motor in conditioning the
pulp to the deflocculation end point was 11.5 W. hr/Kg at 20C and 3.5
W. hr/Kg at 750C. Thus with an increase of temperature from 20
to 750C the conditioning power was reduced by 70%. However, a
detailed knowledge of the heat transfer -process in an actual conditioning
cell would be needed to determine whether it would be more energetically
favourable to condition a hot pulp for a short time or a cold pulp for a
long time.
5.3 The Effect of Temperature bri, Flotation
The recovery of ilmenite increased and the concentrate grade
decreased as the temperature of conditioning and flotation was increased.
An improved ilmenite recovery is consistent with greater collector adsorption,
as was indicated by the power curves. Alternatively, at a given adsorption
density, an increase in temperature could cause the collector coated
surface to become more hydrophobic because of reorientation effects.
The decrease in grade with an increase in temperature was largely due
to an increased feldspar recovery which, similar to the ilmenite, may
be explained by greater adsorption or reorientation effects. Beyond
an ilmenite recovery of 93% there would be an automatic reduction of
grade because the ilmenite was only 9316 liberated.
The recovery of feldspar at the deflocculation end point at 75 0C
shows that an increase in temperature made the feldspar flotable as
discrete grains either by increasing the adsorption or by increasing the
hydrophobicity of the collector coating. Of the feldspar flotable at the
flocculation peak at 75 0 C, 83jo was flotable at the deflocculation end point.
This supports the suggestion that deflocculation is not causeld by the complete
removal of collector from the feldspar. The complete absence of
feldspar from the concentrate at 20C indicates that it was either insufficiently
coated with collector or not oleophilic enough to adhere to the other
readily flotable particles.

-81-
These. flotation results are in agreement with those of Laapas (14)
who, in a study of the conditioning and flotation of a synthetic magnetite
ore with oleic acid, found that at elevated temperatures the magnetite
recovery increased whereas the grade decreased. He also concluded that
the temperature of flotation was not critical because the attachment of
collector to the mineral was completed during the conditioning stage.
The results presented in figure 27 do not support this view. After
conditioning at 75 0C and floating at 70C the flotation response
curve corresponded to the 70C isotherm whereas after conditioning at
20C and floating at 75 0C the flotation response corresponded to the 75 0C
isotherm. This clearly shows that the flotation response is dependent on
the temperature of flotation and independent of the conditioning temperature.
To explain this either the adsorption of collector must be reversible with
respect to temperature or, at a given adsorption density, the degree of
hydrophobibity must be dependent on temperature. Reversibility of
adsorption with respect to temperature would have to be rapid to be
effected during the 1 minute agitation in the flotation cell. It is likely
that such rapid reversibility would concern the outer adsorbed collector
layers and not the collector directly attached to the mineral surface. The
lengthy conditioning process suggests that these latter interactions are
relatively slow. Regardless of any variation of adsorption density with
temperature it is likely that the hydrophobicity of a given collector coating
would also vary with temperature. Tanford (33)
and Marki'na (34)
have
both shown that the solubility of hydrocarbons in aqueous solutions is
decreased with increasing temperature, and this indicates that the
hydrocarbon portion of the fatty acid collector will become more hydrophobic
with increasing temperature. In addition to this the ordering of the
adsorbed collector molecules may vary with temperature and thus cause
a change in the hydrophobicity of the collector coated mineral, regardless
of the collector adsorption density.
-82-
PART TWO
ADSORPTION, CONTACT ANGLE, AND -, OXIDATION STUDIES

-83-
6 INTRODUCTION TO PART TWO
6.1 The Effect of Temperature on Variables Related to Flotation
In part one it was shown that temperature had a marked
effect on the flotation response of an ilmenite ore. Furthermore, the
results suggested that both the adsorption of oleic acid and the
hydrophobicity of the mineral surface increased with an increase of temperature.
In the conditioning and flotation process the components of the
conditioned pulp, their interaction, and their subsequent flotation behaviour,
could all be affected by temperature. To give a more detailed picture, the components, their interaction, and their flotation response, may each be considered as being themselves composed of many variables most
of which are not independent. Although by no means an exhaustive list
the following comprise the more important variables: the viscosity, dispersity, solubility and degree of ionisation of the collector; the
critical micelle concentration (CMC) of the collector; the quantity of
collector at the mineral/water and air/water interfaces; the interaction
of collector with atmospheric gases (oxidation); the solubility of dissolved
gases; the solubility of interfering,, ions;: the tenacity of attachment of the hydrophobic layer to the mineral surface and the degree of hydrophobicity;
the rate of collector adsorption and desorption at the mineral/water interface; and finally, the flotation rate of the constituent minerals.
The effect of temperature on some of these variables has
been studied in detail. Flotation properties of fatty acid collectors depend to a large extent on their dispersion in aqueous solution. The
lower the viscosity the more quickly will the reagent be distributed
throughout the pulp, and if the collector is insoluble, the more finely

-84-
will it be dispersed. Furthermore, if the active collector species is
the ionic molecule, the more soluble'or ionised the collector, the greater
will be its collecting ability. As one would expect, for dilute aqueous
oleate solutions, theviscosity, which does not vary considerably from (35)
water, decreases with an increase of temperature Both the
dispersity (36)
and solubility (37)
increase with temperature; the solubility 0o (37)
almost doubling for a temperature increase from 20 to 60 C The -3 (34,38,39)
CMC of sodium oleate, which is given as 1.5 x 10 M, also increases with temperature
(34,39,40) showing that the aggregation
involved in micellisation is exothermic.
According to Klassen and Mokrousov (41)
temperature not only
affects the flotation properties of oleic acid by changing the viscosity and degree of dispersion but also by changing the process of adsorption itself;
no mention was made, however, of the nature of this change. In general
the adsorption of paraffin chain compounds at the liquid/solid interface (39) decreases with an increase in temperature for example, the adsorption
(42) of dodecyl ammonium chloride on alumina However, in contrast
to this, it has been found that the adsorption of oleate by fluorite increases (43,44)
with an increase in temperature
Other factors that might affect the, adsorption of collector are
the mineral zero point of charge (ZPC) (32) and the interaction of
(45) collector with atmospheric gases , each of which may in turn be
affected by temperature.
Berube and De Bruyn (46)
and Tewari and McLean (47)
have
shown that an increase in temperature -causes an increase in the ZPC
of oxide minerals. Such a variation of the ZPC with temperature will be more important in those systems where the collector is adsorbed by
Coulombic attraction.

-85-
In a review paper Plaksin (45) reported an increased flotation
recovery resulting from the introduction of oxygen to pulps which were treated with carboxylic collectors. A variation of temperature would clearly
affect the dissolution of such atmospheric gases in the mineral Pulp.
At elevated temperatures the solubility of interferingý-ibns (48)
might also increase and result in the activation of unwanted minerals
Not only can temperature affect the quantity of collector adsorbed by a mineral under equilibrium conditions, - it may also affect the
adsorption kinetics. Mitropanov and Kurshrukova (49)
have shown that
the rate of adsorption of amine by magnetite is practically unaffected by an increase in temperature, due to the rapid rate of adsorption. However, the rate of adsorption of amine by calcite is noticeably decreased
(49) with an 'increase of temperature
At a given collector adsorption density the flotation response
of the collector coated mineral will depend on the-orientation and degree
of condensation of the collector molecules. Cases (50) found that there
was a close relation between the flotation recovery rate and the condensation
of the first layer of collector adsorbed at the solid/liquid interface. It
is quite possible that such changes in the adsorption procdss with (41) temperature, as were loosely referred to by Klassen and Mokrousov
might concern the degree of condensation of the adsorbed layer or perhaps the orientation of the adsorbed molecules. It has been reported by
Kharalampiev (51)
that the degree of hydrophobisation of the collector
coated mineral increased with temperature. However in the absence
of detailed information it cannot be ascertained whether this increase
was attributable to increased collector adsorption or increased hydro-
phobicity at a given adsorption density.
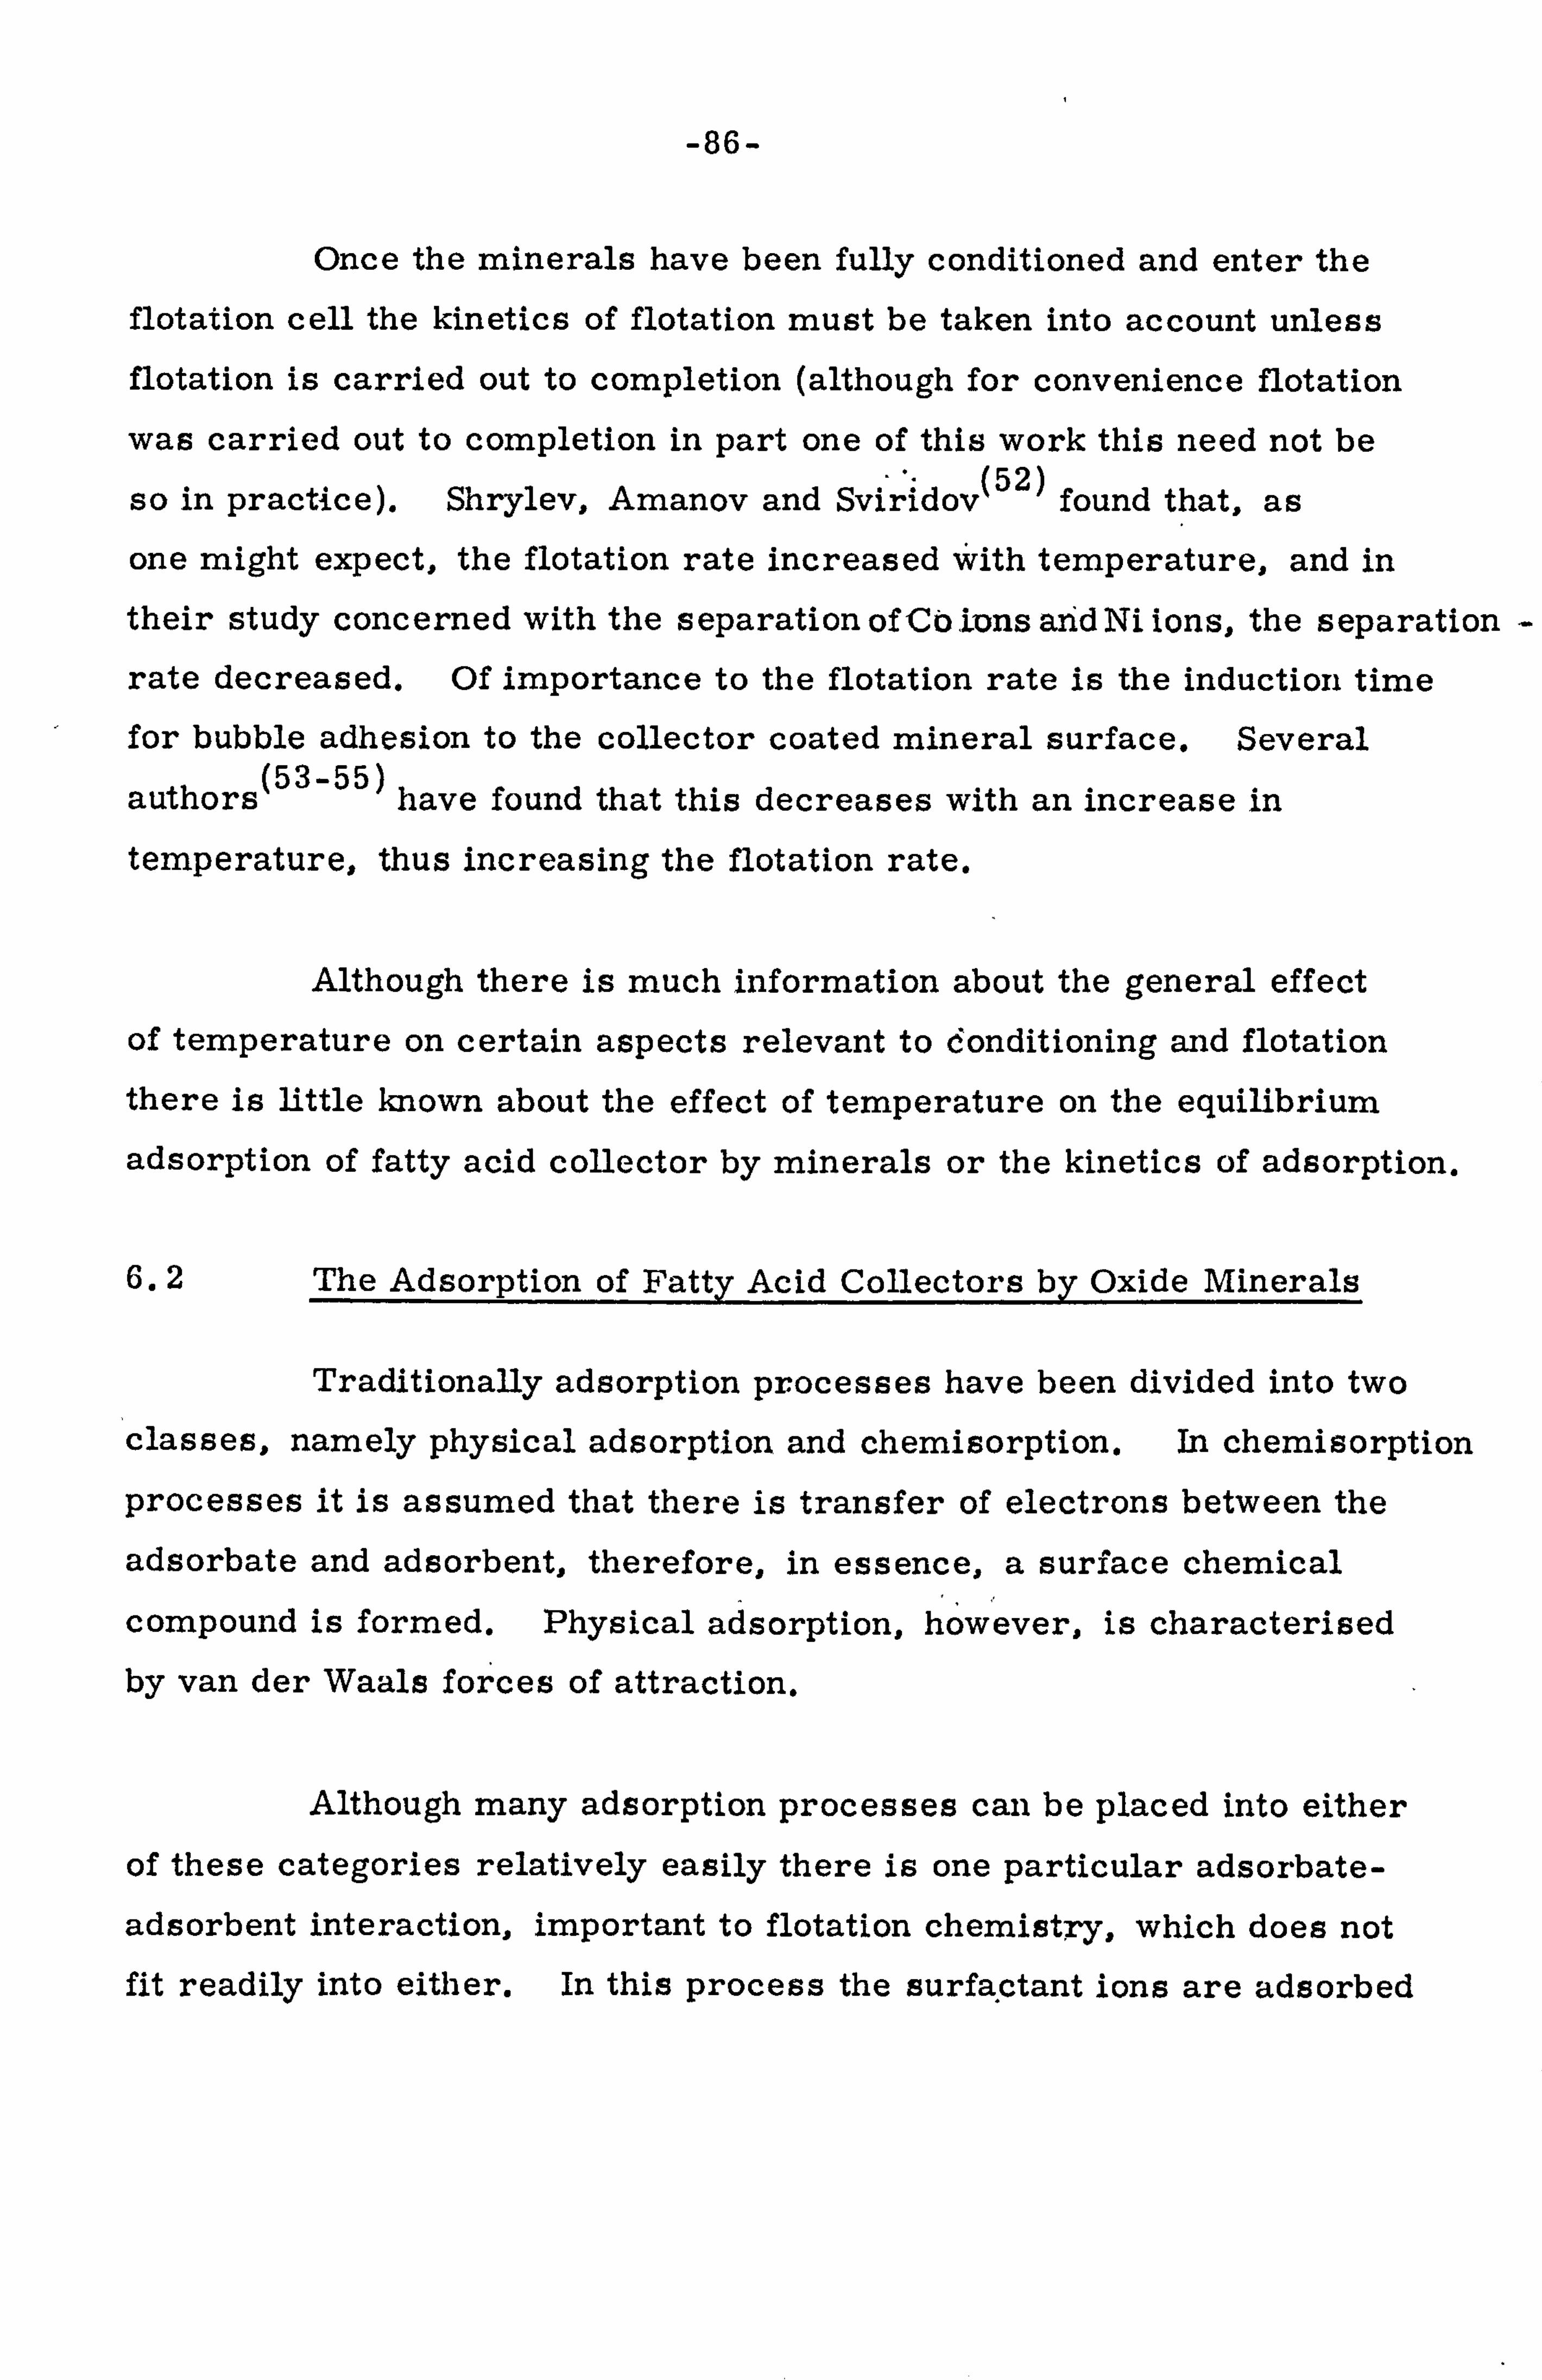
-86-
Once the minerals have been fully conditioned and enter the
flotation cell the kinetics of flotation must be taken into account unless flotation is carried out to completion (although for convenience flotation
was carried out to completion in part one of this work this need not be ' *' (52)
so in practice). Shrylev, Amanov and Sviridov found that, as
one might expect, the flotation rate increased with temperature, and in
their study concerned with the separationof CbIons ahdNi ions, the separation
rate decreased. Of importance to the flotation rate is the induction time
for bubble adhesion to the collector coated mineral surface. Several
authors (53-55)
have found that this decreases with an increase in
temperature, thus increasing the flotation rate.
Although there is much information about the general effect
of temperature on certain aspects relevant to donditioning and flotation
there is little known about the effect of temperature on the equilibrium
adsorption of fatty acid collector by minerals or the kinetics of adsorption.
6.2 The Adsorption of Fatty Acid Collectors by Oxide Minerals
Traditionally adsorption processes have been divided into two
classes, namely physical adsorption and chemisorption. In chemisorption
processes it is assumed that there is transfer of electrons between the
adsorbate and adsorbent, therefore, in essence, a surface chemical
compound is formed. Physical adsorption, however, is characterised by van der Waals forces of attraction.
Although many adsorption processes can be placed into either
of these categories relatively easily there is one particular adsorbate-
adsorbent interaction, important to flotation chemistry, which does not fit readily into either. In this process the surfa. ctant ions are adsorbed

-87-
at the solid/liquid interface by Coulombic attraction at low adsorption densities and then van der Waals attractive forces at high densities.
Physical adsorption at high adsorption densities is generally attributed
to the association of the surfactant hydrocarbon chains at the mineral/
water interface. Patches of these associated ions have been termed
hemimicelles by Gaudin and Fuerstenau (56) because of the similarity
to the formation of micelles in bulk solution. The concentration at which hemimicelles form (CHMC) is however at least one hundredth of the
(56) CMC
The mechanism of adsorption of fatty acids by iron oxides is
not completely understood. Some authors believe that the carboxylate ions are adsorbed by Coulombic attraction followed by h3idrocarbon chain interactions, while others suggest that a surface chemical reaction occurs in which a surface metal soap is formed., Furthermore the interpretation
of adsorption data is made difficult because of the dissociation of the
fatty acid molecule according to the reaction
RCQOH ýý RCOO -+H+ Ka =2x 10⁻⁵ mole/l (57)
and the fact that the neutral molecule has a very low solubility
RCOOH (solid) RCOOH (aqueous) K= 8xlO- 7 mole/l
(57)
Pope and Sutton (58) observed that the adsorption of oleic acid
from aqueous solutions by titanium dioxide, and by ferric oxide, occurred
over a wide pH range, including the pH corresponding to the ZPC of the
mineral, and concluded that adsorption was caused by interaction of the
negatively charged carboxylate group with a positively charged site on the oxide surface. The oleate was thought to be bound to the surface by attachment at the carboxylate group and the olefinic double bond,

-88-
leaving the rest of the hydrocarbon chain angled away from the surface. With increasing competition for the positively charged surface sites the
adsorbed species would bd forced into a vertical orientation and thus expose
the positive surface sites previously covered by the hydrocarbon chain of
the adsorbed oleate and allow further adsorption. At a higher surface
coverage the adsorption mechanism would involve mutual attraction between
the oleate hydrocarbon chains of the adsorbed molecules and those in
solution. Clearly, the adsorption of oleate by ferric or titanium oxide (58) is, accordin-gto Pope and Sutton , of the Coulombic variety.
Peck et al (59)
and Gutierez (28)
studied the adsorption of oleic
acid by hematite and ilmenite respectively using infrared techniques.
From these studies they concluded that chemisorption was involved and
that for both minerals a surface iron carboxylate was formed. Unfortunately
the results obtained from infrared studies are open to the criticism that
some of the observed spectral changes could have been caused by the (60)
sample preparation. Han, Healy and Fuerstenau also concluded, from zeta potential studies, that hematite adsorbed oleic acid by a specific
chemical interaction. They concluded this because the adsorption of oleic
acid shifted the zero point of charge of hematite whereas the adsorption
of dodecanoic acid and sodium dodecyl sulphate did not. Unf ortunately
these authors did not consider that aC 17 alkyl sulphate might possibly have given similar results to those obtained with aC 17 acid. It is
' (32) known that with C 18 alkyl sulphates adsorption does occur on iron
oxide at pH values above the ZPC.
Still other, more speculative theories have been proposed; Cook
(61) has mentioned the possibility of a neutral (RCOOH)
2 dimer
forming and then adsorbing on the mineral surface without being repulsed by the electrostatic'charge. It has also been suggested
(62) that direct
interaction may occur between the hydrocarbon chain and the mineral
surface.

-89-
6.3 The Effect of Oxygen and the Mineral Oxidation State on the
Adsorption of Oleate by Ilmenite
In section 6.2 reference was made to a review paper published by Plaksin
(45) in 1959 titled 'Interaction of minerals with gases and
reagents in flotation'. Although he devoted much attention to the effect
of oxygen on sulphide flotation he mentioned that 'the effect of oxygen is not limited to sulphide minerals but, surprisingly, enters also into
(28,63-68) the behaviour of non-sulphides'. Since then several authors have observed that oxygen, or oxidising agents, enhance the flotation
properties of oleic acid. In particular, for the flotation of hematite
with fatty acids, the variation of grade and recovery with conditioning
time has been correlated with the degree of oxidation of the fatty acid (63)
collector Such oxidation might influence the adsorption of oleate by ilmenite as well as the flotation results. An extensive literature
survey on the role of oxygen in conditioning and flotation was therefore
carried out.
The effect of oxygen on various fatty acids has been covered (69) in detail by Markley Although the nature of autoxidation (oxidation
by atmospheric oxygen) is complex, the initial products are thought to
be mainly hydroperoxides:
H3- (CH 2)x - CH - CH = CH - (CH
2)y - COOH I OOH
The formation of such peroxides is accompanied by the appearance of
trans double bonds (oleic acid normally contains the cis type double
bond). Secondary products of autoxidation occur more readily at high
temperatures ( 60 0 C) or in the presence of metal catalysts and consist
6

-90-
of oxiranes, unsaturated carbonyls and dimers. Ellis (70)
postulated
that the dimers of oleic acid are the form:
R- CH -C- CH -R 12 0 I
R- CII -C-C0-R
(64) Dorokhina suggested that dimerisation would cause an increase
in the hydrophobic action of oleic acid.
The effect of oxygen on oleic acid has been studied by Plaksin
and Soln (65)
. yshkin who found that epoxy groups were formed by the
spontaneous dissolution of oxygen from the atmosphere. . They also found
that peroxy groups, joint molecules, and quasi -crystalline layers are
formed on the surface of mineral particles, and this led to increased
adsorption of the flotation reagents. ' Contrary to sodium oleaie, the
peroxy groups were reported to be insensitive to metal ions. I
Kuzlkin, Parshenkov, Solý (71)
yshkin and Khan studied the
forms of oleic acid attac hmentand grain aggregation in oxidised minerals
by infrared spectroscopy and showed that epoxy films were one of the
forms of oleic acid attac hment; this was said to be of great importance
in the process of flocculation in mineral suspensions. Their results
clearly indicatdd the presence of aliphatic series peroxide structures,
which led to the assumption that oxidation of the oleic acid double bond
and carboxylic group might proceed according to the following reactions,
leading to the formation of quasi polymeric structures:

-91-
CH 13
CH 13
CH 3 CH 13
CH 13
(CH 127
(L; ki ) 127
) 27 27 (CH 27
CH 11 + 0,
Ull d'l 1-0
CIýý
O-CH 11
-H O-CH
oý 11 +0 c
0,1 %"10
cz
(Uli 2)7 2)7 2)7 2)7 (CH 2)7
Ä c A
c
-0 0 -0 0ý -0 0 -0 0 -0 0
A 0-0 A CII - (CH 3
C-C 27 - (CH C-c (Cii ), -C (CH
2)2 CH
3 277,27 c)- 0 0
A somewhat different structure to that, postulated by Ellis.
Although the mechanism of fatty acid oxidation and resultant
products are open to discussion the effect of such oxidation is not. A
number of peroxy fatty acid flotation reagents (RCOO 2 H) have been
synthesised and their flotation activities to certain minerals, including
hematite, investigated. (72) The Ilotation activities of such peroxy
fatty acids were much higher than the corresponding fatty acids and they
also withstood lower temperatures and possessed selectivity for various
minerals.
(63,66,69) (63,66) Metal ions , their oleate salts , and hematite
and ilmenite (63)
all exertý a catalytic effect on the oxidation of fatty acids.
Furthermore, ferric ions are more effective than ferrous ions in (63)
oxidising fatty acids The promotion of oxidation by metal catalysts is believed (69,73)
to involve the continuous donation of oxygen from the
metal in its higher valence state to the fatty acid. Ultimate interaction
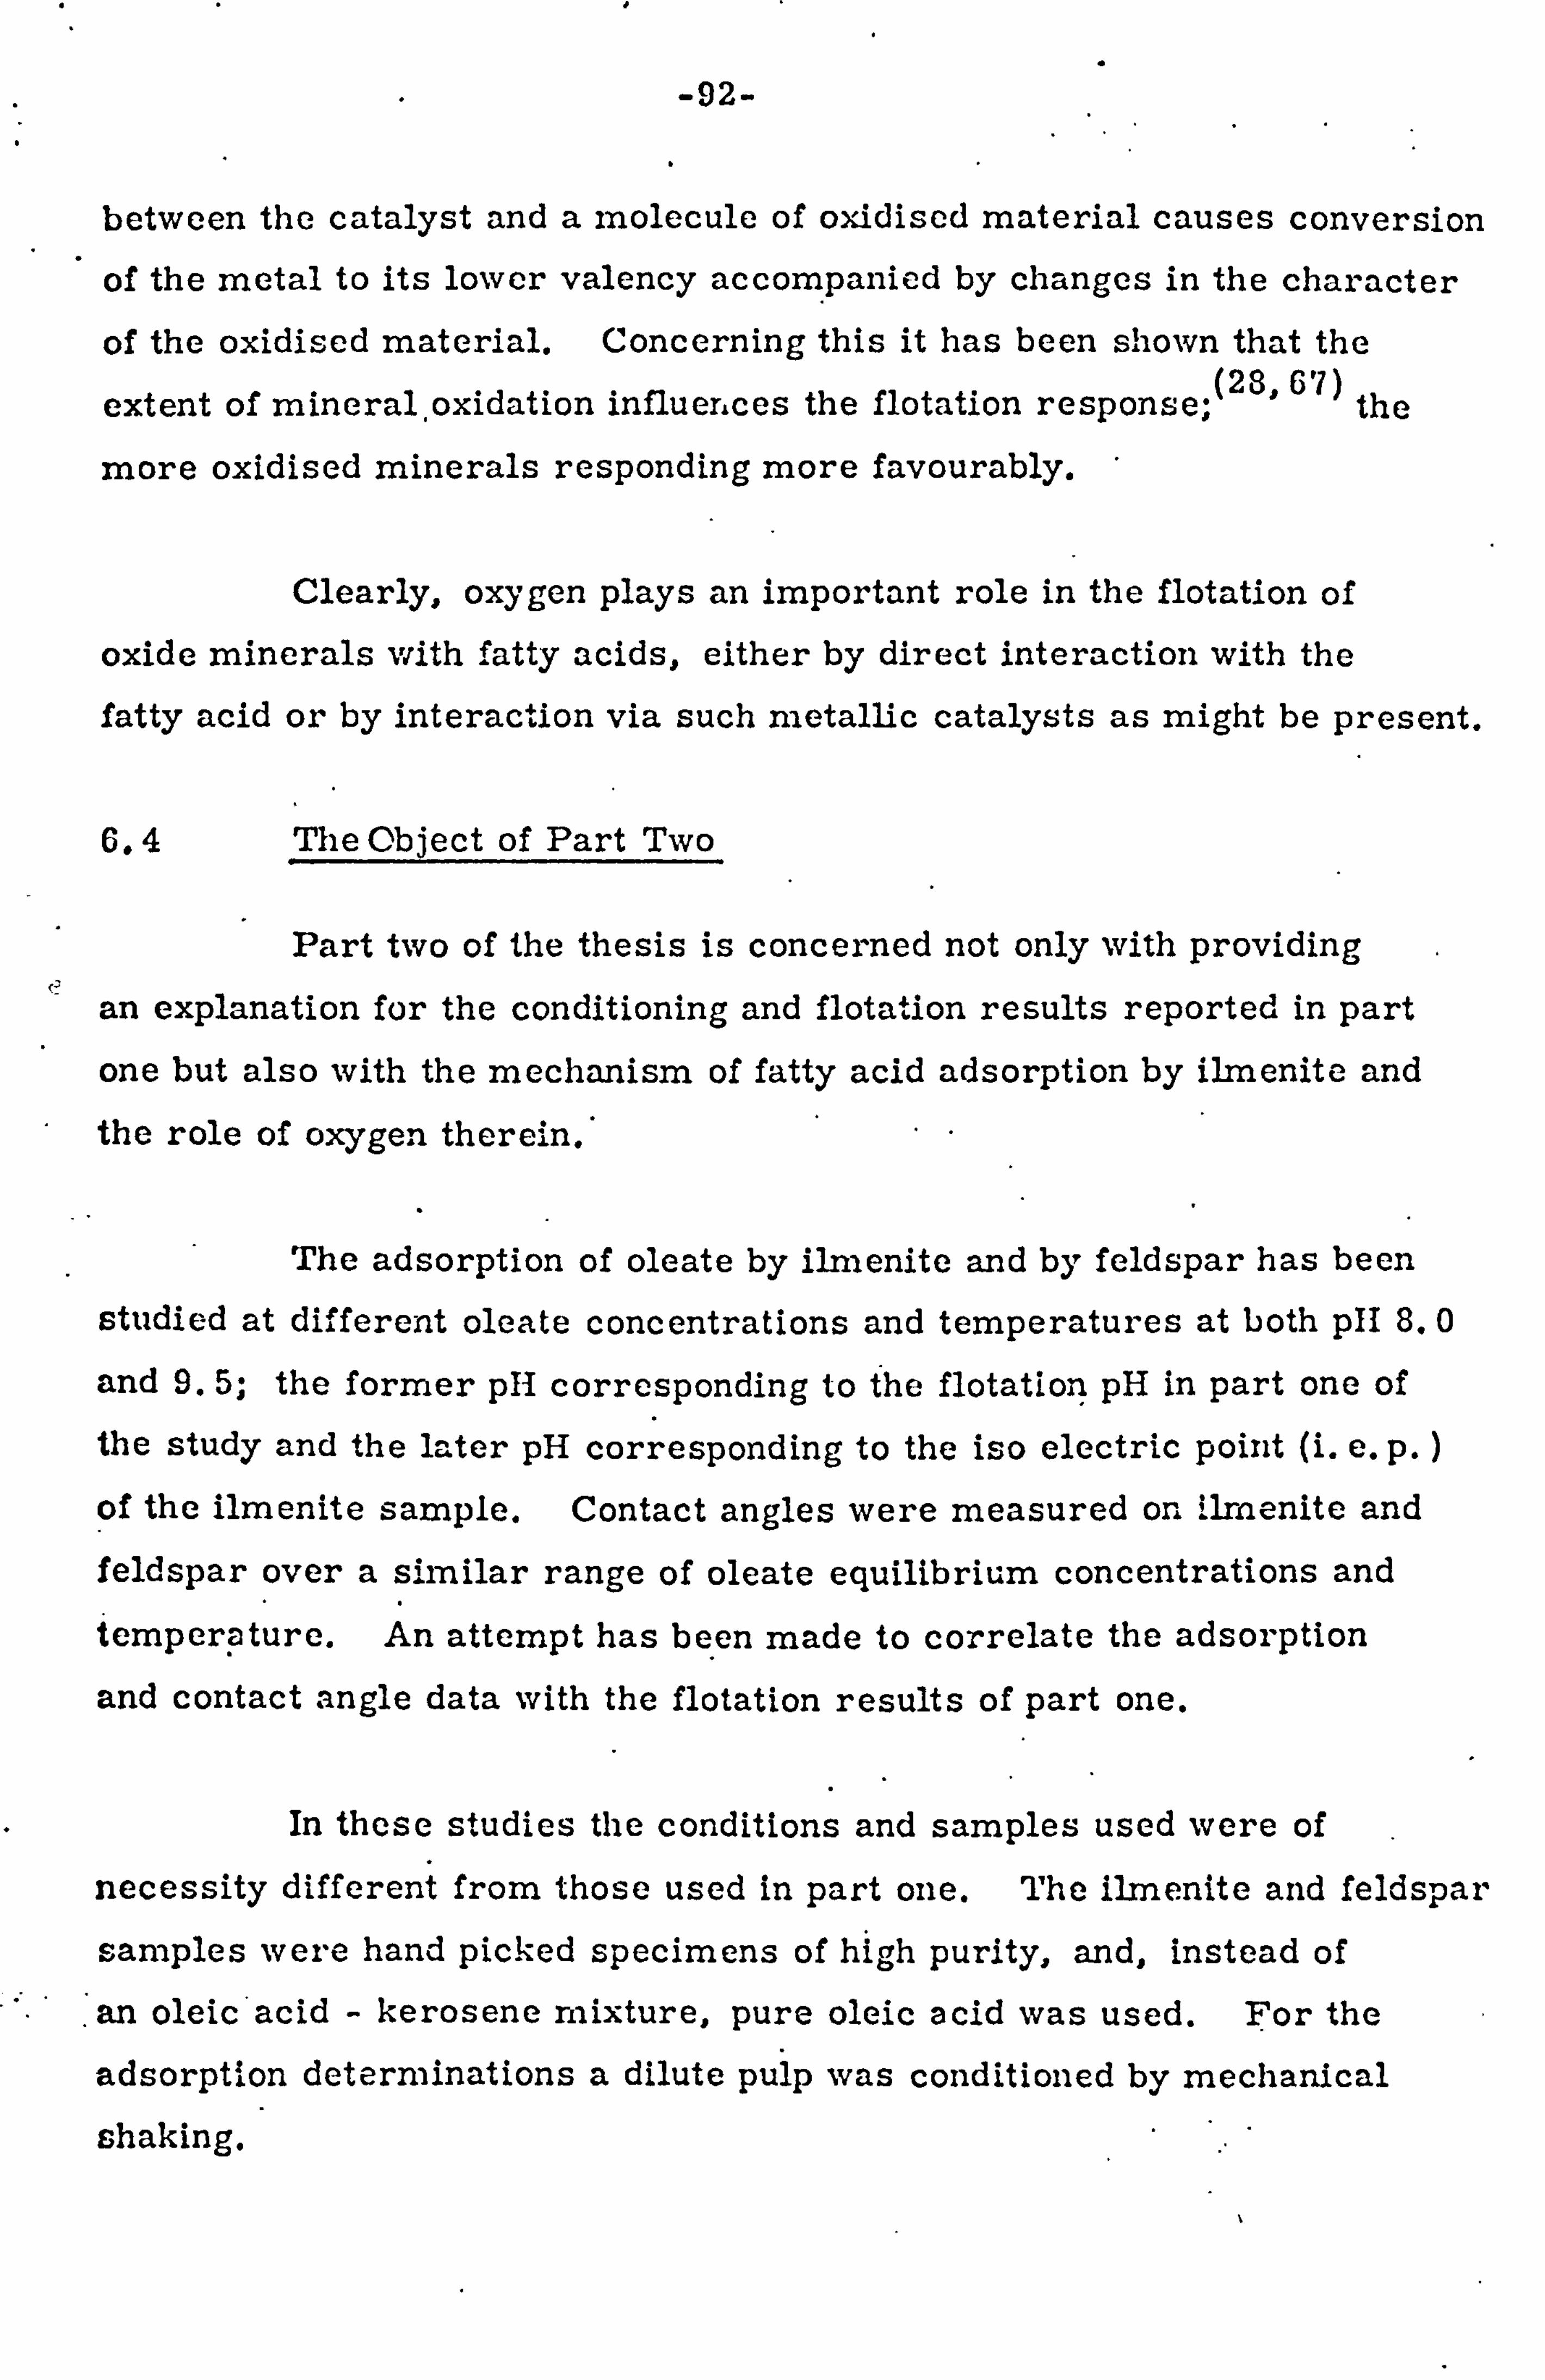
-92-
between the catalyst and a molecule of oxidised material causes conversion
of the metal to its lower valency accompanied by changes in the character
of the oxidised material. Concerning this it has been shown that the
extent of mineral, oxidation influences the flotation response; (28,67)
the
more oxidised minerals responding more favourably.
Clearly, oxygen plays an important role in the flotation of
oxide minerals with fatty acids, either by direct interaction with the
fatty acid or by interaction via such metallic catalysts as might be present.
6.4 The Object of Part Two
Part two of the thesis is concerned not only with providing (ý an explanation for the conditioning and flotation results reported in part
one but also with the mechanism of fatty acid adsorption by ilmenite and the role of oxygen thereLn. *
The adsorption of oleate by ilmenite and by feldspar has been
studied at dif 'ferent oleate concentrations and temperatures at both pII 8.0
and 9.5; the former p1l corresponding to the flotatlorý pH in part one of the study and the later pH corresponding to the iso electric point (i. e. p.
of the ilmenite sample. Contact angles were measured on ilmenite and feldspar over a s., milar range of oleate equilibrium concentrations and temperpture. An attempt has been made to correlate the adsorption
and contact angle data with the flotation results of part one.
In these studies the conditions and samples used were of
necessity different from those used in part one. The ilmenite and feldspar
samples were hand picked specimens of high purity, and, instead of
an oleic*acid - kerosene mixture, pure oleic acid was used. For the
adsorption determinations a dilute pulp was conditioned by mechanical
shaking.

-93-
7 EXPERIMENTAL DETAIL
7.1 Materials
A coarse grained ilmenite of high purity was provided by
Titania A/S, Norway, and a Norwegian plagioclase feldspar of the
anorthite variety, similar to the major silicate component of the ore
described in section 3.1.4 was acquired from R. F. D. Parkinson and
Co., Somerset, England.
For the adsorption studies samples of these minerals were
crushed and then ground in an agate vibratory mill to -40 pm. Specific
surface areas of 1.42 m2 Ig for ilmenite and 8.68 m2 Ig for anorthite
were determined for the ground samples by B. E. T. Krypton adsorption.
Classical and XRF analyses of the -40). im samples showed that the
ilmenite was at least 9916 pure. The anorthite contained between 0.05
and 0.25T6 iron, and as its main impurity magnesium at 0.4116.
For the contact angle studies selected pieces of ilmenite and
anorthite were cut by a fine diamond wheel into 1.5 cm 3 lumps. On
each of these lumps the cleanest surface, as observed microscopically,
was polished by successively finer grades of silicon carbide paper.
Final polishing was conducted with 'Fransill silica on a clean 'Selv. ytl
cloth under conductivity water until the samples were hydrophilic.
Microscopic examination of the polished ilmenite surface under reflected
light showed that the surface was very smooth and revealed the presence
of hematite exsolution lamellae (Plate 10). These lamellae were
much larger than those observed in the ore described earlier (section
3.1.3) and their size varied considerably from grain to grain as is shown in plate 11. Similar examination of the anorthite showed that the surface

'\
\ \\\
ii
I'A
Plate 10 Ilmenite sample for contact angle studies
Reflected light, 200 x magnification. White exsolution lamellae of iron oxide included in the grey ilmenite phase are clearly shown.
Plate 11 Ilmenite sample for contact angle studies
Reflected light, 200 x magnification. The unbroken black line indicates the boundary between two ilmenite grains in which the size of the exsolution lamellae are different. The difference in lamellae size may, however, be a stereological effect produced by the ilmenite grains presenting a different crystallographic axis.
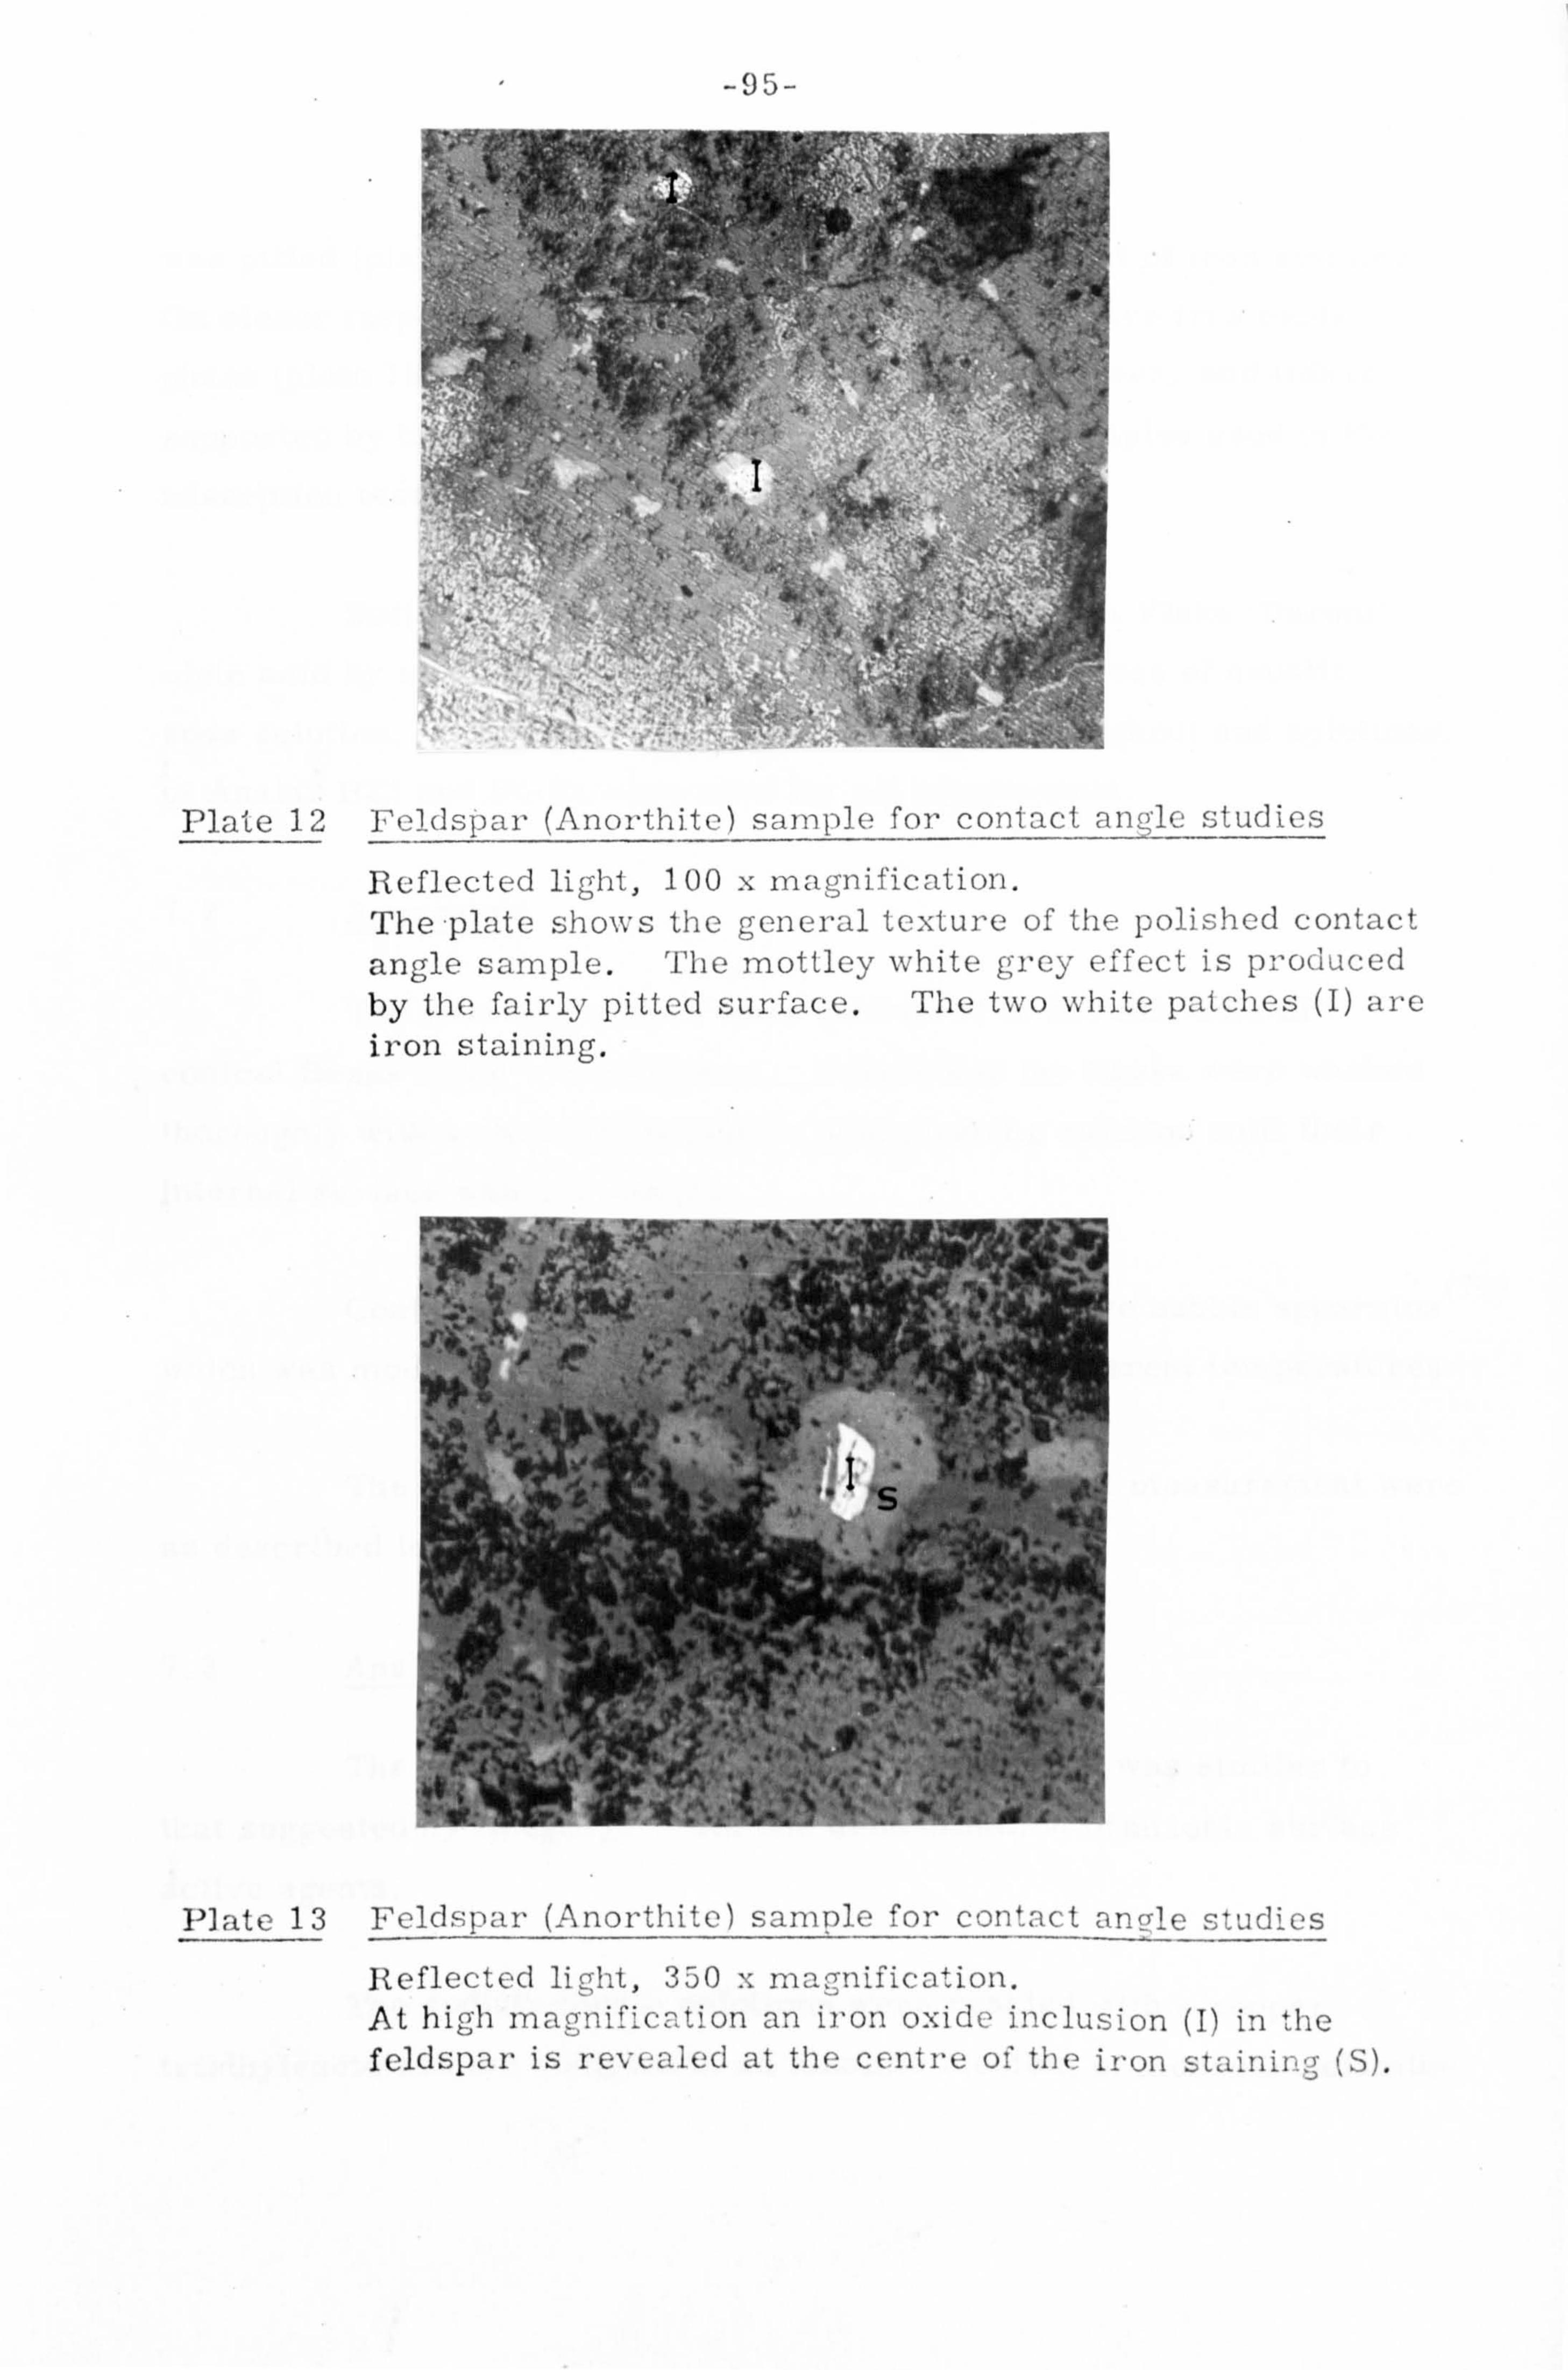
-95-
I
PlaLe 12 Feldspar (Anorthite) sample for contact angle studies
Reflected li(Tht, 100 x magnification. b
The plate shows the gencral texture of the polished contact b
angle sample. The mottley white grey effect is produced t) by the fairly pitted surface. The two white patches (I) are iron staining.
. .:, e, ý'-. ýý, *'1, ý , Ad -
Plate 13 Feldspar (Anorthite) sanmle for contact angle studies
Reflected light, 350 x magnification. At high magnificIntion an iron oxide inclusion (I) in the feldspar is revealed at the, centre of the it-on stainin,,, j- (S).
-96-
was pitted (plate 12) and that there was a small amount of iron staining.
On closer inspection this proved to be a highly reflective iron oxide
phase (plate 13). Such iron oxides were scarce however, and thisis
supported by the 0.05 to 0.2516 iron content of the samples used in the
adsorption tests.
Sodium oleate solutions were prepared from Fluka 'Purum,
oleic acid by reaction with a slight stoichiometric excess of caustic
soda solution. Double distilled water was used throughout and solutions
of Analar HC1 and NaOH were used for pH adjustments.
7.2 Apparatus
The adsorption tests were conducted in 250 ml 'Quickfit'
conical flasks fitted with stoppers. Before use the flasks were washed
thoroughly with a chromic - sulphuric acid cleaning solution until their
internal surface was hydrophilic.
Contact angles were measured with a captive bubble apparatus (74)
which was modified to allow for measurements at different temperatures.
The constant temperature equipment and pH measurement were
as described in part 1 section 3.3.
7.3 Analysis for Oleate
The method of sodium oleate determination was similar to
that suggested by Gregery (75)
for the determination of an, ionic surface
active agents.
The sodium oleate solutions were reacted with a copper
triethylenetetramine complex in an alkaline medium of mono ethanolarnine

-97-
-and the resulting complex was extracted into an isobutanol-cylohexane
mixture. Addition of diethylammonium diethyldithiocarbamate to the
extracted complex produced a colour which was determined
spectrophotometrically in a 'Unicarn' double beam spectrophotometer.
The reagents were prepared in the foUowing way: -
Copper -tri ethylenetetramine:
25g of Copper (II) nitraie trihydrate was dissolved in 125 ml
of water and a solution containing 16.25g of triethylenetetramine in 125 ml
of water was then slowly added. A solution containing 250 ml of
mono ethanolam in e in 250 ml of water was then added and the whole made
up to 1L with distilled water.
Isobutanol-cyclohexane extractant:
200 ml of isobutanol was mixed with 800 ml of cyclohexane.
Diethylammonium diethyldithiocarbamate solutton:
2g of diethylammonium diethyldithiocarbamate was dissolved
in 100 ml, of isobutanol. This solution was prepared fresh each day.
In a determination of 5 ml of the copper complex and 10 ml of
the extractant were added to 25 -ml of the sample and the mixture inverted
rapidly 100 times. The organic phase was then separated from the
aqueous phase and mixed with two drops of carbamate solution. After the
sample had been left to stand in the dark for fifteen minutes the optical
density was determined at a wavelength of 435 mp.
Blank determinations were made with each batch of oleate
analyses.

-98-
7.4 Experimental procedure
7.4.1 Adsorption studies
Samples of pulverised mineral (0.5g ilmenite or 0.9g feldspar)
were placed in the 250 ml conidal flasks and 40 ml of solium oleate
solution at a known concentration and pH added. After passing 'white
spot' nitrogen through each flask to remove carbon dioxide the flasks
were stopped securely and shaken for a fixed time in a thermostatically
controlled water bath. At the end of conditioning the final pH was
measured at the temperature of agitation. The mixture was then
centrifuged to remove any dispersed solids and the resulting solution
was analysed for oleate.
The reversibility of the oleate adsorption was determined by
desorption tests. Samples of the mineral were conditioned with 40 ml
of oleate solution for 1 hour, the suspension was then centrifuged and
20 ml of solution was removed for analysis. The remaining solution was diluted to 40 ml with double distilled water at the appropriate pH and then
reconditioned for a further hour. The oleate concentration of the final
solution was determined and the amount of desorbed oleate calculated. At low adsorption densities a measurable amount of oleate was ensured
by combining the solids of six identical tests after the first hour and then
adding 40 ml of double distilled water at the required pH. Although this
did not give an accurate final equilibrium concentration because of the
oleate solution retained by the centrifuged solids it was good enough to
establish whether or not the adsorption process was reversible under
such conditions.
Blank tests (in the absence of mineral) were conducted with
each batch of adsorption tests and a small correction was then applied to
the results to allow for adsorption on the glass vessels etc.

-99-
A statistical analysis on sixteen blank tests showed that the
adsorption test procedure and anhlysis had a relative error of 2.516.
During the blank tests it was noticed that over a number of days
the oleate solutions became cloudy. Furstenau(60) made similar
observations and found that the cloudiness could either be removed by
passing nitrogen through the solutions or, alternatively, prevented by
using nitrogen saturated water in the solution preparation. However,
solutions prepared in a similar manner, in this work, did go cloudy
on storage. Further tests also showed that the cloudiness was independent
of light intensity and the absence or presence of oxygen. The adsorption
tests were, therefore, always conducted with freshly prepared oleate
solutions.
A number of tests were conducted to determine the time taken
to reach equilibrium in the presence of mineral and collector. The
adsorption was almost complete within 15 minutes and equilibrium was
reached within 30 minutes. To allow for a variation of equilibrium time
with concentration and temperature an equilibrium time of 1 hour was
allowed in all the adsorption tests.
7.4.2 Contact angle studies
Sodium oleate solution of the desired concentration was placed in the contact angle cell, which was itself placed in a water bath, and
when thermal equilibrium was reached the pH was adjusted as required. The mineral sample was then carefully transferred to the oleate solution from the storage vessel (which had been maintained at the required temperature). A bubble was formed at the tip of an 'Agla'. micrometer
syringe, placed just in contact with the mineral surface, equilibrated,
and then its volume increased by a known amount. After a further

-100-
equilibration period the bubble was returned to its original volume and the receding contact angle measured. Under a given set of conditions the
receding angle was measured at different points on the polished surface
and the average determined. After measurement of the contact angle at
each set of conditions the sample was repolished with 'Fransil, and
replaced in the storage vessel.
7.5 Oxidation Studies: The Effect of Oxygen and Mineral Oxidation
State on Conditioning and Flotation, and Adsorption of Oleate
by Ilmenite
To determine qualitatiYely the effect of oxygen and mineral
oxidation state on the conditioning and flotation of ilmenite a number of
conditioning tests were carried out on the ilmenite ore used in part
one of the project. A more detailed study was carried out to determine
the effect of oxygen on the adsorption of oleate by ilmenite. The
adsorption of oleate by oxidised (ordinary) and reduced ilmenite was also determined. A reduced ilmenite surface was obtained by immersing
the ilmenite in hydrazine. Consideration of the respective Eo values as
given by Latymer (76)
shows that hydrazine will reduce ferric to ferrous
Titanic to titanous, and also remove dissolved oxygen from water.
40H +N2H4 '=' N2+ 4H 20+ 4e
Fe 3+
+e-= Fe 2+
Ti 3+ + e- = Ti 2+
02+ 4H ++ 46* = 2H 20
Eo = +1.16 (in basic solution)
E= +0.771 0
E= -0.37 0
E= +1.229 0
In removing oxygen from water, hydrazine produces water and
nitrogen only. The net reaction is:
N2H4 +0 2- 2H 20+N2

-101-
However, the reaction is slow and requires in excess of 48 hours (77)
for the complete removal of dissolved oxygen from water
7.5.1 Conditioning and flotation studies
For the conditioning and flotation tests a reduced ore was
prepared by grinding the normal oxidised ore in a 10- 2M hydrazine
solution under nitrogen and then storing under hydrazine before and
after desliming.
The conditioning cell was fitted with a special lid which allowed
conditioning to be carried out under an atmosphere of nitrogen or oxygen. The optimum conditions determined at room temperature in part one
(as for figure 21) were used throughout.
7.5.2 Adsorption studies
The experimental equipment and procedure were as described
in sections 7.2 and 7.4.1.
The Fe 3+ and Ti
3+ ions in the ilmenite surface were reduced
to the Fe 2+ and Ti 2+
state by immersion for 72 hours in a 10- 2M
hydrazine solution of pH 9.5; this solution was d. ecanted immediately
before conditioning with oleate solution.
Deoxigenated oleate solutions were prepared by reacting oleic
acid and sodium hydroxide in a 10- 3M hydrazine solution whilst
oxygenated oleate solutions were prepared by agitating sodium oleate
solutions under oxygen for 24 hours.
Preliminary tests established that hydrazine did not interfere
with the analysis procedure for oleic acid. It was also established that
the adsorption of oleate by ilmenite which had been immersed in water at
pH 9.5 for 72 hours was the same as that obtained under normal adsorption
conditions (figures 32 and 36).

-102-
A solution of sodium oleate, of about the same concentration
as that to be used in the adsorption studies, was prepared as normal from
untreated (double distilled) water and sodium hydroxide. One batch
of this solution was agitated for 24 hours under nitrogen whilst three other batches were agitated for the same time under oxygen. The resultant
solutions were analysed for oleate and it was found that there was no detectable difference in the oleate concentration of the different batches.
There was, however, a significant difference in the ultra violet spectrum
of the two batches (which was observed by scanning the spectrum of the
oxygenated sample with the nitrogen sample as a reference solution). Such changes in the ultra violet spectrum are produced by oxidation
(78) products of oleate
-103-
8 RESULTS
8.1 Adsorption Studies
8.1.1 Preliminary investigations
The general formula for ilmenite (Fe, Mn, Mg) TiO 3 shows
that magnesium and manganese are both isomorphous with iron. Furthermore
it has been reported by Geis (18) that ilmenite from the Blafjell deposit,
near Tellnes where the samples used originated, contains 80% FeTiO 3' 1976 MgTiO 3 and 1% MnTiO 3' Consequently a ground sample of the ilmenite
was examined by the Analytical Services Laboratory at Imperial College,
and this revealed that the ilmenite contained 0.5216 magnesium.
Subsequent examination of a polished sample by the electron probe
microanalyser showed that the magnesium was evenly distributed throughout
the ilmenite.
Dissolution products of ilmenite -. in double distilled water
and in sodium hydroxide solutions were examined by atomic absorption
and this revealed 1.0 ppm magnesium in solution at pH 9.5 and 200C.
An increase in temperature and a decrease in pH each caused an increase
in the quantity of magnesium in solution although a decrease in pH had the
more pronounced effect (6.4 ppm Mg in solution at pH 7 and 20 0 C).
Less than 1 pým iron was in solution over the pH range 6-11 and
temperature range 20-75 0 C.
A number of tests were carried out to determine the effect
of temperature on the equilibrium pH of ilmenite suspensions prepared
at different initial pH values. At each temperature a sample of ilmenite
was agitated for 1 hour with sodium hydroxide solution of known
concentration and the change in pH was noted. From the results of a

-104-
number of these tests the net uptake of hydroxyl and hydrogen ions
was calculated at each pH and the curves presented in figure 30 were
constructed. These curves show that a reduction of temperature from
75 0 to 20C caused both an increase in the pH corresponding to zero
net uptake of H+ and OH- ions from 8.75 to 9.95 and a marked decrease
in the capacity for hydroxyl uptake. For relatively insoluble oxides
such as hematite and ilmenite the pH corresponding to zero net uptake
of H+ or OH- ions corresponds to the iso electric point of the mineral, (79)
and very often the iso electric point coincides with the zero point of (79)
charge
0 A zero point of charge at pH 9.5 (20 C is rather high for
ilmenite since hematite (Fe 203), a similar oxide, has the -zpc at 6.5-
8.5 (80)
and the zpc of . rutile (TiO 2) is even lower. The high zpc of
the ilmenite may, however, be explained by the presence of magnesium
which would, on dissolution, effectively raise the zpc.
8.1.2 Adsorption of oleate by ilmenite
A series of tests was carried out to determine the variation
of adsorption density with equilibrium pH over a pH range of 6-12 at
collector dosages of 1.75 x 10- 4M and 7.5 x 10⁻⁴ M. The results presented
in figure 31 show that, for each concentration, there was asharp increase
in collector adsorption with a decrease in pH from 10 to 7. Below pH 7
-4 at an initial oleate concentration of 1.75 x 10 the adsorption levelled
off at a value closely corresponding to 10016 adsorption, whilst below
pH 6.5 precipitation of oleate began and so invalidated the adsorption determinations. At an oleate concentration of 7.5 x 10- 4M bulk
precipitation began at pH 7.5 which was before an adsorption plateau had
been reached.

-105-
Figure 30 Adsorption density of OH- or H+ by ilmenit e as a function of pH at three temperatures
+600
eq
+500
ýl , +400 0
1 +Z +300
+200 "0
r.
m +i00 lö ci . 41 (D z
0.
-100
-200
75 C
20 aC
0
fy
9.0 9.5 10.0 10.5 pH

-106-
Figure 31 Adsorption of oleate by ilmenite as a, function of pH at two oleate concentrations
T-
18 -4 7.5 x 10 Mole/L
16
14'
12
C14
5 I-0,10 - 1.75 x 10 Mole/ L
4ý -4 W
8
0 -4 41
ra, 0
$w4
0
4
2
0ý
6', 18 ýý , 10 pH
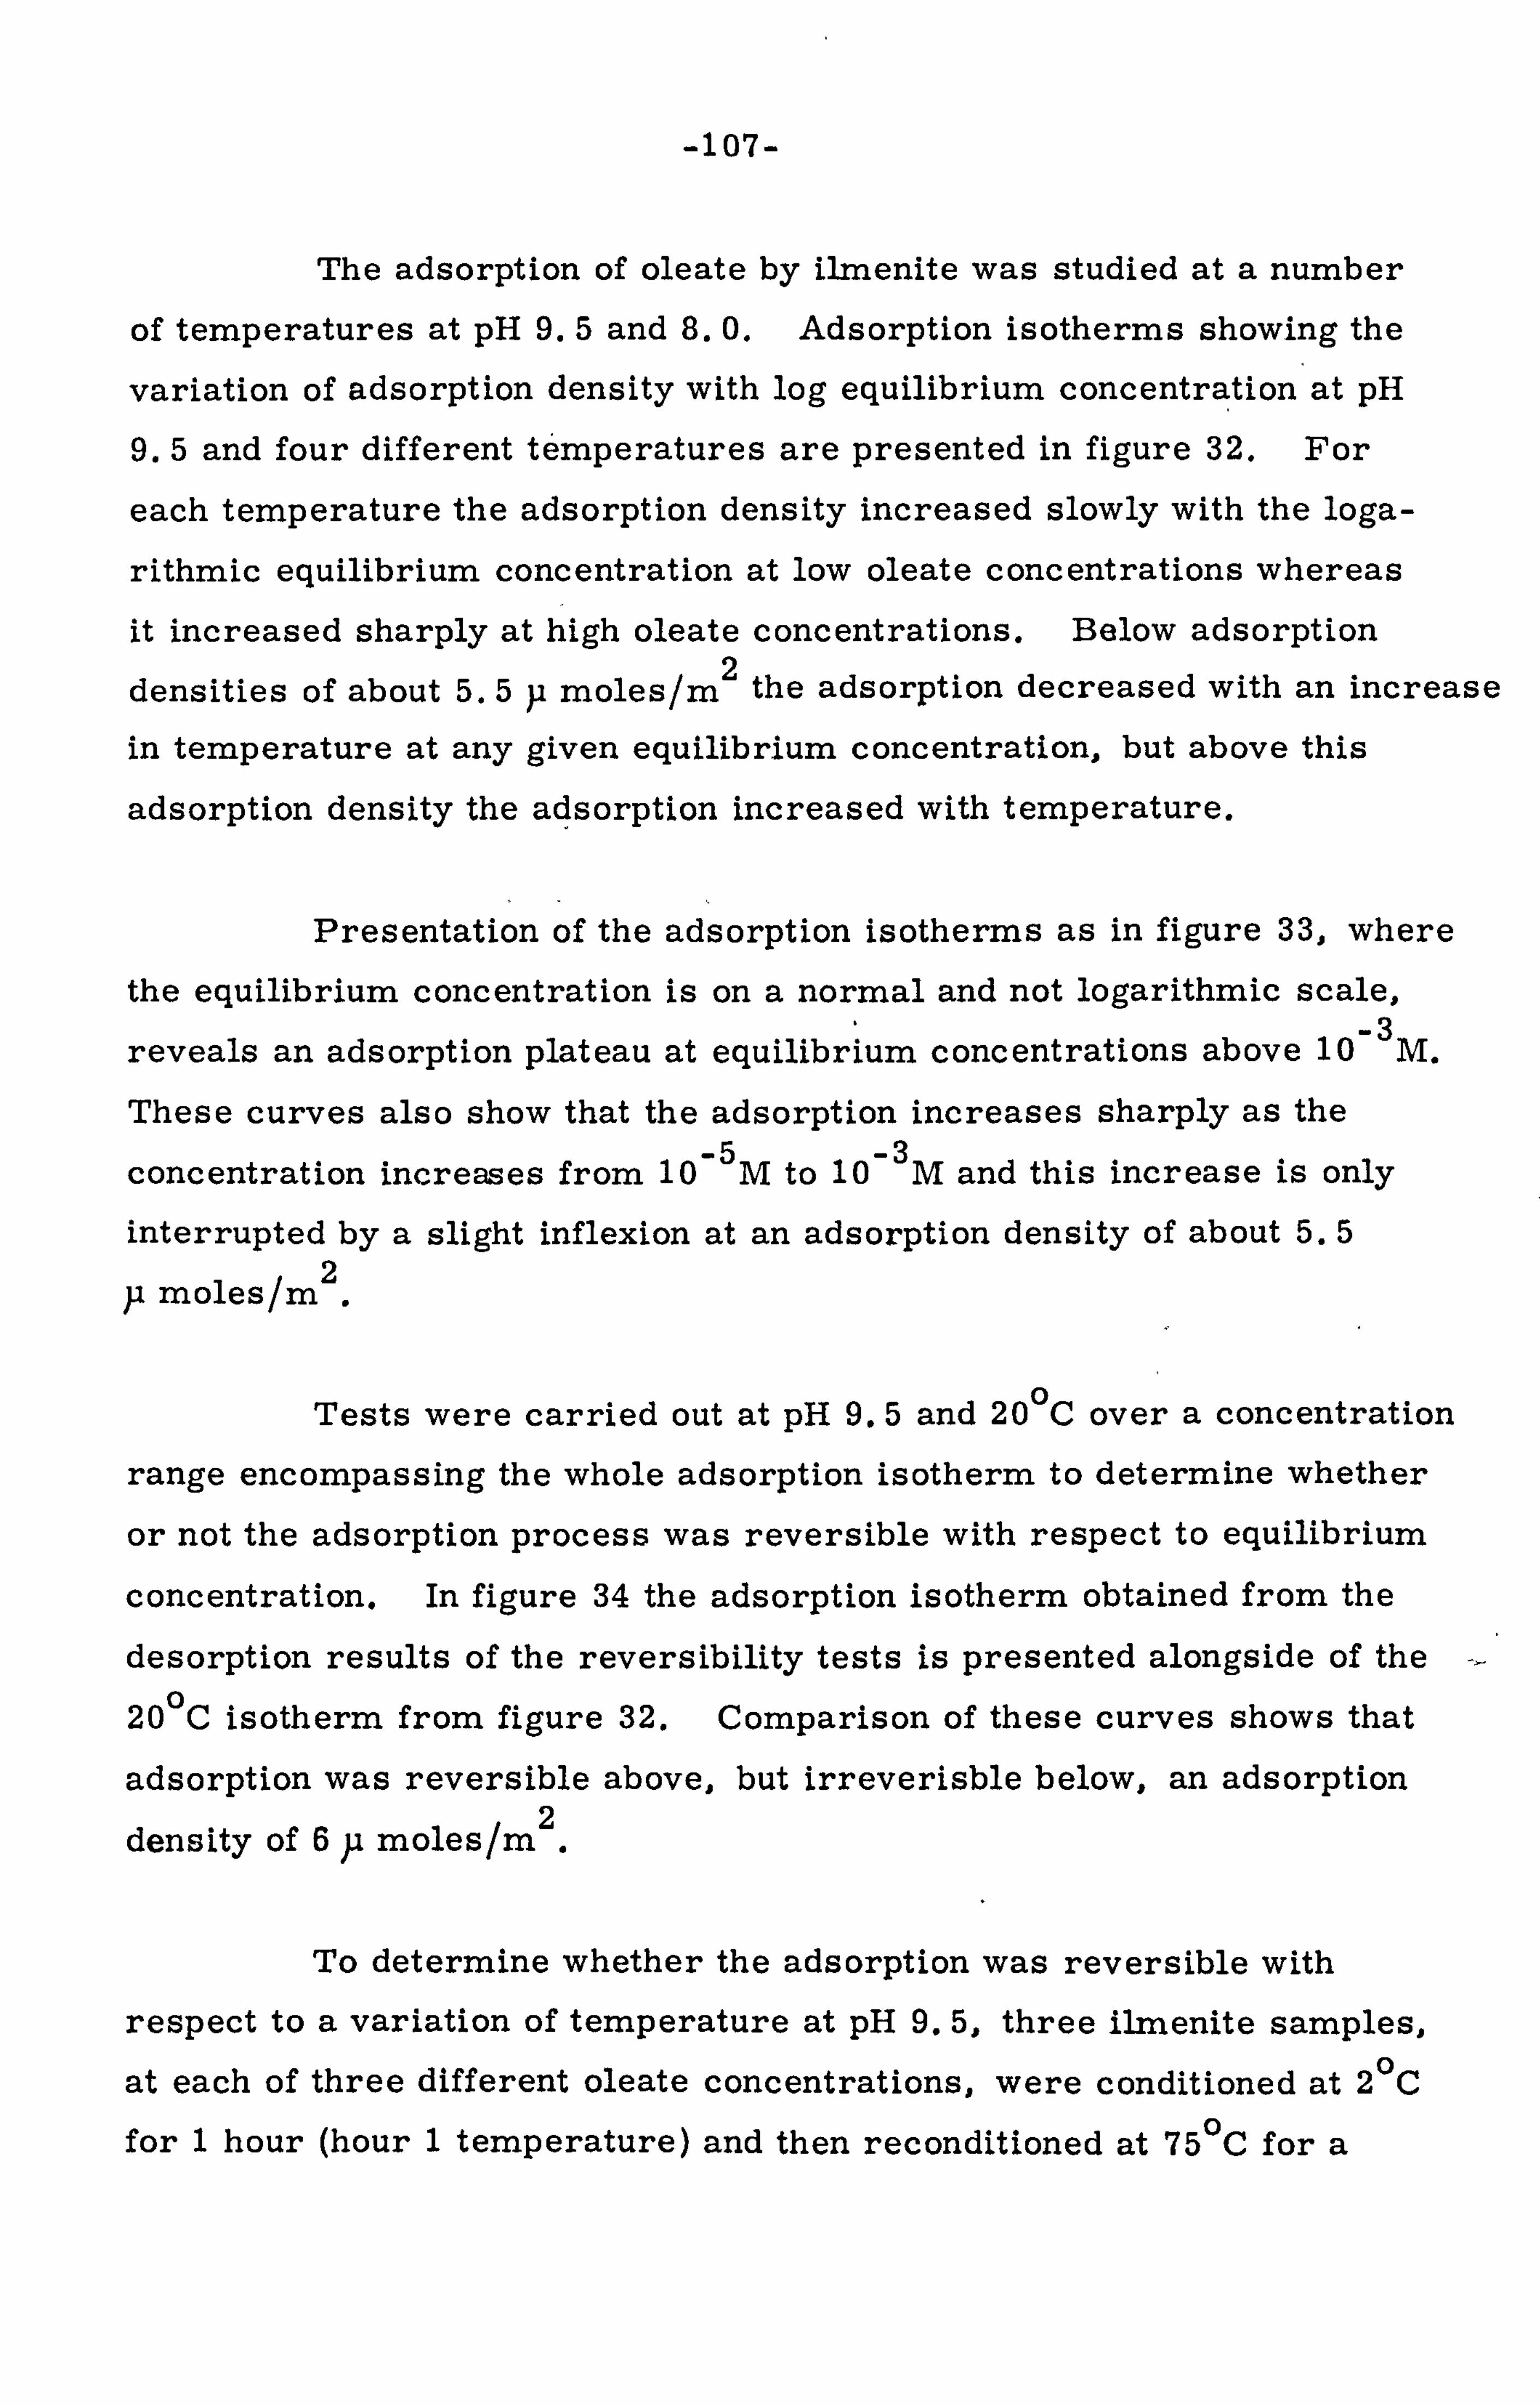
-107-
The adsorption of oleate by ilmenite was studied at a number
of temperatures at pH 9.5 and 8.0. Adsorption isotherms showing the
variation of adsorption density with log equilibrium concentration at pH
9.5 and four different temperatures are presented in figure 32. For
each temperature the adsorption density increased slowly with the loga-
rithmic equilibrium concentration at low oleate concentrations whereas
it increased sharply at high oleate concentrations. Below adsorption
densities of about 5.5 y moles/m 2 the adsorption decreased with an increase
in temperature at any given equilibrium concentration, but above this
adsorption density the adsorption increased with temperature.
Presentation of the adsorption isotherms as in figure 33, where
the equilibrium concentration is on a normal and not logarithmic scale,
reveals an adsorption plateau at equilibrium concentrations above 0 -3 M.
These curves also show that the adsorption increases sharply as the
concentration increases from 10- 5M to 10- 3M and this increase is only
interrupted by a slight inflexion. at an adsorption density of about 5.5 2
y moles/m
Tests were carried out at pH 9.5 and 20 0C over a concentration
range encompassing the whole adsorption isotherm to determine whether
or not the adsorption process was reversible with respect to equilibrium
concentration. In figure 34 the adsorption isotherm obtained from the
desorption results of the reversibility tests is presented alongside of the
20 0C isotherm from figure 32. Comparison of these curves shows that
adsorption was reversible above, but irreverisble below, an adsorption 2 density of 6, g moles/m
To determine whether the adsorption was reversible with
respect to a variation of temperature at pH 9.5, three ilmenite samples,
at each of three different oleate concentrations, were conditioned at 20C
for 1 hour (hour 1 temperature) and then reconditioned at 75 0C for a
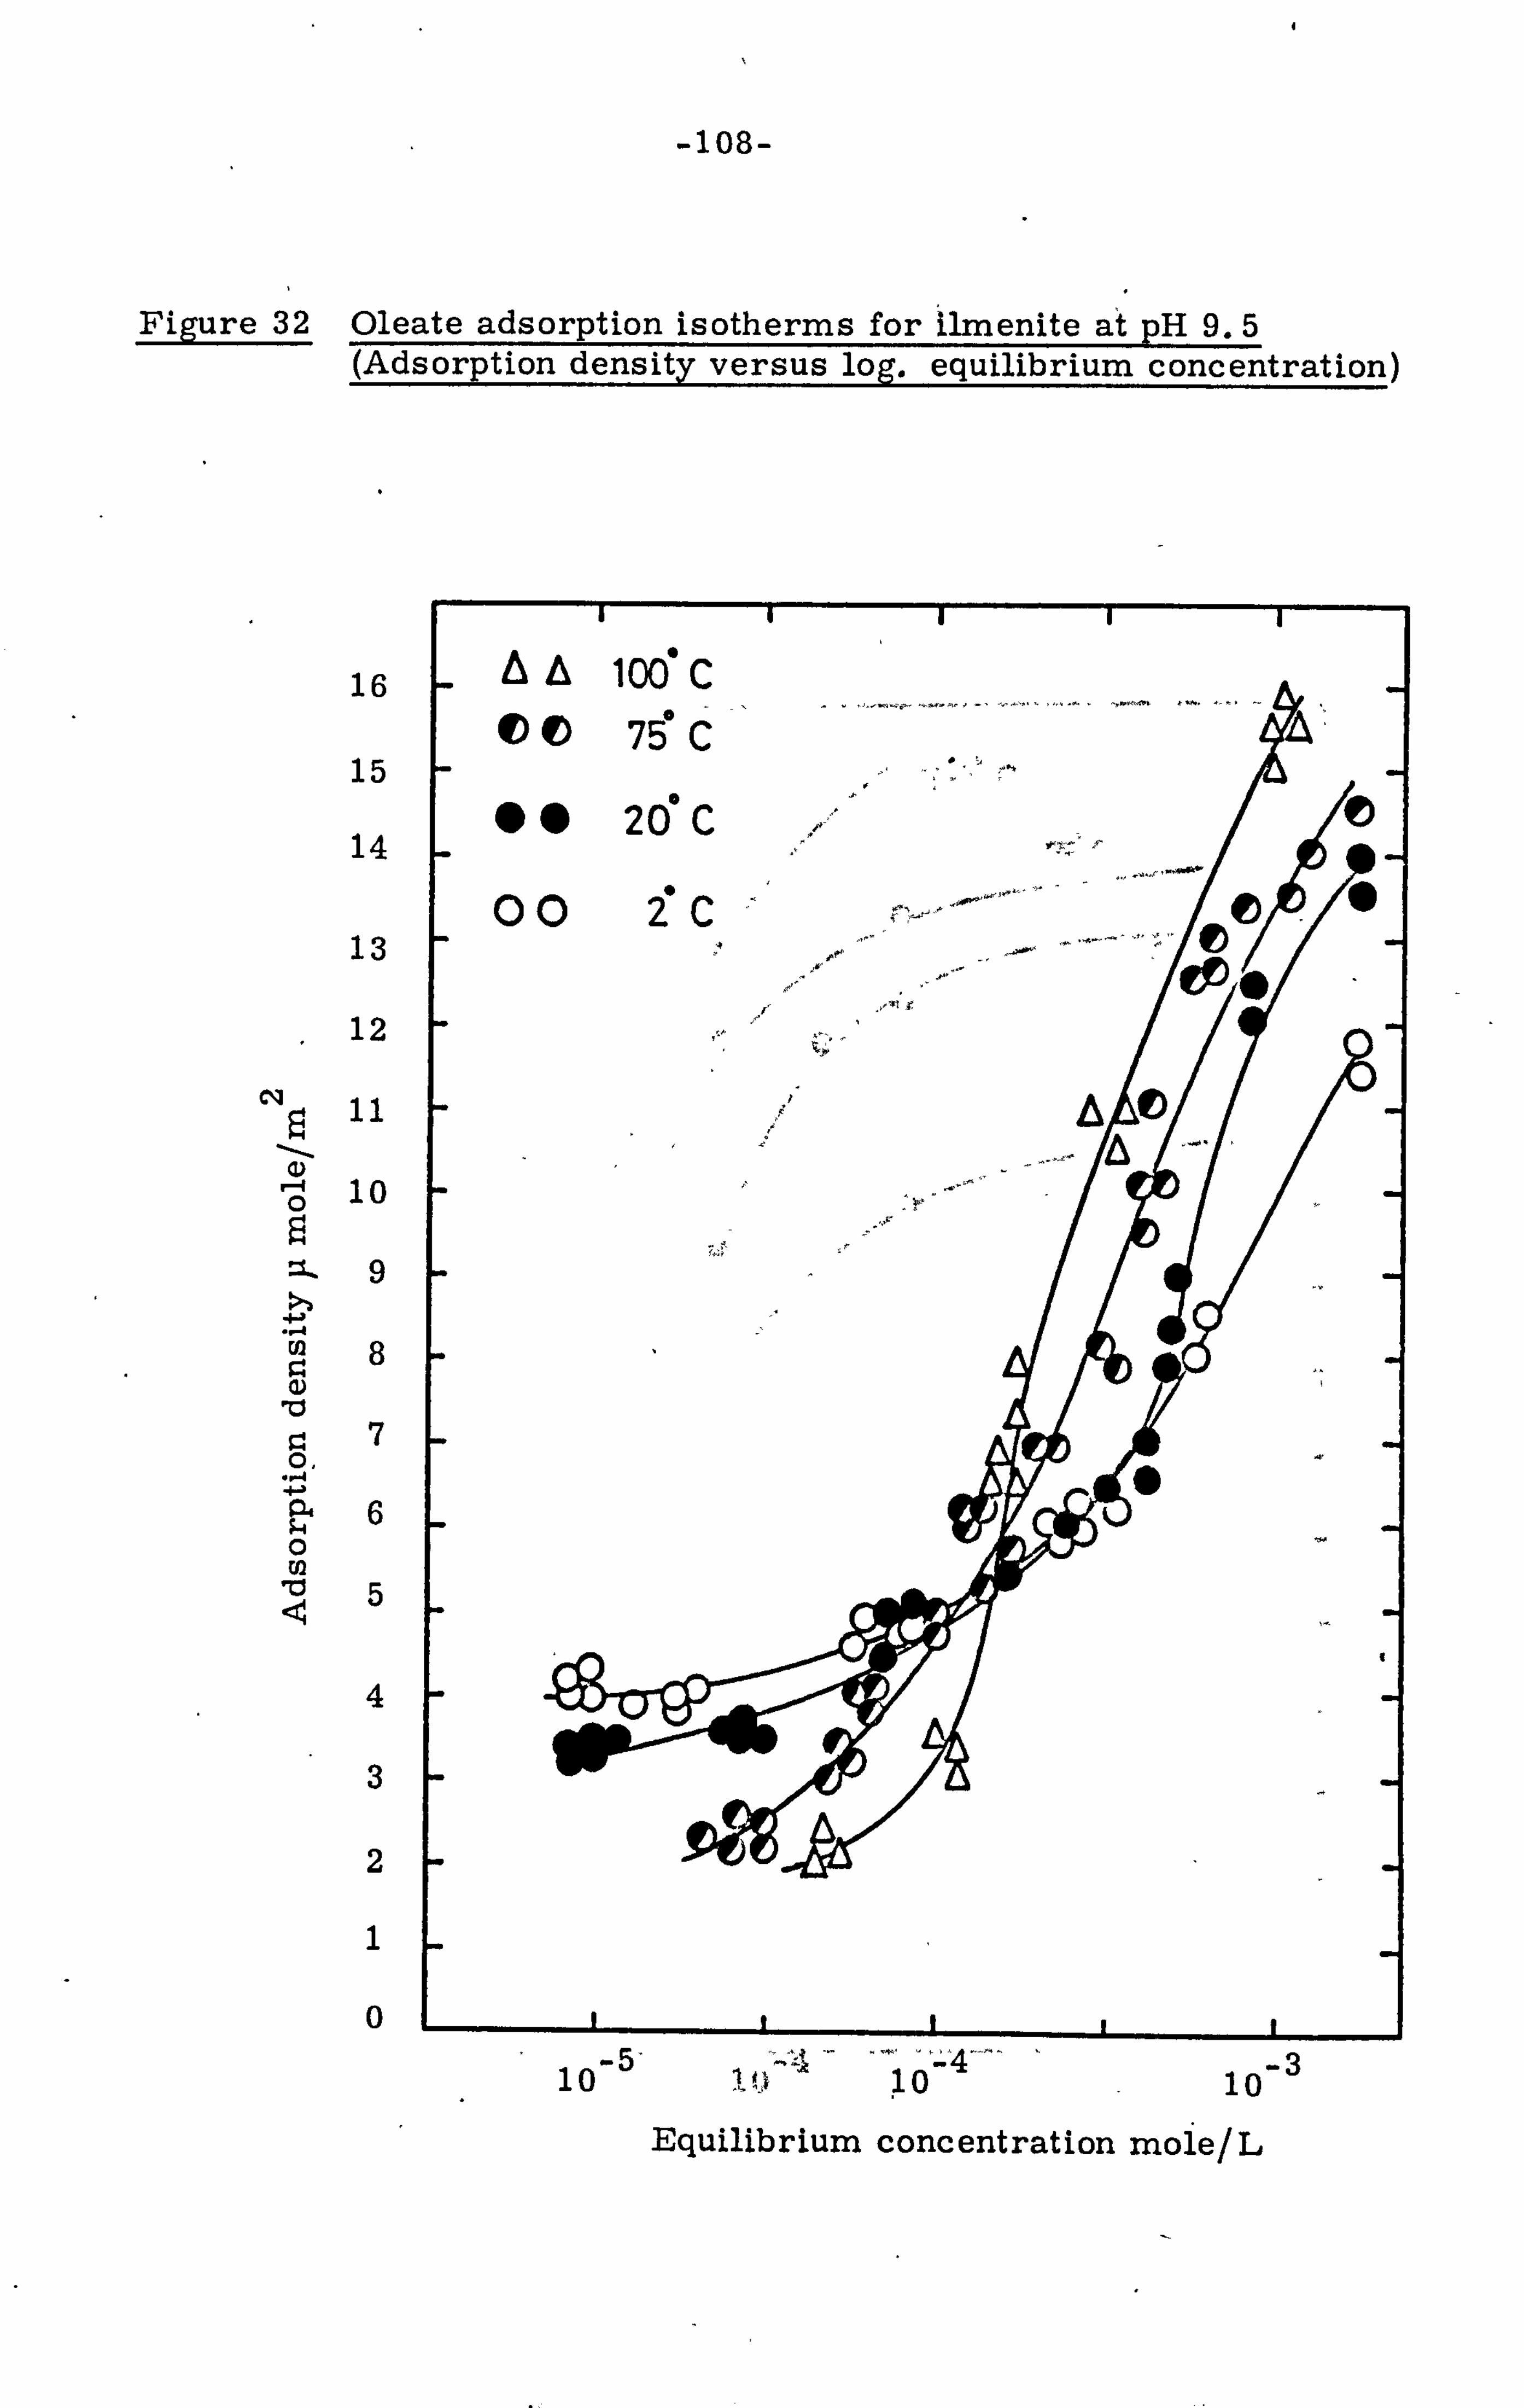
-108-
Figure 32 Oleate adsorption isotherms for ilmenite aIt pH 9.5 (Adsorption density versus log. equilibrium concentration)
16
15
14
13
12
cq
10
9
Ici r. 7
10 5
4
3
A lo(ý c 00 Tý C
00 26C 00 C
I
- 5' 1i- -11 -- --'' "4--" ''3 10 . 10 10-
Equilibrium concentration mole/L

-109-
Figure 33 Oleate adsorption isotherms forý ilmenite at pH- 9.5 1
. (Adsorption density versus equilibrium concentral-lon
16
14
cli 10
0 0
10
.4
75
2d 12
2'*C-
I
-I 1ý I--, I --", ý, -, - -", "- "' , I-- "- "- - -- --, "6, -, ---
10- 5 10- 4 5xlO- 4 10- 3 0.5xlO- 5
Equilibrium concentration mole/L
2

-110-
Figure 34 The reversibility of oieate adsorption at the ilmenite/ water interface with respect to equilibrium concentration at pH 9.5 and 20-C
14
12
10
C14
10 0 0
10 -el
2
0
69
desorption curve 00-
ormal isotherm
543 10- 10- 10-
Equilibrium concentration, mole/ L

-111-
Figure-35 The, reversibility of oleate adsorption at the ilmenite/ water interface with respect to temperature at pH 9.5
18
16
14
12
cli
10
; 11
-4 8
0 0
-4
0 W 1 10,
2
(1
00 1 ýIr.
at 75 0C then'l hr. 'at 20C 040 1 hr. at 20 C then 1 hr. at 750C
AA 1ý hr. ' at 75 0C then 3 hr. ýIat-20Cý, A AA 1 hr. at 20 C then 3 hr. at750C900
1 00
2" C
Tý C C30 preconditioned in H20 at - 750C preconditioned in H0 aý - 2 20C
10 -0 10 -41
10- j
Equilibrium concentration rnole/L
-112-
further hour (hour 2 temperature). Similarly other samples were first
conditioned at 75 0C and reconditioned atI- 20C. The variation of adsorption density with logarithmic equilibrium concentration at the temperature of
reconditioning is shown by curves A and B in figure 35. Also shown in
this figure are the adsorption isotherms obtained at 20 and 75 0C from
figure 32. Comparison of curve A with 1 and B with 2 shows that for
a given equilibrium concentration the adsorption density for the reconditioned
samples was greater than that for the samples conditioned only at the
reconditioning temperature. Furthermore, at any given equilibrium
concentration, the adsorption density was greater for curve A where the
pulp was reconditioned at 20C than for curve B where the pulp was
reconditioned at 75 0 C. The latter, however, contraist with the relative
positions of the 20 and 750C isotherms. To determine whether or not the reconditioned samples were at equilibrium a number of ilmenite samples
were reconditioned at hour 2 temperature for three hours. The results
of these tests are also presented in figure 35 where it can beýseen that
although the adsorption densities were in both instances lower than curves A and B they were still above those in curves 1 and 2; here, however,
the adsorption density was greater for the pulp reconditioned at 750C than
for the pulp reconditioned at 20C.
To determine if the ageing of the ilmenite surface at different
temperatures had an effect on the adsorption, tests were conducted
on samples of ilmenite that had been aged in distilled water at the relevant temperature and pH for several hours. The adsorption results showed that ageing of the ilmenite at a given temperature had no effect on
subsequent adsorption.
Adsorption isotherms showing the variation of adsorption density with the logarithmic oleate equilibrium concentration at pH 8.0

-113-
and three different temperatures are presented in figure 36. These
isotherms are of a similar shape to those obtained at pH 9.5, however,
the isotherms at pH 8.0 do not intersect. At a given dquilibrium
concentration and temperature the adsorption density at pH 8.0 (figure
36) was much greater than at pH 9.5 (figure 32). An increase in temperature
had the effect of shifting the isotherms to higher adsorption densities
thereby increasing the adsorption density at a given equilibrium concentration.
The reversibility of adsorption with respect to equilibrium
concentration was determined at pH 8.0 and 750C over a concentration
range encompassing the whole adsorption isotherm. It was not possible,
because of the detection limit of the analytical technique, to study the
reversibility at lower equilibrium concentrations where the adsorption density would correspond more closely to a monolayer coverage. The
results are presented in figure 37 and show that, over the region studied,
the adsorption process was reversible.
During the adsorption tests a small increase in pH was observed. This effect was investigated further with samples of ilmenite that were
conditioned at pH 9.5 before the addition of sodium oleate at the same
pH. In all these tests a rise of pH, within the range 0.05 to 0.15 units
was detected. This observation is consistent with the ion exchange of
surface hydroxyls for oleate ions at low adsorption densities.
8.1.3 Adsorption of Oleate by Anorthite
Tests were carried out to determine the variation of oleate
adsorption at the anorthite/water interface with equilibrium pH at
collector dosages of 1.75 x 10- 4M and 7.5 x 10⁻⁴ M. The results of
these tests, presented in figure 38, show that between the pH corresponding

-114-
Figure'36 Oleate adsorption i sotherms for ilMenite' at pH 8.0 ,' (Adsorption density versus log. equilibrium concentration)-,
30
26
22
0 18
4ý -4
10
14 0 0 I.,
-4
P4 ;4
0
w
"o 10
. 11,
6
2
750C
-00 2Cr C
00 ZC
, -5 --4 -3 10 10 '10
Equilibrium concentration mole/, L
4

i
-115-
Figure 3 The reversibility of oleate adsorption atAhe ilmenite/wate interface with respect to equilibrium concentration at pH 8.0 and 75-C
30
26
22
18
14
ý"o
10
6
2
cr"
-3 lu IU lu
Equilibrium concentration' mole/ L
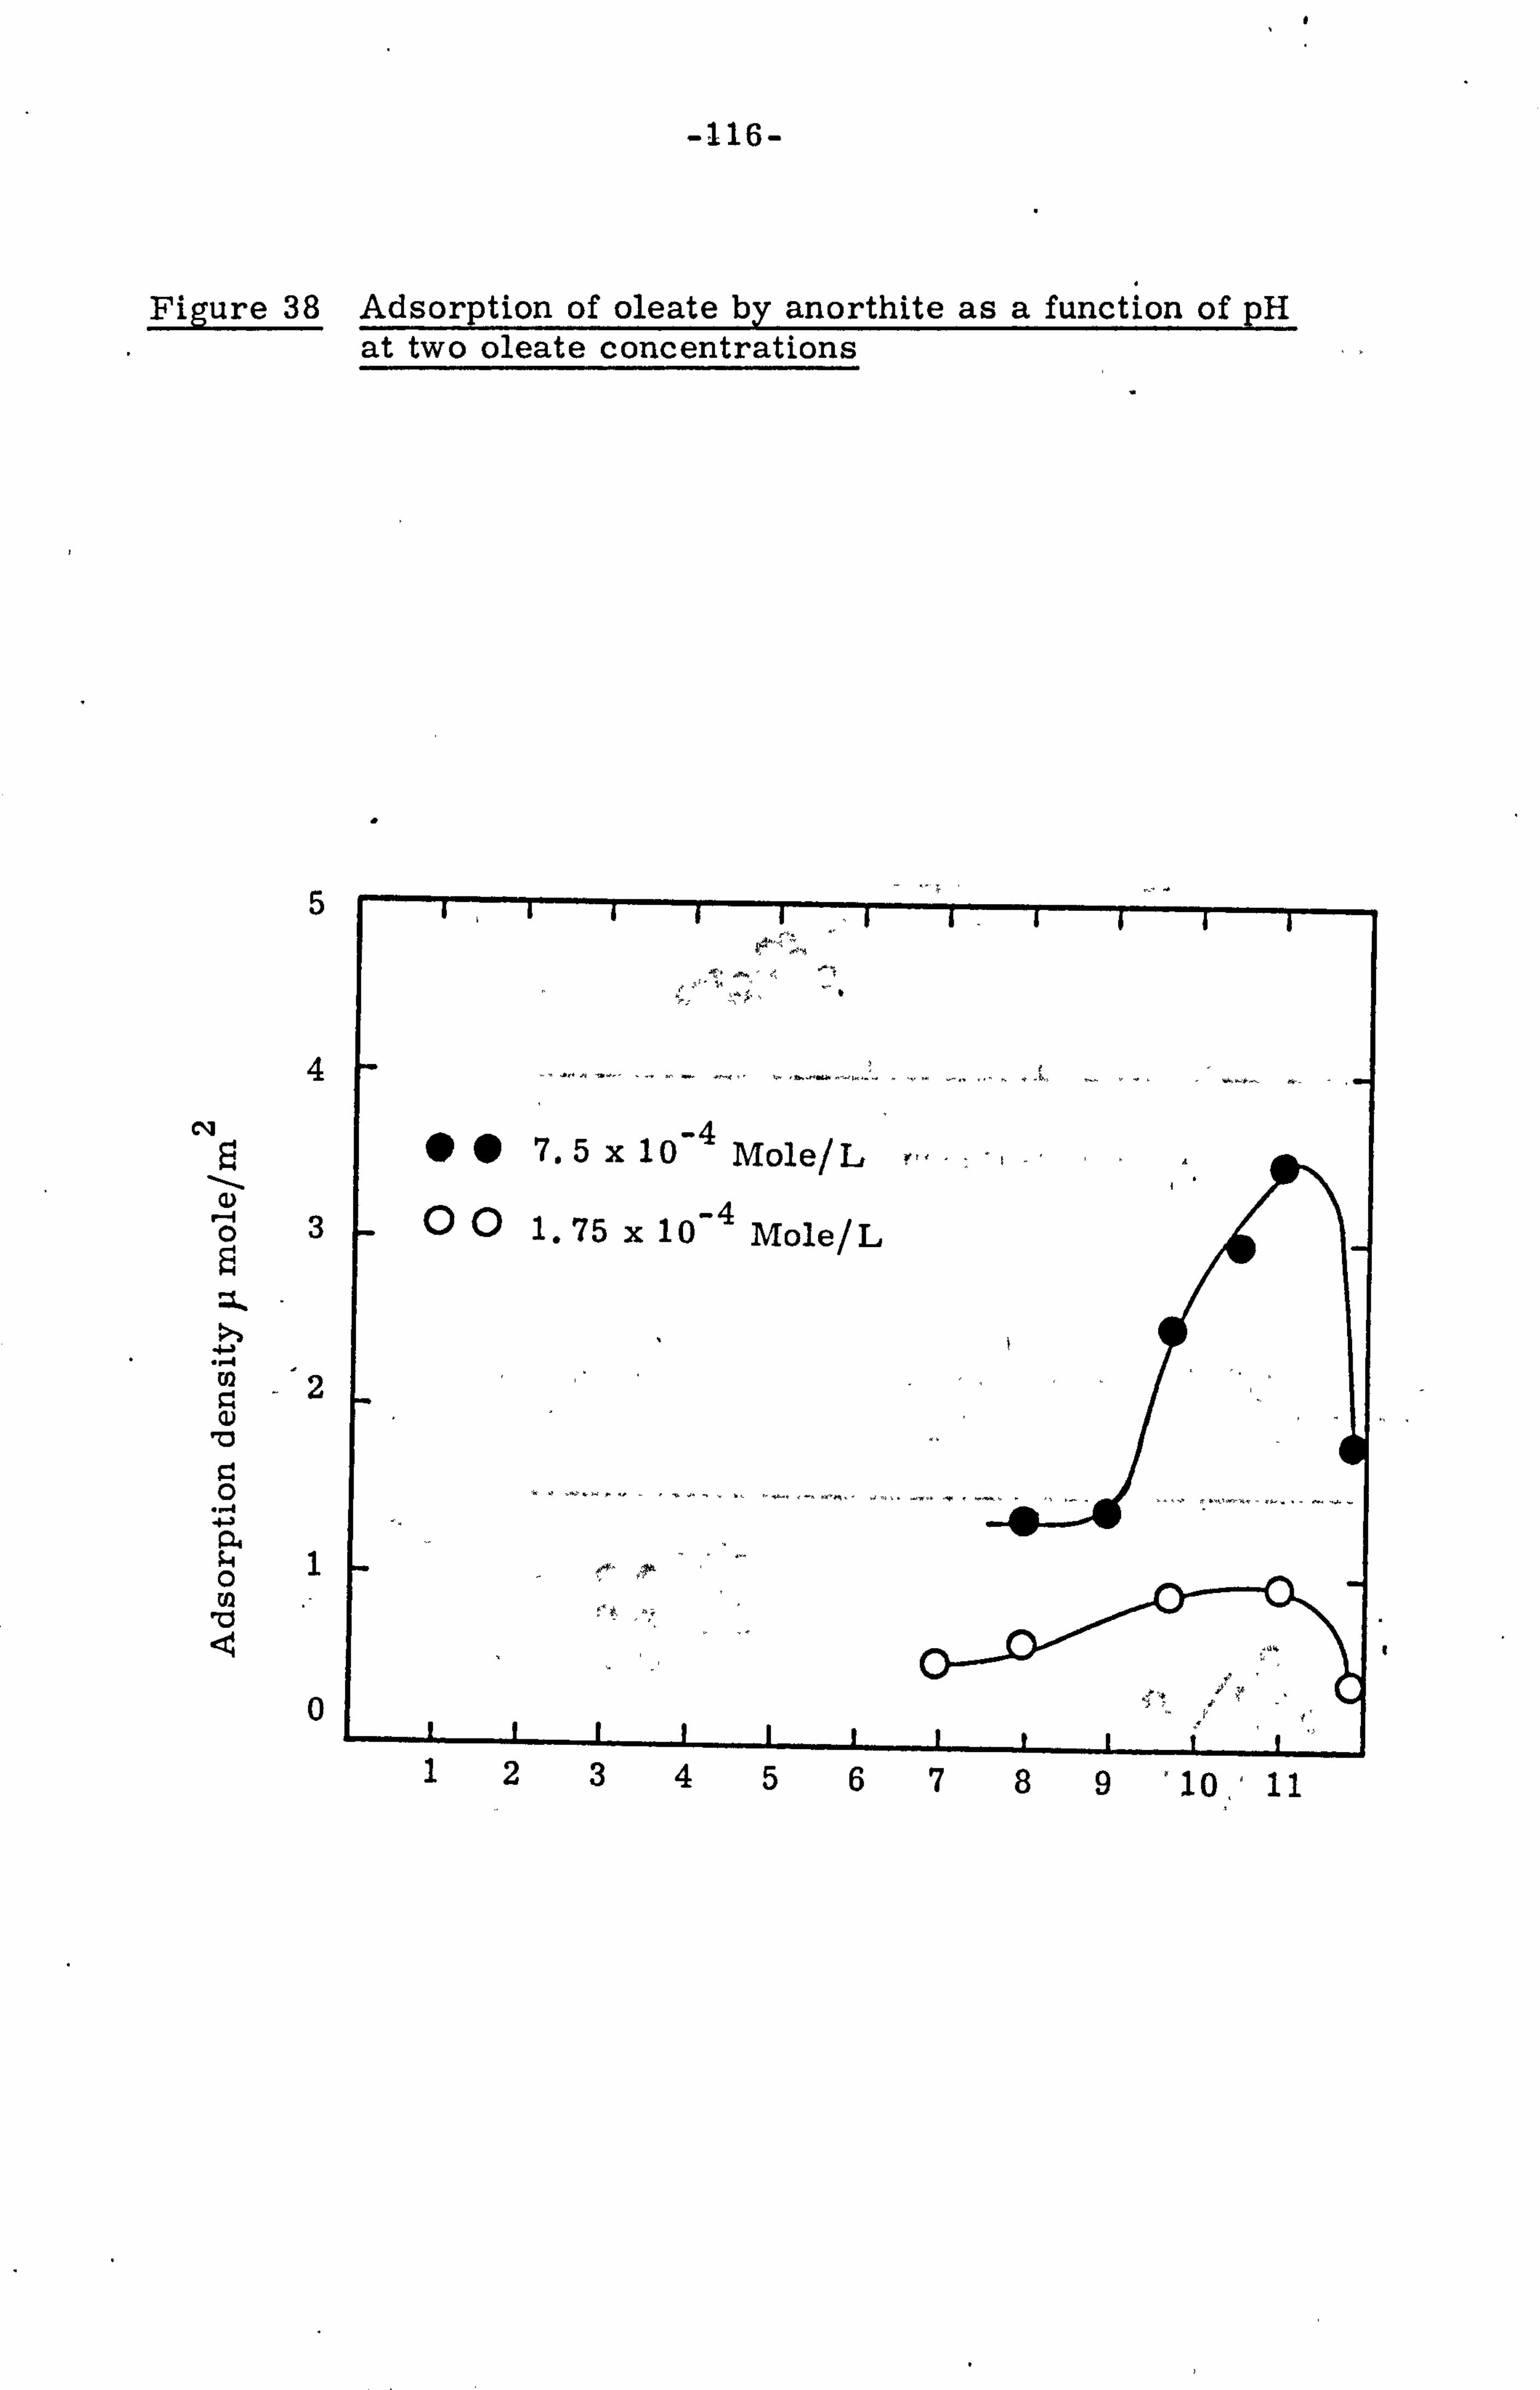
-116-
Figure 38 Adsorption of oleate by anorthite as a function of pH at two oleate concentrations
5
4 C14
0
4.. -4
cu
0 Q4
;. 4 1
0
10
0
--T
40 40 7.5 x 10- 4 Mole/ L
00 1.75 x 10⁻⁴ Mole/ L
II
I
1

-117-
Figur6 39 Oleate adsorption isotherms for anorthite at pH 9.5 (Adsorption density versus log. equilibrium concentration)
7
10 0 In4 ;
-4 0
w
10
".
-3 lu 10
Equilibrium concentration mole/L
Figure 40 Oleate adsorption isotherms for anorthite at pH 8.0 (Adsorption density versus log. equilibrium concentration)
I
"0 0
.4
q
JL VIU
Equilibrium concentration mole/L

-118-
to oleate precipitation and pH 9.0 there was little oleate adsorption (less
than 1.5 ja moles/m 2 ), howevbr, as the pH increased from 9 to 11 the
adsorption increased to a maximum of 3.5 p moles/m 2
at 7.5 /x
10-4 M and
1.0 p moles/m 2
at 1.75 x 10⁻⁴ M. With a further increase of pH,
beyond 11, the adsorption decreased sharply. The adsorption peak at an 4 initial concentration of 7.5 x 10 M was much more pronounced than at
1.75 x 10⁻⁴ M.
Adsorption isotherms showing the variation of adsorption
density with logarithmic equilibrium concentration at pH 9.5 and at three
different temperatures 'are shown in figure 39. With an increase of
oleate concentration the adsorption density increased slowly, levelled 2
off at about 2.5 p moles/m , and then increased markedly as the
concentration approached 2x 10- 3 M. A variation of temperature between
20 and 750C had no apparent effect on the adsorption isotherm.
00 The oleate adsorption isotherms obtained at pH 8.0 and 2,20
and 75 0C are presented in figur e 40. In contrast to the adsorption at
pH 9.5 temperature did have an effect on oleate adsorption at pH 8.0;
an increase in temperature caused a displacement of the adsorption
isotherms to lower equilibrium concentrations and so increased the adsorption
density at any given equilibrium concentration. The adsorption densities
wer6,, at a given equilibrium concentration at pH 8.0, lower than at pH 9.5
and this is the opposite to that observed in the ilmenite-oleate system.
The adsorption of oleate by anorthite was completely reversible
with respect to equilibrium concentration at both pH 8.0 and 9.5.
8.2 Contact Angle Studies
To determine the effect of temperature on the hydrophobicity
of collector coated mineral samples (ilmenite or anorthite) under known
-119-
conditions of oleate equilibrium concentration, the contact angle at the
mineral/ liquid/ air interface was measured at different temperatures and
at pH 8.0 and 9.5. Although the hydrophobicity, defined by the contact
angle, is not enough to describe the flotation properties of a given solid,
since the conditions connected with the speed of displacement of the liquid
layer between solid particle and bubble must be also fulfilled, (81,82)
contact angles do, in conjunction with adsorption studies, provide more
precise information about the effect of temperature on the actual hydro-
phobicity of the collector coated mineral at a given surface coverage and
allow consideration of the collector orientation at the adsorbed collector/
aqueous solution interface.
8.2.1 Contact angle with ilmenite
The contact angle between ilmenite, air and water was measured
as a function of oleate concentration at pH 9.5 and at three different
temperatures. The results are presented in figure 41 and show that, at
each temperature, the contact angle increased with oleate concentration to a maximum at about 1x 10⁻⁴ M. As the concentration increased beyond
this the contact angle decreased sharply. With an increase of temperature
the contact angle and the range over which contact was obtained, both
increased.
The contact angles at pH 8.0 (figure 42), at a given temperature
and equilibrium concentration, were more or less the same as at pH 9.5.
In figures 43 and 44 the contact angles are presented as a function of the oleate adsorption density at the ilmenite/aqueous oleate interface at pH 9.5 and 8.0 respectively. For the construction of these figures it was assumed that the surface area of the samples used

-120-
Figure 41 ' Contact angles with ilmenite at pH 9.5
9u
80
70
60
50 bD 0 cd 40
Cd 0 30 0 u
20
10
0
0
75 C
200C
ft
II -7-6-5-4-3 10 10 10 10 10
EquilibriUm concentration mole/L
Figure 42 Contactangle with ilmenite at pH 8.0-- 90
80 75 C 70
60 20 C
50 Cd
40 Cd 0 U 30-
20-
10 2C
0[ , -, - i, , --I 10- 7
10- 6 10- 5
10- 4 10- 3
Equilibriurh concentration mole/L
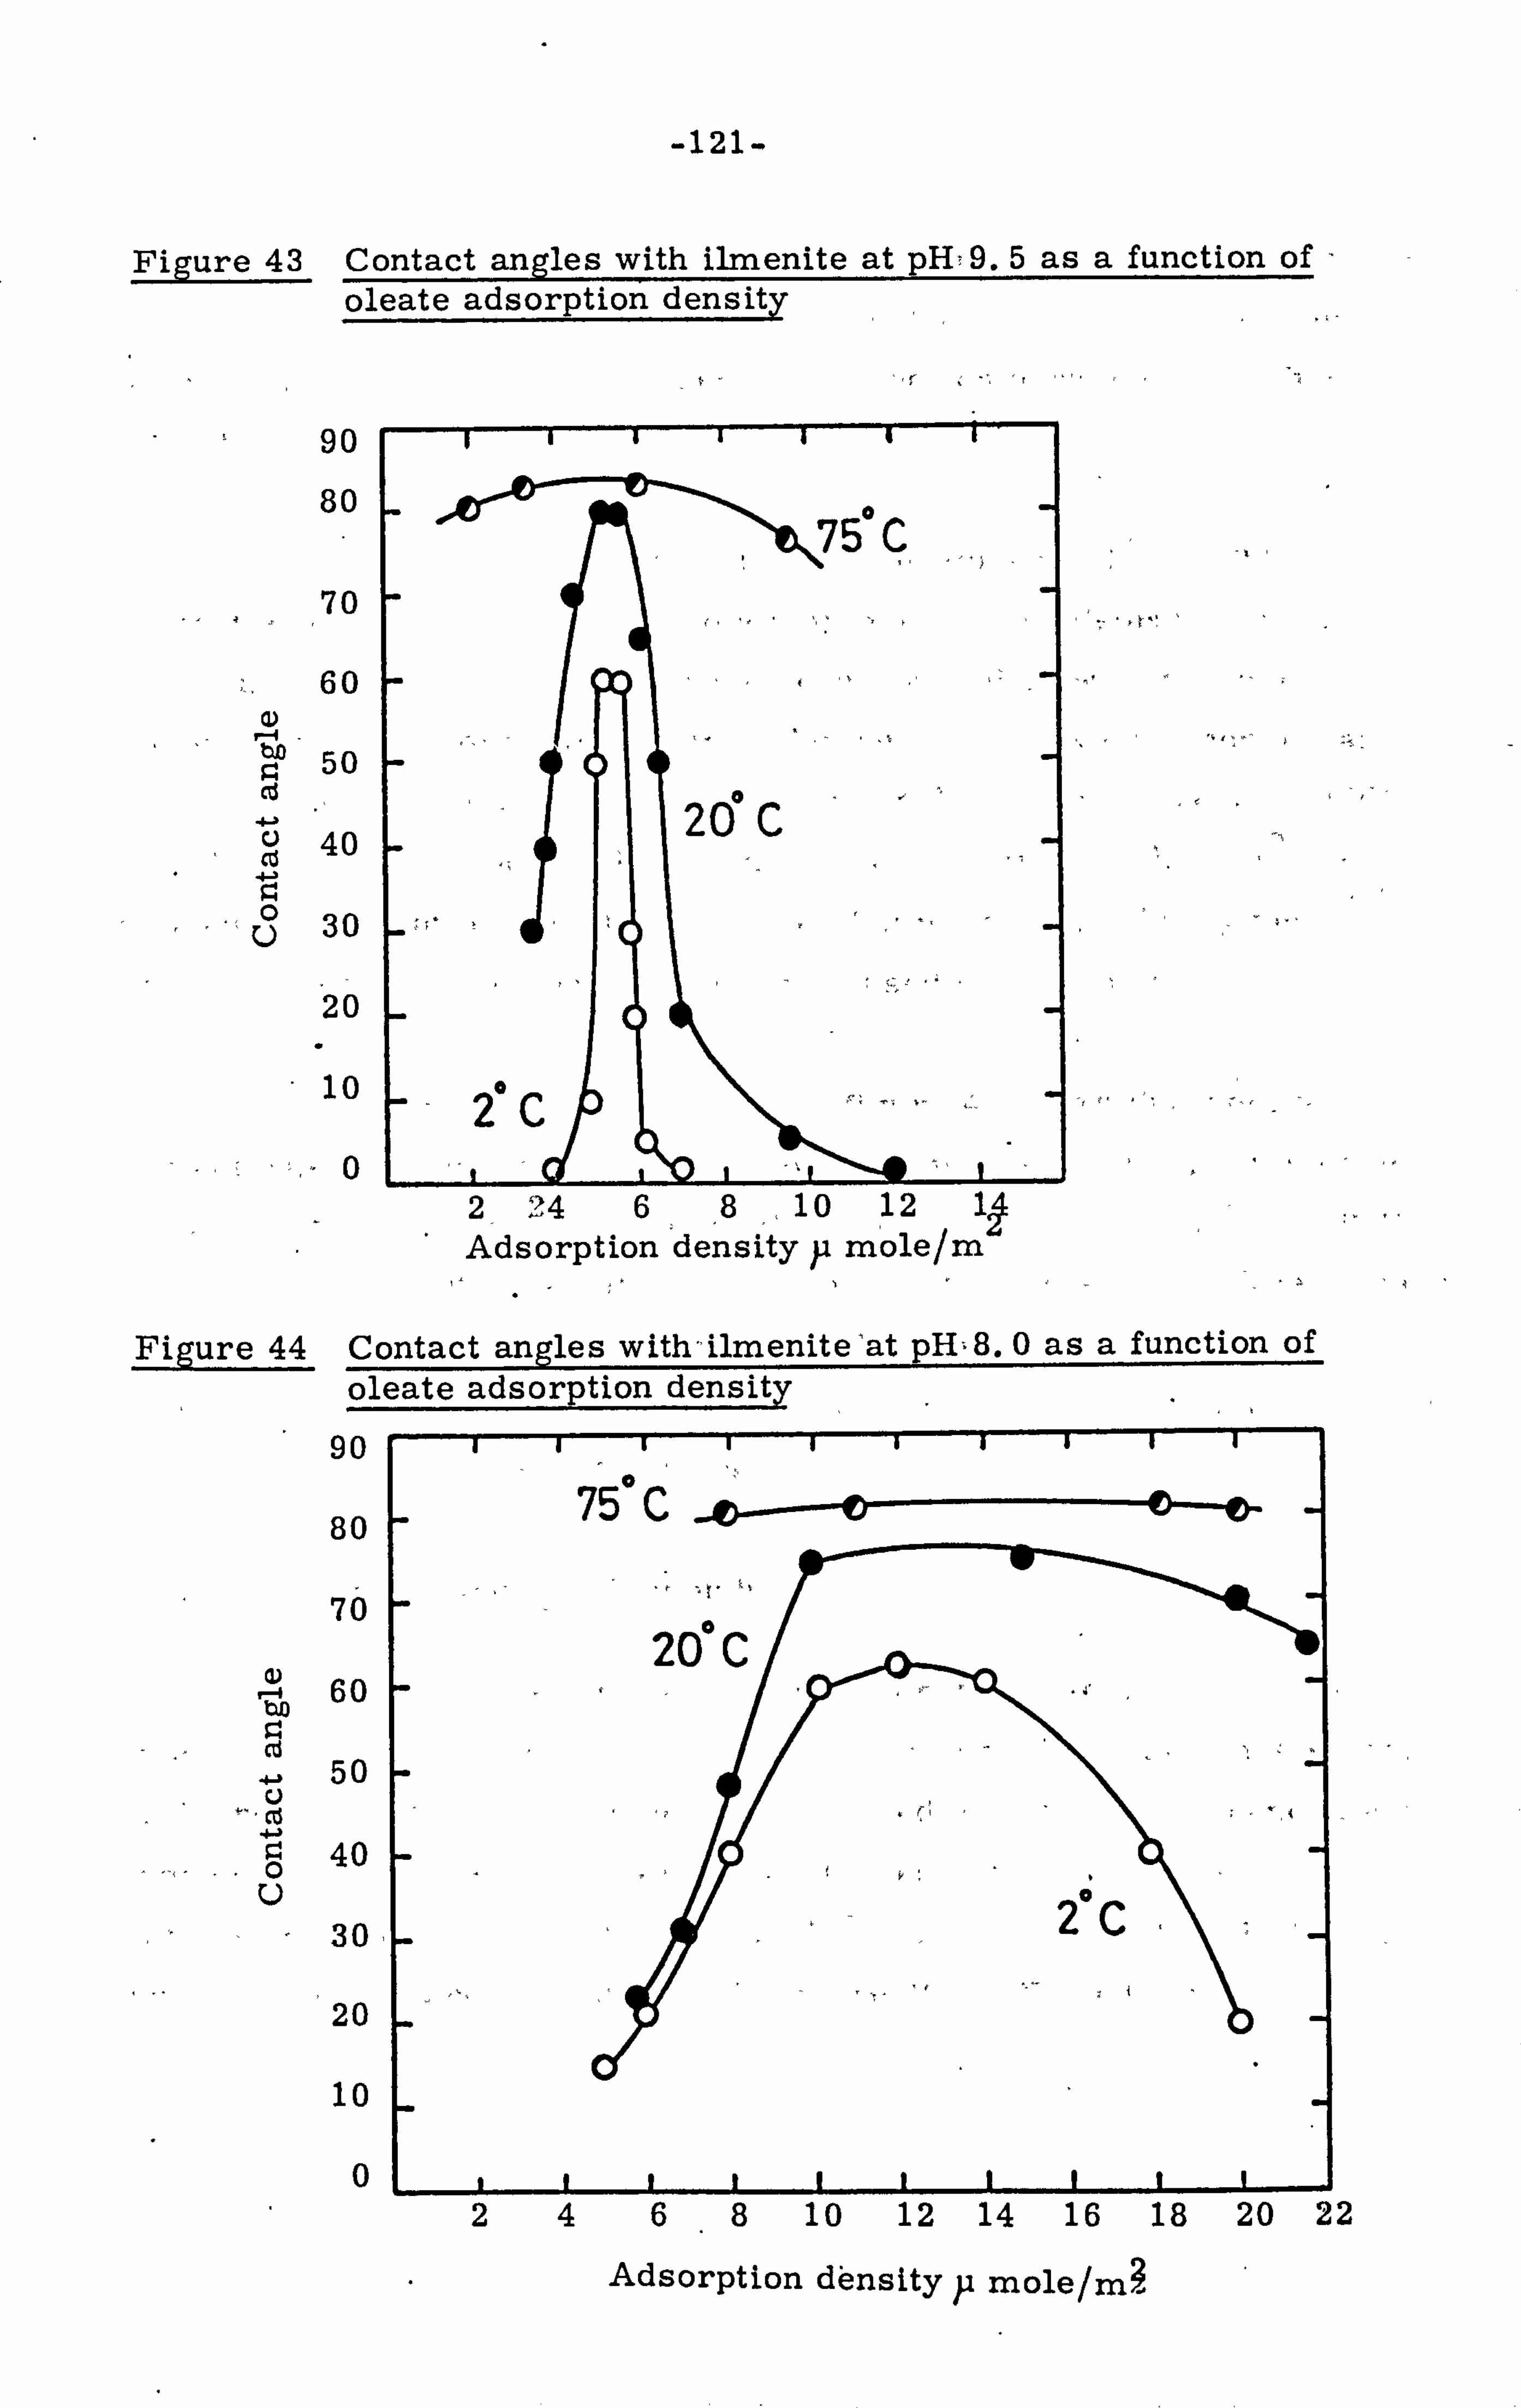
-121-
Figure 43 Contact angles with ilmenite at pH, 9.5 as a function of oleate adsorption densit
90
80
'70 60
50 Cd C 40
0 U 30
20
10
0 2- 24 6ý8,10
'12 11
Adsorption densityp mole/m
Figure 44 Contact angles with - ilmenite'at pH-. 8.0 as a function of oleate adsorption densit
90
80
70
60 tto cd
50 Cd
40 0 u
30,
20
10
0 2468 10 12 14 16 18 20 22
Adsorption dbnsity p mole/m?,

-122-
in the contact angle studies was negligible and that the equilibrium oleate
concentration was equal to the initial concentration. Adsorption densities
at the required equilibrium concentration and temperature were then taken
from the appropriate adsorption isotherm.
At pH 9.5 (figure 43) and at temperatures of 20 and 200C the
contact angle increased rapidly to a maximum at an adsorption density
of 5.5 p mole/m 2
and then decreased equally rapidly with a further
increase of the adsorption density. Although the maximum contact angle
at 750C was at 5.5 p mole/m 2
the contact angle did not decrease rapidly
at either side of the peak; the contact angle was greater than 75 0 over 2
a range of adsorption density from 2 to 10 p mole/m At a given
adsorption density the contact angle increased with temperature.
The contact angles at pH 8.0 (figure 44) show that appreciable
contact was only established at adsorption densities above 5.5 'P mole/M2
This is quite different from the results at pH 9.5 where, at 20 and 20 0 CS
little contact was obtained at such high adsorption densities. The contact 2
angle maximum in figure 44 is at about 12 ju mole/m . and at higher
adsorption densities the contact angle did decrease but much more rapidly
at 20C than at higher temperatures.
8.2.2 Contact angle with anorthite
The contact angle - equilibrium oleate concentration curves
obtained for anorthite at pH 9.5 and at different temperatures are shown
in figure 45. ' At 20C no contact was obtained over the oleate concentration
range studied. However, there was a tendency for the bubble to cling to the sample at concentrations below 10-4 M. Similarly for pH 8.0 no contact was obtained at 20 and 20 0C (figure 46). For each pH the

-123-
Figure 45 Contact angle with anorthite at pH 9.5 ý,
90
80
70
60
bn
co 50 44
40 0 u 30
n --, 20
10
0
7ý'C
ýo 41 C
10- 7 10- 6 10- 5 10- 4 1'0- 3
Equilibrium concentration mole/L Figure 46 Contact angle with anorthite at pH 8.0
90
80
70
60
50 bM 0
cd 40
Cd 41 30 9.4 0
20
10
0
10- '1 - 10- 6 10- 5 10- 4 10- 3
Equilibrium concentration mole/L

0
-124-
Figure 47 Contact angle with anorthite, at; pI-r, 9.,. 5'., ýas a function of oleate adsorption densit
90
80
70
60
CD -1 bD 50 r. Cd
-61 40 ci Cd 0 30 u
20
10
0
750 C
'20 41 C
12324 Adsorption densityp mole/m
Figure 48 Contact angle with anorthite at pH 8.0 as a function of oleate adsorption densit
90
80
70
60
50
40 Cd 9 0 30
20
10
0 1234
Adsorption densityp mole /m2

-125-
maximum contact angle was at an oleate concentration of approximately 10- 4 M. Over the whole concentration range at 75 0C the contact angles
at pH 9.5 were higher than those at pH 8.0. As with the ilmenite an
increase in temperature produced an increase in contact angle at both
pH 8.0 and 9.5.
The contact angles with anorthite are presented as a function of
oleate adsorption density at pH 9.5 and 8.0 in figures 47 and 48 respectively.
Figure 47 shows that for a pH of 9.5 contact was only obtained at adsorption 200 densities of less than 2.5 )1 mole/m at both 20 and 75 C. The contact
angle corresponding to a given adsorption density was much greater at
75 0C than at 20 0 C. Only at 75 0C and over a narrow adsorption density
range was contact obtained at pH 8.0 (figure 48). Under these conditions
the maximum contact angle was only 40 0 and this was at an adsorption
density of 2 ji mole/m 2
For both ilmenite and anorthite the induction time decreased
from about 30-45 seconds at 20C to about 5 seconds at 75 0 C.
8.3 Oxidation Studies
8.3.1 The effect of oxygen and mineral oxidation state on conditioning
and flotation
A programme of ten tests was conducted; two tests on pulps
that had been prepared in the normal way and the other eight on pulps in 3+ 3+ 2+ 2+
which the Fe and Ti had been reduced to Fe and Ti These
eight tests were divided in the following way: two under an oxygen
atmosphere; two under an air atmosphere; and four under nitrogen.

-126-
The power consumption curves and flotation results are presented in figure 49 which shows that the reduced ore produced power consumption
curves (1 and 2) which exhibited a much higher flocculation peak and longer
deflocculation period than obtained under normal conditions (curves X and
Y). The ilmenite grade and recovery at the termination of conditioning
in these tests, although possibly not at the exact deflocculation end point,
was more or less as expected for a normal test.
Conditioning under an oxygen atmosphere produced a much more
pronounced power consumption curve which had little or no induction
period and which displayed a flocculation peak higher than that obtained
under an air atmosphere. Under these conditions there was a very poor flotation response at the flocculation peak and almost no response at
approximately the deflocculation end point.
Under an atmosphere of nitrogen the pulp did not flocculate
however long the pulp was conditioned. Furthermore the flotation
response was poor and there was little or no selectivity.
8.3.2 The effect of oxygen and mineral oxidation state on the
adsorption of Oleate by ilmenite
A programme of five tests was conducted to determine the effect
of mineral oxidation state and the presence of oxygen on the adsorption of
oleate by ilmenite. Tests were carried out at two or more concentrations
under the different oxidation conditions at pH 9.5 and each test was
carried out in triplicate.
Tests 1,2 and 5 were also performed with ilmenite at pH 8.0.

-4 -127- 00 o 54
t: X cd 0 "0 10
r *ý - 4- u rA bjo
l 00 P. C)
10 .. 4
Cý4 u
0 cq r-q
0
cd ý 41 4
bn rh ;4 cq 4 ;, MW M 4 0
Cl cq CD E- LO
4-4 4-4 -4 0 E- CO
W 0 >
-4
-
i - 00
I E-4 co M r x g: ). l u P, co U in,
I
0
0 'D Lo C-i -4 V--l -t C, 5 'm 0
0
cd cli
z
cq r-4 ce) C) C) (n
7
Cd CD CD to 1.14 1144 . 44
10
.
, f-4 Cd ý4
4J w
-j Cj Q) 7 E-4
0
0 0 =1
04 0 rn
1111M11
e_ 10 $ý, ý
M LO Ce rd
LO Me0 CD c4 cý -
. 40 "/
Cd
. CL $-( 011
cli ý4 0M 00 r- co
. A) uojjdTunsuoo aamod jam
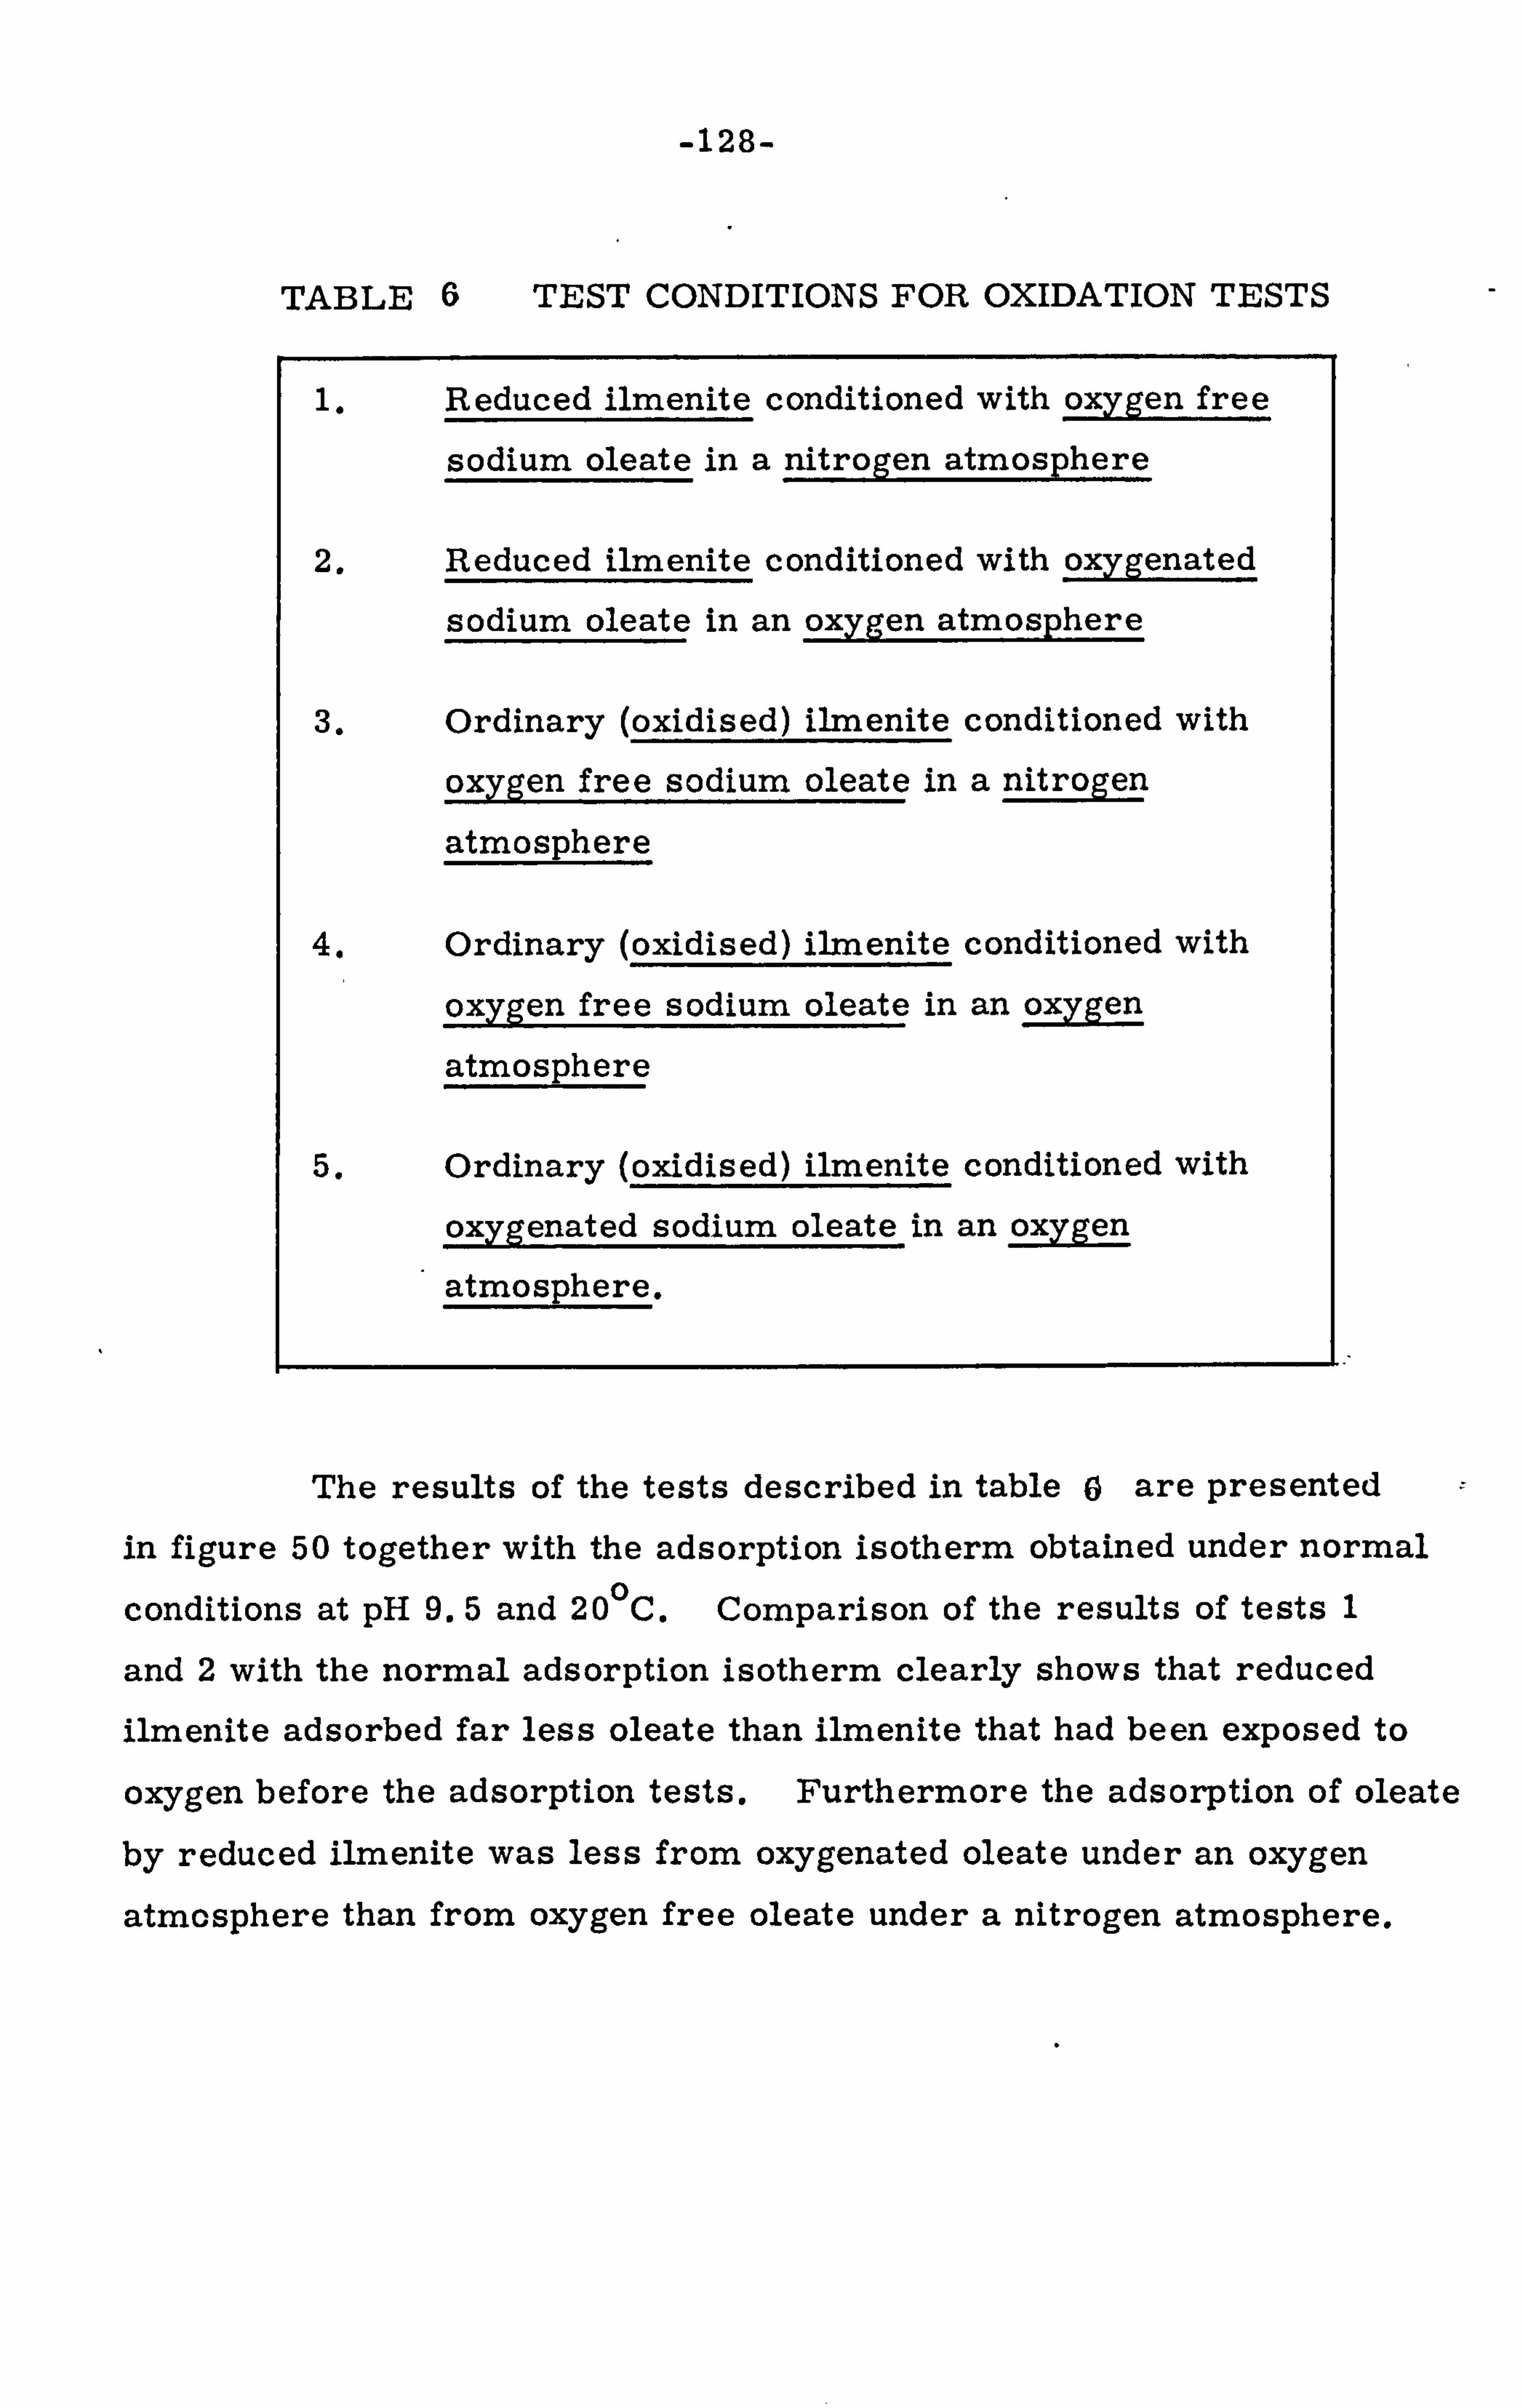
-128-
TABLE 6 TEST CONDITIONS FOR OXIDATION TESTS
Reduced ilmenite conditioned with oxygen free
sodium oleate in a nitrogen atmosphere
2. Reduced ilmenite conditioned with oxygenated
sodium oleate in an oxygen atmosphere
3. Ordinary (oxidised) ilmenite conditioned with
oxygen free sodium oleate in a nitroge
atmosphere
4. Ordinary (oxidised) ilmenite conditioned with
oxygen free sodium oleate in an oxygen
atmosphere
5. Ordinary (oxidised) ilmenite conditioned with
oxygenated sodium oleate in an oxygen
atmosphere.
The results of the tests described in table () are presented
in figure 50 together with the adsorption isotherm obtained under normal
conditions at pH 9.5 and 20 0 C. Comparison of the results of tests 1
and 2 with the normal adsorption isotherm clearly shows that reduced
ilmenite adsorbed far less oleate than ilmenite that had been exposed to
oxygen before the adsorption tests. Furthermore the adsorption of oleate
by reduced ilmenite was less from oxygenated oleate under an oxygen
atmosphere than from oxygen free oleate under a nitrogen atmosphere.
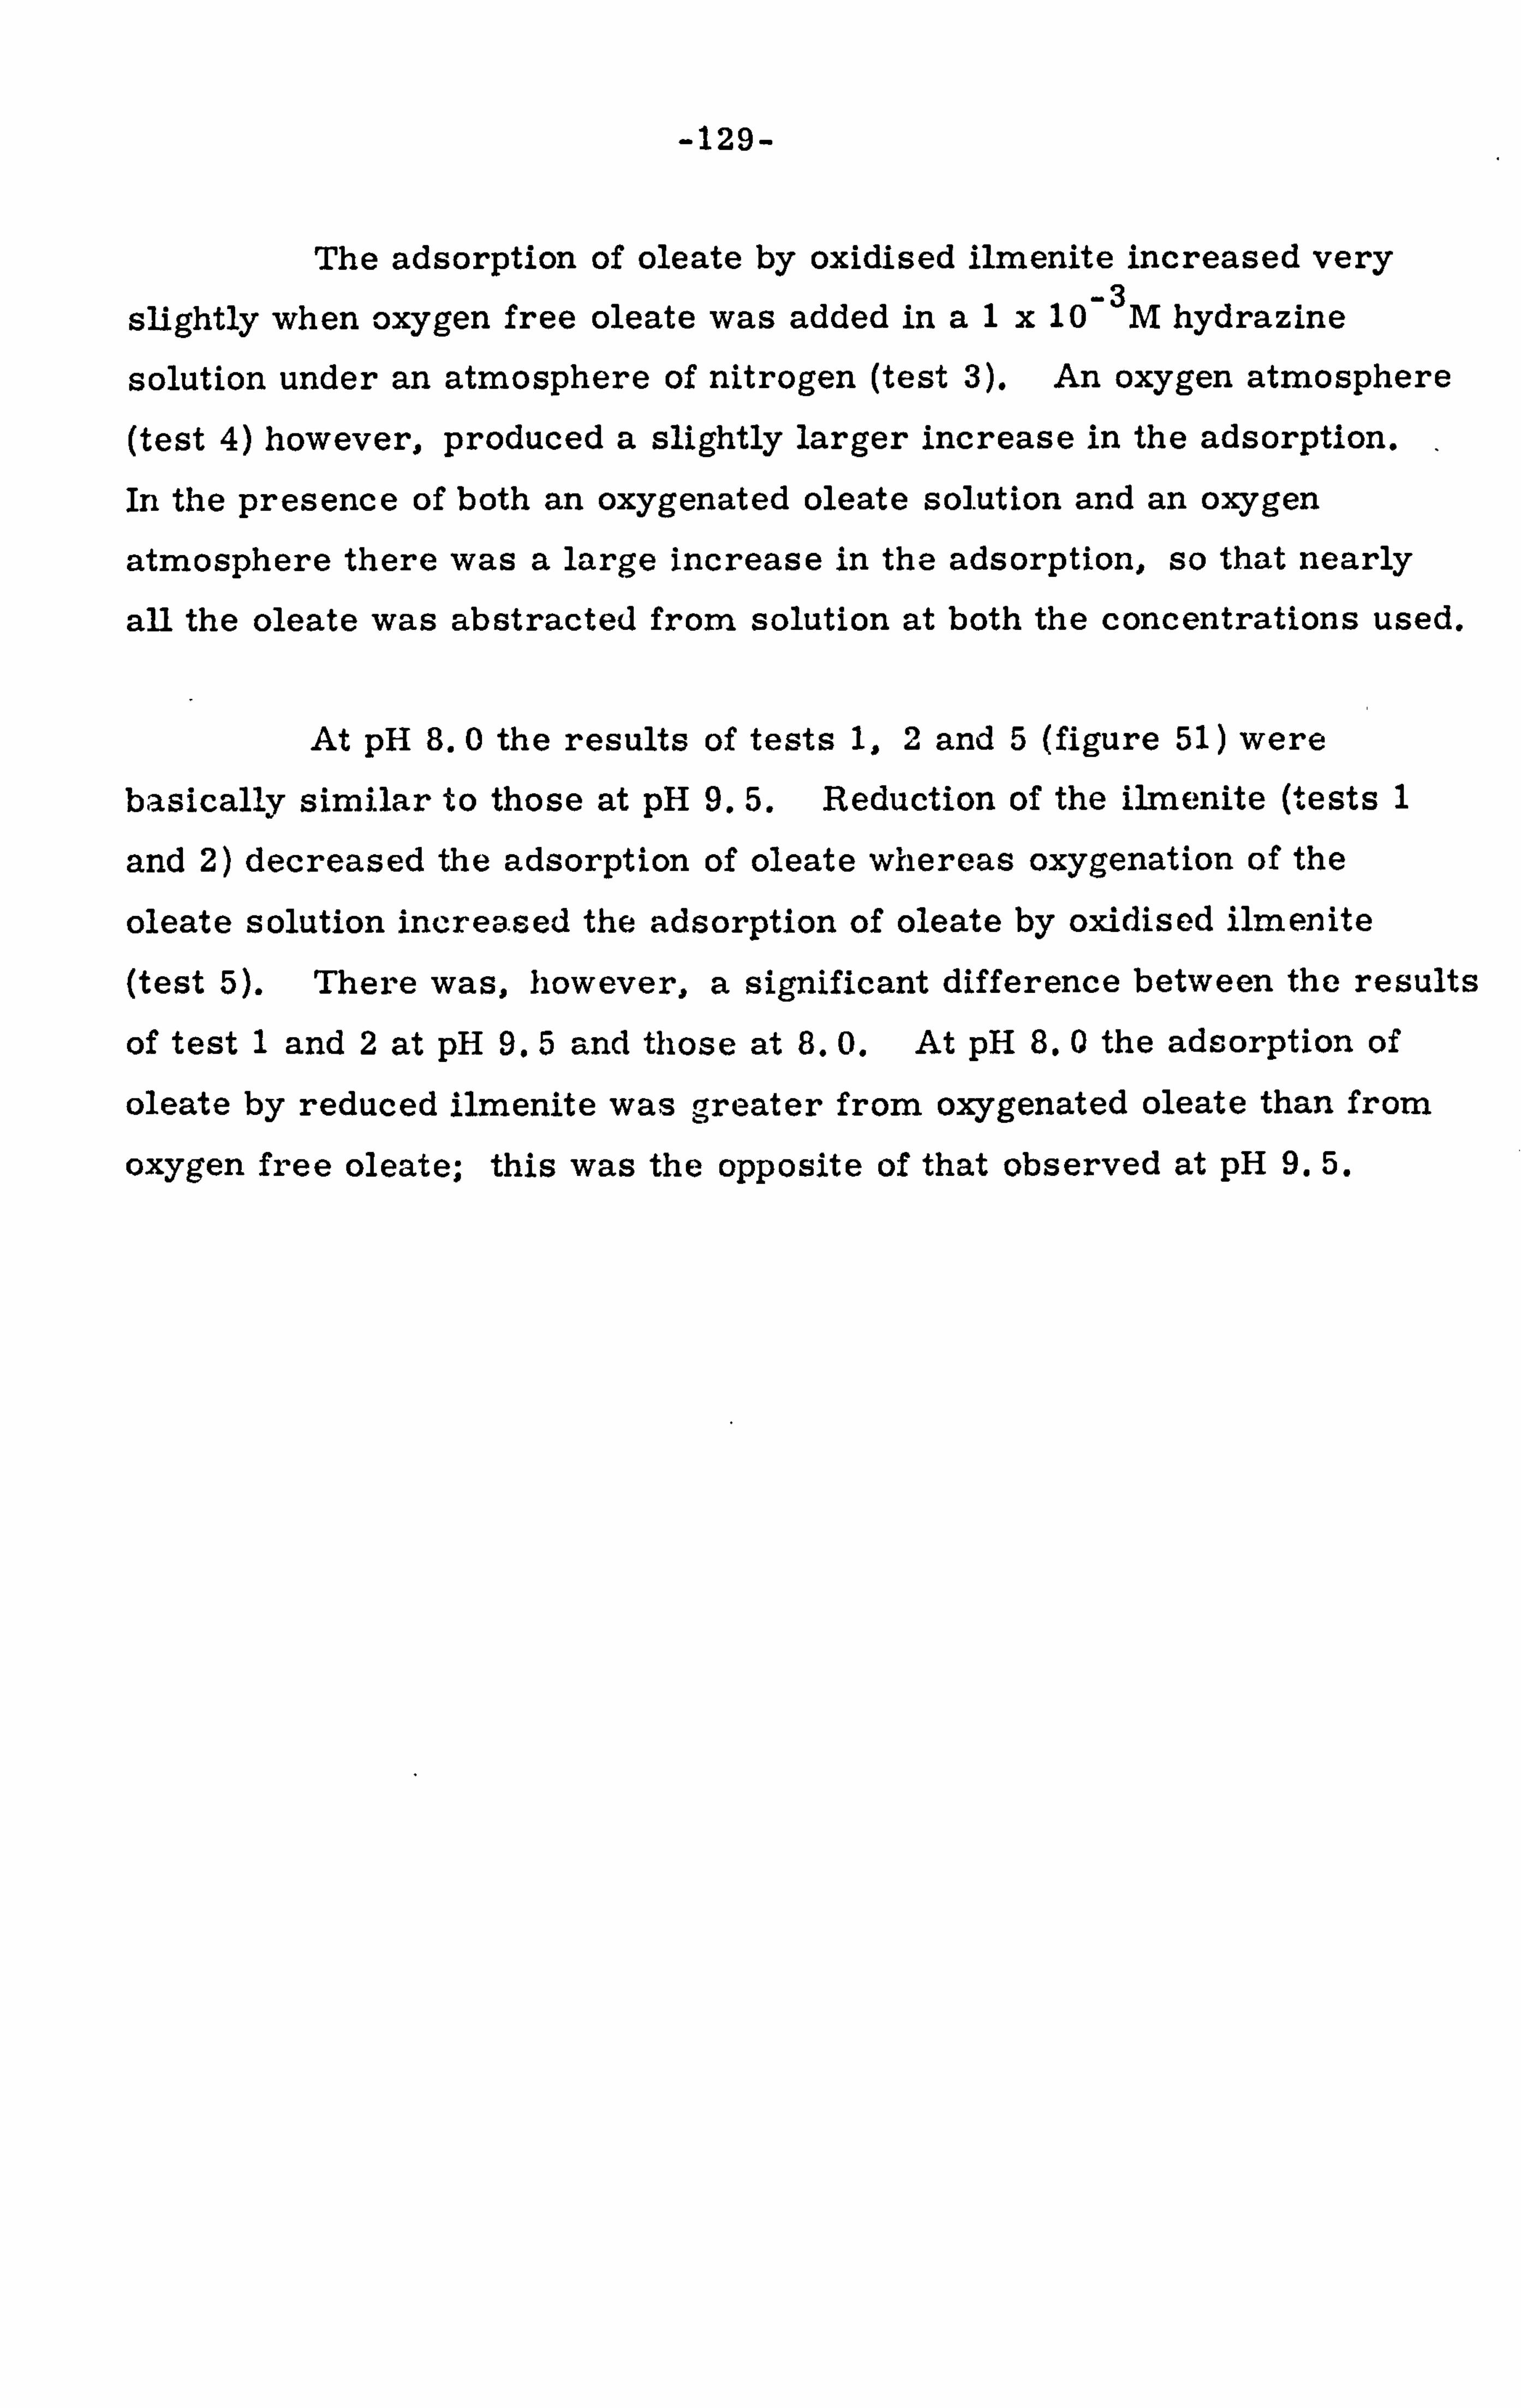
-129-
The adsorption of oleate by oxidised ilmenite increased very
slightly when oxygen free oleate was added in a1x 10- 3M hydrazine
solution under an atmosphere of nitrogen (test 3). An oxygen atmosphere
(test 4) however, produced a slightly larger increase in the adsorption.
In the presence of both an oxygenated oleate solution and an oxygen
atmosphere there was a large increase in the adsorption, so that nearly
all the oleate was abstracted from solution at both the concentrations used.
At pH 8.0 the results of tests 1,2 and 5 (figure 51) were
basically similar to those at pH 9.5. Reduction of the ilmenite (tests 1
and 2) decreased the adsorption of oleate whereas oxygenation of the
oleate solution increased the adsorption of oleate by oxidised ilmenite
(test 5). There was, however, a significant difference between the results
of test 1 and 2 at pH 9.5 and those at 8.0. At pH 8.0 the adsorption of
oleate by reduced ilmenite was greater from oxygenated oleate than from
oxygen free oleate; this was the opposite of that observed at pH 9.5.

-130-
Figure 50 The effect of oxygen and mineral oxidation state on the adsorption of oleate by ilmenite at pH 9.5
14
12
r0 10
10 0 0 Q4 $-4
0 ul "0
-: 4
4
2
0
ODO see table 6 002 for conditions 15115 3
-mm4 13135
013 ,3
normal 20 0c
isotherm
C313 -. IM
WJX-ý 0.
cp
10- 0 10-4 10- 5
--. -Equilibrium -c onc entrat, ion, mole/ L ... ... -
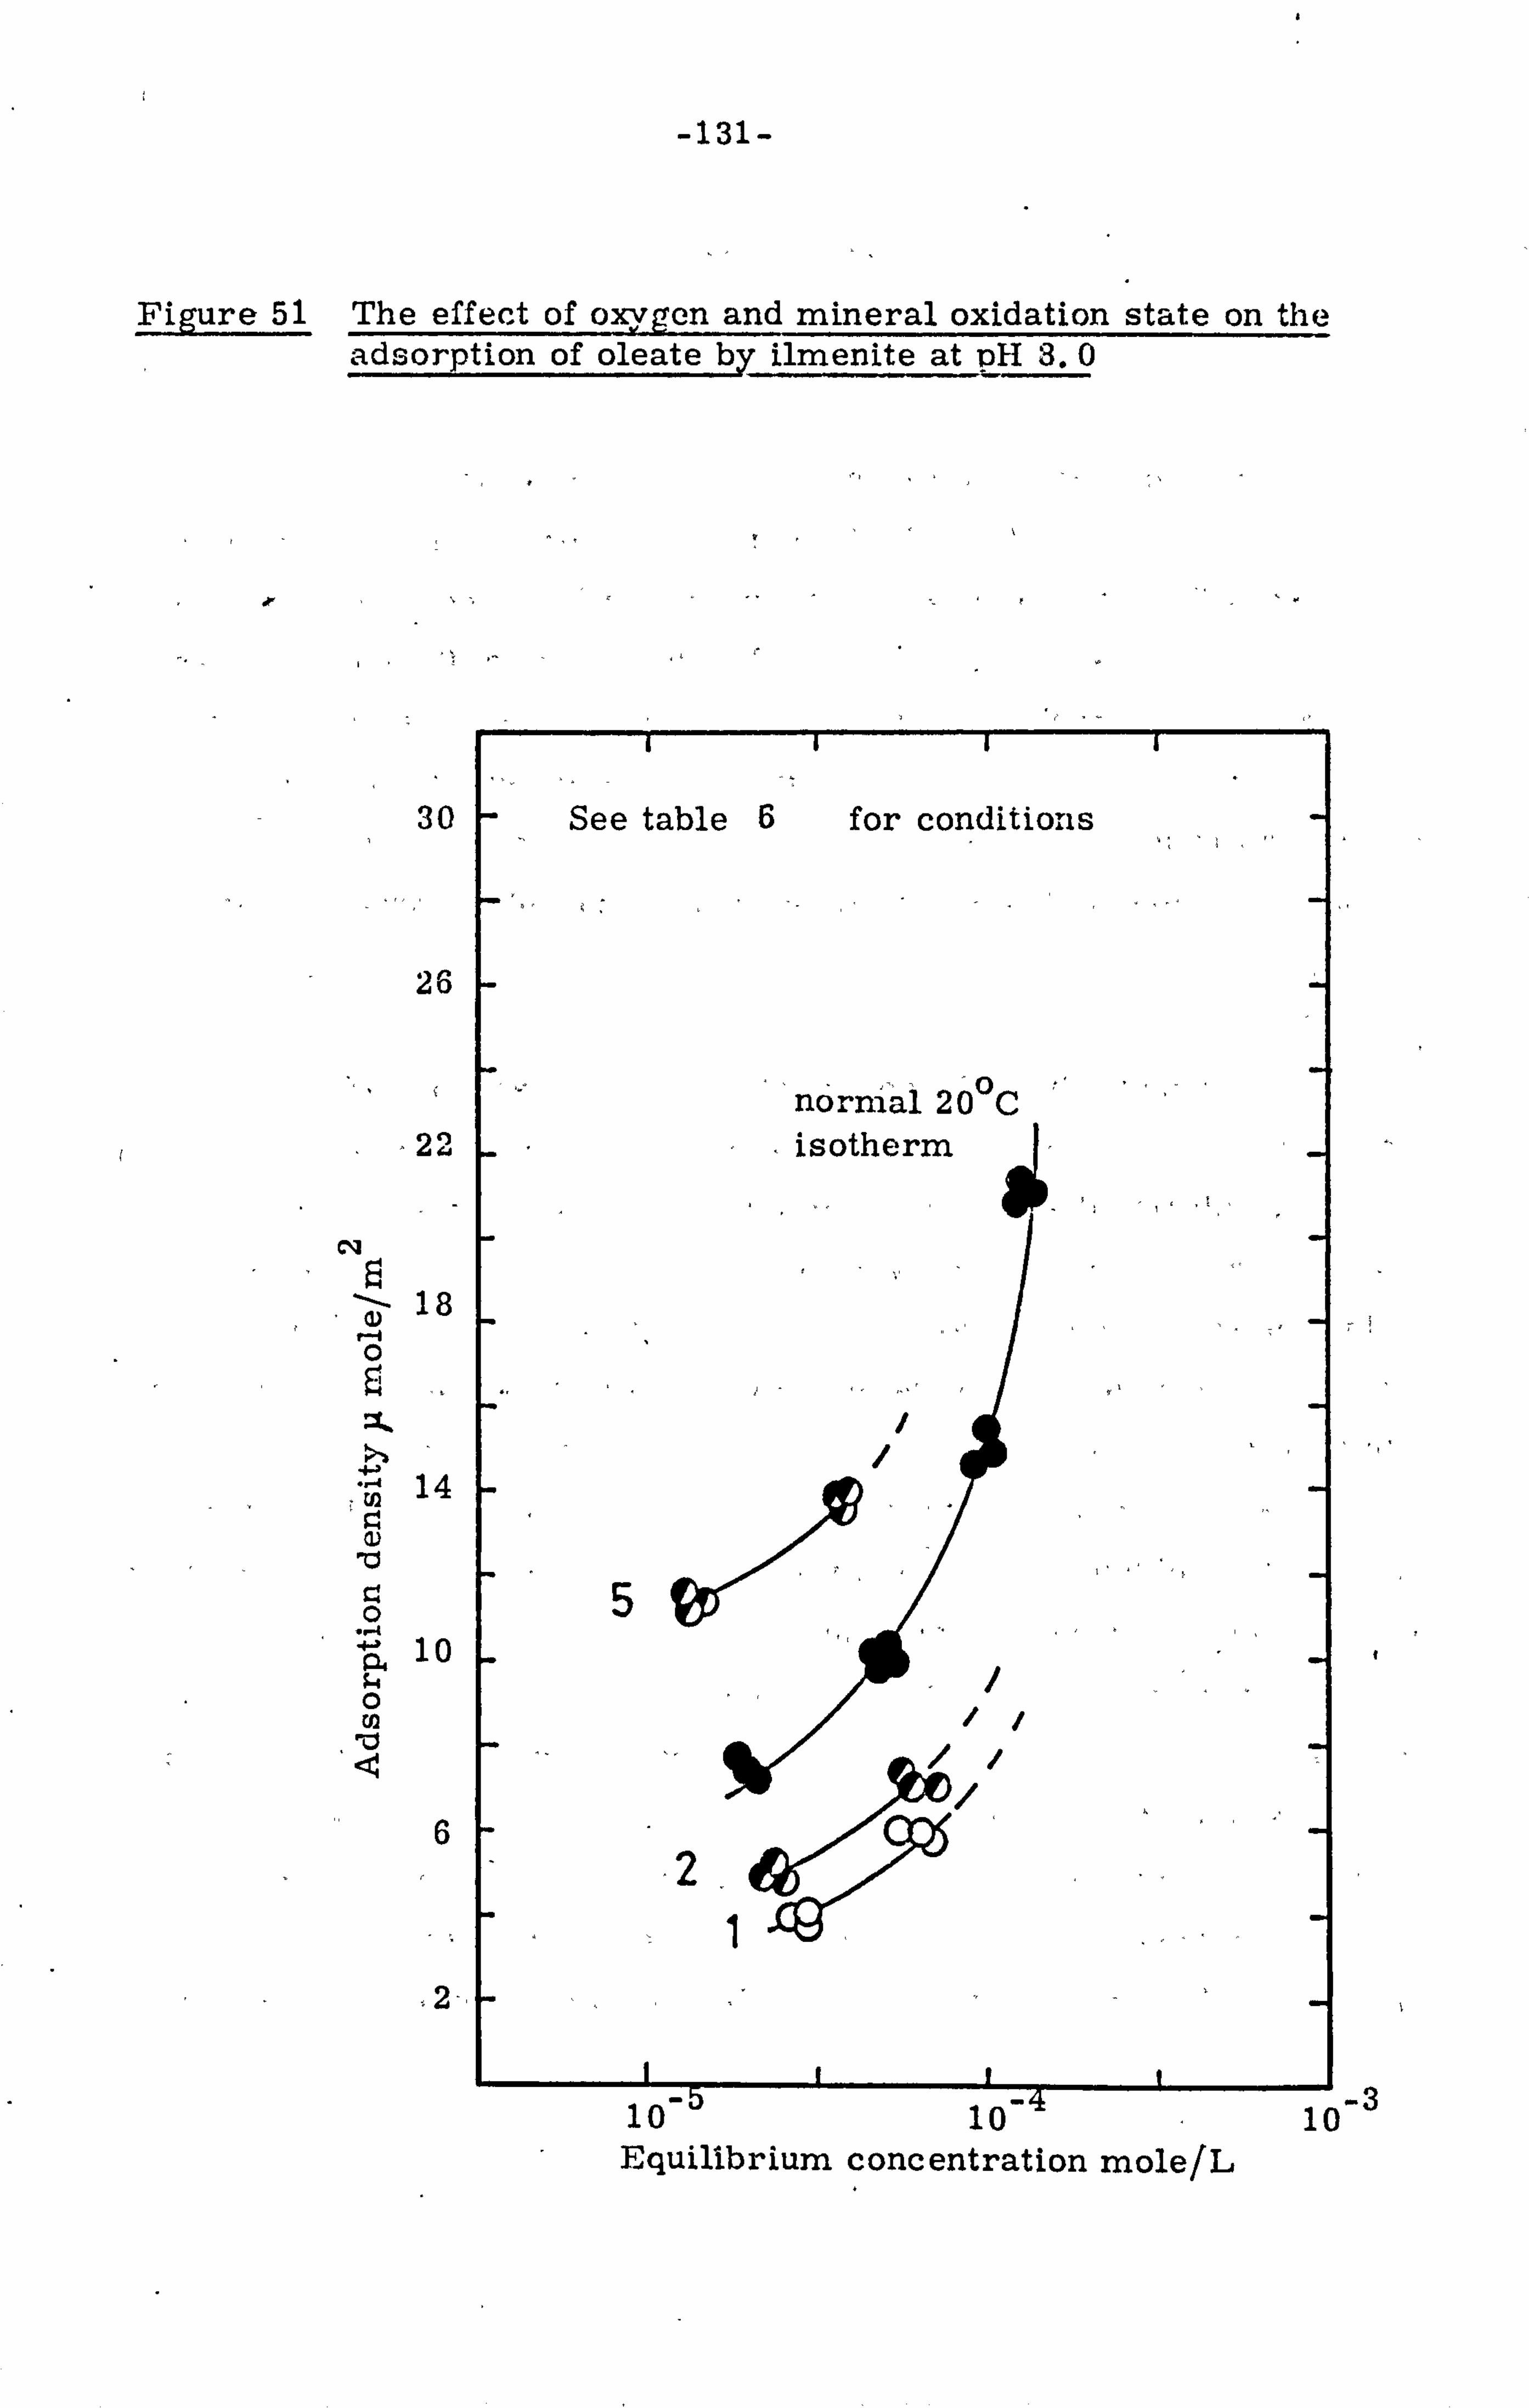
-131-
Figure 51 The effect of o? ýygcn and mineral oxidation state on the adsorption of oleate by ilmenite at DH 3.0
26
2"'
18
: 1.
14
10 C. 4
10
ý 10
6
2-
See table 6 for conditioins
0 normýl 20 C isotherm
f
IU IU lu Equilibrium concentration mole/L

-132-
9 DISCUSSION
9.1 Adsorption of Oleate by Ilmenite
For ilmenite the potential determining ions are H+ and OH-
and therefore at a certain pH known as the iso-electric point (i. e. p. )
the net uptake of potential determining ions will be zero. The results
shown in figure 30 indicate that at 20 0C the i. e. p. was at a pH of 9.5,
and by increasing the temperature the i. e. p. was decreased. Below the
L e. p. Coulombic adsorption of anionic surfactants is possible, and
above, that of cationic surfactants. An increase in temperature should
therefore produce a decrease in the amount of oleate adsorbed by Coulambic
attraction.
The increase in oleate adsorption with a decrease in pH (28) (figure 31) is consistent with the results of Gutierrez Coulombic
adsorption of oleate ions is most likely at pH values below the i. e. p.
of ilmenite where the surface has a net positive charge. For a strong
electrolyte surfactant this effect would increase with a decrease in pH, however, for aqueous oleate solutions the effect will be reduced because
of hydrolysis of the oleate ion to form oleic acid, which will precipitate if the solubility is exceeded. Thus the extent of Coulombic adsorption
will be dependent on the availability of the oleate ion and hence pH. At
pH values approaching neutral the mechanism of adsorption could be one
of Coulambic adsorption of the oleate ion followed by co-adsorption of the
oleic acid molecule, or, alternatively, a chemical reaction between oleic
acid, or oleate, and the ilmenite surface. At pH values corresponding
to, or above, the i. e. p. Coulombic adsorption of oleate ions is unlikely,
although it may be argued that the ilmenite surface will contain some
positive sites; a surface chemical reaction is more probable.

-133-
9.1.1 Adsorption of Oleate by ilmenite at pH 9.5
At pH 9.5 and 20 0C the isotherm for oleate adsorption by
ilmenite (figure 33) is similar in shape to that of Pope and Sutton. (58)
(83) for oleate adsorption by ferric oxide at pH 9.0 and that of Oko and Salman
for oleate adsorption by hematite at pH 10.0. Also, in figure 33
the first adsorption plateau occurs at an adsorption density of about 5-6
ju mole/m 2
as compared with the 3-4 ju mole/m
2(58) and 5-6p mole/m
2(83)
found by the other authors. Like the results of Pope and Sutton figure
33 shows a second plateau at an oleate equilibrium concentration of about
Ix 10- 3M which corresponds closely to the c. m. c. of sodium oleate
(1.5 x 10- 3 M).
The general shape of the isotherm corresponds to type L4
of Gile's classification (84)
which indicates that the molecules are adsorbed
on the surface initially either in a horizontal orientation or in a vertical
orientation with particularly strong intermolecular attraction. Where
the molecules are initially adsorbed in a horizontal orientation the second
steep rise in adsorption with increasing concentration could be the result
of reorientation of the adsorbed species. Such reorientation might occur
when the surface coverage approaches a monolayer and there is strong
attraction between the solute and adsorbent surface. A close packed
vertically oriented monolayer of oleate ions would give an adsorption 202 density of 6.3 p mole/m , assuming a cross sectional area of 26 A
(85) for the carboxylate group This is only slightly greater than the
adsorption density corresponding to the first plateau or point of inflexion
on the 20 0C isotherm in figure 33.
Pope and Sutton (58) have proposed that the second steep
2 rise on the adsorption isotherm, after the inflexion at 3-4 p mole/m
-134-
commences in the region where a monolayer corresponding to two point
attachment is complete. They suggest that the oleate is first adsorbed by two point attachment, but at higher adsorbate concentrations the
adsorbed species is forced to adopt a vertical orientation. For the 2 isotherm shown in figure 33 the inflexion occurs at about 5-6 y mole/m
which more closely corresponds to the region where a vertically orientated layer is complete. This suggests that the second steep rise in adsorption
corresponds to multilayer adsorption. Such considerations are, however,
very dependent on what is taken for the value of the oleate cross sectional
area at a given orientation. Close packing of the adsorbed species is
also assumed, and this is not usually reported, e. g. at the air/water (86) (87)
or oil/water interfaces or on inert substrates
The second plateau at equilibrium concentrations approaching the c. m. c. of sodium oleate suggests that at such high oleate
concentrations it becomes energetically more favourable for the oleate
molecules to form micelles in bulk solution than for them to adsorb on the surface of the oleate covered ilmenite. If the second plateau at 12 - 13, u mole/m
2 corresponded to the completion of a second but
reverse orientated collector layer with the carboxylic groups pointing into the aqueous phase, further collector adsorption would not be favoured
whether or not the equilibrium concentration corresponded to the c. m. c. Such reverse orientation of oleate adsorption has been reported by Paterson
and Salman (88)
who found that at high oleate concentrations dispersions of ferric hydroxide became quite stable.
The results of the desorption studies (figure 34) clearly show
that above adsorption densities of about 6p mole/m 2
the adsorption was
reversible, whilst below this value it was not. This irreversibility

-135-
strongly suggests that below 6p mole/m 2
the adsorption of oleate
is by chemisorption. Above 6 ju mole/m
2 the adsorption was, however,
reversible and therefore physical.
The model of chemisorption at low adsorption densities followed
by physisorption at high adsorption densities corresponds to that suggested (59,88)
by the results of infrared studies
A consistent increase of pH during the adsorption of oleate by
ilmenite suggests that the chernisorption may involve the displacement
or exchange of hydroxyl ions from the ilmenite surface:
M- OH + Z5L- --, - M- -iL + OH-
M- OH = Mineral surface site with chemisorbed water
M- G-L = Mineral surface site with chemisorbed oleate
OL Oleate
Alternatively it could be explained by the ion exchange of
oleate with hydroxyls in the diffuse part of the double layer. However,
at the pH corresponding to the i. e. p. this is unlikely.
The physical adsorption of oleate above adsorption densities
of 6)1 mole/m 2
probably involves attraction by van der Waals forces
between the hydrocarbon chains of the oleate species in solution and
the oleate already adsorbed by the ilmenite. Such physical adsorption
would tend to exclude the carboxylic group from the hydrocarbon phase
thus causing reverse orientation of the physisorbed molecules, as (88)
indicated by the results of Paterson and Salman

-136-
9.1.2 The effect of temperature on the adsorption of oleate by
ilmenite at pH 9.5
The adsorption isotherms in figure 32 clearly show that below
adsorption densities of about 5.5 y mole/m 2
the adsorption was exothermic
whilst above this value the adsorption was endothermic. The fact that
the adsorption isotherms at different temperatures cross at approximately
the same place suggests that there is a change from one adsorption 2
mechanism to another at an adsorption density of about 5.5 p mole/m
This latter point supports the results of the desorption studies which 2
indicated chemisorption below 6p mole/m Clearly whatever the
chemisQrption process, it is exothermic.
As mentioned in the introduction, physical adsorption at high
oleate adsorption densities is considered to result from hydrocarbon (56)
chain interactions and is paralleled with the process of micellisation
One might therefore expect the effect of temperature on physical adsorption,
under such conditions, to be similar to that on micellisation. However
the micellisation of sodium oleate is exothermic (34,39,40)
whilst the
physisorption process is clearly endothermic. This contradiction is
not as surprising as it might at first seem. Whether or not the oleate
molecules form micelles depends basically on two factors; the attractive
interactions (van der Waals forces) between the hydrocarbon chains and
the electrostatic repulsion between the polar head groups. If the
attractive force exceeds the repulsive force the molecules aggregate,
if the repulsive force exceeds the attractive force they do not. It
has been shown that the removal of an aliphatic hydrocarbon from water,
i. e. the association of hydrocarbon chains in aqueous solution, is, as
a result of entropy changes, an endothermic process. (33,34)
Therefore,

-137-
for micellisation to be exothermic, the net heat change resulting from
the bringing together of the polar head groups must be more exothermic than the association of the hydrocarbon chains is endothermic. if
the exothermic contribution of the polar repulsion is reduced then the
endothermic association of the hydrocarbon chains may predominate and
cause the aggregation process to be endothermic. It is quite likely that
the ionic forces within the monolayer of adsorbed oleate will be partly
or wholly neutralised by physical or chemical reaction with the mineral
surface, and that the total ionic repulsion during subsequent adsorption
wil-1, because of the conditions within the lower layer, be less than that
experienced during normal bulk micellisation. Thus, such physical
adsorption would appear endothermic.
The results presented in figure 35 showed that the adsorption
was only partly reversible with respect to temperature and that equilibrium
was only slowly established. As the ilmenite surface did not change during
this treatment it would appear that the reason for the slow attainment of
equilibrium was desorption, adsorption and restructuring within the
adsorbed layer.
9.1.3 Adsorption of oleate by ilmenite at pH 8.0
The adsorption isotherms at pH 8.0 when plotted on a linear
scale (not presented) show a very sharp increase in adsorption with
oleate concentration over an oleate equilibrium c onc ent ration range of 10- 5
to 10- 4 M, but unlike the isotherms at pH 9.5 there was no inflexion
points(nosl at high adsorption densities, a second plateau, even though
the adsorption density greatly exceeded double layer adsorption. This
suggests that the adsorption at pH 8.0, at high adsorption densities, is
different from that at pH 9.5 in that adsorption in excess of a monolayer does not result in the presentation of the carboxylate group to the aqueous
phase and the subsequent prevention of further oleate adsorption.

-138-
Oleic acid is a weak acid and therefore its solubility and
ionisation characteristics are dependent on pH. As the pH of the sodium
oleate solution is decreased the concentration of the fatty acid molecule (RCOOH) will increase until it exceeds the solubility of the molecule (K =8x 10- 7
mole/L (57) ); further reduction of pH will result in fatty
acid precipitation. At pH 9.5 the solubility is 2.5 x 10- 2 mole/ L but
at pH 8.0 it is only 8x 10- 4 mole/L which is fairly close to the steep
increase in adsorption at 1.6 x 10⁻⁴ mole/L shown in figure 36. The
adsorption at pH 8.0 therefore not only includes oleate ions but also
oleic acid molecules which could be adsorbed by hydrocarbon chain
interactions without preventing further adsorption. Read and Manser (30)
have suggested that the association of such unionised species causes
a decrease in the degree of ionisation and in the hydration of the polar
groups, thereby allowing the hydrocarbon chains to pack closer together.
This might result in the formation of an adsorbed layer which resembles bulk oleic acid.
The reversibility of oleate adsorption shown in figure 37
indicates that, over the range studied, the adsorption was of a'physicalnature It was not possible to determine adsorption densities below 6p mole m2 because of the insensitivity of the analytical technique. However the
results of Gutierez (28) and Peck, Raby and Wadsworth
(59) suggest that
chemical adsorption at low densities is probable even at pH values below
the minerali. e. p.
9.1.4 The effect of temperature on the adsorption of oleate by
ilinenite at PH 8.
The adsorption isotherms in figure 36 show that over the
concentration range studied the adsorption process was endothermic. This
is complementary to the endothermic physical adsorption at pH 9.5 at

-139-
adsorption densities above 6 ju mole m2. At pH 8.0, where thbre would
be a greater adsorption of neutral oleic acid molecules, hydrocarbon
interaction would almost certainly be the principal force of adsorption at high adsorption densities and so result in endothermic adsorption according to references 33 and 34.
9.2 The Adsorption of Oleate by Anorthite
Anorthite (CaAl 2
Si 208)
has the three dimensional structure of
quartz but with some of the silicon atoms replaced by aluminium. Electro -neutrality is maintained by the inclusion of calcium in the lattice.
Consequently one might expect anorthite to behave in a similar way to
calcium activated quartz which is readily floated with oleic acid over the (32)
pH range 9-12 The adsorption results presented in figure 38, which
shows adsorption peaks at pH 9-11, are consistent with this.
The 20 0C isotherm at pH 9.5 presented in figure 39 (the shape
of this isotherm is basically the same as for a linear oleate concentration
plot) shows a plateau at about 2-2.5ju mole/m 2
over a concentration
range 0 -4 - 10 -3 M. Such an adsorption density is comparable with those reported by Read and Manser
(30) for the adsorption of oleate by
orthosilicates. The plateau at 2-2.5 u mole/m 2
suggests horizontal or two point attachment of collector since it falls between 1.8 and 3.4 u mole/m
2
reported for horizontal and two point adsorption respectively. Increased
oleate adsorption at equilibrium concentrations above 10- 3 M, near the
c. m. c. suggests that there adsorption is by hydrocarbon chain association. The reversibility of adsorption with respect to oleate equilibrium
concentration shows that adsorption is, as for ilmenite at pH 8.0, a
physisorption process.

-140-
Temperature had no effect on the adsorption of oleate by anorthite
at pH 9.5. This is somewhat unexpected in the light of the ilmenite
results for which an increase in temperature caused an increase in
physisorptioni
The 20 0C isotherm at pH 8.0 (figure 40) is of the same shape
as that at pH 9.5 but over the plateau region the adsorption density is
lower, as would be expected from the results shown in figure 38. Again
the reversibility studies showed that adsorption was a physisorption
process.
At pH 8.0, where any attachment of oleate to the mineral
surface through interaction with calcium ions would be less than at pH 9.5,
the adsorption was, as expected, endothermic. This suggests that the
temperature independence of adsorption at pH 9.5 is connected with the
adsorption of oleate by interaction with calcium surface sites.
9.3 Contact Angle with Ilmenite
The contact angle versus equilibrium concentration c(4-rves at
pH 9.5 and 8.0 in figures 41 and 42 respectively show the overall effect
of temperature on contact angle. At both pH values an increase of
temperature produced a greater contact angle at a given equilibrium
concentration. This behaviour is not peculiar to fatty acid collectors,
Kirchberg and Topfer (89)
observed the same effect for the galena
xanthate system. Perhaps the most significant feature of these curves
is the sharp decrease in contact angle at equilibrium concentrations of
about 10- 3M which corresponds approximately to the c. m. c. of
sodium oleate. This is consistent with the observations of Watson
and Manser (90)
who found that, for the flotation of silicates with dode I cyl
amine the upper collector concentration limit coincided with the collector
c. m. c. The upper equilibrium concentration at which bubble contact was
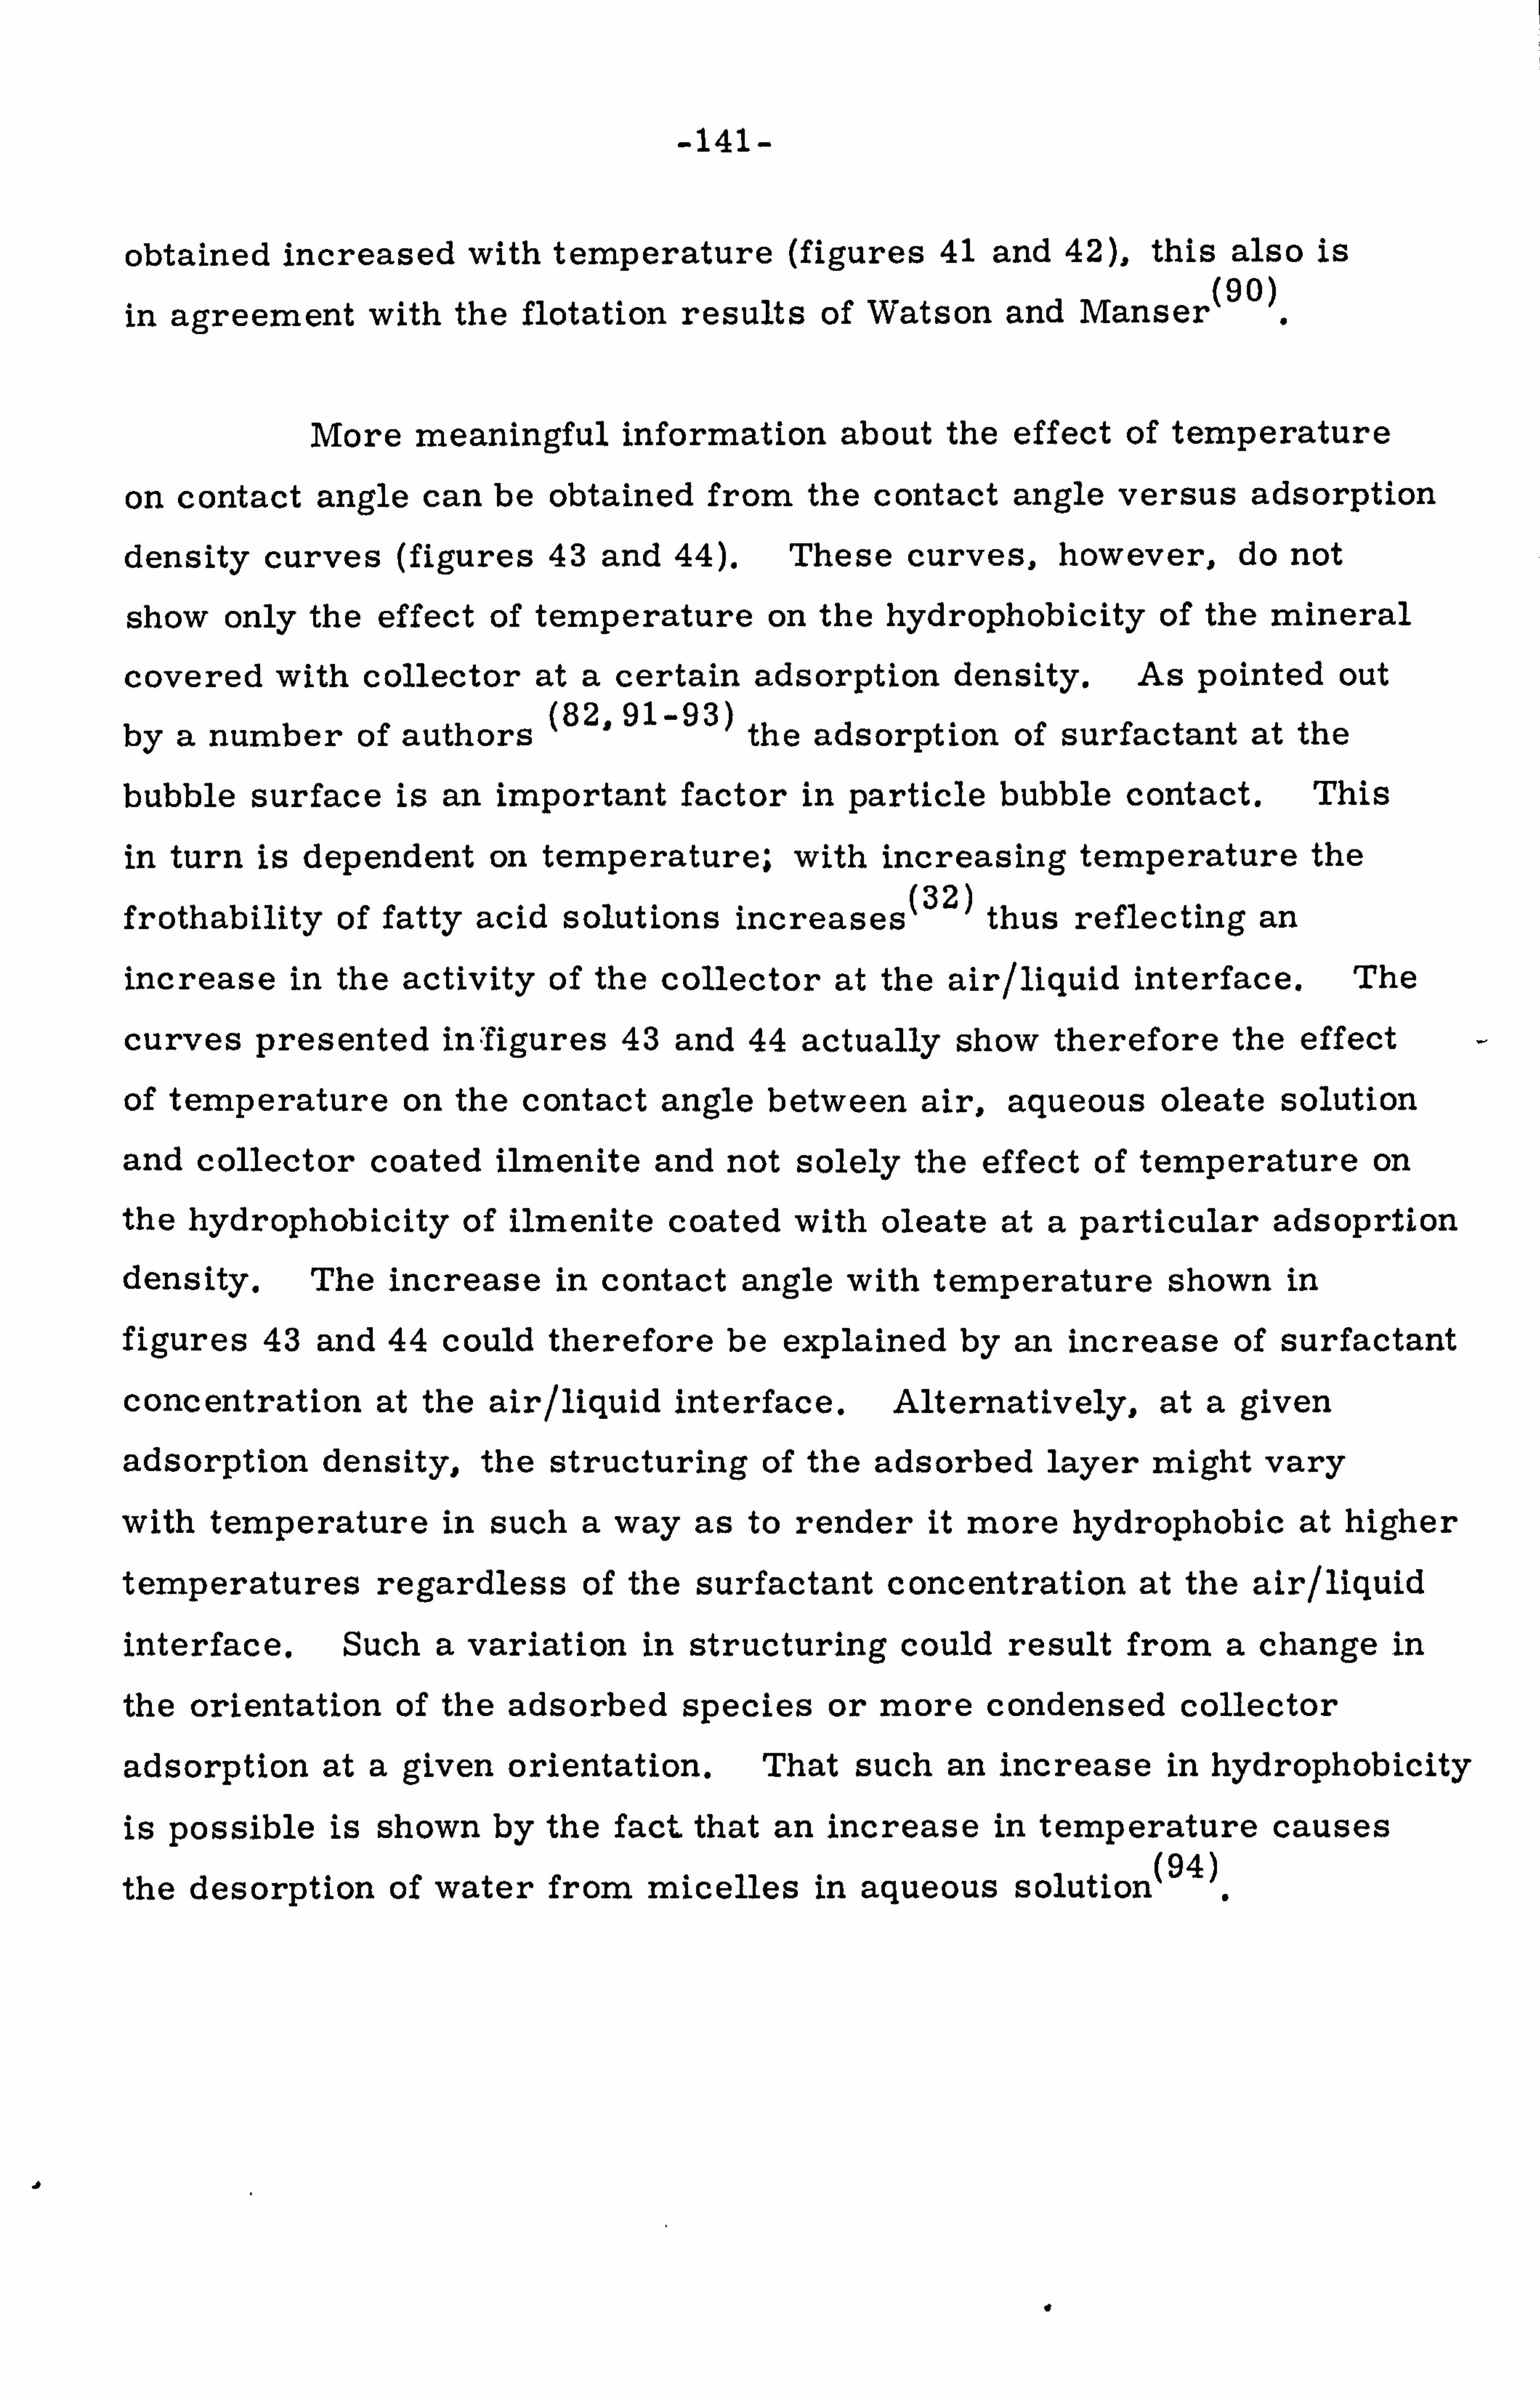
-141-
obtained increased with temperature (figures 41 and 42), this also is (90)
in agreement with the flotation results of Watson and Manser
More meaningful information about the effect of temperature
on contact angle can be obtained from the contact angle versus adsorption
density curves (figures 43 and 44). These curves, however, do not
show only the effect of temperature on the hydrophobicity of the mineral
covered with collector at a certain adsorption density. As pointed out
by a number of authors (82,91-93)
the adsorption of surfactant at the
bubble surface is an important factor in particle bubble contact. This
in turn is dependent on temperature; with increasing temperature the
frothability of fatty acid solutions increases (32) thus reflecting an
increase in the activity of the collector at the air/liquid interface. The
curves presented in-7figures 43 and 44 actually show therefore the effect
of temperature on the contact angle between air, aqueous oleate solution
and collector coated ilmenite and not solely the effect of temperature on
the hydrophobicity of ilmenite coated with oleate at a particular adsoprtion density. The increase in contact angle with temperature shown in
figures 43 and 44 could therefore be explained by an increase of surfactant
concentration at the air/liquid interface. Alternatively, at a given
adsorption density, the structuring of the adsorbed layer might vary
with temperature in such a way as to render it more hydrophobic at higher
temperatures regardless of the surfactant concentration at the air/liquid
interface. Such a variation in structuring could result from a change in
the orientation of the adsorbed species or more condensed collector
adsorption at a given orientation. That such an increase in hydrophobicity
is possible is shown by the fact that an increase in temperature causes (94)
the desorption of water from micelles in aqueous solution

-142-
At pH 9.5 and temperatures of 20 and 20 0C the contact angle increased rapidly with adsorption density to a peak at about 5.5 P mole/m
2
thereafter it decreased rapidly. One would expect an increase in contact
angle with increasing adsorption density up to a monolayer at about
5.5 u mole/m 2.,
thereafter, with the adsorption of reverse orientated
molecules the contact angle would decrease. At pH 9.5 and 75 0C the
results are somewhat different; a large contact angle was obtained over 2
an adsorption density range of 2-10p mole/m The large contact
angle at very low adsorption densities suggests that the collector might be adsorbed at a different orientation from that at lower temperatures
where a much lower contact angle was obtained, Alternatively the low
collector adsorption density at the solid/liquid interface combined with
a high collector adsorption density at the liquid/air interface might
provide a total adsorption density considerably in excess of that indicated
by the adsorption data. Thus the unexpectedly high contact angle
might reflect an increase in the collector molecule activity at the liquid/
air interface. Failure of the contact angle to decrease at adsorption. densities well in excess of a monolayer is somewhat more difficult to
explain. At such a relatively high temperature as 75 0C both the
collector adsorbed at the solid/liquid interface in excess of a monolayer
and the collector adsorbed at the liquid/air interface would be very labile. In such a state the collector molecules in the outer adsorbed layer on the mineral could readily be incorporated by the bubble surface, before adherence of the bubble to the mineral, diffuse away from the
area of bubble particle interaction, and so allow bubble-mineral
interaction as though the mineral was only collector coated to a monolayer
coverage.
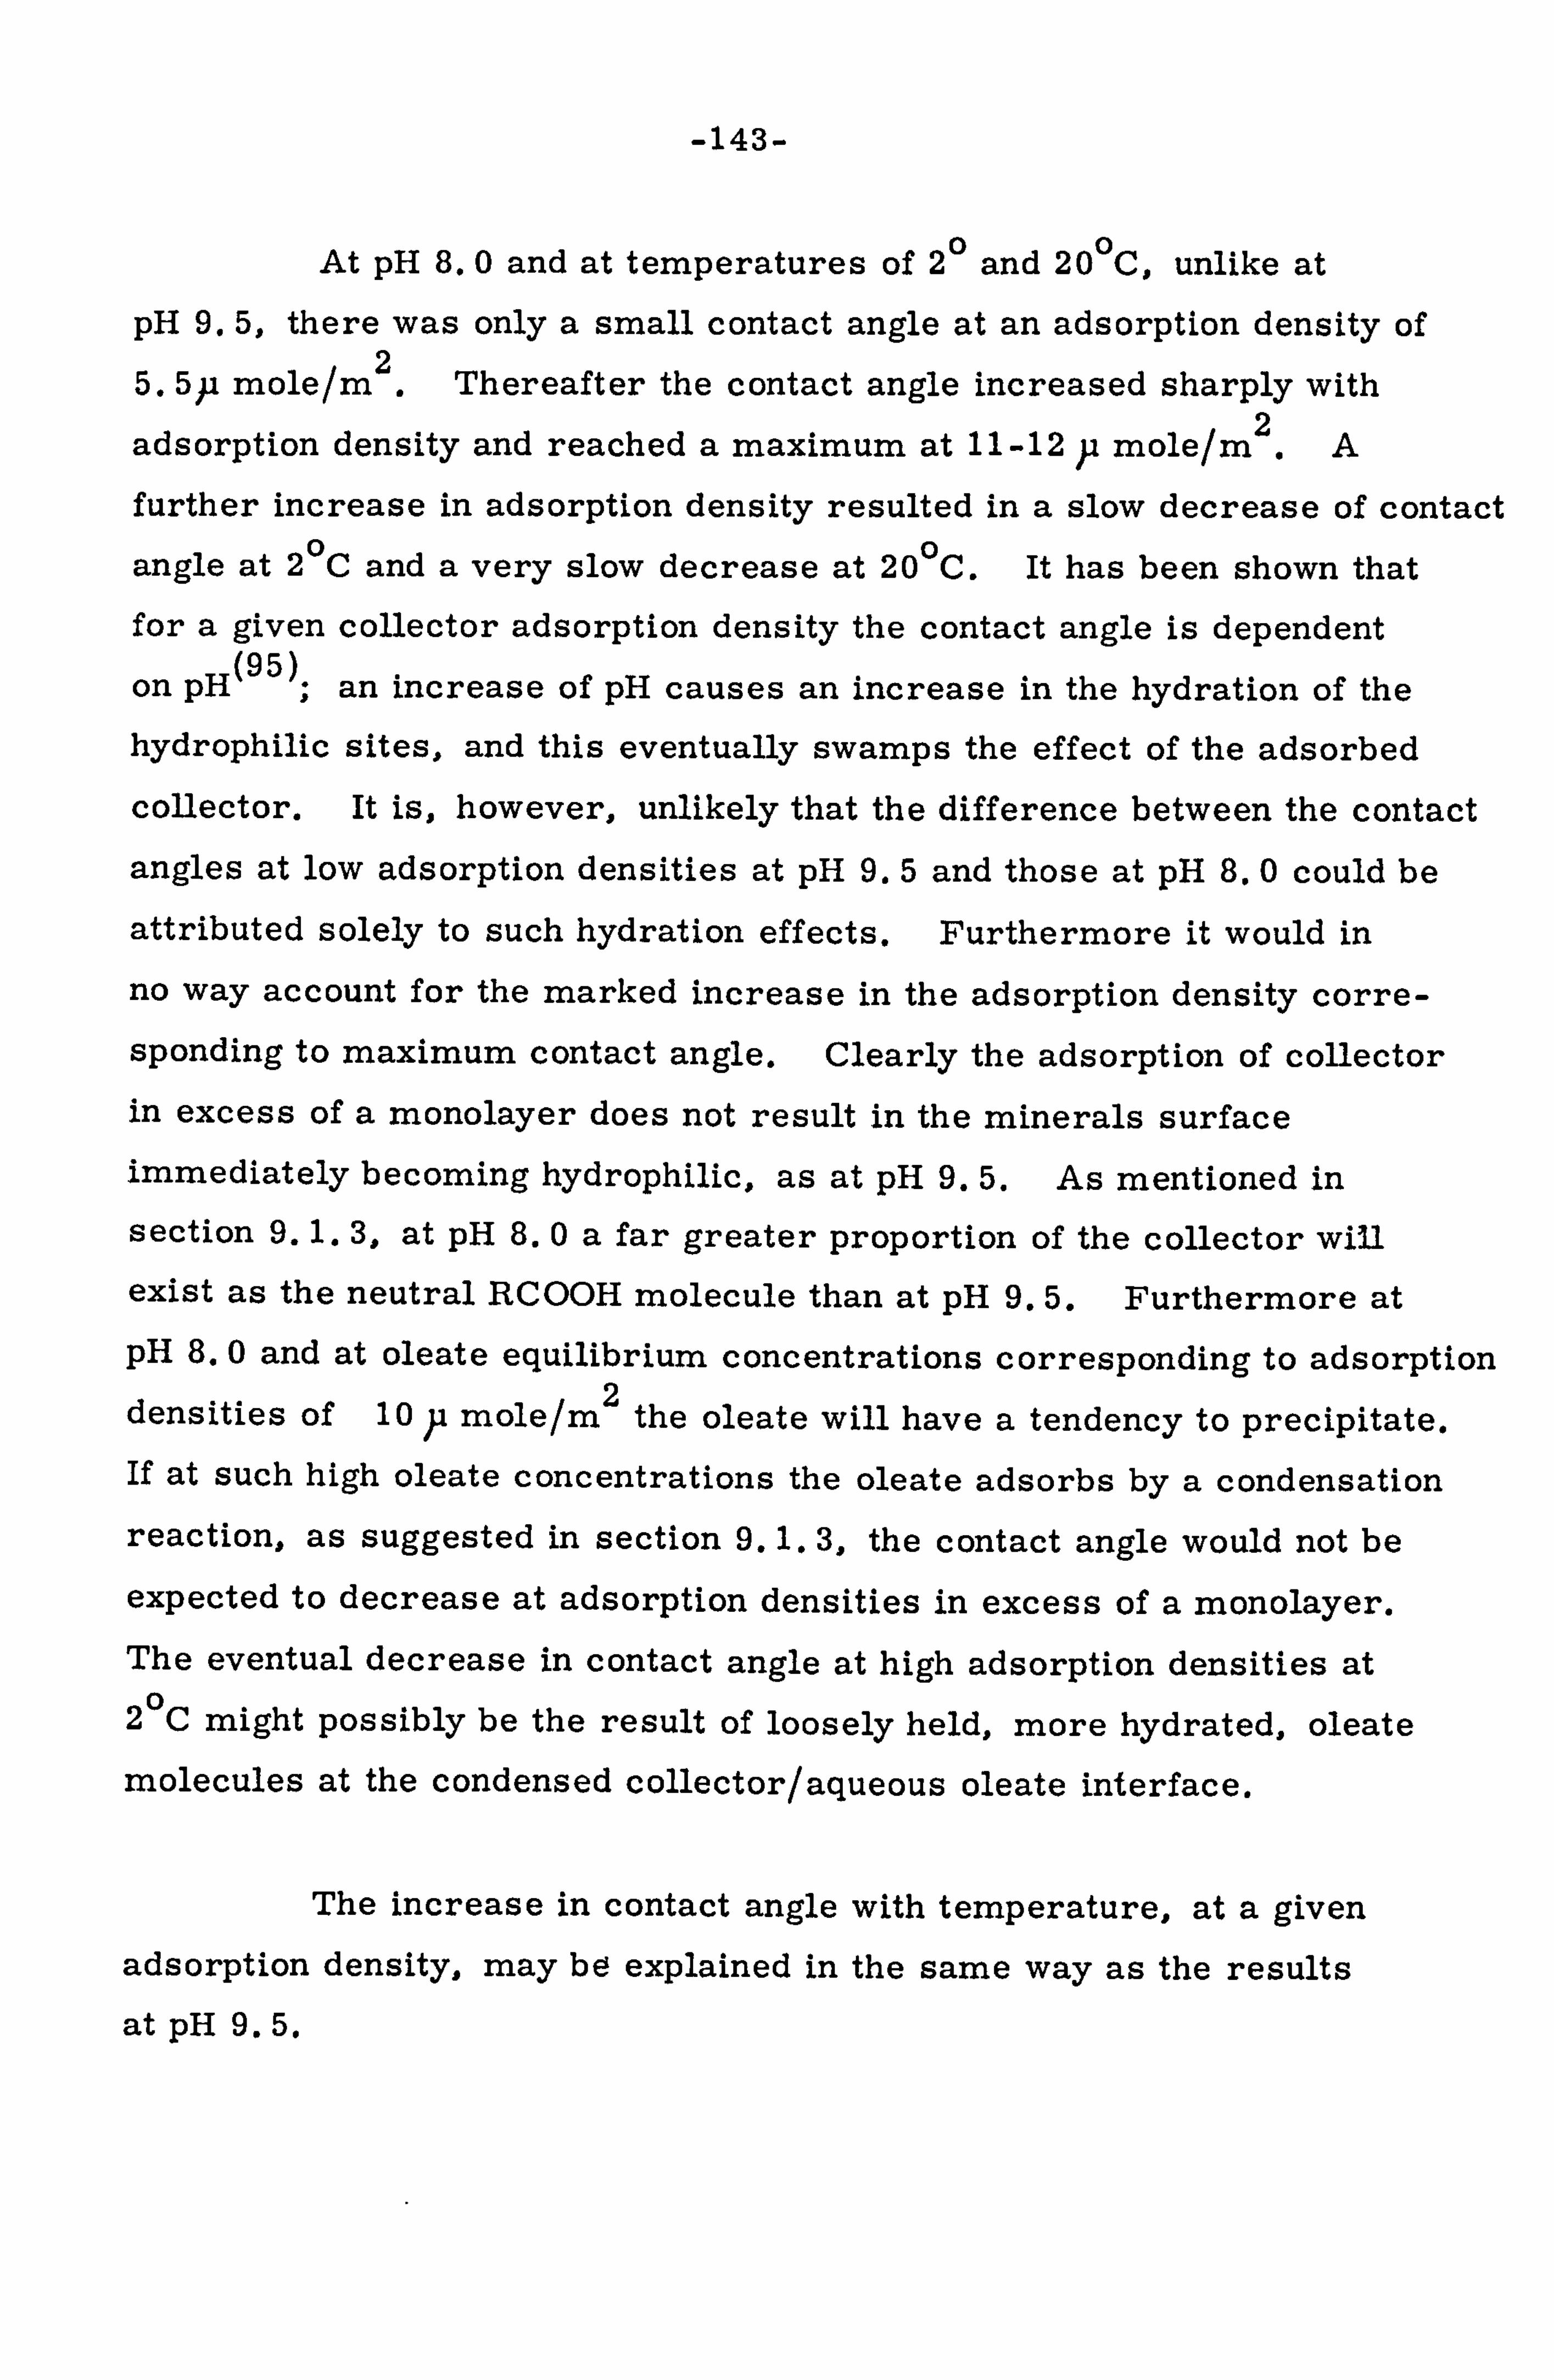
-143-
At pH 8.0 and at temperatures of 20 and 20 0 C, unlike at
pH 9.5, there was only a small contact angle at an adsorption density of 2 5.5p mole/m Thereafter the contact angle increased sharply with
2 adsorption density and reached a maximum at 11-12 p mole/m A
further increase in adsorption density resulted in a slow decrease of contact
angle at 20C and a very slow decrease at 20 0 C. It has been shown that
for a given collector adsorption density the contact angle is dependent
on p (95)
; an increase of pH causes an increase in the hydration of the
hydrophilic sites, and this eventually swamps the effect of the adsorbed
collector. It is, however, unlikely that the difference between the contact
angles at low adsorption densities at pH 9.5 and those at pH 8.0 could be
attributed solely to such hydration effects. Furthermore it would in
no way account for the marked increase in the adsorption density corre-
sponding to maximum contact angle. Clearly the adsorption of collector in excess of a monolayer does not result in the minerals surface immediately becoming hydrophilic, as at pH 9.5. As mentioned in
section 9.1.3, at pH 8.0 a far greater proportion of the collector will exist as the neutral RCOOH molecule than at pH 9.5. Furthermore at pH 8.0 and at oleate equilibrium concentrations corresponding to adsorption densities of 10 p mole/m
2 the oleate will have a tendency to precipitate.
If at such high oleate concentrations the oleate adsorbs by a condensation reaction, as suggested in section 9.1.3, the contact angle would not be
expected to decrease at adsorption densities in excess of a monolayer. The eventual decrease in contact angle at high adsorption densities at 20C might possibly be the result of loosely held, more hydrated, oleate
molecules at the condensed collector/ aqueous oleate interface.
The increase in contact angle with temperature, at a given
adsorption density, may be explained in the same way as the results
at pH 9.5.

-144-
It is interesting to note that, at pH 9.5, from figure 41 it
might be concluded that the decrease in contact angle at high adsorption densities or high equilibrium concentrations was due to the proximity of
the c. m. c. , whilst from the contact angle data displayed in figure 43
the decrease in contact angle might be attributed to the adsorption of
reverse orientated collector; both phenomena involve the association
of hydrocarbon chains.
9.4 Contact Angle with Anorthite
As for ilmenite, the contact angle versus oleate equilibrium
concentration curves at pH 9.5 and 8.0 (figures 45 and 46 respectively) both show a peak at an equilibrium concentration of about 10- 4M
and for
both there is a sharp decrease in contact angle at equilibrium concentrations
approaching the c. m. c. of oleate. At each pH an increase in temperature
caused a marked increase in contact angle at a given equilibrium concentration;
presumably for similar reasons to those given for the ilmenite-oleate
system. However, for anorthite the effect of temperature was much
more pronounced than for ilmenite in that it caused a change from
hydrophiliciiy to hydrophobicity with an increase in temperature from
20 to 20 0C at pH 9.5 and from 20 0 to 75 0C at pH 8.0.
The contact angle versus adsorption density curves at pH 9.5
and 8.0 (figures 47 and 48) show that at both pH values the contact angle
peak oc*curred-: at; an. adsorption density of approximately 2P mole/m 2
which corresponds closely to a horizontally orientated monolayer (1.8
p mole/m 2
according to Ottewill and Tiffany (85) ). Thus for anorthite,
as for ilmenite at pH 9.5, the contact angle peak occurred at an adsorption density corresponding to the monolayer plateau indicated by the adsorption isotherms (figures 39 and 40).

-145-
Comparison of figure 47 with figure 48 shows that the contact
angle at a given adsorption density and temperature is much greater at
pH 9.5 than at pH 8. Q At pH 9.5 the hydration of the hydrophilic
mineral surface sites would be greater than at pH 8.0 (95)
therefore the
contact angle at a given adsorption density ought to be less at pH 9.5 than
at pH 8.0; the very opposite of what is shown in figures 47 and 48.
It has been shown that the forthability of sodium oleate solutions increases
with pH, (96)
thus the higher contact angles at pH 9.5 might be the result
of increased oleate activity at the air/liquid interface. As mentioned
in section 9.2, the calcium and magnesium sites on the anorthite surface
would be more active at higher pH values. An alternative explanation
for the higher contact angles at pH 9.5 might therefore be that the
adsorption of oleate by calcium and magnesium sites results in increased
hydrophobicity at a given adsorption density.
9.5 The Effect of Oxygen and Mineral Oxidation State on the
Conditioning and Flotation of the Ilmenite Ore
Conditioning and flotation tests showed that the oxygen content
of the conditioning atmosphere was important to both the conditioning and
flotation response. Complete absence of oxygen prevented bulk flocculation
and resulted in a very poor flotation response whilst excess oxygen promoted
bulk flocculation and speeded up the flocculation - deflocculation cycle,
but also resulted in a poorflotation response. These results are in
agreement with those of Grebnev and Kiiko (63)
who observed that,
although the oxidation of fatty acid collector exerted a positive effect
on flotation by improving the grade and recovery, excess oxidation
reduced the grade and recovery.

-146-
Comparison of the normal power curves in figure 49 with curves
1 and 2 for the 'reduced' ore shows that the most significant difference
is the duration of the flocculation peak; the period of peak flocculation is
much longer for the 'reduced' ore than for the ordinary (oxidised) ore.
It has been shown that fatty acids are oxidised more rapidly by ferric (63)
ions than by ferrous ions It would therefore appear that the
phenomenon, occurring during the flocculation peak, and responsible for
bulk deflocculation, is associated with the oxidation of fatty acid by Fe 3+
. or Ti 3+ ions. Although the mineral oxidation state affected the rate
of the conditioning process it did not affect the flotation response;
unlike oxygen in the conditioning atmosphere which affected both the
conditioning and the flotation.
9.6 The Effect of Oxygen and Mineral Oxidation State on the
Adsorption of Oleate by Ilmenite
Comparison of the adsorption curves 1 and 2 with the 20 0C
isotherm at pH 9.5 (figure 50) and pH 8.0 (figure 51) shows that an ilmenite surface containing Fe 3+
and Ti 3+ ions adsorbs more oleate than
does one containing Fe 2+ and Ti 2+ ions. This is as expected because
ferric ions catalyse the oxidation of fatty acids and result in the formation
of various oxidation products, of which increased adsorption is reported (65) for one of these, the peroxy fatty acids Any dimers formed during
oxidation would also tend to increase the total oleate adsorption.
At pH 9.5 in the low adsorption density region corresponding
to chemisorption the 'reduced' ilmenite reacted more readily with
unoxidised oleate than with oxidised oleate. The optimum condition
for interact-ion in the region of chemisorption therefore appears to be

-147-
that of oxidised iron and titanium sites reacting with unoxidised oleate. Although evidence has been given for the formation of iron oleates on
(28) (59) ilmenite and hematite , no such evidence has been given for the
formation of titanium oleates. The formation of titanium oleates has
been studied near flotation conditions and it was concluded that the
reaction was practically impossible because -of the very low solubility (97)
of titanium hydroxides In view of the readily oxidisable nature
of the oleate and the catalytic action of metal ions it is suggested that the
adsorption of oleate by ferric ions is analagous to the mineral surface
catalysis of oleate oxidation. Such an interaction might provide an
explanation for the stoichiometry of metal oleates observed in infrared
studies (59,88,98)
where ferrous and cuprous oleates were formed and
not the expected ferric and cupric oleates.
In contrast to the 'reduced' ilmenite, the oxidised ilmenite
at pH 9.5 adsorbed far more oleate from the oxidised solution than from
the unoxidised solution (normal isotherm). Here the adsorption is
above a monolayer and so would essentially involve associative adsorption through hydrocarbon -hydrocarbon attraction. Any dim eri6aýti 6h". or, ., even polymerisation
(71) of fatty acid, caused by oxidation, would in this
region greatly enhance the adsorption of oleate.
For both the 'reduced' and oxidised ore at pH 8.0 the adsorption from oxidised solution was far greater than from unoxidised oleate
solution. This is as expected because even the lowest adsorption density,
measured at pH 8.0 was very near to monolayer coverage and therefore
the adsorption of collector would involve hydrocarbon-hydrocarbon
attraction. Under such conditions, as for the adsorption of oleate above
a monolayer coverage at pH 9.5, the adsorption by ilmenite would be
greater from oxidised oleate solutions than from unoxidised solutions.
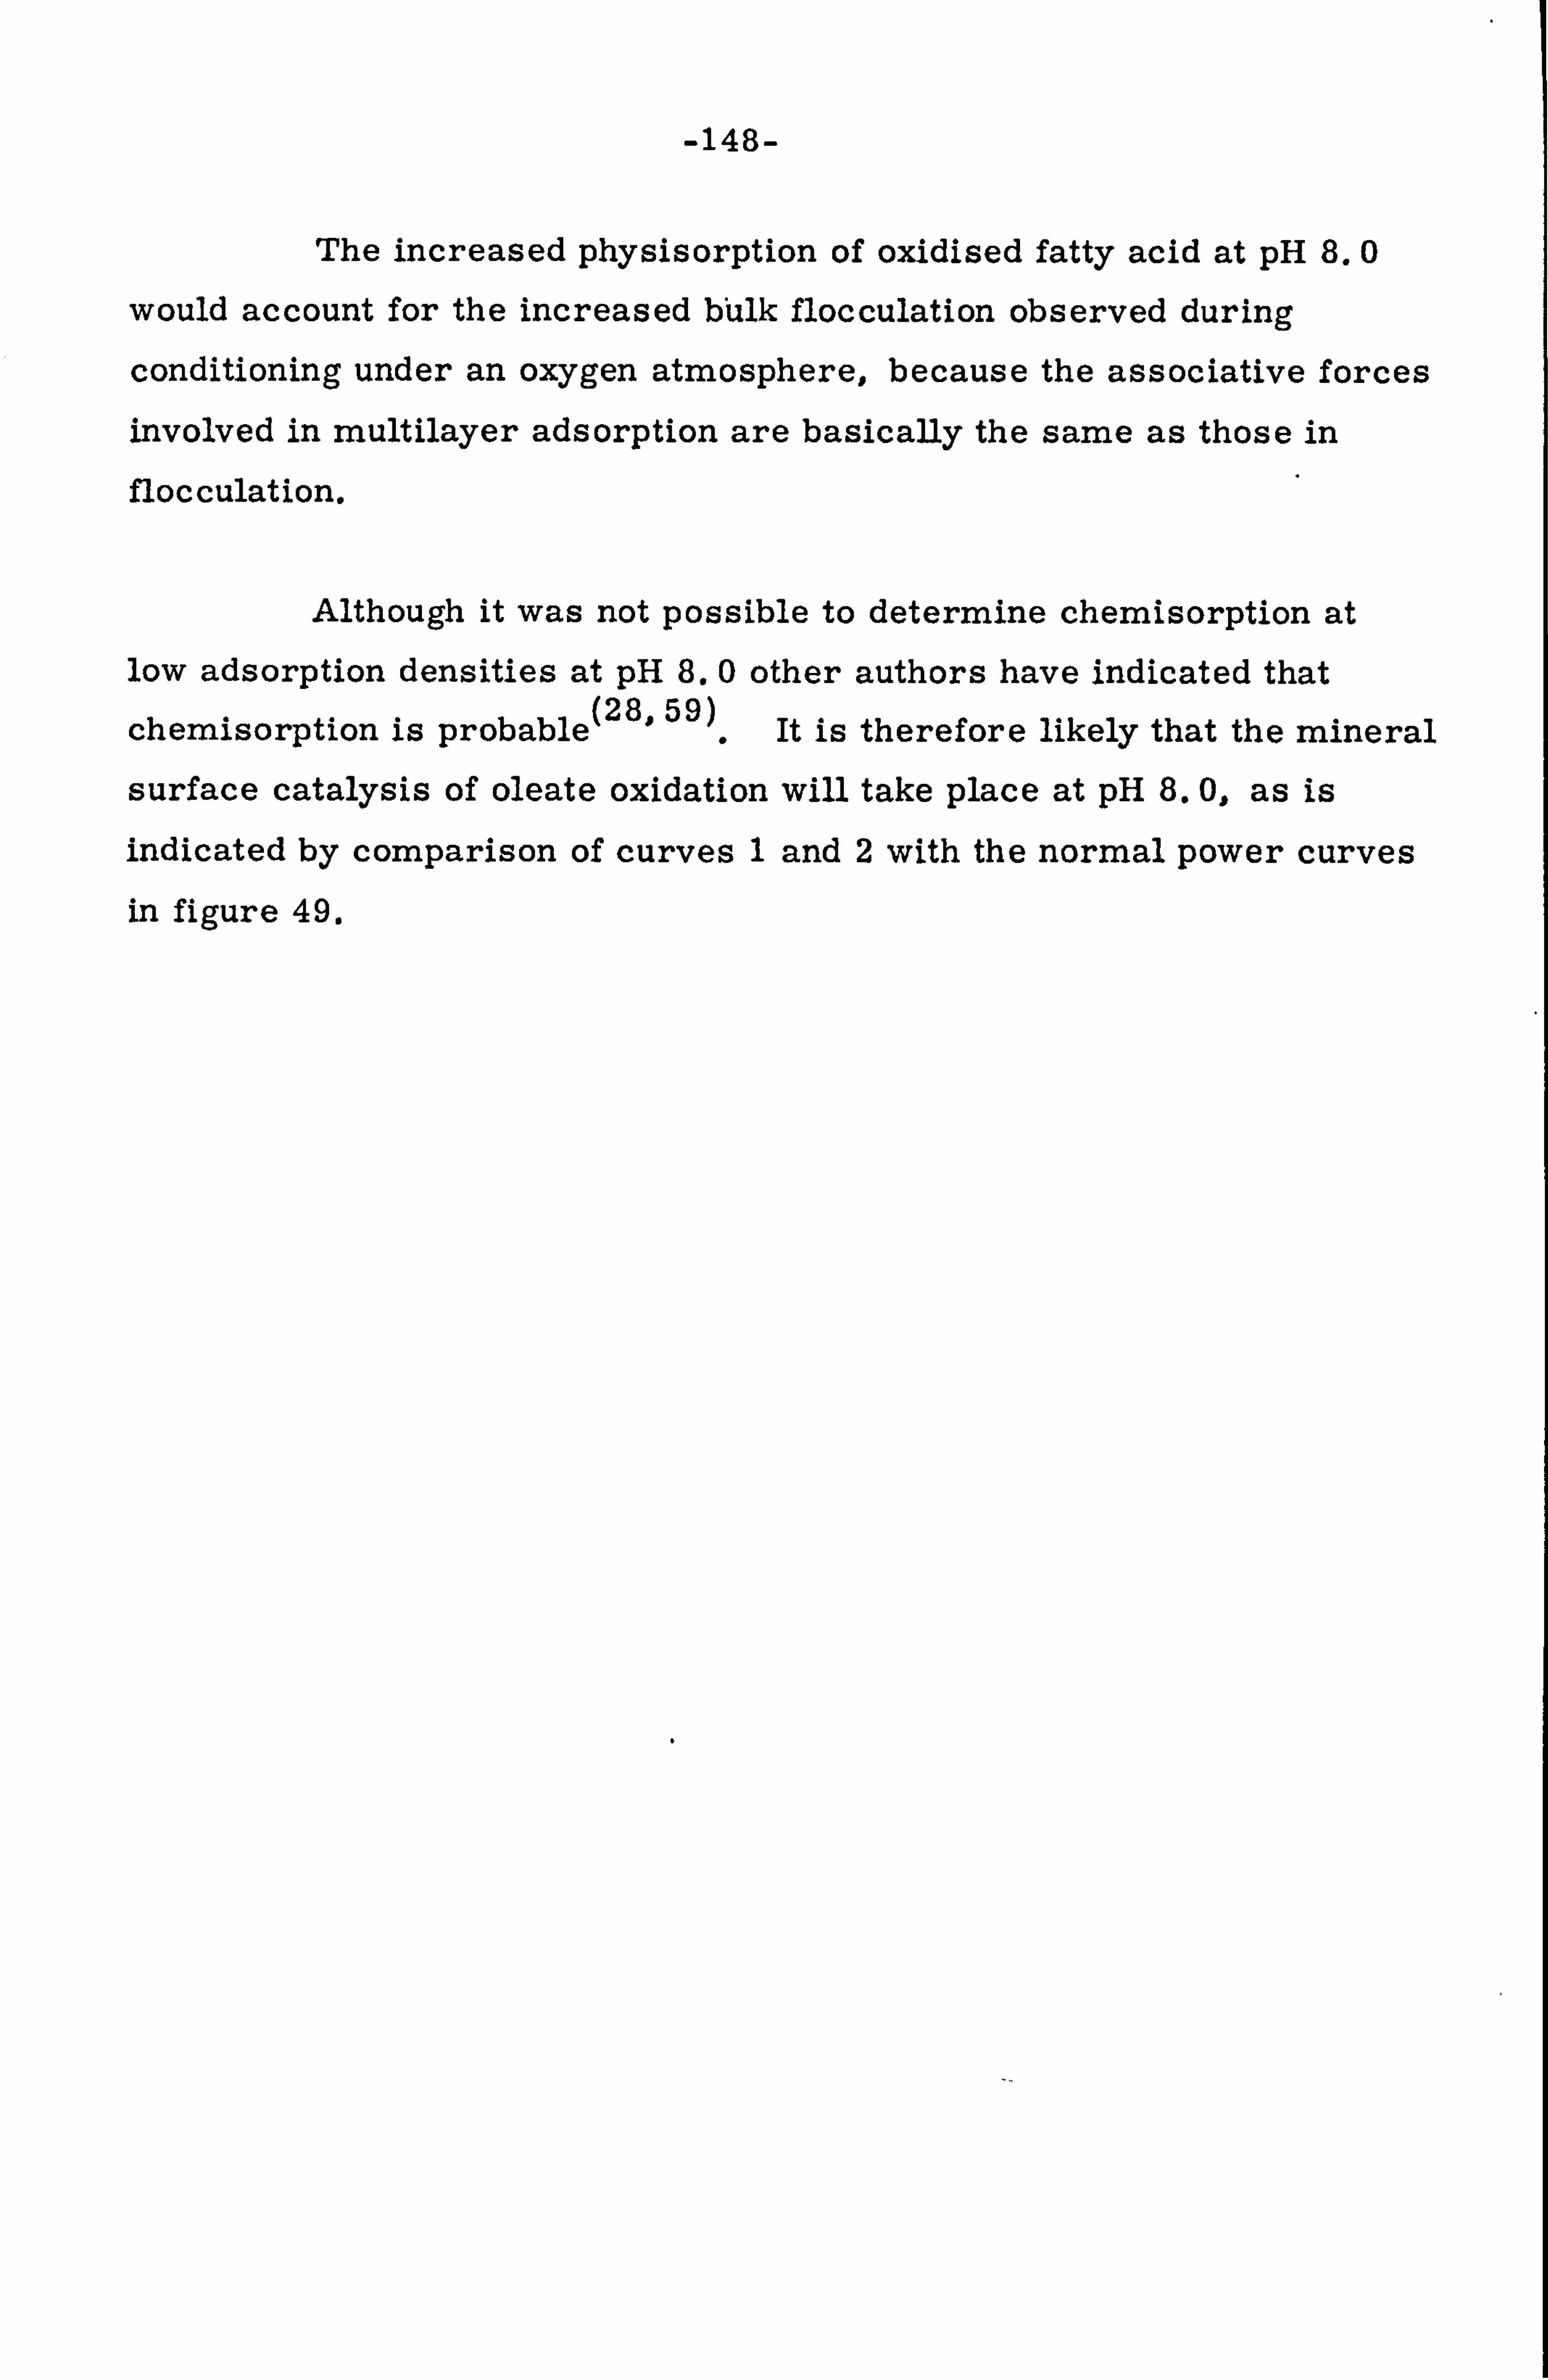
-148-
The increased physisorption of oxidised fatty acid at pH 8.0
would account for the increased bUlk flocculation observed during
conditioning under an oxygen atmosphere, because the associative forces
involved in multilayer adsorption are basically the same as those in
flocculation.
Although it was not possible to determine chemisorption at low adsorption densities at pH 8.0 other authors have indicated that
(28,59) chemisorption is probable It is therefore likely that the mineral
surface catalysis of oleate oxidation will take place at pH 8.0, as is
indicated by comparison of curves 1 and 2 with the normal power curves in figure 49.

-149-
10 GENERAL DISCUSSION AND CONCLUSIONS
10.1 The Effect of Temperature on Conditioning and Flotation
The results presented in part one of the thesis show that by
increasing the temperature of conditioning and flotation the ilmenite
recovery increased whereas, because of increased feldspar recovery, the ilmenite grade decreased. This is readily explained by reference to the results presented in part two which show that, at pH 8.0, an increase in temperature caused greater adsorption of oleate by ilmenite
and feldspar and a larger contact angle at the collector coated mineral/ liquid/air interface. The greater oleate adsorption by both minerals
explains the increased flocculation observed during conditioning.
Comparison of figure 27 with figure 25 showed that the flotation
response of a pulp conditioned at 20C and floated at 75 0C corresponded to the 75 0C conditioning and flotation isotherm. The flotation response
of the ilmenite and gangue was, therefore, dependent on the temperature
of flotation and n(?; the temperature of conditioning. This indicates
that either the adsorption of collector was reversible with respect to
temperature or at a given adsorption density the degree of hydrophobicity
was temperature dependent. The adsorption studies showed that the
adsorption of oleate by ilmenite in the region corresponding to physisorption,
where the adsorption process would be similar to that for feldspar,
was only partly reversible with respect to temperature, and a long
conditioning time was required to reach equilibrium (3 hours compared
with the 1 minute agitation in the flotation cell). However, the degree
of hydrophobicity of the collector coated mineral markedly increased

-150-
with temperature at a given adsorption density. It is therefore suggested
that the dependency of the flotation response on the temperature of flotation
is the result of the variation in the degree of hydrophobicity with
temperature at a given adsorption density, and not the result of reversible
adsorption.
Lapidot and Mellgrenýa) showed that the fatty acid was the
actual collector while fuel oil was needed at a minimum proportion to
render the surface completely hydrophobic and was therefore only a
promoter of surface hydrophobicity. For the purpose of the discussion
the collector has therefore been considered simply as oleic acid.
This simplification facilitates a more direct comparison of the results
of part one and part two.
Assuming that there was no reversibility of adsorption with
respect to temperature during the I minute agitation in the flotation cell,
the recovery of feldspar at 75 0 C, after it had been conditioned in the 0 pulp at 2 C, shows that the feldspar was coated with collector at the
deflocculation end point at 20C. Thus neither deflocculation nor flotation
selectivity can be explained by the removal of collector from the
f eldspar.
Although the feldspar was coated with collector before, during,
and almost certainly after deflocculation, at low temperatures it floated
at the flocculation peak but not at the deflocculation end point. The
contact angle results for anorth-ite at pH 8.0 show that although there was
no bubble contact at 20 and 20 0C there was bubble cling. These
observations suggest that the feldspar collector coating
would have a certain affinity for hydrocarbon chains, perhaps enough
affinity for the feldspar to flocculate with the ilmenite and float at the

-151-
flocculation peak, whereas at the deflocculation end point the feldspar
would not be sufficiently hydrophobic to float on its own. At 75 0 C,
however, the feldspar was more hydrophobic as evidenced by the contact
angle results and would therefore float at the deflocculation end point
as well as at the flocculation peak.
10.2 The Conditioning and Flotation Process
In the introduction it was pointed out that the conditioning of ilmenite in a thick pulp required either intense agitation for a short time
or less intense agitation for a longer time. Lapidot and Mellgren(9)
showed that during conditioning the pulp underwent characteristic changes
which were accompanied by a variation in the flotation response. They
explained this variation of flotation response by a mechanism of reagent transfer in which the role of attrition was important. Maximum sel ectivity
was obtained at the end of the deflocculation period where it was considered that only the ilmenite was collector coated. However, in section 2.1
it was pointed out that the force of attrition was dependent on the degree
of flocculation, therefore it is unlikely that deflocculation of the pulp, or the removal of collector from the gangue or ilmenite, can be explained by attrition alone.
The results of conditioning tests carried out by Lapidot at
pH 4.5 and the results presented here in figure 17 show that selective flotation was not dependent on bulk flocculation of the pulp. It is
therefore suggested that the process by which selectivity is obtained, does
not involve the removal of collector from the gangue minerals.

-152-
The results of the temperature work strongly suggest that the
feldspar or gangue minerals are coated with collector before, during and
after deflocculation, therefore neither deflocculation nor selectivity can
be explained by the removal of collector from the gangue.
In view of these observations the conditioning and flotation
process can now be considered as follows:
During the induction period almost all the minerals are coated
with collector but there is little flotation recovery or selectivity. As
the pulp flocculates the recovery increases rapidly until it reaches a
maximum at the flocculation peak, but the selectivity only increases
slightly. At the flocculation peak various changes take place within
the I quasi- continuous I oil film and the pulp deflocculates. During the
deflocculation period the feldspar becomes less flotable, although it
is still coated with collector, and as a result the ilmenite grade increases.
At the end of the deflocculation period the ilmenite grade is maximum
and the recovery is high, but with further conditioning the ilmenite
recovery decreases rapidly. Thus, during the induction period the
ilmenite and feldspar are coated with collector but are unflotable whilst
at the end of the deflocculation period both minerals are still coated with
collector but only the ilmenite is flotable. During the flocculation - deflocculation cycle, therefore, not only is the state of the pulp changing
but so is the adsorbed layer on the ilmenite. It is unlikely that such a
change will take place as rapidly as is indicated by the sharp increase
in recovery during flocculation. More likely, by the end of the induction
period the weakly adsorbed collector coating is sufficient to allow bulk
flocculation and the coincidental formation of a 'quasi -continuous I oil
phase. In this state the feldspar will float only as a result of its inclusion

-153-
in the oil phase although it will not float as discrete particles. During
the flocculation peak, however, the collector on the ilmenite will become
more strongly adsorbed and gradually acquire a more hydrophobic
structure which, on deflocculation, will a1low the ilmenite to float as
discrete particles, whilst the feldspar, which does not possess a strong
affinity for the collector, will retain its original coating (that has an
affinity for hydrocarbon chains although it is hydrophilic) and remain
unflotable as discrete particles. The change in the ilmenite collector
coating that causes the ilmenite to become flotable could at the same time
cause autophobic retraction at the boundary of the strongly hydrophobic
layer on the ilmenite surface and so allow the pulp to deflocculate.
There are a number of ways by which the oleate layer could
become more hydrophobic with time, it could do so because the adsorbed
collector molecules become more ordered, more condensed, or oxidised.
The latter suggestion is supported by the results presented in figure 49
which shows that the phenomenon occurring during the flocculation peak,
and responsible for bulk deflocculation, as associated with the oxidation
of fatty acid by Fe 3+ or Ti
3+ ions.
A similar change in the structure of the adsorbed collector
must also take place to allow flotation of the ilmenite when no bulk
flocculation occurs, and it is perhaps more than coincidence that the time
taken for the ilmenite to become flotable is more or less the same
with or without flocculation providing the collector dosage, pulp density,
slimes content and stirrer speed are similar (so similar as to have no
effect on the mineral- collector interaction and flotation response but
different enough to affect bulk flocculation). It is therefore suggested
that bulk flocculation is a by-product of high pulp density, high intensity,

-154-
conditioning and that the change of the ilmenite collector coating necessary
for flotation is also partly or wholly responsible for deflocculation.
Because of this the flocculation - deflocculation cycle gives a reliable,
though approximate, indication of the conditioning time necessary for
selective ilmenite flotation.
Conditioning at high intensity and a high pulp density in no way
improves the metallurgy, nor is the resulting bulk flocculation essential
for good metallurgy, it does, however, markedly reduce the conditioning
time. The results of part two showed that the presence of oxygen in
the conditioning atmosphere was essential; in the absence of oxygen bulk
flocculation did not occur and the flotation response was very poor.
Clearly, conditioning at high intensity and a high pulp density would speed
up the interaction of the collector in the pulp with atmospheric oxygen
and so speed up the flocculation- defloc culation cycle. The results
also showed that excess oxygen was deleterious to flotation even though
it enhanced bulk flocculation. This would explain the previously
unaccountable decrease in ilmenite recovery with prolonged conditioning.
10.3 Conclusions
The effect of temperature on the conditioning and flotation of
an ilmenite ore with an oleic acid: kerosene collector mixture has been
determined. Adsorption of oleate from aqueous oleate solutions by
'pure' ilmenite and feldspar, and bubble contact angles on ilmenite and
feldspar in aqueous oleate solutions, were measured at different temperatures
at pH 9.5 and 8.0. A study was made of the effect of oxygen and mineral
oxidation state on conditioning and flotation and on adsorption of oleate
by ilmenite. The results of the conditioning and flotation studies were
compared with those of the adsorption and contact angle studies.

-155-
1 The conditioning process, as reflected by the shape of the power
curves, is very sensitive to small changes in pulp density and slimes
content. Because of this it is not possible to locate the optimum
conditioning time by reference to a standard conditioning curve.
2 Although the flotation response is not affected by a variation
in the conditioning stirrer speed and pulp density, a significant improvement
of the flotation response and a marked reduction of the collector requirements
is obtained when the slimes content of the pulp is reduced.
3 Mineralogical examination of the flotation products showed
that, of the main silicate minerals in the ore,. the schillerised hypersthene
responds to flotation in the same way as the ilmenite and so cannot
successfully be separated from it. The ilmenite can, however, be
separated from the feldspar and biotite.
4 An increase in temperature reduces the total conditioning time and power consumption required to reach any characteristic point
on the conditioning curve.
5 By elevating the temperature of conditioning and flotation the
ilmenite recovery increases but, because of the increased feldspar
recovery, the grade decreases.
6 Although the flotation response is dependent on the temperature
of flotation it is not dependent on the temperature of conditioning.
7 The adsorption of oleate by ilmenite and feldspar, and the
contact angle with the collector coated mineral at a given collector
adsorption density, all increase with temperature at pH 8.0.

-156-
8 The adsorption of oleate by ilmenite is only partly reversible
with respect to temperature and a long conditioning time is required for equilibrium. The temperature dependence of flotation is therefore
attributed to the increase in hydrophobicity of a given mineral collector
coating, regardless of the increase in the amount of collector adsorbed.
9 The adsorption of oleate by ilmenite at pH 9.5 is by an exothermic
chemical reaction at adsorption densities below a vertically orientated
monolayer, and by endothermic physical adsorption at adsorption densities
above a monolayer. At pH 8.0 and above a monolayer the adsorption is physical and endothermic. .
The chemical reaction at adsorption densities below a monolayer at pH 9.5 involves the oxidation of oleate by
ferric ions on the ilmenite surface whilst above a monolayer the oleate is thought to be reverse orientated. At pH 8.0 adsorption above a
monolayer is thought to resemble bulk oleic acid.
10 Anorthite physically adsorbs oleate, and the adsorption isotherm
suggests a horizontal oleate orientation. Although the adsorption of
oleate by feldspar increases with temperature at pH 8.0, it is unaffected by temperature at OH 9.5.
ill At a given temperature and oleate equilibrium concentration the contact angle with ilmenite is far greater than with feldspar.
12 Although an increase in temperature increases the contact
angle on both ilmenite and feldspar at a given adsorption density at pH 9.5
and 8.0, the effect is much more important for the feldspar because at
pH 8.0 an-increase in temperature from 20 0C to 75 0C causes the collector
coated anorthite to become hydrophobic.
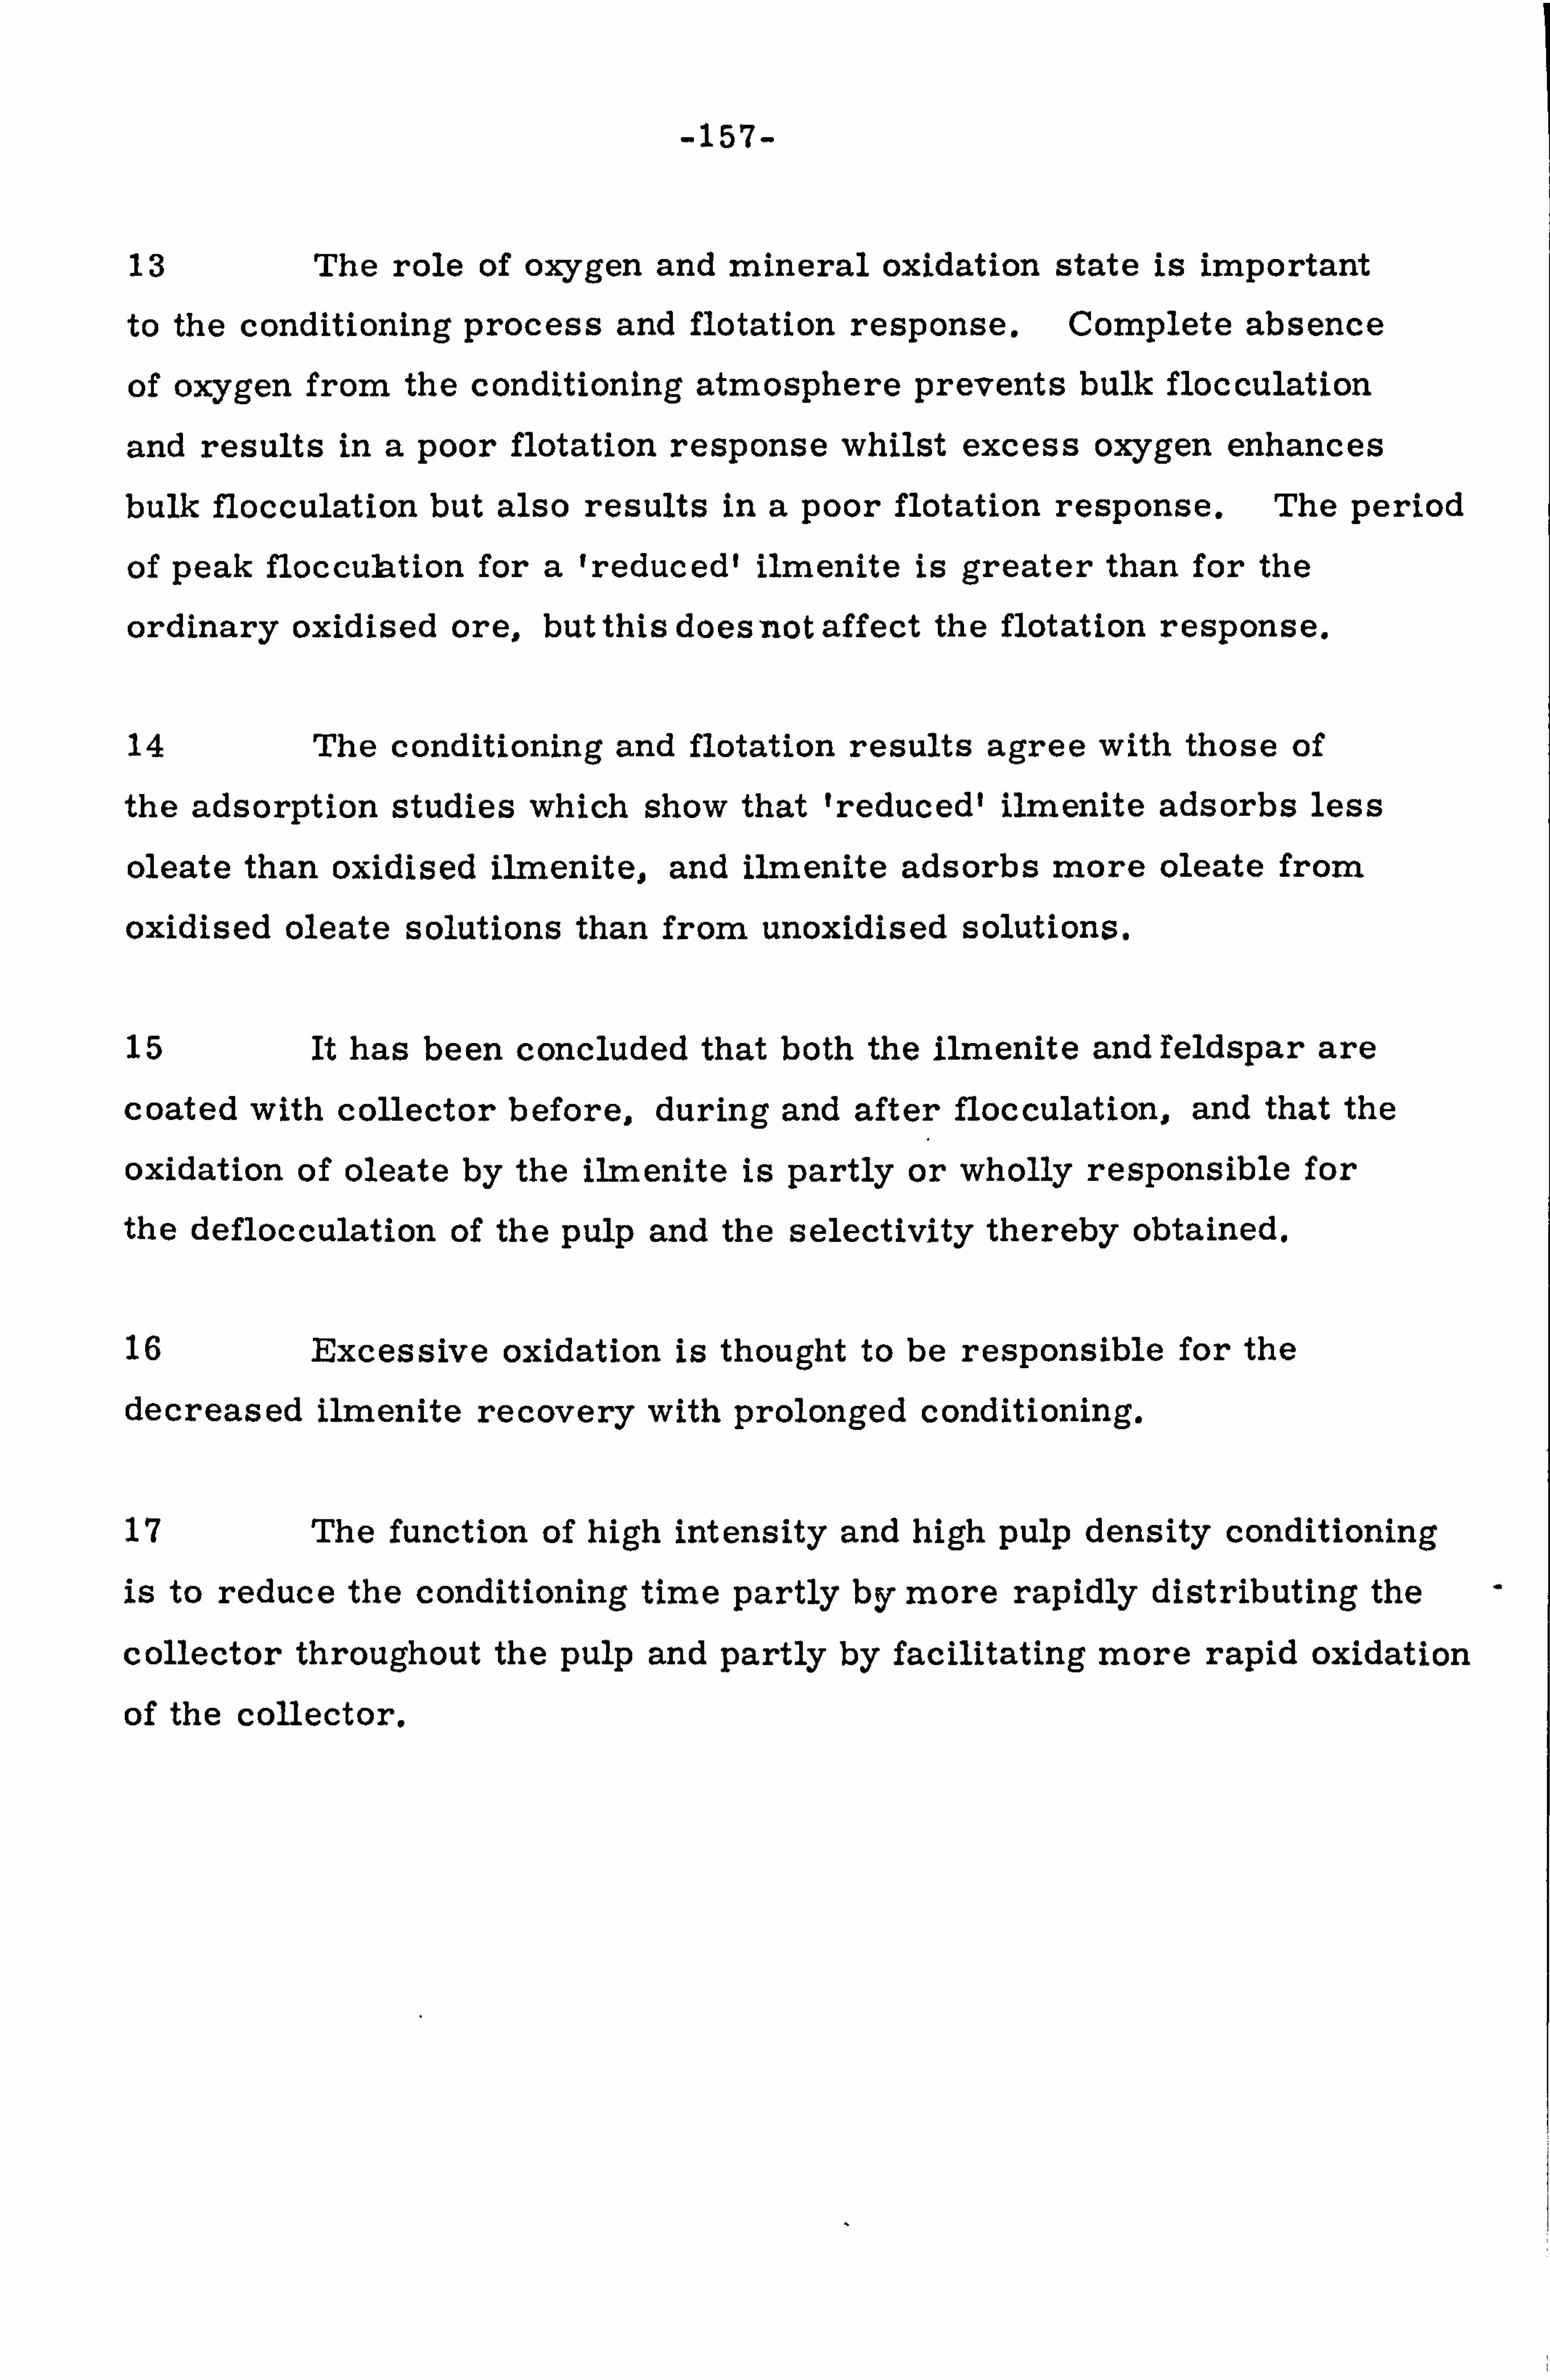
-157-
13 The role of oxygen and mineral oxidation state is important
to the conditioning process and flotation response. Complete absence
of oxygen from the conditioning atmosphere prevents bulk flocculation
and results in a poor flotation response whilst excess oxygen enhances
bulk flocculation but also results in a poor flotation response. The period
of peak floccuhtion for a 'reduced' ilmenite is greater than for the
ordinary oxidised ore, but this does not affect the flotation response.
14 The conditioning and flotation results agree with those of
the adsorption studies which show that 'reduced' ilmenite adsorbs less
oleate than oxidised ilmenite, and ilmenite adsorbs more oleate from
oxidised oleate solutions than from unoxidised solutions.
15 It has been concluded that both the ilmenite and feldspar are
coated with collector before, during and after flocculation, and that the
oxidation of oleate by the ilmenite is partly or wholly responsible for
the deflocculation of the pulp and the selectivity thereby obtained.
16 Excessive oxidation is thought to be responsible for the
decreased ilmenite recovery with prolonged conditioning.
17 The function of high intensity and high pulp density conditioning is to reduce the conditioning time partly by more rapidly distributing the
collector throughout the pulp and partly by facilitating more rapid oxidation
of the collector.

-158-
A T3T3'Lll-, Tr%T'Nr
The Power Consumption and Characteristics of a d. c. Motor
by (23)
:-
The power consumed by the armature of a d. c. motor is given
2 Va. Ia = E. la + la. Ra
where Va = the voltage applied across the armature Ia = the armature current Ra = the ohmic resistance of the armature E= the back e. m. f.
2 Ia. R= the power lost in the resistance E. Ia = the power available for performing mechanical
work, including that lost by friction at the bearings
and brushes and by hysteresis and circulating eddy
currents within the iron core.
The circuit shown in figure 3 provides separate excitation to the field and armature windings and so ensures that the field voltage
(23) is constant Because the fi6ld voltage is constant the power loss
included in E. Ia can be calibrated by determining the power consumption 1
(Va. Iaý as a function of the motor speed when no load is applied.
The net power at any given speed is given by: -
E. Ia - E. la 12
2 where E. Ia Va. Ia - Ia. Ra 3
111 12 and E. Ia Va. Ia Ia . Ra 4
121 Therefore the net power E. Ia - E. Ia Va. Ia - Ia. Ra - E. Ia_ 5

-159-
The no load characteristics of the motor were determined and
are presented in figures 52 and 53. The linear variation of motor speed
and armature current with armature voltage is shown in figure 52. By
subtracting the ohmic losses from the total power consumed in the
armature coil during idling the idling losses were determined. Figure
53 shows the variation in idling power loss with stirrer speed. At any
given stirrer speed the net power consumption was determined by
subtracting the idling power loss and the ohmic losses under load
from the gross power consumption in the armature coil (equation 5).

- -160-
FiEure 52 Motor speed and armature, current as functions of the
armature voltag
1000 50
E 80
"0 60
P4
1ý4
40
20
10
Cd
-fý
CD
4ý cis
-: 4
f
. ari-naLure vu. LLugt: kvi
Figure 53. Idling power losses as a function of the motor speed
3.
', 2 w 0
r-I $4
0 04
-4 1-4 II :IL
200 - 400.600 800 1000.
- Stirrer speed (rpm)

-161-
BIBLIOGRAPHY
BRING, G. G., 'Flotationsanrkning av blostensmalmerl Jernkont.
Ann. 122,1938,139-169.
2. HUTTL, J. B., 'How Manganese In. Upgrades Three Kids Orel.
Engng. & Min. J. 156,1955,88-93
3. KIHLSTINDT, P. G., 'Flotation of Hematite Ores with Tall Oil
Emulsions', International Mineral Dressing Congress,
Stockholm 1957,559-576.
4. EIDSMO, 0., and MELLGREN, 0., 'Some factors which influence
ilmenite flotation at Titania A/S, Norway'. 5th Int. Min.
Proc. Congress, London 1960,431-444.
5. RUNOLINA, U., RINNE, R., and KURRONEN, S., 'Agglomeration
flotation of ilmenite ore at Otanmakil. Int. Min. Proc.
Congress. London 1960.
6. LI, KUN, LIVINGSTON, R. N., AND LEMKE, L. K., 'Flotation
conditioning of ore with petroleum sulphonatel. Trans. I. M. M.
70 Oct, 1960,19-31.
7. LI, KUN, LIVINGSTONE, R. N., and LEMKE, L. K., 'Flotation
conditioning of ore with petroleum sulphonatel. Discussions
and contributions. Trans. I. M. M. 70, Jan 1961,205-13.
8. LAPIDOT, M.,, .- 'Conditioning and flotation of an ilmenite
ore'. PhD Thesis, London University, 1964.
9. LAPIDOT, M., and MELLGREN, 0., 'Conditioning and flotation
of an ilmenite ore'. Trans. I. M. M. 77, C149-165.1968.

-162-
10. LAPIDOT, M., and MELLGREN, 0., 'Conditioning and flotation
of an ilmenite ore. I Discussions and contributions Trans.
I. M. M. 78, C47-C51.1969.
11. MACKENZIE, J. M. W. ,I The Role of C onditioning Energy in
Emulsion Flotation'. Proc. Aust. Inst. Min. Met., No. 233,
March 1970, p. 49.
12. OSIPOW, L. J. I Surface Chemistry, Theory and Industrial
Applications', Reinhold Publishing Corp., N. Y., 1962, p261.
13. STRATHMORE, R. B., COOKE, I. I., CHOI, H. S., 'Effect of
Temperature on Soap Flotation of Iron Orel Trans. A. I. M. E.
217p 1960, p 76.
14. LAAPAS, H., 'An investigation of the effect of pulp temperature on
the flotation of iron bearing oxide minerals with fatty acids.
Proceedings of the llth International Mineral Proc. Congr.
Cagliari, 1975. Special Volume Issued by Ente Minerario
Sardo. p. 143.
15. HUKKI, R. T., 'Hot Flotation Improves Selectivities and Raises
Mineral Recoveries. 'World Mining, Vol. 26, No. 3,
March 1973, p. 74.
16. KLASSEN, V. I., GUREVICH, R. I., BELINSKI, S. I., and KORNEEV, A. F., 'Flotation with oleic acid at increased
pulp temperature. Non. Ferr. Metals, Moscow No. 4 1958.
17. DEAN, K. C., SCHACK, C. H., 'Flotation of Calcareous Scheelite Ores', U. S. But. Mines, R. I. 6385,1964.

-163-
18. GEIS, H. P. 'A short descritpion of the iron-titanium provinces
in Norway with special reference to those in production.
Mineral Science and Engineering 1, No. 3,1971,13-24.
19. GY, P. M., Revue de L'Industrie Minerale 35, No. 607.1954.
20. JONES, M. P. and FLEMING, M. G., 'Identification of Mineral
Grains', Elsevier: London 1965.
21. DEER, W. A., HOWIE, R. A. and ZUSSMAN, J., 'Rock Forming
Minerals'. Longman: London 1963, Vol 4, p152.
22. DANA, E. S., 'Testbook of Mineralogy'. Wiley: London 1932.
23. HUGHES, E., 'Electrical Technology' Longmans: London, 1960,
694p.
24. SMITH, R. W., TRIVEDI, N., 'Variation of point of zero charge
of oxide minerals as a function of ageing time in water'.
Trans. Soc. A. L M. E. Vol. 256 No. 1 March 1974, p69.
25. WARREN, L. J. 'Slime coating and shear flocculation in the
Scheelite -sodium oleate system'. Trans. I. M. M. 84
1975, C99-C104.
26. WARREN, L. J. 'Shear flocculation of ultrafine scheelite in
sodium oleate solutions'. J. Colloid Interface Sci. 50,
1975,307-18.
27. KYOSTI, K., 'Factors affecting the conditioning of an apatite ore
for agglomeration flotation, Trans I. M. M. 81,1972
C219-26.

-164-
28. GUTIERREZ, G., 'Flotation of Ilmenitel Research Progress
Report No. 43, January 1972. Mineral Technology, Royal
School of Mines, London. (unpublished)
29. SPARKS, B. D., and WONG, R. H. T., 'Selective Spherical Agglome-
ration of Ilmenite Ores'. CIM Bulletin, Jan. 1973, p73.
30. READ, A. D., NIANSER, R. M., 'Surface Polarisability and
flotation: study of the effect of cation type on the oleate flotation
of three orthosilicates. Trans. IMM 81 c69-78.1972.
31. FUERSTENAU, M. C., RICE, D. A., ELGILLANI, D. A., ATAK, S.,
and BHAPPU, R. B., 'The Role of Iron in the Flotation of
Some Silicates'. Trans. Soc. Mining Eng. Dec. 1966 321-328.
32. IWASAKI, L, COOKE, S. R. B., and CHOI, H. S., 'Flotation
Characteristics of Hematite, Goethite and Activated Quartz
with 18 Carbon Aliphatic Acids and Related Compounds. I
Trans. A. I. M. E. Vol. 217,1960, p237-244.
33. TANFORD, C., 'The Hydrophobic Effect' Wiley, New York, 1973.
34. MARKINA, Z. N., 'Hydrophobic Interactions in Aqueous Solutions
of Surfactants' Usp. Kolloid, Khim. 1973, p 239-48 (Russ)
Chem. Abst. 81 26,171873.
35. MARKINA, Z. N., CHINNIKOVA, A. V.,. and REMINDER, P. A.,
'Effect of temperature on rheological properties of aqueous
solutions of sodium oleate. I FizrKhim. Mekhan. Dispersnykh
Struktur, Akad Nauk. SSSR, Sb. Statei. 1966,53-9 (Russ)
Chem. Abst. 1966 55 5682g.

-165-
36. ONOPRIENKO, N. N., GONTARENKO, P. A., 'Improvement of the flotation of ferric oxide by use of collector combinations'. Obogasch. Polez. Iskop. 1970, No. 6,64-70. (Russ)
Chem. Abst. 1971 75 8703a.
37. RALSTON, A., and HOERR I Solubilities of fatty acids in water
at different temperature. J. Amer. Chem. Soc. 64 772.
38. FLOCKHART, B. D., and GRAHAM, H., 'Study of dilute aqueous
solutions of sodium oleatel. Journal of Coll. Sci. 1953,
8, p105.
39. SHINODA, NAKAGAWA, TAMAMUSHI and ISEMURA 'Colloidal
Surfactants' Academic Press, New York and London 1963.
40. BUR'-YANEKO, A. F., and STOROZH, G. F., 'Effect of Temperature
on the critical concentration of micelle formation of sodium
oleate in aqueous solution. -. I Visn. Urivsk. Derzh. Univ.
Ser. Khim., Lvov. 1964,51-4 (Ukrain) Chem. Abst. 1966.
64.7402f.
41. KLASSEN and MOKROUSOV. 'An introduction to the theory of flotation'. Butterworths, London 1963.
42. TAMAMUSHI, B., and TAMAKI, K., 'Adsorption of long chain
electrolytes at the solid/liquid interface. I Surface Activity:
Proceedings of the Second International Congress, London
1957. Vo. III, p. 449. Academic Press, New York, 1958.
43. BERGER, G. S., ISHCHENKO, V. V., KISELEV, L. M., POLIKIN
S. 1. , and TURSUNOVA, S. A., I Mechanism of the action of long-chain collectors on fluorit6. Izv. Vyssh. Ucheb.
Zaved., Tsvet. Met. 1962,12(2), 26-9 (Russ) Chem. Abst.
1969 71,70317m.

-166-
44. EIGELES, M. A., 'Theoretical basis of the flotation of non
sulphide minerals'. Metallurgizdat 1950.
45. PLAKSIN, I., 'Interaction of minerals with gases and reagents
in flotation. Mining Engineering and Trans. 1959., Vol. II
p319.
46. BERUBE, Y. G., and DE BRUYN, P. L., 'Adsorption at the rutile
solution interface. 1. Thermodynamic and Experimental
study'. Journal of Coll. and Interface Sci. 1968,27. p. 305.
47. TEWARI, P. H., and McLEAN, A. W., I Temperature dependence
of point of zero charge of alumina and magnetite. I Journal of
Coll. and Interface Sci. 1972.40, p267.
48. SUN, S. C., SNOW, R. E., and PURCELL, V. I., 'Flotation
characteristics of a florida leached zone phosphate ore with
fatty acids. I Trans. A. I. M. E., 1957,208, p70.
49. MITROPANOV, S. I., and KURSHROKOVA, Z. V. G., 'Temperature
effect on the adsorption of tridecylamine on certain minerals.
Inst. Truetn. Metal 1962,19,15-18. Chem. Abst. 1964,
3520b.
50. CASES, J. M. 'Physiochemical phenomena at the interface.
Application to the flotation process. Sci. Terre. Mern.
1968,13,119 (French).
51. KHARALAMPIEV, Khr. 'Variation of the hydrophobisation of
minerals at various temperatures. I Nauchniozsled. Proekt.
Inst. Rudodobiv. Obogat., Obogat. 1971 10(10). 71-87. (Bulg.
Chem. Abst. 1973,79(8), 44559z.

-167-
52. SHRYLEV, L. D., AAIANOV, - K. B., and SVIRIDOV, V. V.,
'Effect of temperature on the flotation separation of Ni 2+
and Co 2+ ions collected by potassium laurate. I Zh.
Prikl. Khim. (Leningrad) 1973,46(7), 1593 (Russ).
53. EIGELES, M. A. and VOLOVA, M. L. 'Kinetic investigation of
effect of contact time, temperature and surface condition on the adhesion of bubbles to mineral surfaces. I 5th Int. Min.
Proc. Cong. London. IMM 1960,271-285.
54. GLEMBOTSKI, V. A., GIATSINTOVA, K. V., SOLOZHENKIN, P. M.,
'Kinetics of the physico chemical state of the liquid/gas interface
and its role in the basic action of flotation. Dokl. Akad.
Nauk. SSSR. 1966,169(l), 139-42 (Russ) Chem. Abst. 1966,
65,10175a.
55. FOFANOV, G. M., SHREDER, Ya. I. 'Effect of surfactants on the
wetting of solids. I Tr. Belgorodskogo Tekhnol. Inst. Stroit.
Mater. 1972,1,3-5 (Russ). Chem. Abst. 1974,81,1117786.
56. GAUDIN, A. M., and FUERSTENAU, D. W., 'Quartz Flotation with
catimic collectors. I AIME Trans., 1955,202, p958.
57. DU RIETZ, C., 'Fatty acids in flotation' Progress in Mineral
Dressing: 4th Int. Congr. Stockholm 1957, (Almquist and
Wiksell, Stockholm, 1958), p417-39.
58. POPE, M. I. and SUTTON, D. I., 'The correlation between froth
flotation response and collector adsorption from aqueous
solution. Part 1. Titanium dioxide and ferric oxide conditioned in oleate solutions. I Powder Technology 1973,7,271-279.
f

-168-
59. PECK, A. S., RABY, L. H., and WADSWORTH, M. E., 'An
infrared study of the flotation of hematite with oleic acid and
sodium oleatel. Trans. AIME 1966,235,301.
60. HAN, K. N., HEALY, T. W., and FUERSTENAU, D. W.,
'The mechanism of adsorption of fatty acids and other
surfactants at the oxide/water interface?. Journal of Coll.
and Interface Sci. 1973,44(3). 407.
61. COOK, M. A., 'Hydrophobic control of surfaces by hydrolytic
adsorption'. 'Hydrophobic Surfaces' edited by Fowkes, F. M.,
Academic Press. 1969.
62. GOOD, J. R., 'Closing Disucssion' 'Wetting' S. C. I. Monograph
No. 25, Soc. of Chem. Ind., 1967.
63. GREBNEV, A. N. and KIIKO, L. D., 'Conditions and rates of
oxidation of unsaturated fatty acids during flotation. Izv.
Akad. Nauk SSSR, Met-., i. Gorn. Dela. 172 (1964(5)).
64. DOROKHINA S. N., 'Effect of oxygen on the collective properties
of oleic acid. I Inst. Gorn. Dela. Akad. Nauk. SSSR. 19
75 (1963); Chem. Abst. 1964 61 6665.
6 5. PLAKSIN, 1. N. , and SOLNYSHKIN, V. I. ,I Effect of oxygen on
oleic acid'. Ironoobmen. i. Ekstraktsion. Metody. v. Khim-Obogat., Protsessakh, Akad. Nauk SSSR., Inst.
Gorn. Dela 64 1965; Chem. Abst. 1965 63 13,029g.
66. PLAKSIN, I. N., and DORKHINA, S. N., I Physical- chemical
properties of emulsion oxidised oleic acid. I Obogashch Rud.
i. Uglei, Akad. Nauk. SSSR, Inst. Gorn. Dela. 129 1963.

-169-
67. SYSOLYATIN, S. A., 'Oxidation and reduction in the flotation of
titanium ores' Tr. Nauch-Issled. Proekt. Inst. Obogashch,
Mekh, Orab. Polez. Iskop. 'Uralmekhanobrl 13,76,1967.
Chem. Abst. 1968.4436u.
68. PLAKSIN, I. N., 'Study of superficial layers of flotation reagents
on minerals and the influence of the structure of minerals
on their interation with collectors. I 8th Int. Min. Prog.
Cong. 1960.
69. MARKLEY, K. S., 'Fatty Acids, I part 2 673, Interscience Publishers
(1961).
70. ELLIS, G. W., 'Autoxidation of fatty acids'. Biochem. J., 1950,
46,129.
71. KUZIKIN, S. F., PARSHENKOV, S. A., SOLNYSHKIN, V. I., and
KHAN, G. A., I Study of forms of oleic acid attachment and
grain aggregation in oxidised minerals by infrared spectroscopy'.
'Flotation Properties of Rare Metal Minerals' Edited by
I. N. Plaksin, Primary sources. New York. 1967.
72. PE-HSI CHIEN and CHING-TUANG LUNG. 'Effect of ultraviolet
light on the properties of flotation reagents. The flotation
properties of peroxy fatty acids. Chin Shu Hsueh Pao 1965,
8(2), 149. Chem. Abst. 1966 64 17,091g.
73. EMANUEL, N. M., 'The oxidation of Hydrocarbons in the Liquid
Phase', Pergamon Press (1965).
74. SUTHERLAND, K. L. and WARK, I. W., 'Principles of Flotation'
Australian Institution of Mining and Metallurgy, 1955,489p.

-170-
75. GREGORY, G. R. E. C., 'The determination of residual aniz)nic
surface-active reagents in mineral flotation liquors.
Analyst 1966,91,251-7.
76. LATYMER, W. M, 'The Oxidation States of the Elements and
their Potentials in Aqueous Solutions. I Prentice-Hall Inc.,
1956. New York.
77. C. E. G. B. 'Modern Power Station Practice, ' Vol. 5,201-203,
Pergamon Press 1971.
78. HOLMAN, R. T., and BURR, G. 0., 'Spetrophotometric studies
of the oxidation of Fats. -, VI. Oxygen adsorption and
chromophore production in fatty esters. I J. Am. Chem. Soc.
(1946), 68,562-566.
79. MULAR, A. L., and ROBERTS, R. B., 'A simplified method to
determine isoelectric points of oxides. ' The Canadian
Mining and Metallurgical Bulletin Nov. 1966 1329-1330.
80. PARKS, G. A., and DE BRUYN, P. L., 'The zero point of charge
of oxides. I J. Phys. Chem. 1962,66,967.
81. LASKOWSKI, J., I Particle -bubble attachment in flotation'.
Minerals Sci. Engng, 1974 6(4), 223-235.
82. FINCH, J. A., and SMITH, G. W., 'Interface adsorption densities
in flotation. I Letters to the Editors. Journal of Coll. and
Interface Sci. 1973,44(2), 387-388.
83. OKO, M. U., and SAHMAN, T., 'Adsorption of fatty acid soaps
on hematite. I Canad. Min. Jýý- 1966 March 61-66.

-171-
84. GILES, C. H., MACEWAN, T. H., NAKHWA, S. N., and SMITH, D.,
'Studies in adsorption. XI. A system of classification of
solution adsorption isotherms, and its use in diagnosis of
adsorption mechanisms and in measurement, of specific area
of solids'. J. Chem. Soc. 1960(111), 3973.
85. OTTEWILL, R. H., and TIFFANY, J. M., 'The adsorption of long chain acids onto rutile from n-heptahe. I Journal of Oil and Colour Chemistry Association 1967,50,844-864.
86. WORST VADER, F., 'Adsorption of detergents at the liquid-
liquid interface. Trans. of Faraday. Soc. 1960,56,
1067-1077.
87. GREENWOOD, F. G., et al., 'Adsorption and wetting phenomena
associated with graphon in aqueous surfactant solutions. In: Adsorption from aqueous solution. Adv. Chem. Ser.
1968,79,135-144.
88. PATERSON, J. G., and SALMA-N, T., 'Adsorption of sodium oleate
on cupric and ferric hydroxides. Trans. I. M. M. 1970,79,
C91.
89. KIRCHBERG, H., and TOPFER, E., 'The mineralisation of air bubbles in flotation. I 7th Int. Min. Proc. Cong. New York
1974. N. Arbiter (ed. ), Gordon and Breach, New York,
1965, Vol. 1 157-168.
9 0. WATSON, D. , and MANSER, R. M. ,I Some factors affecting the
limiting conditions in cationic flotation of silicates'. Trans.
I. M. M. 1968,77, C57.

-172-
91. SOMASUNDARAN, P., 'The relationship between adsorption at different interfaces and flotation behaviour. I Trans. A. I. M. E.
1968,241,105 -108.
92. LEJA, J., 'Interactions at interfaces in relation to froth flotation.
2nd Int. Cong. of Surface Activity 1957. Butterworths,
1957, Vol. 3,273-295.
93. LEJA, J., and SCHULMAN, J. H., 'Flotation theory: molecular interactions between forthers and collectors at solid-liquid-
air interfaces. Mining Engineering& Trans. 1954,6,221 - 2289.
94. VOLKOV, V. A., 'Effect of the shape of micelles and temperature
on the hydration of nonionic surfactants'. Kolloid. Zh. 1973,
35(6), 1050-1053i (Russ. ) Chem. Abst. 1974,80,122679a.
95. LASKOWSKI, J., and KITCHENER, J. A., 'The hydrophilic-
hydrophobic transition on silica. ' Journ. of Coll. and Interface Sci. 1969,29,670-679.
96. BERGER, G. S., and MONASYPOVA, R. M., 'Froth forming
properties of sodium oleate solutions'. Tsvet. Metal. 1967,
40(12), 18 (Russ. ). Chem. Abst. 1968,68,107,006n.
97. KLYUCHNIKOVA, A. M., NAIFONOV, T. B., 'Formation of
titanium oleates. I PollKin, S. I. (USSR) Fiz-Khim. Osn.
Obogashch Polez-Iskop, 1972,15-25 (Russ). Chem. Abst.
1974,80(4), 17,6940.
98. VAINSHENKER, I. A., KRIVELEVA, E. D., 'Infrared spectroscopic determination of the composition of iron oleates. I Obogashch.
Rud., 1970,15(4), 64-6(Russ). Chem. Abst. 1971,74,132,608s.