Embed Size (px)
Citation preview

Effect of synthesis parameters on the structural characteristics and photo-catalytic activity of
ordered mesoporous titania
Dissertation
zur Erlangung des Doktorgrades
doctor rerum naturalium (Dr. rer. nat.)
der Mathematisch-Naturwissenschaftlichen Fakultät
der Universität Rostock
vorgelegt von
Ahmed Mudhafar Mohammed
geb. am 07. November 1979, Mosul, Irak
Rostock, 2018
UNIVERSITÄT ROSTOCK
https://doi.org/10.18453/rosdok_id00002668

Gutachter:
1. Prof. Dr. Peter Langer, Institut für Chemie, Universität Rostock, Germany
2. Prof. Dr. Jennifer Strunk, Leibniz Institut für Katalyse, Rostock, Germany
Einreichung der Dissertation: 23.08.2018
Tag der öffentlichen Verteidigung: 13.11.2018

Die vorliegende Arbeit entstand in der Zeit von Juli 2014 bis August 2018 im Leibniz-Institut
für Katalyse e.V. (LIKAT), Rostock.

Eidesstattliche Erklärung
Hiermit erkläre ich, dass diese Arbeit bisher von mir weder an der Mathematisch-
Naturwissenschaftlichen Fakultät der Universität Rostock noch einer anderen
wissenschaftlichen Einrichtung zum Zwecke der Promotion eingereicht wurde. Ich erkläre
auch, dass ich diese Arbeit selbständig angefertigt und ohne fremde Hilfe verfasst habe, keine
außer den von mir angegebenen Hilfsmitteln und Quellen dazu verwendet habe und die den
benutzten Werken inhaltlich und wörtlich entnommen Stellen als solche kenntlich gemacht
habe.
Ahmed Mudhafar Mohammed
Rostock, August 2018

Danksagung
Zuallererst möchte ich meine Worte des Dankes/ Dankesworte mit
-beginnen. Mit diesem arabischen Satz – ausgesprochen als “Alhamdo le ”الحمد رب العالمين“
llah rab al-alameen”– danke ich “ALLAH”, meinem Gott. In diesem Sinne: “Alhamdo le-llah
rab al-alameen”, sowohl für die Erlangung meines Doktorgrades, als auch allumfassend für
alles in meinem Leben.
Tatsächlich erfuhr ich nie stärkere Unterstützung als durch meinen Betreuer Prof. Dr.
Peter Langer. Ihm gebührt mein größter Dank für die Eröffnung der Möglichkeit, in
Deutschland zu studieren und für seine freundschaftliche Begleitung und seinen Zuspruch.
Für all dies danke ich ihm sehr.
In Hinblick auf das wissenschaftliche Thema möchte ich Dr. Norbert Steinfeldt für
seine Betreuung, Unterstützung und seine Anregungen/ Überarbeitungen während meiner Zeit
als Promotionsstudent meinen Dank aussprechen. Er verhalf mir dazu, eine unabhängige
Person zu sein.
Insbesondere bin ich Dr. Jennifer Strunk für ihre Unterstützung und wissenschaftlichen
Ratschläge dankbar.
Die größte Wertschätzung gilt allen derzeitigen und ehemaligen Mitgliedern unserer
Forschungsgruppe: Dr. Heike Ehrich, Michael Sebek, Manuela Pritzkow, Dr. Elka Kraleva,
und Karl Iffländer – zum einen für ihre Hilfsbereitschaft während meiner Arbeit und zum
anderen für die freundliche Atmosphäre.
Tiefe Dankbarkeit kommt Michael zu. Gerne denke ich an die gemeinsame Laborarbeit
zurück.
Dank gebührt zudem Dr. Ashour Ahmed, Reinhard Eckelt und Dr. Hanan Atia für ihre
Hilfe und Förderung während meines Studiums.
Ich möchte Dr. Carsten Kreyenschulte, Dr. Henrik Lund, Dr. Jabor Rabeah, Dr. Nils
Rockstroh, Dr. Sergey Sokolov, Dr. Stephan Bartling und Dr. Tim Peppel für die
Durchführung der analytischen Messungen und für ihre Mithilfe in der Interpretation der
Ergebnisse danken.
All meinen ehemaligen Lehrern, Professoren und Kollegen der Universität in Mosul bin
ich dankbar.

Nicht zuletzt bin ich meiner Mutter und meinem Vater zu Dank verpflichtet, den
Menschen meines Herzens. Womit auch immer ich ihnen begegne, ihr Wohlwollen ist mir
sicher. In diesem Kontext kann ich ebenso die Hilfe, welche meine Frau für mich erbracht hat,
nicht hoch genug wertschätzen – danke meine geliebte Frau. Zudem möchte ich meinen
geliebten Kindern Omar, Fatimah und Ali, meiner lieben Schwester und meinen lieben
Brüdern danken.
Allen Mitgliedern meiner Familie danke ich für ihre andauernde Unterstützung und ihre
Ermutigung.
Ahmed

Acknowledgment
Before anything, I would like to start my acknowledgment with
This is Arabic sentence which means that I thank my God “ALLAH” and .”الحمد رب العالمين“
can be pronounced as Alhamdo le-llah rab al-alameen. So Alhamdo le-llah rab al-alameen not
only for finishing my Ph.D. but for everything in my life.
In the fact, I didn’t find people supported me like my supervisor Prof. Dr. Peter Langer. It is
my pleasure to thank him so much for giving me the opportunity to study in Germany and for
his kind supervision and encouragement. I am really grateful to him for everything.
With respect to the scientific issue, I would like to introduce my acknowledgement to Dr.
Norbert Steinfeldt for his supervision, support, and revisions throughout my time as Ph.D.
student. He planted inside me how to be independent person.
I am especially grateful to Prof. Dr. Jennifer Strunk for her support and scientific advices.
I would like to express the deepest appreciation to all the current and former members of our
research group Dr. Heike Ehrich, Michael Sebek, Manuela Pritzkow, Dr. Elka Kraleva, and
Karl Iffländer for their helpfulness throughout my work and for the friendly atmosphere.
Profound gratitude goes to Michael. I have very fond memories with him in the lab work.
I would like to introduce my acknowledgement to Dr. Ashour Ahmed, Mr. Reinhard Eckelt,
and Dr. Hanan Atia for their helping and encouragement throughout my study.
I would like to thank Dr. Carsten Kreyenschulte, Dr. Henrik Lund, Dr. Jabor Rabeah, Dr. Nils
Rockstroh, Dr. Sergey Sokolov, Dr. Stephan Bartling and Dr. Tim Peppel for performing the
analytical measurements and for their assistance in the interpretation of the results.
I acknowledge all my previous teachers, professors, and colleagues in University of Mosul.
I must express my gratitude to the dearest people to my heart, they are my mother and father.
Whatever I introduce to them, absolutely I cannot return back their favors to me. In the same
context, I’m unable to return back sacrifices of my wife for me, so thanks my beloved wife.
Also I would like thank my beloved children Omar, Fatimah and Ali, my dear sister, and my
dear brothers.
To all of my family members, I would like to thank their continued support and encouragement to me.
Ahmed

Dedication
To whom my Lord commanded me to be very kind and obedient,
my dear parents,
I would like to dedicate them product of this effort.
AHMED
لمن اوصاني بهم ربي كون مطيعاً وباراً بهمأن أ
الغاليين والديّ هدي لكم ثمرة جهديأن أحب أ
أحمد
Im Namen von Allah, der mir den rechten Weg wies,
widme ich diese Arbeit meinen Eltern als Dank
AHMED

I
Abstract
In this dissertation, pristine ordered, metal- (Fe, Co, and Ni), and nonmetal- (N) doped
ordered mesoporous titania were synthesized via co-precipitation using the evaporation–
induced self-assembly method (EISA) combined with the liquid crystal templating pathway
(LCT). In addition, for un-doped mesoporous TiO2, various parameters were systematically
varied including solvent evaporation temperature, surfactant extraction conditions, molar
surfactant/titanium ratio, and titanium source. In order to investigate the doping effect on the
structural characteristics, different analysis and characterization techniques were employed to
characterize and describe structural, morphological and physicochemical properties of the
synthesized materials. These techniques involved SAXS, TEM, XRD, XPS, EPR, UV/Vis
DRS, ATR-IR, TG/DSC, and N2 physisorption. Moreover, the photocatalytic activity of the
synthesized materials was evaluated in the photodegradation of phenol under various
irradiation sources.
Zusammenfassung
In der vorliegenden Arbeit wurde geordnetes mesoporöses sowie geordnetes Metall-
(Fe, Co und Ni) und Nichtmetall-dotiertes (N) mesoporöses Titandioxid durch eine
verdampfungs- induzierte Selbstanordnung in Kombination mit einem Flüssigkristalltemplat
hergestellt. Bei der Herstellung des undotierten Titandioxids wurden verschiedene
Herstellungsparameter wie z.B. die Lösungsmittelverdampfungstemperatur, die Bedingungen
der Tensidextraktion, das molare Tensid/Titanverhältnis und die eingesetzte Titanverbindung
systematisch variiert. Um den Einfluss der Präparationsparameter und der Dotierung auf die
strukturellen, morphologischen und physikalisch-chemischen Eigenschaften zu ermitteln,
wurden die hergestellten Proben mittels verschiedener, sich ergänzender Methoden
charakterisiert. Folgende Methoden kamen dabei zum Einsatz: SAXS, TEM, XRD, XPS,
EPR, UV/Vis DRS, ATR-IR, TG/DSC, und N2-Physisorption. Die Testung der
photokatalytischen Aktivität der hergestellten Materialien erfolgte am Beispiel der
Phenolzersetzung unter Verwendung unterschiedlicher Bestrahlungsquellen.

II
List of Abbreviations
Ammonium hydroxide NH4OH
Amphiphilic block co-polymers ABCs
Annular Bright Field ABF
Atomic absorption spectroscopy AAS
Attenuated total reflection infrared spectroscopy ATR-IR
Beta titanium dioxide β-TiO2
Bismuth Bi
Brunauer–Emmett–Teller (BET) theory BET
Carbon dioxide CO2
Cetyl trimethyl ammonium bromide CTAB
Cobalt acetate Co(CH3COO)2
Cobalt chloride hexahydrate CoCl2·6H2O
Concentration of phenol C0 (M)
Conduction band CB
Copper Cu
Copper ion (I) Cu1+
Copper nitrate trihydrate Cu(NO3)2·3H2O
Degree Celsius °C
Titanium dioxide P25, nanopowder, ~21 nm P25
Differential scanning calorimetry DSC
Dimethyl formamide DMF
Drag reduction system DRS
Electron paramagnetic resonance EPR
Entrepreneurs' Organization EO
Energy dispersive X-ray spectrometer EDXS
III
Evaporation induced self-assembly EISA
Ferrous sulphate heptahydrate FeSO4·H2O
High Angle Annular Dark Field HAADF
High performance liquid chromatography HPLC
Hydrazine N2H4
Hydrochloric acid HCl
Hydrolytic sol-gel method HSG
Hydroxyl ion OH−
Hydrogen peroxide H2O2
Hydroxyl radical OH•
International Center of Diffraction Data ICDD
International Union of Pure and Applied Chemistry IUPAC
Integral breadth in radians β
Iron(III)chloride FeCl3
Iron(III)nitrate Fe(NO3)3
Initial concentration of phenol at the time Ct
Kubelka-Munk function F(R)
Liquid crystal templating LCT
Methane CH4
Methyl orange MO
Methylene blue MB
Nickel(II)chloride NiCl2
Nonhydrolytic sol-gel route NSG
One-dimensional structure 1D
Oxidized nitrogen NOX
Phenol C6H5OH
Polystyrene PS
IV
Polyacrylamide PAM
Polyethylene glycol PEG
Polytetrafluoroethylene PTFE
Potassium hexafluorotitanate K2TiF6
Positive hole h+VB
Powder X-ray diffraction XRD
Poly(ethylene oxide) PEO
Poly(propylene oxide) PPO
Pulsed laser deposition PLD
Rate constant k
Room temperature RT
Scanning electron microscope SEM
Scanning transmission electron microscopy STEM
scattering vector (nm-1) q
Small-angle X-ray scattering SAXS
Stearidonic acid SDA
superoxide O2•-
Tetrabutyl titanate C16H36O4Ti
Tetrahydrofuran THF
Three dimensional structures 3D
Thermogravimetric analysis TGA
Ti-aquo [Ti(OH2)]4+
Ti-hydroxo [Ti-OH](4-1)+
Titania TiO2
Titanium alkoxides Ti(OR)4
Titanium butoxide Ti(OnBu)4
Titanium chloride TiCl4

V
Titanium ion (IV) Ti4+
Titanium isopropoxide Ti(PriO)4
Titanyl oxalate complex [TiO(C2O4)2]2-
Transmission electron microscopy TEM
Triblock copolymer Pluronic P123
Tricobalt tetraoxide Co3O4
Two-dimensional structure 2D
Ultraviolet irradiation UV
Ultraviolet/Visible light spectroscopy UV/Vis
Valence band VB
X-ray photoelectron spectroscopy XRD
wavelength (nm) λ
Zero-dimensional structure 0D
VI
Table of Contents
1 Introduction .............................................................................................................. 1
1.1 Titanium dioxide .................................................................................................. 1
1.2 Porous materials ................................................................................................... 2
1.2.1 Mesoporous titanium dioxide powder .......................................................... 2
1.2.2 Doping mesoporous titanium dioxide powder .............................................. 5
1.2.2.1 Metal-doped mesoporous titanium dioxide powder ................................ 6
1.2.2.2 Nitrogen doped mesoporous titanium dioxide powder ........................... 8
1.3 Ordered mesoporous materials ........................................................................... 10
1.3.1 Ordered mesoporous titanium dioxide powder ........................................... 11
1.3.2 Doping ordered mesoporous titanium dioxide powder ............................... 16
1.3.2.1 Metal-doped ordered mesoporous titanium dioxide powder ................ 16
1.3.2.2 Non-metal doped ordered mesoporous titanium dioxide powder ......... 18
1.4 Principles of photocatalysis ................................................................................ 18
1.5 Photoactivity of mesoporous titanium dioxide powder ...................................... 19
1.5.1 Photoactivity of undoped-mesoporous titanium dioxide powder ............... 19
1.5.2 Photoactivity of doped-titanium dioxide powder ....................................... 20
1.5.2.1 Photoactivity of metal-doped mesoporous titanium dioxide powder ... 20
1.5.2.2 Photoactivity of non-metal-doped mesoporous titanium dioxide powder
............................................................................................................... 22
1.6 Photoactivity of ordered mesoporous titanium dioxide powder ........................ 23
1.6.1 Photoactivity of pristine mesoporous titanium dioxide powder ................. 23
1.6.2 Photoactivity of doped ordered mesoporous titanium dioxide powder ...... 24
1.6.2.1 Photoactivity of metal-doped ordered mesoporous titanium dioxide
powder ................................................................................................... 24
1.6.2.2 Photoactivity of non-metal-doped ordered mesoporous titanium dioxide
powder ................................................................................................... 25
1.7 Photocatalytic mechanism .................................................................................. 25

VII
1.8 Phenol as pollutant ............................................................................................. 26
1.9 Objectives and structural planning ..................................................................... 28
2 Experimental part ................................................................................................... 30
2.1 Material synthesis ............................................................................................... 30
2.1.1 Materials ..................................................................................................... 30
2.1.2 Synthesis of pristine mesoporous titania ..................................................... 30
2.1.2.1 General synthesis procedure ................................................................. 30
2.1.3 Synthesis of metal-doped mesoporous titania ............................................. 31
2.1.4 Synthesis of nitrogen-doped mesoporous titania ........................................ 32
2.1.5 Photocatalytic degradation of phenol in aqueous solution ......................... 34
2.1.5.1 Experiments with a Mercury lamp ........................................................ 34
2.1.5.2 Experiments with a Xenon lamp ........................................................... 35
2.2 Characterization ................................................................................................. 36
2.2.1 Small-angle X-ray scattering (SAXS) ........................................................ 36
2.2.2 Transmission electron microscopy (TEM) ................................................. 36
2.2.3 Powder X-ray diffraction (XRD) ................................................................ 37
2.2.4 X-ray photoelectron spectroscopy (XPS) ................................................... 37
2.2.5 N2 physisorption measurement ................................................................... 38
2.2.6 UV-Vis spectroscopy (UV/Vis) .................................................................. 38
2.2.7 Electron paramagnetic resonance (EPR) .................................................... 38
2.2.8 Attenuated total reflection infrared spectroscopy (ATR-IR) ...................... 38
2.2.9 Thermogravimetric analyses (TGA) and differential scanning calorimetry
(DSC) measurements .................................................................................. 38
3 Results and discussion ........................................................................................... 39
3.1 Pristine ordered mesoporous titanium dioxide ................................................... 39
3.1.1 Variation of synthesis parameters ............................................................... 39
3.1.1.1 Evaporation temperature ....................................................................... 39
3.1.1.2 Surfactant extraction conditions ............................................................ 48

VIII
3.1.1.3 Molar surfactant/titanium ratio ............................................................. 53
3.1.1.4 Changing of titanium source ................................................................. 55
3.1.2 Photocatalytic activity of the prepared materials ........................................ 58
3.2 Doped ordered mesoporous titanium dioxide .................................................... 61
3.2.1 Metal-doped ordered mesoporous titanium dioxide ................................... 61
3.2.2 Structural characteristics ............................................................................. 61
3.2.3 Photocatalytic activity of metal doped mesoporous titanium dioxide ........ 69
3.3 Nitrogen doped ordered mesoporous titania ...................................................... 74
3.3.1 Effect of the temperature ............................................................................ 77
3.3.2 Influence of the heating rate ....................................................................... 88
3.3.3 Influence of the presence of water vapor .................................................... 91
4 Summary and Conclusions .................................................................................... 95
5 Appendix ................................................................................................................ 99
6 References ............................................................................................................ 111

IX
List of Figures
Figure 1. Schematic diagram showing the main methods for the synthesis of mesoporous TiO2. 3 Figure 2. Schematic diagram showing the valence and conduction bands of un-doped and N-doped TiO2. 9 Figure 3. Schematic diagram showing common sol-gel technique used in synthesis ordered mesoporous TiO2. 13
Figure 4. Schematic diagram showing procedures synthesis of ordering mesoporous titania.
16
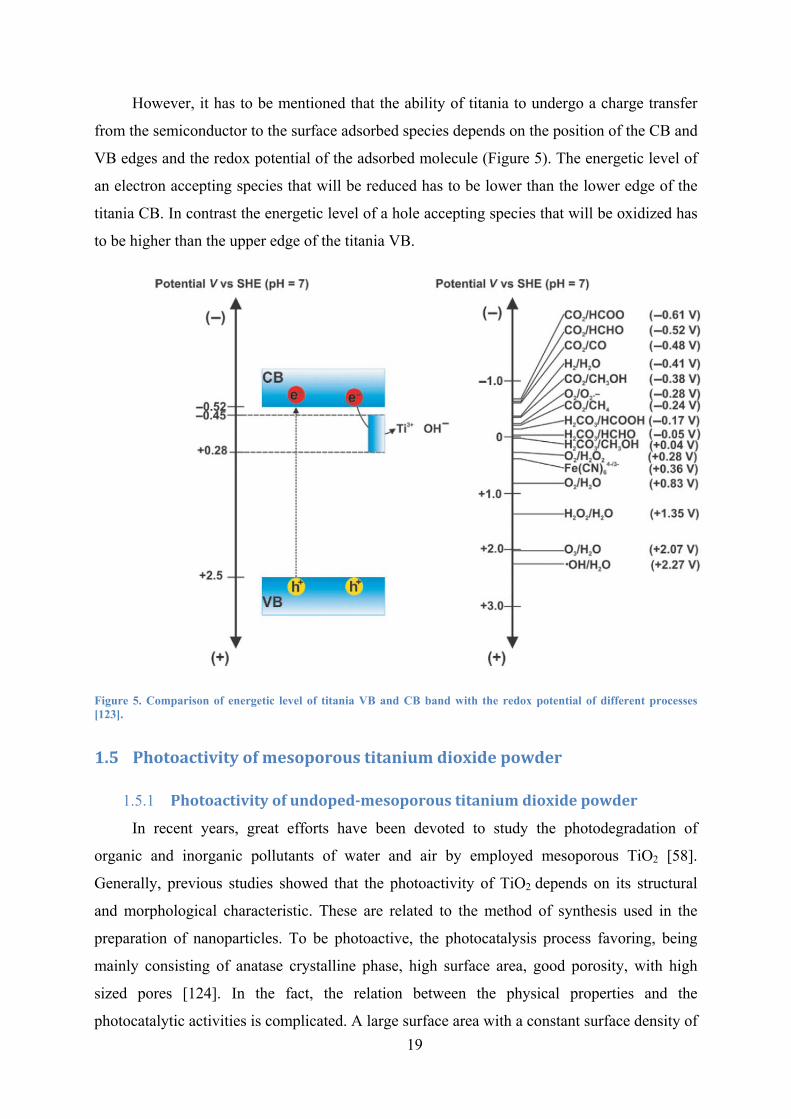
Figure 5. Comparison of energetic level of titania VB and CB band with the redox potential of different processes. 19
Figure 6. mechanism of hѵ1: pristine, hѵ2: metal-doped and hѵ3: nonmetal-doped TiO2 photocatalysis . 26
Figure 7. Schematic diagram showing the probable degradation mechanism for phenol. 28
Figure 8. Schematic diagram showing structural planning of the dissertation. 29
Figure 9. Schematic diagram showing experimental set up for treatment of amorphous mesoporous TiO2 with gaseous ammonia. 32
Figure 10. Photos of the experimental set up used for the degradation of phenol with mesoporous titania using a) Mercury lamp and b) Xenon lamp. 35
Figure 11. Influence of the solvent evaporation temperature on the SAXS patterns recorded at different steps of material synthesis A) after ammonia treatment, B) after surfactant removal, C) after thermal treatment; and D) influence of single synthesis step on d100 spacing. 40
Figure 12. STEM-HAADF images of the material where the solvent was evaporated at 40 °C (A,B,C) and 70 °C (D,E,F), respectively; (A,D) after treatment of the sol with ammonia, (B,E) after surfactant extraction, and (C,F) after thermal treatment . 42
Figure 13. XRD powder patterns of samples synthesized with different evaporation temperature thermal treatment. 43
Figure 14. A) Adsorption-desorption isotherms of calcined titania materials synthesized with different evaporation temperature and B) Pore size distribution obtained by BJH method. 44
Figure 15. UV/Vis Spectra of samples synthesized with different solvent evaporation temperature after thermal treatment. 45
Figure 16. High resolution XPS spectra from calcined material synthesized with solvent evaporation temperature of 60 °C A) N 1s and B) C1s. 46
Figure 17. Influence of the repetition of synthesis mesoporous TiO2 on the SAXS patterns A) after ammonia treatment, B) after surfactant removal, C) after thermal treatment. 47
Figure 18. SAXS pattern of the sample synthesized without gel aging time of 15 h. 48
Figure 19. A) SAXS patterns and B) Nitrogen adsorption–desorption isotherms for the powders without surfactant P123 extraction (TiO2-W) and with surfactant P123 extraction (TiO2-E). 49

X
Figure 20. Simultaneous TG/DSC curves in compressed air atmosphere A) for the materials P123/Ti(OiPr)4 (molar ratio: 0.0163) before and after extraction using ethanol (temperature of extraction: 78 ºC, stirred at 300-rpm) and B) for P123/Ti(OiPr)4 (molar ratio: 0.0163) after a) first, b) second, c) third, d) fourth extraction. 50
Figure 21. Simultaneous TG-DSC curves of the material molar ratio P123/Ti(OiPr)4 (molar ratio: 0.0163) after two extraction at different temperatures, A(a-d): under N2 and 19B(a-d): air atmosphere. 51
Figure 22. A) SAXS patterns and B) Nitrogen adsorption–desorption isotherms of the materials after calcination prepared with different extraction temperatures. 51
Figure 23. Influence of the number of extraction steps on the SAXS patterns A) after surfactant removal B) after calcination. 53
Figure 24. SAXS patterns of TiO2 prepared with different molar P123/Ti(OiPr)4 ratios (Tevap = 40 °C) A) after surfactant extraction (Textrac = 78 °C (4 times)), B) after calcination. 54
Figure 25. SAXS patterns for the materials prepared with different mol ratio P123/Ti(OnBu)4 after surfactant extraction A), and after thermal treatment B). 56
Figure 26. Influence of reaction time on phenol concentration for titania samples synthesized with different molar ratio of P123/Ti(OiPr)4 under UV irradiation with 1.2 °/min. 58
Figure 27. Influence of reaction time on phenol concentration for titania samples synthesized with different solvent evaporation temperature at irradiation with white light A) and visible light, > 420 nm B). 59
Figure 28. Influence of reaction time on phenol concentration for titania samples synthesized with different surfactant extraction temperatures (4 times) - A) and with Ti(OnBu)4 as Ti source - B); Xenon lamp, visible light > 420 nm. 60
Figure 29. SAXS patterns pristine and doped titania prepared with 0.5 (A, C, and E) and 5 mol% metal (B, D and F) after different synthesis steps: (A, B) after treatment with NH3 gas - step c, (C, D) after treatment in boiling ethanol – step d, and (E, F) after thermal treatment at 450 °C – step e. 62
Figure 30. STEM-HAADF images of titania doped with 0.5 mol% metal after thermal treatment, A) Fe, B) Co, C) Ni. 63
Figure 31. STEM-HAADF images of titania samples doped with 5 mol% metal after thermal treatment, A) Fe, B) Ni. 64
Figure 32. XRD patterns of calcined mesoporous titania prepared with A) 0.5 and B) 5 mol% doping metal; a)- pristine, b) Fe, c) Co and d) Ni. 65
Figure 33. . Pore size distribution of doped mesoporous titania calcined at 450 °C, A) 0.5 mol% metal, and B) 5 mol% metal. 66
Figure 34. EPR spectra of the calcined mesoporous titania doped with iron (the spectra were recorded at 295 K). 67
Figure 35. UV-Vis diffuse reflectance spectra (DSR) of calcined un-doped mesoporous TiO2 and doped mesoporous TiO2 prepared with a) 0.5 and b) 5 mol% metal. 68
Figure 36. Degradation of phenol under UV irradiation as function of time, A) samples doped with 0.5 mol% metal and B) samples doped with 5 mol% metal. 71
Figure 37. Degradation of phenol under Xenon lamp as function of time samples doped with 0.5 mol% metal A) and B) samples doped with 5 mol% metal. 72

XI
Figure 38. Influence of reaction time on phenol concentration for titania doped with 0.5 mol % Fe A) repeated synthesis (Xenon lamp without filter) and B) two tests of the same material under identical conditions ( > 420 nm). 73
Figure 39. A) XRD powder patterns and B) SAXS patterns of am-TiO2) and of TiO2-Ar/O2
(am-TiO2 after heating under Ar, 22-450 °C/6.5 h followed from treatment under O2 (450 °C, 2 h). 74
Figure 40. STEM-HAADF A) of am-TiO2 and B) of TiO2-Ar/O2 (am-TiO2 after heating under Ar followed from treatment in oxygen atmosphere (Ar: 22-450 °C/6.5 h followed from treatment under O2 atmosphere (450 °C, 2 h)). 75
Figure 41. A) UV/vis spectra and B) ATR-IR spectra of titania obtained after surfactant extraction (am-TiO2) and after calcination (TiO2-Ar/O2, 22-450 °C/6.5 h, followed from oxygen treatment (450 °C, 2 h). 76
Figure 42. HR XPS spectra from am-TiO2, A) Ti2p, B) O1s, C) C1s, and D) N1s. 77
Figure 43. A) XRD powder patterns and B) SAXS patterns of am-TiO2 samples heated under NH3 atmosphere using different heating temperatures 350, 450, and 550 °C. 78
Figure 44. STEM-HAADF images of A) N-TiO2-450NH3 obtained after heating under NH3 atmosphere at 450 °C and B) N-TiO2-450NH3/O2 (sample was obtained after successive heating O2 (450 °C, 2 h)). 79
Figure 45. Sample N-TiO2-450NH3 A) STEM-HAADF image with marked area used for spectrum C, B) HAADF overlaid with elemental maps of Ti, O, and N. C) The EELS spectrum showed the presence of nitrogen on the surface of TiO2. 79
Figure 46. A) ATR-IR spectra of am-TiO2 samples heated under NH3 atmosphere using different heating temperatures and B) UV/vis absorption spectra. 80
Figure 47. HR XPS spectra from am-TiO2 after heating in NH3 to 450 °C, A) Ti2p, B) O1s, C) C1s, and D) N1s. 82
Figure 48. A) XRD patterns and B) SAXS patterns of samples calcined under NH3 using different heating temperatures followed from successive oxygen treatment (450 °C, 2 h). 83
Figure 49. A) ATR-IR spectra and B) UV/Vis absorption spectra of samples heated under NH3 using different heating temperatures followed from successive oxygen treatment (450 °C, 2 h). 84
Figure 50. HR XPS spectra from am-TiO2 after heating in NH3 to 450 °C (N-TiO2-450NH3) followed from successive treatment in oxygen atmosphere (450 °C/2 h), A) Ti2p, B) O1s, C) C1s, and D) N1s. 85
Figure 51. Degradation of phenol under Xenon lamp irradiation as function of time for samples heated under NH3 at 450 °C A) white light and B) visible light (> 420 nm). 86
Figure 52. Degradation of phenol under Xenon lamp irradiation as function of time for samples heated under NH3 at different heating temperatures followed from treatment in oxygen atmosphere (450 °C, 2 h), A) white light and B) visible light (> 420 nm). 87
Figure 53. A) XRD powder pattern of am-TiO2 treated with ammonia at different heating rates (0.6, 1.2, and 2.4 °C/min) and B) SAXS patterns obtained after a successive treatment with oxygen (450 °C, 2 h). 88
XII
Figure 54. A) SAXS patterns of am-TiO2 treated with ammonia at different heating rates (0.6, 1.2, and 2.4 °C/min) and B) SAXS patterns obtained after a successive treatment with oxygen (450 °C, 2 h). 89
Figure 55. A) UV/vis spectra of am-TiO2 treated with ammonia at different heating rates (0.6, 1.2, and 2.4 °C/min) and B) UV/vis spectra obtained after a successive treatment with oxygen (450 °C, 2 h). 90
Figure 56. Degradation of phenol as function of time under Xenon lamp irradiation for samples obtained using different heating rates (0.6, 1.2, and 2.4 °C/min) under NH3 atmosphere followed from successive treatment under oxygen (450 °C, 2 h); A) white light and B) visible light > 420 nm. 91
Figure 57. A) XRD patterns and B) SAXS patterns of the am-TiO2 after heating the sample under gas mixture of NH3,N2, and water vapor. 92
Figure 58. A) UV/vis spectra and B) phenol degradation of as function of time under Xenon lamp irradiation (white light) for samples heated under mixture of NH3, N2, and water vapor. 93
Figure 59. HR XPS spectra from am-TiO2 after heating in NH3 /N2 /H20 to 450 °C, A) Ti2p, B) O1s, C) C1s, and D) N1s. 94

XIII
List of Tables
Table 1. Amount of metal source that was used in the synthesis of metal doped titania. 31
Table 2. Summary of the structure characteristics for materials synthesized with different solvent evaporation temperatures (molar P123/Ti(OiPr)4 ratio = 0.0163, calcination at 450 °C). 44
Table 3. Summary of the structure characteristics for materials synthesized with different molar P123/Ti(OiPr)4 ratio after calcination. 52
Table 4. Summary of the structure characteristics for materials synthesized with different molar P123/Ti(OiPr)4 ratio after calcination. 55
Table 5. Structural characteristics of titania prepared with Ti(OnBu)4. 57
Table 6. Characteristics of calcined TiO2 doped with 0.5 or 5 mol% metal. 66
Table 7. Comparison of pseudo first order rate constants in phenol degradation over doped mesoporous titania under UV irradiation. 71
Table 8. Comparison of pseudo first order rate constants in phenol degradation over doped mesoporous titania under Xenon lamp. 73
Table 9. General characteristics for samples obtained after heating under NH3 at different temperatures and after following treatment in oxygen flow (450 °C, 2 h). 81
Table 10. General characteristics of samples prepared with different heating rate under NH3 atmosphere and following treatment with oxygen (450 °C, 2 h). 89
Table 11. General characteristics for samples heated under a mixture of NH3, N2, and water vapor. 92
1
1 Introduction
1.1 Titaniumdioxide
Titania or titanium dioxide (TiO2) is one of the most popular semiconductor materials
that attract great attention. Moreover, titania has been utilized over the past years as an
excellent photocatalyst in a wide range of energy and environmental applications such as the
photocatalytic degradation of air pollutants, air and water purification, water disinfection,
medical applications, printing, optics, sensors, batteries, photoelectrochemical cell, energy
conversion and water splitting [1-10]. This is because of its strong oxidizing power, photo-
stability, chemical and biological inertness, excellent electronic and optical properties,
environmentally friendly and low cost etc. [11-14]. It was first produced commercially in
1923 [15]. In 1972, it was first discovered by Fujishima and Honda as an active photocatalyst
[16].
TiO2 naturally exists in an amorphous or a crystalline phase. The crystalline titania have
three different major crystallographic phases in nature involving anatase (tetragonal), rutile
(tetragonal), and brookite (orthorhombic) [17]. Moreover, it has a special phase β-TiO2
(monoclinic), which is less known compared to the others [18]. These forms exhibit different
physical and chemical properties enabling different functionalities [19, 20]. Generally, in a
photo-catalytic study anatase appears to have the highest photoactivity compared to the others
due to the large surface area per unit mass and volume [21]. In addition, anatase exhibits an
indirect band gap, which is smaller than its direct band gap [22]. Recent study showed that the
high performance of photocatalytic reduction of CO2 due to forming a heterojunction between
two crystal phases, anatase and phase β-TiO2. This could be promoted the separation of
electron-hole pairs and prolong its lifetime [23].
Regarding the nanostructure, TiO2 forms different geometric structural design such as
spheres as a zero-dimensional structure (0D), fibers and tubes as one-dimensional structure
(1D), nanosheets as a two-dimensional structure (2D), and interconnected architectures as
three dimensional structures (3D) [9]. Moreover, it exhibits several morphologies such as
powders, nanoparticles and films [24]. Diverse morphologies could result in various
properties for different applications [25]. For photocatalytic and photovoltaic applications,
high specific surface area, controllable pore size and morphology, and good interparticle
connectivity for titania are desired properties [26, 27]. These vital properties could be
2
simultaneously achieved by using titania with an ordered crystalline mesoporous framework.
Most of reported works on ordered mesoporous TiO2 are focused on films [26, 28-32].
1.2 Porousmaterials
Mainly, porous materials can interact with wide range of chemical systems including
atoms, ions, molecules, and nanoparticles at their surfaces and also though their bulk. This
interaction leads to much attention and interest for porous materials. Moreover, the presence
of pores in nanostructured materials can dramatically enhance their physical and chemical
properties [33, 34].
According to convention of the International Union of Pure and Applied Chemistry
(IUPAC), porous materials can be classified into three types based on their pore diameter.
These are microporous (pore diameter < 2 nm), mesoporous (2-50 nm) and macroporous (>
50 nm) materials [35]. Mesoporous transition metal oxides are of great interest because they
exhibit both intrinsic optical and electronic properties of transition metal oxides and the
advantages of mesopores [24]. The mesoporous TiO2 is one of the most important
semiconductor materials (transition metal oxides) that shows a great potential in versatile
applications. In recent years, mesoporous TiO2 has received special attention for
photocatalytic and photovoltaic application due to its high specific surface area, controllable
pore size and morphology, and high antiparticle connectivity [26].
Mesoporoustitaniumdioxidepowder1.2.1
Mesoporous TiO2 as photocatalyst has been synthesized by different methods such as
sol-gel, hydrothermal, solvothermal, microwave, sonochemical, and electrodeposition
synthesis (for details, see Figure 1) [3, 36]. Sol-gel technology have been used for the first
time by Ebleman in 1846 [37]. This method is applied commercially in many applications,
such as forming coatings on window glass, powders and fibers [38]. It is also used to
synthesize photo-catalyst powders or thin films [17]. The chemistry involved in this method
is based on inorganic polymerization reactions. Two important reactions, hydrolysis and
condensation, are included here that lead to the formation of M-OH-M or M-O-M bridges.
The sol-gel technology has major advantages such as inexpensive, easy to operate, ambient
temperature of sol preparation and gel formation, better homogeneity, better control of the
structure, including porosity and particle size, and the highly pure resulting product [39]. In
contrast, the main disadvantage for this method is that the products are mostly amorphous and
need hydrothermal treatment or calcination for the crystallization process [40]. In addition

3
titania suffers fast hydrolysis and condensation reactions resulting in poorly structured and
even non-porous materials.
Figure 1. Schematic diagram showing the main methods for the synthesis of mesoporous TiO2.
Furthermore, mesoporous TiO2 has been synthesized by combining sol-gel chemistry
with surfactants [41]. In this process, the micelle formation and their organization is driven by
solvent evaporation that is known as evaporation induced self-assembly (EISA) [42]. EISA
process is one of the most essential synthetic methods, which has extensively been employed
for obtaining a wide variety of mesoporous morphologies (e.g., aerosol, monoliths, films, and
powders) [43]. This is due to the use of very dilute initial conditions that leads to a gradual
formation of the liquid crystalline mesophase upon the solvent evaporation [44]. During the
sol-gel synthesis, it is not easy to control the reactivity of the titanium precursors due to their
high tendency to hydrolyze and to form the TiO2 precipitate without the mesopores formation
[24, 42]. Therefore, controlling the sol-gel procedures is the most critical issue for this
technique. The liquid crystal templating (LCT) mechanism clarifies this process with a
stabilized non-ionic surfactant mesophase which is representing as a template for the
condensation of the inorganic phase. The templates lead to spontaneous co-assembly of both
materials in a mesostructured phase. The templates play key roles in modulating the
mesostructure, surface area, pore size, and wall thickness and thermal stability of the
mesoporous TiO2 [34]. Effects of the surfactant concentration on synthesis of the mesoporous

4
titania were studied by Benkacem and his colleagues [45]. They noted that increasing of
amount cetyl trimethyl ammonium bromide (CTAB) surfactant increased considerably titania
pore diameters while decreased its porous volume and specific surface area. Titanium oxo-
polymers can be obtained through hydrolysis and condensation of the titania molecular
precursors such as titanium alkoxides Ti(OR)4 [46].
Mainly, most works have been focusing on synthesis of the mesoporous TiO2. The first
mesoporous TiO2 powder with highly organized hexagonal pore structure has been
synthesized by Antonelli and Ying in 1995. They employed the modified sol-gel method with
the phosphate surfactant templating chemistry [47]. Mesoporous anatase with large pore size
of ∼7–8 nm and very narrow pore size distribution has been synthesized by Kartini et al.[48].
This has been performed via a neutral route of hydrothermally templated anatase seeds. This
two-step process produces a material with a fully anatase crystalline domain. The block
copolymer restrains the pore formation as well as the crystal growth. Tuning the hydrothermal
temperature in the self-assembly process controls the pore size.
The roles of hydrochloric acid in the synthesis of mesoporous titania have been clarified
by Anpo's group [49]. They explained three important roles including a) enhancing the
interaction between inorganic framework and organic template, b) hindrance the gelatination
of titania oligomers, and c) promotion the growth of crystalline particles. Moreover, they also
explained the effects of H+/Ti molar ratio on the formation of mesoporous structure and the
phase transition. The high H+/Ti ratio improved the mesopores and promoted the formation of
rutile more than anatase after 623 K thermal treatment. Tanaskovic et al. [50] have
synthesized the mesoporous titania with well-crystallized anatase phase by nonhydrolytic sol-
gel process combined with solvothermal gel. Titania powder was obtained by calcination of
the gel sample. They showed that increasing the gelation time does not increase the
crystallinity of the dry gels. Moreover, they determined a correlation between the crystallite
and the mesopore size: as the crystallite increase, intercrystallite voids increase. This explains
the possibility of controlling the porosity by changing the crystallite size through varying the
gelation temperature and time.
Swapana et al. [51] synthesized the mesoporous titania nanoparticles using simple and
cost-effective sol-gel technique by ultrasonic irradiation. Ultrasonic irradiation reduced the
sol-gel reaction time, led to uniform size distribution, and improved the phase purity. Their
XRD results showed the formation of high purity anatase titania nanoparticles with a size of

5
19.9 nm. Their SEM analysis revealed the agglomeration of the titania nanoparticles. The
synthesized titania showed an indirect bandgap of 3.25 eV for the anatase phase.
In 2016, Zi et al. [52] synthesized mesoporous titania by a new method of
photodegradation to remove the organic surfactant template (CTAB). Their results showed the
ability of UV light to degrade the surfactant template to form mesoporous titania with high
surface area (203 m2/g). Further calcination treatment was done to transform the amorphous
TiO2 to the crystalline anatase phase.
Recently, Zhang and co-workers [40] fabricated mesoporous TiO2 with high crystalline
form and large surface area. This has been done by using a fast sol-gel method combined with
two-step calcination process (powder was calcined at 500-700 °C in nitrogen, and then
recalcined at 500 °C in air). They used polyacrylamide (PAM) and polyethylene glycol (PEG)
as composite templates. Their results showed that PAM accelerated the gel rate. When
calcined in nitrogen, PEG was converted into amorphous carbon that prevented the
mesostructure from collapsing when titania heated to the temperature required to get high
crystallinity and high specific surface between 78.5 - 110.7 m2/g area. The average crystallite
sizes of samples is about 7-12 nm.
Dopingmesoporoustitaniumdioxidepowder1.2.2
Doping technique refers to introducing the impurity atoms into the semiconductor
lattice to improve the conductivity [53]. It is one the most promising techniques to extend the
light-absorbing properties of TiO2. In addition, the doping process leads to reduced electron-
hole recombination rate, low band gap, improved TiO2 morphology, high crystallinity, high
surface area, and improved photocatalytic activity [54, 55]. TiO2 anatase has a wide band gap
of ca. 3.2 eV due to its activity only under the ultraviolet irradiation (UV) [56].
Considerable efforts have been employed towards different strategies to extend the
visible light activity of TiO2 via modification of its electronic and optical properties, as well
as surface and interface modification, thereby enhancing its photocatalytic properties. These
strategies include the controlling of the morphology and particle size, composite or coupling
materials, transition metals doping, non-metals, noble metals deposition, and surface
sensitization, etc. [53, 57]. Among these strategies, doping has been the most promising
approach for modification the photo response of TiO2.

6
1.2.2.1 Metal‐dopedmesoporoustitaniumdioxidepowder
The doping of metal ions into TiO2 matrix can be classified into three kinds, which
includes the doping with transition metal ions, rare-earth metal ions, and poor metal ions
(post-transition metals such as aluminum and bismuth) [57]. TiO2 doped with various types of
suitable transition metals (such as iron, cobalt, nickel etc.) can produce impurity states
between the valance and conduction bands of TiO2. This decreases the band gap and thus
increases the photo efficiency of TiO2 [58]. Generally, mesoporous TiO2 doped with metal
has been synthesized by several methods including the sol-gel method, impregnation,
metallization, precipitation, hydrothermal process, solvothermal synthesis, flame spray
pyrolysis, ultra sound assisted methods, and addition of transition metal to the substrate
solution.
There are a lot of scientific research articles focusing on the transition metal doped
TiO2. Among these metals, Fe has attracted special attention due to its ionic radius of Fe3+
(0.64Å) that is similar to that of Ti4+ (0.68Å). This leads to an easier incorporation of Fe3+
into the TiO2 crystal structure lattice. In 2005, Fe-doped mesoporous TiO2 nanocrystalline
powders and films were synthesized by Zhou et al. via the sol-gel method [59]. They
employed tetrabutyl titanate (TBOT) (Ti(OC4H9)4) as titanium precursor and ferric nitrate
(Fe(NO3)3) as iron source. They showed that Fe-doping influenced the crystallization, specific
surface area, pore structures and photocatalytic activity of mesoporous TiO2 powders.
Moreover, the sol-gel method and hydrothermal treatment have been employed to Fe-doped
mesoporous TiO2 powder by Anpo's group [60]. XRD, EPR, AAS, and XPS characterization
demonstrated that Fe3+ could substitute Ti4+ in the TiO2 lattice and its concentration decreased
from the surface to the center of the doped TiO2. They found that the actual bulk Fe3+content
determined by AAS is a little lower than the nominal one and far lower than surface Fe3+
content determined by XPS. They supposed that firstly Fe3+ could be adsorbed mostly and
strongly on the surface of TiO2 dried gels due to their very large surface area and strong
electrostatic interaction and then Fe3+ may diffuse gradually into the bulk during
hydrothermal treatment.
Zhu et al. [61] have reported the synthesis of Fe-doped TiO2 by using a facile
nonhydrolytic sol-gel route (NSG) and hydrolytic sol-gel method (HSG). They used titanium
chloride (TiCl4) as titanium source and iron nitrate (Fe(NO3)3) as iron source. They
demonstrated that the NGS method is superior the HSG owing to the controllable reaction rate
and lack of surface tension. This ensures the formation of mesoporous and well-crystallized

7
anatase in the Fe-TiO2 form. In 2012, Shouqiang et al. [62] synthesized Fe-doped mesoporous
TiO2 powder with specific surface area of 117.6 m2/g by the sol-gel method with Ti(SO4)2 as
a raw material. Their results showed that Fe3+ and Fe2+ replaced Ti4+ and entered into the TiO2
lattice.
Furthermore, effect of the titanium precursor type on the photocatalytic properties of the
Fe-doped mesoporous TiO2 powder and its physical properties has been studied by Goswami
et al. [63]. They synthesized mesoporous Fe-doped TiO2 nanoparticles with an anatase phase
by the sol-gel method using a stable precursor potassium hexafluorotitanate (K2TiF6) as
titanium source for the first time. Ferrous sulphate heptahydrate (FeSO4.7H2O) and ferric
nitrate (Fe(NO3)3·9H2O) have been used for doping TiO2 with Fe (III).
Piumetti et al. [64] synthesized two metals (iron or vanadium)-doped mesoporous TiO2
powder by slightly modifying the hydrothermal assisted sol-gel method. They inferred that
inclusion of Fe3+ in the Fe-doped mesoporous TiO2 takes place. Therefore, Fe3+ ions were
present in the bulk as well as at the surface. In contrast, V ions were present basically only at
the surface and did not enter the bulk of the V-doped mesoporous TiO2. Moreover, Cu-doped
mesoporous TiO2 was prepared by Guo's group [65] via a hydrothermal method at relatively
low temperatures without any calcination. Triblock copolymer Pluronic P123 has been used
as a template, Tetrabutyl titanate (TBT) has been used a titanium precursor, and
Cu(NO3)2·3H2O has been used as a copper source. XRD and XPS results showed that the
copper species existed with oxidation state of Cu1+, which was attributed to the reduction
effect of dihydroxylation during synthesis process. For doped sample with 1 Wt. % Cu-doped
mesoporous TiO2, the Cu1+ was dispersed in mesoporous TiO2 lattice as Cu1+. Whereas, for
doped sample with 3 Wt. % Cu, the Cu1+ was dispersed in the form of micro-TiO2 crystal with
Cu2O small clusters. They concluded that the excess copper could not replace Ti4+.
Recently, mesoporous anatase-brookite TiO2 doped with different Fe/Ti molar ratios
have been synthesized by Soo et al [66]. The results showed that the addition of Fe dopant
into TiO2 especially brookite phase has induced a red shift in the observed optical absorption
which reduced the band gap from 2.97 eV to 1.59 eV. The prepared Fe doped mesoporous
TiO2 samples have an anatase-brookite and mesoporous structure with a large surface area.
XRD results indicated that Fe3+ ions have been successfully inserted via interstitial
substitution into the crystal structure of TiO2 and thus occupied some of the TiO2 lattice sites.

8
1.2.2.2 Nitrogendopedmesoporoustitaniumdioxidepowder
Incorporation of non-metal atoms such as nitrogen, hydrogen, boron, carbon, fluorine,
iodine, sulfur, and phosphorus into the TiO2 structure is still one of the most popular and
effective method to promote its photocatalytic efficiency. These atoms have orbitals of
suitable energy to mix with the TiO2 oxygen orbitals. In particular, nitrogen attracts great
attention since nitrogen atoms can be introduced into the TiO2 lattice due to its comparable
atomic size to oxygen atom, small ionization energy, and high stability [54]. The mixing
process includes mixing of N 2p states with O 2p states. The calculated densities of states
showed that the substitutional N doping is more efficient in reducing the bandgap of titania
compared to doping with other non-metal elements [67]. Generally, this incorporation leads to
decrease of the electron-hole recombination rate in addition to reduction in the band gap by
forming a mid-gap state (Figure 2). Moreover, this leads to better photocatalytic activity [68].
In 1986, Sato appeared to be the first researcher to synthesis a nitrogen-doped TiO2 by
calcination of titanium hydroxide. He found that the enhanced spectral sensitization of
titanium dioxide was due to the presence of NOX impurities that were formed from the used
NH4OH in the preparation [69].
A large number of recent physical and chemical variety methods have been utilized to
incorporate nitrogen into the TiO2 lattices. These methods are mainly based on two kinds of
processes. One process can be ascribed as one-step direct incorporation of N atoms into TiO2
lattice such as calcination, sol-gel method, ball milling, plasma or ion implantation,
solvothermal method, hydrothermal method, electrochemical method, microwave, direct
hydrolysis of organic /inorganic salts, and pulsed laser deposition (PLD) [70]. The second
important synthesis process can be described as two-step oxidation of titanium nitride. This
process could be done via different strategies such as sputtering method, thermal annealing,
and plasma-enhanced micro arc oxidation [71]. All strategies can be classified into two main
processes. The first one includes dry processes such as oxidation of titanium nitride powder in
an oxygen gas flow, nitrification of TiO2 powder in an ammonia gas flow, and anatase TiO2
powder treated by plasma in N2 gas or N2-H2 mixed gases. The second one involves wet
processes such as sol-gel method, hydrothermal method, and solvothermal method [72].
The synthesis method plays a very important role to form nitrogen species. Various
types of nitrogen species introduced in TiO2 lattice, which lead to N-doped TiO2 with
different physical and chemical properties. Despite this, the mode of nitrogen doping in the
TiO2 lattice is unclear. The nitrogen species can be assigned as substitutional (Ti-N-Ti) and/or

9
interstitial N (Ti-O-N or Ti-N-O) atoms, including oxidized NOx, hydrogen containing NHx
species, as well as carbon nitride-like fragments [73, 74]. The substitutional doping means
oxygen replacement while interstitial doping means the addition of nitrogen into the TiO2
lattice [70, 75]. Interstitial doping reduces the band gap of TiO2 more than the substitutional
doping (Figure 2).
Figure 2. Schematic diagram showing the valence and conduction bands of un-doped and N-doped TiO2 [70].
Over the past years, a number of studies have focused on influence of the experimental
parameters of the sol-gel N-doping method on the photocatalytic activity of N-doped TiO2.
Some studies have taken into account the TiO2 precursors, nitrogen precursors, solvents, pH
values, and post N-doping treatments [76]. Fang et al. have successfully synthesized
mesoporous N-doped TiO2 by the precipitation of titanyl oxalate complex ([TiO(C2O4)2]2-) by
ammonium hydroxide (NH3·H2O) at low temperature followed by calcination at different
temperatures. The doped N species located at the interstitial sites in TiO2 led to reduction of
the TiO2 band gap. Moreover, they explored that N-doped TiO2 calcinated at 400 °C has
Brønsted acid sites arising from covalently bonded dicarboxyl groups [77].
N-doped Mesoporous TiO2 powders were synthesized by Gibaud and co-workers via
the sol-gel route either directly or by using the P123 templating agent and nitrogen doping
from thiourea. Their EPR results showed that several paramagnetic species were found in
these mesostructured samples mainly with oxygen radicals for calcinations at 400 °C. In
contrast, nitrogen centers appeared for calcination temperature as high as 500 °C during 12 h
[78].
Hui-Lei and his colleague synthesized N-doped mesoporous titania using PEG as
template and dimethyl formamide (DMF) as nitrogen source. They explained that PEG played

10
an important role in the preparation process within mesoporous titania. The N-doped
mesoporous titania possessed diameter of ca. 20 nm with anatase crystalline structure, and
had absorption in the visible region [79].
Recently, Zalas has reported synthesis of the N-doped mesoporous titania by template-
free solvothermal method that could be considered as a good and inexpensive method. The
main advantage of template-free methods of mesoporous TiO2 synthesis was environmental
friendliness in connection with potentially cheaper way to obtain well defined mesostructure.
He employed titanium tetra isopropoxide as titanium source, urea and nitric acid as nitrogen
source. His results showed that the temperature treatment brought an increase in the crystallite
sizes and a significant decrease in the specific surface area after calcination at 400 °C [80].
More recently, Huang and his colleagues synthesized N-doped anatase mesoporous
TiO2 through a sol-gel method, followed by cycle microwave-assisted hydrothermal method
using three different types of nitrogen sources (diaminohexane, methylamine, and urea). They
claimed that different sources lead to different degrees of doping. Moreover, at low doping
concentration, the N atoms were found in the interstitial sites while at high doping
concentration, the N atoms were incorporated into the TiO2 lattice [81].
1.3 Orderedmesoporousmaterials
According to the arrangement of pores, mesoporous materials can be classified into two
kinds including ordered and disordered materials based on IUPAC classification. Ordered
mesoporous materials have uniform and regular arrangements of pore widths whereas, atomic
arrangements are not ordered. They are obtained by templating pathways. However,
disordered mesoporous materials have uniform channel width, but they are not regularly
arranged i.e. neither the pore arrangements nor the atomic arrangements are ordered. Those
are obtained by template-free methods [82]. The mesopores in mesoporous materials are
isolated or interconnected that may have similar or different shapes and sizes [83]. Ordered
mesoporous materials are important kind of functional materials. They have attracted
intensive interest in various research areas such as catalysis, sensor, energy conversion and
storage, environment remediation, and biomedical sciences [84]. In the fact for photocatalytic
applications, the presence of ordered mesoporous in nanostructured materials promotes
diffusion of the reactants and products throughout the channels. Moreover, it is offering more
active sites for pollutant adsorption and consequently increasing the reaction speed [85, 86].
11
Orderedmesoporoustitaniumdioxidepowder1.3.1
Based on the nature of the templates and the spatial relationship between templates and
products, there are two templating strategies to synthesize the ordered mesoporous TiO2. They
include the soft-templating (endotemplate) and hard-templating (exotemplate) pathways. The
soft-templating pathway implies the use of surfactants that forms micelles such as block
copolymer. In contrast, the hard-templating pathway implies the use of porous solids such as
silica or carbon [82, 86].
A process often applied for synthesis of well-ordered mesoporous titania is the
evaporation-induced self-assembly (EISA) method [41]. This method is a simple and facile
method to synthesize inorganic-organic highly uniform mesoporous materials in the form of
powder and thin films using various surfactants [41]. It involves a cooperative assembly
process between sol-gel species and supramolecular templates [87].
Previous studies have shown the effect of various synthesis parameters on the formation
of ordered mesoporous titania using the EISA method. These parameters include nature and
concentration of the surfactant, titanium precursor, the molar surfactant/titanium source ratio,
the choice of solvent used, acid concentration, amount of water or hydrolysis ratio (H =
H2O/M, where M= metal such as Ti) and calcination temperature [41, 88-91]. The synthesis
of ordered mesoporous TiO2 is mainly affected by any change in the experimental setup [41].
The role of amount of water in the formation of ordering mesophase has been studied by
Soler-Illia and his colleagues. They explained that low water content and strong chelation
between metal centers and the non-ionic polar heads lead to polymer unfolding and thus to
worm-like phases. However, larger quantities of water and acid added to the reaction bath
weaken the coordination bonds that compose the hybrid interface. These resulting weak
interactions (mainly hydrogen bonds) help in the folding of the templating agents, and yield
more ordered mesophases [92].
Recently, several studies have focused on synthesis of the ordered mesoporous titania
that was mostly synthesized by sol-gel chemistry using ionic or non-ionic surfactants as
templates [3, 86]. The role of surfactant has been explained; the template acts as structure
directing agent (SDA) in the synthesis of the porous materials. The presence of template is
very important to control the shape and structure of the pores. In other words, the templates
play key roles in modulating the mesostructure, surface area, pore size, wall thickness, and
thermal stability of mesoporous TiO2. As well known, the surfactant molecular system
consists of two regions including the hydrophilic (polar) and hydrophobic (non-polar) parts.

12
In aqueous media, the polar part of the surfactant molecule favorably interacts with water,
while the non-polar part stays away from water molecules. The aggregates of surfactant
molecules are called micelles. A self-assembly of these micelles through weak coordination
bonds occur to form 3D or 2D nanostructure and helps in the pore generation [82]. Pluronic
block copolymers are important kind of the surfactants, which are more suitable for the
synthesis of the ordered mesoporous titanium oxides with large pore size, high surface area,
and well-crystalline materials. The reason is that the tailor-made amphiphilic block co-
polymers (ABCs) exhibit high glass transition temperature, thermal stability, and high content
of sp2 hybrid carbon atoms [43]. Hexagonal ordered mesoporous TiO2 material with an
anatase phase and high surface area have been synthesized by Kao et al. This has been done
by using a cationic surfactant cetyltrimethyl ammonium bromide (C16TMABr) as a structure-
directing agent and soluble peroxytitanates as Ti precursor through a self-assembly between
the positive charged surfactant S+ and the negatively charged inorganic framework I- (S+I-
type) [93]. Recently, Cao et al. synthesized hexagonal ordered mesoporous titania with
thermal stability up to 700˚C by combining the EISA method and template-carbonization
strategy through. They used PEO-b-PMA(Az) as a structure-directing agent, titanium
isopropoxide and titanium chloride (TiCl4) as a titanium source, and tetrahydrofuran (THF) as
the solvent. They confirmed that the template carbonation in nitrogen after ageing is the key
step to obtain the ordered crystalline mesostructure [94]. In 2015, for the first time Veliscek-
Carolan et al. reported synthesis of the ordered mesoporous titania powders using the block
copolymer F127 as a template without the use of stabilizing agents via evaporation induced
self-assembly (EISA). They demonstrated that the choice of template affects the growth and
structure of Ti oligomers in the precursor solution due to the size of the EO blocks in the
block copolymer templates. Moreover, the optimal evaporation temperature during EISA was
dependent on the choice of template [95].
Moreover, Hung et al. have reported that titanium alkoxides have been utilized as
titanium precursor for the synthesis of mesoporous TiO2 because of their higher chemical
stability and they are safe to handle [96]. As well as it gives a very good compositional and
morphological control over the product properties, such as specific surface area and degree of
aggregation [42].
The solvent was also an important parameter in changing the morphology and
performance of the sol-gel-derived porous TiO2 [96]. Ethanol has been chosen as a good
solvent due to its surface wetting properties and the good solubility of all organic and
13
inorganic precursors [97]. HCl was preferred due to its volatility, which is required during the
evaporation-assisted deposition [87].
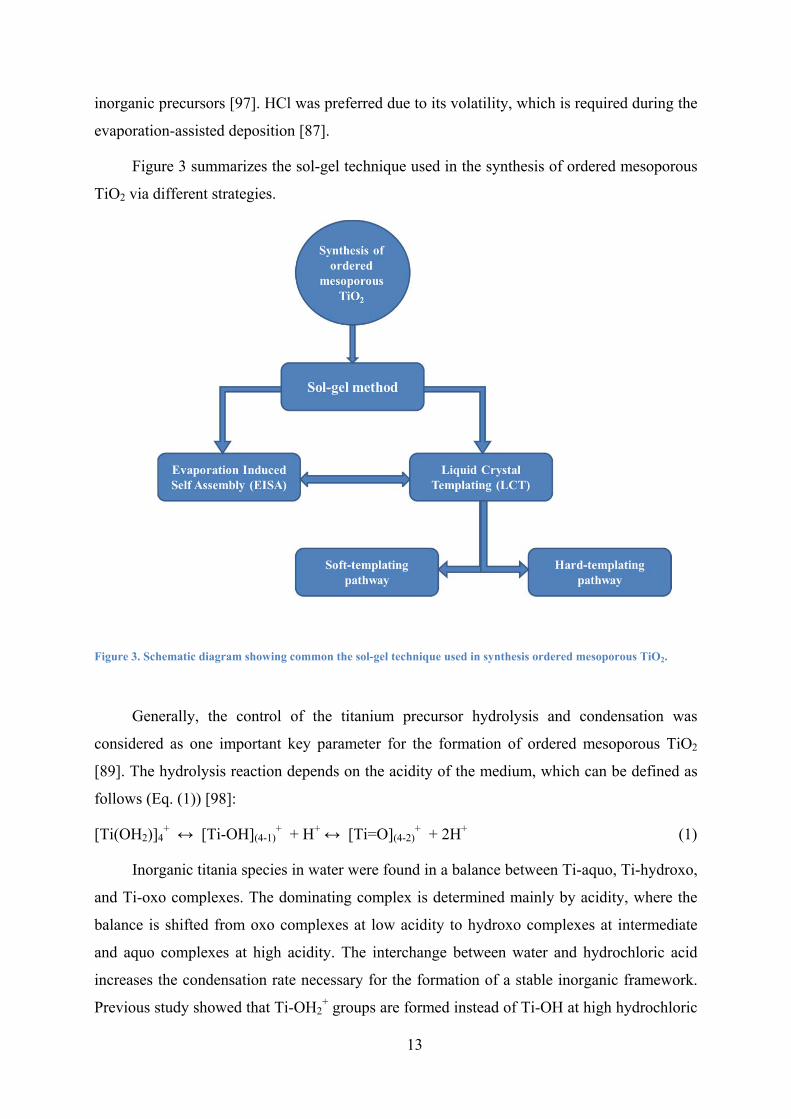
Figure 3 summarizes the sol-gel technique used in the synthesis of ordered mesoporous
TiO2 via different strategies.
Figure 3. Schematic diagram showing common the sol-gel technique used in synthesis ordered mesoporous TiO2.
Generally, the control of the titanium precursor hydrolysis and condensation was
considered as one important key parameter for the formation of ordered mesoporous TiO2
[89]. The hydrolysis reaction depends on the acidity of the medium, which can be defined as
follows (Eq. (1)) [98]:
[Ti(OH2)]4+ ↔ [Ti-OH](4-1)
+ + H+ ↔ [Ti=O](4-2)+ + 2H+ (1)
Inorganic titania species in water were found in a balance between Ti-aquo, Ti-hydroxo,
and Ti-oxo complexes. The dominating complex is determined mainly by acidity, where the
balance is shifted from oxo complexes at low acidity to hydroxo complexes at intermediate
and aquo complexes at high acidity. The interchange between water and hydrochloric acid
increases the condensation rate necessary for the formation of a stable inorganic framework.
Previous study showed that Ti-OH2+ groups are formed instead of Ti-OH at high hydrochloric
14
acid concentration. Because of charge repulsion between the groups, dehydration hardly
occurs, and the Ti-O6 octahedral prefers to share corners with each other [99]. Aquo-ligands
are excellent leaving groups but poor nucleophiles, thus the condensation of titania will be
severely hampered due to the lack of good nucleophiles, allowing the system longer time to
self-assemble into an ordered mesophase [100]. For the reaction under acidic conditions, more
hydrophilic groups (EO) head towards water. This leads to inhibition of the hydrolysis rate
and balance of the condensation. The regulation of the hydrolysis and condensation is very
useful in the synthesis of the ordered mesoporous TiO2.
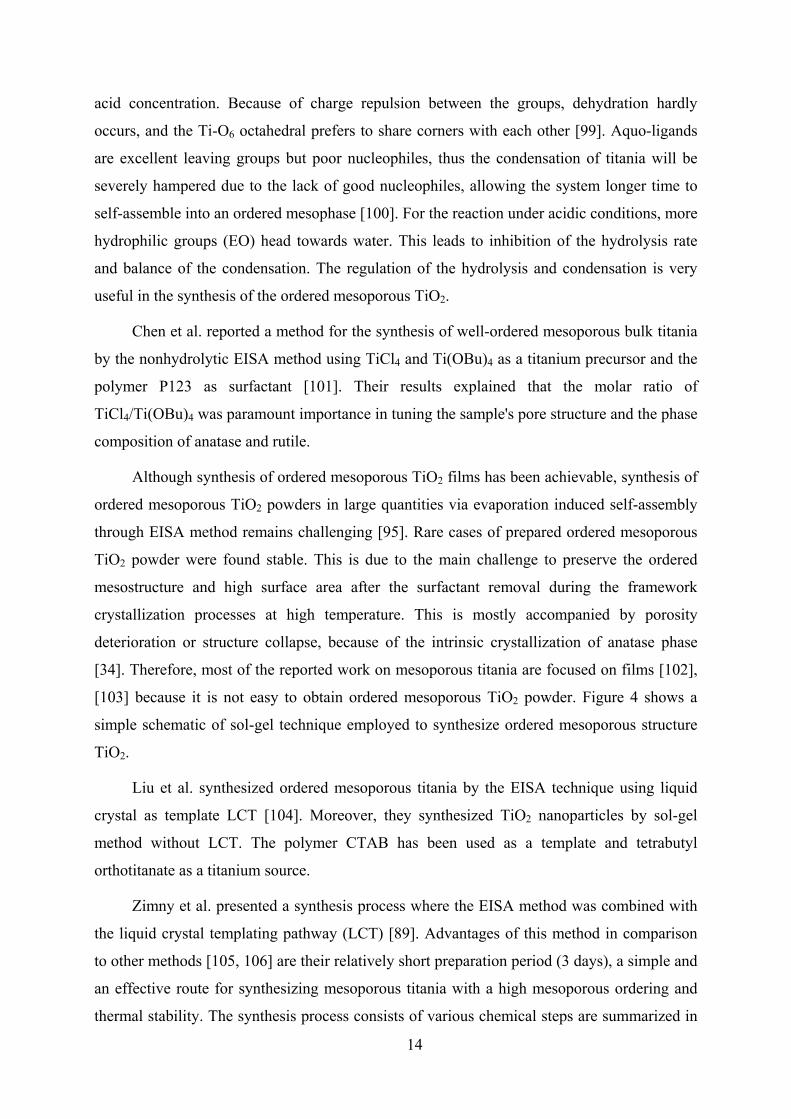
Chen et al. reported a method for the synthesis of well-ordered mesoporous bulk titania
by the nonhydrolytic EISA method using TiCl4 and Ti(OBu)4 as a titanium precursor and the
polymer P123 as surfactant [101]. Their results explained that the molar ratio of
TiCl4/Ti(OBu)4 was paramount importance in tuning the sample's pore structure and the phase
composition of anatase and rutile.
Although synthesis of ordered mesoporous TiO2 films has been achievable, synthesis of
ordered mesoporous TiO2 powders in large quantities via evaporation induced self-assembly
through EISA method remains challenging [95]. Rare cases of prepared ordered mesoporous
TiO2 powder were found stable. This is due to the main challenge to preserve the ordered
mesostructure and high surface area after the surfactant removal during the framework
crystallization processes at high temperature. This is mostly accompanied by porosity
deterioration or structure collapse, because of the intrinsic crystallization of anatase phase
[34]. Therefore, most of the reported work on mesoporous titania are focused on films [102],
[103] because it is not easy to obtain ordered mesoporous TiO2 powder. Figure 4 shows a
simple schematic of sol-gel technique employed to synthesize ordered mesoporous structure
TiO2.
Liu et al. synthesized ordered mesoporous titania by the EISA technique using liquid
crystal as template LCT [104]. Moreover, they synthesized TiO2 nanoparticles by sol-gel
method without LCT. The polymer CTAB has been used as a template and tetrabutyl
orthotitanate as a titanium source.
Zimny et al. presented a synthesis process where the EISA method was combined with
the liquid crystal templating pathway (LCT) [89]. Advantages of this method in comparison
to other methods [105, 106] are their relatively short preparation period (3 days), a simple and
an effective route for synthesizing mesoporous titania with a high mesoporous ordering and
thermal stability. The synthesis process consists of various chemical steps are summarized in

15
Figure 4. The first step includes dissolving a surfactant and a titanium precursor in ethanol in
the presence of acid. This step is very important because it is the key to obtain ordered
mesoporous structure. The copolymer P123 consists of two parts hydrophilic (polar) and
hydrophobic (non-polar). After that, HCl will be added. In this step, the micelles are formed
[107]. The high concentration of HCl allows to the control of hydrolysis-condensation
reactions and avoids the precipitation of a titanium oxide phase, and the micelle will
agglomerate. Upon dissolution in the presence of alcohol and HCl, the Ti precursor undergoes
fast exchange reactions with alcohol and/or chloride ions, which make hydrolysis processes to
proceed practically instantaneously [92]. These reactions can be schematically represented as
follows (Eq. (2))*:
Ti(OCH(CH3)2)4 + H2O/HCl Ti(OCH(CH3)2)n-x(OCH2CH3)x or TiCln-x(OCH2CH3)x
or mixture Ti(OCH(CH3)2)n-x(OCH2CH3)x + TiCln-x(OCH2CH3)x (2)
* The equation above is not stoichiometry.
Subsequently, starting of a polycondensation reaction between the formed Ti-species
leads to the formation of discrete Ti-oxo-oligomers of general formula [TiXx(OH)yO2-(x+y)/2]
X: OR or Cl, clusters or small polymers [92]. The co-condensation of these subunits around
the micelles is hindered by the presence of acid [49, 92]. The degree of condensation depends
on the [H2O]:[Ti] and [H+]:[Ti] ratio [87]. The second step is the evaporation of solvent; the
mixture has been placed under vacuum to evaporate the alcohols in order to form the
hexagonal hybrid mesophase structure gel by agglomeration of micelles (more of
polycondensation reactions). The third step is the treatment of the obtained gel with ammonia
vapor to precipitate amorphous TiO2 by induce more of polycondensation reaction. The fourth
step is removal of surfactant by ethanol. Finally, the fifth step is the calcination of amorphous
TiO2 at high temperature to obtain crystalline TiO2.
It was shown that mesoporous ordering and pore size of the formed amorphous titania
framework obtained after surfactant extraction can be controlled by the molar
surfactant/titanium precursor ratio and the surfactant concentration [90].
Different methods were reported to transform the amorphous titania framework into
crystalline titania domains while the mesostructure is preserved intact, such as conventional
calcination conditions (under Ar or N2 then O2) and flash induction calcination (induction
furnace) [90, 108-110].

16
Figure 4. Schematic diagram showing procedures synthesis of ordering mesoporous titania (the draws in step 3 and 4 were taken from [89]).
Dopingorderedmesoporoustitaniumdioxidepowder1.3.2
The term doping has been defined and introduced in the previous sections. Very little
work about doping ordered mesoporous titanium dioxide powder in comparison with
mesoporous titanium dioxide. This work will be summarized in the following.
1.3.2.1 Metal‐dopedorderedmesoporoustitaniumdioxidepowder
Metal doped mesoporous TiO2 powder is an important area of research, however
relatively very little is known about metal doped ordered mesoporous TiO2. In 1999, cobalt
doping into the mesoporous structure was reported for the first time in this system, and its
structure was determined by Yin and Wang via template-assisted self-assembly techniques.
They employed polystyrene (PS) particles as template, titanium butoxide as titanium
precursor and heptane solution of cobalt carbonyl as cobalt source. They found that cobalt
titanium oxide may be formed on the internal surface of the ordered pore structure. They
suggested that transition metal elements could be incorporated into porous titania without
blocking the interconnected pores [111].
In 2006, Wang et al. prepared Fe-doped ordered mesoporous titania through a
hydrothermal process by using CTAB as a template and tetrabutyl orthotitanate (TBOT) as
precursor. They concluded that ordering of the pore channels and the thermal stability of the
mesostructure at 350˚C were improved after the incorporation of iron into TiO2 [112]. In
another study [113], Fe-doped ordered mesoporous TiO2 has been synthesized via the EISA
using P123 as soft template, TBOT as a titanium precursor and ferric nitrate (Fe(NO3)3·9H2O)
as an iron source. The results indicated that the 0.5 mol ratio of doped Fe3+ ions had an

17
ordered mesoporous structure. They explained that the Fe3+ ions introduced into the lattice of
mesoporous TiO2 could reduce the growth of the anatase during the calcination and preserved
the mesoporous structure with large surface area. Further, cobalt-doped ordered mesoporous
titanium dioxide also has been successfully synthesized by Ye and co-workers via a
multicomponent self-assembly process. They used triblock copolymer Pluronic F127 as a
template, tetrabutyl titanate as a titanium source and cobalt acetate as a cobalt source. The
doped Co species have changed the construction of the conduction band and valence band of
TiO2 leading to visible-light absorption by TiO2 [114].
Moreover, the highly ordered 2D hexagonal mesoporous Bi-doped TiO2 with changing
Bi ratios (from 0 to 4 mol%) has been synthesized by Sajjad et al. [115] through an ethanolic
EISA process. They employed triblock copolymer Pluronic P127 as a template, titanium
isopropoxide as a titanium precursor and bismuth nitrate as a bismuth source. They used
variable Bi ratios (1, 2, or 4% Bi-doped ordered mesoporous TiO2). Here, no effect of using
different Bi ratios on the ordered hexagonal mesostructure has been investigated. Moreover
they studied the thermal stability at three different temperatures (350, 400, and 450 °C). They
concluded that increasing the calcination temperature leads to a gradual decrease of
diffractional strength due to the degree of ordering of the mesoporous structure.
Recently, Assaker et al. [116] have examined the effect of the zinc ion addition on the
structure and photocatalytic properties of the ordered mesoporous titania. They observed that
the hexagonal array was lost upon increasing the zinc content to higher than 7 mol%. The
decrease in the activity of methyl orange photo-degradation under UV irradiation at high Zn
content was related to the decrease of the crystallinity as well as to the shift of the band gap.
In the same context, Co-doped ordered mesoporous TiO2 has been fabricated by Li et al. [117]
via multicomponent self-assembly procedure. They used triblock copolymer Pluronic F127 as
templates, tetrabutyl titanate (C16H36O4Ti) and cobalt acetate (C4H6CoO4·4H2O) as cobalt
source. They showed that low cobalt contents up to 3 mol% did not destroy the mesoporous
structure and hence the response of the sensors increased with increasing the cobalt contents.
Above this content (e.g. 5 mol%), the cobalt started to appear in oxides form and the
mesoporous structure was mainly destroyed.

18
1.3.2.2 Non‐metaldopedorderedmesoporoustitaniumdioxidepowder
N-doped ordered mesoporous structure TiO2 powder has been synthesized by Ikuma
and his group [118]. Their results showed stronger absorption in the visible region above 400
nm, owing to the substitution of the lattice oxygen by nitrogen. Their XPS results proved the
doping of nitrogen in to oxygen in TiO2 lattice. More recently, Li et al. [119] have reported
nitrogen doped ordered mesoporous TiO2 powder via EISA method combined with the post–
annealing treatment in NH3 atmosphere. The BET surface area of ordered mesoporous TiO2
and N-doped ordered mesoporous TiO2 were 139.6 and 138.7 m2/g. in addition, their XPS
results suggested existence of N-Ti-O and Ti-O-N bonding.
1.4 Principlesofphotocatalysis
The development of water treatment technologies has included conventional
technologies such as activated carbon adsorption and solvent extraction, and advanced
technologies such as electro‐Fenton method, membrane‐based separation method, and
photocatalysis. All these methods have been successfully used for removal of phenolic
compounds from water [120]. However, well-known conventional methods for wastewater
treatment are not efficient enough to destroy the refractory organic pollutants. Moreover, their
applications are limited because of the high cost and the required sophisticated equipment
(Panda et al., 2011). Based on IUPAC, the term photocatalysis means that the reactions are
carried out in the presence of a semiconductor and light [121]. The photocatalysis technology
has received enormous attention in recent years. It is rapidly developing as one of the most
active areas of chemical research. It can be applied in different scientific areas such as
electrochemistry, medicine, and environmental chemistry. Photocatalysis can be classified
into two main branches including homogeneous and heterogeneous photocatalysis. This
classification is mainly based on the phase of the reactant as well as the photocatalyst.
Moreover, the main difference between a conventional thermal catalyst and a photocatalyst is
that the former one is activated by heat whereas the latter is activated by photons of
appropriate energy [53]. Currently, heterogeneous photocatalytic techniques are using a
semiconductor (such as TiO2) as photocatalyst to degrade various pollutants (such as phenol
and its derivation) from water [122]. Furthermore, the photocatalytic activity of ordered
mesoporous TiO2 was obviously enhanced compared to that of disordered mesoporous
structures. The increase in activity was attributed to their uniformly distributed porosity
leading to high specific surface areas, which could enhance both the diffusion of reactants and
products and the access to active sites [2, 86].
19
However, it has to be mentioned that the ability of titania to undergo a charge transfer
from the semiconductor to the surface adsorbed species depends on the position of the CB and
VB edges and the redox potential of the adsorbed molecule (Figure 5). The energetic level of
an electron accepting species that will be reduced has to be lower than the lower edge of the
titania CB. In contrast the energetic level of a hole accepting species that will be oxidized has
to be higher than the upper edge of the titania VB.
Figure 5. Comparison of energetic level of titania VB and CB band with the redox potential of different processes [123].
1.5 Photoactivityofmesoporoustitaniumdioxidepowder
Photoactivityofundoped‐mesoporoustitaniumdioxidepowder1.5.1
In recent years, great efforts have been devoted to study the photodegradation of
organic and inorganic pollutants of water and air by employed mesoporous TiO2 [58].
Generally, previous studies showed that the photoactivity of TiO2 depends on its structural
and morphological characteristic. These are related to the method of synthesis used in the
preparation of nanoparticles. To be photoactive, the photocatalysis process favoring, being
mainly consisting of anatase crystalline phase, high surface area, good porosity, with high
sized pores [124]. In the fact, the relation between the physical properties and the
photocatalytic activities is complicated. A large surface area with a constant surface density of
20
adsorbents led to faster surface photocatalytic reaction rates. However, the surface is a
defective site; therefore the larger surface area is the faster recombination. The higher the
crystallinity means the fewer the bulk defects, which leads to high photoactivity [1]. Other
reports showed that the photocatalytic activity of TiO2 is influenced by the crystal phase, pore
diameter, and surface hydroxyl group density. All these structural factors are dramatically
dependent on the TiO2 synthesis procedure [125, 126].
Moreover, many studies suggest that the photocatalytic activity depends on the number
of electrons and holes at the photocatalyst surface. In addition to many other factors, the small
grain size leads to a shorter distance for the electrons and holes to transfer to the
photocatalytic reaction sites. So efforts should be made to increase the specific surface area
and decrease the grain size that would improve photocatalytic activity [40].
Further, mesoporous TiO2 has been employed as photocatalyst for chloro-phenol
degradation. Its degradation efficiency increased with increasing the PEG molecular weights.
The remarkably high catalytic activity of the mesoporous TiO2 was derived from its high
crystallinity and mesostructure as compared to Degussa P-25 [115]. Moreover, it was
observed by Zhang's group [40] that the absorption intensity, in the visible region, for the
prepared samples by the two-step calcining process (powder was calcined at 500-700 °C in
nitrogen, and then recalcined at 500 °C in air) is higher than that for the prepared samples by
the one-step calcining process (calcined at 500 °C in air).
Photoactivityofdoped‐titaniumdioxidepowder1.5.2
Generally, the photocatalytic activity of pure mesoporous materials could be enhanced
by dispersing metals on surfaces of these materials [83]. This will increase the reaction
efficiency by introducing more active sites. Both metal- and non-metal-doped mesoporous
TiO2 could extend the absorption edge into the visible-light region and improve the separation
efficiency of the photogenerated electron [36]. Photoactivity of doped-TiO2 substantially
depends on several factors such as the nature and concentration of dopants, thermal treatment,
and thus on the synthesis method [127].
1.5.2.1 Photoactivityofmetal‐dopedmesoporoustitaniumdioxidepowder
The photocatalytic performance of titania can be further improved by doping of the
material with transition metal ions [17, 34, 36, 57, 128]. The activity of the doped material is
influenced by the preparation method, specific metal and its concentration, the location and
distribution of the metal ions in the titania phase, and the oxidation state of the metal and its
local environment.

21
Zhu et al. [61] studied effect of the synthesis method and iron doping on the
photocatalytic activity of TiO2. They investigated activity of their samples by photolytic
degradation of methylene blue under visible light irradiation. They showed that Fe-TiO2
obtained via NSG route exhibited a higher photoactivity compared to the undoped TiO2 and
the Fe-TiO2 obtained via HSG route. The NSG route was superior to the HSG route due to its
controlled reaction rate and lack of the surface tension. This could be explained by the
formation of mesoporous, well-crystallized anatase, the strong absorbance for visible light,
and more surface oxygen vacancies and/or defects that could reduce the recombination
process between the photoelectrons and holes. This will lead to the enhanced quantum
efficiency of photocatalysis. Moreover, the enhancing of the Fe-doping on the photocatalytic
activity could be attributed to the producing of intermediate energy levels that allow Fe-TiO2
to be activated easily in the visible light.
In the same context, the photocatalytic property of the prepared samples by Shouqiang
et al. [62] was evaluated by degradation of the methylene blue (MB) solution. The appropriate
content of iron can effectively enhance the absorption in the visible light region and the
photocatalytic activity of TiO2. The optimum content of the doped Fe was 2 mol%.
Here, the effect of titanium source on the photocatalytic properties of TiO2 doped with
iron will be briefly introduced. Goswami and his colleague [63] demonstrated that the Fe-
doped mesoporous TiO2 prepared from (K2TiF6) was much more effective in the
photocatalytic decomposition of bromocresol green than undoped mesoporous TiO2 as well as
commercial titania.
The effects of copper doping and mesoporous structure on the photocatalytic properties
of TiO2 have been reported by Guo's group [65]. The results confirmed that copper doping
greatly promoted the absorption in the visible light region and played a significant role for
enhancing the photocatalytic activity of the catalysts. The observed high photoactivity of the
catalysts for degradation of methyl orange (MO) strongly depends on the stabilization of Cu
(I) that was well dispersed in TiO2. Moreover, mesoporous structures with larger specific
surface area, pore size, and the relatively regular channel structure had better adsorption
capacity. Yusop and his colleagues [66] have reported a significantly high photocatalytic
activity for the Fe-doped mesoporous TiO2 in the photodegradation of RB5 under solar light
irradiation. This is due to the high surface area for the anatase-brookite phase and mesoporous
structure.

22
1.5.2.2 Photoactivityofnon‐metal‐dopedmesoporoustitaniumdioxidepowder
Previous studies have explained the synergistic effects of many factors on photo-
catalytic activity of N-doped TiO2 such as synthetic methods, morphology, crystal phase,
particle size, optical response, surface area, and nitrogen doping [70, 129]. Moreover,
localized nitrogen state in N-doped TiO2 lattice has a significant influence on the
photocatalytic degradation of pollutants [72]. Wang et al. [130] synthesized N-doped
mesoporous TiO2 polycrystalline powders by calcination of the hydrolysis product of tetra
butyl titania with ammonia. Their results showed that the photocatalytic activity of N-doped
TiO2 was higher than that of P25 for the phenol degradation under visible light irradiation,
while P25 showed higher photocatalytic activity under sunlight irradiation.
Over the past years, a number of studies have focused on study influence of the
experimental parameters of sol-gel N-doping method on the photocatalytic activity of N-
doped TiO2. These parameters included TiO2 precursors, nitrogen precursors, solvents, pH
values, and post N-doping treatments [76]. Huang and co-workers [77] investigated that N-
doped TiO2 calcined at 400 °C has Brønsted acid sites arising from covalently bonded
dicarboxyl groups. This greatly promoted the adsorption capacity for methyl orange. N-doped
mesoporous titania samples demonstrated excellent photoactivity for methyl orange (MO)
degradation under visible light irradiation, which could be attributed to synergistic effect
between the retained alkoxyls and the nitrogen doping [79]. Moreover, Zalas observed that N-
doped mesoporous TiO2 materials are more active than the undoped mesoporous TiO2 and
P25 [80]. He concluded that the improvement in the photocatalytic efficiency of N-doped
TiO2 is due to their visible light sensitization caused by incorporation of nitrogen atoms into
the TiO2 structure. His results also indicated that the relatively low specific surface areas of
N-doped mesoporous TiO2 materials have not influenced their activity.
Zhang et al. studied the influence of different chemical bonds for the nitrogen element
in each particular nitrogen source on the photocatalytic properties of N-doped TiO2. They
tested the photoactivity of materials in carbon dioxide photocatalytic reduction under visible
light illumination. CH4 was the main product with N2H4-doped N-TiO2, while CO was the
main product with NH3-doped N-TiO2 [131]. Rayalu and his group [132] explored the photo-
oxidation properties of N-doped mesoporous titania in photodegradation of phenols under
visible light. Their study showed the effect of various operating parameters including catalyst
loading, pH, initial concentration, and the effect of coexisting ions (such as chloride,
carbonate and bicarbonate) on the rate of photocatalytic degradation of both phenol and o-

23
chlorophenol. It was found that the catalyst showed significant activity in the solar radiation
as compared to artificial light. Their results indicated that initial pH and coexisting ions have
a significant influence on the photocatalytic degradation rates. Maximum photodegradation
was observed at neutral pH while the presence of co-ions has a detrimental effect on the
degradation rates in case of both phenol and o-chlorophenol. Further improvement in the
photoactivity of N-doped mesoporous titania was envisaged by co-doping with nonmetal or
metal ions.
1.6 Photoactivityoforderedmesoporoustitaniumdioxidepowder
Photoactivityofpristinemesoporoustitaniumdioxidepowder1.6.1
In reference [101], the photocatalytic activity of powders prepared for phenol
degradation under UV irradiation showed that the well-ordered open pore structure and
biphase composition (anatase and rutile) played significant roles in determining the sample’s
photoactivity. In another reference [93], ordered mesoporous anatase TiO2 demonstrated a
remarkable photocatalytic efficiency for degradation of methylene blue (MB) under UV
irradiation. The researchers attributed the reason to the associated effects of high specific
surface area, pure anatase crystalline framework, and structural ordering of the mesopores.
Zhou et al. showed that the mesoporous anatase TiO2 exhibited better photocatalytic
activity than that of Degussa P25 TiO2 under UV irradiation due to the integrated ordered
large-pore mesoporous structure and the high crystallinity in favor of the separation of
photogenerated electron-hole pairs [133]. The photocatalytic degradation of methyl orange
also has been performed by Zimny’s sample [90]. Here the influence of calcination
temperature on photocatalytic activity was studied. They showed that the crystallinity played
a significant role in the photoactivity. The material calcined at temperatures between 400 and
450 °C showed the fastest degradation rate under UV irradiation.
Ordered mesoporous titania has been synthesized by Zeng’s group [104], it has shown
higher photocatalytic efficiency for methylene blue (MB) degradation under UV irradiation
than TiO2 nanoparticles, due to the 2D hexagonal mesostructure with small particle size and
high surface area. Cao et al. have investigated that ordered mesoporous titania demonstrated
good photocatalytic activity for degradation of rhodamine B in aqueous suspension due to its
highly crystalline material and large surface area [94].
Silvam’s group [134] referred that the ordered mesoporous titania showed much higher
activity than P25 due to synergistic effect of stable mesoporous structure and mixed
24
crystalline phases of titania (anatase, brookite and rutile). The presence of ternary phase
compositions promoted the photoinduced e-/h+ pair life time by facilitating carrier migration
across the phase junctions. Higher life time of the charge carriers led to higher OH radical
concentration and a faster degradation rate of 4-chlorophenol.
Moreover, in other study, the effect of some physicochemical parameters such as time
of adsorption prior to UV irradiation, initial methyl orange concentration, photonic flux, pH
and amount of photocatalyst has been studied by Blin and his colleagues in ordered to
optimize the experimental parameters. They tested order mesoporous TiO2 efficiency on the
photodegradation of methyl orange (MO) under UV irradiation. Their results explained that
the efficiency of the process depended on the experimental conditions, which were including
the time of adsorption prior to UV irradiation, initial methyl orange concentration, incident
light intensity, pH and amount of photocatalyst [110].
Photoactivityofdopedorderedmesoporoustitaniumdioxidepowder1.6.2
1.6.2.1 Photoactivityofmetal‐dopedorderedmesoporoustitaniumdioxidepowder
In the reference [113], the results indicated that the 0.5 mol ratio of Fe-doped had an
ordered mesoporous structure and the highest photoactivity to degrade the methyl orange
under visible light irradiation compared with other catalysts. The Bi-doped mesoporous TiO2
samples by Sajjad et al. [115] enhanced photocatalytic activities for simultaneous phenol
oxidation and chromium reduction in aqueous suspension under visible and UV light over the
pure mesoporous TiO2, Bi-doped titania, and P25. The reason was attributed to both the
unique structural characteristics and the Bi doping.
The ordered mesoporous Co-doped TiO2 synthesized by Wang et al. [114] exhibited a
much higher photocatalytic activity for CO2 reduction under visible light owing to its regular
porous structure and suitable band structure. In addition, the selectivity of the reduction
products was improved by optimizing the energy-band configurations of cobalt-doped
titanium dioxide through varying the molar ratio of Co/Ti. The optimal molar ratio of Co/Ti
was 0.025, which showed the best photoactivity. When the doping content of cobalt species
increases to some extent, Co3O4/Co-doped TiO2 nanocomposites with oxygen vacancies were
obtained, which markedly improve the generation rate of CH4. In the same context, Assaker et
al. explained [116] that the photocatalytic efficiency was significantly affected by the zinc
content. The high content of zinc inhibited the photodegradation rate of methyl orange under
UV irradiation.

25
1.6.2.2 Photoactivity of non‐metal‐doped ordered mesoporous titanium dioxide
powder
The efficiency of photocatalyst prepared by Ikuma’s group [118] was evaluated via the
degradation of Rhodamine-B and antibacterial activity against E. coli under visible-light
irradiation. N-doped mesoporous TiO2 showed superior photocatalytic and anti-bacterial
activity compared to pure TiO2 under visible-light irradiation. The enhanced photocatalytic
activity after N-doping was attributed to synergistic effect of nitrogen and well-ordered
crystalline mesoporous structure with high surface area. Huang and his colleague [81]
claimed that different sources of nitrogen doping led to different degrees of doping, which
enhanced the photodegradation of methylene blue in the visible light region.
1.7 Photocatalyticmechanism
The photocatalytic mechanism of pristine TiO2 under UV light irradiation (as shown in
Figure 6) can be described during two steps. The first step of photoreaction is producing an
electron-hole pair on the surface of TiO2 nanoparticle. This step needs energy to overcome the
band gap between the valence band (VB) and conduction band (CB). When the photon energy
is equal to or exceeded the band gap energy (Eg) of TiO2 (3.2 eV for the anatase phase), the
electron-hole pairs are created in the volume and on the surface of TiO2 nanoparticle (Eq. (3)).
In this step, photoelectron is promoted to CB while a positive photo hole is formed in VB.
The photocatalytic redox reaction will utilize the positive hole (h+VB) for the oxidation
processes and the electrons (e-CB) for the reduction processes on the surface of the
photocatalysts.
TiO2 + hυ → e-CB+ h+
VB charge pair generation (3)
The second step involves producing the hydroxyl radical OH• with high redox oxidizing
potential by the oxidation reaction of adsorbed water or OH− (Eq. (4) and (5)). In addition, in
conduction band, the electron is reducing the oxygen molecules to form superoxide anion O2•-
(Eq. (5)). The superoxide anion is protonated (Eq. (7)) by H+, which is produced by (Eq. (5)).
Then HOO• traps another excited electron to produce HO2- (Eq. (8)), which is protonated by
H+ to form hydrogen peroxide H2O2 (Eq. (9)). Finally, the hydrogen peroxide is reacting with
the electron e- to produce OH• (Eq. (10)). Here, the oxygen can play a very important role to
produce more of OH• [17].
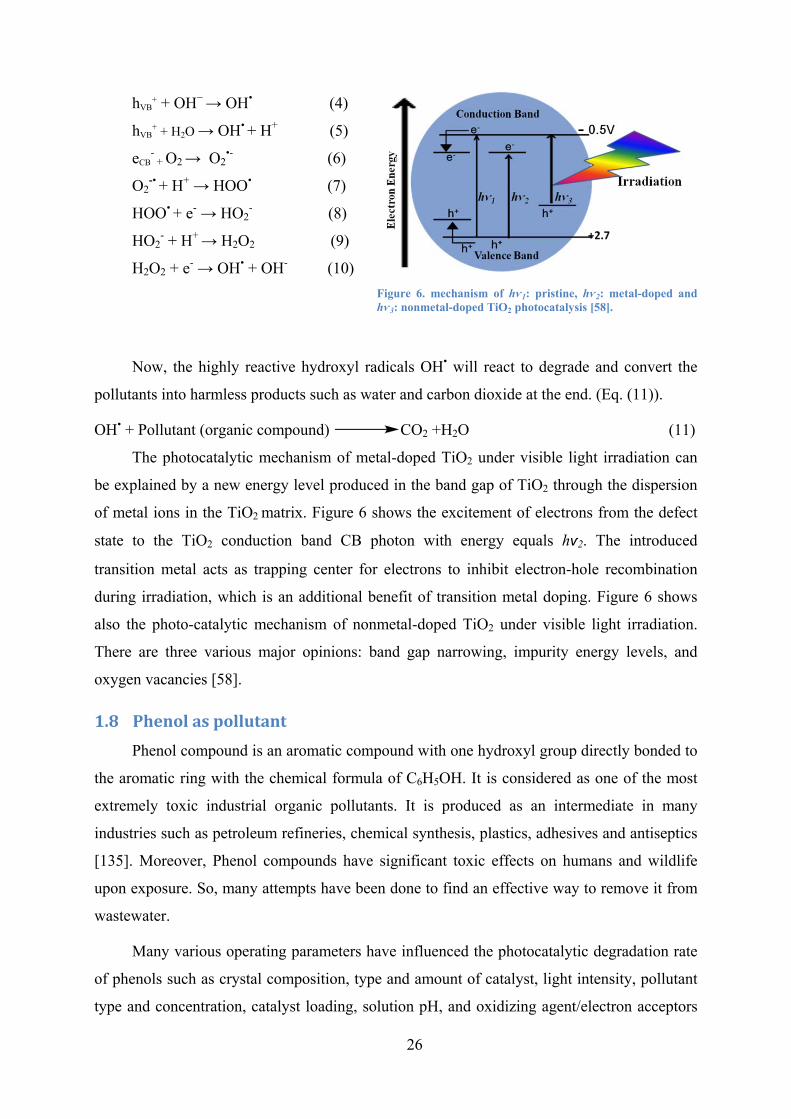
26
hVB+ + OH− → OH• (4)
hVB+ + H2O → OH• + H+ (5)
eCB- + O2 → O2
•- (6)
O2-• + H+ → HOO• (7)
HOO• + e- → HO2- (8)
HO2- + H+ → H2O2 (9)
H2O2 + e- → OH• + OH- (10)
Figure 6. mechanism of hѵ1: pristine, hѵ2: metal-doped and hѵ3: nonmetal-doped TiO2 photocatalysis [58].
Now, the highly reactive hydroxyl radicals OH• will react to degrade and convert the
pollutants into harmless products such as water and carbon dioxide at the end. (Eq. (11)).
OH• + Pollutant (organic compound) CO2 +H2O (11)
The photocatalytic mechanism of metal-doped TiO2 under visible light irradiation can
be explained by a new energy level produced in the band gap of TiO2 through the dispersion
of metal ions in the TiO2 matrix. Figure 6 shows the excitement of electrons from the defect
state to the TiO2 conduction band CB photon with energy equals hѵ2. The introduced
transition metal acts as trapping center for electrons to inhibit electron-hole recombination
during irradiation, which is an additional benefit of transition metal doping. Figure 6 shows
also the photo-catalytic mechanism of nonmetal-doped TiO2 under visible light irradiation.
There are three various major opinions: band gap narrowing, impurity energy levels, and
oxygen vacancies [58].
1.8 Phenolaspollutant
Phenol compound is an aromatic compound with one hydroxyl group directly bonded to
the aromatic ring with the chemical formula of C6H5OH. It is considered as one of the most
extremely toxic industrial organic pollutants. It is produced as an intermediate in many
industries such as petroleum refineries, chemical synthesis, plastics, adhesives and antiseptics
[135]. Moreover, Phenol compounds have significant toxic effects on humans and wildlife
upon exposure. So, many attempts have been done to find an effective way to remove it from
wastewater.
Many various operating parameters have influenced the photocatalytic degradation rate
of phenols such as crystal composition, type and amount of catalyst, light intensity, pollutant
type and concentration, catalyst loading, solution pH, and oxidizing agent/electron acceptors
-
27
[128]. Previous studies showed that phenol could be degraded by OH radicals or directly via
photogenerated carriers using photocatalysis technology [13, 136]. There are many different
mechanisms proposed for the phenol degradation process by photocatalysis technology
through OH radicals attack. In all these proposals, mostly hydroquinone and catechol have
been formed in the first step of the reaction while the main products were water and carbon
dioxide at the final step of the reaction. The differences were only in the intermediates
compounds such as 2-hydroxy-propaldehyde, glycerol, 3-hydroxypropyl acid, hydroxyl-acetic
acid, maleic acid, and oxalic acid. These differences were due to various reaction conditions
and different analytical techniques (e.g. GC-MS and HPLC) applied to enrichment step and
final detection of samples [136]. The general formula of the photocatalytic reaction on
illuminated TiO2 is shown below (Eq. (12)):
Organic Pollutant Intermediates CO2+H2O (12)
Figure 7 shows the possible proposed reaction mechanisms by Devi and Rajashekhar
for the phenol degradation. The generated hydroxyl radicals attack the phenol molecule that
leads to the formation of dihydroxy benzene (2) which is confirmed by the presence of m/z
peaks at 110 (relative abundance [RA]: 42, retention time [Rt]: 10.4 min). Further degradation
proceeds through the cleavage of dihydroxy benzene (2). After 15 min of UV irradiation, m/z
peaks at 130 (RA: 54; Rt: 16.6 min) and 30 (RA: 42; Rt: 28.6 min) corresponding to the
formation of Pent 2-enedioic acid (3) and formaldehyde (4) are observed. Few low intense
peaks at 108 and 116 (RA: 49; Rt: 6.8 min) were accounted as benzoquinone (5) and maleic
acid (6). The decarboxylation of maleic acid (6) and ring opening of hydroquinone (5) results
in the formation of oxalic acid (7) with the m/z peak at 90 (RA: 64; Rt: 18.2 min). During the
photodegradation process, formation of the two main intermediates of dihydroxy benzene (2)
and benzoquinone (5) has been observed. Finally, decarboxylation of oxalic acid leads to the
formation of carbon dioxide and water molecule [137].

28
Figure 7. Schematic diagram showing the probable degradation mechanism for phenol [137].
1.9 Objectivesandstructuralplanning
This dissertation aims to study the effect of synthesis parameters on the structure of
mesoporous TiO2 and their photocatalytic performance in order to obtain a highly ordered
mesoporous structure with high crystallinity and high photocatalytic performance in the
treatment of water pollution.
Important reaction parameters including:
- The evaporation temperature, synthesis of mesoporous TiO2 powders in a range between 25
and 80 °C in order to obtain optimal evaporation temperature.
- The extraction conditions were varied to find the optimal condition in order to remove of the
surfactant including: extraction step, extraction temperature a range between 23 and 78 °C,
and the number of the extraction steps.
- The optimal molar ratio P123/Ti-source, synthesis of mesoporous TiO2 powders in a molar
range between 0.1-0.4.
- The titanium source, synthesis of mesoporous TiO2 powders were performed by using two
titanium sources, titanium isopropoxide Ti(OiPr)4 and titanium butoxide Ti(OnBu)4.
Additionally, influence of transition metal and nonmetal doping on the structure of ordered
mesoporous TiO2 and their photocatalytic performance will be studied.
OH
OH
COOH
COOH
4
2
O
O
+
COOH
COOH
+ HCHO
3
5 6
6
COOH
COOH
CO2 + H2O
7
8 9
OH
1
OH
OHOH
OH
OH
OH OH
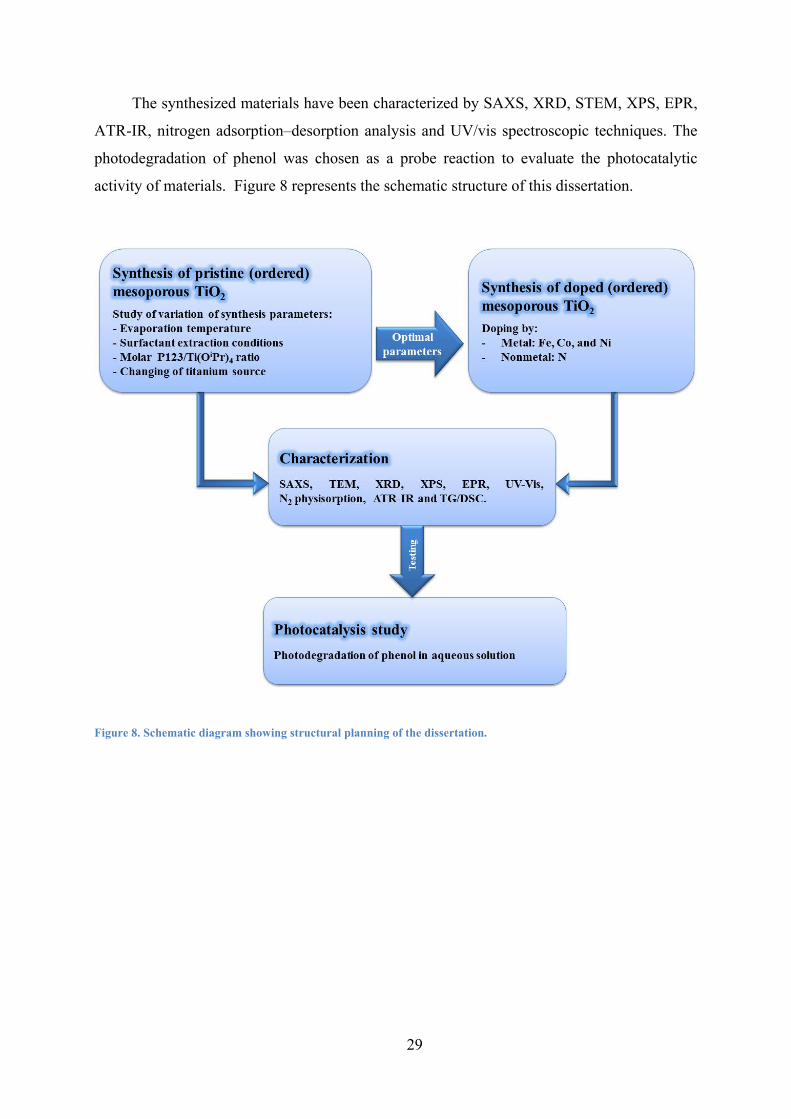
29
The synthesized materials have been characterized by SAXS, XRD, STEM, XPS, EPR,
ATR-IR, nitrogen adsorption–desorption analysis and UV/vis spectroscopic techniques. The
photodegradation of phenol was chosen as a probe reaction to evaluate the photocatalytic
activity of materials. Figure 8 represents the schematic structure of this dissertation.
Figure 8. Schematic diagram showing structural planning of the dissertation.

30
2 Experimentalpart
2.1 Materialsynthesis
Materials2.1.1
Triblock copolymer P123 (EO20PO70EO20, Sigma-Aldrich) was used as structure–
directing agent (surfactant); titanium isopropoxide (Ti(OiPr)4, 97%) and titanium butoxide
(Ti(OnBu)4, 97%) purchased from Sigma-Aldrich were used as titanium precursor. Iron (III)
chloride (FeCl3, 97%), cobalt chloride hexahydrate (CoCl2·6H2O, 98%) were also purchased
from Sigma-Aldrich. Nickel chloride (NiCl2, 98%) was obtained from MERCK. HCl (37%)
were purchased from VWR chemicals, and absolute ethanol was obtained from J. T. Baker.
All chemicals were used as received without any further purification.
Synthesisofpristinemesoporoustitania2.1.2
2.1.2.1 Generalsynthesisprocedure
1 g of P123 was dissolved in 20 g of ethanol in a two necked round bottom flask (100
mL) at room temperature (RT) under stirring. After 30 min stirring at RT, 2 g of HCl (37%),
3.016 g of the titanium precursor (Ti(OiPr)4) and 2 g of distilled water were added to the P123
containing solution (molar P123/Ti ratio = 0.0163). After the water addition was finished, the
flask was flushed with argon. The two necked round bottom flask containing the clear
reaction mixture was immersed in a water bath which was heated to a temperature of 5 °C
below the temperature used for solvent evaporation. In general, this step was performed using
two parallel round bottles flask at the same time. After the water bath had achieved 40 °C the
argon flow was stopped and the solvent removal was started under reduced pressure (250
mbar). The time of solvent evaporation to obtain a viscous gel varied between 2 h and 2 h 15
min. The slightly yellow gels obtained after solvent evaporation were dried in an oven at 40
°C in air atmosphere for 15 to 19 h. The aged materials were deposited as a thin layer on petri
dishes by using a spatula and placed in a desiccator. The air in the desiccator was exchanged
to ammonia and the solid material was treated at RT with ammonia for 18-22 h to allow the
TiO2 precipitation. The P123 surfactant was removed from the titania framework by treatment
of the solid material with boiling ethanol for 1h and the titania was separated from the
solution by centrifugation. This procedure was repeated 2 or 4 times. Afterwards the solid
material was dried in the oven at 60 °C. Finally, the obtained dried powder was heated from
22 to 450 °C within 6.5 h under argon flow (100 mL/min) followed by treatment under
oxygen flow (100 mL/min) for 2 h at 450 °C.

31
Single synthesis parameters were varied in order to obtain information about their influence
on structural characteristics of titania at different synthesis steps.
Surfactant/Ti-ratio
The synthesis of materials was carried out as described in the paragraph (2.1.2.1) but
using different amounts of Ti(OiPr)4. The amount of added Ti(OiPr)4 varied between 1.225 -
4.66 g leading to molar surfactant/Ti-ratios between 0.0105 and 0.04.
Extraction temperature
The synthesis of materials was carried out as described in the paragraph (2.1.2.1). The
amount of Ti(OiPr)4 was fixed to 3.016 g. P123 surfactant was removed from the titania
framework by treatment of the solid material in water bath at different temperatures (25, 60,
80, and 100 °C). For each extraction temperature, the identical synthesis procedure was
applied to obtain the material used for the extraction. The temperature inside the ethanol
solution was determined as 23, 53, 69, and 78 °C, respectively.
Titanium source
The synthesis of materials were carried out under the same conditions as described in
the paragraph (2.1.2.1) but different amounts of Ti(OnBu)4 (3.018, 3.61, and 4.18 g) were
added as titanium precursor instead of Ti(OiPr)4 in order to obtain molar surfactant/Ti ratios
of 0.0194, 0.0163, 0.014 respectively. In addition, the surfactant extraction step was repeated
2 times.
Synthesisofmetal‐dopedmesoporoustitania2.1.3
The synthesis was carried out under the same conditions as described in the paragraph
(2.1.2.1) with fixed Ti(OiPr)4 amount of 3.016 g. In order to synthesis 0.5 and 5 mol% metal -
doped TiO2 appropriate amounts of metals precursors (see Table 1) were added as solid to the
synthesis solution directly after addition of Ti(OiPr)4.
Table 1. Amount of metal source that was used in the synthesis of metal doped titania.
metal source 0.5 mol% metal 5 mol% metal
metal source mg
FeCl3 9.0 90.9 CoCl2·6H2O 12.7 132.8
NiCl2 6.9 72.3

32
Synthesisofnitrogen‐dopedmesoporoustitania2.1.4
In order to study titania crystallization in presence of gaseous ammonia titania synthesis
was stopped after surfactant extraction. The synthesis of amorphous titania (material obtained
after extraction) was described in the paragraph (2.1.2.1.). To obtain a sufficient amount of
amorphous titania, the synthesis was repeated several times followed by mixing of the single
fractions. Finally, the obtained mixture was divided in single fractions which were used for
study of thermally induced crystallization in ammonia-containing gas flow.
A flow sheet of the experimental set-up used for thermal treatment of the amorphous
mesoporous titania in ammonia atmosphere is shown in Figure 9. The quartz tube located in
an electrical heated furnace has an internal diameter of 1.6 cm. An open ceramic vessel was
placed inside the isothermal zone of the furnace which contained the titania. The ceramic
vessel was located on the ground of the tube. The amount for the single experiment varied
between 90 and 500 mg.
Figure 9. Schematic diagram showing experimental set up for treatment of amorphous mesoporous TiO2 with gaseous ammonia.
Experiments with different furnace temperatures
The amorphous TiO2 powder was heated from room temperature to the desired
temperature (350, 450, or 550 C) with a heating rate of 1.2 C/min in a pure NH3 flow of
30mL/min. After achieving the desired temperature, the product was kept in the NH3
atmosphere for another 0.5 h. After that time, nitrogen was switched on and ammonia was
switched off and the sample was slowly cooled down to room temperature under N2 flow. For
the temperature of 450 °C one attempt was carried out where the sample was treated in
ammonia for 4 h. An aliquot part of the material calcined under ammonia atmosphere was
N2
H2O
MFC
MFCNH3
syringe pump vaporizer
heated mixing chamber oven with
glass tube condenser
33
afterwards treated in an external tube oven under oxygen atmosphere (flow rate = 100
mL/min, heated from 25 to 450 C using a heating rate of 1.2 °C/min, treatment time: 2 h). In
an another experiment, the sample was treated firstly in oxygen atmosphere and afterwards in
ammonia atmosphere at 450 °C for 0.5 h in the same manner as described before. The
samples obtained at different heating temperatures were referred as N-TiO2-350NH3/O2, N-
TiO2-450NH3/O2 and N-TiO2-550NH3/O2.
Experiments with different heating rates
The amorphous TiO2 powder was heated from 25 °C to 450 C in NH3 flow (flow rate =
30 mL/min) with heating rates of 0.6, 1.2, 2.4 C/min, respectively. After achieving the final
temperature the material was kept in the gaseous NH3 atmosphere for another 0.5 h. Then, the
NH3 flow was replaced by a N2 flow. The sample was cooled down to RT under nitrogen
flow. One part of the powder was again treated with oxygen (flow rate = 100 mL/min) under
the same conditions as descripted before.
Experiments in presence of water
The amorphous TiO2 material was heated in a mixture of 10 mL/min NH3 and 20
mL/min N2 with a heating rate of 1.2 °C/min. After achieving 200 °C gaseous water was
introduced with a flow rate of 10 mL/min. After 210 min, the water and the NH3 flow were
stopped and the sample was cooled down under N2 flow.
In a further experiments, the sample was heated from 25 to 350 or 450 °C with a heating
rate of 1.2 C/min. Between RT and 200 °C the material was flushed with pure NH3 (10
mL/min). When the temperature had achieved 200 °C, the water flow was switched on (20
mL/min). After achieving the desired temperature (350 or 450 °C), the temperature was held
for another 30 min. Afterwards, the water and NH3 flow were switched off and the sample
was cooled down under N2 flow.
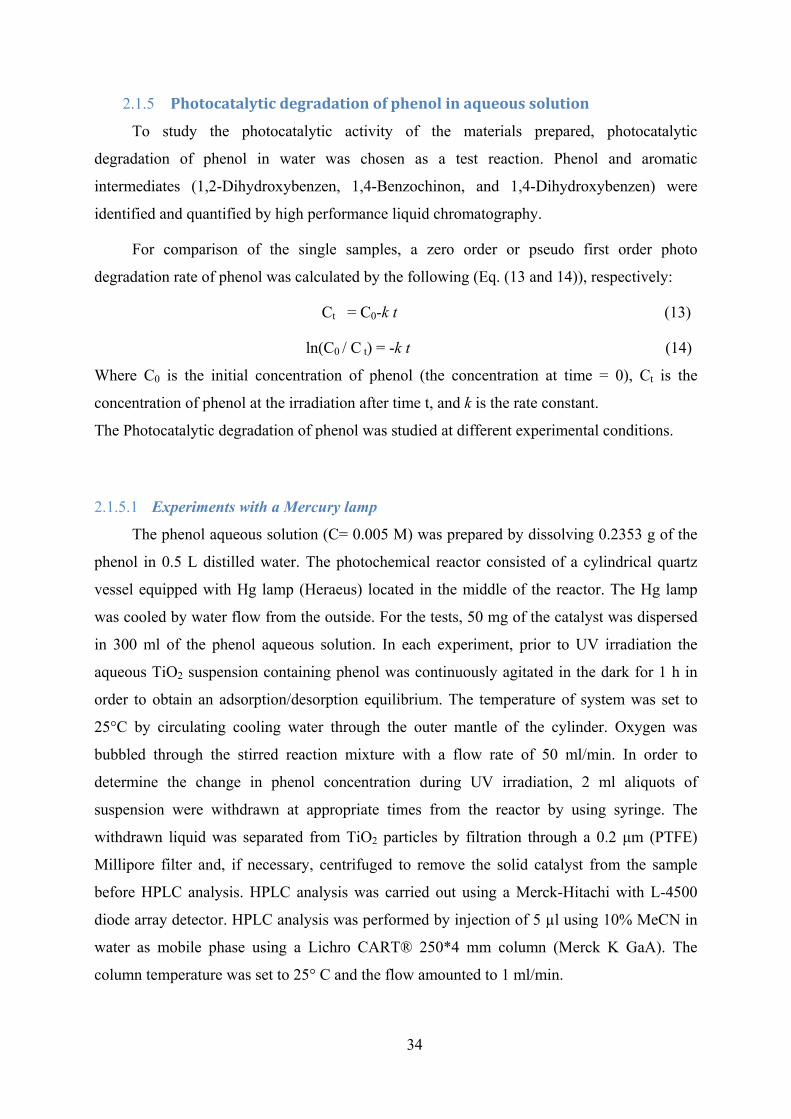
34
Photocatalyticdegradationofphenolinaqueoussolution2.1.5
To study the photocatalytic activity of the materials prepared, photocatalytic
degradation of phenol in water was chosen as a test reaction. Phenol and aromatic
intermediates (1,2-Dihydroxybenzen, 1,4-Benzochinon, and 1,4-Dihydroxybenzen) were
identified and quantified by high performance liquid chromatography.
For comparison of the single samples, a zero order or pseudo first order photo
degradation rate of phenol was calculated by the following (Eq. (13 and 14)), respectively:
Ct = C0-k t (13)
ln(C0 / C t) = -k t (14)
Where C0 is the initial concentration of phenol (the concentration at time = 0), Ct is the
concentration of phenol at the irradiation after time t, and k is the rate constant.
The Photocatalytic degradation of phenol was studied at different experimental conditions.
2.1.5.1 Experiments with a Mercury lamp
The phenol aqueous solution (C= 0.005 M) was prepared by dissolving 0.2353 g of the
phenol in 0.5 L distilled water. The photochemical reactor consisted of a cylindrical quartz
vessel equipped with Hg lamp (Heraeus) located in the middle of the reactor. The Hg lamp
was cooled by water flow from the outside. For the tests, 50 mg of the catalyst was dispersed
in 300 ml of the phenol aqueous solution. In each experiment, prior to UV irradiation the
aqueous TiO2 suspension containing phenol was continuously agitated in the dark for 1 h in
order to obtain an adsorption/desorption equilibrium. The temperature of system was set to
25°C by circulating cooling water through the outer mantle of the cylinder. Oxygen was
bubbled through the stirred reaction mixture with a flow rate of 50 ml/min. In order to
determine the change in phenol concentration during UV irradiation, 2 ml aliquots of
suspension were withdrawn at appropriate times from the reactor by using syringe. The
withdrawn liquid was separated from TiO2 particles by filtration through a 0.2 μm (PTFE)
Millipore filter and, if necessary, centrifuged to remove the solid catalyst from the sample
before HPLC analysis. HPLC analysis was carried out using a Merck-Hitachi with L-4500
diode array detector. HPLC analysis was performed by injection of 5 µl using 10% MeCN in
water as mobile phase using a Lichro CART® 250*4 mm column (Merck K GaA). The
column temperature was set to 25° C and the flow amounted to 1 ml/min.
35
2.1.5.2 Experiments with a Xenon lamp
The experiments were carried out in a 50 ml double jacket cylindrical glass reactor. The
solution was irradiated with a 1000 W Xenon lamp (LAX 1000) equipped with a 90°
deflection reflector system (MS 90) containing a dichroic mirror. The reactor was located in a
distance of 12 cm from the deflection reflector system. The lamp intensity reaching the
reactor was 105 mW/cm2. For experiments with a cut-of filter ( > 420 nm) the power
decreased to 80 mW/cm2. The reaction temperature was set to 25 °C by circulating cooling
water through an outer cooling mantle. Oxygen was fed to the bottom of the reactor by means
of a small tube with a flow rate of 10 ml/min. 30 mg of the catalyst were dispersed in 30 mL
of 0.0002 M phenol aqueous solution. Prior to exposure to the radiation, the TiO2 and phenol
containing suspension was stirred in the dark for 30 min. During irradiation with light, the
reaction mixture was continuously stirred to keep TiO2 particles in suspension. In order to
monitor phenol concentration during irradiation, 0.3 ml aliquots of the suspension were
regularly withdrawn from the reactor, filtrated from TiO2 particles and analyzed by HPLC.
Additionally, samples were withdrawn before and after stirring the suspension in dark in order
to account for phenol adsorbed on titania. HPLC analysis was performed on an Agilent
instrument equipped with a L-4500 diode array detector and a Lichro Rp-18 CART®
250*4 mm column (Merck K GaA). The injection volume was 5 µl. 10% MeCN in water was
used as a mobile phase and the flow rate was set to 1 ml/min. The analysis was performed at
25 °C.
Figure 10. Photos of the experimental set up used for the degradation of phenol with mesoporous titania using a) Mercury lamp and b) Xenon lamp.

36
2.2 Characterization
Different analysis and characterization techniques have been employed to characterize
and describe structural, morphological and physicochemical properties of synthesized
materials, which provide information about phase composition, crystallinity, crystallite size,
optical properties, surface structure, textural properties, morphology, and other characteristic
features. Moreover, they give information about the nature and chemical state of dopant.
These technique involve the small angle X-ray diffraction (SAXS), transmission electron
microscopy (TEM), X-ray diffraction (XRD), X-ray photoelectron spectroscopy (XPS),
electron paramagnetic resonance (EPR) spectroscopy, UV/visible diffuse reflectance spectra
(DRS), thermogravimetry (TG) and differential scanning calorimetry (DSC) and nitrogen
adsorption-desorption analysis. The procedure of each technique used in the current study is
briefly explained.
Small-angle X-ray scattering (SAXS) 2.2.1
SAXS measurements were carried out using a Kratky-type instrument (SAXSess, Anton
Paar, Austria) operated at 40 kV and 50 mA in slit collimation using a two-dimensional CCD
detector cooled to –40 °C or image plates digitalized with a Cyclone Plus (Perkin Elmer). A
Göbel mirror was used to convert a divergent polychromatic X-ray beam into a collimated
line-shaped beam of CuKα radiation (λ = 0.154 nm). Slit collimation of the primary beam was
aimed to increase the flux and to improve the signal quality. The sample cell consisted of a
metal body with two windows for the beam. The samples were sealed between two layers of
scotch® tape. Scattering profiles of the mesoporous materials were obtained by subtraction of
the detector current background and the scattering pattern of scotch® tape from the
experimental scattering patterns. The 2D scattering patterns were converted with SAXS Quant
software (Anton Paar) into one-dimensional scattering curves as a function of the magnitude
of the scattering vector q= (4/λ) sin (/2). Correction of the instrumental broadening effects
(smearing) was carried out with SAXS Quant software using the slit length profile determined
in a separate experiment. All SAXS measurements were carried out at 25 °C.
Transmission electron microscopy (TEM) 2.2.2
STEM measurements were performed in an aberration-corrected JEM-ARM200F
instrument (JEOL, Corrector: CEOS) operated at 200 kV. The microscope was equipped with
a JED-2300 (JEOL) energy dispersive X-ray spectrometer (EDXS). The aberration-corrected
STEM imaging (High-Angle Annular Dark Field (HAADF) and Annular Bright Field (ABF))
was performed under the following conditions. HAADF and ABF were both done with a spot
37
size of approximately 0.13 nm, a convergence angle of 30-36° and collection semi-angles for
HAADF and ABF of 90-170 mrad and 11-22 mrad, respectively. The samples were supported
on holey carbon Cu or Ni-grids (mesh 300) and transferred into the microscope without any
pretreatment.
Powder X-ray diffraction (XRD) 2.2.3
XRD powder patterns were recorded either on a Panalytical X'Pert diffractometer
equipped with a Xcelerator detector or on a Panalytical Empyrean diffractometer equipped
with a PIXcel 3D detector system both used with automatic divergence slits and Cu Kα1/α2
radiation (40 kV, 40 mA; λ = 0.015406 nm, 0.0154443 nm). Cu beta-radiation was excluded
by using nickel filter foil. The measurements were performed in 0.0167° steps and 25 s of
data collecting time per step. Phase analysis was done with the Panalytical HighScore Plus
software package using the PDF-2 2015 database of the International Center of Diffraction
Data (ICDD).
The crystallite sizes were calculated by applying the Scherrer equation (Eq. (15)) and
the usage of the integral breadth under the assumption of spherically shaped crystallites.
D= Kλ/β cos θ (15)
K is set to 1.0747, λ is the x-ray wavelength (λ= 0.015406 nm, 0.0154443 nm) for
(CuKα1 Kα2 radiation), β is Integral breadth in radians (area peak/Int. peak), θ is the angle in
radians. An average value of the calculated sizes of diffraction peaks between 20 ≤ 2θ ≤ 50° is
presented here.
X-ray photoelectron spectroscopy (XPS) 2.2.4
The oxidation states and the surface compositions were deter-mined by X-ray
photoelectron spectroscopy (XPS). The measurements were performed with an ESCALAB
220iXL (ThermoFisherScientific) with monochromatic Al K radiation (E = 1486.6 eV). The
samples were fixed on a stainless steel sample holder with double adhesive carbon tape. For
charge compensation a flood gun was used, the spectra were referenced to the C1s peak at
284.8 eV. The error range for the determination of the electron binding energy is
approximately ±0.2 eV. After background subtraction the peaks were fitted with Gaussian–
Lorentzian curves to determine the positions and the areas of the peaks. The surface
composition was calculated from the peak areas divided by the element- specific Scofield
factor and the transmission function of the spectrometer.
38
N2 physisorption measurement 2.2.5
Nitrogen adsorption-desorption isotherms were collected at –196 °C on BELSORP-mini
II (BEL Japan, Inc.). The specific surface area (BET) and pore size distribution were
calculated from the adsorption and desorption branches of the isotherm, respectively,
applying the Brunauer, Emmet and Teller equation for the N2 relative pressure range of 0.05 <
P/P0 < 0.3 and the BJH method for the pressure range of 0.3 < P/P0 < 0.99. Some samples
were measured by the apparatus ASAP 2020 (USA). The samples were pretreatment before
measure by heating to 200 °C.
UV-Vis spectroscopy (UV/Vis) 2.2.6
UV/Vis spectra were measured using the UV-Visible spectrometer of the type AvaSpec-
2048 Fiber-Optic Spectrometer (Avantes) using the FCR7UV-400-400-2-Me-HT Fiber optic
and pure barium sulphate BaSO4 powder as white reflection standard of referencing.
The optical band gap (BG) energies values of un-doped and doped mesoporous TiO2
were calculated from the Tauc’s plot [138], which shows the relationship between
(F(R)·hv)1/2 and hv for indirect transition. F(R) is the Kubelka-Munk function derived from
reflectance spectra where F(R) = (1-R)2/2R and hv is the photon energy. Plotting (F(R)·hv)1/2
against hv based on the spectral response.
Electron paramagnetic resonance (EPR) 2.2.7
EPR spectra were measured at 300 K on a Bruker EMX CW-micro X-band
spectrometer (ν9.8 GHz) with a microwave power of 6.9 mW, a modulation frequency of
100 kHz and modulation amplitude up to 5 G.
Attenuated total reflection infraredspectroscopy(ATR‐IR)2.2.8
ATR-IR spectra were acquired using an ALPHA FTIR-spectrometer from Bruker. The
data collection consisted of 64 scans per spectrum with a resolution of 4 cm-1. The
mesoporous titania powder was deposited on the ATR-crystal without any further
pretreatment.
Thermogravimetric analyses (TGA) and differential scanning calorimetry 2.2.9
(DSC) measurements
Thermogravimetric analyses (TGA) and differential scanning calorimetry (DSC)
measurements were performed simultaneously on a Netzsch STA 449 F3 Jupiter device in the
temperature range of 25-500 °C with heating rates of 10 or 20 K/min in nitrogen or
compressed air atmosphere, respectively.
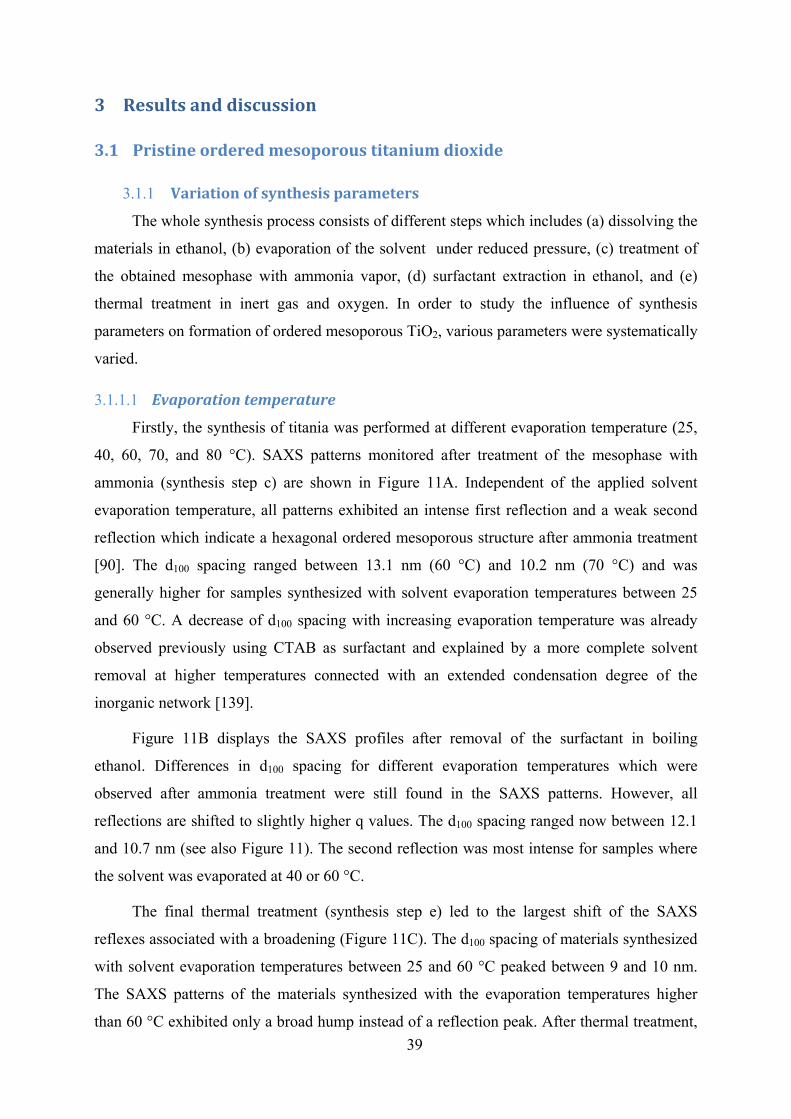
39
3 Resultsanddiscussion
3.1 Pristineorderedmesoporoustitaniumdioxide
Variationofsynthesisparameters3.1.1
The whole synthesis process consists of different steps which includes (a) dissolving the
materials in ethanol, (b) evaporation of the solvent under reduced pressure, (c) treatment of
the obtained mesophase with ammonia vapor, (d) surfactant extraction in ethanol, and (e)
thermal treatment in inert gas and oxygen. In order to study the influence of synthesis
parameters on formation of ordered mesoporous TiO2, various parameters were systematically
varied.
3.1.1.1 Evaporationtemperature
Firstly, the synthesis of titania was performed at different evaporation temperature (25,
40, 60, 70, and 80 °C). SAXS patterns monitored after treatment of the mesophase with
ammonia (synthesis step c) are shown in Figure 11A. Independent of the applied solvent
evaporation temperature, all patterns exhibited an intense first reflection and a weak second
reflection which indicate a hexagonal ordered mesoporous structure after ammonia treatment
[90]. The d100 spacing ranged between 13.1 nm (60 °C) and 10.2 nm (70 °C) and was
generally higher for samples synthesized with solvent evaporation temperatures between 25
and 60 °C. A decrease of d100 spacing with increasing evaporation temperature was already
observed previously using CTAB as surfactant and explained by a more complete solvent
removal at higher temperatures connected with an extended condensation degree of the
inorganic network [139].
Figure 11B displays the SAXS profiles after removal of the surfactant in boiling
ethanol. Differences in d100 spacing for different evaporation temperatures which were
observed after ammonia treatment were still found in the SAXS patterns. However, all
reflections are shifted to slightly higher q values. The d100 spacing ranged now between 12.1
and 10.7 nm (see also Figure 11). The second reflection was most intense for samples where
the solvent was evaporated at 40 or 60 °C.
The final thermal treatment (synthesis step e) led to the largest shift of the SAXS
reflexes associated with a broadening (Figure 11C). The d100 spacing of materials synthesized
with solvent evaporation temperatures between 25 and 60 °C peaked between 9 and 10 nm.
The SAXS patterns of the materials synthesized with the evaporation temperatures higher
than 60 °C exhibited only a broad hump instead of a reflection peak. After thermal treatment,
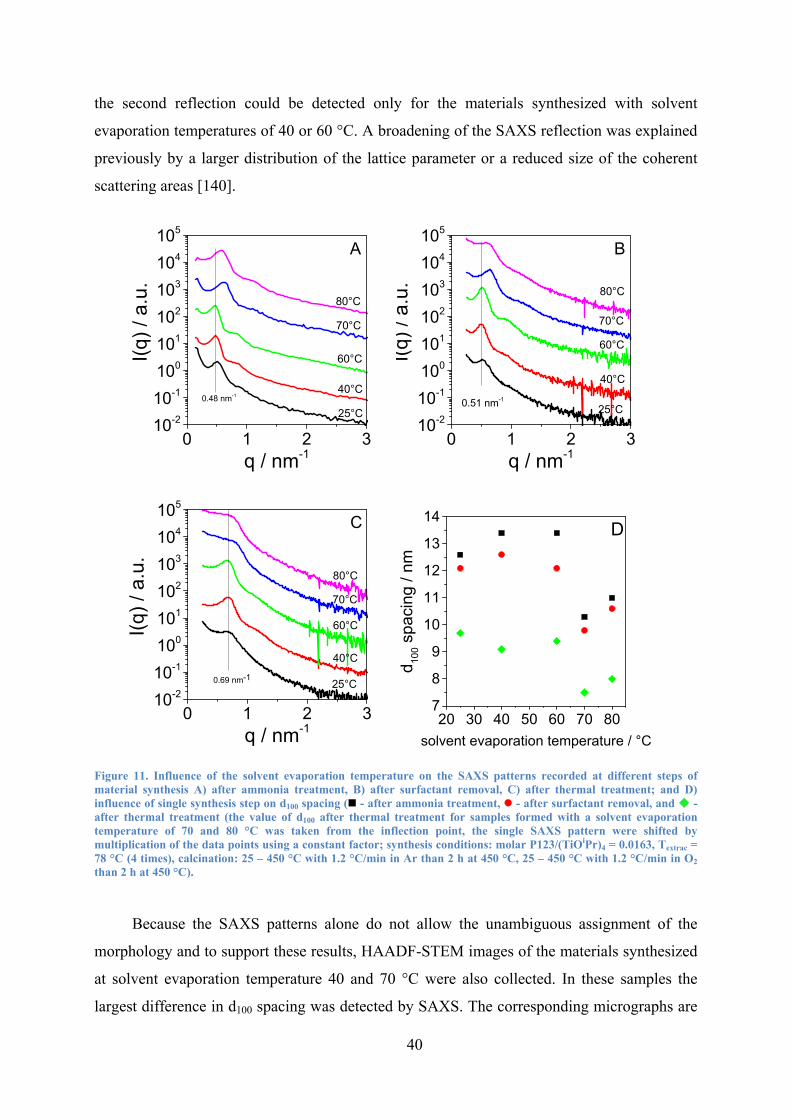
40
the second reflection could be detected only for the materials synthesized with solvent
evaporation temperatures of 40 or 60 °C. A broadening of the SAXS reflection was explained
previously by a larger distribution of the lattice parameter or a reduced size of the coherent
scattering areas [140].
0 1 2 310-2
10-1
100
101
102
103
104
105
80°C
0.48 nm-1
70°C
60°C
40°C
I(q) /
a.u
.
q / nm-1
25°C
A
0 1 2 310-2
10-1
100
101
102
103
104
105
80°C
0.51 nm-1
70°C
60°C
40°C
I(q) /
a.u
.
q / nm-1
25°C
B
0 1 2 310-2
10-1
100
101
102
103
104
105
80°C
0.69 nm-1
70°C
60°C
40°C
I(q) /
a.u
.
q / nm-1
25°C
C
20 30 40 50 60 70 807
8
9
10
11
12
13
14
d 100 s
paci
ng /
nm
solvent evaporation temperature / °C
D
Figure 11. Influence of the solvent evaporation temperature on the SAXS patterns recorded at different steps of material synthesis A) after ammonia treatment, B) after surfactant removal, C) after thermal treatment; and D) influence of single synthesis step on d100 spacing ( - after ammonia treatment, - after surfactant removal, and - after thermal treatment (the value of d100 after thermal treatment for samples formed with a solvent evaporation temperature of 70 and 80 °C was taken from the inflection point, the single SAXS pattern were shifted by multiplication of the data points using a constant factor; synthesis conditions: molar P123/(TiOiPr)4 = 0.0163, Textrac = 78 °C (4 times), calcination: 25 – 450 °C with 1.2 °C/min in Ar than 2 h at 450 °C, 25 – 450 °C with 1.2 °C/min in O2 than 2 h at 450 °C).
Because the SAXS patterns alone do not allow the unambiguous assignment of the
morphology and to support these results, HAADF-STEM images of the materials synthesized
at solvent evaporation temperature 40 and 70 °C were also collected. In these samples the
largest difference in d100 spacing was detected by SAXS. The corresponding micrographs are
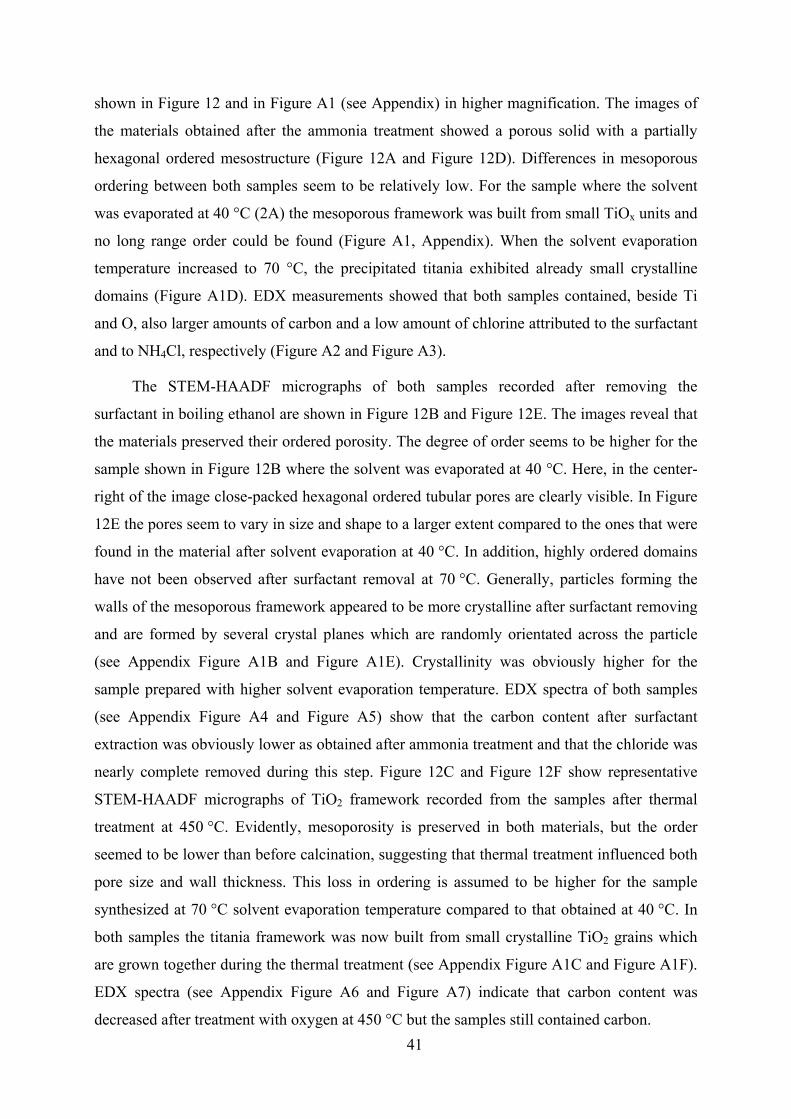
41
shown in Figure 12 and in Figure A1 (see Appendix) in higher magnification. The images of
the materials obtained after the ammonia treatment showed a porous solid with a partially
hexagonal ordered mesostructure (Figure 12A and Figure 12D). Differences in mesoporous
ordering between both samples seem to be relatively low. For the sample where the solvent
was evaporated at 40 °C (2A) the mesoporous framework was built from small TiOx units and
no long range order could be found (Figure A1, Appendix). When the solvent evaporation
temperature increased to 70 °C, the precipitated titania exhibited already small crystalline
domains (Figure A1D). EDX measurements showed that both samples contained, beside Ti
and O, also larger amounts of carbon and a low amount of chlorine attributed to the surfactant
and to NH4Cl, respectively (Figure A2 and Figure A3).
The STEM-HAADF micrographs of both samples recorded after removing the
surfactant in boiling ethanol are shown in Figure 12B and Figure 12E. The images reveal that
the materials preserved their ordered porosity. The degree of order seems to be higher for the
sample shown in Figure 12B where the solvent was evaporated at 40 °C. Here, in the center-
right of the image close-packed hexagonal ordered tubular pores are clearly visible. In Figure
12E the pores seem to vary in size and shape to a larger extent compared to the ones that were
found in the material after solvent evaporation at 40 °C. In addition, highly ordered domains
have not been observed after surfactant removal at 70 °C. Generally, particles forming the
walls of the mesoporous framework appeared to be more crystalline after surfactant removing
and are formed by several crystal planes which are randomly orientated across the particle
(see Appendix Figure A1B and Figure A1E). Crystallinity was obviously higher for the
sample prepared with higher solvent evaporation temperature. EDX spectra of both samples
(see Appendix Figure A4 and Figure A5) show that the carbon content after surfactant
extraction was obviously lower as obtained after ammonia treatment and that the chloride was
nearly complete removed during this step. Figure 12C and Figure 12F show representative
STEM-HAADF micrographs of TiO2 framework recorded from the samples after thermal
treatment at 450 °C. Evidently, mesoporosity is preserved in both materials, but the order
seemed to be lower than before calcination, suggesting that thermal treatment influenced both
pore size and wall thickness. This loss in ordering is assumed to be higher for the sample
synthesized at 70 °C solvent evaporation temperature compared to that obtained at 40 °C. In
both samples the titania framework was now built from small crystalline TiO2 grains which
are grown together during the thermal treatment (see Appendix Figure A1C and Figure A1F).
EDX spectra (see Appendix Figure A6 and Figure A7) indicate that carbon content was
decreased after treatment with oxygen at 450 °C but the samples still contained carbon.

42
Figure 12. HAADF-STEM images of the material where the solvent was evaporated at 40 °C (A,B,C) and 70 °C (D,E,F), respectively; (A,D) after treatment of the sol with ammonia, (B,E) after surfactant extraction, and (C,F) after thermal treatment; (synthesis conditions: molar P123/(TiOiPr)4 = 0.0163, Textrac = 78 °C (4 times), calcination: 25 – 450 °C with 1.2 °C/min in Ar than 2 h at 450 °C, 25 – 450 °C with 1.2 °C/min in O2 than 2 h at 450 °C).
EB
C
DA
F

43
XRD powder patterns of the materials obtained after thermal treatment (C) are
presented in Figure 13. XRD patterns of these materials showed intense reflections of anatase
TiO2 (ICDD 03-065-5714) together with minor reflections attributed to β-TiO2 (ICDD 00-
035-0088) independent of the temperature used for solvent evaporation. Rietveld refinement
was applied to analyze the diffraction data quantitatively. The anatase content varied between
73 and 80%, however, an influence of the solvent evaporation temperature on phase
composition could not be derived. The average domain size of crystal synthesis parameters
after calcination determined by the Scherrer equation increased with rising evaporation
temperature from 3.9 (25 °C) to 5.4 nm (80 °C) (see Table 2).
10 20 30 40 50 60 70 80
beta TiO2
+
+
++ ++
+ +
70°C
80°C
60°C
40°Cinte
nsity
/ a.
u.
2theta / grd
25°C
+
anatase
Figure 13. XRD powder patterns of samples synthesized with different evaporation temperature thermal treatment (synthesis conditions: molar P123/(TiOiPr)4 = 0.0163, Textrac = 78 °C (4 times calcination: 25 – 450 °C with 1.2 °C/min in Ar than 2 h at 450 °C, 25 – 450 °C with 1.2 °C/min in O2 than 2 h at 450 °C)).
N2 sorption isotherms and respective pore size distributions of the materials obtained
after thermal treatment are presented in Figure 14. All isotherms can be described as type IV
which is typical for mesoporous materials [141]. Moreover, all samples showed a H2-type
hysteresis loop which is regarded as a sign of interconnection between pores [141] or
explained by the existence of mesoscale disorder [142]. Textural parameters derived from N2
adsorption/desorption experiments by BET and BJH methods are listed in Table 2. During
thermal treatment BET surface decreases considerably as shown in Table 2. The BET surface
of the calcined samples varied between 147 and 202 m2/g. The highest BET surface was
observed at the samples prepared with solvent evaporation at 40 or 60 °C. In these samples
also the largest pore volume was calculated from the sorption data. The BET surface dropped
significantly when the solvent evaporation was carried out at 70 or 80 °C. Solvent evaporation
temperature also had an effect on pore size distribution. The average pore diameter rises upon
increasing solvent evaporation temperature from 3.8 (25 °C) to about 5.7 nm (70 °C). The
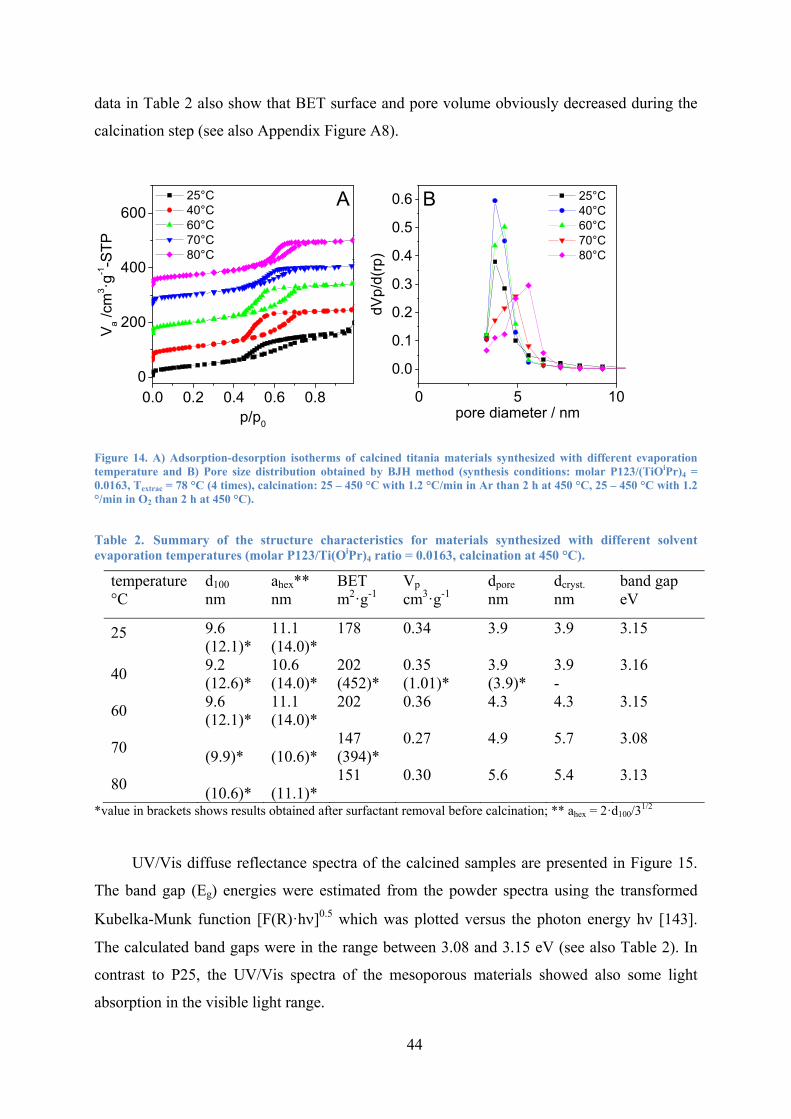
44
data in Table 2 also show that BET surface and pore volume obviously decreased during the
calcination step (see also Appendix Figure A8).
0.0 0.2 0.4 0.6 0.80
200
400
600
V a /cm
3 ·g-1-S
TP
25°C 40°C 60°C 70°C 80°C
p/p0
A
0 5 10
0.0
0.1
0.2
0.3
0.4
0.5
0.6
dVp/
d(rp
)
pore diameter / nm
25°C 40°C 60°C 70°C 80°C
B
Figure 14. A) Adsorption-desorption isotherms of calcined titania materials synthesized with different evaporation temperature and B) Pore size distribution obtained by BJH method (synthesis conditions: molar P123/(TiOiPr)4 = 0.0163, Textrac = 78 °C (4 times), calcination: 25 – 450 °C with 1.2 °C/min in Ar than 2 h at 450 °C, 25 – 450 °C with 1.2 °/min in O2 than 2 h at 450 °C).
Table 2. Summary of the structure characteristics for materials synthesized with different solvent evaporation temperatures (molar P123/Ti(OiPr)4 ratio = 0.0163, calcination at 450 °C).
temperature °C
d100 nm
ahex** nm
BET m2·g-1
Vp
cm3·g-1 dpore nm
dcryst. nm
band gap eV
25 9.6 (12.1)*
11.1 (14.0)*
178
0.34
3.9
3.9 3.15
40 9.2 (12.6)*
10.6 (14.0)*
202 (452)*
0.35 (1.01)*
3.9 (3.9)*
3.9 -
3.16
60 9.6 (12.1)*
11.1 (14.0)*
202
0.36
4.3
4.3 3.15
70 (9.9)*
(10.6)*
147 (394)*
0.27
4.9
5.7 3.08
80 (10.6)*
(11.1)*
151
0.30
5.6
5.4 3.13
*value in brackets shows results obtained after surfactant removal before calcination; ** ahex = 2·d100/31/2
UV/Vis diffuse reflectance spectra of the calcined samples are presented in Figure 15.
The band gap (Eg) energies were estimated from the powder spectra using the transformed
Kubelka-Munk function [F(R)·h]0.5 which was plotted versus the photon energy h [143].
The calculated band gaps were in the range between 3.08 and 3.15 eV (see also Table 2). In
contrast to P25, the UV/Vis spectra of the mesoporous materials showed also some light
absorption in the visible light range.

45
200 400 600 8000.0
0.5
1.0
1.5
abso
rban
ce /
a.u.
/ nm
P25 25°C 40°C 60°C 70°C 80°C
Figure 15. UV/Vis Spectra of samples synthesized with different solvent evaporation temperature after thermal treatment.
The visible light absorption might be attributed to the presence of carbon residuals
originating from residuals of the titanium precursor and/or the surfactant which remain(s) in
the sample despite the final treatment with oxygen. To prove this assumption the sample
synthesized with solvent evaporation temperature at 60 °C was investigated by XPS. The
corresponding XPS spectra are shown in Figure 16. XPS analysis indicated to presence of
both carbon residuals and nitrogen on titania surface. This was surprising because nitrogen
was not mentioned in previous reports using the applied synthesis method [89, 90]. Probably,
the nitrogen was introduced by the titania precipitation step as adsorbed ammonia or the
formed ammonium chloride was not completely removed during the treatment with boiling
ethanol. Doping of titania by addition of ammonium chloride to the synthesis mixture was
already reported previously for synthesis of iron-nitrogen doped titania nanoparticles [144].
XPS spectra of the N(1s) region showed peaks located at 399.5 and 400.7 eV indicating the
presence of O-Ti-N and Ti-N-O bonds, respectively [145]. The main peak in the C(1s) spectra
was located at 284.4 eV and could be assigned as carbon residues from the carbon sources
[146]. The total nitrogen and carbon content was very low and below the detection limit of the
H, C, N analyzer (nitrogen 0.02 wt.%, carbon 0.002 wt.%) where only hydrogen was detected
in the range between 0.24 – 0.40 wt.%. It was postulated that carbon residues from the P123
surfactant were removed from the mesoporous titania below 400 °C [147]. However, total
elimination of organic carbon residues from titania surface proceeds at temperatures much
higher as applied for calcination (700 °C or higher) [148].

46
Finally, the characterization results showed that the temperature of solvent evaporation
had affected the structural characteristics of the finally obtained material. It was clear that the
best evaporation temperatures were 40 and 60 °C.
404 402 400 398 396 394
BE: 399.5 eV
inte
nsity
/ a.
u.
binding energy / eV
BE: 400.7 eV
N1s A
292 290 288 286 284 282 280
BE: 284.4 eV
inte
nsity
/ a.
u.
binding energy / eV
BE: 288.1 eV
C1s B
Figure 16. High resolution XPS spectra from calcined material synthesized with solvent evaporation temperature of 60 °C A) N 1s and B) C1s.
In order to investigate in which extent the structural parameters varied at repeated
synthesis under approximately identical synthesis parameters, the titania synthesis was
repeated with an evaporation temperature at 40 °C several times. Figure 17 compares the
SAXS pattern of these materials after ammonia treatment, after surfactant extraction and after
calcination. All SAXS patterns after ammonia treatment exhibited an intense first reflection
and a weak second reflection which indicate a hexagonal ordered mesoporous structure.
Slight differences were observed in the position of reflection peak maximum (Figure 17A).
The removal of surfactant did not lead to a clear change of the shape of the SAXS pattern.
The surfactant extraction shifted the position of all reflections to slightly larger q values.
(Figure 17B). However, clear differences in SAXS pattern were obtained after the thermal
treatment. In some samples the mesoporous ordering was still there, in other samples the
mesoporous ordering was lost (Figure 17C). At the same time, BET surface area varied
strongly (232.5, 223, 202, 182, 181, 168, 166, and 155 m2/g). Otherwise, the phase
composition in all material was comparable. Until now, the reasons for the structural
differences of the materials synthesized at nearly identical conditions are still unclear.

47
0 1 2 3 4 510-2
10-1
100
101
102
103
104
I(q) /
a.u
.
q / nm-1
q = 0.49 nm-1 A
0 1 2 3 4 510-2
10-1
100
101
102
103
104
I(q) /
a.u
.
q / nm-1
q = 0.52 nm-1 B
0 1 2 3 4 510-2
10-1
100
101
102
103
104
I(q) /
a.u
.
q / nm-1
Cq = 0.68 nm-1
Figure 17. Influence of the repetition of synthesis mesoporous TiO2 on the SAXS patterns A) after ammonia treatment, B) after surfactant removal, C) after thermal treatment.(molar P123/(TiOiPr)4 = 0.0163, Tevap = 40 °C, Textrac = 78 °C (4 times), calcination: 25 – 450 °C with 1.2 °C/min in Ar than 2 h at 450 °C, 25 – 450 °C with 1.2 °C/min in O2 than 2 h at 450 °C).
The degree of order of the material obtained after calcination might be influenced from
the mesoporous structure obtained after evaporation step as indicated by the small differences
of SAXS pattern of precipitation of titania with ammonia. Only those materials with highest
degree of order after ammonia treatment might conserve the ordered structure after thermal
treatment.
Furthermore, it was investigated whether ordered mesoporous titania can be synthesized
without gel aging. For that reason, the gel obtained after solvent evaporation was treated with
ammonia directly after finishing this process. In all other studies presented in this work, the
aging time of the gel was between 15 and 19 h. SAXS patterns of the samples without gel
aging obtained after surfactant extraction and after calcination are presented in Figure 18. The
pattern shows that hexagonal ordered mesoporous TiO2 can be synthesized without the aging

48
step. BET surface area of the calcined sample was high (221 m2/g) and the results supports
conclusion derived from SAXS. Also TiO2 phase composition was not influenced by gel
aging time. The finding that ordered mesoporous TiO2 can be synthesized without gel aging
will shorten the time for the synthesis process considerably.
0 1 2 3 4 51E-4
1E-3
0.01
0.1
1
10
I(q) /
a.u
.
q / nm-1
after extraction after calcination
Figure 18. SAXS pattern of the sample synthesized without gel aging time of 15 h.(molar P123/(TiOiPr)4 = 0.0163, Tevap = 40 °C, Textrac = 78 °C (2 times), calcination: 25 – 450 °C with 1.2 °/min in Ar than 2 h at 450 °C, 25 – 450 °C with 1.2 °C/min in O2 than 2 h at 450 °C).
3.1.1.2 Surfactantextractionconditions
In order to investigate the influence of surfactant extraction on the ordering of
mesostructure, mesopoures titania was prepared using different temperatures and different
repetitions of surfactant extraction. At first, titania synthesis with and without surfactant
extraction was performed. The material with surfactant extraction was referred as TiO2-E and
that without extraction was referred as TiO2-W. The SAXS pattern in Figure 19A showed a
mesoporous ordering of the material obtained ammonia treatment. When the surfactant was
extracted before calcination, the position of the d100 reflection was shifted to higher q-values.
The presence of the d100 reflection proves that the material contains ordered mesoporous
domains. For the material prepared without surfactant extraction, the intensity of the SAXS
pattern decreases with increasing q values nearly continuously. This indicates that for the
material prepared without surfactant extraction the mesoporous ordering was destroyed during
the thermal treatment which lead to a disordered structure. This result agrees with a study
presented by Dai eta al. [149]. From Nitrogen adsorption–desorption measurements (Figure
19B), it can be seen that the samples exhibit a type IV isotherm, and H2 type hysteresis
characteristic of mesoporous materials according to the IUPAC classification [141]. The
inflection of isotherm and its sharpness is reduced and shift toward P/P0 0.5 for the sample

49
TiO2-W and was found to be 0.4 for the sample TiO2-E. The surface areas of the prepared
samples TiO2-W and TiO2-E are 180.9 and 232.5 m2/g, respectively. This means the removal
of the surfactant leads to an increase in surface area. The average pore diameter was
determined by using the BJH method and was found to be 7.3 nm for TiO2-W and 5.6 nm for
TiO2-E, respectively. Calcination of TiO2-W led to structural collapse during heating. It is
assumed that the template burn rapidly (explode) in the pores. This led to rip apart and
collapse of the ordered structure. The collapse of the pores might be also responsible for the
decrease in BET surface area.
0.0 0.5 1.0 1.5 2.0 2.5 3.01E-3
0.01
0.1
1
q / nm-1
I(q) /
a.u
.
NH3 TiO2-W TiO2-E
A
0.0 0.2 0.4 0.6 0.8 1.00
50
100
150
200
Va/c
m^3
(STP
) g^-
1
Relative pressure p/p0
TiO2-W TiO2-E
B
Figure 19. A) SAXS patterns and B) Nitrogen adsorption–desorption isotherms for the powders without surfactant P123 extraction (TiO2-W) and with surfactant P123 extraction (TiO2-E); (synthesis conditions: molar P123/(TiOiPr)4 = 0.0163, Tevap = 40 °C, Textrac = 78 °C (4 times), calcination: 25 – 450 °C with 1.2 °C/min in Ar than 2 h at 450 °C, 25 – 450 °C with 1.2 °C/min in O2 than 2 h at 450 °C).
To obtain more information about the surfactant removal step, simultaneous TG and
DSC measurements were carried out before and after extraction. In Figure 20A, TG/DSC
curves are presented for the sample before extraction. There, mass loss starts above 100 ºC
with an endothermic event, and ends slightly above 300 ºC with a sharp exothermic event,
which can be assigned to evaporating and burning of polymer P123 [150, 151], yielding a
total weight loss of about 64.5%. In Figure 20B(a-d), TG/DSC curves are shown for the
materials prepared with one, two, three or four extractions. Weight losses of about 21.9, 19.8,
18.8, and 18.0 %, respectively, can be observed. Mass loss starts always at temperatures
between 100–150 ºC with endothermic phenomena, which was be assigned to evaporation of
water and organic solvent [152].
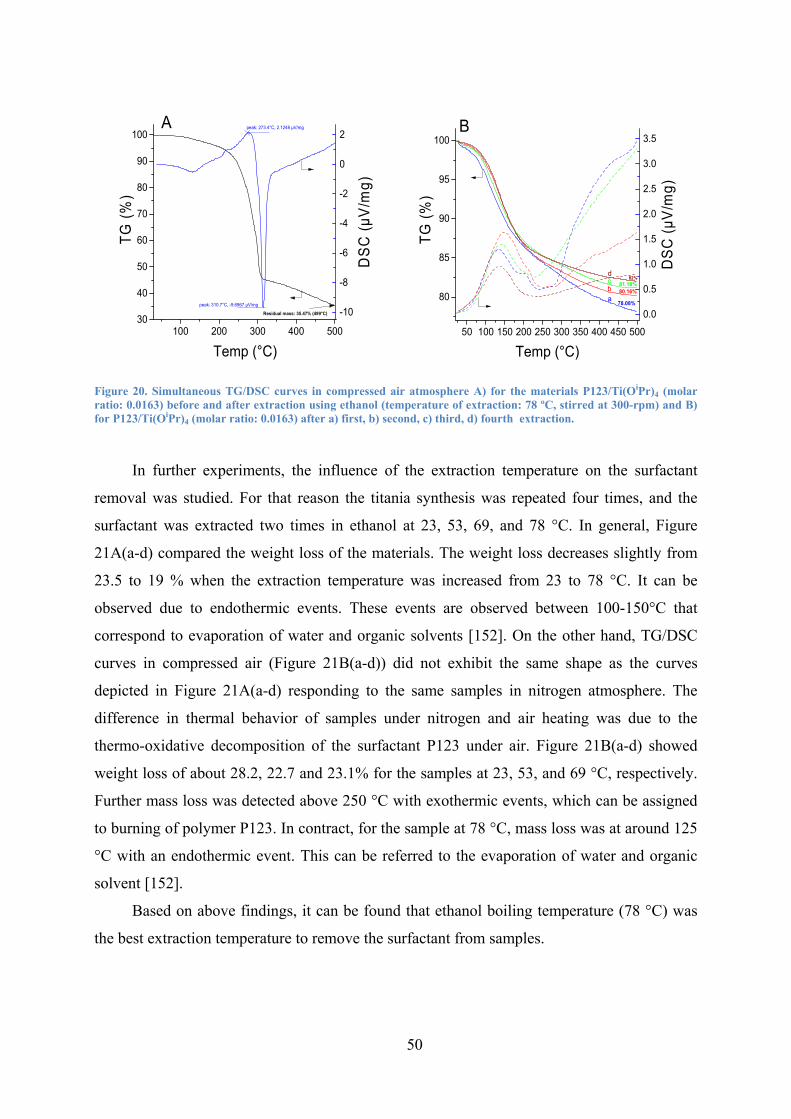
50
100 200 300 400 50030
40
50
60
70
80
90
100
peak: 310.7°C, -9.6967 µV/mg
TG (%
)
Temp (°C)
Residual mass: 35.47% (499°C)
peak: 273.4°C, 2.1248 µV/mg
-10
-8
-6
-4
-2
0
2
DSC
(µV/
mg)
A
50 100 150 200 250 300 350 400 450 500
80
85
90
95
100
82% 81.18% 80.16%
TG (%
)
Temp (°C)
78.08%
B
0.0
0.5
1.0
1.5
2.0
2.5
3.0
3.5
DSC
(µV/
mg)
abcd
Figure 20. Simultaneous TG/DSC curves in compressed air atmosphere A) for the materials P123/Ti(OiPr)4 (molar ratio: 0.0163) before and after extraction using ethanol (temperature of extraction: 78 ºC, stirred at 300-rpm) and B) for P123/Ti(OiPr)4 (molar ratio: 0.0163) after a) first, b) second, c) third, d) fourth extraction.
In further experiments, the influence of the extraction temperature on the surfactant
removal was studied. For that reason the titania synthesis was repeated four times, and the
surfactant was extracted two times in ethanol at 23, 53, 69, and 78 °C. In general, Figure
21A(a-d) compared the weight loss of the materials. The weight loss decreases slightly from
23.5 to 19 % when the extraction temperature was increased from 23 to 78 °C. It can be
observed due to endothermic events. These events are observed between 100-150°C that
correspond to evaporation of water and organic solvents [152]. On the other hand, TG/DSC
curves in compressed air (Figure 21B(a-d)) did not exhibit the same shape as the curves
depicted in Figure 21A(a-d) responding to the same samples in nitrogen atmosphere. The
difference in thermal behavior of samples under nitrogen and air heating was due to the
thermo-oxidative decomposition of the surfactant P123 under air. Figure 21B(a-d) showed
weight loss of about 28.2, 22.7 and 23.1% for the samples at 23, 53, and 69 °C, respectively.
Further mass loss was detected above 250 °C with exothermic events, which can be assigned
to burning of polymer P123. In contract, for the sample at 78 °C, mass loss was at around 125
°C with an endothermic event. This can be referred to the evaporation of water and organic
solvent [152].
Based on above findings, it can be found that ethanol boiling temperature (78 °C) was
the best extraction temperature to remove the surfactant from samples.

51
50 100 150 200 250 300 350 400 450 50075
80
85
90
95
100
a: extraction at 23° Cb: extraction at 53° Cc: extraction at 69° Cd: extraction at 78° C
c
ab 78.27%
76.49%
79.39%
TG (%
)
Temp (°C)
80.16% d
A
0.0
0.2
0.4
0.6
0.8
1.0
1.2
1.4
1.6
1.8
DSC
(µV/
mg)
50 100 150 200 250 300 350 400 450 50070
75
80
85
90
95
100
c
a
b 77.32%
71.77%
76.86%
TG (%
)
Temp (°C)
80.16% d
a: extraction at 23° Cb: extraction at 53° Cc: extraction at 69° Cd: extraction at 78° C
-7
-6
-5
-4
-3
-2
-1
0
1
DSC
(µV/
mg)
B
Figure 21. Simultaneous TG-DSC curves of the material molar ratio P123/Ti(OiPr)4 (molar ratio: 0.0163) after two extraction at different temperatures, A(a-d): under N2 and 19B(a-d): air atmosphere.
To investigate the influence of extraction temperature on mesoporous ordering, the
calcined samples were characterized by SAXS (Figure 22A). SAXS pattern indicate an
improvement of mesoporous ordering with increasing extraction temperature. Surfactant
extraction temperature of 23 °C seems to be low because similar SAXS profile as without
surfactant extraction was obtained. This pattern indicates the presence of a disordered
structure after thermal treatment.
0 1 2 3 4 51E-7
1E-6
1E-5
1E-4
1E-3
0.01
0.1
1
I(q) /
a.u
.
q / nm-1
23°C 53°C 69°C 78°C
A
0.0 0.2 0.4 0.6 0.8 1.00
50
100
150
200
250
300
350
Va/c
m^3
(STP
) g^-
1
p/p0
23°C 53°C 69°C 78°C
B
Figure 22. A) SAXS patterns and B) Nitrogen adsorption–desorption isotherms of the materials after calcination prepared with different extraction temperatures (synthesis conditions: molar P123/(TiOiPr)4 = 0.0163, Tevap = 40 °C (4 times), calcination: 25 – 450 °C with 1.2 °C/min in Ar than 2 h at 450 °C, 25 – 450 °C with 1.2 °C/min in O2 than 2 h at 450 °C).
The nitrogen adsorption–desorption isotherms of these samples are shown in Figure
22B. The isotherms can be classified as type IV, typical for mesoporous materials according
to the IUPAC nomenclature [141]. The calculated BET surface areas and pore diameter are

52
listed in Table 3. As can be seen in Table 3, BET surface area increases with rising extraction
temperature. The sample at 78 ºC extraction temperature exhibit the highest surface area (202
m2/g) compared to 97 m2/g measured for the sample where the surfactant was extracted at 23
ºC. The crystallite size of the samples ranged from 3.86 to 7.41 nm. In general, crystallite size
with surfactant extraction between 53 and 78 °C was comparable and increased considerably
when the surfactant was extracted at 23 °C. The higher amount of surfactant maintaining in
the titania after extraction at 23 °C might be the reason for the observed differences in BET
surface and the loss of mesoporous ordering as already observed previously for TiO2-W
sample.
Table 3. Summary of the structure characteristics for materials synthesized with different solvent evaporation temperatures (molar P123/Ti(OiPr)4 ratio = 0.0163, calcination at 450 °C).
temperature °C
crystal phase crystallite
size BET
m2.g-1 dpore nm
dcryst. nm
band gap eV
23 anatase 7.41 97* 3.86 7.41 3.15
53 anatase, β-TiO2 3.99 172 4.90 3.99 3.16
69 anatase, β-TiO2 4.13 173 3.96 4.13 3.15
78 anatase, β-TiO2 3.86 202 3.86 3.86 3.08 *The big difference in the BET surface area for this sample and for the TiO2-W sample might be due to instabilities occurred during the synthesis.
In order to investigate whether the mesoporous ordering will be influenced by the
number of the extraction steps, a sample obtained after titania precipitation with ammonia was
separated into two fractions. One fraction was extracted two times; the other fraction was
extracted four times. SAXS pattern of both samples after extraction and after calcination are
shown in Figure 23A. The patterns obtained after extractions were very similar and exhibited
an intense first reflection and a weak second reflection which indicates formation of
hexagonal ordered titania framework. After calcination the d100 reflection disappeared in both
samples and only a very broad peak could be detected. The presented results indicate that a)
the mesoporous ordering was mainly destroyed during thermal treatment and b) that the
number of the extraction steps will have only a minor influence on the mesoporous structure
obtained after calcination. Small differences were obtained in BET surface area (two times:
196 m2/g, four times: 223 m2/g). These small differences could be caused either from
instabilities of the synthesis process or from the different number of extraction steps. In
general, the results are in good accordance with TGA results which showed only small
differences in mass loss after two and four extractions.

53
0 1 2 3 4 510-4
10-3
10-2
10-1
100
101
I(q) /
a.u
.
q / nm-1
2 extraction steps 4 extraction steps
A
0 1 2 3 4 510-5
10-4
10-3
10-2
10-1
100
I(q) /
a.u
.
q / nm-1
2 extraction steps 4 extraction steps
B
Figure 23. Influence of the number of extraction steps on the SAXS patterns A) after surfactant removal B) after calcination .(molar P123/(TiOiPr)4 = 0.0163, Tevap = 40 °C, Textrac = 78 °C, calcination: 25 – 450 °C with 1.2 °C/min in Ar than 2 h at 450 °C, 25 – 450 °C with 1.2 °C/min in O2 than 2 h at 450 °C).
The obtained results indicate that the surfactant extraction step was necessary in order to
obtain a titania framework which conserve the hexagonal ordered structure during calcination.
However, two extraction steps seem to be sufficient for removing the surfactant. Extraction
temperature should be as high as possible to remove the surfactant as far as possible in order
to avoid a collapse of the ordered mesostructure during the following thermal treatment.
3.1.1.3 Molarsurfactant/titaniumratio
Previous studies showed that surfactant/Ti-isopropoxide molar ratio is a key parameter
to obtain a mesopore ordering of the amorphous titania framework present before calcination
[90]. In this work, the P123 concentration is preserved constant at 32.5 Wt.% with the molar
P123/Ti(OiPr)4 ratio has been varied from 0.0105 to 0.04. The effect of the mol ratio of
P123/Ti(OiPr)4 on the overall properties of ordered mesoporous TiO2 after thermal treatment
was investigated. Figure A9 shows the XRD powder pattern of the TiO2 materials with
different molar ratios. All samples display the characteristic peaks of anatase (JCPDF card
No. 01-073-1764) and minor reflexes of a β-TiO2 phase (JCPDF card No. 00-035-0088).
SAXS pattern of the materials after extraction and after calcination are presented in Figure 24.
For molar P123/Ti(OiPr)4 ratios between 0.0105 and 0.02, a hexagonal ordered titania
framework was obtained after extraction. Materials prepared with molar P123/Ti(OiPr)4 ratio
of 0.025 and 0.04 display only a single broad reflection. After calcination ordered domains
are still present in samples with the molar P123/Ti(OiPr)4 ratio between 0.025 and 0.04. The
results indicate the ordered mesoporous titania with semi-crystalline walls can be synthesized
with molar P123/Ti ratios between 0.0105 and 0.02 when using Ti(OiPr)4 as titania source.

54
0 1 2 3 4
I(q) /
a.u
.
q / nm-1
q = 0.511 nm-1
0.0400
0.02500.02000.01630.0140
0.01050.0126
molar ratio P123/Ti(OiPr)4
A
0 1 2 3 4
B
I(q) /
a.u
.
q / nm-1
0.04000.02500.02000.01630.0140
0.0105
molar ratio P123/Ti(OiPr)4
0.0126
q = 0.68 nm-1
Figure 24. SAXS patterns of TiO2 prepared with different molar P123/Ti(OiPr)4 ratios .(Tevap = 40 °C) A) after surfactant extraction (Textrac = 78 °C (4 times)), B) after calcination: calcination: 25 – 450 °C with 1.2 °C/min in Ar than 2 h at 450 °C, 25 – 450 °C with 1.2 °/min in O2 than 2 h at 450 °C).
Nitrogen adsorption–desorption isotherms (Figure A10) and the corresponding BJH
pore size distributions (insert of Figure A10); obtained from an analysis of the adsorption
branch of the isotherm, are presented in the Appendix. Samples obtained exhibit an isotherm
of type IV, characteristic for mesoporous materials according to the IUPAC classification
[153] with H2 type hysteresis. The isotherms with low molar P123/Ti(OiPr)4 ratios exhibit
sharp inflections in the P/Po range from 0.4 to 0.6 similar to their parent uncalcined samples.
With additional increase in the molar P123/Ti(OiPr)4 ratios above 0.0163 some changes can
be seen from Figure A10 as the inflection of the isotherm and its sharpness is reduced and a
shift toward higher P/Po range 0.5 to 0.9 compared to the uncalcined and lowers ratios. This
indicates bigger pores are formed. Increasing the molar P123/Ti(OiPr)4 ratio affects the
structure and forms samples with more disordered structure. The BJH pore size distribution
was calculated from the desorbed branch of the isotherm. At low molar P123/Ti(OiPr)4 ratios
for calcined samples the pore size distribution is more uniform and narrow compared with
those obtained at high ratios above 0.0163. Table 4 presents the specific surface areas and the
pore volumes for calcined samples. Differences in BET surface area of materials synthesized
with a molar P123/Ti(OiPr)4 ratio between 0.025 and 0.04 are relatively small and might be
caused from the variation of the P123/Ti ratio or some instabilities in the synthesis process as
reported before.
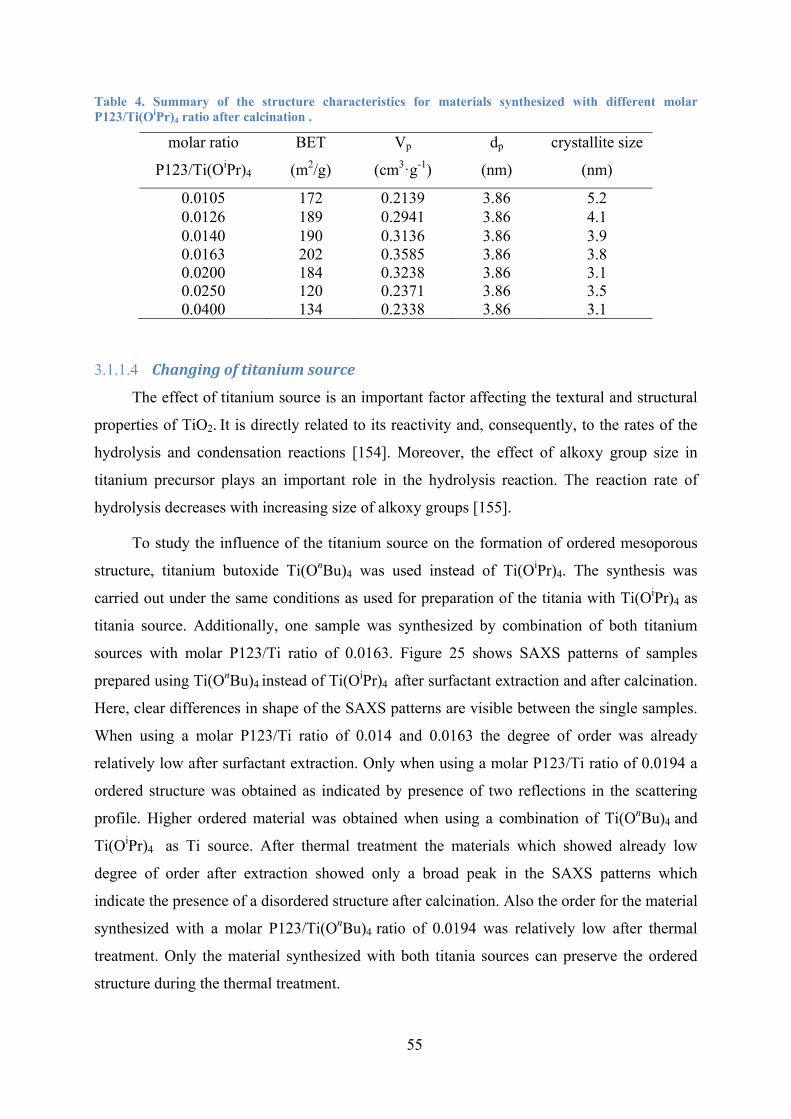
55
Table 4. Summary of the structure characteristics for materials synthesized with different molar P123/Ti(OiPr)4 ratio after calcination .
molar ratio
P123/Ti(OiPr)4
BET
(m2/g)
Vp
(cm3·g-1)
dp
(nm)
crystallite size
(nm)
0.0105 172 0.2139 3.86 5.2 0.0126 189 0.2941 3.86 4.1 0.0140 190 0.3136 3.86 3.9 0.0163 202 0.3585 3.86 3.8 0.0200 184 0.3238 3.86 3.1 0.0250 120 0.2371 3.86 3.5 0.0400 134 0.2338 3.86 3.1
3.1.1.4 Changingoftitaniumsource
The effect of titanium source is an important factor affecting the textural and structural
properties of TiO2. It is directly related to its reactivity and, consequently, to the rates of the
hydrolysis and condensation reactions [154]. Moreover, the effect of alkoxy group size in
titanium precursor plays an important role in the hydrolysis reaction. The reaction rate of
hydrolysis decreases with increasing size of alkoxy groups [155].
To study the influence of the titanium source on the formation of ordered mesoporous
structure, titanium butoxide Ti(OnBu)4 was used instead of Ti(OiPr)4. The synthesis was
carried out under the same conditions as used for preparation of the titania with Ti(OiPr)4 as
titania source. Additionally, one sample was synthesized by combination of both titanium
sources with molar P123/Ti ratio of 0.0163. Figure 25 shows SAXS patterns of samples
prepared using Ti(OnBu)4 instead of Ti(OiPr)4 after surfactant extraction and after calcination.
Here, clear differences in shape of the SAXS patterns are visible between the single samples.
When using a molar P123/Ti ratio of 0.014 and 0.0163 the degree of order was already
relatively low after surfactant extraction. Only when using a molar P123/Ti ratio of 0.0194 a
ordered structure was obtained as indicated by presence of two reflections in the scattering
profile. Higher ordered material was obtained when using a combination of Ti(OnBu)4 and
Ti(OiPr)4 as Ti source. After thermal treatment the materials which showed already low
degree of order after extraction showed only a broad peak in the SAXS patterns which
indicate the presence of a disordered structure after calcination. Also the order for the material
synthesized with a molar P123/Ti(OnBu)4 ratio of 0.0194 was relatively low after thermal
treatment. Only the material synthesized with both titania sources can preserve the ordered
structure during the thermal treatment.

56
Comparing the SAXS patterns of the samples after surfactant extraction using
Ti(OnBu)4 (Figure 25A) with those prepared from Ti(OiPr)4 (Figure 24A) showed that all the
reflections were shifted to higher q values when using Ti(OnBu)4 as Ti source. Moreover, a
loss in the mesoporous ordering of TiO2 framework was found with increasing amount of
Ti(OnBu)4. The differences in ordering of mesoporous titania might be caused by the
differences in size and structure of Ti alkoxide sources. Ti(OnBu)4 has a larger size and is less
reactive towards water than Ti(OiPr)4 [156]. Due to the linearity and larger dimensions of
Ti(OnBu)4, the reaction rates of hydrolysis might be reduced and co-condensation of the
titania sub-units might be suppressed leading to the formation of smaller titania subunits
(discrete oxo-oligomers or clusters) which affects the arrangement of these subunits around
the micelles formed during solvent evaporation. This assumption was derived from the higher
q values of the d100 reflection of the samples obtained after extraction when the materials were
synthesized with Ti(OnBu)4. Moreover, the reduced d100 spacing (higher q values) indicates
the formation of more densely packed titania subunits in these samples compared to the
materials synthesized with Ti(OiPr)4.
0 1 2 3 410-1
100
101
102
103
104
105
q / nm-1
mol ratio P123/Ti(OBnu)4
0.0163*
0.0194
0.0163
I(q) /
a.u
.
q = 0.62 nm-1
0.014
A
0 1 2 3 410-1
100
101
102
103
104
105
mol ratio P123/Ti(OnBu)4
0.0163*
0.0194
0.0163
I(q) /
a.u
.
q / nm-1
Bq = 0.83 nm-1
0.014
Figure 25. SAXS patterns for the materials prepared with different mol ratio P123/Ti(OnBu)4 after surfactant extraction A), and after thermal treatment B); synthesis conditions: Textrac = 78 °C (2 times), calcination: 25 – 450 °C with 1.2 °C/min in Ar than 2 h at 450 °C, 25 – 450 °C with 1.2 °C/min in O2 than 2 h at 450 °C).
The effect of titanium precursor can be seen also on BET surface areas of the calcined
samples. The BET surface area for the materials prepared using Ti(OnBu)4 (Table 5) were
lower than that area obtained using Ti(OiPr)4 (Table 5) when the same molar surfactant/Ti
ratio was used. The mean pore size decreases slightly with increasing Ti amount when using
Ti(OnBu)4 but was still in the same range as obtained when using Ti(OiPr)4. Mean crystallite

57
size after calcination was, in general, also in the same range. The reason for the lower degree
of ordering for materials prepared with Ti(OnBu)4 might be the higher density of the titania
framework formed during solvent evaporation which lead to thinner wall thickness at the
same pore dimension compared to the material synthesized with Ti(OiPr)4. The thinner wall
thickness in samples prepared with Ti(OnBu)4 was derived from the lower d100 spacing after
extraction and the similar mean pore size after calcination (obtained from nitrogen sorption
analysis) independent which Ti source was used. Furthermore, it was assumed that mean pore
size determined after calcination was in the same range as after extraction. This assumption is
supported by a result given in Table 5 where the same mean pore size was found before and
after calcination. During calcination of the materials synthesized with Ti(OnBu)4 the formed
crystallites destroy the ordered framework probably because of lower wall thickness in these
samples compared with the wall thickness obtained when using Ti(OiPr)4. The lower wall
thickness results from processes during solvent evaporation. It is assumed that titania species
with higher density are formed when Ti(OnBu)4 instead of Ti(OiPr)4 is used, resulting in lower
wall thickness of the amorphous ordered titania framework.
Otherwise, phase composition of the calcined material does not depend on Ti source.
Independent whether Ti(OiPr)4 or Ti(OnBu)4 was used all samples show a mixture of anatase
(main phase) and β-TiO2.
Table 5. Structural characteristics of titania prepared with Ti(OnBu)4
molar ratio P123/Ti-(OBu)4
crystal phase crystallite size
nm BET
m2·g-1 dp nm
0.0140 anatase, β-TiO2 5.2 178 3.1 0.0163 anatase, β-TiO2 4.4 156 3.6 0.0194 anatase, β-TiO2 4.8 140 4.2 0.0163* anatase, β-TiO2 4.5 180 4.0
* This sample was synthesized by combination of both titanium sources.
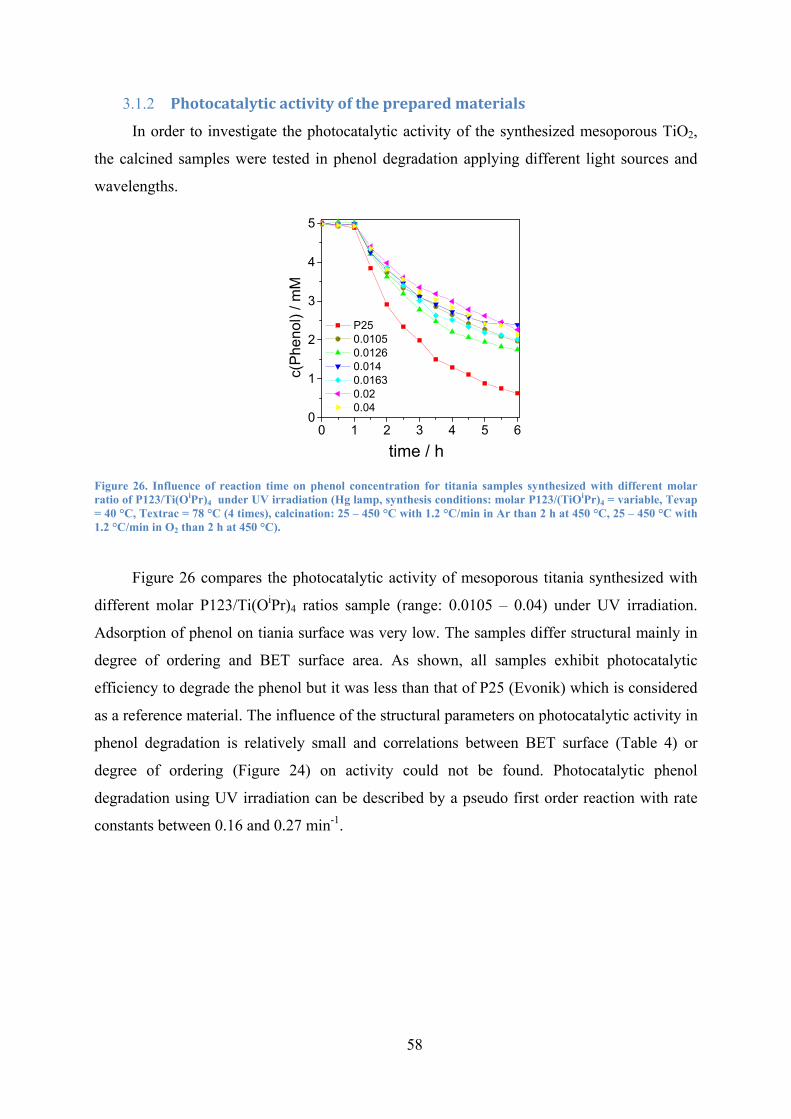
58
Photocatalyticactivityofthepreparedmaterials3.1.2
In order to investigate the photocatalytic activity of the synthesized mesoporous TiO2,
the calcined samples were tested in phenol degradation applying different light sources and
wavelengths.
0 1 2 3 4 5 60
1
2
3
4
5
c(Ph
enol
) / m
M
time / h
P25 0.0105 0.0126 0.014 0.0163 0.02 0.04
Figure 26. Influence of reaction time on phenol concentration for titania samples synthesized with different molar ratio of P123/Ti(OiPr)4 under UV irradiation (Hg lamp, synthesis conditions: molar P123/(TiOiPr)4 = variable, Tevap = 40 °C, Textrac = 78 °C (4 times), calcination: 25 – 450 °C with 1.2 °C/min in Ar than 2 h at 450 °C, 25 – 450 °C with 1.2 °C/min in O2 than 2 h at 450 °C).
Figure 26 compares the photocatalytic activity of mesoporous titania synthesized with
different molar P123/Ti(OiPr)4 ratios sample (range: 0.0105 – 0.04) under UV irradiation.
Adsorption of phenol on tiania surface was very low. The samples differ structural mainly in
degree of ordering and BET surface area. As shown, all samples exhibit photocatalytic
efficiency to degrade the phenol but it was less than that of P25 (Evonik) which is considered
as a reference material. The influence of the structural parameters on photocatalytic activity in
phenol degradation is relatively small and correlations between BET surface (Table 4) or
degree of ordering (Figure 24) on activity could not be found. Photocatalytic phenol
degradation using UV irradiation can be described by a pseudo first order reaction with rate
constants between 0.16 and 0.27 min-1.

59
0 20 40 60 80
0.05
0.10
0.15
0.20c(
phen
ol) /
mM
time / min
Pure Phenol P25 25°C 40°C 60°C 70°C 80°C
Alight on
0 1 2 3 4 5
0.05
0.10
0.15
0.20
c(ph
enol
) / m
M
time / h
Pure Phenol P25 25°C 40°C 60°C 70°C 80°C
B
Figure 27. Influence of reaction time on phenol concentration for titania samples synthesized with different solvent evaporation temperature at irradiation with white light A) and visible light, > 420 nm B) (Xenon lamp, synthesis conditions: molar P123/(TiOiPr)4 = variable, Tevap variable, Textrac = 78 °C (4 times), calcination: 25 – 450 °C with 1.2 °C/min in Ar than 2 h at 450 °C, 25 – 450 °C with 1.2 °C/min in O2 than 2 h at 450 °C)).
Samples prepared with different solvent evaporation temperature were tested also in
phenol degrading using a Xenon lamp as irradiation source. Results are presented in Figure
27. Adsorption of phenol on the titania surface during the dark period was again lower than
5% despite the high BET surface of the synthesized titania materials. Phenol bulk
concentration in the presence of the titania and light decreases with reaction time. Decreasing
of phenol concentration in presence of mesoporous titania photo-catalyst was much higher
than in absence of the catalyst. Photocatalytic phenol degradation using white light (Figure
27A) can be again described by a pseudo first order reaction with rate constants between
0.012 and 0.019 min-1. Here, phenol degradation increases slightly with increasing BET
surface and mesoporous ordering but differences between the samples were relatively low.
Phenol degradation with the synthesized mesoporous titania was clearly slower than
degradation over P25 which had a rate constant of 0.091 min-1. The same behavior was
previously observed for methyl orange degradation and explained by the higher volume of the
charge carrier recombination in the mesoporous titania [110]. The situation changed when the
samples were irradiated with visible light containing wavelengths > 420 nm (Figure 27B).
Here, the photocatalytic activity of the mesoporous titania was superior to that of P25. Under
these conditions, phenol degradation followed a zero order reaction and the degradation rate
was between 0.019 and 0.025 mmol/h. The highest activity was found for a sample with high
mesoporous ordering and BET surface, but under visible light illumination, no significant
influence of the BET surface, the mesoporous ordering or crystallite size on the photocatalytic

60
activity could be observed. The generally higher visible light photocatalytic activity of
mesoporous titania compared to P25 is attributed to the presence of nitrogen and carbon
species near the titania surface [136, 157]. Both elements are present in the synthesized tiania
even after calcination as proven by XPS (Figure 16).
Finally, samples prepared at different surfactant extraction temperature (Figure 28A) or
synthesized with Ti(OnBu)4 instead of Ti(OiPr)4 (Figure 28B) were also tested also in phenol
degradation using visible light. The photocatalytic activity of these samples was again
superior to that of P25 but differences in activity between these samples were only small
although the materials differ both in degree of ordering and BET surface area. Therefore, it
might be assumed that the amount of nitrogen or carbon residuals of the materials after
calcination was similar and approximately independent of the particular synthesis parameters.
The nitrogen will be introduced during the titania precipitation step by ammonia and not
complete removed during surfactant extraction. The carbon might originate from the
surfactant or from not completely hydrolyzed alkoxide groups of the Ti source. The lower
activity of sample were the surfactant was extracted at 23 °C and for the sample with the
highest amount of Ti(OnBu)4 might be caused by the presence of higher amounts of carbon
residuals in these samples.
0 1 2 3 4 50,00
0,05
0,10
0,15
0,20
time / h
light on
c( p
heno
l) / m
M
Pure Phenol P25 23°C 53°C 69°C 78°C
A
0 1 2 3 4 50,00
0,05
0,10
0,15
0,20
time / h
light on
c( p
heno
l) / m
M
Pure Phenol P25 0.0163 P123/Ti(OnBu)4
0.014 0.0194 0.0163 P123/Ti(OiPr)4
B
Figure 28. Influence of reaction time on phenol concentration for titania samples synthesized with different surfactant extraction temperatures (4 times) - A) and with Ti(OnBu)4 as Ti source - B); (Xenon lamp, visible light > 420 nm, A synthesis conditions: molar P123/Ti ratio = variable, Tevap = 40 °C, B): Textrac = 78 °C (2 times), calcination: 25 – 450 °C with 1.2 °C/min in Ar than 2 h at 450 °C, 25 – 450 °C with 1.2 °C/min in O2 than 2 h at 450 °C).
61
3.2 Dopedorderedmesoporoustitaniumdioxide
Metal‐dopedorderedmesoporoustitaniumdioxide3.2.1
Fe, Co and Ni were used to synthesize doped mesoporous TiO2 with different metals
content (0.5 and 5 mol %) via the same method which used to synthesize pristine TiO2 in
order to study the effect of doping of a second metal on the structural characteristics and
photocatalytic activity of ordered mesoporous titania.
Structuralcharacteristics3.2.2
SAXS was applied for monitoring changes in mesoporous structure between step c and
d. SAXS patterns of pristine TiO2 and titania doped with 0.5 or 5 mol% metal after treatment
the mesophase with ammonia can be seen in Figure 29A-B (synthesis step c). Independent of
the used metal salt, all patterns of the materials synthesized by adding 0.5 mol% of doping
metal exhibited an intense first reflection (d100) and a weaker second reflection which
indicates presence of a ordered mesoporous structure after titania precipitation. Similar results
were obtained after addition of 5 mol% Co or Ni. The d100 spacing peaked around 13.4 nm (q
= 0.46 - 0.47 nm-1). The nearly identical d100 spacing indicates that the size of the hexagonal
framework was not strong affected by the presence of the dopant. Only when 5 mol% Fe was
added into the Ti precursor containing synthesis solution no ordering was observed after
ammonia treatment indicated by absence of the (100) reflection. Extraction of the surfactant
in boiling ethanol (step d) led only to a slight shrinking of the hexagonal structure. This seems
to be approximately independent of the particular metal incorporated, but slightly influenced
by its amount (Figure 29C-D). The d100 spacing peaked at around 12.6 nm (q = 0.50 nm-1) for
the samples doped with 0.5 mol% and at 12.1 nm (q = 0.52 nm-1) for samples prepared with 5
mol% dopant. After the final thermal treatment at 450 °C (step e) the d100 reflection was shift
to about 9.2 nm (0.5 mol% metal, q = 0.68 nm-1) and 9.7 nm (5 mol% metal, q = 0.65 nm-1).
The shrinking of the mesoporous structured is attributed to titania densification caused by
thermal induced crystallization and sintering processes. The shift in 100 reflections was
connected with a broadening of the diffraction peaks and the low intense reflection could not
be clearly resolved in these SAXS patterns. The broadening indicates a partial loss of the
hexagonal ordering during thermal treatment. The loss is higher for the materials doped with
5 mol% metal in comparison to those doped with 0.5 mol%. Moreover, for the material doped
with 5 mol% Co, the 100 reflection in SAXS pattern disappeared after thermal treatment
which suggests that the mesoporous ordering in this sample collapsed during the thermal
treatment.
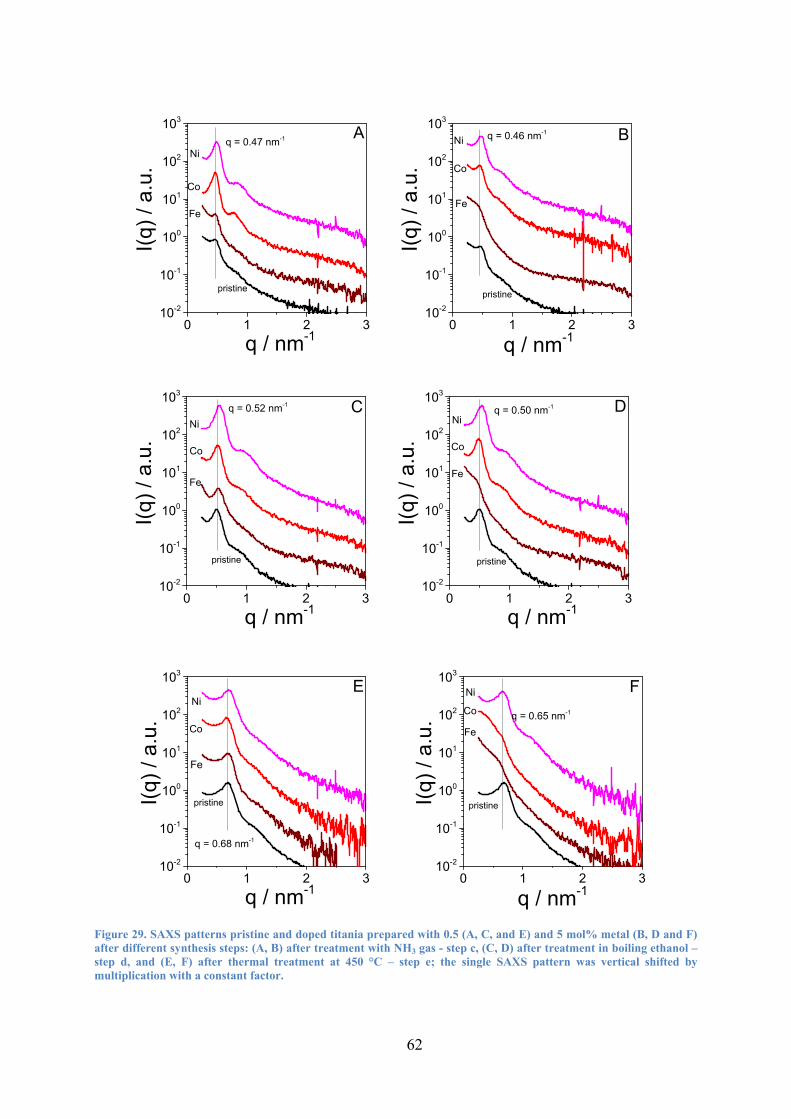
62
0 1 2 310-2
10-1
100
101
102
103
pristine
Ni
Co
I(q) /
a.u
.
q / nm-1
Fe
Aq = 0.47 nm-1
0 1 2 310-2
10-1
100
101
102
103
pristine
BNi
Co
I(q) /
a.u
.
q / nm-1
Fe
q = 0.46 nm-1
0 1 2 310-2
10-1
100
101
102
103
pristine
Ni
Co
I(q) /
a.u
.
q / nm-1
Fe
Cq = 0.52 nm-1
0 1 2 310-2
10-1
100
101
102
103
Ni
Co
I(q) /
a.u
.
q / nm-1
Fe
pristine
Dq = 0.50 nm-1
0 1 2 310-2
10-1
100
101
102
103
pristine
Ni
Co
I(q) /
a.u
.
q / nm-1
Fe
E
q = 0.68 nm-1
0 1 2 310-2
10-1
100
101
102
103
Ni
Co
I(q) /
a.u
.
q / nm-1
Fe
pristine
Fq = 0.65 nm-1
Figure 29. SAXS patterns pristine and doped titania prepared with 0.5 (A, C, and E) and 5 mol% metal (B, D and F) after different synthesis steps: (A, B) after treatment with NH3 gas - step c, (C, D) after treatment in boiling ethanol – step d, and (E, F) after thermal treatment at 450 °C – step e; the single SAXS pattern was vertical shifted by multiplication with a constant factor.

63
Scanning transmission electron microscopy (STEM) was applied in order to obtain
further insight in the morphology of materials formed after thermal treatment (step e). STEM
HAADF images of the samples synthesized with 0.5 mol% Fe, Co, and Ni are presented in
Figure 30. All three images show a hexagonal ordered titania framework in accordance with
the presented SAXS patterns. Differences in hexagonal ordering between the samples doped
with the particular metal were relatively low. The walls of the titania framework are
composed of small crystalline grains, which are orientated in all directions without any order
(See Appendix Figure A11). EDX analysis confirms the presence of the particular doping
element (Figure A12-Figure A14).
Figure 30. STEM-HAADF images of titania doped with 0.5 mol% metal after thermal treatment, A) Fe, B) Co, C) Ni.
A B
C
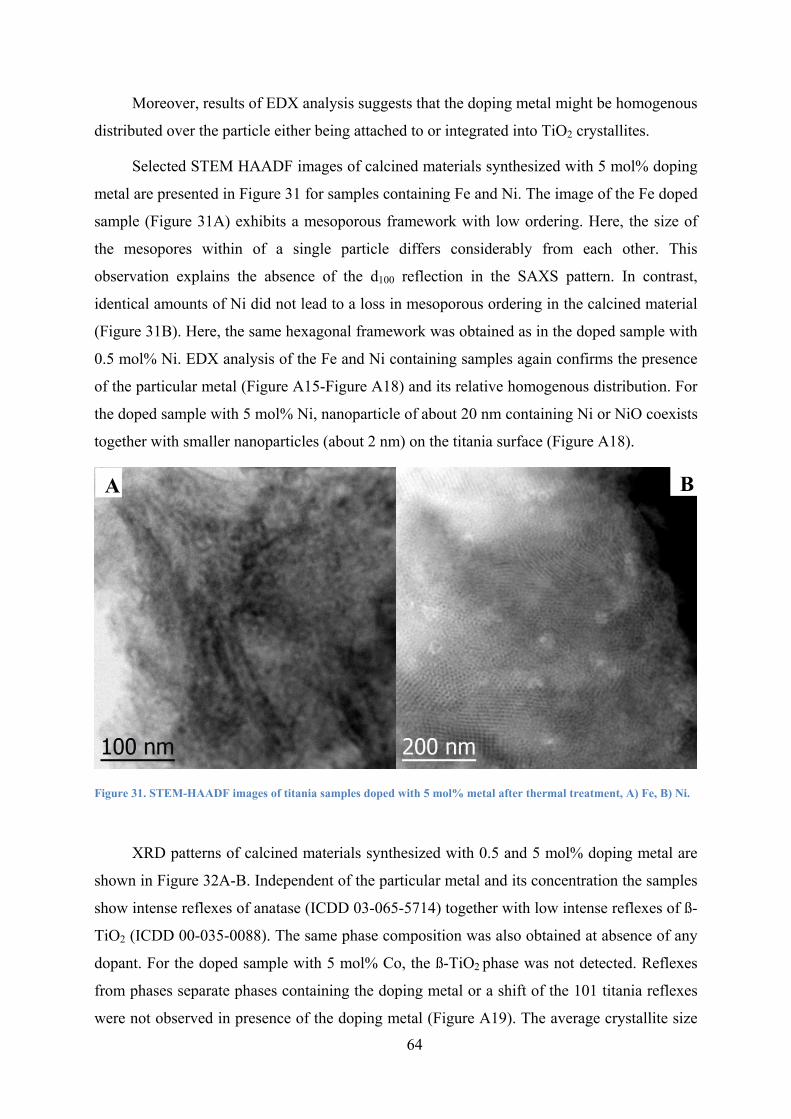
64
Moreover, results of EDX analysis suggests that the doping metal might be homogenous
distributed over the particle either being attached to or integrated into TiO2 crystallites.
Selected STEM HAADF images of calcined materials synthesized with 5 mol% doping
metal are presented in Figure 31 for samples containing Fe and Ni. The image of the Fe doped
sample (Figure 31A) exhibits a mesoporous framework with low ordering. Here, the size of
the mesopores within of a single particle differs considerably from each other. This
observation explains the absence of the d100 reflection in the SAXS pattern. In contrast,
identical amounts of Ni did not lead to a loss in mesoporous ordering in the calcined material
(Figure 31B). Here, the same hexagonal framework was obtained as in the doped sample with
0.5 mol% Ni. EDX analysis of the Fe and Ni containing samples again confirms the presence
of the particular metal (Figure A15-Figure A18) and its relative homogenous distribution. For
the doped sample with 5 mol% Ni, nanoparticle of about 20 nm containing Ni or NiO coexists
together with smaller nanoparticles (about 2 nm) on the titania surface (Figure A18).
Figure 31. STEM-HAADF images of titania samples doped with 5 mol% metal after thermal treatment, A) Fe, B) Ni.
XRD patterns of calcined materials synthesized with 0.5 and 5 mol% doping metal are
shown in Figure 32A-B. Independent of the particular metal and its concentration the samples
show intense reflexes of anatase (ICDD 03-065-5714) together with low intense reflexes of ß-
TiO2 (ICDD 00-035-0088). The same phase composition was also obtained at absence of any
dopant. For the doped sample with 5 mol% Co, the ß-TiO2 phase was not detected. Reflexes
from phases separate phases containing the doping metal or a shift of the 101 titania reflexes
were not observed in presence of the doping metal (Figure A19). The average crystallite size
A B
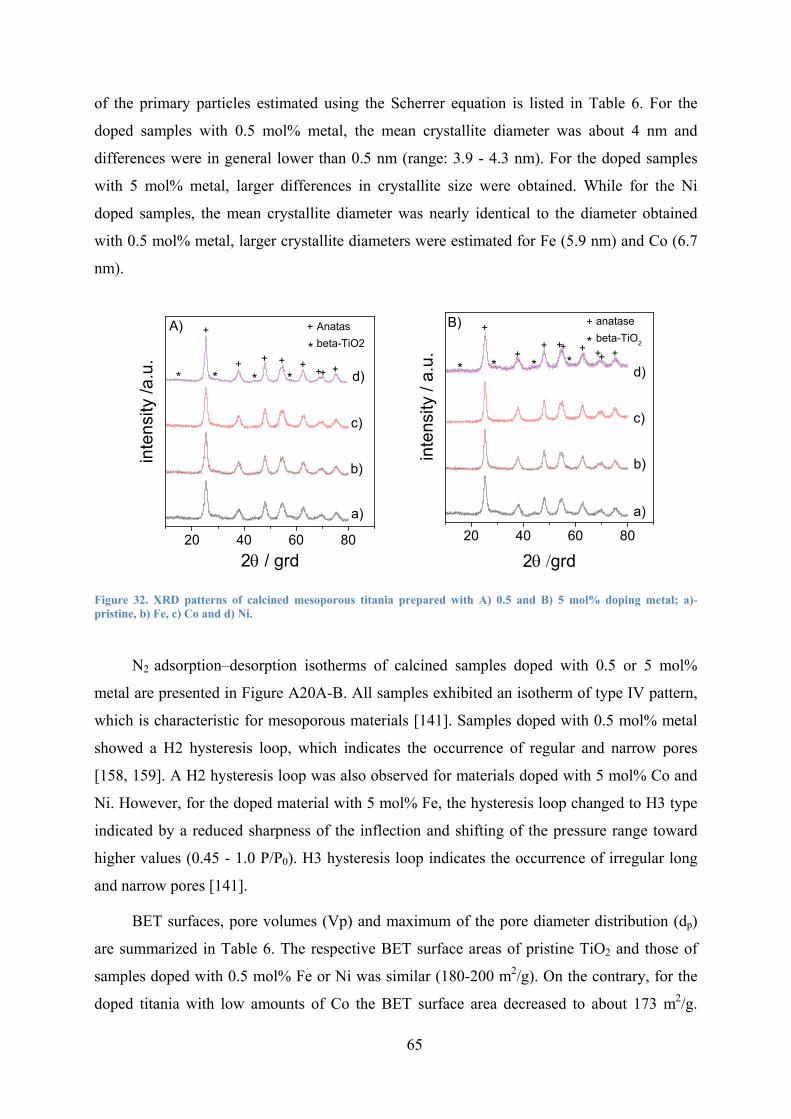
65
of the primary particles estimated using the Scherrer equation is listed in Table 6. For the
doped samples with 0.5 mol% metal, the mean crystallite diameter was about 4 nm and
differences were in general lower than 0.5 nm (range: 3.9 - 4.3 nm). For the doped samples
with 5 mol% metal, larger differences in crystallite size were obtained. While for the Ni
doped samples, the mean crystallite diameter was nearly identical to the diameter obtained
with 0.5 mol% metal, larger crystallite diameters were estimated for Fe (5.9 nm) and Co (6.7
nm).
20 40 60 80
inte
nsity
/a.u
.
2 / grd
*+
++++++
** **
+
a)
d)
c)
b)
Anatasbeta-TiO2
A)
+
20 40 60 80
*
+
***
a)
d)*+++
+++++
c)in
tens
ity /
a.u.
2grd
b)
anatasebeta-TiO2
B) +
Figure 32. XRD patterns of calcined mesoporous titania prepared with A) 0.5 and B) 5 mol% doping metal; a)- pristine, b) Fe, c) Co and d) Ni.
N2 adsorption–desorption isotherms of calcined samples doped with 0.5 or 5 mol%
metal are presented in Figure A20A-B. All samples exhibited an isotherm of type IV pattern,
which is characteristic for mesoporous materials [141]. Samples doped with 0.5 mol% metal
showed a H2 hysteresis loop, which indicates the occurrence of regular and narrow pores
[158, 159]. A H2 hysteresis loop was also observed for materials doped with 5 mol% Co and
Ni. However, for the doped material with 5 mol% Fe, the hysteresis loop changed to H3 type
indicated by a reduced sharpness of the inflection and shifting of the pressure range toward
higher values (0.45 - 1.0 P/P0). H3 hysteresis loop indicates the occurrence of irregular long
and narrow pores [141].
BET surfaces, pore volumes (Vp) and maximum of the pore diameter distribution (dp)
are summarized in Table 6. The respective BET surface areas of pristine TiO2 and those of
samples doped with 0.5 mol% Fe or Ni was similar (180-200 m2/g). On the contrary, for the
doped titania with low amounts of Co the BET surface area decreased to about 173 m2/g.

66
Observed differences in the BET surfaces and pore volumes of the doped titania samples with
0.5 mol% metal might be caused from instabilities in the synthesis process and/or the
presence of the doping metal. Doping with 5 mol% Fe or Co led to a clear decrease in BET
surface (115 m2/g). In contrast, for the doped material with 5 mol% Ni, the BET surface was
in the same range than that of the sample doped with 0.5 %. Figure 33 exhibits the pore
diameter distribution estimated from the adsorption branch. For doping with 0.5 mol% metal
the samples showed a nearly identical pore size distribution independent of the particular
metal, with a maximum located at about 4 nm. When the titania was doped with 5 mol%
metal, obvious differences in pore size distribution between samples containing the particular
doping metal were visible.
0 5 10 15 200,0
0,1
0,2
0,3
0,4
0,5
0,6
dV/d
D /
cm3 /(g
·nm
)-1
pore diameter / nm
pristine Fe Co Ni
A
0 5 10 15 200,0
0,1
0,2
0,3
0,4
0,5
0,6dV
/dD
/ cm
3 /(g·n
m)-1
pore diameter / nm
Fe Co Ni
B
Figure 33. Pore size distribution of doped mesoporous titania calcined at 450 °C, A) 0.5 mol% metal, and B) 5 mol% metal.
Table 6. Characteristics of calcined TiO2 doped with 0.5 or 5 mol% metal.
sample crystal phase metal
content mol%
BET m2/g
Vp cm3/g
dp nm
cryst. size nm
band gap eV
Pristine TiO2
anatase, β-TiO2 - 202 0.36 3.9 3.9 3.16
Fe/TiO2 anatase, β-TiO2 0.5 5
182 116
0.30 0.30
4.3 5.6
4.7 5.9
3.06 2.60
Co/TiO2 anatase, β-TiO2 0.5 5
173 115
0.34 0.32
3.9 5.6
4.7 6.7
2.98 2.78
Ni/TiO2 anatase, β-TiO2 0.5 5
199 212
0.32 0.36
4.3 3.9
3.9 3.4
3.10 2.84

67
In order to study the oxidation state and local environment of doping metal, the titania
doped with Fe obtained after thermal treatment have been characterized by EPR spectra as
shown in Figure 34. The sample doped with 0.5 mol% Fe showed an unsymmetrical signal at
g = 4.3 and a symmetrical peak at g = 1.99 with Hpp = 67 G Figure 34. The signal located at
g = 1.99 shows the presence of isolated high spin Fe3+ cations in octahedral symmetry [160].
Moreover, the signal indicates an uniform distribution of the Fe3+ ions inside the titania
framework by substitution of Ti4+ sites [161, 162]. Radii of Ti4+ and Fe3+ are very similar. The
signal at 4.3 is attributed to isolated Fe3+ ions in orthorhombic state located either inside the
anatase phase adjacent to a charge compensating oxide anion vacancy [161, 163] or on the
titania surface [162, 164]. Because the relative intensity of the surface Fe3+ signal (g= 4.3)
was much lower than that of the Fe3+ in the bulk phase (g = 1.99) it can be assumed that most
of the Fe3+ ions being integrated in the crystal lattice. The iron content was below the
solubility limit of iron (around 1 wt.%) in the anatase phase [165]. This assumption is further
supported by XPS analysis of this sample where no iron signal was detected (Figure A21).
Additional to the already observed signals, the EPR spectra of the sample loaded with 5 mol%
Fe showed a new broad peak superimposed on the signal at g = 1.99. This new signal was
attributed to spin-spin interactions among neighboring Fe3+ ions and indicates the presence of
Fe3+ in an iron oxide cluster [160, 164].
1000 2000 3000 4000 5000
g = 1.99
0.5 mol% Fe 5 mol% Fe
EPR
sig
nal i
nten
sity
/ a.
u.
Bo / G
g = 4.3
Figure 34. EPR spectra of the calcined mesoporous titania doped with iron (the spectra were recorded at 295 K).
Diffuse reflectance spectra are presented in Figure 35A-B. The pristine TiO2 shows only
absorbance in the wavelength region < 400 nm [166, 167]. This absorbance was attributed to
the intrinsic band gap absorption of anatase due to the ligand -metal charge transfer between
titanium Ti4+ (3d) and oxygen ligand O2- (2p) [168]. The doped samples showed enhanced
absorption at wavelengths higher than 400 nm. The extent of the red shift depends on the

68
particular metal and its concentration. It was general higher for samples synthesized with 5
mol% of dopants. The 0.5 mol% Fe containing sample sho wed light absorption between 400
and 500 nm. An absorption band around 415 nm was attributed to electronic transition from
Fe3+ energy level to the conduction band of titania [169]. The Fe3+ energy level was obtained
by substitution of Ti4+ ions by Fe3+ ions. This finding is in good accordance with EPR results.
When the amount of Fe was increased to 5 mol%, the absorption wave length increased up to
650 nm with a shoulder at about 500 nm. This new band could result from d-d transition of
Fe3+ species [60] and indicates the presence of iron containing clusters in the sample. A band
at 530 nm was previously attributed to the presence of α-Fe2O3 [162]. The doped sample with
0.5 mol% Co exhibited light absorption between 370 and 800 nm. Such red shift was
attributed to sp-d exchange interactions between the band electrons and the localized d-
electrons of the Co2+ ions substituting Ti4+cations [170]. Judging by the ionic radius, the Co2+
ion can easily replace the Ti4+ ion. d-d-transitions of Co3+ in octahedral coordination were
observed between 350 and 440 nm [171]. With the doping concentration of Co increasing to 5
mol%, the absorption intensity in the visible range further increased and a new band around
620 nm (Figure 35B) was detected which was attributed to Co2+ ions in tetrahedral
coordination. The appearance of this band among with absorption bands between 350-440 nm
and 450-550 nm hints at the presence of spinel Co3O4 phase in this sample [171]. Doping with
0.5 mol% Ni results only in a weak red shift of the light absorption compared to the other
metals. Absorption between 400 and 450 nm indicates presence of Ni2+ ions in octahedral
environment. The doped sample with 5 mol% Ni shows an additional band at wavelengths
higher than 600 nm which may result from the presence of a NiO [171] observed by TEM.
200 400 600 800
400 600
(1-R
)2 /2R
/ a.
u.
/ nm
pristine Fe Co Ni
A
(1-R
)2 /2R
/ a.
u.
/ nm
200 400 600 800
400 600
(1-R
)2 /2R
/ a.
u.
/ nm
Fe Co Ni
B
(1-R
)2 /2R
/ a.
u.
/ nm
Figure 35. UV-Vis diffuse reflectance spectra (DSR) of calcined un-doped mesoporous TiO2 and doped mesoporous TiO2 prepared with a) 0.5 and b) 5 mol% metal.

69
The optical band gap (BG) energies were calculated from the Tauc’s plot [143] and are
listed in Table 6. The estimated band gap energies for doped TiO2 were lower than that of un-
doped TiO2 as natural consequence of the shift of the band gap energy toward the visible
region in the presence of the dopant. For the doped samples with 0.5 mol%, the band gap shift
was lower than 0.3 compared to the pristine sample. The shift might result from charge
transfer transitions between d-electrons of the dopant ions which creates impurity electron
levels in the band gap of the titania and the TiO2 valance or conduction band [172]. On the
other hand, for the doped samples with 5 mol% metal, the decrease in band gap energy was
much higher compared to the doping level of 0.5 mol%. At this high dopant content, the
observed strong decrease in band gap energy may be associated with the presence of X-ray
amorphous oxidic phases containing the doping metal which are able to absorb light in the
visible range [173].
Photocatalyticactivityofmetaldopedmesoporoustitaniumdioxide3.2.3
The photocatalytic activity of the mesoporous TiO2 nanopowders was evaluated using
phenol. Although the tested titania samples had a relatively high BET surface, phenol
adsorption on the titania surface during the dark reaction was very low (Figure 36). For
comparison, commercial titania P25 was also tested and plotted in same Figure 36. Phenol
degradation starts immediately after switching on of the UV-light. The decrease in phenol
concentration with time depends on the particular metal and its content. For the doped
samples with 0.5 mol% Fe or Co about 80% of phenol was converted within 6 h (Figure
36A). This degradation was much higher as observed for the Ni doped and the pristine titania
samples. Addition of 5 mol% of these metals resulted in a material with clearly lower
photocatalytic activity. Here phenol degradation after 6 h dropped to 46, 51, and 38%,
respectively and was lower than observed for pristine titania. First order rate constant of
phenol degradation presented in Table 3 supports the above statements. These results differs
from those obtained with Zn doping where photocatalytic activity was similar at Zn content
below 10 wt.% [116].
The presented results indicate that material properties such as specific surface area, pore
volume, crystallite size, and degree of order have a relatively small influence on the
photocatalytic activity of the titania materials in phenol degradation at irradiation with UV
light. Photocatalytic activity of the mesoporous titania was mainly determined by the presence
of the particular metal and its concentration. Phenol photo-oxidation efficiency is regularly
mediated by a hydroxyl-radical pathway [174]. In a first step electron-hole pairs are generated
70
in the titania bulk by light absorption with energy equal or greater than the titania bandgap. In
further steps the generated charge carriers can recombine or migrate to the surface where they
can react. Hydroxyl-radicals are assumed to be formed by reaction of positive charged holes
with adsorbed OH- and/or water molecules and electrons are removed by reaction with
oxygen molecules [136, 175]. Depending on the particular doping element, its amount, local
structure, and oxidation state, the donor might act as a recombination centers or as a trap for
the particular charge carrier [113]. Since the irradiation energy applied was in the spectral
range of titania band gap (UV irradiation), the rate of carrier generation might be comparable
for samples doped with 0.5 mol% metal and the pristine titania. In this case, the observed
differences in photocatalytic activity might be explained by interaction of the doping element
itself (Fe, Co and Ni) or defects created in their environment with the charge carriers. These
sites will act as a charge carrier trap and altering the electron/hole pair recombination rate
[176]. Because the higher photo-activity of the samples doped with 0.5 mol% Fe, Co, Ni
compared to pristine titania the incorporated metal ions might acting preferred as electron trap
so that the holes can migrate to the surface and react with OH- or adsorbed water molecules
[59], which lead to higher photoactivity compared to pristine titania. It is known that Fe3+ ions
in low concentration can act under UV irradiation both as electron and hole trap and therefore
can reduce the photo-generated hole-electron recombination rate [161]. EPR and UV/Vis of
the calcined titania doped with 0.5 mol% Fe indicate the presence of isolated Fe3+ ions both
inside of the titania framework and on its surface. The increase in phenol degradation rate at
0.5 mol% iron doping in comparison to the pristine titania is attributed to the presence of
these isolated Fe3+ ions. An increase in activity in phenol degradation after iron doping (1
wt%) was already observed using nano sized-iron doped anatase [165]. On the other hand, at
higher content of the doping metal, surface modifications due to formation of Fe, Co and Ni
amorphous oxides phases on the titania surface appeared as proven by EPR and UV/Vis
spectroscopy. These new oxides structures might reduce the rate and number of generated
charge carrier, the number of phenol adsorption sites on titania and/or act as recombination
centers which reduce the life time of the charge carrier compared to pristine titania [161].
Therefore, the photocatalytic activity of samples with 5 mol% doping metal is lower than that
of pristine titania.

71
0 1 2 3 4 5 60
1
2
3
4
5
time / h
c Phen
ol /
mM
P25 pristine TiO2
Fe Co Ni
A
0 1 2 3 4 5 60
1
2
3
4
5
c Phen
ol /
mM
P25 pristine TiO2
Fe Co Ni
time / h
B
Figure 36. Degradation of phenol under UV irradiation as function of time, A) samples doped with 0.5 mol% metal and B) samples doped with 5 mol% metal, synthesis conditions: molar P123/(TiOiPr)4 = 0.0163, Tevap = 40 °C, Textrac = 78 °C (4 times), calcination: 25 – 450 °C with 1.2 °C/min in Ar than 2 h at 450 °C, 25 – 450 °C with 1.2 °C/min in O2 than 2 h at 450 °C).
Table 7. Comparison of pseudo first order rate constants in phenol degradation over doped mesoporous titania under UV irradiation.
dopants
0.5 mol% 5 mol%
kobs
h-1
R2
kobs
h-1
R2
P25* 0.43 0.9902
TiO2* 0.21 0.9496
Fe /TiO2 0.35 0.9859 0.13 0.9872
Co /TiO2 0.31 0.9953 0.15 0.9866
Ni /TiO2 0.22 0.9817 0.10 0.9747
*pristine titania
Moreover, the photocatalytic activity of these samples was tested in phenol degradation
under Xenon lamp as shown in Figure 37. Ordered mesoporous titania doped with 0.5 mol%
Fe or Ni exhibited higher photocatalytic activity than the pristine titania at irradiation with
white light, but, Co-doped showed less photoactivity (Figure 37A). According to results
presented in Figure 37A, photocatalytic activities of the samples were in the order of Fe ˃ Ni
˃ pristine TiO2 ˃ Co. The observed differences in photocatalytic activity might be explained
by interaction of the doping element itself or defects created in their environment with the
charge carriers. For Fe and Ni -doped samples, the significant improvement in the
photoactivity of TiO2 to degrade the phenol might be that the Fe and Ni ions promote the
separation of photogenerated charge carries. For Co-doped sample, however, it might be

72
assumed that Co ions could increase the rate of the recombination of electron-hole pairs. This
was because Co ions might be played the role of recombination centers. Phenol degradation
followed a pseudo first order reaction and the degradation rate was presented in Table 8.
Whereas, reducing of the photocatalytic activity of Fe and Ni has been found under
visible light illumination (Figure 37B). Under these conditions, no significant influence of the
metal doped on the photocatalytic activity of the titania was observed. The metal ions might
be serving as electron-hole recombination centers. In contrast, the photocatalytic activities of
all obtained samples have been found to be higher than P25 under visible light illumination
(Figure 37B). The reason has already been explained. From the results in Table 8, it can be
seen that phenol degradation followed a zero order reaction. The degradation rate of phenol
was also presented in Table 8.
Comparing the photocatalytic performance of these samples under white light
illumination (Figure 37A) with those under UV irradiation (Figure 36A), it can be seen that
there are differences in phenol degradation between the Ni and Co-doped samples. This might
be attributed to the difference in the testing conditions. Here the experiments were performed
under Xenon lamp (using white light) and UV irradiation. Moreover, both experiments were
carried out at different setups including amount of metal doped-TiO2 photocatalyst,
concentration of phenol, and volume of solution.
0 20 40 60 80 1000.00
0.05
0.10
0.15
0.20
Pure Phenol P25 Pristine TiO2
Fe-TiO2
Ni-TiO2
Co-TiO2
C p
heno
l / m
M
time / min
A0 1 2 3 4 5 6
0.00
0.05
0.10
0.15
0.20
Pure Phenol P25 Pristine TiO2
Fe-TiO2
Ni-TiO2
Co-TiO2
C p
heno
/ m
M
time / h
B
Figure 37. Degradation of phenol under Xenon lamp as function of time samples doped with 0.5 mol% metal A) white light and B) visible light (> 420 nm), synthesis conditions: molar P123/(TiOiPr)4 = 0.0163, Tevap = 40 °C, Textrac = 78 °C (4 times), calcination: 25 – 450 °C with 1.2 °C/min in Ar than 2 h at 450 °C, 25 – 450 °C with 1.2 °C/min in O2 than 2 h at 450 °C).

73
Furthermore, in order to investigate the influence of repeated synthesis of metal-doped
TiO2 on the photocatalytic activity, the 0.5 mol% Fe-doped titania sample was synthesized
again and applied in phenol degradation (molar ratio P123/(TiOiPr)4 0.0163, at 40 °C
evaporation temperature, 4 times surfactant extraction, calcination at 450 °C). Figure 38A
indicates that small differences in photocatalytic activity between both samples appeared. In
order to evaluate whether there was an error in temporal evolution of phenol concentration in
a single experiment, a fresh 0.5 mol% Fe-doped titania sample was tested two times with the
same conditions under visible light illumination. Figure 38B shows that only minor
differences in phenol degradation between the two tests were observed.
0 30 60 900.00
0.05
0.10
0.15
0.20
C p
heno
l / m
M
time / min
1. synthesis 2. synthesis
A
0 1 2 3 4 5 60.00
0.05
0.10
0.15
0.20
first experiment second experiment
C p
heno
l / m
M
time / h
B
Figure 38. Influence of reaction time on phenol concentration for titania doped with 0.5 mol% Fe A) repeated synthesis (Xenon lamp without filter) and B) two tests of the same material under identical conditions ( > 420 nm), (synthesis conditions: molar P123/(TiOiPr)4 = variable, Tevap = 40 °C, Textrac = 78 °C (4 times), calcination: 25 – 450 °C with 1.2 °C/min in Ar than 2 h at 450 °C, 25 – 450 °C with 1.2 °C/min in O2 than 2 h at 450 °C).
Table 8. Comparison of zero and first order rate constants in phenol degradation over doped mesoporous titania under Xenon lamp.
dopants
Xenon lamp Xenon lamp with filter
kobs
h-1
R2
kobs
R2
P25* 0.10 0.9703 0.19 0.9785
TiO2* 0.13 0.9979 0.20 0.9944
Fe /TiO2 0.18 0.9897 0.20 0.9978 Co /TiO2 0.12 0.9991 0.20 0.9974 Ni /TiO2 0.19 0.9964 0.20 0.9992
* Pristine titania
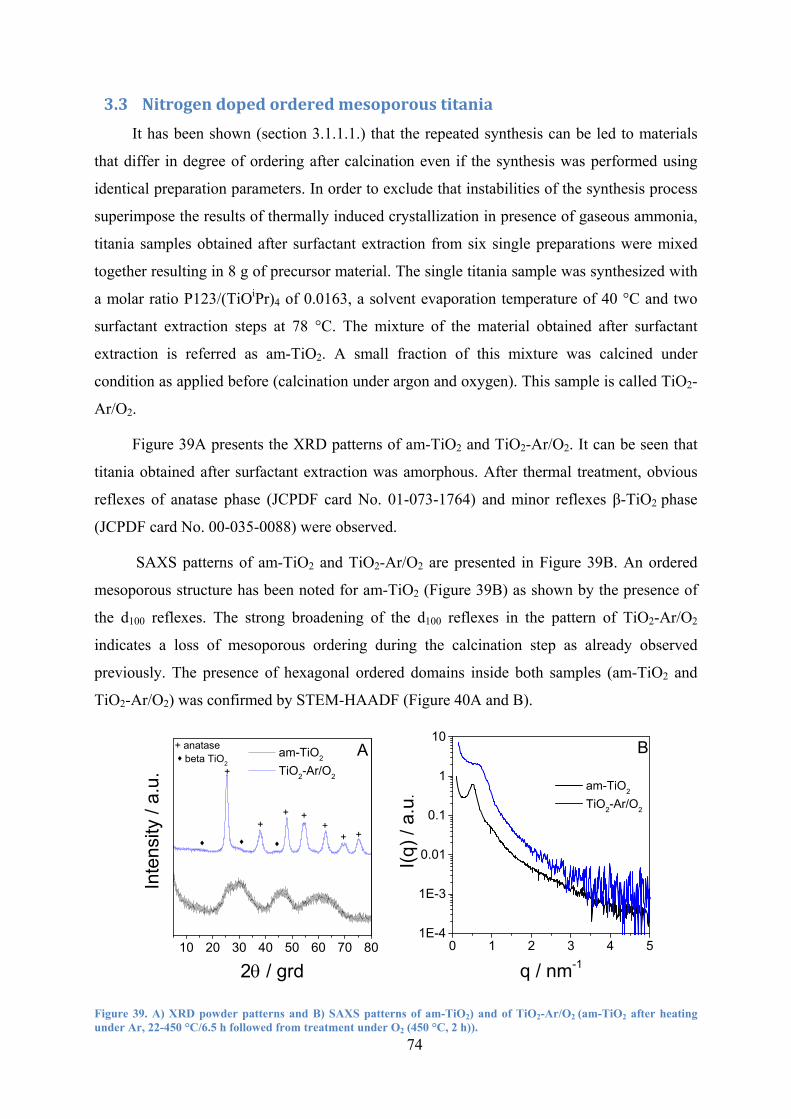
74
3.3 Nitrogendopedorderedmesoporoustitania
It has been shown (section 3.1.1.1.) that the repeated synthesis can be led to materials
that differ in degree of ordering after calcination even if the synthesis was performed using
identical preparation parameters. In order to exclude that instabilities of the synthesis process
superimpose the results of thermally induced crystallization in presence of gaseous ammonia,
titania samples obtained after surfactant extraction from six single preparations were mixed
together resulting in 8 g of precursor material. The single titania sample was synthesized with
a molar ratio P123/(TiOiPr)4 of 0.0163, a solvent evaporation temperature of 40 °C and two
surfactant extraction steps at 78 °C. The mixture of the material obtained after surfactant
extraction is referred as am-TiO2. A small fraction of this mixture was calcined under
condition as applied before (calcination under argon and oxygen). This sample is called TiO2-
Ar/O2.
Figure 39A presents the XRD patterns of am-TiO2 and TiO2-Ar/O2. It can be seen that
titania obtained after surfactant extraction was amorphous. After thermal treatment, obvious
reflexes of anatase phase (JCPDF card No. 01-073-1764) and minor reflexes β-TiO2 phase
(JCPDF card No. 00-035-0088) were observed.
SAXS patterns of am-TiO2 and TiO2-Ar/O2 are presented in Figure 39B. An ordered
mesoporous structure has been noted for am-TiO2 (Figure 39B) as shown by the presence of
the d100 reflexes. The strong broadening of the d100 reflexes in the pattern of TiO2-Ar/O2
indicates a loss of mesoporous ordering during the calcination step as already observed
previously. The presence of hexagonal ordered domains inside both samples (am-TiO2 and
TiO2-Ar/O2) was confirmed by STEM-HAADF (Figure 40A and B).
10 20 30 40 50 60 70 80
+++
+++
+
am-TiO2 TiO2-Ar/O2
Inte
nsity
/ a.
u.
2 / grd
Abeta TiO2
+
anatase
0 1 2 3 4 51E-4
1E-3
0.01
0.1
1
10
am-TiO2 TiO2-Ar/O2
I(q) /
a.u
.
q / nm-1
B
Figure 39. A) XRD powder patterns and B) SAXS patterns of am-TiO2) and of TiO2-Ar/O2 (am-TiO2 after heating under Ar, 22-450 °C/6.5 h followed from treatment under O2 (450 °C, 2 h)).

75
Figure 40. STEM-HAADF A) of am-TiO2 and B) of TiO2-Ar/O2 (am-TiO2 after heating under Ar followed from treatment in oxygen atmosphere (Ar: 22-450 °C/6.5 h followed from treatment under O2 atmosphere (450 °C, 2 h)).
Figure 41A shows the ATR-IR spectra of am-TiO2 and TiO2-Ar/O2 samples. The
spectrum of am-TiO2 showed a strong absorption bands around 3200 cm-1, which was
ascribed to the surface -(OH) stretching vibrations and/or adsorbed water molecules [177].
The band located at 1633 cm-1 can be attributed to the bending vibration of O-H bond
resulting from surface adsorbed water molecules [178]. The band at 1433 cm-1 can be
attributed to bending vibrations of NH4+ [177]. The presence of this band indicates that during
surfactant extraction in boiling ethanol ammonia species were not completely removed. The
protons of NH4+ are considered as strong Lewis acid that can bind to oxygen [177]. NH4
+ was
formed by reaction of protonated Ti-species with ammonia during the precipitation step.
Thermal treatment of the sample in Ar/O2 atmosphere led to a significant change of the IR
spectrum. Intensity of the broad absorption band around 3200 cm-1 and that of the band at
1633 cm-1 were decreased which might indicate that a part of the water was removed during
calcination. Moreover, the band located at 1433 cm-1 was nearly disappeared and new peaks
were located at 3735 and 1511 cm-1 appeared which might be attributed to the stretching
vibrations of Ti4+-OH surface hydroxyl groups (3735 cm-1) and NH2 or NO2/NO groups (1511
cm-1), respectively [177]. UV/vis spectra of both samples are presented in Figure 41B.
Absorption in the visible light range was higher, when the sample was thermally treated. This
might be attributed to nitrogen incorporation into the TiO2 lattice and the formation of new
electronic state above the valence band [179].
A B
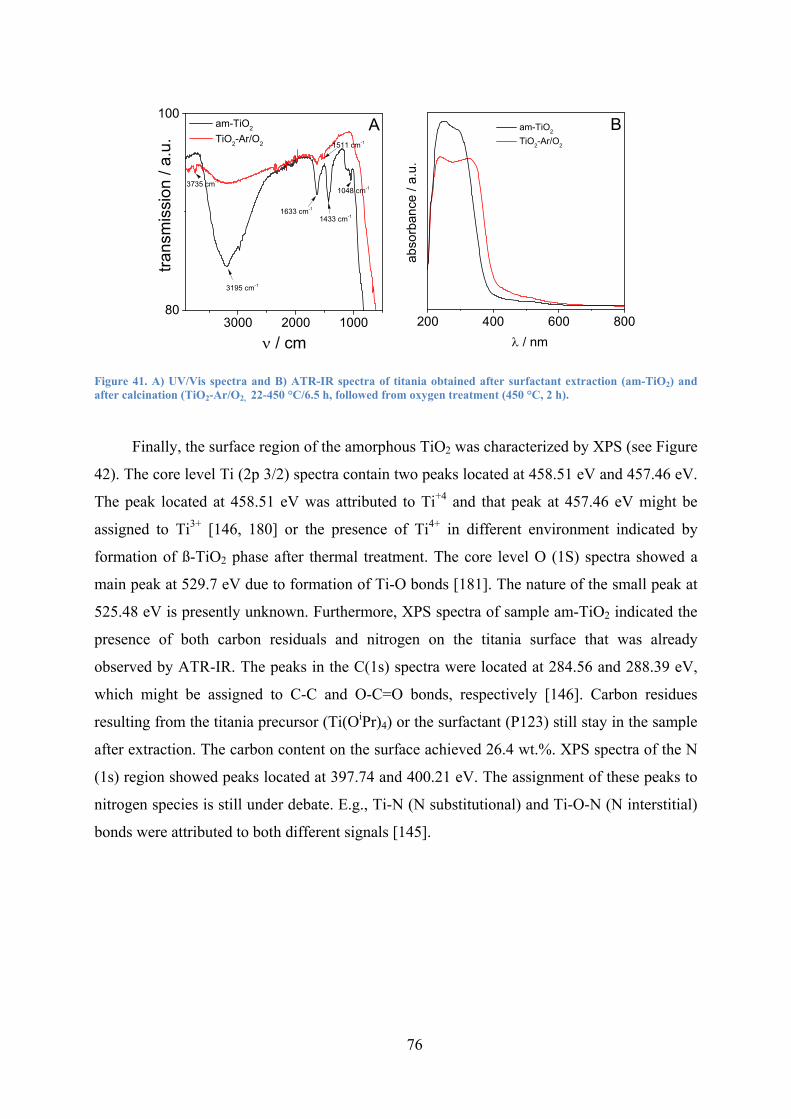
76
3000 2000 100080
100
1511 cm-1
3195 cm-1
3735 cm-1
1048 cm-1
1433 cm-1
trans
mis
sion
/ a.
u.
/ cm
am-TiO2 TiO2-Ar/O2
1633 cm-1
A
200 400 600 800
abso
rban
ce /
a.u.
/ nm
am-TiO2
TiO2-Ar/O2
B
Figure 41. A) UV/Vis spectra and B) ATR-IR spectra of titania obtained after surfactant extraction (am-TiO2) and after calcination (TiO2-Ar/O2, 22-450 °C/6.5 h, followed from oxygen treatment (450 °C, 2 h).
Finally, the surface region of the amorphous TiO2 was characterized by XPS (see Figure
42). The core level Ti (2p 3/2) spectra contain two peaks located at 458.51 eV and 457.46 eV.
The peak located at 458.51 eV was attributed to Ti+4 and that peak at 457.46 eV might be
assigned to Ti3+ [146, 180] or the presence of Ti4+ in different environment indicated by
formation of ß-TiO2 phase after thermal treatment. The core level O (1S) spectra showed a
main peak at 529.7 eV due to formation of Ti-O bonds [181]. The nature of the small peak at
525.48 eV is presently unknown. Furthermore, XPS spectra of sample am-TiO2 indicated the
presence of both carbon residuals and nitrogen on the titania surface that was already
observed by ATR-IR. The peaks in the C(1s) spectra were located at 284.56 and 288.39 eV,
which might be assigned to C-C and O-C=O bonds, respectively [146]. Carbon residues
resulting from the titania precursor (Ti(OiPr)4) or the surfactant (P123) still stay in the sample
after extraction. The carbon content on the surface achieved 26.4 wt.%. XPS spectra of the N
(1s) region showed peaks located at 397.74 and 400.21 eV. The assignment of these peaks to
nitrogen species is still under debate. E.g., Ti-N (N substitutional) and Ti-O-N (N interstitial)
bonds were attributed to both different signals [145].

77
470 465 460 455
Inte
nsity
/a.u
.
binding energy / eV
Ti2pA
534 532 530 528 526 524
Inte
nsity
/ a.
u.
binding energy / eV
O1sB
290 285 280
binding energy / eV
Inte
nsity
/ a.
u.
C1sC
405 400 395
inte
nsity
/ a.
u.
binding energy / eV
N1sD
Figure 42. HR XPS spectra from am-TiO2, A) Ti2p, B) O1s, C) C1s, and D) N1s.
Effectofthetemperature3.3.1
In order to investigate the effect of the heating temperature in presence of gaseous
ammonia on the structural characteristics and photocatalytic activity of the formed
mesoporous TiO2, single fractions of the mixed titania powder (am-TiO2) were heated in
presence of ammonia with different temperature values (350, 450, and 550 °C). The samples
obtained at different heating temperatures were referred as N-TiO2-350NH3, N-TiO2-450NH3
and N-TiO2-550NH3.
Figure 43A shows XRD patterns of the N-doped mesoporous TiO2 obtained by heating
at different temperatures in ammonia atmosphere. The sample treated at 350 °C was still
amorphous. Crystalline samples were obtained when the am-TiO2 was heated to 450 and
550°C. This indicates that the titania crystallinity was increasing with raising heating
temperature. The main reflexes in the XRD patterns could be indexed to an anatase phase of
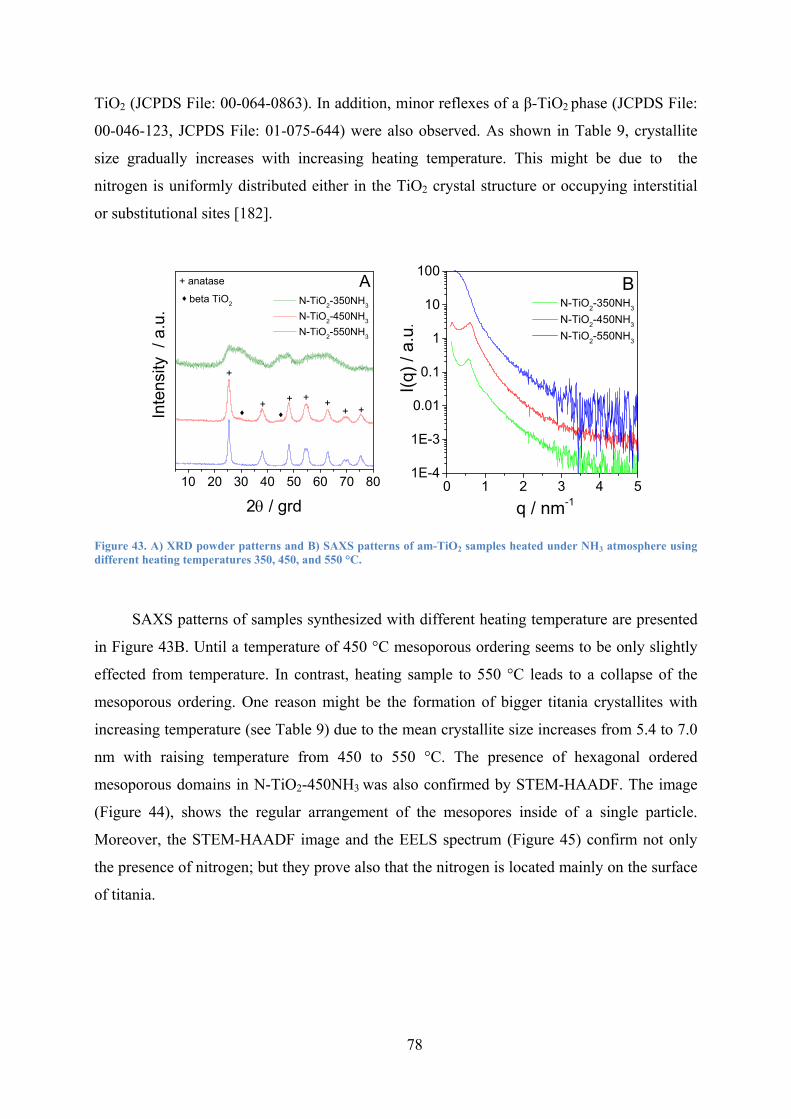
78
TiO2 (JCPDS File: 00-064-0863). In addition, minor reflexes of a β-TiO2 phase (JCPDS File:
00-046-123, JCPDS File: 01-075-644) were also observed. As shown in Table 9, crystallite
size gradually increases with increasing heating temperature. This might be due to the
nitrogen is uniformly distributed either in the TiO2 crystal structure or occupying interstitial
or substitutional sites [182].
10 20 30 40 50 60 70 80
beta TiO2
+
+
+ +++++In
tens
ity /
a.u
.
2 / grd
N-TiO2-350NH3 N-TiO2-450NH3 N-TiO2-550NH3
anatase A
0 1 2 3 4 51E-4
1E-3
0.01
0.1
1
10
100
I(q) /
a.u
.
q / nm-1
N-TiO2-350NH3
N-TiO2-450NH3
N-TiO2-550NH3
B
Figure 43. A) XRD powder patterns and B) SAXS patterns of am-TiO2 samples heated under NH3 atmosphere using different heating temperatures 350, 450, and 550 °C.
SAXS patterns of samples synthesized with different heating temperature are presented
in Figure 43B. Until a temperature of 450 °C mesoporous ordering seems to be only slightly
effected from temperature. In contrast, heating sample to 550 °C leads to a collapse of the
mesoporous ordering. One reason might be the formation of bigger titania crystallites with
increasing temperature (see Table 9) due to the mean crystallite size increases from 5.4 to 7.0
nm with raising temperature from 450 to 550 °C. The presence of hexagonal ordered
mesoporous domains in N-TiO2-450NH3 was also confirmed by STEM-HAADF. The image
(Figure 44), shows the regular arrangement of the mesopores inside of a single particle.
Moreover, the STEM-HAADF image and the EELS spectrum (Figure 45) confirm not only
the presence of nitrogen; but they prove also that the nitrogen is located mainly on the surface
of titania.
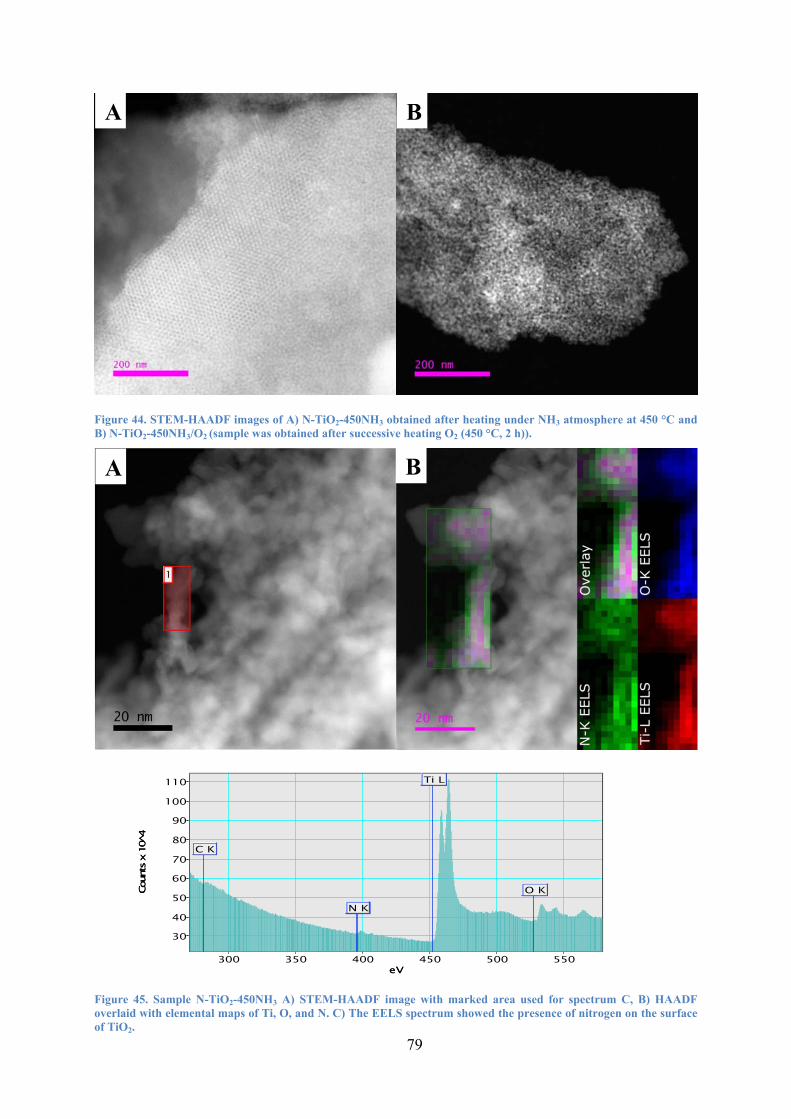
79
Figure 44. STEM-HAADF images of A) N-TiO2-450NH3 obtained after heating under NH3 atmosphere at 450 °C and B) N-TiO2-450NH3/O2 (sample was obtained after successive heating O2 (450 °C, 2 h)).
Figure 45. Sample N-TiO2-450NH3 A) STEM-HAADF image with marked area used for spectrum C, B) HAADF overlaid with elemental maps of Ti, O, and N. C) The EELS spectrum showed the presence of nitrogen on the surface of TiO2.
Coun
ts x
10̂
4
eV
30
40
50
60
70
80
90
100
110
Coun
ts x
10̂
4
300 350 400 450 500 550eV
C K
N KN K
Ti L
O K
A B
A B

80
Figure 46B presents ATR-IR spectra of N-TiO2-350NH3, N-TiO2-450NH3 and N-TiO2-
550NH3. All samples show an IR-absorption band at 3200 cm-1 similar to am-TiO2, which
was ascribed to the surface-(OH) stretching vibrations of the coordinated water molecules.
The band located around 1630 cm-1, attributed to the bending vibration of O-H bond from
surface adsorbed water, was also visible. The position of the band located around 1430 cm-1,
assigned to the presence of NH4+ [183], was slightly different in the single samples.
Moreover, intensity of this band compared to intensity of the band located at 1630 cm-1
decreased with increasing heating temperature. This indicates that amount of NH4+ decreases
with increasing heating temperature despite presence of ammonia in gas phase. General
characteristics of samples obtained after ammonia treatment are summarized in Table 9.
Results presented there confirm that increasing heating temperature lead to a decrease of the
nitrogen content.
3000 2000 100080
100
1431 cm-1
trans
mis
sion
/ a.
u.
/ cm
N-TiO2-350NH3 N-TiO2-450NH3 N-TiO2-550NH3
A
1633 cm-1
200 400 600 800
abso
rban
ce /
a.u.
/ nm
am-TiO2
N-TiO2-450NH3
B
Figure 46. A) ATR-IR spectra of am-TiO2 samples heated under NH3 atmosphere using different heating temperatures and B) UV/Vis absorption spectra.

81
The UV/Vis spectra of sample N-TiO2-450NH3 and am-TiO2 are shown in Figure 46A.
The absorption spectra of the amorphous titania (am-TiO2) shows only low light absorption in
the visible light range. Here, absorption in the visible range might be attributed to the
presence of carbon species and/or nitrogen. The sample heated in ammonia atmosphere show
much higher light absorption in the visible range compared to am-TiO2. Wang et al. [181]
observed an increase in the absorption in visible region with increasing of NH3 treatment
temperature to 600°C. The calculated band gap of sample N-TiO2-450NH3 (3.03 eV) was
clearly lower that of am-TiO2 (3.38 eV) although the sample am-TiO2 also contains nitrogen.
Here, the nitrogen might be weaker bounded on the titania surface. The reducing of the band
gap after heating in ammonia atmosphere might be considered as an indication that during the
thermal treatment some nitrogen was introduced into the titania lattice [146].
Table 9. General characteristics for samples obtained after heating under NH3 at different temperatures and after following treatment in oxygen flow (450 °C, 2 h).
Samples N* wt.%
BET m2/g
Vp
cm3/g dpore nm
dcryst. nm
band gap eV
m-TiO2 1.3 - - - - 3.38 N-TiO2-350NH3 1.3 - - - - N-TiO2350NH3/O2 <0.06 188 0.3 4.4 5.4 3.14 N-TiO2-450NH3 0.3 277 0.49 4.9 5.2 3.03 N-TiO2-450NH3/O2 <0.09 238 0.43 5.3 4.9 3.15 N-TiO2-550NH3 0.2 - - - 7.0 - N-TiO2-550NH3/O2 <0.06 150 0.36 6.7 7.0 3.10
*the nitrogen amount was determined by CHN-analysis using the corresponding titania sample
In order to investigate the chemical surface states after treatment in ammonia
atmosphere, N-TiO2-450NH3 have been characterized by XPS (Figure 47). The core level Ti
(2p3/2) spectra shows after deconvolution peaks located at 457.9, 458.7, and 459.7 eV, which
might be attributed to Ti3+ and Ti4+ 2p3/2, [146, 180]. The presence of Ti3+ indicates the
removal of oxygen from TiO2 lattice, which produces oxygen vacancies [184]. The core level
O (1S) spectrum shows the presence of two different oxygen bonds. The first binding energy
located at 529.7 due to formation of Ti-O. The second peak with binding energy located at
530.9 eV might be attributed to the hydroxyl group (-OH) [145, 185]. The N (1s) region
showed signals at 399.7 and 401.4 eV, which indicates the presence of anionic N in N-Ti-O
bonds and oxidized N in Ti-O-N bonds [186]. The core level C (1S) spectra showed two
peaks at 284.8 and 288.03, which can be assigned to C-C and O-C=O bonds, respectively
[146].

82
Generally, as well known, the assignment of the XPS peak of N1s in titania is still under
debate and controversial hypothesis have been presented [72, 187]. Previous reports indicate
that a peak at about 396 eV can be attributed to substitutional nitrogen doping (TiO2-xNx)
[188, 189]. In contrast, the peak at higher binding energies in the range (399-404 eV) is
attributed to interstitial nitrogen doping (TiO2Nx) [145]. It was found that binding energy of
interstitial nitrogen is higher than that of substitutional nitrogen. This might be because the
nitrogen doping into the TiO2 lattice reduces the electron density on the nitrogen due to the
high electronegativity of oxygen. These changes in the nitrogen environment led to significant
differences in the nitrogen 1s XPS spectral region [187]. In contrast, other studies assumed
that the peak in the range 397.8-399.9 eV has to be attributed to substitutional nitrogen as N-
Ti-N and O-Ti-N [145, 178].
470 465 460 455
Inte
nsity
/a.u
.
binding energy / eV
Ti2pA
534 532 530 528 526 524
Inte
nsity
/ a.
u.
binding energy / eV
O1sB
290 285 280
Inte
nsity
/ a.
u.
binding energy / eV
C1sC
405 400 395
inte
nsity
/ a.
u.
binding energy / eV
N1sD
Figure 47. HR XPS spectra from am-TiO2 after heating in NH3 to 450 °C, A) Ti2p, B) O1s, C) C1s, and D) N1s.

83
Next, the effect of the successive oxygen treatment was studied. For that reason, the
samples prepared under ammonia atmosphere at different temperatures were calcined in
oxygen flow at 450 °C. Figure 48 presents the X-ray diffraction and SAXS patterns of these
samples. The material synthesized under ammonia at 350 °C shows after treatment with
oxygen at 450 °C reflexes of anatase and ß-TiO2. Interestingly, the mean crystallite sizes
obtained after treatment with ammonia does not increase during the oxygen treatment (see
Table 9). However, the SAXS patterns show a loss of mesoporous ordering after oxygen
treatment for samples prepared under ammonia at 350 and 450 °C which might indicate that
at comparable temperature the presence of oxygen has a larger effect on ordering of the
mesoporous structure as the presence of ammonia. STEM-HAADF image of N-TiO2-
450NH3/O2 (Figure 44B) confirm the loss of mesoporous ordering during treatment with
oxygen at 450 °C as derived from SAXS pattern. The loss of ordering during oxygen
treatment is also supported by results of nitrogen sorption. As shown in Table 9, BET surface
decreases after treatment with oxygen from 277 to 238 m2/g. Interestingly, the sample
prepared under ammonia atmosphere at 450 °C showed after successive oxygen treatment
relatively high BET surface areas.
10 20 30 40 50 60 70 80
+ ++++
++
+ N-TiO2-350NH3/O2 N-TiO2-450NH3/O2 N-TiO2-550NH3/O2
Inte
nsity
/ a.
u.
2 / grd
Abeta TiO2
+
anatase
0 1 2 3 4 51E-4
1E-3
0.01
0.1
1
10
100 N-TiO2-350NH3/O2 N-TiO2-450NH3/O2 N-TiO2-550NH3/O2
I(q) /
a.u
.
q / nm-1
B
Figure 48. A) XRD patterns and B) SAXS patterns of samples calcined under NH3 using different heating temperatures followed from successive oxygen treatment (450 °C, 2 h).
Figure 49A shows the ATR-IR spectra of N-TiO2-350NH3/O2, N-TiO2-450NH3/O2 and
N-TiO2-550NH3/O2. In all three samples a broad absorption band located at 3200-3250 cm-1
was observed similar to the bands found in the samples after ammonia treatment. The band
located at 1633 cm-1 was also still there. This shows that all samples contained water probably
adsorbed on the titania surface. However, the band located at 1433 cm-1 was disappeared after
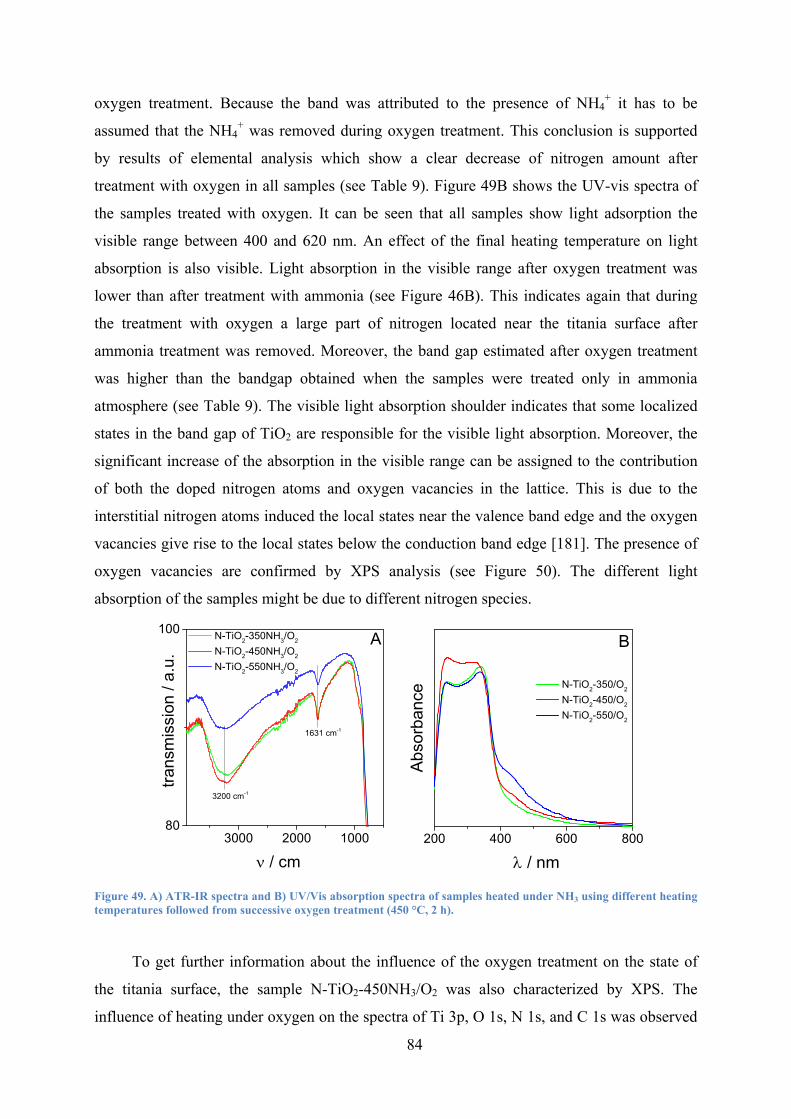
84
oxygen treatment. Because the band was attributed to the presence of NH4+ it has to be
assumed that the NH4+ was removed during oxygen treatment. This conclusion is supported
by results of elemental analysis which show a clear decrease of nitrogen amount after
treatment with oxygen in all samples (see Table 9). Figure 49B shows the UV-vis spectra of
the samples treated with oxygen. It can be seen that all samples show light adsorption the
visible range between 400 and 620 nm. An effect of the final heating temperature on light
absorption is also visible. Light absorption in the visible range after oxygen treatment was
lower than after treatment with ammonia (see Figure 46B). This indicates again that during
the treatment with oxygen a large part of nitrogen located near the titania surface after
ammonia treatment was removed. Moreover, the band gap estimated after oxygen treatment
was higher than the bandgap obtained when the samples were treated only in ammonia
atmosphere (see Table 9). The visible light absorption shoulder indicates that some localized
states in the band gap of TiO2 are responsible for the visible light absorption. Moreover, the
significant increase of the absorption in the visible range can be assigned to the contribution
of both the doped nitrogen atoms and oxygen vacancies in the lattice. This is due to the
interstitial nitrogen atoms induced the local states near the valence band edge and the oxygen
vacancies give rise to the local states below the conduction band edge [181]. The presence of
oxygen vacancies are confirmed by XPS analysis (see Figure 50). The different light
absorption of the samples might be due to different nitrogen species.
3000 2000 100080
100 N-TiO2-350NH3/O2 N-TiO2-450NH3/O2 N-TiO2-550NH3/O2
trans
mis
sion
/ a.
u.
/ cm
A
1631 cm-1
3200 cm-1
200 400 600 800
N-TiO2-350/O2 N-TiO2-450/O2
N-TiO2-550/O2
Abs
orba
nce
/ nm
B
Figure 49. A) ATR-IR spectra and B) UV/Vis absorption spectra of samples heated under NH3 using different heating temperatures followed from successive oxygen treatment (450 °C, 2 h).
To get further information about the influence of the oxygen treatment on the state of
the titania surface, the sample N-TiO2-450NH3/O2 was also characterized by XPS. The
influence of heating under oxygen on the spectra of Ti 3p, O 1s, N 1s, and C 1s was observed

85
through shifting in the binding energies. The first peak of Ti 2p changed from 457.9 eV to
lower binding energy of 456.75 eV. This peak could be assigned as Ti3+. The second and third
peaks were shifted by -0.36 and +0.26 eV, respectively. These peaks (458.34 and 459.96 eV)
are related to Ti4+. The core level O (1S) spectra showed a main peak at 530.45 due to
formation of Ti-O bond and a peak at 528.71 eV attributed to the oxygen of surface hydroxyl
groups [145, 185]. In addition, a new peak located at 527.6 eV appeared. The nature of this
peak is unknown. In the N1s spectra, the first peak was shifted from 399.7 eV to lower
binding energy of 397.7 eV. This peak belongs to substitutional nitrogen in Ti-N-O bonds.
The shift indicates a substitution of O- by N- to form Ti-N-O [81]. The second peak N1s was
shifted from 401.4 eV to 400.1 eV which corresponding to oxidized nitrogen (interstitial N)
such as NO or NO2 [81]. Upon heating under oxygen, the C1s peak at 288.1 disappeared and a
new peak at 282.3 eV appeared. This new peak might be attributed to the Ti–C bond [190]
where the carbon replace some oxygen into the titanium oxide lattice near the surface.
470 465 460 455
Inte
nsity
/ a.
u.
binding energy / eV
Ti2pA
534 532 530 528 526 524
Inte
nsity
/ a.
u.
binding energy / eV
O1sB
290 285 280
Inte
nsity
/ a.
u.
binding energy / eV
C1sC
405 400 395
inte
nsity
/ a.
u.
binding energy / eV
N1sD
Figure 50. HR XPS spectra from am-TiO2 after heating in NH3 to 450 °C (N-TiO2-450NH3) followed from successive treatment in oxygen atmosphere (450 °C/2 h), A) Ti2p, B) O1s, C) C1s, and D) N1s.

86
In order to investigate the photocatalytic activity of the N-doped mesoporous TiO2
selected samples obtained after ammonia treatment were tested applying Xenon lamp as
irradiation source. Figure 51 shows results of phenol degradation for the sample which was
treated in ammonia atmosphere at 450 °C. The presented samples differ in the amount of am-
TiO2 (86 or 500 mg) used and in time of treatment in ammonia atmosphere after achieving
450 °C (0.5 or 2 h). When using white light, differences in activity between the samples are
relatively small. At irradiation with visible light, clear differences in photocatalytic activity
were found. Here, the sample prepared with a lower amount of am-TiO2 showed a higher
activity than the sample synthesized using a larger amount of am-TiO2. This indicates that the
accessibility of ammonia to the powder surface during the thermal treatment might be
important for the amount of nitrogen which was adsorbed or built in into the titania lattice. In
order to circumvent such problems and to study the effect of single parameters, all further
experiment were conducted using 500 mg of am-TiO2 because the amount of 86 mg was too
low for an extended characterization in combination with photocatalytic experiments.
Furthermore, the presented results indicate that an extended treatment with ammonia at the
same temperature does not lead to material with an improved photocatalytic activity.
0 20 40 60 80 1000.00
0.05
0.10
0.15
0.20
c(Ph
enol
) / m
M
time / min
TiO2-450NH3,0.5h (80 mg)
TiO2-450NH3,0.5h (500 mg)
TiO2-450NH3, 2h (500 mg)
A
0 1 2 3 4 5 60.00
0.05
0.10
0.15
0.20
c(Ph
enol
) / m
M
time / h
TiO2-450NH3,0.5h (80 mg) TiO2-450NH3,0.5h (500 mg) TiO2-450NH3, 2h (500 mg)
B
Figure 51. Degradation of phenol under Xenon lamp irradiation as function of time for samples heated under NH3 at 450 °C A) white light and B) visible light (> 420 nm).

87
Photocatalytic results obtained at irradiation with white or visible light after successive
treatment of the samples with oxygen are presented in Figure 52. Photocatalytic activities at
irradiation with white light were in the order of P25 ˃ N-TiO2-450NH3/O2 ˃ N-TiO2-
350NH3/O2 ~ N-TiO2-550NH3/O2 ~ TiO2-Ar/O2 (Figure 52A). Photocatalytic activities of the
samples treated with oxygen at irradiation with visible light ( > 420 nm) were in the order N-
TiO2-450/O2 ˃ N-TiO2-350NH3/O2 ~ N-TiO2-550NH3/O2 ~ TiO2-Ar/O2 ˃ P25 ˃ pure phenol
(Figure 52A). At both irradiations, the sample N-TiO2-450NH3/O2 shows higher
photocatalytic activity than the other prepared samples. The photocatalytic activity of the
sample prepared under Argon followed from oxygen treatment results from the presence of
nitrogen and carbon residuals. The presence of these elements after surfactant extraction was
sufficient to obtain after calcination in Argon and oxygen similar photocatalytic activity than
in samples prepared under ammonia treatment at 350 or 550 °C and successive oxygen
treatment. In both cases the substitutional (nitrogen replaced oxygen atom of the TiO2 lattice)
and/or interstitial nitrogen (on the surface of TiO2) will be present affecting the electronic
structure of TiO2 and improve the photocatalytic activity in the visible light region. It was
assumed that interstitial nitrogen leads to formation of oxygen vacancies in the structure [75],
which are responsible to increase the photocatalytic activity. The higher photocatalytic
activity of the sample N-TiO2-450NH3/O2 compared to the other prepared samples might
results from the formation of Ti-C.
0 20 40 60 80 1000,00
0,05
0,10
0,15
0,20
time / min
C(P
heno
l) / m
M
Pure-Phenol P25 TiO2-Ar/O2
N-TiO2-350NH3/O2 N-TiO2-450NH3/O2
N-TiO2-550NH3/O2
A
0 1 2 3 4 5 60.00
0.05
0.10
0.15
0.20
C(P
heno
l) / m
M
time / h
Pure-Phenol P25 TiO2-Ar/O2
N-TiO2-350NH3/O2 N-TiO2-450NH3/O2
N-TiO2-550NH3/O2
B
Figure 52. Degradation of phenol under Xenon lamp irradiation as function of time for samples heated under NH3 at different heating temperatures followed from treatment in oxygen atmosphere (450 °C, 2 h), A) white light and B) visible light (> 420 nm).

88
Influenceoftheheatingrate3.3.2
In order to investigate the effect of the heating rate on the structural characteristics and
photocatalytic activity, experiments were carried out under NH3 atmosphere using three
different heating rates (0.6, 1.2, and 2.4 °C/min). The final temperature was always 450°C.
The samples obtained at different heating rates were referred as N-TiO2-0.6NH3, N-TiO2-
1.2NH3 and N-TiO2-2.4NH3, resectively. Additionally, all samples were also successive
treated with oxygen at 450 °C for 2 h. These samples were referred as N-TiO2-0.6NH3/O2, N-
TiO2-1.2NH3/O2 and N-TiO2-2.4NH3/O2.
Figure 53A shows XRD patterns of the materials after heating in ammonia. For all
samples, the peaks in the XRD patterns could be indexed to the anatase phase (JCPDS File:
00-064-0863). In addition, a small fraction of the β-TiO2 phase is also observed (JCPDS File:
00-046-123, JCPDS File: 01-075-644). Values for the crystallite size are given in Table 10.
The crystallite size was approximately independent on the heating rate and peaks around 5
nm. Treatment of these samples in oxygen atmosphere led to a small increase in crystallite
size. In addition, from patterns given in Figure 53B it can be derived that the phase
composition was not affected by heating in O2 atmosphere. All samples showed after oxygen
treatment reflexes of anatase and ß-TiO2 as already observed after ammonia treatment.
10 20 30 40 50 60 70 80
++++++
+ N-TiO2-0.6NH3 N-TiO2-1.2NH3
N-TiO2-2.4NH3
Inte
nsity
/ a.
u.
2 / grd
A
beta TiO2
+
anatase
10 20 30 40 50 60 70 80
+++++++
+ N-TiO2-0.6NH3/O2 N-TiO2-1.2NH3/O2
N-TiO2-2.4NH3/O2
Inte
nsity
/ a.
u.
2 / grd
B
beta TiO2
+
anatase
Figure 53. A) XRD powder pattern of am-TiO2 treated with ammonia at different heating rates (0.6, 1.2, and 2.4 °C/min) and B) SAXS patterns obtained after a successive treatment with oxygen (450 °C, 2 h).
SAXS patterns of samples prepared at different heating rate under ammonia flow and
after the following oxygen treatment are presented Figure 54. Samples obtained at different
heating rates under ammonia (Figure 54A) exhibited, independent which heating rate was
used, a strong d100 diffraction peak, which indicate the presence of ordered mesoporous titania

89
domains in all samples. The result hints that heating rate has only a marginal effect on
mesoporous ordering in comparison to the final heating temperature. SAXS patterns of the
samples obtained after successive heating in oxygen (450 °C, 2 h) are shown in Figure 54B.
Here, the patterns show a clear broadening of the d100 reflexes compared to sample obtained
under ammonia atmosphere. These results again indicate that treatment in oxygen might lead
to a stronger loss of mesoporous ordering than treatment under ammonia. However, it has to
be kept in mind that treatment in oxygen after achieving 450 °C was longer (2 h) than
treatment in ammonia (0.5 h). The BET surface area after ammonia treatment showed a
maximum for the sample heated with a heating rate of 1.2 °/min (see Table 10). Both lower
(0.6 °C/min) as well as higher heating rates (2.4 °C/min) lead to lower BET surface areas. As
already observed in the chapter before, BET surface area decreased when the material was
successive treated with oxygen. This suggests that pores walls were lost during the oxygen
treatment although the mean pore size does not increase strongly. The BET surface area for
the materials heated in gaseous NH3 (Table 10) was higher than that surface area obtained at
using argon followed by oxygen for titania crystallization (see e.g. Table 2).
0 1 2 3 4 51E-4
1E-3
0.01
0.1
1
10
100
I(q) /
a.u
.
q / nm-1
N-TiO2-0.6NH3 N-TiO2-1.2NH3
N-TiO2-2.4NH3
A
0 1 2 3 4 51E-4
1E-3
0.01
0.1
1
10
100
I(q) /
a.u
.
q / nm-1
N-TiO2-0.6NH3/O2 N-TiO2-1.2NH3/O2
N-TiO2-2.4NH3/O2
B
Figure 54. A) SAXS patterns of am-TiO2 treated with ammonia at different heating rates (0.6, 1.2, and 2.4 °C/min) and B) SAXS patterns obtained after a successive treatment with oxygen (450 °C, 2 h).
Table 10. General characteristics of samples prepared with different heating rate under NH3 atmosphere and following treatment with oxygen (450 °C, 2 h).
samples N wt.%
BET m2/g
Vp
cm3/g dpore nm
dcryst. nm
band gap eV
N-TiO2-0.6NH3 0.2 250 0.46 5.2 5.1 3.03 N-TiO2-0.6NH3/O2 <0.06 199 0.35 5.1 5.8 3.15 N-TiO2-1.2NH3 0.3 277 0.49 4.9 4.9 3.03 N-TiO2-1.2NH3/O2 <0.09 238 0.43 5.3 5.2 3.15 N-TiO2-2.4NH3 0.2 249 0.44 4.3 4.8 3.07 N-TiO2-2.4NH3/O2 <0.06 197 0.35 5 5.6 3.11
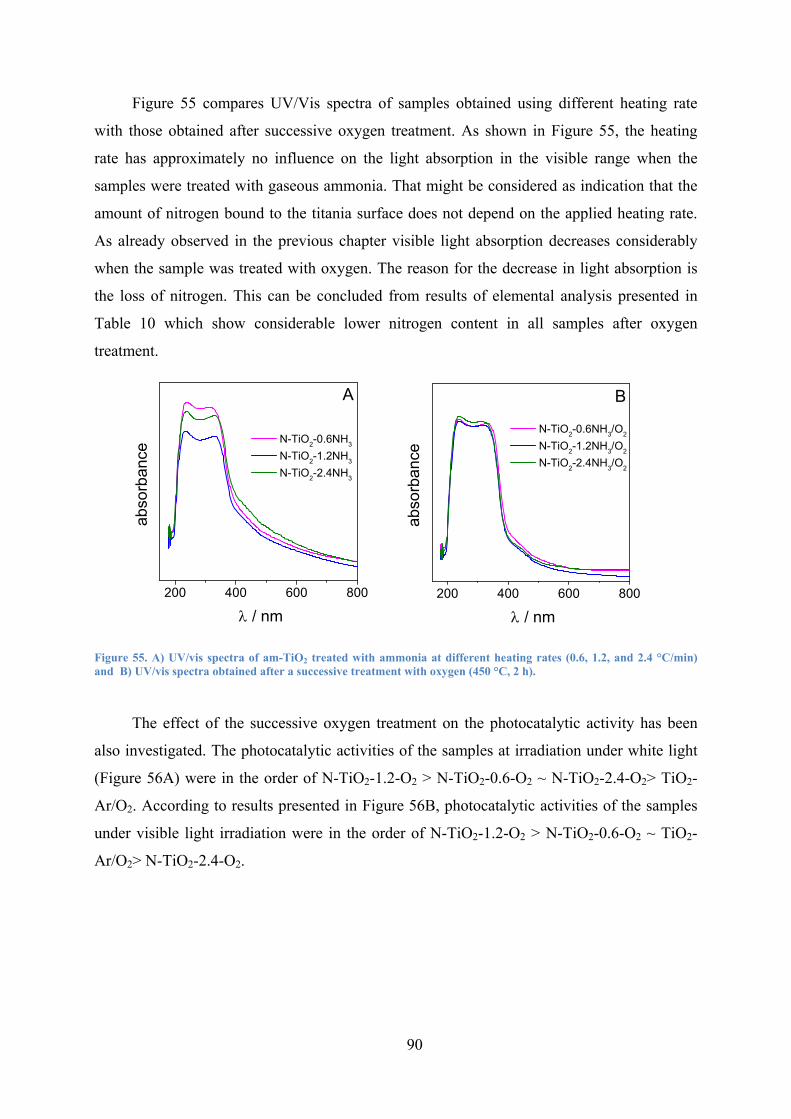
90
Figure 55 compares UV/Vis spectra of samples obtained using different heating rate
with those obtained after successive oxygen treatment. As shown in Figure 55, the heating
rate has approximately no influence on the light absorption in the visible range when the
samples were treated with gaseous ammonia. That might be considered as indication that the
amount of nitrogen bound to the titania surface does not depend on the applied heating rate.
As already observed in the previous chapter visible light absorption decreases considerably
when the sample was treated with oxygen. The reason for the decrease in light absorption is
the loss of nitrogen. This can be concluded from results of elemental analysis presented in
Table 10 which show considerable lower nitrogen content in all samples after oxygen
treatment.
200 400 600 800
abso
rban
ce
/ nm
N-TiO2-0.6NH3 N-TiO2-1.2NH3 N-TiO2-2.4NH3
A
200 400 600 800
N-TiO2-0.6NH3/O2
N-TiO2-1.2NH3/O2
N-TiO2-2.4NH3/O2
abso
rban
ce
/ nm
B
Figure 55. A) UV/vis spectra of am-TiO2 treated with ammonia at different heating rates (0.6, 1.2, and 2.4 °C/min) and B) UV/vis spectra obtained after a successive treatment with oxygen (450 °C, 2 h).
The effect of the successive oxygen treatment on the photocatalytic activity has been
also investigated. The photocatalytic activities of the samples at irradiation under white light
(Figure 56A) were in the order of N-TiO2-1.2-O2 ˃ N-TiO2-0.6-O2 ~ N-TiO2-2.4-O2˃ TiO2-
Ar/O2. According to results presented in Figure 56B, photocatalytic activities of the samples
under visible light irradiation were in the order of N-TiO2-1.2-O2 ˃ N-TiO2-0.6-O2 ~ TiO2-
Ar/O2˃ N-TiO2-2.4-O2.

91
0 20 40 60 80 1000.00
0.05
0.10
0.15
0.20c(
Phen
ol) m
M
time / min
TiO2-Ar/O2
N-TiO2-0.6NH3/O2
N-TiO2-1.2NH3/O2
N-TiO2-2.4NH3/O2
A
0 1 2 3 4 5 60.00
0.05
0.10
0.15
0.20
c(Ph
enol
) / m
M
time / h
Pure phenol P25 TiO2-Ar/O2
N-TiO2-0.6NH3/O2 N-TiO2-1.2NH3/O2
N-TiO2-2.4NH3/O2
A
Figure 56. Degradation of phenol as function of time under Xenon lamp irradiation for samples obtained using different heating rates (0.6, 1.2, and 2.4 °C/min) under NH3 atmosphere followed from successive treatment under oxygen (450 °C, 2 h); A) white light and B) visible light > 420 nm.
Influenceofthepresenceofwatervapor3.3.3
Finally, the influence of water vapor on the structural features and photocatalytic
activity of nitrogen-doped mesoporous TiO2 was studied. For that reason, the am-TiO2
material was heated in a gas mixture containing NH3, N2, and water vapor. The samples
obtained at different heating temperatures were assigned N-TiO2-200NH3/N2/H2O, N-TiO2-
350NH3/N2/H2O and N-TiO2-450NH3/N2/H2O, respectively.
XRD patterns of the samples synthesized in presence of water vapor are shown in
Figure 57A. It can be seen from that Figure that the sample N-TiO2-200NH3/N2/H2O contains
already crystalline anatase domains. At absence of water vapor crystalline anatase domains
were not obtained at such low temperature. With increasing the heating temperature from 350
to 450°C, the intensity of the anatase phase reflexes increases and the reflexes become
narrower. Again, the XRD patterns did not show any nitrogen containing phase. Moreover,
reflexes of the ß-TiO2 phase were also not observed. This indicates to that the presence of
water vapor has a strong influence on the crystallization of the titania. Mean crystallite sizes
in presence the water vapor (Table 11) where obvious higher than those sizes obtained in
absence of water vapor and increases with increasing temperature.

92
10 20 30 40 50 60 70 80
Inte
nsity
/ a.
u.
2 / grd
N-TiO2-200NH3/N2/H2O N-TiO2-350NH3/N2/H2O N-TiO2-450NH3/N2/H2O
A
0 1 2 3 4 51E-4
1E-3
0.01
0.1
1
10
100
N-TiO2-200NH3/N2/H2O N-TiO2-450NH3/N2/H2O
I(q) /
a.u
.
q / nm-1
B
Figure 57A) XRD patterns and B) SAXS patterns of the am-TiO2 after heating the sample under gas mixture of NH3,N2, and water vapor.
SAXS patterns for the samples prepared at 200 or 450 °C are presented in Figure 57B.
The pattern shows that the material lost the mesoporous order already after heating to 200 °C
where both amorphous and crystalline domains were present. This indicates that already at
200 °C the structure of amorphous domains are changed by the water vapor. The pattern of
the samples prepared at 450 °C show that the ordered structure was completely collapsed. The
collapse of the mesoporous ordering is connected with considerable decrease in BET surface
area as shown in Table 11.
UV−Visible spectra of N-TiO2-200NH3/N2/H2O, N-TiO2-350NH3/N2/H2O and N-TiO2-
450NH3/N2/H2O together with the spectra of m-TiO2 are shown in Figure 58A. Interestingly,
UV/Vis spectra of am-TiO2 and N-TiO2-200NH3/N2/H2O are very similar. With increasing
temperature the UV intensity is shifted to slightly higher wavelength. Absorption in the
visible range is general lower than in the other materials obtained in presence of gaseous
ammonia. Also the estimated band gap (Table 11) was generally higher in comparison to the
other samples prepared at presence of gaseous ammonia but at absence of water (see Table 9
and Table 10). The high band gap indicates that the amount of nitrogen bounded to the titania
surface should be only low.
Table 11. General characteristics for samples heated under a mixture of NH3, N2, and water vapor.
Samples BET m2/g
Vp
cm3/g dpore nm
dcryst. nm
band gap eV
N-TiO2-200NH3/N2/H2O 388 0.73 6.6 - 3.23
N-TiO2-350NH3/N2/H2O 162 0.51 9.1 8.2 3.19
N-TiO2-450NH3/N2/H2O 137 0.51 11.6 9.8 3.20

93
200 400 600 800 1000
am-TiO2
N-TiO2-200NH3/N2/H2O N-TiO2-350NH3/N2/H2O N-TiO2-450NH3/N2/H2O
abso
rban
ce /
a.u.
/ nm
A
0 20 40 60 80 1000.00
0.05
0.10
0.15
0.20
C P
heno
l / m
M
time / min
TiO2-Ar/O2
N-TiO2-200NH3/N2/H2O N-TiO2-350NH3/N2/H2O N-TiO2-450NH3/N2/H2O
B
Figure 58. A) UV/Vis spectra and B) phenol degradation of as function of time under Xenon lamp irradiation (white light) for samples heated under mixture of NH3, N2, and water vapor.
Because of the assumed low nitrogen content the samples prepared under water vapor
were tested in phenol degradation using white light. The results are presented in Figure 58B.
It can be seen that all samples prepared in presence of water vapor showed higher
photocatalytic activity than that of TiO2-Ar/O2. Moreover, activity was clearly higher than
photocatalytic activity of the other samples prepared under ammonia atmosphere. This might
be due to the effect of H2O on the surface of TiO2, which produced defects in the titania
structure and formed hydroxyl group or more oxygen vacancies [191]. In addition, the higher
crystallinity or lower defect density might be played role in enhanced the photocatalytic
activity of materials obtained. This indicates that crystallinity has a larger effect than surface
area or mesoporous structure.
XPS spectra of the treated at 450 °C with the NH3+N2+H2O mixture are presented in
Figure 59. The Ti 2p3/2 region shows after deconvolution signals at 458.1 eV, 460.3 eV, and
461.4 eV. While the the signal at 458.1 eV migbt be assigned to Ti3+ the binding energy of the
two signals is very high compared to binding energy given for Ti4+ [146, 180]. In the O 1s
spectra three chemical states of oxygen were separated. The peak at 529.9 eV is characteristic
for oxygen in TiO2. The signal at 532.2 eV might be attributed to surface TiOx species, OH
groups binding with two Ti atoms or C=O. A peak at 532.0 eV was also attributed to a Ti-O-
N structure [189].The largest signal located from at 533.2 eV was previously assigned to
surface oxygen in Ti-OH and C-OH. [68]. The high amount of surface Ti-OH species might
be also the reason for higher photocatalytic activity of the samples prepared in presence of

94
water vapor at irradiation with white light in comparion to the activity of samples prepared
without water vapor. Furthermore, the samples synthesized with water vapor show also the
highest cristallinity. The specrum in the C 1s region shows two signal with binding energies
of 284.8 and 288.1 eV. The broad peak at higher binding energy indicate presence of C=O,
O=C-O and C-N bondings on the titania surface. The N 1s region shows after deconvultion
peaks located at 399.5 and 401.0 eV which might indicate presence of interstitional and
substitutional doped nitrogen.
470 465 460 455
Inte
nsity
/ a.
u.
binding energy / eV
Ti2pA
534 532 530 528 526 524
Inte
nsity
/ a.
u.
binding energy / eV
O1sB
290 285 280
Inte
nsity
/ a.
u.
binding energy
C1sC
405 400 395
inte
nsity
/ a.
u.
binding energy / eV
N1sD
Figure 59. HR XPS spectra from am-TiO2 after heating in NH3 /N2 /H20 to 450 °C, A) Ti2p, B) O1s, C) C1s, and D) N1s.

95
4 SummaryandConclusions
First, for pristine ordered mesoporous titania, the characterization results showed that
the solvent evaporation, extraction conditions step, the molar molar P123/Ti(OiPr)4 ratio and
titanium source play an important role in structural characteristics in the synthesis process of
ordered mesoporous titania framework. The temperature of solvent evaporation had affected
the structural characteristics of the finally obtained pristine titania after calcination step.
Moreover, it was found that the best evaporation temperatures to prepare ordered mesoporous
TiO2 were 40 or 60 °C. In addition, the obtained results form study conditions of removal
surfactant indicated that the surfactant extraction step was necessary in order to obtain a
titania framework which conserves the hexagonal ordered structure during the thermal
induced crystallization. In contrast, two extraction steps seem to be sufficient for removing
the surfactant. Extraction temperature should be high as possible to remove the surfactant as
far as possible in order to avoid collapse of the ordered mesostructure during the following
thermal treatment. The effect of molar P123/Ti(OiPr)4 ratio indicted that the high molar ratio
leads to collapse of ordered mesoporous TiO2. The effect of titanium source on the textural
and structural properties of TiO2 showed that the high order mesoporous structure was
obtained by using titanium isopropoxide as titanium source. Based on the effect of the
previous parameters, it can be concluded that the best hexagonal ordered mesoporous TiO2
was obtained with 0.0163 molar P123/ Ti(OiPr)4 ratio, 40 °C evaporation temperature, 2 or 4
times extraction at 78 °C, and 450 °C calcination temperature under Ar for 6.5 h then O2 for 2
h. Generally, the phase composition of obtained materials has been not influenced by above
various parameters. The crystal phase obtained after thermal treatment were mainly anatase
TiO2 together with minor reflections attributed of β-TiO2.
Moreover, the pristine mesoporous titania showed high catalytic activity for
photodegradation of phenol under visible light. The reason for that is the presence of carbon
and nitrogen, which leads to enhancement of the photocatalytic activity in visible region. The
total nitrogen and carbon content was very low. The carbon was assumed to be residuals
originating from residuals of the titanium precursor and/or the surfactant. The nitrogen was
presented from treatment of gel in ammonia atmosphere. The influence of the structural
parameters on photocatalytic activity of phenol degradation is relatively small. There is no
correlation between BET surfaces area and degree of ordering.

96
Second, for the metal (Fe, Co, and Ni)- doped titania, the obtained results showed that
ordering of mesoporous titania framework obtained after the thermal induced crystallization is
influenced by the amount of added doping metal. For 0.5 mol% Fe, Co and Ni, the hexagonal
ordered mesoporous structure successfully observed after titania precipitation was mainly
maintained during the crystallization process. The reason for that might be due to the
homogenous distribution of metal ions inside the gel formed during solvent evaporation.
Moreover, the low content of the doping metal has no obvious effect on the titania
crystallization during thermal annealing. This is due to formation of crystallites with nearly
identical particle size as obtained in pristine titania. On the other hand, at higher metal content
(5 mol%), the synthesis of hexagonal ordered mesoporous titania was influenced by the
particular Fe or Co. While for higher Ni content after annealing the same ordered mesoporous
structure was obtained as for low Ni content, the sample doped with Co loses their
mesoporous ordering during the calcination process. Additional processes like surface
segregation might occur during titania crystallization leading to formation of bigger titania
crystallites and amorphous doped metal oxide surface structures. The 0.5 mol% Fe, Co and
Ni-doped ordered mesoporous TiO2 showed BET surface areas higher than 5 mol% Fe, Co
and Ni-doped ordered mesoporous TiO2.
Moreover, the photocatalytic activity of the 0.5 mol% Fe, Co and Ni-doped ordered
mesoporous TiO2 showed enhanced phenol degradation under UV light irradiation compared
to the pristine TiO2. In addition, the samples doped with 0.5 mol% Fe and Ni-doped showed
also higher photocatalytic activity than the pristine TiO2 under white light irradiation. These
results prove that the doping metal is involved in processes running after generation of the
charge carrier by irradiation of the sample with light. The charge carrier might interact both
with the doping element itself or defects created in their environment.
All the metal-doped TiO2 samples and pristine TiO2 showed higher photoactivity
degradation of phenol than P25 under visible light. The reason for this higher photoactivity
might be due to the acting of these metals as charge carrier trap. Otherwise, it cannot be
excluded that the photocatalytic activity in the visible range is caused by the presence of
nitrogen or carbon which were not completely removed during the extraction in boiling
ethanol and the following thermal treatment. This assumption would explain also the low
differences in photocatalytic activity between the pristine and the metal doped materials when
using visible light irradiation ( > 420 nm).

97
Third, for the N-doped titania, the obtained results indicate that the parameters used for
titania crystallization have influences on the structural characteristics and the photocatalytic
activity. Factors studied were the crystallization temperature, the heating rate, and the
influence of water vapor. Moreover, the effect of the successive oxygen treatment has been
also explored.
The temperature applied for titania crystallization has a strong influence on the
mesoporous ordering. The presence of hexagonal ordered mesoporous domains in at
crystallization at 450 °C was confirmed by SAXS and STEM-HAADF. Moreover, the EELS
spectrum indicates that the nitrogen was located mainly on the surface of titania when heating
the sample in ammonia. XPS analysis showed the presence of interstitial nitrogen doping
(TiO2Nx) and substitutional nitrogen doping (TiO2-xNx). Higher crystallization temperature
(550 °C) led to a loss of the mesoporous ordering. On the other hand, the titania crystallinity
was increasing with raising heating temperature.
The successive treatment in oxygen led to a loss of mesoporous ordering independent
which temperature was used for crystallization under ammonia. This indicates that the
treatment with oxygen has a larger effect on ordering of the mesoporous structure as the
presence of ammonia. BET surface area decreased when the material was successive treated
in oxygen. This suggests that pores walls were lost during the oxygen treatment although the
mean pore size does not increase strongly. The photocatalytic results obtained under
irradiation with white or visible light after successive oxygen treatment showed higher
photocatalytic activity for the sample prepared at 450 °C under ammonia than the samples
prepared at 350 or 450 °C. It was assumed that interstitial nitrogen led to formation of oxygen
vacancies in the structure.
The effect of the heating rates (0.6, 1.2, and 2.4 °C/min) under ammonia atmosphere on
the structural characteristics and photocatalytic activity were also investigated. The ordered
mesoporous structure, crystal phase and crystallite size were approximately independent of
the heating rate. After a successive oxygen treatment, a strong loss of mesoporous ordering
was found when the material was prepared at heating rate of 0.6 and 2.4 °C/min under
ammonia atmosphere. Again, BET surface area decreased when the material was successive
treated with oxygen. Moreover, it was found that the heating rate has approximately no
influence on the light absorption in the visible range when the samples were treated with
gaseous ammonia. This might be considered as indication that the amount of nitrogen bound
to the titania surface does not depend on the applied heating rate. The photocatalytic results
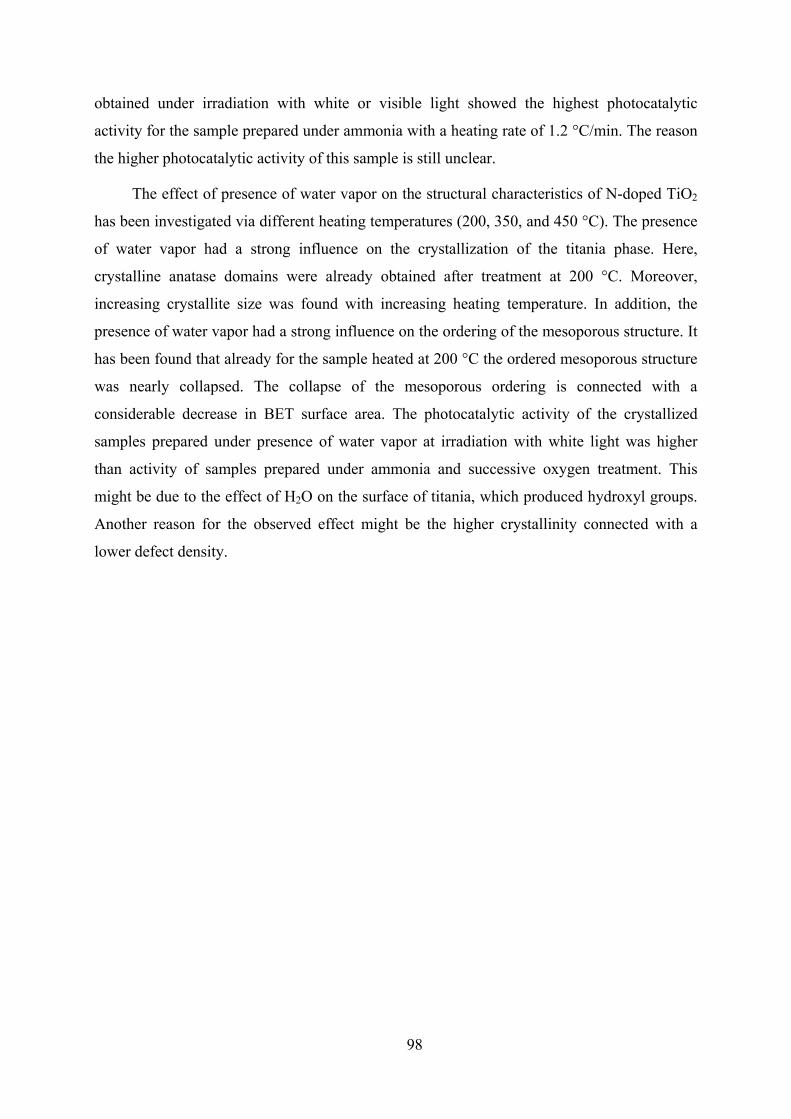
98
obtained under irradiation with white or visible light showed the highest photocatalytic
activity for the sample prepared under ammonia with a heating rate of 1.2 °C/min. The reason
the higher photocatalytic activity of this sample is still unclear.
The effect of presence of water vapor on the structural characteristics of N-doped TiO2
has been investigated via different heating temperatures (200, 350, and 450 °C). The presence
of water vapor had a strong influence on the crystallization of the titania phase. Here,
crystalline anatase domains were already obtained after treatment at 200 °C. Moreover,
increasing crystallite size was found with increasing heating temperature. In addition, the
presence of water vapor had a strong influence on the ordering of the mesoporous structure. It
has been found that already for the sample heated at 200 °C the ordered mesoporous structure
was nearly collapsed. The collapse of the mesoporous ordering is connected with a
considerable decrease in BET surface area. The photocatalytic activity of the crystallized
samples prepared under presence of water vapor at irradiation with white light was higher
than activity of samples prepared under ammonia and successive oxygen treatment. This
might be due to the effect of H2O on the surface of titania, which produced hydroxyl groups.
Another reason for the observed effect might be the higher crystallinity connected with a
lower defect density.

99
5 Appendix
Figure A1. STEM-HAADF images of the material were the solvent was evaporated at 40 °C (A,B,C) and 70 °C (D,E,F); (A,D) after treatment with ammonia, (B,E) after surfactant extraction, and (C,F) after calcination.
A D
B
C
E
F

100
Figure A2. STEM-HAADF image of the sample synthesized with solvent evaporation temperature of 40 °C after ammonia treatment – (left) and the EDX spectra of the marked area – (right) (the sample was deposited on Cu-grid).
Figure A3. STEM-HAADF image of the sample synthesized with solvent evaporation temperature of 70 °C after ammonia treatment – (left) and the EDX spectra of the marked area – (right) (the sample was deposited on Cu-grid).
009009
200 nm200 nm200 nm200 nm200 nm0.00 1.00 2.00 3.00 4.00 5.00 6.00 7.00 8.00 9.00 10.00
keV
009
0100200300400500600700800900
1000
Cou
nts
CKa
OKa
ClK
aC
lKb
TiLl
TiLa
TiKe
sc
TiKa
TiKb
CuL
l CuL
a
CuK
a
CuK
b
001001
100 nm100 nm100 nm100 nm100 nm0.00 1.00 2.00 3.00 4.00 5.00 6.00 7.00 8.00 9.00 10.00
keV
001
0153045607590
105120135150165180
Coun
ts
CKa
OKa
SiKa
ClK
aC
lKb
CaK
aC
aKb
TiLl
TiLa Ti
Kesc
TiKa
TiKb
CuL
l CuL
a
CuK
a
CuK
b

101
Figure A4. STEM-HAADF image of the sample synthesized with solvent evaporation temperature of 40 °C after surfactant removal in boiling ethanol – (left) and the EDX spectra of the marked area – (right) (the sample was deposited on Cu-grid).
Figure A5. STEM-HAADF image of the sample synthesized with solvent evaporation temperature of 70 °C after surfactant removal in boiling ethanol – (left) and the EDX spectra of the marked area – (right) (the sample was deposited on Cu-grid).
006006
200 nm200 nm200 nm200 nm200 nm0.00 1.00 2.00 3.00 4.00 5.00 6.00 7.00 8.00 9.00 10.00
keV
006
0100200300400500600700800900
100011001200
Coun
ts
CKa
OKa
SiKa
ClK
aC
lKb
TiLl
TiLa
TiKe
sc
TiKa
TiKb
CuL
l CuL
a
CuK
a
CuK
b
005005
100 nm100 nm100 nm100 nm100 nm0.00 1.00 2.00 3.00 4.00 5.00 6.00 7.00 8.00 9.00 10.00
keV
005
080
160240320400480560640720800
Coun
ts
CKa
OKa
ClK
aC
lKb
TiLl
TiLa
TiKe
sc
TiKa
TiKb
CuL
l CuL
a CuK
a
CuK
b
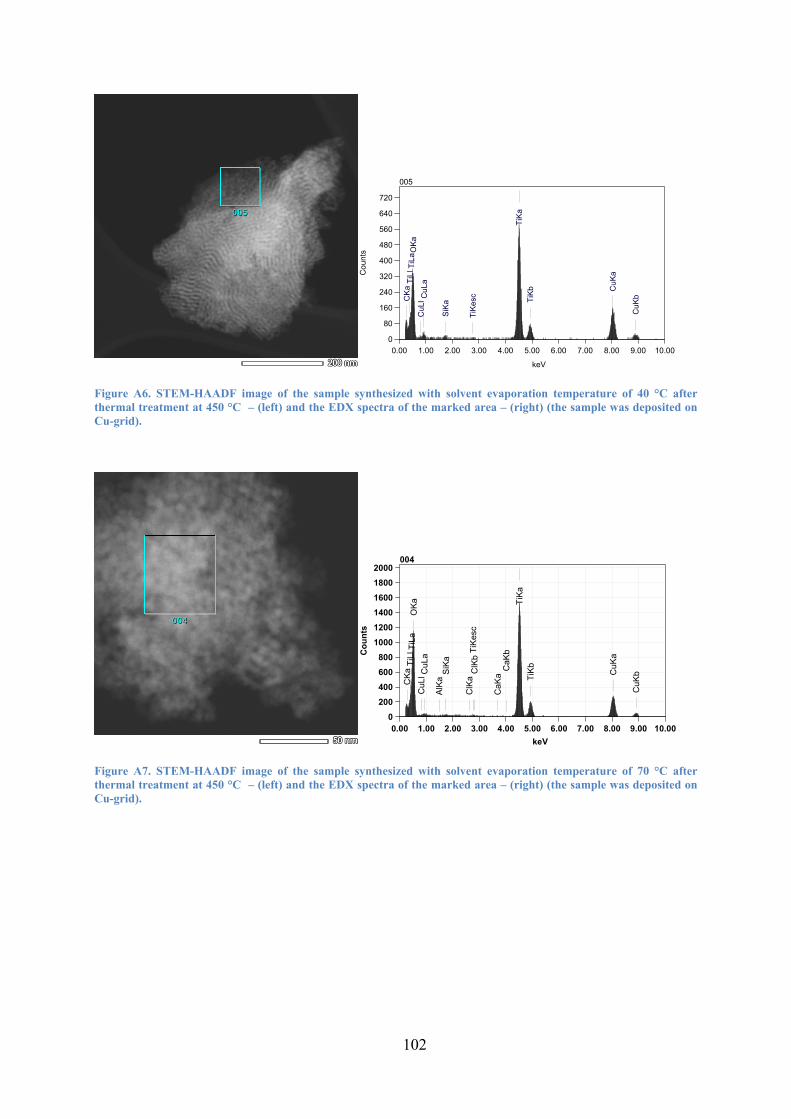
102
Figure A6. STEM-HAADF image of the sample synthesized with solvent evaporation temperature of 40 °C after thermal treatment at 450 °C – (left) and the EDX spectra of the marked area – (right) (the sample was deposited on Cu-grid).
Figure A7. STEM-HAADF image of the sample synthesized with solvent evaporation temperature of 70 °C after thermal treatment at 450 °C – (left) and the EDX spectra of the marked area – (right) (the sample was deposited on Cu-grid).
005005
200 nm200 nm200 nm200 nm200 nm0.00 1.00 2.00 3.00 4.00 5.00 6.00 7.00 8.00 9.00 10.00
keV
005
0
80
160
240
320
400
480
560
640
720
Cou
nts
CKa
OKa
SiKa
TiLl
TiLa
TiKe
sc
TiKa
TiKb
CuL
l CuL
a
CuK
a
CuK
b
004004
50 nm50 nm50 nm50 nm50 nm0.00 1.00 2.00 3.00 4.00 5.00 6.00 7.00 8.00 9.00 10.00
keV
004
0200400600800
100012001400160018002000
Coun
ts
CKa
OKa
AlKa
SiKa
ClK
aC
lKb
CaK
aC
aKb
TiLl
TiLa
TiKe
sc
TiKa
TiKb
CuL
l CuL
a
CuK
a
CuK
b

103
0.0 0.2 0.4 0.6 0.8 1.0
0
100
200
300
400
500
600P123/Ti(OPr)4 : 0.0163
0 5 10 15 20 25
0,0
0,1
0,2
0,3
0,4
0,5
0,6 3.86nm
dVp/
d(rp
)
pore diameter/nm
V ads
orbe
d /(c
m3 /
g ST
P)
Relative pressure p/p0
Figure A8. Nitrogen adsorption–desorption isotherm and the corresponding BJH pore size distribution (inset) of the sample synthesized with solvent evaporation temperature of 40 °C after surfactant extraction.
0 10 20 30 40 50 60 70 80 90
0.0400
0.0250
0.0200
0.0163
0.0140
0.0126
Inte
nsity
/ a.
u.
2 theta/ grd
0.0105
Anatasbeta-TiO2
Figure A9. XRD patterns of TiO2 prepared with different molar P123/Ti(OiPr)4 ratios in 5.4 M of HCl at 40 °C, after calcination.

104
0.0 0.2 0.4 0.6 0.8 1.0
0
20
40
60
80
100
120
140
160
180
200P123/Ti(OiPr)4: 0.014
0 5 10 15 20 25-0,1
0,0
0,1
0,2
0,3
0,4
0,5
0,6
0,7
0,8 3.86nm
dVp/
d(rp
)
pore diameter/nm
AM58D
Relative pressure
Va/c
m^3
(STP
) g^-
1
p/p00.0 0.2 0.4 0.6 0.8 1.0
0
20
40
60
80
100
120
140
160 P123/Ti(OiPr)4: 0.04
0 5 10 15 20 25
0,00
0,05
0,10
0,15
0,203.86nm
dVp/
d(rp
)
pore diameter/nm
AM61D
Relative pressure
Va/c
m^3
(STP
) g^-
1
p/p0
0.0 0.2 0.4 0.6 0.8 1.0
0
20
40
60
80
100
120
140
160
180
200P123/Ti(OiPr)4: 0.0126
0 5 10 15 20 25
0,0
0,2
0,4
0,6
0,83.86nm
dVp/
d(rp
)
pore diameter/nm
AM62
Relative pressure
Va/c
m^3
(STP
) g^-
1
p/p00.0 0.2 0.4 0.6 0.8 1.0
0
20
40
60
80
100
120
140
160 P123/Ti(OiPr)4: 0.025
0 5 10 15 20 25
0,00
0,02
0,04
0,06
0,08
0,10
0,12
0,14 3.86nm
dVp/
d(rp
)
pore diameter/nm
AM60D
Relative pressure
Va/c
m^3
(STP
) g^-
1
p/p0
0.0 0.2 0.4 0.6 0.8 1.0
0
20
40
60
80
100
120
140 P123/Ti(OiPr)4: 0.0105
0 5 10 15 20 25
0,0
0,1
0,2
0,3
0,4
0,5
0,6
0,7 3.86nm
dVp/
d(rp
)
pore diameter/nm
AM63D
Relative pressure
Va/c
m^3
(STP
) g^-
1
p/p00.0 0.2 0.4 0.6 0.8 1.0
0
50
100
150
200P123/Ti(OiPr)4: 0.02
0 5 10 15 20 25
0,00
0,05
0,10
0,15
0,20
0,25
0,30
3.86nm
dVp/
d(rp
)
pore diameter/nm
AM59D
Relative pressure
Va/c
m^3
(STP
) g^-
1
p/p0
Figure A10. Nitrogen adsorption –desorption isotherms and the corresponding BJH pore size distributions for different molar P123/Ti(OiPr)4 ratio.
0.0 0.2 0.4 0.6 0.8 1.0
0
50
100
150
200
0 5 10 15 20 25
0,0
0,1
0,2
0,3
0,4
0,5
0,6 3.86nm
B
A
Relative pressure
Va/c
m^3
(STP
) g^-
1
p/p0
P123/Ti(OiPr)4: 0.0163

105
Figure A11. High resolution STEM ABF images of doped titania samples obtained after thermal treatment A) doped with 0.5 mol% Fe, B) doped with 0.5 mol% Co, C) doped with 0.5 mol% Ni, (to see better the lattice planes STEM ABF was applied because of the higher depth of the focus compared to STEM HAADF).
A B
C

106
Figure A12. EDX spectra of the sample doped with 0.5 mol% Fe at two different areas.
Figure A13. EDX spectra of the sample doped with 0.5 mol% Co at two different areas.
Figure A14. EDX spectra of the sample doped with 0.5 mol% Ni at two different areas.
004004
003003
0,5 µm0,5 µm0,5 µm0,5 µm0,5 µm0.00 1.00 2.00 3.00 4.00 5.00 6.00 7.00 8.00 9.00 10.00
keV
0
800
1600
2400
3200
4000
4800
5600
6400
7200
8000
Cou
nts
003
CKa
OKa
SiKa
TiLl
TiLa
TiKe
sc
TiKa
TiKb
FeLl
FeLa
FeKe
sc
FeKa
FeKb
CuL
l CuL
a
CuK
a
CuK
b
004
CKa
OKa
SiKa
TiLl
TiLa
TiKe
sc
TiKa
TiKb
FeLl
FeLa
FeKe
sc
FeKa
FeKb
CuL
l CuL
a
CuK
a
CuK
b
005005
002002
200 nm200 nm200 nm200 nm200 nm0.00 1.00 2.00 3.00 4.00 5.00 6.00 7.00 8.00 9.00 10.00
keV
0
100
200
300
400
500
600
700
800
900
1000
Cou
nts
002
CKa
OKa
SiKa
ClK
aC
lKb
TiLl
TiLa
TiKe
sc
TiKa
TiKb
CoL
l CoL
a
CoK
esc
CoK
a
CoK
b
NiL
l NiL
a
NiK
esc
NiK
a
NiK
b
CuL
l CuL
a
CuK
a
CuK
b005
CKa
OKa
SiKa
ClK
aC
lKb
TiLl
TiLa
TiKe
sc
TiKa
TiKb
CoL
l CoL
a
CoK
esc
CoK
a
CoK
b
NiL
l NiL
a
NiK
esc
NiK
a
NiK
b
CuL
l CuL
a
CuK
a
CuK
b
012012
009009
100 nm100 nm100 nm100 nm100 nm0.00 1.00 2.00 3.00 4.00 5.00 6.00 7.00 8.00 9.00 10.00
keV
0
100
200
300
400
500
600
700
800
900
1000
Cou
nts
009
CKa
OKa
SiKa
TiLl
TiLa
TiKe
sc
TiKa
TiKb
NiL
l NiL
a
NiK
esc
NiK
a
NiK
b
CuL
l CuL
a
CuK
a
CuK
b
012
CKa
OKa
SiKa
TiLl
TiLa
TiKe
sc
TiKa
TiKb
NiL
l NiL
a
NiK
esc
NiK
a
NiK
b
CuL
l CuL
a
CuK
a
CuK
b
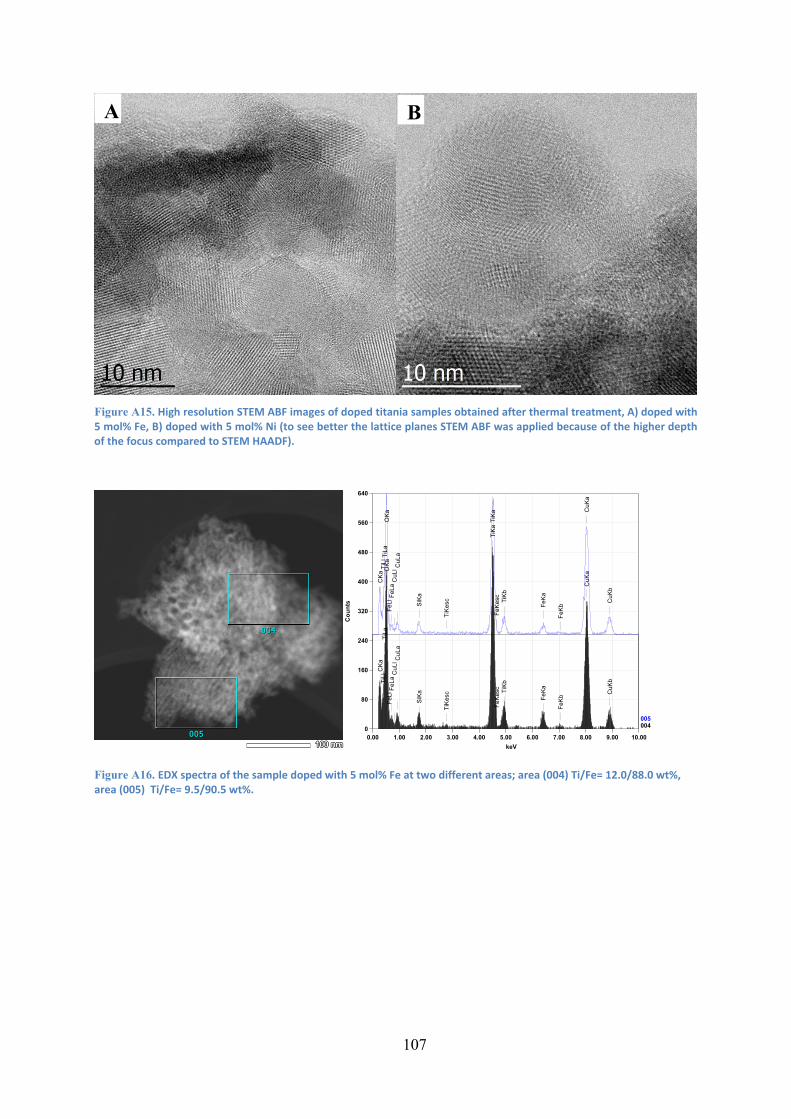
107
Figure A15. High resolution STEM ABF images of doped titania samples obtained after thermal treatment, A) doped with 5 mol% Fe, B) doped with 5 mol% Ni (to see better the lattice planes STEM ABF was applied because of the higher depth of the focus compared to STEM HAADF).
Figure A16. EDX spectra of the sample doped with 5 mol% Fe at two different areas; area (004) Ti/Fe= 12.0/88.0 wt%, area (005) Ti/Fe= 9.5/90.5 wt%.
005005
004004
100 nm100 nm100 nm100 nm100 nm0.00 1.00 2.00 3.00 4.00 5.00 6.00 7.00 8.00 9.00 10.00
keV
0
80
160
240
320
400
480
560
640
Cou
nts
004
CKa
OKa
SiKa
TiLl
TiLa
TiKe
sc
TiKa
TiKb
FeLl
FeLa
FeKe
sc
FeKa
FeKb
CuL
l CuL
a
CuK
a
CuK
b
005
CKa
OKa
SiKa
TiLl
TiLa
TiKe
sc
TiKa
TiKb
FeLl
FeLa
FeKe
sc
FeKa
FeKb
CuL
l CuL
a
CuK
a
CuK
b
A B

108
Figure A17. EDX spectra of the sample doped with 5 mol% Ni at two different areas; area (018) Ti/Ni= 93.3/6.1 wt%, area (019) Ti/Ni= 74.2/25.8 wt% (larger NiO nanoparticle was included).
Figure A18. HAADF STEM images of the sample prepared with 5 mol% Ni in different magnification (A and B) and results
of EDX mapping using the NiKα line (C).
019019018018
200 nm200 nm200 nm200 nm200 nm0.00 1.00 2.00 3.00 4.00 5.00 6.00 7.00 8.00 9.00 10.00
keV
0
300
600
900
1200
1500
1800
2100
2400
2700
3000
Cou
nts
018
CKa
OKa
SiKa
TiLl
TiLa
TiKe
sc
TiKa
TiKb
NiL
l NiL
a
NiK
esc
NiK
a
NiK
b
CuL
l CuL
a
CuK
a
CuK
b
019
CKa
OKa
SiKa
TiLl
TiLa
TiKe
sc
TiKa
TiKb
NiL
l NiL
a
NiK
esc
NiK
a
NiK
b
CuL
l CuL
a
CuK
a
CuK
b
C
A B

109
23 24 25 26 27 28 29
undoped TiO2
2 / grd
inte
nsity
/ a.u
.
Co-doped TiO2
Fe-doped TiO2
Ni-doped TiO2
A
23 24 25 26 27 28 29
undoped TiO2
Ni-doped TiO2
inte
nsity
/ a.u
.2 / grd
Co-doped TiO2
Cu-doped TiO2
Fe-doped TiO2
B
Figure A19. Comparison of the position of the 002 reflexes of anatase in calcined samples doped with A) 0.5 mol% and B) 5 mol%.
0,0 0,2 0,4 0,6 0,8 1,0
A
Co
un-doped
Fe
Ni
V a/cm
3 (STP
).g-1
p/p0
0,0 0,2 0,4 0,6 0,8 1,0
Ni
Co
V a/cm
3 (STP
).g-1
p/p0
Fe
B
Figure A20. Adsorption‐desorption isotherms for calcined materials synthesized with ‐ A) 0.5 mol% metal and B) 5 mol% metal.

110
Figure A21. XPS spectra of the Fe2p3/2 region for the sample doped with 0.5 mol% Fe

111
6 References
[1] X. Chen, S.S. Mao, Chem. Rev, 107 (2007) 2891-2959.
[2] R. Zhang, A.A. Elzatahry, S.S. Al-Deyab, D. Zhao, Nano Today, 7 (2012) 344-366.
[3] A.A. Ismail, D.W. Bahnemann, J. Mater. Chem., 21 (2011) 11686-11707.
[4] J. Peral, X. Domenech, D.F. Ollis, J. Chem. Technol. Biotechnol., 70 (1997) 117-140.
[5] R.J. Tayade, R.G. Kulkarni, R.V. Jasra, Ind. Eng. Chem. Res., 45 (2006) 5231-5238.
[6] D. Kanakaraju, B.D. Glass, M. Oelgemöller, Env. Chem. Lett., 12 (2014) 27-47.
[7] P. Dzik, M. Veselý, M. Kete, E. Pavlica, U.k.L.i. Štangar, M. Neumann-Spallart, ACS
App. Mat. Int., 7 (2015) 16177-16190.
[8] W.-N. Zhao, Z.-P. Liu, Chem. Sci., 5 (2014) 2256-2264.
[9] K. Nakata, A. Fujishima, J. Photochem. Photobiol., C, 13 (2012) 169-189.
[10] T.L. Thompson, J.T. Yates, Chem. Rev., 106 (2006) 4428-4453.
[11] A. Fujishima, T.N. Rao, D.A. Tryk, J. Photochem. Photobiol., C, 1 (2000) 1-21.
[12] T. Wang, X. Meng, P. Li, S. Ouyang, K. Chang, G. Liu, Z. Mei, J. Ye, Nano Energy, 9
(2014) 50-60.
[13] V. Binas, D. Venieri, D. Kotzias, G. Kiriakidis, Journal of Materiomics, 3 (2017) 3-16.
[14] J. Schneider, M. Matsuoka, M. Takeuchi, J. Zhang, Y. Horiuchi, M. Anpo, D.W.
Bahnemann, Chem. Rev., 114 (2014) 9919-9986.
[15] S. Mugundan, B. Rajamannan, G. Viruthagiri, N. Shanmugam, R. Gobi, P. Praveen,
Appl. Nanosci., 5 (2015) 449-456.
[16] A. Fujishima, K. Honda, Nature, 238 (1972) 37.
[17] M.R.D. Khaki, M.S. Shafeeyan, A.A.A. Raman, W.M.A.W. Daud, J. Environ. Manage.,
198 (2017) 78-94.
[18] Z. Liu, Y.G. Andreev, A.R. Armstrong, S. Brutti, Y. Ren, P.G. Bruce, Prog. Mater
Sci.:Mat. Intern., 23 (2013) 235-244.
[19] Y. Li, X. Sun, H. Li, S. Wang, Y. Wei, Powder Technol., 194 (2009) 149-152.
[20] A.A. Gribb, J.F. Banfield, Am. Mineral., 82 (1997) 717-728.
[21] S. Bagheri, K. Shameli, S.B. Abd Hamid, J. Chem-NY, 2013 (2012).
[22] T. Luttrell, S. Halpegamage, J. Tao, A. Kramer, E. Sutter, M. Batzill, Scientific Reports,
4 (2014) 4043.
[23] L. Zhang, C. Ni, H. Jiu, H. Chen, G. Qi, J. Mater. Sci-Mater. El., 28 (2017) 6601-6606.
[24] J.L. Vivero-Escoto, Y.-D. Chiang, K.C. Wu, Y. Yamauchi, Sci. Technol. Adv. Mat., 13
(2012) 013003.
[25] T. Hongo, A. Yamazaki, Micropor. Mesopor. Mat., 142 (2011) 316-321.

112
[26] B. Elgh, N. Yuan, H.S. Cho, D. Magerl, M. Philipp, S.V. Roth, K.B. Yoon, P. Müller-
Buschbaum, O. Terasaki, A.E. Palmqvist, APL Materials, 2 (2014) 113313.
[27] H. Shibata, T. Ogura, T. Mukai, T. Ohkubo, H. Sakai, M. Abe, J. Am. Chem. Soc., 127
(2005) 16396-16397.
[28] C.-W. Wu, T. Ohsuna, M. Kuwabara, K. Kuroda, J. Am. Chem. Soc., 128 (2006) 4544-
4545.
[29] D. Grosso, G. de AA Soler‐Illia, F. Babonneau, C. Sanchez, P.A. Albouy, A. Brunet‐
Bruneau, A.R. Balkenende, Adv. Mater., 13 (2001) 1085-1090.
[30] B. Smarsly, D. Grosso, T. Brezesinski, N. Pinna, C. Boissière, M. Antonietti, C. Sanchez,
Chem. Mater., 16 (2004) 2948-2952.
[31] Y. Bian, X. Wang, Z. Zeng, Z. Hu, Surf. Interface Anal., 45 (2013) 1317-1322.
[32] R. Keshavarzi, V. Mirkhani, M. Moghadam, S. Tangestaninejad, I. Mohammadpoor-
Baltork, J. Mater. Chem. A, 3 (2015) 2294-2304.
[33] M.E. Davis, Nature, 417 (2002) 813.
[34] W. Li, Z. Wu, J. Wang, A.A. Elzatahry, D. Zhao, Chem. Mater., 26 (2013) 287-298.
[35] P. Müller, Pure Appl. Chem, 31 (1972) 578.
[36] W. Zhou, H. Fu, ChemCatChem, 5 (2013) 885-894.
[37] J. Ebelman, M. Bouquet, Ann. Chim. Phys., 17 (1846) 54-73.
[38] C.B. Carter, M.G. Norton, Ceramic materials: science and engineering, Springer Science
& Business Media, 2007.
[39] S. Gupta, M. Tripathi, Open Chemistry, 10 (2012) 279-294.
[40] Q. Yin, J. Xiang, X. Wang, X. Guo, T. Zhang, J. Exp. Nanosci., 11 (2016) 1127-1137.
[41] L. Mahoney, R.T. Koodali, Materials, 7 (2014) 2697-2746.
[42] S. Bagheri, Z.A.M. Hir, A.T. Yousefi, S.B.A. Hamid, Micropor. Mesopor. Mat., 218
(2015) 206-222.
[43] T. Kimura, The Chemical Record, 16 (2016) 445-457.
[44] J. Tao, Y. Shen, F. Gu, J. Zhu, J. Zhang, J. Mater. Sci. Technol., 23 (2007) 513-516.
[45] T. Benkacem, N. Agoudjil, Am J Appl Sci, 5 (2008) 1437-1441.
[46] J. Blanchard, M. In, B. Schaudel, C. Sanchez, Eur. J. Inorg. Chem., 1998 (1998) 1115-
1127.
[47] D.M. Antonelli, J.Y. Ying, Angew. Chem. Int. Ed., 34 (1995) 2014-2017.
[48] I. Kartini, P. Meredith, J.D. Da Costa, G. Lu, J. Sol-Gel Sci. Technol., 31 (2004) 185-
189.
[49] S. Yuan, Q. Sheng, J. Zhang, F. Chen, M. Anpo, Mater. Lett., 58 (2004) 2757-2760.

113
[50] N. Tanasković, Ž. Radovanović, V. Đokić, J. Krstić, S. Drmanić, D. Janaćković, R.
Petrović, Superlattices Microstruct., 46 (2009) 217-222.
[51] M.V. Swapna, K.R. Haridas, J. Exp. Nanosci., 11 (2016) 540-549.
[52] S.C. Zi, S. Chandren, L.S. Yuan, R. Razali, C.S. Ho, D. Hartanto, T.M.I. Mahlia, H. Nur,
Solid State Sciences, 52 (2016) 83-91.
[53] R. Ameta, S.C. Ameta, Photocatalysis: Principles and Applications, CRC Press, 2016.
[54] S.Z. Islam, S. Nagpure, D.Y. Kim, S.E. Rankin, Inorganics, 5 (2017) 15.
[55] H. Zhang, C. Liang, J. Liu, Z. Tian, G. Wang, W. Cai, Langmuir, 28 (2012) 3938-3944.
[56] C. Dette, M.A. Pérez-Osorio, C.S. Kley, P. Punke, C.E. Patrick, P. Jacobson, F. Giustino,
S.J. Jung, K. Kern, Nano Lett., 14 (2014) 6533-6538.
[57] R. Daghrir, P. Drogui, D. Robert, Ind. Eng. Chem. Res., 52 (2013) 3581-3599.
[58] A. Zaleska, Recent Patents on Engineering, 2 (2008) 157-164.
[59] M. Zhou, J. Yu, B. Cheng, H. Yu, Mater. Chem. Phys., 93 (2005) 159-163.
[60] J. Zhu, F. Chen, J. Zhang, H. Chen, M. Anpo, J. Photochem. Photobiol., A, 180 (2006)
196-204.
[61] J. Zhu, J. Ren, Y. Huo, Z. Bian, H. Li, J. Phys. Chem. C, 111 (2007) 18965-18969.
[62] S. TANG, J. HE, Z. ZHANG, J. Chin. Ceram. Soc., 40 (2012) 950-956.
[63] P. Goswami, J.N. Ganguli, Mater. Res. Bull., 47 (2012) 2077-2084.
[64] M. Piumetti, F.S. Freyria, M. Armandi, F. Geobaldo, E. Garrone, B. Bonelli, Catal.
Today, 227 (2014) 71-79.
[65] Y. Wang, W. Duan, B. Liu, X. Chen, F. Yang, J. Guo, J. Nanomater., 2014 (2014) 63.
[66] C.W. Soo, J.C. Juan, C.W. Lai, S.B.A. Hamid, R.M. Yusop, J. Taiwan Inst. Chem. Eng.,
(2016).
[67] N.M. Nursam, J.Z. Tan, X. Wang, W. Li, F. Xia, R.A. Caruso, ChemistrySelect, 1 (2016)
4868-4878.
[68] P. Mazierski, M. Nischk, M. Gołkowska, W. Lisowski, M. Gazda, M.J. Winiarski, T.
Klimczuk, A. Zaleska-Medynska, Appl. Catal., B, 196 (2016) 77-88.
[69] S. Sato, Chem. Phys. Lett., 123 (1986) 126-128.
[70] S.A. Ansari, M.M. Khan, M.O. Ansari, M.H. Cho, New J. Chem., 40 (2016) 3000-3009.
[71] F. Huang, A. Yan, H. Zhao, Influences of Doping on Photocatalytic Properties of TiO2
Photocatalyst, Semiconductor Photocatalysis-Materials, Mechanisms and Applications,
InTech, 2016.
[72] R. Asahi, T. Morikawa, H. Irie, T. Ohwaki, Chem. Rev., 114 (2014) 9824-9852.
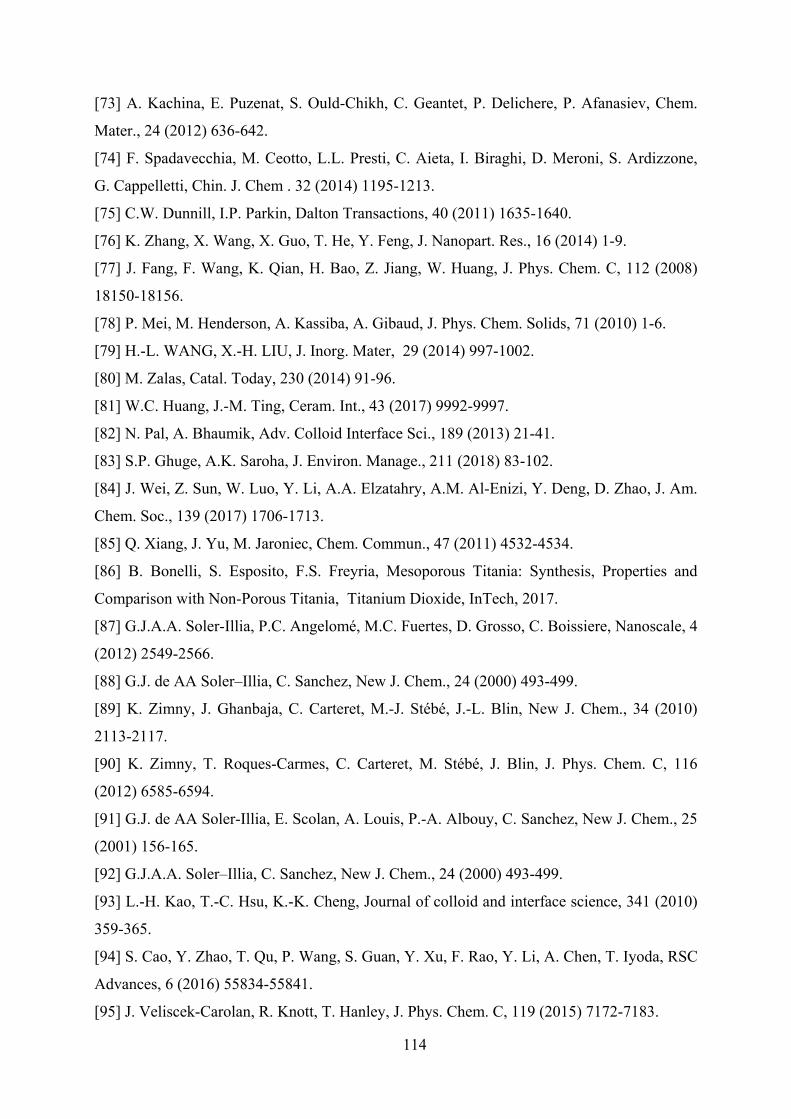
114
[73] A. Kachina, E. Puzenat, S. Ould-Chikh, C. Geantet, P. Delichere, P. Afanasiev, Chem.
Mater., 24 (2012) 636-642.
[74] F. Spadavecchia, M. Ceotto, L.L. Presti, C. Aieta, I. Biraghi, D. Meroni, S. Ardizzone,
G. Cappelletti, Chin. J. Chem . 32 (2014) 1195-1213.
[75] C.W. Dunnill, I.P. Parkin, Dalton Transactions, 40 (2011) 1635-1640.
[76] K. Zhang, X. Wang, X. Guo, T. He, Y. Feng, J. Nanopart. Res., 16 (2014) 1-9.
[77] J. Fang, F. Wang, K. Qian, H. Bao, Z. Jiang, W. Huang, J. Phys. Chem. C, 112 (2008)
18150-18156.
[78] P. Mei, M. Henderson, A. Kassiba, A. Gibaud, J. Phys. Chem. Solids, 71 (2010) 1-6.
[79] H.-L. WANG, X.-H. LIU, J. Inorg. Mater, 29 (2014) 997-1002.
[80] M. Zalas, Catal. Today, 230 (2014) 91-96.
[81] W.C. Huang, J.-M. Ting, Ceram. Int., 43 (2017) 9992-9997.
[82] N. Pal, A. Bhaumik, Adv. Colloid Interface Sci., 189 (2013) 21-41.
[83] S.P. Ghuge, A.K. Saroha, J. Environ. Manage., 211 (2018) 83-102.
[84] J. Wei, Z. Sun, W. Luo, Y. Li, A.A. Elzatahry, A.M. Al-Enizi, Y. Deng, D. Zhao, J. Am.
Chem. Soc., 139 (2017) 1706-1713.
[85] Q. Xiang, J. Yu, M. Jaroniec, Chem. Commun., 47 (2011) 4532-4534.
[86] B. Bonelli, S. Esposito, F.S. Freyria, Mesoporous Titania: Synthesis, Properties and
Comparison with Non-Porous Titania, Titanium Dioxide, InTech, 2017.
[87] G.J.A.A. Soler-Illia, P.C. Angelomé, M.C. Fuertes, D. Grosso, C. Boissiere, Nanoscale, 4
(2012) 2549-2566.
[88] G.J. de AA Soler–Illia, C. Sanchez, New J. Chem., 24 (2000) 493-499.
[89] K. Zimny, J. Ghanbaja, C. Carteret, M.-J. Stébé, J.-L. Blin, New J. Chem., 34 (2010)
2113-2117.
[90] K. Zimny, T. Roques-Carmes, C. Carteret, M. Stébé, J. Blin, J. Phys. Chem. C, 116
(2012) 6585-6594.
[91] G.J. de AA Soler-Illia, E. Scolan, A. Louis, P.-A. Albouy, C. Sanchez, New J. Chem., 25
(2001) 156-165.
[92] G.J.A.A. Soler–Illia, C. Sanchez, New J. Chem., 24 (2000) 493-499.
[93] L.-H. Kao, T.-C. Hsu, K.-K. Cheng, Journal of colloid and interface science, 341 (2010)
359-365.
[94] S. Cao, Y. Zhao, T. Qu, P. Wang, S. Guan, Y. Xu, F. Rao, Y. Li, A. Chen, T. Iyoda, RSC
Advances, 6 (2016) 55834-55841.
[95] J. Veliscek-Carolan, R. Knott, T. Hanley, J. Phys. Chem. C, 119 (2015) 7172-7183.

115
[96] I.-M. Hung, Y. Wang, L.-T. Lin, C.-F. Huang, J. Porous Mater., 17 (2010) 509-513.
[97] E.L. Crepaldi, G.J.d.A. Soler-Illia, D. Grosso, F. Cagnol, F. Ribot, C. Sanchez, J. Am.
Chem. Soc., 125 (2003) 9770-9786.
[98] C.J. Brinker, G.W. Scherer, Sol-gel science: the physics and chemistry of sol-gel
processing, Academic press, 2013.
[99] H. Khan, D. Berk, Catal. Lett., 144 (2014) 890-904.
[100] J. Livage, M. Henry, C. Sanchez, Prog. Solid State Chem., 18 (1988) 259-341.
[101] L. Chen, B. Yao, Y. Cao, K. Fan, J. Phys. Chem. C, 111 (2007) 11849-11853.
[102] M. Henderson, A. Gibaud, J.-F. Bardeau, J. White, J. Mater. Chem., 16 (2006) 2478-
2484.
[103] M.J. Henderson, K. Zimny, J.-L. Blin, N. Delorme, J.-F.o. Bardeau, A. Gibaud,
Langmuir, 26 (2009) 1124-1129.
[104] L. Chen, Y.-j. Li, X. Peng, Z.-s. Li, M.-x. Zeng, Trans. Nonferrous Met. Soc. China, 24
(2014) 1072-1078.
[105] R. Zhang, B. Tu, D. Zhao, Chem. Eur. J., 16 (2010) 9977-9981.
[106] H. Luo, C. Wang, Y. Yan, Chem. Mater., 15 (2003) 3841-3846.
[107] B. Tian, X. Liu, B. Tu, C. Yu, J. Fan, L. Wang, S. Xie, G.D. Stucky, D. Zhao, Nature
Mat., 2 (2003) 159.
[108] K. Assaker, T. Benamor, L. Michelin, B. Lebeau, C. Marichal, M.-J. Stébé, J.-L. Blin,
Micropor. Mesopor. Mat., 201 (2015) 43-49.
[109] K. Assaker, C.d. Carteret, B.n.d. Lebeau, C. Marichal, L. Vidal, M.-J. Stébé, J.-L. Blin,
ACS Sustain. Chem. Eng., 2 (2013) 120-125.
[110] J.-L. Blin, M.-J. Stébé, T. Roques-Carmes, Colloids Surf., A, 407 (2012) 177-185.
[111] J.S. Yin, Z.L. Wang, Adv. Mater., 11 (1999) 469-472.
[112] Y. Wang, Z.-H. Jiang, F.-J. Yang, Mater. Sci. Eng., B, 134 (2006) 76-79.
[113] X.-L. Yuan, J.-L. Zhang, M. Anpo, D.-N. He, Res. Chem. Intermed., 36 (2010) 83-93.
[114] T. Wang, X. Meng, G. Liu, K. Chang, P. Li, Q. Kang, L. Liu, M. Li, S. Ouyang, J. Ye,
J. Mater. Chem. A, 3 (2015) 9491-9501.
[115] S. Sajjad, S.A. Leghari, F. Chen, J. Zhang, Chem. Eur. J., 16 (2010) 13795-13804.
[116] K. Assaker, C. Carteret, T. Roques-Carmes, J. Ghanbaja, M.-J. Stébé, J.-L. Blin, New J.
Chem., 38 (2014) 2081-2089.
[117] Z. Li, A.A. Haidry, B. Gao, T. Wang, Z. Yao, Appl. Surf. Sci., 412 (2017) 638-647.
[118] S. Anandan, T. Rao, R. Gopalan, Y. Ikuma, J. Nanosci. Nanotechnol, 14 (2014) 3181-
3186.

116
[119] Z. Li, A.A. Haidry, B. Dong, L. Sun, Q. Fatima, L. Xie, Z. Yao, J. Alloys Compd., 742
(2018) 814-821.
[120] W.W. Anku, M.A. Mamo, P.P. Govender, Phenolic Compounds in Water: Sources,
Reactivity, Toxicity and Treatment Methods, Phenolic Compounds-Natural Sources,
Importance and Applications, InTech, 2017.
[121] J. Plotnikow, Verlag Walter de Gruyter & co., Berlin, 1936.
[122] M. Umar, H.A. Aziz, Photocatalytic degradation of organic pollutants in water,
Organic Pollutants-Monitoring, Risk and Treatment, InTech, 2013.
[123] J. Kou, C. Lu, J. Wang, Y. Chen, Z. Xu, R.S. Varma, Chem. Rev., 117 (2017) 1445-
1514.
[124] A.E. Machado, K.A. Borges, T.A. Silva, L.M. Santos, M.F. Borges, W.A. Machado,
B.P. Caixeta, M.D. França, S.M. Oliveira, A.G. Trovó, Applications of Mesoporous Ordered
Semiconductor Materials-Case Study of TiO2, Solar Radiation Applications, InTech, 2015.
[125] C.-Y. Wu, K.-J. Tu, J.-P. Deng, Y.-S. Lo, C.-H. Wu, Materials, 10 (2017) 566.
[126] M. Alvaro, C. Aprile, M. Benitez, E. Carbonell, H. García, J. Phys. Chem. B, 110
(2006) 6661-6665.
[127] J.A. Torres-Luna, N.R. Sanabria, J.G. Carriazo, Powder Technol., 302 (2016) 254-260.
[128] S. Ahmed, M. Rasul, W.N. Martens, R. Brown, M. Hashib, Water, Air, Soil Pollut., 215
(2011) 3-29.
[129] Y.-T. Lin, C.-H. Weng, H.-J. Hsu, Y.-H. Lin, C.-C. Shiesh, Int. J. Photoenergy, 2013
(2013).
[130] Z. Wang, W. Cai, X. Hong, X. Zhao, F. Xu, C. Cai, Appl. Catal., B, 57 (2005) 223-231.
[131] Z. Zhang, Z. Huang, X. Cheng, Q. Wang, Y. Chen, P. Dong, X. Zhang, Appl. Surf. Sci.,
355 (2015) 45-51.
[132] P.A. Mangrulkar, S.P. Kamble, M.M. Joshi, J.S. Meshram, N.K. Labhsetwar, S.S.
Rayalu, Int. J. Photoenergy, 2012 (2012).
[133] W. Zhou, F. Sun, K. Pan, G. Tian, B. Jiang, Z. Ren, C. Tian, H. Fu, Adv. Funct. Mater.,
21 (2011) 1922-1930.
[134] A. Alagarasi, P. Rajalakshmi, K. Shanthi, P. Selvam, Catal. Today, (2017).
[135] R. Alnaizy, A. Akgerman, Adv. Environ. Res., 4 (2000) 233-244.
[136] E. Grabowska, J. Reszczyńska, A. Zaleska, Water Res., 46 (2012) 5453-5471.
[137] L.G. Devi, K.E. Rajashekhar, J. Mol. Catal. A: Chem., 334 (2011) 65-76.
[138] Z. Zhou, H. Wang, Z. Zou, M. Du, J. Guo, Z. Yang, Mater. Res. Bull., 86 (2017) 287-
294.

117
[139] G.J.A.A. Soler-Illia, A. Louis, C. Sanchez, Chem. Mater., 14 (2002) 750-759.
[140] L. Robben, A.A. Ismail, D.W. Bahnemann, J.-C. Buhl, Micropor. Mesopor. Mat., 143
(2011) 277-283.
[141] K.S. Sing, D.H. Everett, R.A.W. Haul, L. Moscou, R.A. Pierotti, J. Rouquerol, T.
Siemieniewska, Pure Appl. Chem., 57 (1985) 603-619.
[142] S. Naumov, A. Khokhlov, R. Valiullin, J. Kärger, P.A. Monson, Phys. Rev. E, 78
(2008) 060601.
[143] R. López, R. Gómez, J. Sol-Gel Sci. Technol., 61 (2012) 1-7.
[144] Y. Cong, J. Zhang, F. Chen, M. Anpo, D. He, J. Phys. Chem. C, 111 (2007) 10618-
10623.
[145] F. Dong, W. Zhao, Z. Wu, Nanotechnology, 19 (2008) 365607.
[146] R. Venkatkarthick, D.J. Davidson, S. Vasudevan, G. Sozhan, S. Ravichandran,
ChemistrySelect, 2 (2017) 288-294.
[147] T. Hongo, A. Yamazaki, Microporous Mesoporous Mater., 142 (2011) 316-321.
[148] D. Grosso, G.J.A.A. Soler-Illia, E.L. Crepaldi, F. Cagnol, C. Sinturel, A. Bourgeois, A.
Brunet-Bruneau, H. Amenitsch, P.A. Albouy, C. Sanchez, Chem. Mater., 15 (2003) 4562-
4570.
[149] Q. Dai, L. Shi, Y. Luo, J. Blin, D. Li, C. Yuan, B. Su, J. Photochem. Photobiol., A, 148
(2002) 295-301.
[150] H.M. Kao, C.L. Chen, S.W. Chiao, J. Chin. Chem. Soc., 52 (2005) 693-699.
[151] M. Abdallah, N. Velikova, Y. Ivanova, Y. Dimitriev, J. Chem. Technol. Metall., 48
(2013) 571-576.
[152] R.G. Chaudhary, H.D. Juneja, R. Pagadala, N.V. Gandhare, M.P. Gharpure, J. SAUDI.
CHEM. SOC., 19 (2015) 442-453.
[153] K.S. Sing, Pure Appl. Chem., 57 (1985) 603-619.
[154] G. Calleja, D.P. Serrano, R. Sanz, P. Pizarro, A. García, Ind. Eng. Chem. Res., 43
(2004) 2485-2492.
[155] J.-K. Park, J.-J. Myoung, J.-B. Kyong, H.-K. Kim, Bull. Korean Chem. Soc., 24 (2003)
671-673.
[156] J. Blanchard, F. Ribot, C. Sanchez, P.-V. Bellot, A. Trokiner, J. Non-Cryst. Solids, 265
(2000) 83-97.
[157] W. Ren, Z. Ai, F. Jia, L. Zhang, X. Fan, Z. Zou, Appl. Catal., B, 69 (2007) 138-144.
[158] M. Dimitrov, R. Ivanova, N. Velinov, J. Henych, M. Slušná, V. Štengl, J. Tolasz, I.
Mitov, T. Tsoncheva, Nano-Structures & Nano-Objects, 7 (2016) 56-63.
118
[159] S. Karnjanakom, A. Bayu, X. Hao, S. Kongparakul, C. Samart, A. Abudula, G. Guan, J.
Mol. Catal. A: Chem., (2016).
[160] G. Pecchi, P. Reyes, T. Lopez, R. Gomez, A. Moreno, J. Fierro, A. Martínez-Arias, J.
Sol-Gel Sci. Technol., 27 (2003) 205-214.
[161] T. Tong, J. Zhang, B. Tian, F. Chen, D. He, J. Hazard. Mater., 155 (2008) 572-579.
[162] X. Li, P.-L. Yue, C. Kutal, New J. Chem., 27 (2003) 1264-1269.
[163] M. Graetzel, R.F. Howe, J. Phys. Chem., 94 (1990) 2566-2572.
[164] R. Janes, L. Knightley, C. Harding, Dyes and pigments, 62 (2004) 199-212.
[165] C. Adán, A. Bahamonde, M. Fernández-García, A. Martínez-Arias, Appl. Catal., B, 72
(2007) 11-17.
[166] O. Zuas, H. Budiman, Nano-Micro Letters, 5 (2013) 26-33.
[167] Q. Wang, R. Jin, M. Zhang, S. Gao, J. Alloys Compd., 690 (2017) 139-144.
[168] D. Zhang, J. Sol-Gel Sci. Technol., 58 (2011) 312-318.
[169] M. Zhou, J. Yu, B. Cheng, J. Hazard. Mater., 137 (2006) 1838-1847.
[170] B. Santara, B. Pal, P. Giri, J. Appl. Phys., 110 (2011) 114322.
[171] N. Smirnova, I. Petrik, V. Vorobets, G. Kolbasov, A. Eremenko, Nanoscale Res. Lett.,
12 (2017) 239.
[172] T. Umebayashi, T. Yamaki, H. Itoh, K. Asai, J. Phys. Chem. Solids, 63 (2002) 1909-
1920.
[173] G. Liu, L. Wang, H.G. Yang, H.-M. Cheng, G.Q.M. Lu, J. Mater. Chem., 20 (2010)
831-843.
[174] E. Grabowska, J. Reszczyńska, A. Zaleska, Water Res., 46 (2012) 5453-5471.
[175] C.M. Teh, A.R. Mohamed, J. Alloys Compd., 509 (2011) 1648-1660.
[176] W. Choi, A. Termin, M.R. Hoffmann, J. Phys. Chem., 98 (1994) 13669-13679.
[177] S. Mozia, M. Tomaszewska, B. Kosowska, B. Grzmil, A.W. Morawski, K. Kałucki,
Appl. Catal., B, 55 (2005) 195-200.
[178] S.M. El-Sheikh, G. Zhang, H.M. El-Hosainy, A.A. Ismail, K.E. O'Shea, P. Falaras,
A.G. Kontos, D.D. Dionysiou, J. Hazard. Mater., 280 (2014) 723-733.
[179] X. Chen, C. Burda, J. Am. Chem. Soc., 130 (2008) 5018-5019.
[180] F.N. Sayed, O. Jayakumar, R. Sasikala, R. Kadam, S.R. Bharadwaj, L. Kienle, U.
Schürmann, S.r. Kaps, R. Adelung, J. Mittal, J. Phys. Chem. C, 116 (2012) 12462-12467.
[181] J. Wang, D.N. Tafen, J.P. Lewis, Z. Hong, A. Manivannan, M. Zhi, M. Li, N. Wu, J.
Am. Chem. Soc., 131 (2009) 12290-12297.

119
[182] S.K. Kassahun, Z. Kiflie, D.W. Shin, S.S. Park, W.Y. Jung, Y.R. Chung, J. Sol-Gel Sci.
Technol., 82 (2017) 322-334.
[183] B. Wawrzyniak, A.W. Morawski, B. Tryba, Int. J. Photoenergy, 2006 (2006).
[184] B. Bharti, S. Kumar, H.-N. Lee, R. Kumar, Scientific Reports, 6 (2016) 32355.
[185] M. Kawashita, N. Endo, T. Watanabe, T. Miyazaki, M. Furuya, K. Yokota, Y. Abiko,
H. Kanetaka, N. Takahashi, Colloids and Surfaces B: Biointerfaces, 145 (2016) 285-290.
[186] W. Qian, P.A. Greaney, S. Fowler, S.-K. Chiu, A.M. Goforth, J. Jiao, ACS Sustain.
Chem. Eng., 2 (2014) 1802-1810.
[187] Y. Cong, J. Zhang, F. Chen, M. Anpo, J. Phys. Chem. C, 111 (2007) 6976-6982.
[188] R. Asahi, T. Morikawa, T. Ohwaki, K. Aoki, Y. Taga, science, 293 (2001) 269-271.
[189] X. Chen, C. Burda, J. Phys. Chem. B, 108 (2004) 15446-15449.
[190] Y. Choi, T. Umebayashi, M. Yoshikawa, J. Mater. Sci., 39 (2004) 1837-1839.
[191] J. Trimboli, M. Mottern, H. Verweij, P.K. Dutta, J. Phys. Chem. B, 110 (2006) 5647-
5654.

120
Curriculum Vitae
Ahmed Mudhafar Mohammed
Data, Place of Birth 07.11.1979, Mosul, Iraq
Status married, 3 children
Home address
Iraq: Nineveh, Mosul, Al-Sadiq Q. Lane 756, street no.756, house no. 123-33/345
Germany: Rigaer-Str.11, 18107 Rostock
Work address
Iraq: Department of Chemistry, College of Education for Girls, University of Mosul
Germany: Leibniz-Institut für Katalyse e.V, Rostock, Germany
Albert-Einstein-Str. 29a, 18059 Rostock
Academics
1997-2001 B.Sc. chemistry, rank 5th in a class of 44 students
College of Education, University of Mosul, Iraq
2002-2004 M.Sc. in inorganic chemistry
College of Education, University of Mosul, Iraq
2014-2018 PhD student
Leibniz-Institut für Katalyse e.V, Rostock, Germany
Languages
English, German, Arabic (Mother Tongue)

121
References
Prof. Dr. Peter Langer Department of Organic Chemistry, Albert-Einstein St. 3a, 18059 Rostock, Germany. Tel.: +49 (0)381 498 6410, E-mail: [email protected]
Dr. Norbert Steinfeldt
Leibniz-Institut für Katalyse e.V., Albert-Einstein-Str. 29a, 18059 Rostock, Germany. Tel.: +49 (0)381 1281 319, E-mail: [email protected]
Acknowledgments: 31
Researches
1 - “Preparation and Spectroscopic Characterization of Some Mixed Ligand Complexes
of Homodinuclear Co (II), Ni (II) and Cu (II)”. Kirkuk University Journal, Scientific
Studies, Vol. 4, No. 3, 2009.
2 - “Preparation and studies of a new Schiff base complexes with Co(II), Ni(II) and
Cu(II)”. Publication in the Journal of Education and Science, Vol. 26, No.3, 2013.
3 - “Preparation of New Complexes of ligand 2- (2-butyl) Thio-5-phenyl-1,3,4-
oxadiazole with Studying their Biological Activities”. Publication in the Journal
Baghdad of Sciences, Vol. 10, No.3, 2013.
4- “Preparation Complexes of ligand 2–cyclohexyl thio–5–phenyl–1,3,4–oxadiazole”
(Finished unpublished).
4- “Effect of metal ion addition on structural characteristics and photocatalytic activity
of ordered mesoporous titania”
(Finished unpublished).
5- “Influence of solvent evaporation step on formation and photo-catalytic properties of
mesoporous semi-crystalline titania framework” (Finished unpublished).
122
Participation in Conferences and Symposia
1 - The first Scientific Conference for pure Science held in the College of Science/
university of Kirkuk, 24-25 February 2009.
2 - The fourth scientific symposium under the title of “Bio safety in the context of food
security” College of Education for Girls, University of Mosul, 8 April 2010.
3 - A member of the Preparatory Committee for the Sixth Scientific Symposium held in
College of Education for Girls , University of Mosul, 22 September 2011.
4 - A member of the Preparatory Committee for the First National Conference of the
science of chemistry, which was held in College of Science for Girls, University of
Baghdad. 19-20 December 2012.
5 - The National Comprehensive Nano Technology , held by the Iraqi Association of
Nanotechnology in collaboration research and development department and the
University of Technology, 25 December 2012.
6 - The Second Women's Conference, which was held at Baghdad University, College
of Science for Girls under the title “Women in Science and Iraq”, 26-28 March 2013.
7 - 49. Jahrestreffen Deutscher Katalytiker, 16-18 March 2016, Weimar, Germany.
Poster “Preparation , characterization and photocatalytic activity of mesoporous TiO2”.
8 - 51. Jahrestreffen Deutscher Katalytiker, 14-16 March 2018, Weimar, Germany.
Poster “Effect of metal ions doping on ordered mesostructure and photoactivity of TiO2
under UV- irradiation”.
9 - 12th International Symposium on the Scientific Bases for the Preparation of
Heterogeneous Catalysts, 8-12 July 2018, Louvain-La-Neuve, Belgium. Poster
“Influence of solvent evaporation step on formation of mesoporous semi-crystalline
titania framework”.