Embed Size (px)
Citation preview

Effect of Switching From Statin Monotherapy to Ezetimibe/Simvastatin Combination Therapy Compared With Other IntensifiedLipid-Lowering Strategies on Lipoprotein Subclasses in DiabeticPatients With Symptomatic Cardiovascular DiseaseNgoc-Anh Le, PhD; Joanne E. Tomassini, PhD; Andrew M. Tershakovec, MD, MPH; David R. Neff, DO; Peter W. F. Wilson, MD
Background-—Patients with diabetes mellitus and cardiovascular disease may not achieve adequate low-density lipoproteincholesterol (LDL-C) lowering on statin monotherapy, attributed partly to atherogenic dyslipidemia. More intensive LDL-C–loweringtherapy can be considered for these patients. A previous randomized, controlled study demonstrated greater LDL-C lowering indiabetic patients with symptomatic cardiovascular disease who switched from simvastatin 20 mg (S20) or atorvastatin 10 mg(A10) to combination ezetimibe/simvastatin 10/20 mg (ES10/20) therapy, compared with statin dose-doubling (to S40 or A20) orswitching to rosuvastatin 10 mg (R10). The effect of these regimens on novel biomarkers of atherogenic dyslipidemia (low- andhigh-density lipoprotein particle number and lipoprotein-associated phospholipase A2 [Lp-PLA2]) was assessed.
Methods and Results-—Treatment effects on low- and high-density lipoprotein particle number (by NMR) and Lp-PLA2 (by ELISA)were evaluated using plasma samples available from 358 subjects in the study. Switching to ES10/20 reduced low-densitylipoprotein-particle number numerically more than did statin dose-doubling and was comparable with R10 (�133.3, �94.4, and�56.3 nmol/L, respectively; P>0.05). Increases in high-density lipoprotein particle number were significantly greater withswitches to ES10/20 versus statin dose-doubling (1.5 and �0.5 lmol/L; P<0.05) and comparable with R10 (0.7 lmol/L; P>0.05).Percentages of patients attaining low-density lipoprotein particle number levels <990 nmol/L were 62.4% for ES10/20, 54.1% forstatin dose-doubling, and 57.0% for R10. Switching to ES10/20 reduced Lp-PLA2 activity significantly more than did statin dose-doubling (�28.0 versus �3.8 nmol/min per mL, P<0.05) and was comparable with R10 (�28.0 versus �18.6 nmol/min per mL;P>0.05); effects on Lp-PLA2 concentration were modest.
Conclusions-—In diabetic patients with dyslipidemia, switching from statins to combination ES10/20 therapy generally improvedlipoprotein subclass profile and Lp-PLA2 activity more than did statin dose-doubling and was comparable with R10, consistent withits lipid effects.
Clinical Trial Registration-—URL: http://www.clinicaltrials.gov. Unique identifier: NCT00862251. ( J Am Heart Assoc. 2015;4:e001675 doi:10.1161/JAHA.114.001675)
Key Words: diabetes mellitus • ezetimibe • lipoprotein particle number • lipoprotein subclasses • lipoprotein-associatedphospholipase A2 • NMR spectroscopy • rosuvastatin • simvastatin
P atients with diabetes mellitus have dyslipidemia andmetabolic complications that contribute to an increased
risk of cardiovascular disease (CVD).1–6 Statin therapy is therecommended first-line therapeutic approach for lipid manage-ment of high-risk patients; however,many patients with diabeticdyslipidemia do not achieve adequate low-density lipoprotein(LDL) cholesterol (LDL-C) lowering on statin monotherapy.7–11
This residual risk may be attributed in part to atherogenicdyslipidemia, characterized by high levels of triglycerides, lowlevels of high-density lipoprotein (HDL) cholesterol (HDL-C),and high LDL-particle (LDL-P) numbers in these patients.1 Inaddition to LDL-C lowering, non–HDL-C and apolipoprotein B(apoB) have been recommended as treatment targets forassessment of individuals with diabetic dyslipidemia.1,7,12–15
Several international guidelines endorse statin uptitration,switching to a more-potent statin therapy, and/or combination
From the Biomarker Core Laboratory, Atlanta VAMC, Decatur, GA (N.-A.L.,P.W.F.W.); Merck Research Laboratories, Kenilworth, NJ (J.E.T., A.M.T., D.R.N.);Emory University School of Medicine, Atlanta, GA (P.W.F.W.).
Correspondence to: Ngoc-Anh Le, Biomarker Core Laboratory, Room 4A186,Atlanta VAMC, 1670 Clairmont Rd, Decatur, GA 30033. E-mail: [email protected]
Received December 12, 2014; accepted August 3, 2015.
ª 2015 The Authors. [Ngoc-Anh Le and Peter W. F. Wilson] and Merck Sharp& Dohme Corp., a subsidiary of Merck & Co., Inc., Kenilworth, NJ, USA. Allrights reserved. Published on behalf of the American Heart Association, Inc.,by Wiley Blackwell. This is an open access article under the terms of theCreative Commons Attribution-NonCommercial License, which permits use,distribution and reproduction in any medium, provided the original work isproperly cited and is not used for commercial purposes.
DOI: 10.1161/JAHA.114.001675 Journal of the American Heart Association 1
ORIGINAL RESEARCH
by guest on June 13, 2018http://jaha.ahajournals.org/
Dow
nloaded from

therapy for high-risk individuals in need of additional choles-terol lowering.7,12–15 US guidelines recommend using themaximum tolerated statin dose with consideration given tothe addition of a nonstatin cholesterol-lowering drug if theclinical benefit outweighs the safety risk in these patients.16
Trials that evaluate the lipid-lowering efficacy of differentmodes of therapy may provide helpful information forphysicians when considering therapeutic options for high-risk patients on statin therapy in need of additional LDL-Clowering. A number of studies have reported that combinationezetimibe/simvastatin (ES) therapy reduces LDL-C andimproves other lipids more than do statin monotherapy anddoubling the statin dose or switching to a more-potent statin,across a range of commonly prescribed doses in high-riskpatients including those with type 2 diabetes.17–20 Therecently completed IMPROVE-IT trial (IMProved Reduction ofOutcomes: Vytorin Efficacy International Trial) assessed theincremental cardiovascular benefit of LDL-C lowering withezetimibe 10 mg added to simvastatin (mainly 40 mg)compared with simvastatin monotherapy in patients present-ing with acute coronary syndromes.21–23 The study investi-gators reported that the trial met its primary and secondarycomposite efficacy end points.
Lipid and inflammatory markers, including LDL particlenumber (LDL-P), HDL particle number (HDL-P), and lipopro-tein-associated phospholipase A2 (Lp-PLA2), may be morepredictive of the atherogenic dyslipidemia present in diabeticpatients with CVD.24–26 In patients with discordant LDL-C andLDL-P levels, LDL-attributable atherogenic risk was shown tobe more strongly correlated with LDL-P than LDL-C levels.27,28
Similarly, HDL-P is proposed to be better correlated with CVDrisk than HDL-C.29–32 Increased levels of Lp-PLA2 mass andactivity have been shown to be associated with CVD risk and,compared with other inflammatory markers, provide anadvantage as they are less subject to variability.25,26
An assessment of the efficacy of combination ES therapyversus more-intensive statin therapy on lipoprotein sub-classes may aid in better understanding the lipid-alteringeffects of these therapies in these patients. In a previouslyreported multicenter, double-blind, randomized clinical trial,CVD patients with diabetes on stable, low-dose statintherapy (simvastatin 20 mg/day [S20] or atorvastatin(10 mg/day [A10]) who switched to ES 10/20 mg/day(ES10/20) had significantly greater LDL-C lowering versusdoubling the statin dose (S40 or A20) and numericallygreater changes than switching to rosuvastatin 10 mg/day(R10) during 6 weeks of treatment.33 This analysis assessedthe effect of these therapies on changes in LDL-P and HDL-Pconcentrations with the use of NMR spectroscopy,34 as wellas changes in Lp-PLA2 concentration and activity,35–37 byusing a subset of available samples from participants in thatstudy.
Materials and Methods
SubjectsThis was a post-hoc analysis of plasma samples obtained froma 12-week randomized, double-blind, active-controlled studyconducted between June 2009 and March 2011 in 86 centersin Europe, South America, and the United States (www.clin-icaltrials.gov NCT00862251).33 The protocol had been previ-ously approved by the institutional review board at eachparticipating clinical center, and all patients providedinformed consent. In brief, participants were adults betweenthe age of 18 and 80 with type 1 or 2 diabetes mellitus (HbA1c≤8.5%) and symptomatic CVD, who were na€ıve to statin and/or ezetimibe or were taking a stable dose of approved lipid-lowering therapy and, if needed, stable antidiabetic medica-tion for 3 months before the screening visit, as well as willingto maintain an approved cholesterol- and glucose-loweringdiet for the duration of the study. Only individuals with LDL-C≥1.81 mmol/L (70 mg/dL) and ≤4.14 mmol/L (160 mg/dL)after 6 weeks’ stabilization with either S20 or A10 wereeligible for randomization. Subjects with elevated levels oftriglycerides (>4.52 mmol/L, e.g., 400 mg/dL), alaninetransaminase and aspartate transaminase (>29 upper limitof normal), creatinine kinase (>39 upper limit of normal) wereexcluded from randomization. Patients who were newlydiagnosed (within 3 months before visit 1) or had any changein antidiabetic pharmacotherapy (e.g., changes in dosage[with the exception of �10 units of insulin] or had theaddition of new medication) within 3 months before visit 1, aswell as patients experiencing a recent history of repeatedhypoglycemia or unstable glycemic control, were alsoexcluded. Eligible participants were stratified according tothe statin taken during the run-in period (S20 or A10) andrandomly assigned to treatment with ES 10/20 (n=133),double the current statin dose (S40 or A20; n=74), or R10(n=151), in a 2:1:2 ratio. Details of the randomization strategyhave been published previously.33 The current study includesa subset of the entire cohort (358 of a total of 406, or 88.2%)in whom adequate plasma volume was available at bothbaseline and study-end time points.
Laboratory AnalysesCollected plasma specimens were stored at �80°C at acentral biospecimen archiving center and shipped to theBiomarker Core Laboratory (Atlanta, GA) on dry ice. Matchingbaseline and study-end samples from the same participantwere sorted in dry ice and stored at �80°C until ready foranalysis. Specimens were thawed in batches of 240 samplesor 120 participants for analysis on a weekly basis. Lp-PLA2concentrations (PLAC) were determined with the use of ELISA
DOI: 10.1161/JAHA.114.001675 Journal of the American Heart Association 2
Ezetimibe/Simvastatin and Lipoprotein Subclasses Le et alORIG
INALRESEARCH
by guest on June 13, 2018http://jaha.ahajournals.org/
Dow
nloaded from
(diaDexus), and Lp-PLA2 activities (ACAM) were determinedthrough an enzymatic method with the Beckman AU480 usingreagents from diaDexus. On completion (within 48 hours),each batch was shipped on ice to Liposcience for NMRanalysis. Plasma samples were subjected to only a singlefreeze–thaw cycle, and all analyses were completed within7 days.
Statistical MethodsBaseline was defined as the end of the 6-week run-in periodwith low-dose statin, either S20 or A10. Net differences werecalculated between baseline and after 6 weeks of treatmentwith the intensified lipid-lowering therapies (S40, A40, E/S10/20, or R10) for each of the measured parameters. Pairedt test was used to assess the changes from baseline withineach treatment group, and 2-sample t test was used to assessthe significance of the net differences between treatmentgroups. One-way ANOVA was used to assess the effect of the3 more-intensive cholesterol-reduction regimens. For thepresent analysis, all subjects receiving double the run-in statindose were considered as a single group, independent ofwhether the statin used was S20 or A10. The percentattainment of on-treatment target levels of LDL-C(<2.33 mmol/L, <90 mg/dL), LDL-P (<990 nmol/L), andnon–HDL-C (<2.85 mmol/L, <110 mg/dL), defined as per-centage of individuals below these levels, were assessed.These target levels for LDL-C, non–HDL-C, and LDL-Pcorresponded to population equivalent levels (≤20th and<5th percentiles) as previously reported in the MESA(Multi-Ethnic Study of Atherosclerosis) study cohort.25,38 Nostatistical analysis was performed with respect to thesepercentages.
Simple linear regression analysis was used to explore therelationship among the percent changes for the various novelmarkers. Only relationships with P<0.01 were consideredsignificant.
ResultsThe baseline characteristics of the 358 study participantsassessed in this analysis are presented in Table 1. Baselinevalues for lipids and biomarkers, determined after 6 weeks oftreatment on the starting dose of statin (S20 or A10), weregenerally consistent among the 3 treatment groups and werenot statistically different.
Effect on Lipids and ApolipoproteinsCompared with baseline, significant reductions were obtainedin all 3 groups for total cholesterol, LDL-C, non–HDL-C, andapoB (Table 2 and Figure 1). In comparing treatment groups
(Table 2), significantly greater reductions for total cholesterol,LDL-C, non–HDL-C, and apoB were achieved when theparticipants were switched to either ES 10/20 or R10 thanwhen the initial statin dose was doubled. Net changes with ES10/20 were not statistically different from changes obtainedwith R10. Both R10 and ES10/20 increased apoA-I levelsfrom baseline significantly more than did doubling the statindose (P<0.05). Changes from baseline in triglycerides, HDL-C,and high-sensitivity C-reactive protein were not significant forany of the 3 treatment groups, and there were no significantbetween-treatment differences.
Effect of More Intensive Therapy on LDL-PConcentrationsLDL-P concentrations were significantly reduced with all 3treatments, (P<0.05 for 29 statin, P<0.001 for R10 and ES10/20) (Table 3 and Figure 2A). The net changes in LDL-P observedin subjects who were switched to either ES10/20 or R10 werecomparable (�133.3 and �94.4 nmol/L, respectively) andwere significantly greater than the changes obtained when thestatin dose was doubled (�56.3 nmol/L) (P<0.05).
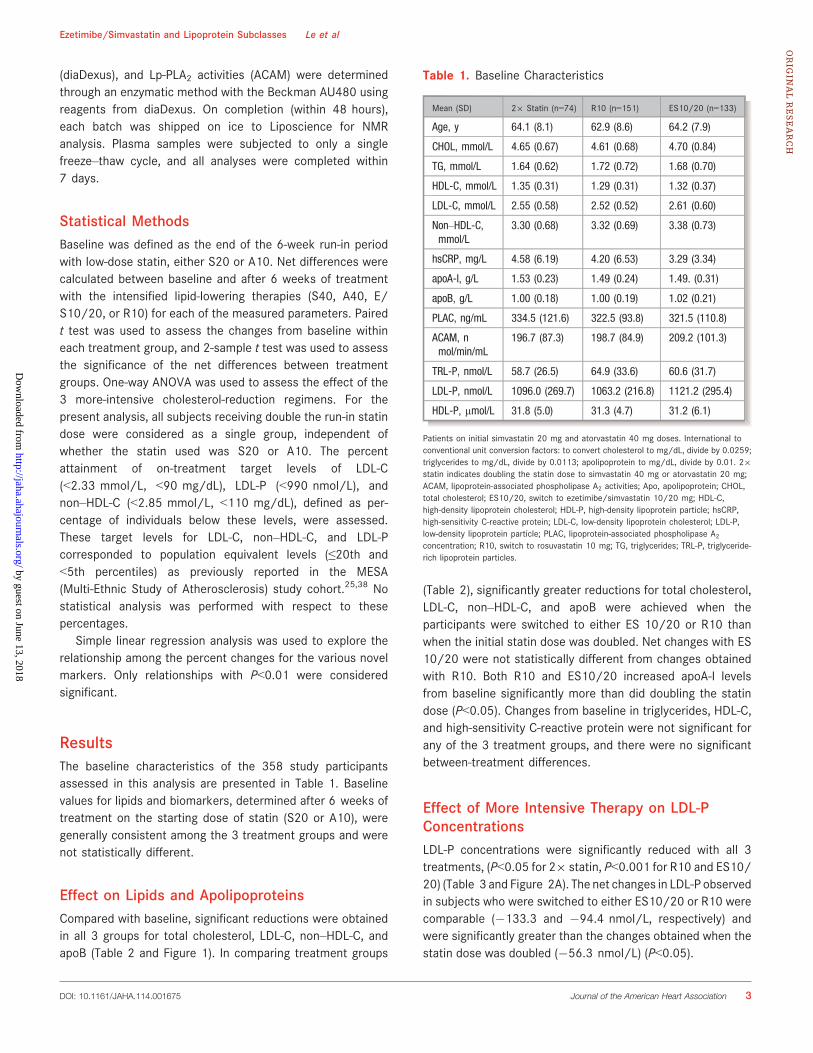
Table 1. Baseline Characteristics
Mean (SD) 29 Statin (n=74) R10 (n=151) ES10/20 (n=133)
Age, y 64.1 (8.1) 62.9 (8.6) 64.2 (7.9)
CHOL, mmol/L 4.65 (0.67) 4.61 (0.68) 4.70 (0.84)
TG, mmol/L 1.64 (0.62) 1.72 (0.72) 1.68 (0.70)
HDL-C, mmol/L 1.35 (0.31) 1.29 (0.31) 1.32 (0.37)
LDL-C, mmol/L 2.55 (0.58) 2.52 (0.52) 2.61 (0.60)
Non–HDL-C,mmol/L
3.30 (0.68) 3.32 (0.69) 3.38 (0.73)
hsCRP, mg/L 4.58 (6.19) 4.20 (6.53) 3.29 (3.34)
apoA-I, g/L 1.53 (0.23) 1.49 (0.24) 1.49. (0.31)
apoB, g/L 1.00 (0.18) 1.00 (0.19) 1.02 (0.21)
PLAC, ng/mL 334.5 (121.6) 322.5 (93.8) 321.5 (110.8)
ACAM, nmol/min/mL
196.7 (87.3) 198.7 (84.9) 209.2 (101.3)
TRL-P, nmol/L 58.7 (26.5) 64.9 (33.6) 60.6 (31.7)
LDL-P, nmol/L 1096.0 (269.7) 1063.2 (216.8) 1121.2 (295.4)
HDL-P, lmol/L 31.8 (5.0) 31.3 (4.7) 31.2 (6.1)
Patients on initial simvastatin 20 mg and atorvastatin 40 mg doses. International toconventional unit conversion factors: to convert cholesterol to mg/dL, divide by 0.0259;triglycerides to mg/dL, divide by 0.0113; apolipoprotein to mg/dL, divide by 0.01. 29statin indicates doubling the statin dose to simvastatin 40 mg or atorvastatin 20 mg;ACAM, lipoprotein-associated phospholipase A2 activities; Apo, apolipoprotein; CHOL,total cholesterol; ES10/20, switch to ezetimibe/simvastatin 10/20 mg; HDL-C,high-density lipoprotein cholesterol; HDL-P, high-density lipoprotein particle; hsCRP,high-sensitivity C-reactive protein; LDL-C, low-density lipoprotein cholesterol; LDL-P,low-density lipoprotein particle; PLAC, lipoprotein-associated phospholipase A2concentration; R10, switch to rosuvastatin 10 mg; TG, triglycerides; TRL-P, triglyceride-rich lipoprotein particles.
DOI: 10.1161/JAHA.114.001675 Journal of the American Heart Association 3
Ezetimibe/Simvastatin and Lipoprotein Subclasses Le et alORIG
INALRESEARCH
by guest on June 13, 2018http://jaha.ahajournals.org/
Dow
nloaded from

As illustrated in Figure 2B through 2D, the percent changes inLDL-P were strongly associated with changes in the concentra-tions of small LDL particles (sLDL-P) (P<0.0001). Patientsreceiving ES10/20 or R10 tended to have greater reductions inthe concentrations of sLDL-P (34.7 and 23.3 nmol/L, respec-tively) compared with those who were taking double the dose ofthe initial statin (1.0 nmol/L); however, the between-groupdifferences were not significant (data not shown).
Effect of More Intensive Therapy on HDL-PConcentrationsStatistically significant increases in HDL-P from baseline wereobserved with switching to ES10/20 (P<0.001) and R10(P<0.05), whereas doubling the statin dose had no effect(Table 3 and Figure 3A). Net changes in HDL-P were signif-icantly greater when switching to ES10/20 compared withdoubling the statin dose (P<0.05) but not significantlydifferent than switching to R10 (P>0.05). Net changes inHDL-P with R10 were not statistically different from changesobtained with doubling the statin dose. As illustrated inFigure 3B through 3D, the overall changes in HDL-P wereassociated with changes in large HDL-P number for all 3treatment groups (P<0.0001).
Effect of More Intensive Therapy on Triglyceride-Rich Lipoprotein Particle ConcentrationsReductions from baseline in the total concentrations of triglyc-eride-rich lipoproteins were moderate for all 3 treatment
groups, with only R10 being statisticallysignificant (P<0.05) (Table 3). This was predominantlyattributed to reduction in the concentration of smallvery low-density lipoprotein particle concentration (from 35.2to 31.6 nmol/L, P<0.01). There were no statistically signifi-cant differences between treatment groups.
Effect on Lp-PLA2Switching to either ES10/20 or R10 resulted in significantreductions from baseline in PLAC (P<0.001), whereassmall, nonsignificant reductions were observed with dou-bling the statin dose (P>0.05) (Table 3). Also, comparedwith baseline, significant reductions in Lp-PLA2 activitywere obtained when the subjects were switched to eitherES 10/20 or R10 (P<0.05) but not when the initial statindose was doubled (P>0.05). When Lp-PLA2 specificactivity calculated as the activity per unit mass of Lp-PLA2 was examined, significant reductions were observedonly when the participants were switched from low-dosestatin to ES 10/20 (P<0.001) but not to any otherregimen (Figure 4).
Relationship Between ApoB and LDL-PConcentrationsFigure 5 presents the relationship between on-treatmentlevels of LDL-P and apoB using all available samplesincluding data while on low-dose statin (S20 or A10)and on all 3 more-intensive cholesterol-reduction therapies
Table 2. Changes From Baseline in Lipid, Apolipoprotein, and hsCRP Levels
Mean (SD)CHOL(mmol/L)
TG(mmol/L)
HDL-C(mmol/L)
LDL-C(mmol/L)
non–HDL-C(mmol/L)
hsCRP(mg/dL) apoA-I (g/L) apoB (g/L)
Changes from baseline within treatment group
29 statin �0.22 (0.79)‡ �0.05 (0.70)* �0.02 (0.22)* �0.18 (0.67)† �0.21 (0.75)† 0.6 (6.8) �0.07 (0.23)† �0.07 (0.18)‡
R10 �0.50 (0.64)§ �0.04 (0.54)* 0.02 (0.18)* �0.51 (0.54)§ �0.50 (0.73)§ 0.9 (14.9)* 0.02 (0.20)* �0.14 (0.20)§
ES10/20 �0.57 (0.92)§ �0.04 (0.63)* 0.02 (0.26)* �0.57 (0.78)§ �0.59 (0.81)§ 0.3 (4.5)* 0.01 (0.25)* �0.15 (0.22)§
P value for differences between treatment groupsk
ES 10/20 vs29 statin
0.05 NS NS 0.05 0.05 0.05 0.05 0.05
ES 10/20 vs R10 NS NS NS NS NS NS NS NS
R10 vs 29 statin 0.05 NS NS 0.05 0.05 NS 0.05 0.05
ANOVA¶ 0.01 NS NS 0.001 0.001 NS 0.05 0.01
International to conventional unit conversion factors: to convert cholesterol to mg/dL, divide by 0.0259; triglycerides to mg/dL, divide by 0.0113; apolipoprotein to mg/dL, divide by 0.01.29 statin indicates doubling the statin dose to simvastatin 40 mg or atorvastatin 20 mg; apo, apolipoprotein; CHOL, total cholesterol; ES10/20, switch to ezetimibe/simvastatin 10/20 mg; HDL-C, high-density lipoprotein cholesterol; hsCRP, high-sensitivity C-reactive protein; LDL-C, low-density lipoprotein cholesterol; R10, switch to rosuvastatin 10 mg; TG,triglycerides.*P>0.05; †P<0.05; ‡P<0.01; §P<0.001 by paired t-test.kPairwise comparison between any 2 intervention groups.¶Comparison of differences among all 3 groups.NS, not significant.
DOI: 10.1161/JAHA.114.001675 Journal of the American Heart Association 4
Ezetimibe/Simvastatin and Lipoprotein Subclasses Le et alORIG
INALRESEARCH
by guest on June 13, 2018http://jaha.ahajournals.org/
Dow
nloaded from

(29 statin, ES 10/20, and R10). Combining all datawith apoB ranging from 50 mg/dL to 200 mg/dL, LDL-Pconcentration (nmol/L) could be estimated fromtotal plasma apoB concentration (mg/dL) by using theequation:
LDL-P=9.3739(apoB)+157.13 (R=0.706, P<0.0001).
Effect of Different Intensive Therapies on theRelationship Among LDL-C, ApoB, and LDL-PFigure 6 illustrates the relationships between the percentchanges in LDL-P, LDL-C, and apoB for all 3 more-aggressivecholesterol reduction regimens. As expected, there was astrong correlation between percent changes in LDL-C and intotal plasma apoB (Figure 6A, R=0.894, P<0.0001). Data fromall 3 more-intensive therapies are tightly clustered around theregression line. In contrast, the relationships between changesin LDL-P and LDL-C (Figure 6B, R=0.583, P<0.0001) andbetween changes in LDL-P and apoB were weaker (Figure 6C,R=0.608, P<0.0001), although statistically significant. In 2.3%of the patients randomized to ES 10/20, there was anunexpected increase in LDL-P despite reductions in bothLDL-C and apoB. The percent of patients exhibiting thisdiscordant response was higher with 29 statin dose (5.4%)and highest for patients randomized to R10 (8.6%).
Efficacy of More Intensive Therapy With Respectto Target LevelsThe percentage of patients who achieved on-treatment targetlevels for LDL-C (<2.33 mmol/L, <90 mg/dL), non–HDL-C(<2.85 mmol/L, <110 mg/dL), and LDL-P (<990 nmol/L)corresponding to the 20th population equivalent of the MESAcohort are shown in Figure 7A. With the starting dose ofstatin (either simvastatin 40 mg/day or atorvastatin 20 mg/day), � 41.1% of the patients achieved target levels for LDL-C, 37.7% were at target levels for LDL-P, and 26.8% for non–HDL-C. After 6 weeks of treatment with all 3 intensive lipid-lowering therapies, the percentages of patients who achievedtarget levels of LDL-C and LDL-P increased substantially, withthe largest improvements in LDL-C. Percent achievement ofLDL-C target levels was 51.4% for doubling the statin dose,72.2% for switching to R10, and 75.2% for switching to ES10/20. The percentages of patient attainment for LDL-P were54.1%, 57.0%, and 62.4% for doubling the statin dose andswitching to R10 and ES10/20, respectively. Percentages ofpatient attainment for non–HDL-C were 62.2%, 57.0%, and64.7%, respectively, for statin dose-doubling and switching toR10 and to ES10/20.
For the more-stringent targets, equivalent to the 5thpercentile based on the MESA cohort25,38 (LDL-C <1.8mmol/L, 70 mg/dL, and non–HDL-C <2.3 mmol/L, 90 mg/dL), the improvements in LDL-C and non–HDL-C were consis-tently greater for E/S 10/20 and R10 than those for doublingthe statin dose (Figure 7B). With low-dose starting statin, eithersimvastatin (20 mg/day) or atorvastatin (10 mg/day), thepercentage of patients achieving this LDL-C target was lessthan 0.6%. With more-intensive therapy, the percentage ofindividuals reaching the LDL-C target level improved with
-1.0
-0.5
0.0
0.5
1.0
1.5
CHOL(mmol/L)
LDL-C(mmol/L)
hsCRP(mg/L)
Net
Cha
nges
Fro
m B
asel
ine
A
-0.20
-0.16
-0.12
-0.08
-0.04
0.00
0.04
0.08
HDL-C(mmol/L)
TG(mmol/L)
apoA-I(mg/L)
apoB(mg/L)
Net
Cha
nges
Fro
m B
asel
ine
2x StatinR10ES 10/20
2x StatinR10ES 10/20
B
Figure 1. Net changes from baseline in (A) CHOL, LDL-C, andhsCRP and in (B) HDL-C, TG, apoA-I, and apoB for the more-intensive therapies. Apo indicates apolipoprotein; ES, ezetim-ibe/simvastatin; HDL-C, high-density lipoprotein cholesterol;hsCRP, high-sensitivity C reactive protein; LDL-C, low-densitylipoprotein cholesterol; R, rosuvastatin; CHOL, total cholesterol;TG, triglycerides. See Table 1 for actual values and standarddeviations.
DOI: 10.1161/JAHA.114.001675 Journal of the American Heart Association 5
Ezetimibe/Simvastatin and Lipoprotein Subclasses Le et alORIG
INALRESEARCH
by guest on June 13, 2018http://jaha.ahajournals.org/
Dow
nloaded from

doubling the statin dose, R10 and ES 10/20 (24.3%, 42.4%, and52.6%, respectively). Similarly, the percentage of patientsreaching the target level for non–HDL-C increased substantiallyfrom 1.7% at the initial starting dose to 17.6%, 29.8%, and 41.4%with 29statin, R10, and ES10/20, respectively. The percentageof individuals achieving the target level for LDL-P (770 nmol/L)also improved from 11.2% at the starting dose to 18.9%, 25.8%,and 27.1%, with 29 statin, R10, and ES 10/20, respectively.
DiscussionThis analysis showed that switching from S10 or A20 therapyto more-intensive lipid-lowering therapies had favorableeffects on several biomarkers considered to be importantmeasures of atherogenic dyslipidemia in diabetic patientswith symptomatic CVD. Switching to combination ES10/20provided greater reductions from baseline in LDL-P as well asattainment of LDL-P levels <990 nmol/L compared withdoubling the statin dose and reductions that were comparablewith R10. Switching to the combination ES10/20 therapy alsoresulted in modest increases in HDL-P that were significantlygreater than doubling the starting dose and similar to R10.Combination ES10/20 therapy improved Lp-PLA2 activitysignificantly more than statin dose-doubling and comparablywith R10, and moderately decreased Lp-PLA2 concentration.Overall, the treatment effects on these atherogenicity mark-ers were consistent with the lipid changes demonstrated inthe full cohort of the original study.
The lipid changes observed in this subgroup analysis weregenerally similar to those reported in the full cohort of theoriginal trial, in which switching to ES combination therapy
improved LDL-C lowering and achievement of LDL-C levels<70 and <100 mg/dL compared with doubling the baselinestatin dose and switching to R10.33 Other studies have alsoreported that switching from low-dose statin monotherapy toES combination therapy significantly improved LDL-C loweringcompared with doubling the statin dose39–41 and switching toR10.42,43 Taken together, these results indicate that more-intensive lipid-lowering therapy may contribute to improvedlipid management in these high-risk patients.
Given that measurement of on-treatment levels of LDL-Pmay be more predictive of residual CVD risk than LDL-C whenthe 2 measures are discordant, it has been suggested thatintensification of lipid-lowering therapy is reasonable toconsider when elevated LDL-P is present in patients receivingstatin therapy.25,44 To assess the response to lipid-loweringtherapy, LDL-P targets have been proposed, based onpopulation equivalent levels for LDL-C targets (<20thpercentile for high- and very high-risk patients). It should benoted that while treatment targets for LDL-C, non–HDL-C,and apoB have been recommended in various nationaldyslipidemia guidelines, LDL-P targets have not beenendorsed.1,7,12,15 Achievement of LDL-P targets that areequivalent to LDL-C and non–HDL-C targets based onpopulation percentiles have been shown to require intensivetherapy.44 Our study showed that ≤41% of patients at baselinehad levels of LDL-C <2.33 mmol/L (90 mg/dL), non–HDL-C<2.85 mmol/L (110 mg/dL), and LDL-P <990 nmol/L after6 weeks of pretreatment with S20 or A10. After switching toES10/20 or R10, >72% of patients achieved the LDL-C leveland >57% achieved the LDL-P and non–HDL-C targets,highlighting the importance of more-intensive therapy in
Table 3. Changes in Lp-PLA2 and Lipoprotein Particle Concentrations
Mean (SD) PLAC (ng/mL) ACAM (nmol/min per mL) TRL-P (nmol/L) LDL-P (nmol/L) HDL-P (lmol/L)
Changes from baseline within treatment group
29 statin �6.7 (71.9)* �3.8 (51.3)* �1.9 (28.2)* �56.3 (256.0)† �0.5 (4.4)*
R10 �16.7 (58.5)§ �18.6 (3.87)† �5.0 (25.5)† �94.4 (242.0)§ 0.7 (1.4)†
ES10/20 �23.7 (70.2)§ �28.0 (3.98)† �2.4 (29.7)* �133.3 (317.5)§ 1.5 (3.8)§
P value for differences between treatment groupsk
ES 10/20 vs 29 statin NS <0.05 NS <0.05 <0.05
ES 10/20 vs R10 NS NS NS NS NS
R10 vs 29 statin NS <0.05 NS <0.05 NS
ANOVA¶ NS 0.002 NS NS 0.005
International to conventional unit conversion factors: to convert cholesterol to mg/dL, divide by 0.0259; triglycerides to mg/dL, divide by 0.0113; apolipoprotein to mg/dL, divide by 0.01.29 statin indicates doubling the statin dose to simvastatin 40 mg or atorvastatin 20 mg; ACAM, lipoprotein-associated phospholipase A2 activities; ES10/20, switch to ezetimibe/simvastatin 10/20 mg; HDL-P, high-density lipoprotein particle; LDL-P, low-density lipoprotein particle; Lp-PLA2, lipoprotein-associated phospholipase A2; PLAC, lipoprotein-associatedphospholipase A2 concentration; R10, switch to rosuvastatin 10 mg; TRL-P, triglyceride-rich lipoprotein particles.*P>0.05; †P<0.05; ‡P<0.01; §P<0.001 by paired t- test.kPairwise comparison between any 2 intervention groups.¶Comparison of differences among all 3 groups.NS, not statistically significant at the 0.05 a level (P>0.05).
DOI: 10.1161/JAHA.114.001675 Journal of the American Heart Association 6
Ezetimibe/Simvastatin and Lipoprotein Subclasses Le et alORIG
INALRESEARCH
by guest on June 13, 2018http://jaha.ahajournals.org/
Dow
nloaded from

reducing the atherogenic lipoprotein profile in these patients.The observation that more patients achieved the LDL-C thanLDL-P and non–HDL-C target levels may be attributed to ahigh LDL-P number that is not reflected by LDL-C measure-ment, consistent with findings in patients where these 2measures are discordant.44 To the best of our knowledge, thisstudy is the first to evaluate the effect of these therapies onLDL-P targets.
Several studies have demonstrated that the prevalenceof dense sLDL-P may be an independent risk factor forcardiovascular disease.45–48 Data from this study wouldsuggest that the changes in LDL-P observed when patientswere switched to either ES10/20 or R10 were primarilydriven by changes in the concentrations of sLDL-P as
assessed with NMR spectroscopy. For patients who werereceiving double the initial statin dose, the relationshipbetween the changes in the number of sLDL-P and theoverall changes in LDL-P number was weaker. Thus,aggressive LDL-reduction therapy with combination ES10/20 and R10 may have a preferential impact on densesLDL-P compared with either simvastatin (40 mg/day) oratorvastatin (20 mg/day).
Because apoB is the primary protein component of LDL-P, measurement of apoB concentration is considered toprovide a direct estimate of LDL-P, and thus it would beanticipated that changes between apoB and LDL-P would behighly associated.49,50 In our study, changes in LDL-P andapoB were only moderately correlated, and response to
R=0.618p<0.0001
-100
-75
-50
-25
0
25
50
75
100
125
-200 0 200
Perc
ent C
hang
es in
LD
L-P
Percent Changes in sLDL-P
R10D
-250
-200
-150
-100
-50
0
Net
Cha
nges
in L
DL-
P (m
mol
/L)
LDL-P
2x StatinR10ES 10/20
p<0.05
ns
p<0.05
A
R=0.741 p<0.0001
-100
-75
-50
-25
0
25
50
75
100
125
-200 0 200
Perc
ent C
hang
es in
LD
L-P
Percent Changes in sLDL-P
ES 10/20B
R=0.431p<0.0001
-100
-75
-50
-25
0
25
50
75
100
125
-200 0 200
Perc
ent C
hang
es in
LD
L-P
Percent Changes in sLDL-P
2x StatinC
Figure 2. Effect of more-intensive therapy on LDL-P. A, Reductions in LDL-P from baseline weresignificant with switching to 29 statin (P<0.05), ES 10/20 (P<0.001), and R10 (P<0.001). There was asignificant association between the percent changes in total LDL-P and the percent changes in theconcentration of small LDL particles with ES 10/20 (B), 29 statin (C), and with R10 (D). 29 statin indicatesdoubling the statin dose to simvastatin 40 mg or atorvastatin 20 mg; ES10/20, switch to ezetimibe/simvastatin 10/20 mg; LDL-P, low-density lipoprotein particle number; R10, switch to rosuvastatin 10 mg.
DOI: 10.1161/JAHA.114.001675 Journal of the American Heart Association 7
Ezetimibe/Simvastatin and Lipoprotein Subclasses Le et alORIG
INALRESEARCH
by guest on June 13, 2018http://jaha.ahajournals.org/
Dow
nloaded from

treatment was found to be discordant in some patients,particularly those who had increases in LDL-P despite apoBreductions. Differences in baseline levels of triglycerides,HDL-C, LDL-C, apoB, and body mass index in these patientsmay have contributed to this discrepancy. A prior studyshowed that while apoB and LDL-P levels were concordantin a majority of individuals, discordance was observed inpatients who had low apoB and high LDL-P levels but not inthose with higher apoB levels, indicating that apoB andLDL-P measurement of atherogenic lipoproteins may not becomparable in all settings.49 Additionally, differences inassessment of apoB with immunoassay [LDL, very low-
density lipoprotein, intermediate-density lipoprotein, andlipoprotein(a)] and of LDL-P with NMR [LDL subfractions,intermediate-density lipoprotein, and lipoprotein(a)] maypartly account for these discordant observations. In linewith this, a review of 25 clinical trials showed that althoughapoB and LDL-P were comparably associated with clinicaloutcomes in most studies, some discordance was noted,which was attributed to inherent methodological differencesin measurement of these markers.51 Further studies areneeded to better understand the relationship between apoBand LDL-P, as well as assessment of these markers invarious populations.
R=0.407p<0.0001
-100
-75
-50
-25
0
25
50
75
100
-100 0 100 200
Perc
ent C
hang
es in
HD
L-P
Percent Changes in Large HDL-P
R10D
-2
-1
0
1
2
3
4
Net
Cha
nges
in H
DL-
P (µ
mol
/L)
HDL-P
ns
p<0.05
ns
A
R=0.585p<0.0001
-100
-75
-50
-25
0
25
50
75
100
-100 0 100 200
Perc
ent C
hang
es in
HD
L-P
Percent Changes in Large HDL-P
ES 10/20B
R=0.620p<0.0001
-100
-75
-50
-25
0
25
50
75
100
-100 0 100 200
Perc
ent C
hang
es in
HD
L-P
Percent Changes in Large HDL-P
2x StatinC
2x StatinR10ES 10/20
Figure 3. Effect of more-intensive therapy on HDL-P. A, Net changes (SD) from baseline in HDL-Pconcentrations (lmol/L) were statistically significant only for ES 10/20 (P<0.001) and nonsignificant(P>0.05) for doubling the statin dose (29 statin) and R10. Significant associations were observed betweenHDL-P and large HDL-P with ES 10/20 in (B), 29 statin in (C), and R10 in (D). 29 statin indicates doublingthe statin dose to simvastatin 40 mg or atorvastatin 20 mg; ES10/20, switch to ezetimibe/simvastatin10/20 mg; HDL-P, high-density lipoprotein particle number; R10, switch to rosuvastatin 10 mg; SD,standard deviation.
DOI: 10.1161/JAHA.114.001675 Journal of the American Heart Association 8
Ezetimibe/Simvastatin and Lipoprotein Subclasses Le et alORIG
INALRESEARCH
by guest on June 13, 2018http://jaha.ahajournals.org/
Dow
nloaded from

Studies have also suggested that HDL-P is a better markerof residual CVD risk than are HDL-C and apoA-I levels andHDL-P size, including patients treated to very low LDL-C levels
with potent statin therapy.52 In our study, in patients treatedwith S10 or A20 therapy, switching from statin therapy toES10/20 had modest, nonsignificant effects on apoA-I and
500
600
700
800
900
1000
ES 10/20 2x Statin R10tt
Lp-P
LA2
Spe
cific
Act
ivity
(nm
ol/m
in/n
g) Pre Post
p<0.001ns
ns
nsns
Figure 4. Changes in Lp-PLA2 specific activity with the 3 more-intensive cholesterol-reduction regimens. E/S indicates ezetim-ibe/simvastatin; Lp-PLA2 lipoprotein-associated phospholipaseA2; R, rosuvastatin.
0
500
1000
1500
2000
2500
3000
0 50 100 150 200 250
LDL-
P (n
mol
/L)
Plasma apoB (mg/dL)
BaselinePost
R=0.706p<0.0000
Figure 5. Relationship between on-treatment levels of totalplasma apoB and LDL-P concentration based on all samples forparticipants stabilized on low-dose statin (S20 or A10) as well asmore-intensive cholesterol reduction (29 statin, ES 10/20, andR10). 29 statin indicates doubling the statin dose to simvastatin40 mg or atorvastatin 20 mg; A, atorvastatin; Apo, apolipopro-tein; E/S, ezetimibe/simvastatin; LDL-P, low-density lipoproteinparticle number; R, rosuvastatin; S, simvastatin.
-80
-40
0
40
80
120
-100 -50 0 50 100 150
Perc
ent C
hang
es in
LD
L-P
Percent Changes in LDL-C
R=0.583 p<0.0001
B
-80
-40
0
40
80
120
-100 -50 0 50 100
Perc
ent C
hang
es in
apo
B
Percent Changes in LDL-C
R=0.894 p<0.0001
A
-80
-40
0
40
80
120
-100 -50 0 50 100 150
Perc
ent C
hang
es in
apo
B
Percent Changes in LDL-P
R=0.608 p<0.0001
C
ES 10/20
ES 10/20
2x Statin R10
2x Statin R10
ES 10/20 2x Statin R10
Figure 6. Effect of more-intensive cholesterol reducing regi-mens (ES 10/20, 29 statin, and R10) on the percent changes forvarious measures of LDL. (A) LDL-C versus total plasma apoB, (B)LDL-C versus LDL-P, and (C) total plasma apoB versus LDL-P. 29statin indicates doubling the statin dose to simvastatin 40 mg oratorvastatin 20 mg; E/S, ezetimibe/simvastatin; LDL-P, low-density lipoprotein particle number; R, rosuvastatin.
DOI: 10.1161/JAHA.114.001675 Journal of the American Heart Association 9
Ezetimibe/Simvastatin and Lipoprotein Subclasses Le et alORIG
INALRESEARCH
by guest on June 13, 2018http://jaha.ahajournals.org/
Dow
nloaded from

HDL-C that were comparable with those of R10, whiledoubling the statin dose had no effect. On the other hand,increases in HDL-P with switching to ES10/20 were signif-icantly greater than those with doubling the statin dose andslightly larger than R10. Similarly, in a previously reported
study in rosuvastatin- and atorvastatin-treated metabolicsyndrome patients, the HDL-P response was greater thanthose for HDL-C or apoA-I.31 Such treatment effects couldreflect an increase in cholesterol-depleted HDL-P.31 In aprevious analysis of combination ES10/20 therapy in hyper-lipidemic patients, we reported that ES10/20+niacin andniacin increased HDL-C more than HDL-P, whereas ES10/20increased HDL-P more than HDL-C,53 which is consistent withfindings in other studies that have evaluated niacin and statineffects on HDL-P.31,53,54
With respect to HDL subclasses, the current data suggestthat with either the combination therapy ES 10/20 ordoubling of the initial dose of simvastatin or atorvastatin,the changes in overall HDL-P number were closely associatedwith the changes in the concentration of large HDL-P. Thechanges in HDL-P observed when the patients were switchedto rosuvastatin (10 mg/day) were less dependent on changesin the concentration of large HDL-P. It remains unclearwhether changes in the concentrations of any specific HDLsubpopulations are more important in risk reduction thanoverall changes in HDL-P number.55–57
In our study, reductions in Lp-PLA2 were greatest withswitching to ES10/20 in terms of plasma concentration andenzyme activity, followed by R10, while reductions withdoubling the statin dose were smallest. These results are inline with previous studies that showed reductions in Lp-PLA2mass and activity with statins and ES were proportionate tothe extent of LDL-C lowering efficacy25,58,59 and thatcombination ezetimibe therapy with rosuvastatin and sim-vastatin provided additional reductions in Lp-PLA2 mass andactivity in patients already receiving statin monotherapy.58
Ezetimibe, rosuvastatin, and fenofibrate monotherapies havebeen shown to primarily reduce Lp-PLA2 activity and massassociated with LDL lipoprotein subfractions via receptor-mediated uptake.60 On the other hand, it has also beensuggested that statin and nonstatin lipid-lowering therapiesreduce Lp-PLA2 through a receptor-independent clearancemechanism and that Lp-PLA2 changes are weakly correlatedwith LDL-C changes, indicating that Lp-PLA2 reduction isonly partly explained by LDL-C lowering.61 In our analysis,reductions in Lp-PLA2 activity and concentration wereconsistent with the degree of cholesterol lowering andLDL-P reduction observed for these agents. Similarly, onlyES 10/20 treatment resulted in a statistically significantreduction in Lp-PLA2 specific activity (ie, enzyme activity perunit mass).
A limitation of our study was that the samples used werethose available from the original trial and thus were notrandomly selected. Nonetheless, the baseline characteristicswere generally similar for the treatment groups indicating noselection bias, and the effect of treatment on lipids wascomparable to that observed in the original trial. It should be
0
10
20
30
40
50
60
70
80
LDL-C LDL-P non-HDL-C
Per
cent
of P
atie
nts
Ach
ievi
ng T
arge
ts
Baseline 2x Statin R10 ES10/20
Baseline 2x Statin R10 ES10/20
Target Levels 20th percentile
A
B
0
10
20
30
40
50
60
LDL-C LDL-P non-HDL-C
Target Levels 5th percentile
Per
cent
of P
atie
nts
Ach
ievi
ng T
arge
ts
Figure 7. Percent of individuals who reached (A) the 20thpercentile target levels for LDL-C, LDL-P, and non–HDL-C or (B)the 5th percentile target levels based on the Multi-Ethnic Study ofAtherosclerosis (MESA) cohort. Baseline corresponds to eithersimvastatin 20 mg or atorvastatin 10 mg. 29 statin indicatesdoubling the statin dose to simvastatin 40 mg or atorvastatin20 mg; E/S, ezetimibe/simvastatin; LDL-C, low-density lipoproteincholesterol; LDL-P, low-density lipoprotein particle number; non–HDL-C, non–high-density lipoprotein cholesterol R, rosuvastatin.
DOI: 10.1161/JAHA.114.001675 Journal of the American Heart Association 10
Ezetimibe/Simvastatin and Lipoprotein Subclasses Le et alORIG
INALRESEARCH
by guest on June 13, 2018http://jaha.ahajournals.org/
Dow
nloaded from

noted that our analysis was exploratory in nature and thus theresults should be considered hypothesis generating. However,the treatment effects observed on the biomarkers in thisstudy are generally consistent with lipid changes observed forthese treatments in this and other studies. The treatmenteffects observed in this study were limited to a 6-weekduration, and thus, longer-term effects on these biomarkersare not known. Additionally, the diabetic patients in this studywere a mix of both types 1 and 2, and the relevance of theseresults to each type was not ascertained.
In summary, in diabetic patients with symptomatic CVDon statin monotherapy, switching to more-intensive therapyprovided additional improvements in the lipid profile, asassessed by a more-advanced risk panel including lipopro-tein subclass analysis with NMR spectroscopy and Lp-PLA2.These effects were generally greater with combinationES10/20 and R10 therapies than statin dose-doubling, andES10/20 and R10 were more comparable, consistent withthe lipid-altering effects demonstrated for these therapies inthese patients.
AcknowledgmentsThe authors are indebted to the staff at Liposcience, Inc, Raleigh, NCfor their contribution in the NMR analyses. Carol Zecca of Merck &Co., Inc. provided editorial support.
Sources of FundingThis research was funded by an investigator-initiated grant toDr Le and Dr Wilson from Merck Research Laboratories,Kenilworth, NJ.
DisclosuresDr Le is a consultant with Liposcience. Dr Wilson is aconsultant with Merck and Liposcience. Dr Tershakovec, DrTomassini, and Dr Neff are employees and/or formeremployees of Merck Sharp & Dohme Corp., a subsidiary ofMerck & Co., Inc., Kenilworth, NJ and may hold stock/stockoptions in the company.
References1. Brunzell JD, Davidson M, Furberg CD, Goldberg RB, Howard BV, Stein JH,
Witztum JL. Lipoprotein management in patients with cardiometabolic risk:consensus statement from the American Diabetes Association and theAmerican College of Cardiology Foundation. Diabetes Care. 2008;31:811–822.
2. Dunn FL. Hyperlipidemia in diabetes mellitus. Diabetes Metab Rev. 1990;6:47–61.
3. Feher MD, Caslake M, Foxton J, Cox A, Packard CJ. Atherogenic lipoproteinphenotype in type 2 diabetes: reversal with micronised fenofibrate. DiabetesMetab Res Rev. 1999;15:395–399.
4. Gregg EW, Gu Q, Cheng YJ, Narayan KM, Cowie CC. Mortality trends in menand women with diabetes, 1971 to 2000. Ann Intern Med. 2007;147:149–155.
5. Haffner SM, Lehto S, Ronnemaa T, Pyorala K, Laakso M. Mortality fromcoronary heart disease in subjects with type 2 diabetes and in nondiabeticsubjects with and without prior myocardial infarction. N Engl J Med.1998;339:229–234.
6. Krauss RM. Lipids and lipoproteins in patients with type 2 diabetes. DiabetesCare. 2004;27:1496–1504.
7. Catapano AL, Reiner Z, De Backer G, Graham I, Taskinen MR, Wiklund O,Agewall S, Alegria E, Chapman M, Durrington P, Erdine S, Halcox J, Hobbs R,Kjekshus J, Filardi PP, Riccardi G, Storey RF, Wood D. ESC/EAS Guidelines forthe management of dyslipidaemias The task force for the management ofdyslipidaemias of the European Society of Cardiology (ESC) and the EuropeanAtherosclerosis Society (EAS). Atherosclerosis. 2011;217:3–46.
8. Foody JM, Sajjan SG, Hu XH, Ramey DR, Neff DR, Tershakovec AM, Tomassini JE,Wentworth C, Tunceli K. Loss of early gains in low-density lipoprotein cholesterolgoal attainment among high-risk patients. J Clin Lipidol. 2010;4:126–132.
9. Rublee DA, Burke JP. LDL-C goal attainment in patients who remain onatorvastatin or switch to equivalent or non-equivalent doses of simvastatin: aretrospective matched cohort study in clinical practice. Postgrad Med.2010;122:16–24.
10. Santos RD, Waters DD, Tarasenko L, Messig M, Jukema JW, Chiang CW,Ferrieres J, Foody JM. A comparison of non-HDL and LDL cholesterol goalattainment in a large, multinational patient population: the Lipid TreatmentAssessment Project 2. Atherosclerosis. 2012;224:150–153.
11. Waters DD, Brotons C, Chiang CW, Ferrieres J, Foody J, Jukema JW, Santos RD,Verdejo J, Messig M, McPherson R, Seung KB, Tarasenko L. Lipid treatmentassessment project 2: a multinational survey to evaluate the proportion ofpatients achieving low-density lipoprotein cholesterol goals. Circulation.2009;120:28–34.
12. Anderson TJ, Gregoire J, Hegele RA, Couture P, Mancini GB, McPherson R,Francis GA, Poirier P, Lau DC, Grover S, Genest J Jr, Carpentier AC, Dufour R,Gupta M, Ward R, Leiter LA, Lonn E, Ng DS, Pearson GJ, Yates GM, Stone JA, UrE. 2012 Update of the Canadian Cardiovascular Society guidelines for thediagnosis and treatment of dyslipidemia for the prevention of cardiovasculardisease in the adult. Can J Cardiol. 2013;29:151–167.
13. Grundy SM. Low-density lipoprotein, non-high-density lipoprotein, andapolipoprotein B as targets of lipid-lowering therapy. Circulation.2002;106:2526–2529.
14. International Atherosclerosis Society. An International Atherosclerosis SocietyPosition Paper: global recommendations for the management of dyslipidemia-full report. J.Clin.Lipidol. 2014;8:29–60.
15. Jellinger PS, Smith DA, Mehta AE, Ganda O, Handelsman Y, Rodbard HW,Shepherd MD, Seibel JA, Kreisberg R, Goldberg R. American Association ofClinical Endocrinologists’ guidelines for management of dyslipidemia andprevention of atherosclerosis. Endocr Pract. 2012;18(suppl 1):1–78.
16. Stone NJ, Robinson J, Lichtenstein AH, Merz CN, Blum CB, Eckel RH, GoldbergAC, Gordon D, Levy D, Lloyd-Jones DM, McBride P, Schwartz JS, Shero ST,Smith SC Jr, Watson K, Wilson PW. 2013 ACC/AHA guideline on the treatmentof blood cholesterol to reduce atherosclerotic cardiovascular risk in adults: areport of the American College of Cardiology/American Heart AssociationTask Force on Practice Guidelines. Circulation. 2013;29(25 Suppl 2):S1–S45.
17. Bays HE, Neff D, Tomassini JE, Tershakovec AM. Ezetimibe: cholesterollowering and beyond. Expert Rev Cardiovasc Ther. 2008;6:447–470.
18. Catapano AL, Toth PP, Tomassini JE, Tershakovec AM. The efficacy and safetyof ezetimibe co-administered with statin therapy in various patient groups. ClinLipidol. 2013;8:13–41.
19. Morrone D, Weintraub WS, Toth PP, Hanson ME, Lowe RS, Lin J, Shah AK,Tershakovec AM. Lipid-altering efficacy of ezetimibe plus statin and statinmonotherapy and identification of factors associated with treatment response:a pooled analysis of over 21,000 subjects from 27 clinical trials. Atheroscle-rosis. 2012;223:251–261.
20. Toth PP, Catapano A, Tomassini JE, Tershakovec AM. Update on the efficacyand safety of combination ezetimibe plus statin therapy. Clin Lipidol.2010;5:655–684.
21. Blazing MA, Giugliano RP, Cannon CP, Musliner TA, Tershakovec AM, White JA,Reist C, McCagg A, Braunwald E, Califf RM. Evaluating cardiovascular eventreduction with ezetimibe as an adjunct to simvastatin in 18,144 patients afteracute coronary syndromes: final baseline characteristics of the IMPROVE-ITstudy population. Am Heart J. 2014;168:205–212.
22. Cannon CP, Blazing MA, Giugliano RP, McCagg A, White JA, Theroux P, DariusH, Lewis BS, Ophuis TO, Jukema JW, De FERRARI GM, Ruzyllo W, De LUCCA P, ImK, Bohula EA, Reist C, Wiviott SD, Tershakovec AM, Musliner TA, Braunwald E,Califf RM; on behalf of the IMPROVE-IT investigators. Ezetimibe added to statintherapy after acute coronary syndromes. N Engl J Med. 2015;372:2387–2397.
23. Blazing MA, Guigliano R, Cannon CP, Musliner TA, Tershakovec AM, White JA,Reist C, McCagg A, Braunwald E, Califf RM. IMProved reduction of outcomes:vytorin efficacy international trial on-treatment analysis. Available at: http://
DOI: 10.1161/JAHA.114.001675 Journal of the American Heart Association 11
Ezetimibe/Simvastatin and Lipoprotein Subclasses Le et alORIG
INALRESEARCH
by guest on June 13, 2018http://jaha.ahajournals.org/
Dow
nloaded from

my.americanheart.org/idc/groups/ahamah-public/@wcm/@sop/@scon/documents/downloadable/ucm_469652.pdf. Accessed October 13, 2015.
24. Chehade JM, Gladysz M, Mooradian AD. Dyslipidemia in type 2 diabetes:prevalence, pathophysiology, and management. Drugs. 2013;73:327–339.
25. Davidson MH, Ballantyne CM, Jacobson TA, Bittner VA, Braun LT, Brown AS,Brown WV, Cromwell WC, Goldberg RB, McKenney JM, Remaley AT, SnidermanAD, Toth PP, Tsimikas S, Ziajka PE, Maki KC, Dicklin MR. Clinical utility ofinflammatory markers and advanced lipoprotein testing: advice from an expertpanel of lipid specialists. J Clin Lipidol. 2011;5:338–367.
26. Mangalmurti SS, Davidson MH. The incremental value of lipids and inflam-matory biomarkers in determining residual cardiovascular risk. Curr Ather-oscler Rep. 2011;13:373–380.
27. Otvos JD, Mora S, Shalaurova I, Greenland P, Mackey RH, Goff DC Jr. Clinicalimplications of discordance between low-density lipoprotein cholesterol andparticle number. J Clin Lipidol. 2011;5:105–113.
28. Cromwell WC, Otvos JD. Heterogeneity of low-density lipoprotein particlenumber in patients with type 2 diabetes mellitus and low-density lipoproteincholesterol <100 mg/dl. Am J Cardiol. 2006;98:1599–1602.
29. deGoma EM, Rader DJ. High-density lipoprotein particle number: a bettermeasureto quantify high-density lipoprotein? J Am Coll Cardiol. 2012;60:517–520.
30. Mackey RH, Greenland P, Goff DC Jr, Lloyd-Jones D, Sibley CT, Mora S. High-density lipoprotein cholesterol and particle concentrations, carotid atheroscle-rosis, and coronary events: MESA (multi-ethnic study of atherosclerosis). J AmColl Cardiol. 2012;60:508–516.
31. Rosenson RS, Otvos JD, Hsia J. Effects of rosuvastatin and atorvastatin on LDL andHDL particle concentrations in patients with metabolic syndrome: a randomized,double-blind, controlled study. Diabetes Care. 2009;32:1087–1091.
32. van der Steeg WA, Holme I, Boekholdt SM, Larsen ML, Lindahl C, Stroes ES,Tikkanen MJ, Wareham NJ, Faergeman O, Olsson AG, Pedersen TR, Khaw KT,Kastelein JJ. High-density lipoprotein cholesterol, high-density lipoproteinparticle size, and apolipoprotein A-I: significance for cardiovascular risk: theIDEAL and EPIC-Norfolk studies. J Am Coll Cardiol. 2008;51:634–642.
33. Rosen JB, Jimenez JG, Pirags V, Vides H, Hanson ME, Massaad R, McPeters G,Brudi P, Triscari J. A comparison of efficacy and safety of an ezetimibe/simvastatin combination compared with other intensified lipid-loweringtreatment strategies in diabetic patients with symptomatic cardiovasculardisease. Diab Vasc Dis Res. 2013;10:277–286.
34. Otvos JD. Measurement of lipoprotein subclass profiles by NMR spectroscopy.In: Rifai N, Warnick GR, and Dominiczak MH, eds. Handbook of LipoproteinTesting. Washington DC: AACC Press; 2000:609–623.
35. Ballantyne CM, Hoogeveen RC, Bang H, Coresh J, Folsom AR, Heiss G, SharrettAR. Lipoprotein-associated phospholipase A2, high-sensitivity C-reactiveprotein, and risk for incident coronary heart disease in middle-aged menand women in the Atherosclerosis Risk in Communities (ARIC) study.Circulation. 2004;109:837–842.
36. Corson MA, Jones PH, Davidson MH. Review of the evidence for the clinicalutility of lipoprotein-associated phospholipase A2 as a cardiovascular riskmarker. Am J Cardiol. 2008;101:41F–50F.
37. Garza CA, Montori VM, McConnell JP, Somers VK, Kullo IJ, Lopez-Jimenez F.Association between lipoprotein-associated phospholipase A2 and cardiovas-cular disease: a systematic review. Mayo Clin Proc. 2007;82:159–165.
38. Malave H, Castro M, Burkle J, Voros S, Dayspring T, Honigberg R, Pourfarzib R.Evaluation of low-density lipoprotein particle number distribution in patientswith type 2 diabetes mellitus with low-density lipoprotein cholesterol<50 mg/dl and non-high-density lipoprotein cholesterol <80 mg/dl. Am JCardiol. 2012;110:662–665.
39. Barrios V, Amabile N, Paganelli F, Chen JW, Allen C, Johnson-Levonas AO,Massaad R, Vandormael K. Lipid-altering efficacy of switching from atorvastatin10 mg/day to ezetimibe/simvastatin 10/20 mg/day compared with doublingthe dose of atorvastatin in hypercholesterolaemic patients with atherosclerosisor coronary heart disease. Int J Clin Pract. 2005;59:1377–1386.
40. Constance C, Westphal S, Chung N, Lund M, McCrary SC, Johnson-LevonasAO, Massaad R, Allen C. Efficacy of ezetimibe/simvastatin 10/20 and 10/40 mg compared with atorvastatin 20 mg in patients with type 2 diabetesmellitus. Diabetes Obes Metab. 2007;9:575–584.
41. Hing Ling PK, Civeira F, Dan AG, Hanson ME, Massaad R, De Tilleghem CB,Milardo C, Triscari J. Ezetimibe/simvastatin 10/40 mg versus atorvastatin40 mg in high cardiovascular risk patients with primary hypercholesterolemia:a randomized, double-blind, active-controlled, multicenter study. Lipids HealthDis. 2012;11:18.
42. Bays HE, Averna M, Majul C, Muller-Wieland D, De Pellegrin A, Giezek H, Lee R,Lowe RS, Brudi P, Triscari J, Farnier M. Efficacy and safety of ezetimibe added toatorvastatin versus atorvastatin uptitration or switching to rosuvastatin in patientswith primary hypercholesterolemia. Am J Cardiol. 2013;112:1885–1895.
43. Farnier M, Averna M, Missault L, Vaverkova H, Viigimaa M, Massaad R,Vandormael K, Johnson-Levonas AO, Brudi P. Lipid-altering efficacy ofezetimibe/simvastatin 10/20 mg compared with rosuvastatin 10 mg inhigh-risk hypercholesterolaemic patients inadequately controlled with priorstatin monotherapy: the IN-CROSS study. Int J Clin Pract. 2009;63:547–559.
44. Sniderman AD. Differential response of cholesterol and particle measures ofatherogenic lipoproteins to LDL-lowering therapy: implications for clinicalpractice. J Clin Lipidol. 2008;2:36–42.
45. Gerber PA, Thalhammer C, Schmied C, Spring S, Amann-Vesti B, Spinas GA,Berneis K. Small, dense LDL particles predict changes in intima mediathickness and insulin resistance in men with type 2 diabetes and prediabetes:a prospective cohort study. PLoS One. 2013;8:e72763.
46. Nishikura T, Koba S, Yokota Y, Hirano T, Tsunoda F, Shoji M, Hamazaki Y,Suzuki H, Itoh Y, Katagiri T, Kobayashi Y. Elevated small dense low-densitylipoprotein cholesterol as a predictor for future cardiovascular events inpatients with stable coronary artery disease. J Atheroscler Thromb.2014;21:755–767.
47. Hoogeveen RC, Gaubatz JW, Sun W, Dodge RC, Crosby JR, Jiang J, Couper D,Virani SS, Kathiresan S, Boerwinkle E, Ballantyne CM. Small dense low-densitylipoprotein-cholesterol concentrations predict risk for coronary heart disease:the Atherosclerosis Risk In Communities (ARIC) study. Arterioscler ThrombVasc Biol. 2014;34:1069–1077.
48. Lamarche B, Tchernof A, Moorjani S, Cantin B, Dagenais GR, Lupien PJ,Despres JP. Small, dense low-density lipoprotein particles as a predictor of therisk of ischemic heart disease in men. Prospective results from the QuebecCardiovascular Study. Circulation. 1997;95:69–75.
49. Morris B, McLain KH, Malave HA, Underberg JA, Le N, Shapiro MD, WinegarDA, Pourfarzib R. Relationship between plasma apoliprotein B concentrationand LDL particle number. Res Rep Clin Cardiol. 2014;5:237–242.
50. Sniderman AD, Lamarche B, Contois JH, de Graaf J. Discordance analysis andthe Gordian knot of LDL and non-HDL cholesterol versus apoB. Curr OpinLipidol. 2014;25:461–467.
51. Cole TG, Contois JH, Csako G, McConnell JP, Remaley AT, Devaraj S, HoefnerDM, Mallory T, Sethi AA, Warnick GR. Association of apolipoprotein B andnuclear magnetic resonance spectroscopy-derived LDL particle number withoutcomes in 25 clinical studies: assessment by the AACC Lipoprotein andVascular Diseases Division Working Group on Best Practices. Clin Chem.2013;59:752–770.
52. Mora S, Szklo M, Otvos JD, Greenland P, Psaty BM, Goff DC Jr, O’Leary DH,Saad MF, Tsai MY, Sharrett AR. LDL particle subclasses, LDL particle size, andcarotid atherosclerosis in the Multi-Ethnic Study of Atherosclerosis (MESA).Atherosclerosis. 2007;192:211–217.
53. Le NA, Jin R, Tomassini JE, Tershakovec AM, Neff DR, Wilson PW. Changes inlipoprotein particle number with ezetimibe/simvastatin coadministered withextended-release niacin in hyperlipidemic patients. J Am Heart Assoc. 2013;2:e000037 doi: 10.1161/JAHA.113.000037.
54. Jafri H, Alsheikh-Ali AA, Mooney P, Kimmelstiel CD, Karas RH, Kuvin JT.Extended-release niacin reduces LDL particle number without changing totalLDL cholesterol in patients with stable CAD. J Clin Lipidol. 2009;3:45–50.
55. Camont L, Chapman MJ, Kontush A. Biological activities of HDL subpopula-tions and their relevance to cardiovascular disease. Trends Mol Med.2011;17:594–603.
56. Kontush A, Chapman MJ. Antiatherogenic function of HDL particle subpop-ulations: focus on antioxidative activities. Curr Opin Lipidol. 2010;21:312–318.
57. Rosenson RS, Davidson MH, Le NA, Burkle J, Pourfarzib R. Underappreciatedopportunities for high-density lipoprotein particles in risk stratification andpotential targets of therapy. Cardiovasc Drugs Ther. 2015;29:41–50.
58. Ballantyne CM, Hoogeveen RC, Raya JL, Cain VA, Palmer MK, Karlson BW.Efficacy, safety and effect on biomarkers related to cholesterol and lipoproteinmetabolism of rosuvastatin 10 or 20 mg plus ezetimibe 10 mg vs. simvastatin40 or 80 mg plus ezetimibe 10 mg in high-risk patients: results of theGRAVITY randomized study. Atherosclerosis. 2014;232:86–93.
59. Moutzouri E, Liberopoulos EN, Tellis CC, Milionis HJ, Tselepis AD, Elisaf MS.Comparison of the effect of simvastatin versus simvastatin/ezetimibe versusrosuvastatin on markers of inflammation and oxidative stress in subjects withhypercholesterolemia. Atherosclerosis. 2013;231:8–14.
60. Saougos VG, Tambaki AP, Kalogirou M, Kostapanos M, Gazi IF, Wolfert RL,Elisaf M, Tselepis AD. Differential effect of hypolipidemic drugs on lipoprotein-associated phospholipase A2. Arterioscler Thromb Vasc Biol. 2007;27:2236–2243.
61. Zhang B, Fan P, Shimoji E, Itabe H, Miura S, Uehara Y, Matsunaga A, Saku K.Modulating effects of cholesterol feeding and simvastatin treatment onplatelet-activating factor acetylhydrolase activity and lysophosphatidylcholineconcentration. Atherosclerosis. 2006;186:291–301.
DOI: 10.1161/JAHA.114.001675 Journal of the American Heart Association 12
Ezetimibe/Simvastatin and Lipoprotein Subclasses Le et alORIG
INALRESEARCH
by guest on June 13, 2018http://jaha.ahajournals.org/
Dow
nloaded from

Ngoc-Anh Le, Joanne E. Tomassini, Andrew M. Tershakovec, David R. Neff and Peter W. F. WilsonDiabetic Patients With Symptomatic Cardiovascular Disease
Lowering Strategies on Lipoprotein Subclasses in−Compared With Other Intensified Lipid Effect of Switching From Statin Monotherapy to Ezetimibe/Simvastatin Combination Therapy
Online ISSN: 2047-9980 Dallas, TX 75231
is published by the American Heart Association, 7272 Greenville Avenue,Journal of the American Heart AssociationThe doi: 10.1161/JAHA.114.001675
2015;4:e001675; originally published October 20, 2015;J Am Heart Assoc.
http://jaha.ahajournals.org/content/4/10/e001675World Wide Web at:
The online version of this article, along with updated information and services, is located on the
for more information. http://jaha.ahajournals.orgAccess publication. Visit the Journal at
is an online only OpenJournal of the American Heart AssociationSubscriptions, Permissions, and Reprints: The
by guest on June 13, 2018http://jaha.ahajournals.org/
Dow
nloaded from