Embed Size (px)
Citation preview


EFFECT OF SUPERPLASTICIZERS ON
CONCRETE-STEEL BOND STRENGTH
by
Barie B. Brettmann David Darwin
Rex C. Donahey
A Report on Research Sponsored by The University of Kansas
Transportation Center
UNIVERSITY OF KANSAS LAWRENCE, KANSAS
April 1984

Abstract
Effect of Superplasticizers
on
Concrete-Steel Bond Strength
The effects of superp 1 asti ci zers on concrete-steel bond strength are
studied. Key variables are degree of consolidation, concrete slump, both
with and without a superplasticizer, concrete temperature, and bar
position. #8 deformed reinforcing bars were used with a 2 in. cover and a
10 in. bonded length. Concrete slumps ranged from 1-3/4 in. to 9 in.
Three specimen depths were used. All specimens were modified cantilever
beam specimens.
Based on the experimental results, high slump superplasticized
concrete pro vi des a 1 ower bond strength than 1 ow slump concrete of the
same strength. Superpl asti ci zed concrete pro vi des a higher bond strength
than high slump regular concrete with the same slump and water-cement
ratio. Vibration of high slump concrete increases the bond strength
compared to high slump concrete without vibration. Bond strength
decreases as the amount of concrete below a bar increases, but the
greatest effect appears to occur with top-cast (i.e. upper surface) bars.

INTRODUCTION
One of the major advances in concrete technology in the last twenty years has been the development of high-range water-reducers. The
admixtures, also known as superpl asti ci zers, are used to make high slump,
very workable normal strength concrete as well as 1 ow slump, 1 ow water
cement ratio, high strength concrete. While superpl asti ci zers have a
number of important advantages, there is some concern with the high slump
mixtures, since previous work has shown that bond strength tends to
decrease with increasing slump for concrete without superpl asti cizers, especially for top-cast bars (3-7, 9).
This report presents the results of a study of the effects of high
range water-reducers on the bond strength between horizontal deformed
reinforcing bars and concrete. The key variables are the degree of
consolidation, concrete slump, both with and without a superpl asti ci zer,
concrete temperature, and bar position.
EXPERIMENTAL INVESTIGATION
To study the effects of high-range water-reducers on bond strength, test specimens, placement procedures, and test procedures were selected to
reflect field conditions as closely as possible.
Test Specimens
Four specimen types and five different test bar positions were used for each set of specimens (Fig. 1): Two shallow specimens, 9xllx24 in.,
one with a bottom-cast bar (2 in. of concrete below the bar) and the other
with a top-cast bar (8 in. of concrete below the bar); one medium specimen, 9xl8x24 in., with a top-cast bar (15 in. of concrete below the
bar); and one deep specimen, 9x39x24 in., with both a bottom-cast bar (2
in. of concrete below. the bar), and a top-cast bar (36 in. of concrete
below the bar). Eight sets of specimens were tested, each with different
concrete properties, for a total of 32 test specimens and 40 bars.
Steel in addition to the test bar was kept to a minimum. Two #5 bars parallel to the test bar were provided to prevent the specimen from
failing in flexure during pullout (Fig. 2), and a single transverse #5 bar

2
was used to support the test bar. One or two small lifting brackets were be·
added to help move the specimens. pr'
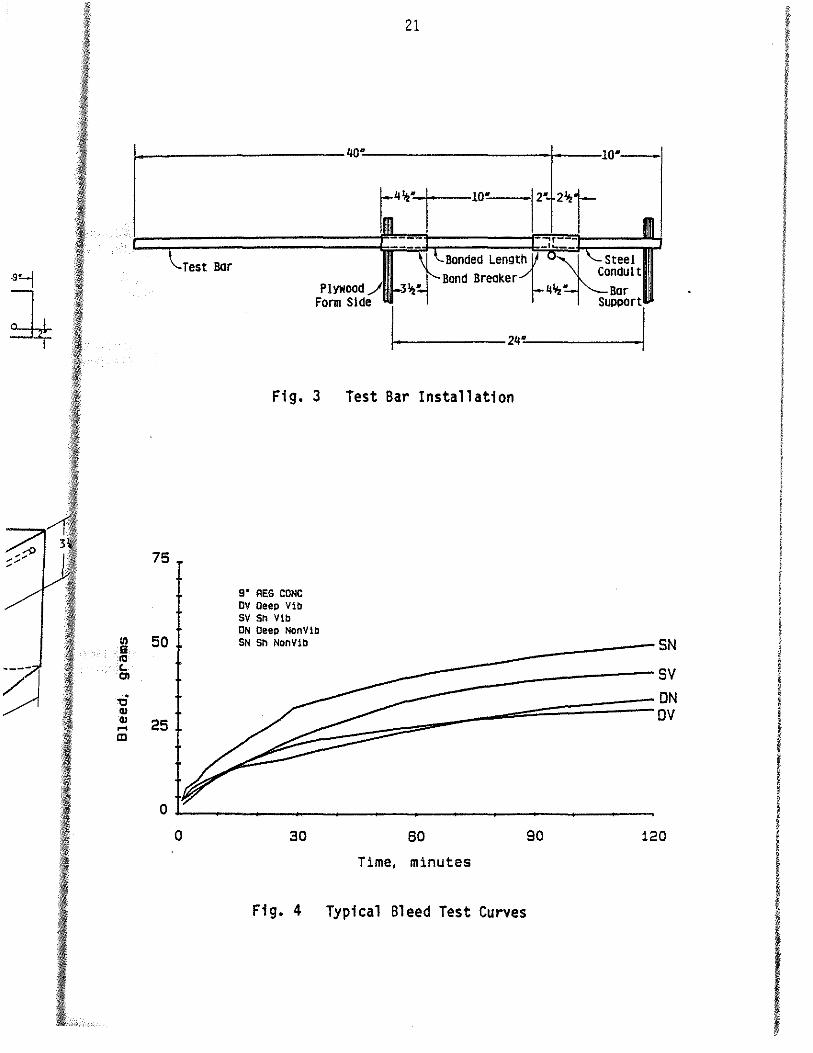
The test bars were 40 in. long, with two 4-1/2 in. long, 1 in.
diameter polyvinyl chloride (PVC) pipes as bond breakers to limit the wi
bonded 1 ength of the test bar and to prevent a cone type pull out failure to
on the front surface of the specimen (Fig. 3). A 10 in. long, 1 in. ba
diameter steel conduit was used to pro vi de access to the test bar for se
unloaded end slip measurements. Based on previous work at the University cc
of Kansas (3-5), a 2 in. concrete cover and a 10 in. embedment length was w<
used to insure that a splitting failure occurred when the bars pulled out.
Material Properties
Concrete: Non-air entrained concrete was supplied by a local ready mix plant. Type I portland cement and 3/4 in. nominal maximum size coarse aggregate were used. A design water-cement ratio of 0.55 was used for all
placements. Concrete slump was varied using both water content and high
range water-reducers. Superpl asti ci zer was added directly into the ready
mix truck immediately before placing until the desired slump was
reached. Mix designs, aggregate properties, and concrete properties are summarized in Table 1.
Steel: ASTM A 615, Grade 60 #8 reinforcing bars were used for all
tests. Oeformati on dimensions, bearing areas, and steel strengths are presented in Table 2.
High-Range Water-Reducer: The high-range water-reducer was PSI Super
supplied by Gifford-Hill and Company, Inc. PSI Super is anionic naphthalene base material and meets or exceeds the requirements of ASTM C
494 ( 2) for Types F and G admixtures ( 8). High-range water-reducer dosages are given in Table 1.
Placement Procedure
Construction and placement procedures were selected to be as
consistent as possi b 1 e between i ndi vi dual specimens and concrete types. The formwork was constructed from 3/4 inch BB Plyform and standard
2x4' s. Forms were coated with brushing 1 acquer to prevent water from
01
c s s 11'
c 1

:kets
imit
t fail g, 1 in.
bar for tiversity ngth was led out.
tl ready l coarse for all d highe ready mp was i es are
'or all
hs are
Super nionic ~STM C
~ducer
e as ypes. ndard from
3
being absorbed into the plywood. All joints and cracks were caulked to prevent water leakage.
Test bar preparation consisted of soaking in acetone for 45 seconds, wiping with a clean paper towel in one direction, discarding the paper towel, and wiping again with another towel. This was repeated until the bar was free of oil and grit. The bar was then installed using a silicon sealer to provide a non-binding connection to the bond breakers and conduit, as shown in Fig. 3. After placing the test bar in the form, it was again cleaned with acetone.
The test specimens were placed in three groups. Each group consisted of two or three sets of specimens.
The first set of specimens in Group 1 was fabricated using low slump concrete as it arrived from the ready mix plant. After placing the first set, high-range water-reducer was added to the concrete to increase the slump. One set of vibrated and one set of non-vi bra ted specimens were made with the superplasticized concrete. These specimens were placed at a concrete temperature of 84°F, which caused the superpl asti ci zer to rapidly lose effectiveness and the concrete in the upper layers of the deep specimens to have a reduced slump.
Group 2 was made superplasticized) concrete.
using a high slump regular (i.e. nonOne set of vi bra ted and one set of non-
vibrated specimens were made.
The first set in Group 3 used a medium slump concrete as it arrived from the ready mix plant. The high-range water-reducer was then added, and one set of vibrated and one set of non-vibrated specimens were placed.
The concrete was placed in the forms using shovels. For the vibrated specimens, the shallow, medium, and deep specimens were placed in one, two, and three lifts, respectively. The non-vibrated specimens were placed in a single lift.
The vibrated specimens were consolidated using a 1-1/2 in. electric internal vibrator. The specimens were vibrated at six points, with the vibrator inserted rapidly and withdrawn slowly. The concrete was vibrated until paste was seen coming to the surface. There was no attempt to consolidate the non-vibrated specimens.

4
After all of the specimens of a concrete type were consolidated, the
specimens were screeded using a meta 1-edged screed. Immediately after
screeding, the surface was finished using a magnesium hand float. Bleed
tests were started upon completion of finishing.
A modification of the special bleed tests developed in earlier work
at the University of Kansas (3-5) was used. 'The tests were performed on
the surface of the shallow and deep specimens, away from the bonded length
of the test bar. The tests used 5-1/2 inch square paper towels (from the
same lot). The towels were placed on the surface of the concrete and
covered with a glass plate to prevent evaporation. When fully saturated,
the towels were replaced. The time on the surface was recorded for each
specimen. The wet towels were weighed and then dried and weighed again to
determine the amount of bleedwater. This test provides data on the amount
of bleed water reaching the specimen surface as a function of time after
finishing (Fig. 4). The tests were not solely a measure of bleed, since
the towels drew water from the specimen surface. Bleed data was taken for
approximately 90 minutes for Group 1 and 120 minutes for Groups 2 and 3.
Result
p
passed
exhibi
diffel
The s'
speci'
the <
mix 1
flui<
also
had ·
the
cone
spec
med' The specimens were then covered with polyethylene and kept moist. sha'
The forms were stripped when the concrete strength reached about 3500 psi. obt
Standard 6xl2 in. compression cylinders were made· for each type of
concrete, four for measuring the strength gain, and four for determining
the concrete strength at the time of testing.
Test Procedure
The bond tests were made at concrete strengths between 4000 and 4800
psi. The specimens were tested using the pullout apparatus shown in Fig.
5, which is a modification of the equipment used by Donahey and Darwin (3-
5). The test places the concrete around the test bar in tension, as it
would be under actual conditions, and not in compression as in some
earlier tests (4).
Gro
was
slc
wi·
co
vi
su
tl
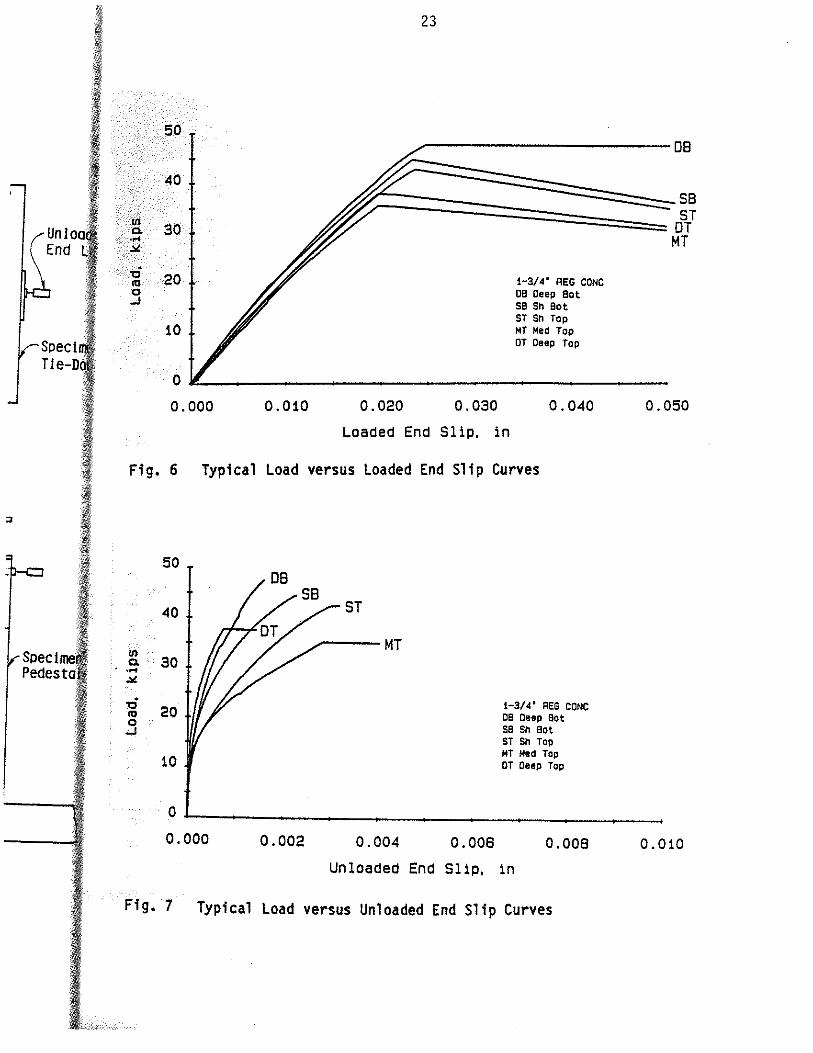
The specimens from a group were tested within a 10 hour period, at s
ages ranging from 5 days to 22 days. The bars were loaded at
approximately 6 kips per minute. Load, loaded end slip, and unloaded end
slip were recorded during the tests (Fig. 6 and 7).

1 i dated, the
lately afte
1 oat. Bl ee
earlier work!
performed on onded length.
5
Results and Observations
Plastic Concrete: Bleeding was rapid at first, but slowed as time
passed (Fig. 4, Table 3). With only one exception, the shallow specimens
exhibited more bleeding than the companion deep specimens. This
difference between specimens is likely due to the method of placement.
The shallow specimens, along with the initial lifts in the medium and deep
specimens, were placed first, followed by the second and third lifts in
1 s (from the the deeper specimens. Si nee the first concrete discharged from a ready :oncrete and:
1 saturated,
led for each,
1ed again to.
1 the amount
time after
lleed, since
IS taken for .
2 and 3.
kept moist.
t 3500 psi.
iCh type of,
determining
)0 and 4800
lwn in Fig.
Darwin (3-
;ion, as it
iS in some .
period, at
1 oaded at
11 oaded end
mix truck is usually more fluid than the rest of the batch, this greater
fluidity may account for the difference in surface bleed. These results
also suggest that the b 1 eed from the 1 ower 1 ifts in the deeper specimens
had little effect on the bleed at the upper surface.
Overall, low bleed (15.4 to 21.6 g in 90 minutes) was obtained for
the specimens in Group 1 (84°F, low slump regular and superplasticized
concrete). Medium bleed (21.8 to 38.3 g) was obtained for the deep
specimens in Groups 2 (78°F, high slump regular concrete) and 3 (53°F,
medium slump regular and superplasticized concrete), as well as the
shallow medium slump specimen in Group 3. High bleed (40.1 to 70.6 g) was
obtained for the shallow high slump specimens in Groups 2 and 3, with
Group 3 showing the highest amount of bleed. The greater bleed in Group 3
was probably caused by the lower concrete temperature which resulted in a
slower rate of setting.
The vi bra ted specimens bled 1 ess than the non-vi bra ted specimens,
with the exception of the Group 1 specimens (84°F, superplasticized
concrete), which showed little difference. The greater bleed in the non
vi bra ted specimens may have been due to greater settlement which occurred
subsequent to finishing.
In all cases, the rate of bleed was enhanced due to the coarseness of
the fine aggregate (fineness modulus= 3.17).
Five specimens showed visual signs of settlement (top of the concrete
surface settling below the top of the form):
1. Deep specimen 2D: 78°F, high slump regular, vibrated
2. Deep specimen 2H: 78°F, high slump regular, non-vibrated
3. Deep specimen 3H: 53°F, superplasticized, vibrated

6
4. Medium specimen 3K: 53°F, superplasticized, non-vibrated T 5. Deep specimen 3L: 53°F, superplasticized, non-vibrated
Parallel settlement cracks developed over some of the test and dumn 1 bars. Small cracks developed over the test bars only in:
1. Medium specimen 2G: 78°F, high slump regular, vibrated
2. Medium specimen 2C: 78°F, high slump regular, non-vibrated
3. Deep specimen 3D: 53°F, medium slump regular, vibrated
4. Shallow specimen 3E: 53°F, superplasticized, vibrated
5. Shallow specimen 31: 53°F, superplasticized, non-vibrated
6. Medium specimen 3G: 53°F, superplasticized, vibrated
Noticeable cracks developed over both test and dummy bars in:
1. Deep specimen 2H: 78°F, high slump regular, vibrated
2. Deep specimen 2D: 78°F, high slump regular, non-vibrated
3. Deep specimen 3H: 53°F, superplasticized, vibrated
4. Medium specimen 3K: 53°F, superplasticized, non-vibrated
5. Deep specimen 3L: 53°F, superplasticized, non-vibrated
The cracks in the last specimen were particularly clear.
The non-vi bra ted specimens had many sma 11 surface voids, especi all,
under the reinforcement. The vi bra ted specimens had smooth sides wit\
very few voids.
Hardened Concrete: During pull out, a splitting type bond fail ur1
occurred in all cases. The top surface crack ran parallel to and abov1
the test bar over the bonded section of the bar and fanned out over thl
rear PVC bond breaker. Two different cracking patterns were observed ol
the front surface of the specimens {Fig. 8): a triple crack, one runnin\
straight down from the top to the test bar, and then two others a1
approximately 120 degrees to the first, generally occurred in the
specimens with 1 ower bond strengths. A double crack, one passing down
from the top surface to the test bar, then continuing on under the test
bar to the top of the bearing pad of the testing machine, accompanied by a crack perpendicular to the first running across the face of the specimen
at the top of the bearing pad, occurred in the higher bond strength
specimens.
The ultimate bond forces are listed along with test variables in
t

tnd dum
ted
~ciall.
>S wit
'ai 1 ur abov'
er th. ved o unnin ~rs a .
! tes · I by
•cimen ength
!S in
7
Table 4.
The compressive strength of the superpl asti ci zed concrete was 8% to 12% (360 psi to 460 psi) higher than the strength of the companion regular concrete (Table 4).
EVALUATION OF EXPERIMENTAL RESULTS
The test results are used to examine the effects of high-range waterreducers upon concrete-steel bond strength. The results are also used to examine the influence of the degree of consolidation, concrete slump, both with and without a superplasticizer, concrete temperature, and bar position.
The bond forces are converted to a bond force per unit length (kip/in.). These values are normalized to a concrete strength of 4000 psi using the assumption that, within the tested concrete range (4000 psi -4800 psi), bond strength is proportional to the square root of the compressive strength. Therefore, the values are multiplied by (4000/f~)l/2 • The normalized values are summarized in Table 4 and Fig. 9.
Comparing bond strengths on a normalized basis is necessary, because in practice, job concrete strength is based on the concrete used, not on the non-superpl asti ci zed base concrete. Therefore, there would be no "increase" in bond strength due to the higher strength obtained with a high-range water-reducer.
Effect of High-Range Water-Reducer
The effects of the high-range water-reducer on bond strength are presented in Fig. 10-13.
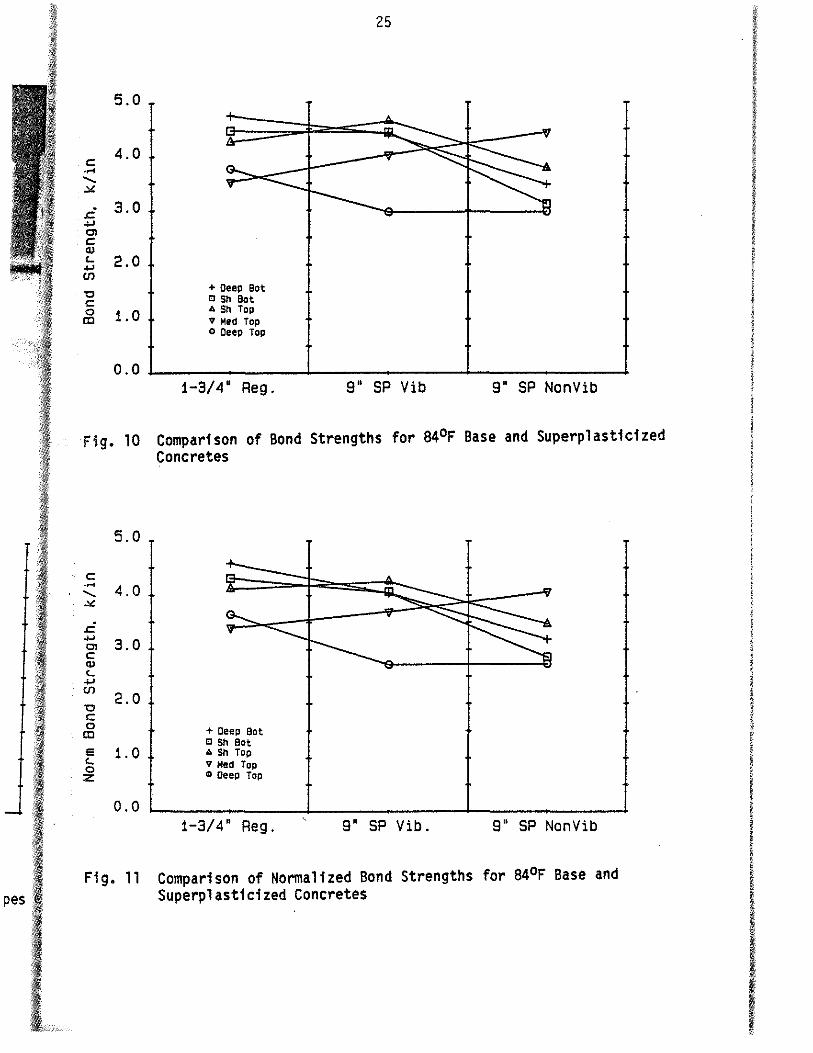
For the higher temperature (84°F) concrete (Group 1), the actual bond strengths are nearly the same for the 1 ow slump base concrete and the vibrated superplasticized concrete (Fig. 10). The bond strengths are comparable at least in part because of the increased compressive strength of the superplasticized concrete. However, the bond strength of the nonvibrated superplasticized concrete is an average of 14% lower when compared to the base concrete, in spite of the higher concrete strength.

8
For the same mixes (Group 1), the norma 1 i zed bond strength of tl\~ st '
vibrated superplasticized specimens decreases an average of 6% wh~ ad compared to the low slump base concrete (Fig. 11). The normalized bo~ sl strength of the non-vibrated superpl asti ci zed concrete decreases a average of 19% compared to the base concrete. The top-cast bar bof\ f! strengths for the non-vi bra ted superpl a,?ti ci zed concrete may not be full,, representative of non-consolidated concrete.
specimens was at a much lower slump when finished The concrete in thes ir than when placed, due \1 a1
the loss in effectiveness of the high-range water-reducer, requiring mori al effort to finish the top surface. Therefore, the concrete around the top' ; 1 cast bars was probably well consolidated. The bottom-cast bars, whic; c were not influenced by the extra finishing, should be more representativ of non-vibrated concrete.
In the lower temperature (53°Fl specimens (Group 3), both the actua and normalized bond strengths decrease from the medium slump base concret
c s II
to the higher slump superplasticized concrete (Fig. 12 and 13). For th( t
vibrated superpl asti ci zed specimens, the actual and norma 1 i zed .bon strengths drop an average of 12% and 15%, respectively. For the non. vibrated superplasticized specimens, the actual and normalized bon1 strengths decrease an average 27% and 30%, respectively. These values rna; be a better gage of the general trends than the higher temperaturt specimens because there was no extra consolidation around the top bar1 (the concrete remained at a high slump during finishing).
Effect of Slump
The bond strengths of bottom-cast bars in regular concrete are nol affected by concrete slump (Fig. 9). This observation agrees with earliel work (6,7 ,9).
However, the bond strengths of bottom-cast bars in tht superplasticized concrete are significantly lower than those of bottom• cast bars in the corresponding base concrete (Fig. 11 and 13), with al average decrease of 9% in Group 1 and 16% in Group 3 for the vibratet specimens.
In most cases, an increase in slump decreases the bond strengths o1 top-cast bars (Fig. 9 and 14). However, the decrease in normalized bont

9
gth of t strength with increasing slump is less when a high range water reducer is
f 6% wh • added than when the water content is increased in order to increase the
11ized bo slump (Fig. 9).
:reases
: bar bo
t be ful
ed, due
iring mo ·
d the to
1rs, whic
esentativ
the actua
! concret
For th
zed bon•.
the non •
zed bon
alues rna·
mperatur·
top bar ·
are no
1 earlie
in th
bottom
with a·
vibrate
1gths o ·
:ed bon
Effect of Bar Position
Concrete Below Bar: As the amount of concrete bel ow the test bar
increases, the normalized bond strength decreases (Fig. 15). The decrease
appears to be the least for the low slump regular concrete (Group 1),
approximately 16% as the depth below the test bar increases from 2 to 36
in. The greatest decrease, 40%, occurs for the high slump regular
concrete (Group 2).
Casting Position: The effect of casting position is seen when
comparing top-cast to bottom-cast bars. The ratio of normalized top-cast
strength to the average bond strength of the two bottom-cast bars, or
"bond efficiency ratio" ( 6 l, is plotted as a function of the concrete
below the bar (Fig. 16 and 17).
For the higher temperature regular concrete specimens (1 ow slump in
Group 1 and high slump in Group 2 l, there is a 10 to 40% decrease in the
normalized bond strength between a bottom-cast bar and the top-cast bar
with the least amount of concrete below the bar. The main portion of the
decrease appears to be due to an upper surface effect. A smaller
additional decrease in bond strength is associ a ted with an increase in
concrete depth below the top-cast bars.
In the higher temperature superplasticized specimens
another factor strongly effects the casting position results.
(Group 1),
Although
the concrete initially had a 9 in. slump, the slump had dropped to under 6 in. by the end of placement (all other 9 in. slump specimens remained at a
9 in. slump through finishing). This decrease in slump required more
effort for finishing, which improved the relative consolidation around the
top bars, especially the· non-vibrated specimens (Fig. 16). This extra
consolidation may account for the strength increases between bottom-cast
and top-cast bars of 5% in some vibrated to 35% in some non-vibrated
specimens.
The effect of casting position is seen more clearly for the lower

10
temperature specimens (Group 3), with decreases of 15 to 60% (Fig. 17, 36 i
There is some scatter in the 3-3/4 in. slump specimens, which may 1. used
because the lower slump concrete was more difficult to finish, resultil
in greater consolidation around the top-cast bars. Again, the effect 1
casting position appears to be dominated by the upper surface effect, at
Effe -the superplasticized specimens show only a slight decrease in normaliz1. in !
bond strength as concrete below the bar increases from 15 to 36 in. strE
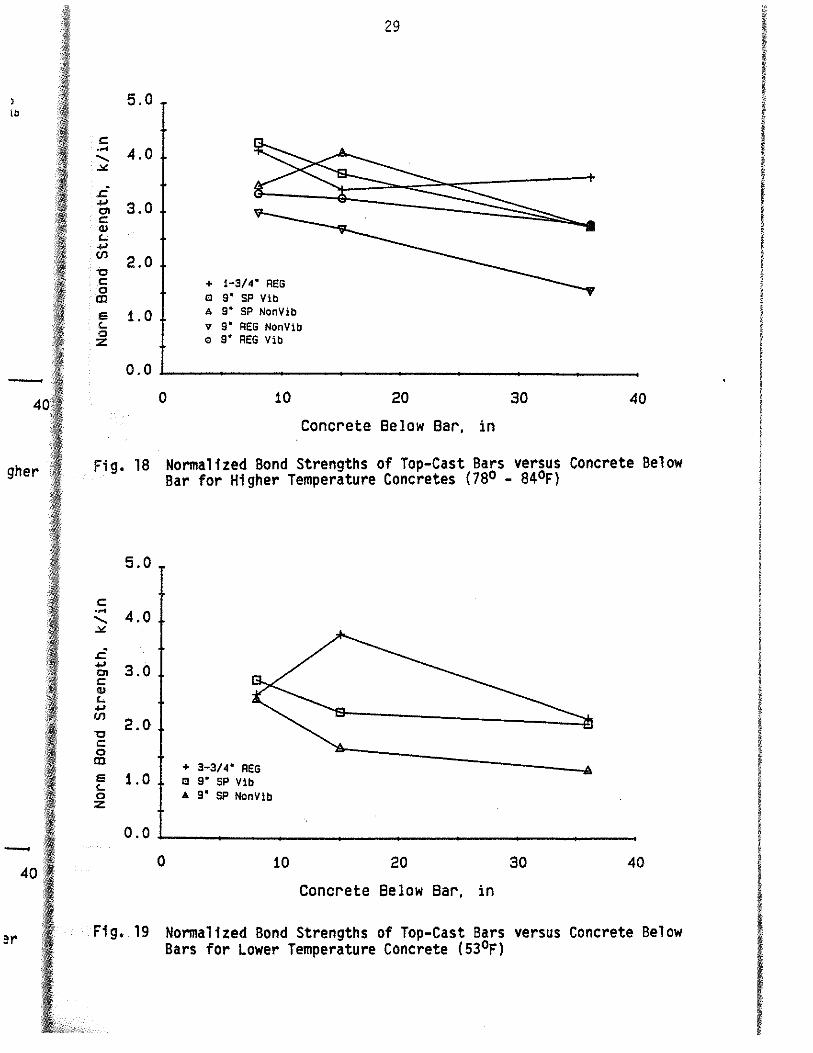
ACI "Top Bars" Verses Other Top-Cast Bars: The ACI Building Code (i vibt
defines a "top bar" as "horizontal reinforcement so placed that more thi rest ,, 12 in. of concrete is cast in the member below the reinforcement". 1 \
practice, a great deal of reinforcement falls under this definitic ave without being top-cast reinforcement. spe
In the current research, the differences in bond strength between tt 6%
bars with 8 in. of concrete below the bar, non "top bars", and bars wij of
15 in. of concrete below the bar, ACI "top bars", are relatively small, whE
with the exception of the non-vibrated superplasticized mix placed at 53t,
(Group 3) (Fig. 18 and 19). There is a greater reduction in bond strengt bor
for the bars with 36 in. of concrete below them. But even here, sizeabl apl
drops are obtained only for the high slump, non-vibrated specimens. Thi. 1)
shows that the choice of 12 in. of concrete bel ow the bar for the 30 re
reduction in bond strength (handled with a 40% increase in developmen th
length in ACI 318) for a "top bar" is arbitrary. There seems to be
gradual decrease in bond strength with no sharp drop off point. go
Comparing these results (Fig. 16-19) to research at the University o sp
Texas (6) indicates that much of the drop-off in bond strength is an uppe vi
surface effect. In the Texas tests, non top-cast bars generally showed
gradual and relatively low decrease in bond strength with an increase i 3'
concrete bel ow the bars from 2 to 39 in. In the current study, top-cas
bars with only 8 in. of concrete bel ow the bar show a sharp decrease i Sl 4
bond strength compared to bottom-cast bars with 2 in. of concrete belo
the bar. In this light, it makes more sense to apply the "top-bar" facto
to top-cast bars, regardless of the amount of concrete bel ow the bar. Y E
is questionable if such a large penalty is necessary for non top-cast bar
with more than 12 in. of concrete below the bar. It may still b c necessary to impose a large penalty for non top-cast bars with more tha t

i g. 17
1 may
·esul ti
ffect
ect, a
rmaliz
Code ( • )re th ·
tu.
Finiti ·
11
36 in. of concrete below the bar, particularly if high slump concrete is
used.
Effect of Vibration on High Slump Specimens
The results clearly show the importance of vibration on bond strength
in specimens made with high slump concrete. As shown in Fig. 20, the bond
strengths in the vibrated specimens exceed the bond strengths in the non
vibrated specimens in all but two cases. The observations agree with the
results obtained by Donahey and Darwin (3-5).
For the high slump, regular concrete, the bond strengths are an
average of 14% lower for the non-vibrated specimens than for the vibrated
specimens. For the bottom-cast bars, there is an average decrease of only
teen t . 6% for the non-vibrated specimens, largely due to the consolidating effect
:rs wi. · of the concrete above the bar. The top-cast bars average a 23% decrease
smal when not vibrated.
at 53 treng ,
izeab
Th
the 3
lopme. . o be ·
The superplasticized concrete, with just two exceptions, has a lower
bond strength with non-vi bra ted specimens (Fig. 20). The trend is not
apparent in two sets of the higher temperature top-cast specimens (Group
1). This, as mentioned earlier, is probably the result of the greater
relative consolidation applied to some of the top-cast bars, especially
the non-vibrated specimens •
The bottom-cast bars, which are away from the top surface, pro vi de a
good i ndi cation of the importance of vibration, with the non-vi bra ted ;ity specimens exhibiting a 25% decrease in bond strength compared to the 1 upp vibrated specimens. lOWed
1p-ca
ase i
belo
facto
r. I
t bar
11 b
: tha .
The non-vibrated lower temperature superplasticized specimens (Group
3) exhibit a uniform decrease in bond strength compared to the vibrated
specimens, with the values dropping from 8% for the bottom-cast bars to
41% for the top-cast bars in the deep specimens.
Effect of Temperature and Bleed
Generally, the more rapidly the concrete sets up, the less
deletereous are the effects of high slump and concrete below the bar. The
bond strengths of the lower temperature superplasticized specimens (Group

12
3) are noticeably less than the bond strengths of the higher temperatu, Recommr superplasticized specimens (Group 1) (Fig. 21). This is true regardl(' T
of whether the specimen was vibrated or not. The lower temperature causE 1 • s the high-range water-reducer to keep the specimen at a higher slump for 2. A 1 anger time and to delay set. This allows the lower temperature specime' c to bleed more (Table 3 and Fig. 22) and settle more, causing mot 3. c settlement cracking. The increased bleed and settlement decreases bo
strength. t
The higher slump concretes bled more than the lower slu 4.
specimens. For the lower temperature specimens, the superplasticir specimens bled much more than the 3-3/4 in. slump regular specimens (Gro
1
3), with the vi bra ted specimens b 1 eedi ng an average of 63% more and t: SUMMA!
non-vibrated specimens an average of 112% more (Fig. 23).
For the higher temperature regular concrete, the high slump specimet (Group 2) bled an average of 87% more (both vibrated and non-vibratei than the low slump specimens (Group 1) (Fig. 24). The high slump regul; concrete was cast on a different date and at a somewhat lower temperatul than the low slump regular concrete. The higher temperatUJ superplasticized concrete (Group 1) bled nearly the same as the low slur
regular concrete. This was probably due to the rapid slump 1 oss of tl. superplasticized concrete.
Bleed for the vi bra ted regular concrete only showed a 1 i ne< relationship between bleed and concrete slump (Fig. 25). This tret, compares favorably with the results obtained from previous work at tt University of Kansas on similar concrete (3-5).
Some comments on the relative effects of bleeding and settlement ar desirable. The decrease in bond strength with an increase in depth c
concrete beneath a bar is generally tied to both bleed and settlement The bleed tests (Table 3) in this investigation, however, indicate tha the shallow specimens bled more than the deep specimens. In spite o
this, the top-cast bars in the deep specimens had lower bond strength than the top-cast bars in the shallow specimens. This suggests tha settlement, not measured, but expected to be higher in the deep specimens· has a greater effect on bond strength than bleed.
Summa
super reinf co ncr tempe on 31
to dE
Conc1
desc: 1.
2.
3.
4.

13
· temperat Recommendations
e regard] The following recommendations reflect the findings of this study. ·ature cau
slump fo re specim ausing m :reases b
ower sl plastici mens (Gr 1re and
1 specime 1-vi brate mp regul emperatu emperatu low sl u
ss of t
a 1 i ne lis tre k at t
1ment a· depth tlemen He th >pite trength ts tha 1cimens
1.
2.
3.
Superplasticized concrete is recommended when using a high slump mix. All superplasticized concrete should be vibrated, especially when the concrete is placed in deep forms such as wall forms or column forms. care should be taken when using superplasticized concrete in cool weather (less than 55°F) to control possible excessive settlement and bleeding.
4. The current ACI "top-bar" requirements (1 l should be applied to top-cast bars.
SUMMARY AND CONCLUSIONS
Summary
The purpose of this investigation was to study the effects of superplasticized concrete on the bond strength of horizontal deformed reinforcing bars. The key variables were the degree of consolidation, conc·rete slump, both with and without a superpl asticizer, concrete temperature, and bar position. A total of 40 pullout tests were performed on 32 test specimens using #8 deformed bars. The results were evaluated to determine the effects of the major variables.
Conclusions
The following conclusions are based on the tests and analyses described in this report: 1. Vibrated, high slump concrete made with a high-range water-reducer
has a lower bond strength than a low slump concrete of equal strength.
2. Vibrated, high slump, superplasticized concrete and its low slump, non-superpl asti ci zed base concrete appear to have approximately the same bond strength due to the increased concrete strength obtained with the addition of the high-range water-reducer.
3, A decrease in bond strength occurs when high slump concrete (superplasticized or not) is not vibrated.
4. Increased concrete slump has a negative effect on bond strength of

5.
6.
7.
14
top-cast bars.
When using high-range water-reducers, the 1 onger the concrete remai;;
plastic (obtained with lower concrete temperatures in this study) t\ lower the bond strength.
A sharp drop-off in bond strength between bottom-cast bars and t~:
cast bars strongly suggests an ·. upper surface effect, even ft
relatively 1 ow amounts of concrete bel ow the bar. The current AI
{1) "top bar" requirements appear to be unconservative for top-ca~
bars with less than 12 in. of concrete below the bar and are possibl
over-conservative for non top-cast bars with more than 12 in. t
concrete below the bar when low slump concrete is used.
The bond strength of top-cast bars decreases as the amount
concrete below a bar increases.
Future Study
Based on this study, several other aspects concerning the use t
high-range water-reducers should be studied in order to fully understan
the effect of these materials on concrete-steel bond strength:
1. The effects on bond strength of high-range water-reducers used t
produce high strength, low slump concrete.
2. The effects on the bond strength of non top-cast bars (i.e. bars wit:
concrete above and below, such as in concrete walls).
3. The effects on bond strength when using higher cement factor concret
mixes, different aggregate graduations or entrained air in order t
reduce bleed.
4. The effects on the bond strength of smaller bars that do not cause
splitting failure.
ACKNOWLEDGEMENTS
This report is based on research performed by Barie B. Brettmann i!
partial fulfillment of the requirements for the MSCE degree from t~ University of Kansas. Support for this project was provided by th),
University of Kansas Transportation Center, Department of Ci vi)
Engineering, and Center for Research, Inc. High-range water-reducer wa!
supplied by Gifford-Hill and Company, Inc. Special thanks are due t!
Roli
Lab'
REF -
2

ete rema study)
·s and t
even :urrent 1r top-e·
·e possi 12 in.
amount
he use understa
s used
bars wi
· concre order
t cause
:tmann i
from th I by th
f Civi ucer wa
due t
15
Roland Hurst, manager of the University of Kansas Structural Engineering Laboratory, for his support in executing this study.
REFERENCES
1. ACI Committee Concrete ( AC I Michigan, 1983,
318, "Bui 1 ding Code Requirements for Reinforced 318-83)," American Concrete Institute, Detroit, lll pp.
2. ASTM C 494, "Standard Specifications for Chemica 1 Admixtures for Concrete," Annual Book of ASTM Standards, Part 14, American Society for Testing and Materials, Philadelphla, Pennsylvania, 1982, pp. 319-332.
3. Donahey, Rex C. and Darwin, David, "Effects of Construction Procedures on Bond in Bridge Decks," Structural Engineering and Engineering Materials SM Report No. 7, University of Kansas Center for Research, Inc., Lawrence, Kansas, January 1983, 125 pp.
4. Donahey, Rex C. and Darwin, David, "Effects of Innovative Construction Procedures on Bridge Decks: Part I, Effects of Construction Procedures on Bond in Bridge Decks," Structural Engineering and Engineering Materials SL Report 83-1, University of Kansas Center for Research, Inc., Lawrence, Kansas, June 1983, 28 pp.
5. Donahey, Rex C. and Darwin, David, "Bond of Top-Cast Bars in Bridge Decks," accepted for publication in the Journal of the American Concrete Institute.
6. Luke, J.J., Hamad, B.S., Jirsa, J.O. and Breen, J.E., "The Influence of Casting Position on Development and Splice Length on Reinforcing Bars," Research Report No. 242-1 , Center for Transportation Research, Bureau of Engineering Research, The University of Texas at Austin, June 1981, 153 pp.
7. Menzel, Carl A., "Effect of Settlement of Concrete on Results of Pull out Tests," Research Department Bulletin 41 , Research and Development Laboratories of the Portland Cement Association, November 1952, 49 pp.
8.
9.
"PSI Super, Superplasticizing High-Range Water-Reducer," Gifford-Hill and Company, Inc., Chemical Division, Charlotte, North Carolina, 1983, 2 pp.
Zekany, A.J., Neumann, s., Jirsa, J.O. and Breen, J.E., "The Influence of Shear on Lapped Splices in Reinforced Concrete," Research Report No. 242-2, Center for Transportation Research, Bureau of Eng1neenng Research, The University of Texas at Austin, July 1981, 88 pp.
I {, \
i J !
! J
I I I l i
i ! I I I
I I
I l

Table l Concrete Mix Designs and Properties (Cubic Yard Batch Weights)
A2~re9ate Base or Re2ular Concrete
Mix w/c Cement Water Fine+ Coarse * Temp Age at Test Slump Air Strength Design ~ * -*- # # OF Days ...!!!!.... 'f, psi
l
2
3
D.55 SDO 275 1555 1579 84
0.55 545 300 1453 1579 78
0.55 510 280 1534 1579 53
+Kansas River Sand- lawrence Sand Company, lawrence, KS Bulk Specific Gravity= 2.62, Absorption • D.S'!. Fineness Modulus= 3.D to 3.17
* Crushed limestone - Hamms Quarry, Perry, KS Bulk Specific Gravity • 2.52, Absorption • 3.5'1. Maximum Size • 3/4 Inch
Design Air Content • 2'1.
Slump and Air Values are as Measured
n Not measured
5 l-3/4 2-3/4 4280
22 9 l 4000
11 3-3/4 l-1/2 4470
Superplast1clzed Concrete
SP-HRWR Slump Air Strength oz. ln. 'f, ~psi
96 6 - 9 n 4760
72 9 1-1/2 4830
,_. "'

17
Table 2 Average Test Bar Data
Bar Size
Deformation Spacing, in.
Deformation Height, in.
Deformation Angle, deg.
Deformation Gap, in.
Nominal Weight, lb/ft
Deformation
Bearing Area, sq. in./in. length
Yield Strength, ksi
Tensile Strength, ksi
Deformation Pattern--Sheffield
#8
0.545
0.057
50
0.313
2.650
0.239
63.47
104.6

18
* Data not taken full 2 hours.
** R = Regular SP = Superplasticized

19
Table 4 Test Specimen Variables and Bond Strength
Bar Size #8 1tal B1ee Embedment Length 10 in.
grams Cover 2 in.
es 120 Specimen Specimen Bar Concrete Concrete Slump Consol. Norm. Cone. Mfx No. Size* Position+ Below Bar Strength in. ** Bond Bond Design No.
in. psi Strength Strength ++ * k/1n k/in
* lA s B 2 42BO 1-3/4 v 4.46 4.31 1 - R 18 s T 8 4.26 4.12 1C M T 15 3.52 3.40
* 10 D B 2 4.74 4.58 10 D T 36 3.76 3.64
* 1E s B 2 4760 9 v 4.44 4.07 1 - SP 1F s T 8 9 4.65 4.26 1G M T 15 9 4.03 3.70
* HI D B 2 8 4.41 4.04 1H D T 36 6 2.97 2.72
* 1I s B 2 4760 9 N 3.12 2.86 1 - SP lJ s T 8 9 3.78 3.47 lK M T 15 8 4.44 4.07 lL D 8 2 8 3.48 3.19 ll D T 36 6 2.98 2.73
2A s 8 2 4000 9 N 4.31 4.31 2 - R 28 s T 8 2.99 2.99 2C M T 15 2.68 2.68 20 D 8 2 4.45 4.45 20 D T 36 1.56 1.56
2E s B 2 4000 9 v 4.57 4.57 2 - R 2F s T 8 3.33 3.33 2G M T 15 3.24 3.24 2H D 8 2 4.71 4.71 2!1 D T 36 2.76 2.76 3A s 8 2 4470 3-3/4 v 4.09 3.87 3 - R 38 s T 8 2.81 2.66 3C M T 15 3.98 3.77 30 0 8 2 4.60 4.35
36. 30 0 T 36 2.35 2.22 3E s 8 2 4830 9 v 3.81 3.47 3 - SP
74.1 3F s T 8 3.22 2.93 3G M T 15 2.57 2.34 3H D 8 2 3.76 3.42
40.4 3H D T 36 2.33 2.12 3! s 8 2 4830 9 N 3.51 3.19 3 - SP 3J s T 8 2.82 2.57 3K M T 15 1.84 1.67 3L D 8 2 3.47 3.16 3L D T 36 1 .38 1.26
: S • Shallow Specimen, M • Medium Specimen, D • Deep Specimen B • Bottom-Cast, T • Top-Cast ·
** V • Vibrated, N • Non-Vibrated ++ R • Regular, SP = Superplasticized

20
1---24"'----1
------------- ----~8 Test Bar
T 39"
36"
1:::: :::::::::::::::·:::.::. ..L-L...........J0 111 ° I± II 0 ~ Itl DeeD MedliJll Shallow
Fig. 1 Test Specimens
41<,•-t-
~9·--v Fig. 2 Test Specimen Details
21
40" 10"-
~-4~110" 2~ 2~1 JIL ---- --.r------- _ ..... __
\.rest Bar f Bonded Leng1 O~steel PlYWOOd../
Bond Breaker Conduit ~3~· 41;," Bar
Form Side SUilport
24" Fig. 3 Test Bar Installation
75
9' REG CONC DV Deep V!b sv sn V!b ON Deep NonVib
(I) 50 e SN sn NonV!b SN 10
~ c.. 01 sv -o DN ., .,
25 DV
..... CD
0~------------------------------~ 0 30 so 90 120
Time, minutes
Fig. 4 Typical Bleed Test Curves

~ r-
f-
f-
f-
~ 0
~ in Mach e Tie-Down
.n.
c:j{
n 1
II ~ ~~~~
l! 1)
lf
22
.--F= ~
Wedge Grip~ = ~ Test Bar- ~
, l F= bP (HYdraulic Rom ~ Yokes
lrBeartng Pad
(sPTest ecimen
--------------------------
Loaded End LVDT's
0
0
n
~ c::!
=
u nloa~ nd Lli
~~ E
IrS T peclnli te-o&§
':t:
~1~ II - ---- - ---· _-;.l-c::J (~\ II --------------
;-y
-u Jr Spec 1 mer;
Pedestal; }
Machine j.
Pedestals - r
!I I· :111 ::I!
"-Laboratory Floor if .!,t
Fig. 5 Schematic of Bond Test l'
Spec! Tie-D
Spec! Pedest
23
50 ~---------------------08
40
"' 30 0. .... :.1;
-o 20 co 0 ...1
10
0
0.000 0.010 0.020 0.030
Loaded End 51 ip, in
1-3/4' REG CONC DB Deep Bot sa sn Bot ST Sh Top MT Med Tap OT Oeep Top
0.040
Fig. 6 Typical Load versus Loaded End Slip Curves
50
40
"' 30 0. .... ~
-o 20 co 0
...1
10
0
0.000 0.002
ST
~--MT
0.004 0.006
1-3/4' REG CONC OS Deep Bot SB Sn Bot ST Sh Top MT Med Top OT Deep Top
0.008
Unloaded End Slip, in
Fig. 7 Typical Load versus Unloaded End Slip Curves
0.050
0.010

24
Fig. 8 Test Specimens After Pullout
5.0
+ ~ c \S + ~ A .... 4.0 ....... Ill v .,., 9 0 v ~ v ~
Ql A ..... 3.0 Ill Cl) A c A QJ A 0 v 0 ~ '-..... v Cll 2.0 0 0 "0 c 0 0 v
CD
e 1.0 0
<.. 0 z
0.0 1-3/4" 3-3/4" 9" Reg 9" Reg 9" SP 9" SP
Reg Reg Vib NonVib Vib NonVib
Fig. 9 Comparison of Normalized Bond Strengths for Different Types Concrete
5.0
c: 4.0 ..... ...... "" .c 3.0 ..... en c: Cl)
~ 2.0 (/)
'C c: 0 aJ 1.0
+ Deep Bot <l Sh Bot A Sh Top v Med Top a Deep Top
25
0.0~--~------~----------~------------J 1-3/4" Reg. 9" SP Vib 9" SP NonVib
Fig. 10 Comparison of Bond Strengths for 84°F Base and Superplasticized Concretes
c: ..... ...... "" .c ..... en c: Cl) L .... (/)
'C c: 0
aJ
e L 0 z
5.0
4.0
3.0
2.0
1.0
0.0
+ Deep Bot <l Sh Bot A Sh Top v Med Top a Deep Top
1-3/4" Reg. 9" SP Vib. 9" SP NonVib
Fig. 11 Comparison of Normalized Bond Strengths for 84°F Base and pes Superplasticized Concretes

c: ..... ' ~ .c .... 0> c: QJ c.. .... en "C c: 0 aJ
5.0
4.0
3.0
2.0
1.0
0.0
+ Deep Bot 1!1 Sh Bot A Sh Top v Med Top o Deep Top
3-3/4" Reg
26
9" SP Vib 9" SP NonVib
Fig. 12 Comparison of Bond Strengths for 53°F Base and Superplastici Concretes
c: ..... ' ~ .c .... 0> c: OJ c.. .... en "C c: 0 aJ
e c.. 0 z
5.0
4.0
3.0
2.0
1.0
0.0
+ Deep Bot C Sh Bot A Sh Top v Med Top o Deep Top
3-3/4" Reg 9" SP Vib 9" SP NonVib
Fig. 13 Comparison of Normalized Bond Strengths for 53°F Base and Superplasticized Concretes

27
5.0
c ..... 4.0 ....... .¥.
.c .... s.o "' c Q)
'-..... (/) 2.0 "0
- -+---- ...... - c_ -----a ---- -- m- ~
--- -- "'T' LO.l
=:t.-=:~!. ------:-=1=--=v=--- --. .. ._ .. --.... ' -
A --- (1) -------
'0/ ---0 ·-c 0
CD
e 1.0 '-0
!!! - - • + Oeep Bot --·" Sh Bot --A sn Top --v Med Top --(!) Oeep Top
:z
0.0~--------------------------------------lb 0 2 4 6 8 10
astici Slump, in
Ffg. 14 Normalized Bond Strength versus Slump
5.0
c: ..... 4.0 .......
""' .c ..... 3.0 "' c Q)
'-..... (/)
"0 2.0
c 0
CD -- -+ 1-3/4' REG
e 1.0 '-
--c 3-3/4' REG -·-A 9' REG
0 :z ---<> 9' SP
0.0~----------------------------------------0 10 20 so 40
tnd Concrete Below Bar, in
Fig. 15 Normalized Bond Strength versus Concrete Below Bar

140
120 ~
0 100 ..... .... ID a: eo --w -o 60 c: 0
tD 40
20
28
0 10 20
Concrete Below Bar, in
+ 1-3/~' REG C 9' SP Vlb A 9M SP NonVib v g• REG NonVib o 9' REG V!b
30
Fig. 16 Bond Efficiency Ratio versus Concrete Below Bar for Higher Temperature Concretes (7BO - 840F)
140
120 ~
0 100 .... .... ID a: eo --w
60 -o c: 0 tD
40
20
0
+ 3-3/~' REG c 9' SP V!b .. 9' SP NonV!b
10 20 30
Concrete Below Bar, in
Fig. 17 Bond Efficiency Ratio versus Concrete Below Bar for lower Temperature Concrete (53°Fl
4(
lb
-40
gher
-40
er
29
5.0
c: .... 4.0 ...... ....:
,C .... 3.0 01 c:
"' c.. .... en 2.0 "0 c + 1-3/4" REG 0 al 0 9" SP Vlb
e 1.0 A 9" SP NonV!b c.. v 9" REG NonV!b 0 9" REG Vib z 0
0.0~------------------------------------0 10 20 30 40
Concrete Below Bar. in
Fig. 18 Normalized Bond Strengths of Top-Cast Bars versus Concrete Below Bar for Higher Temperature Concretes (780 - 840F)
5.0
c .... ...... 4.0 ....:
,C .... 0> 3.0 c
"' c.. .... en "0 c 0 al
2.0
~ 1.0 0 z
+ 3-3/4" REG o 9" SP Vlb A 9" SP NonV!b
0.0~--------------------------------------0 10 20 30 40
Concrete Below Bar, in
Fig. 19 Normalized Bond Strengths of Top-Cast Bars versus Concrete Below Bars for Lower Temperature Concrete (53°F)
I I
I I I

c:: .... ...... ,:,(.
.c·
..... Cl c:: Q) c.. ..... (/)
"0 c:: 0
C!l
e c.. 0 z
30
5.0
4.0
3.0
2.0
1.0
0.0 ~----~----~~----~----~------4------J 9" Reg
Vib 9" Reg NonVib
9" SP Vib
9" SP NonVib
9" SP Vib
9" SP NonVib
Fig. 20 Comparison of Average Normalized Bond Strengths for Vibrate Non-vibrated High-Slump Concrete Mixes
5.0
c:: A .... 4.0 ...... Ill ,:,(.
v ~ ljl A ..... 3.0 Ill + Cl A c:: 8 Q)
A c.. ..... v (/) 2.0 0
"0 c:: v 0 C!l + Deep Bot
1.0 0 C Sh Bot
e A Sh Top c.. v Med Top 0 z o Deep Top
0.0
40 50. 60 70 80 s Temp of Fresh Concrete, F
Fig. 21 Normalized Bond Strength versus Temperature of Superplasti Concrete at Placement (Vibrated and Non-vibrated)

31
80
60
"' e "' t:l 'II <... Cl 40
A 0 1:1 t:l 0>
"' + liS - + 1-3/4,3-3/4' REG CD 20 + lil 9' SP V!b
~ A g• SP NonVib V g• REG NonVib o 9' REG V!b
0~--------------------------------~------40 50 60 70 eo 90
Temp., degree F
ate Fig. 22 90 Minute Bleed versus Temperature of Fresh Concrete
80
A
60
"' e "' c.. t:l Cl 40 <0 A
"' t:l "' .... + + 3-3/4' REG CD " 9' SP Vlb
20 + A 9' SP NonV!b
0~------------------------------~---------90 0 2 4 6 8 10
Slump, in.
tici Fig. 23 90 Minute Bleed versus Slump of Lower Temperature Concrete (53oF)

32
ao
+ 1-3/4' REG 60 0 9' SP Vib
A 9~ SP NonVib
Ul v g• REG NonVib E o 9' REG Vib <D v '-Cl 40 0 -d Cll
~ Cll ...... co
20 0
~ A
0
0 2 4 6 a Slump at finishing, in.
Fig. 24 90 Minute Bleed versus Slump of Higher Temperature Cone - 84°F)
ao
60 Ul E <D '-Cl 40 + "0 Cll QJ + ...... + co
20 +
0 ~------------------------------------------0 2 4 6 a 10
Slump, in.
Fig. 25 90 Minute Bleed versus Slump of Regular Concretes