Embed Size (px)
Citation preview
Sains Malaysiana 40(4)(2011): 359–367
Effect of Super Olein and Sunflower Oil on theRheological Properties of Chocolate Syrup
(Kesan Minyak Super Olein dan Bunga Matahari ke Atas Ciri Reologi Sirap Coklat)
NAZARUDDIN RAMLI* & FOO SHIH YING
ABSTRACT
This study was carried out to determine the effect of super olein (POo) and sunflower oil (SFO) on the rheological properties of chocolate syrup. The formulation of chocolate syrup was modified from that used in a preliminary study consisting of 49.1% water, 30% sugar, 15% cocoa powder, 5% vegetable fats (POo and SFO), 0.5% lecithin and 0.4% vanilla flavour. The rheology of chocolate syrup was measured at a shear rate of 0.01-60 s-1 using a rotational rheometer equipped with a parallel plate at 4°C and 25°C. The shear stress and shear rate data were entered into the Power Law model to determine the apparent viscosity, flow behaviour index (n) and consistency index (K) of the chocolate syrup. In this study, the apparent viscosity of the chocolate syrup was determined at a shear rate of 30 s-1. The apparent viscosity of POo chocolate syrup was the highest at 14.62 ± 1.97 Pa.s (4°C) and 3.91 ± 0.21 Pa.s (25°C), followed by SFO chocolate syrup, with apparent viscosities of 5.42 ± 0.40 Pa.s (4°C) and 1.203 ± 0.076 Pa.s (25°C). The apparent viscosity of Hershey’s chocolate syrup was the lowest, at 2.15 ± 0.070 Pa.s (4°C) and 0.6734 ± 0.027 Pa.s (25°C). All of the chocolate syrups exhibited shear-thinning behaviours with n<1 at 4°C and 25°C. The consistency index of chocolate syrup increased in the order of KHershey<KSFO<KPOo at 4°C and 25°C. For sensory evaluation, it was found that POo and SFO chocolate syrups were preferred by the panellists over Hershey’s syrup (p<0.05). There was no significant difference between the POo and SFO chocolate syrups with respect to panellists’ preferences. In conclusion, POo and SFO can be potentially utilised in the preparation of chocolate syrups.
Keywords: Chocolate syrup; rheology; sunflower oil; super olein; viscosity
ABSTRAK
Kajian ini dijalankan untuk menentukan kesan minyak super olein (POo) dan bunga matahari (SFO) ke atas ciri reologi sirap coklat. Formulasi sirap coklat adalah diubahsuai daripada kajian awal yang mengandungi 49.1% air, 30% gula, 15% serbuk koko, 5% lemak sayuran (POo dan SFO), 0.5% lesitin dan 0.4% perisa vanilla. Reologi sirap coklat diukur pada kadar ricihan 0.01-60 s-1 menggunakan reometer berputar yang dilengkapi dengan plat selari pada 4°C dan 25°C. Data tekanan ricihan dan kadar ricihan dimasukkan ke dalam model Hukum Kuasa untuk menentukan kelikatan ketara, indeks kelakuan aliran (n) dan indeks konsistensi (K) sirap coklat. Dalam kajian ini, kelikatan ketara bagi sirap coklat ditentukan pada kadar ricihan 30 s-1. Kelikatan ketara bagi sirap coklat POo adalah yang tertinggi, pada 14.62 ± 1.97 Pa.s (4°C) dan 3.91 ± 0.21 Pa.s (25°C), diikuti dengan sirap coklat SFO, dengan kelikatan ketara 5.42 ± 0.40 Pa.s (4°C) dan 1.203 ± 0.076 Pa.s (25°C). Kelikatan ketara bagi sirap coklat Hershey adalah yang terendah, pada 2.15 ± 0.070 Pa.s (4°C) dan 0.6734 ± 0.027 Pa.s (25°C). Kesemua sirap coklat mempunyai kelakuan ricihan penipisan n<1 pada 4°C dan 25°C. Indeks konsistensi bagi sirap coklat meningkat mengikut urutan KHershey<KSFO<KPOo pada 4°C dan 25°C. Bagi penilaian sensori, didapati sirap coklat POo dan SFO lebih disukai oleh ahli panel berbanding sirap Hershey (p<0.05). Tiada perbezaan ketara diantara sirap coklat POo dan SFO dengan kesukaan ahli panel. Kesimpulannya, POo dan SFO adalah berpotensi untuk digunakan di dalam penyediaan sirap coklat.
Kata kunci: Kelikatan; minyak bunga matahari; reologi; sirap coklat; super olein
INTRODUCTION
Chocolate syrup is a confectionery commonly used as a topping for ice creams and cakes and a beverage flavouring agent. Chocolate syrup is free-flowing under ambient and refrigeration temperatures. Commercial chocolate syrups usually contain only a small amount of cocoa powder (approximately 5%) to produce a low-viscosity product (Hohenthal et al. 1998). However, the low concentration
of cocoa powder reduces the desired chocolate flavour of the product. The addition of cocoa liquor tends to increase the viscosity of chocolate syrup due to its high concentration. Therefore, to reduce the viscosity and to maintain the chocolate flavour of chocolate syrup, super olein and sunflower oil were added. Super olein is a double-fractionated palm olein with an iodine value between 60 and 67. It contains a high content

360
of oleic (C18:1), palmitic (C16:0) and linoleic (C18:2) acids (Siew 2000). Super olein is unable to withstand cold temperatures and becomes cloudy and crystallises when the temperature is lower than its melting point. Sunflower oil, with an iodine value between 110 and 143, contains a high level of polyunsaturated fatty acids, especially linoleic and linolenic (C18:3) acids (Nwokolo 1996). The objective of this study was to determine the effects of added superolein (POo) and sunflower oil (SFO) on rheological properties of chocolate syrup including apparent viscosity, flow behaviour index (n), consistency index (K) and sensory evaluation.
MATERIALS AND METHODS
MATERIALS
Super olein (Seri Murni), sunflower oil (SunLico), sugar (Malayan Sugar MFG Co. Bhd.) and vanilla flavour (Star Brand) were obtained from Hentian Kajang. Low-fat cocoa powder was obtained from KL-Kepong Cocoa Products Sdn. Bhd. Soy lecithin (Flavonoma) was obtained from Damah Trading Sdn. Bhd. Hershey’s chocolate syrup was obtained from Giant, Sungai Wang.
PREPARATION OF SAMPLES
The formulation of chocolate syrup was modified from that of Hohenthal et al. (1998), which consisted of 49.1% water, 30% sugar, 15% cocoa powder, 5% oil (super olein or sunflower oil), 0.5% lecithin and 0.4% vanilla flavour. The chocolate syrup was homogenised after cooking.
RHEOLOGICAL MEASUREMENT OF OILS
The viscosity of oils was measured using a rotational rheometer equipped with a cone plate (25 mm diameter). The shear stress was measured at 4°C and 25°C at shear rates of 0 to 500 s-1 over 120 s (ramp up) followed by decreasing shear rates from 500 to 0 s-1 (ramp down) (Huang & Sathivel 2008). Fifty measurement cycles were taken in each ramp.
RHEOLOGICAL MEASUREMENT OF CHOCOLATE SYRUPS
The rheological properties of chocolate syrups were measured using an Anton Paar (Physica MCR 301) rotational rheometer equipped with a parallel plate (25 mm diameter). The shear stress was measured at 4°C and 25°C, at increasing shear rates from 0.01 to 60 s-1 over 120 s (ramp up), followed by decreasing shear rates from 60 to 0.01 s-1 (ramp down). Fifty measurement cycles were taken in each ramp (Sokmen & Gunes 2006). The obtained data were entered into Power Law, Casson and Herschel-Bulkley models. The best fit model was selected by determining the coefficient of determination (R2) of each model.
COLOUR
The colour measurements of oils and chocolate syrups were made using a tristimulus colorimeter (Minolta Chroma Meter Model Cr-300). The colour system used in the study was the Judd-Hunter L a b solid system, where L = lightness/darkness, +a = redness, -a = greenness, +b = yellowness and –b = blueness (Ekthamasut & Akesowan 2001).
IODINE AND PEROXIDE VALUE
The iodine values of oils were determined using the PORIM method (1995). The peroxide values of oils were determined using the AOAC method (1990).
DIFFERENTIAL SCANNING CALORIMETRY
The melting points of oils and chocolate syrups were determined using a differential scanning calorimeter (STARe SW 9.01). Nitrogen (99.99% purity) was used as the purge gas, which flowed at 40 mL/min under a pressure of 50 psi. Samples (3-5 mg) were heated from -60°C to 60°C at a rate of 20 min/°C.
PARTICLE SIZE ANALYSIS
The particle size of chocolate syrups was analysed using a Particle Size Analyzer (Mastersizer 2000 Version 5.40, Malvern Instruments Ltd., Malvern, England) equipped with a Hydro 2000 MU dispersion unit (A). A few drops of sample were dispersed in a beaker filled with 600-1000 mL of distilled water. The samples were stirred for 2 min until the obscuration achieved 0.2 through the use of ultrasonication.
WATER ACTIVITY
The water activities of chocolate syrups were measured using a Labmeter Water Activity system (Novasina FSFE, Malaysia) at 25°C every 2 weeks.
PROXIMATE ANALYSIS
The fat, protein, moisture and ash contents of chocolate syrups were determined using the AOAC method (1990). The carbohydrate content was obtained by subtracting the percentages of protein, fat, moisture and ash from 100% (Nielsen 2003).
SENSORY EVALUATION
A seven-point hedonic scale test was conducted to evaluate the sensory attributes of the chocolate syrups; this test involved 30 panellists.
STATISTICAL ANALYSIS
All the rheological property data were analysed using SAS V6.12. ANOVA was conducted at a 5% significance level.

361
RESULTS AND DISCUSSION
VISCOSITY OF OILS
Figure 1 shows the viscosities of POo and SFO determined at a shear rate of 500 s-1 at 4°C and 25°C. The viscosity of POo at 4°C was significantly different from the viscosity at 25°C (p<0.05). POo is a liquid at 25°C, but it tends to crystallise if the temperature is lower than its melting point. According to the DSC data, POo melted completely at around 10.07°C, which is higher than 4°C. The viscosities of the oils at 25°C were lower than the viscosities at 4°C (p<0.05). Temperature has an obvious influence on the viscosity of oils that is even more significant than the application of the shear rate. An increase in temperature increases the kinetic movement of molecules and thus breaks the intermolecular forces (Wan Nik et al. 2005). The viscosity of POo was higher than that of SFO at both 4°C and 25°C (p<0.05). This result is due to the chemical forces of the fatty acid hydrocarbon chains. POo has a high content of saturated fatty acids, especially palmitic acids. The single bonds of palmitic acids form a ‘zig-zag’ arrangement that enhances intermolecular forces such as Van der Waals interactions and thus increases the viscosity of POo. SFO is rich in polyunsaturated fatty acids, such as linoleic and linolenic acids, which contain
double bonds. These cis-configuration double bonds tend to form kinks within the geometry of fatty acid molecules and prevent intermolecular interactions (Abramovic & Klofutar 1998). Thus, the presence of cis double bonds can lower the viscosity of SFO. Abramovic and Klofutar (1998) reported the correlation between the iodine value and the viscosity of different oils. They found that the viscosity of oils decreased when the iodine value increased.
APPARENT VISCOSITY OF CHOCOLATE SYRUPSRHEOLOGICAL MODEL
Table 1 shows the coefficients of determination (R2) of POo, SFO and Hershey’s chocolate syrups for the Power Law, Casson and Herschel-Bulkley models at 4°C and 25°C. The Herschel-Bulkley model exhibited the highest and most consistent values of R2 at both 4°C and 25°C. However, this model failed to produce the yield stress of some samples studied. A preliminary study showed that the Power Law model is suitable to describe the rheological properties of chocolate syrup because the evidence confirmed that chocolate syrups should not be described as a fluids that require a yield stress to initiate the flow (Wichchukit 2004). Therefore, the Power Law model was chosen as the best fit model for the rheological measurements of chocolate syrup.
TABLE 1. Coefficients of determination (R2) of POo, SFO and Hershey’s chocolate syrups applied to the Power Law, Casson and Herschel-Bulkley models at 4°C and 25°C
Model temperature (ºC) R²POo SFO Hershey
Power Law 425
0.9302 ± 0.025b
0.9988 ± 0.00014a0.9032 ± 0.0014c
0.9823 ± 0.0071a0.9344 ± 0.018c
0.9588 ± 0.014abc
Casson 425
0.8015 ± 0.018d
0.8509 ± 0.0012c0.8614 ± 0.00071d
0.8527 ± 0.018d0.9241 ± 0.013c
0.9443 ± 0.019bc
Herschel-Bulkley 425
0.9770 ± 0.0021a
0.9720 ± 0.00007a0.9904 ± 0.0013a
0.9611 ± 0.00028b0.9900 ± 0.002a
0.9737 ± 0.0074ab
a-d Different letters indicate significant differences (p<0.05).
FIGURE 1. Viscosity of super olein (POo) and sunflower oil (SFO) determined at a shear rate of 30 s-1 at 4°C and 25°C. a-d Different letters indicate significant differences (p<0.05)
Oil
Vis
cosi
ty (P
a.s)

362
APPARENT VISCOSITY
Figure 2 shows the apparent viscosities of super olein (POo), sunflower oil (SFO) and Hershey’s chocolate syrups determined at a shear rate of 30 s-1 at 4°C and 25°C. There were significant differences between the apparent viscosities of POo, SFO and Hershey’s chocolate syrups at 4°C (p<0.05). The apparent viscosity of POo chocolate syrup was the highest, at 14.62 ± 1.97 Pa.s (4°C) and 3.91 ± 0.21 Pa.s (25°C), followed by SFO chocolate syrup, with apparent viscosities of 5.42 ± 0.40 Pa.s (4°C) and 1.203 ± 0.076 Pa.s (25°C). The apparent viscosity of Hershey’s chocolate syrup was the lowest, at 2.15 ± 0.070 Pa.s (4°C) and 0.6734 ± 0.027 Pa.s (25°C). The high apparent viscosity of POo chocolate syrup compared to SFO was due to the addition of POo. POo contains a high amount of saturated and monounsaturated triglycerides such as PPP, POP and POS (P = palmitic acid; O = oleic acid; S = stearic acid). POo tends to crystallise at temperatures lower than its cloud point, which is 2.8-5.7°C (Siew 2000). Therefore,
the addition of POo increased the apparent viscosity of the chocolate syrup. SFO is composed primarily of polyunsaturated triglycerides such as LLL and LnLnLn (L= linoleic acid; Ln= linolenic acid). Hence, the apparent viscosity of SFO chocolate syrup was lower than that of POo chocolate syrup. Although SFO has a higher cold stability, the apparent viscosity of SFO chocolate syrup at 4°C was higher than that at 25°C. This result could be due to moisture lost during refrigeration, as chocolate syrup is a water-based fluid (Wichchukit 2004). The apparent viscosity of Hershey’s chocolate syrup was the lowest, probably due to the presence of high-fructose corn syrup, which may reduce the crystallisation of the chocolate syrup (Nabors 2001).
FLOW BEHAVIOUR INDEX
Figure 3 shows the flow behaviour index of super olein (POo), sunflower oil (SFO) and Hershey’s chocolate syrups at 4°C and 25°C. All chocolate syrups showed shear-
FIGURE 2. Apparent viscosities of super olein (POo), sunflower oil (SFO) and Hershey’s chocolate syrups determined at a shear rate of 30 s-1 at 4°C and 25°C.
a-d Different letters indicate significant differences (p<0.05)
Chocolate Syrup
App
aren
t Vis
cosi
ty (P
a.s)
FIGURE 3. Flow behaviour index values of super olein (POo), sunflower oil (SFO) and Hershey’s chocolate syrups at 4°C and 25°C a-c Different letter indicate significant differences (p<0.05)
Chocolate Syrup
Flow
Beh
avio
r Ind
ex (n
)

363
thinning behaviours with flow behaviour index values (n) less than 1. There were no significant differences among flow behaviour index values of the chocolate syrups at 4°C. The flow behaviour index value of POo chocolate syrup at 25°C was higher than that of the other syrups (p<0.05). Thus, POo chocolate syrup had a lower tendency to become shear thinned at 25°C.
CONSISTENCY INDEX
Figure 4 shows the consistency index values of super olein (POo), sunflower oil (SFO) and Hershey’s chocolate syrups at 4°C and 25°C. The consistency index value of POo chocolate syrup was the highest, followed by SFO and Hershey’s chocolate syrup at 4°C (p<0.05). There was no significant difference between consistency index values of SFO (25°C) and Hershey’s (4°C and 25°C) chocolate syrups. Hershey’s chocolate syrup tolerated temperature changes better than the others.
DIFFERENTIAL SCANNING CALORIMETRY (DSC) OILS
Table 2 shows the enthalpy and melting points (onset, peak, end) of POo and SFO. The melting thermograms of POo and SFO yielded more than 1 endothermic peak due to their polymorphic behaviours or the melting of different triglycerides (TAG) in the oils at different temperatures (Abdul Karim & Ghazali 2007). Polymorphic behaviours indicate the existence of more than one type of crystal structure. TAG can be categorised into four components:
trisaturated TAG (SSS), disaturated-monounsaturated TAG (SSU), monosaturated-diunsaturated TAG (SUU) and triunsaturated TAG (UUU) (Tan & Che Man 2000). The melting thermogram of POo showed a fusion peak at around -20°C and a sharp endothermic peak at 2.675 ± 0.25°C, with a shoulder peak at around 6°C. The existence of multiple peaks was due to the presence of two different components in the POo crystals. Olein (low melting component) is a liquid fraction extracted from palm oil that contains a high amount of unsaturated TAG, whereas stearin (high melting component) is a solid fraction that contains a high amount of saturated TAG (Calliauw et al. 2007). Olein melts at a lower temperature than stearin. α polymorphs are formed only when POo is cooled vigorously (Kloek et al. 2000). The α polymorphs started to melt at a temperature around -30°C and reached the fusion peak at -20°C. α polymorphs were not stable and tended to recrystallise to form β’ polymorphs at around -16°C. β’ polymorphs started to melt at -4.435 ± 0.11°C and reached the sharp endothermic peak at 2.675 ± 0.25°C. These polymorphs were unstable and recrystallised into a more stable form, β polymorphs, at approximately 6°C (Siew & Faridah 2000; Kloek et al. 2000). POo crystals melted completely at 10.07 ± 0.34°C. There were two endothermic peaks in the melting thermogram of SFO. A small endothermic peak was present at in the temperature range between -30°C and -60°C, followed by an exothermic peak in the temperature range between -29°C and -44°C. There was a sharp endothermic peak at -21.98 ± 0.23°C. SFO crystallised and formed α polymorphs
TABLE 2. Enthalpy and melting points (onset, peak, end) of super olein (POo) and sunflower oil (SFO)
Sample ∆H (J/g) Peak Melting Point (°C)Onset Peak End
POo 62.88 ± 4.37 -4.435 ± 0.11 2.675 ± 0.25 10.07 ± 0.34SFO 68.85 ± 8.78 -28.31 ± 0.49 -21.98 ± 0.23 -8.64 ± 0.68
FIGURE 4. Consistency index values of super olein (POo), sunflower oil (SFO) and Hershey’s chocolate syrups at 4°C and 25°Ca-c Different letters indicate significant differences (p<0.05)
Chocolate Syrup
Con
sist
ency
Inde
x (K
)
364
at low temperatures. These α polymorphs started to melt as the temperature increased until they produced an exothermic peak at approximately -36.5 ± 10.61°C. α polymorphs recrystallised into a more stable form, β’ or β polymorphs. These polymorphs started to melt at -28.31 ± 0.49°C and produced an endothermic peak at -21.98 ± 0.23°C. They melted completely at -8.64 ± 0.68°C.
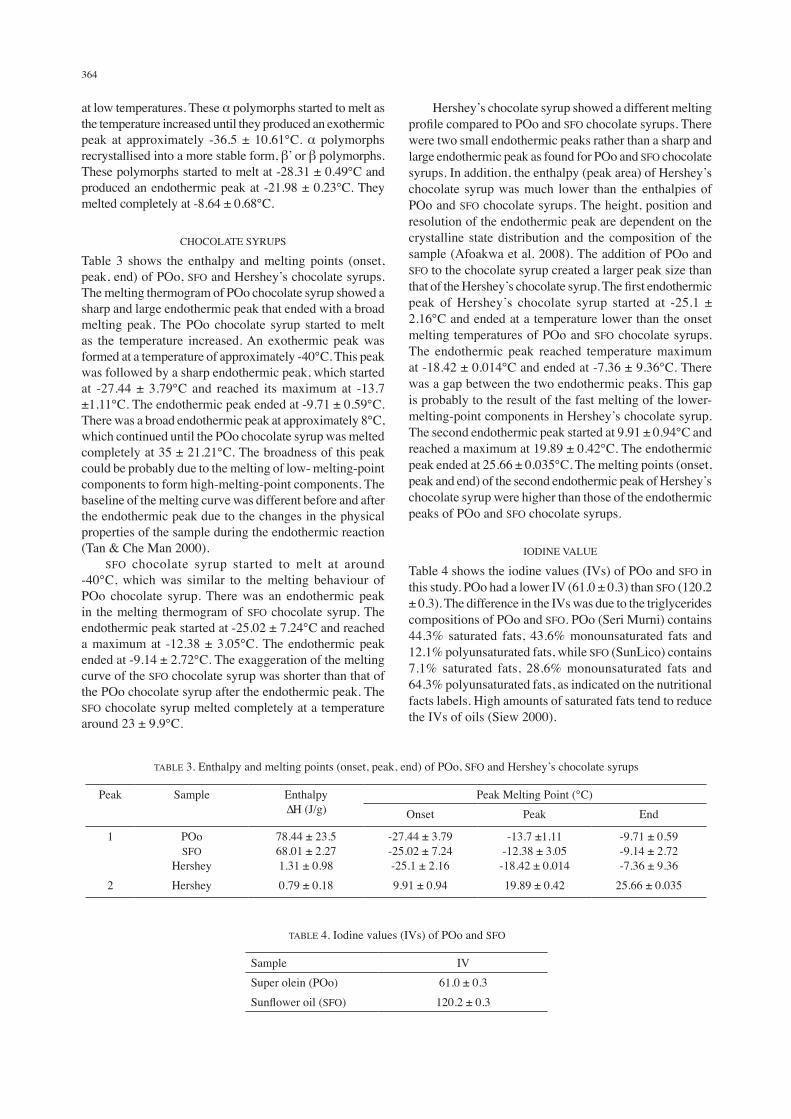
CHOCOLATE SYRUPS
Table 3 shows the enthalpy and melting points (onset, peak, end) of POo, SFO and Hershey’s chocolate syrups. The melting thermogram of POo chocolate syrup showed a sharp and large endothermic peak that ended with a broad melting peak. The POo chocolate syrup started to melt as the temperature increased. An exothermic peak was formed at a temperature of approximately -40°C. This peak was followed by a sharp endothermic peak, which started at -27.44 ± 3.79°C and reached its maximum at -13.7 ±1.11°C. The endothermic peak ended at -9.71 ± 0.59°C. There was a broad endothermic peak at approximately 8°C, which continued until the POo chocolate syrup was melted completely at 35 ± 21.21°C. The broadness of this peak could be probably due to the melting of low- melting-point components to form high-melting-point components. The baseline of the melting curve was different before and after the endothermic peak due to the changes in the physical properties of the sample during the endothermic reaction (Tan & Che Man 2000). SFO chocolate syrup started to melt at around -40°C, which was similar to the melting behaviour of POo chocolate syrup. There was an endothermic peak in the melting thermogram of SFO chocolate syrup. The endothermic peak started at -25.02 ± 7.24°C and reached a maximum at -12.38 ± 3.05°C. The endothermic peak ended at -9.14 ± 2.72°C. The exaggeration of the melting curve of the SFO chocolate syrup was shorter than that of the POo chocolate syrup after the endothermic peak. The SFO chocolate syrup melted completely at a temperature around 23 ± 9.9°C.
Hershey’s chocolate syrup showed a different melting profile compared to POo and SFO chocolate syrups. There were two small endothermic peaks rather than a sharp and large endothermic peak as found for POo and SFO chocolate syrups. In addition, the enthalpy (peak area) of Hershey’s chocolate syrup was much lower than the enthalpies of POo and SFO chocolate syrups. The height, position and resolution of the endothermic peak are dependent on the crystalline state distribution and the composition of the sample (Afoakwa et al. 2008). The addition of POo and SFO to the chocolate syrup created a larger peak size than that of the Hershey’s chocolate syrup. The first endothermic peak of Hershey’s chocolate syrup started at -25.1 ± 2.16°C and ended at a temperature lower than the onset melting temperatures of POo and SFO chocolate syrups. The endothermic peak reached temperature maximum at -18.42 ± 0.014°C and ended at -7.36 ± 9.36°C. There was a gap between the two endothermic peaks. This gap is probably to the result of the fast melting of the lower-melting-point components in Hershey’s chocolate syrup. The second endothermic peak started at 9.91 ± 0.94°C and reached a maximum at 19.89 ± 0.42°C. The endothermic peak ended at 25.66 ± 0.035°C. The melting points (onset, peak and end) of the second endothermic peak of Hershey’s chocolate syrup were higher than those of the endothermic peaks of POo and SFO chocolate syrups.
IODINE VALUE
Table 4 shows the iodine values (IVs) of POo and SFO in this study. POo had a lower IV (61.0 ± 0.3) than SFO (120.2 ± 0.3). The difference in the IVs was due to the triglycerides compositions of POo and SFO. POo (Seri Murni) contains 44.3% saturated fats, 43.6% monounsaturated fats and 12.1% polyunsaturated fats, while SFO (SunLico) contains 7.1% saturated fats, 28.6% monounsaturated fats and 64.3% polyunsaturated fats, as indicated on the nutritional facts labels. High amounts of saturated fats tend to reduce the IVs of oils (Siew 2000).
TABLE 3. Enthalpy and melting points (onset, peak, end) of POo, SFO and Hershey’s chocolate syrups
Peak Sample Enthalpy ∆H (J/g)
Peak Melting Point (°C)Onset Peak End
1 POoSFO
Hershey
78.44 ± 23.568.01 ± 2.271.31 ± 0.98
-27.44 ± 3.79-25.02 ± 7.24-25.1 ± 2.16
-13.7 ±1.11-12.38 ± 3.05-18.42 ± 0.014
-9.71 ± 0.59-9.14 ± 2.72-7.36 ± 9.36
2 Hershey 0.79 ± 0.18 9.91 ± 0.94 19.89 ± 0.42 25.66 ± 0.035
TABLE 4. Iodine values (IVs) of POo and SFO
Sample IVSuper olein (POo) 61.0 ± 0.3Sunflower oil (SFO) 120.2 ± 0.3

365
PEROXIDE VALUE
Figure 5 shows the peroxide values (PVs) of POo and SFO stored at 50°C for 2 weeks. The PV of POo was found to be higher than that of SFO on day 0; these values were 8 meq/kg and 4 meq/kg, respectively. The PV of POo increased over time at a greater rate than that of SFO over a period of one week. This result could be due to the different brands of oils used or the duration of storage, during which time the syrups is exposed to headspace oxygen (Smith et al. 2007).
WATER ACTIVITY
Figure 7 shows the water activities of POo, SFO and Hershey’s chocolate syrups measured continuously at 25°C. The ranges of water activities for POo, SFO and Hershey’s chocolate syrups from week 0 until week 10 were 0.898 ± 0.0040 to 0.904 ± 0.0015, 0.895 ± 0.0006
to 0.909 ± 0.0006 and 0.828 ± 0.0026 to 0.842 ± 0.0026, respectively. The water activity of the SFO chocolate syrup increased during storage, while the water activity of Hershey’s chocolate syrup decreased. The water activity of POo chocolate syrup was more stable than that of SFO chocolate syrup. Hershey’s chocolate syrup had a lower water activity due to the hygroscopic nature of high-fructose corn syrup, which can lower the water activity of chocolate syrup (Nabors 2001).
PARTICLE SIZE DISTRIBUTION
Figure 6 shows the particle size distributions (PSDs) of POo, SFO and Hershey’s chocolate syrups. The PSDs of both POo and SFO chocolate syrups ranged from 0.479 µm to 138.038 µm, whereas the PSD of Hershey’s chocolate syrup ranged from 0.479 µm to 239.883 µm. More than 90% of particles in the POo, SFO and Hershey’s chocolate syrups were less than 20.93 µm, 18.62 µm and 33.87 µm in size, respectively. Hershey’s chocolate syrup had the largest particle size.
COLOUR OILS
Figure 8 shows the colour of POo and SFO. POo had a darker colour than SFO, with a lower L value; the L values were 41.83 ± 0.68 and 47.24 ± 0.78, respectively. POo had a higher degree of yellowness (+b; 20.19 ± 0.57) compared to SFO (10.84 ± 0.75). POo and SFO had different a values, which were 0.37 ± 0.18 (redness) and –1.2 ± 0.32 (greenness) respectively. The colour of oil is dependent on the combination and portion of colour pigments extracted from the plant. SFO contains a lower concentration of carotenoids than POo and thus has a lighter colour. Carotenoid pigments contribute to the orange reddish colour, while chlorophyll pigments exhibit yellow and greenish colours in plant oils.
FIGURE 8. Colour of POo and SFOa-f Different letters indicate significant differences (p<0.05)
L a
b va
lue
FIGURE 6. Particle size distribution of POo, SFO and Hershey’s chocolate syrups
Particle Size (um)
Volu
me
(%)
FIGURE 5. Peroxide values of POo and SFO stored at 50°C for 2 weeks
Day
Pero
xide
Val
ue (m
eq/k
g)
FIGURE 7. Water activities of POo, SFO and Hershey’s chocolate syrups measured continuously at 25°C
Week
Wat
er A
ctiv
ity (a
w)

366
PROXIMATE ANALYSIS
Figures 10, 11 and 12 show the nutritional compositions of POo, SFO and Hershey’s chocolate syrups. POo and SFO chocolate syrups had higher fat contents (10.9 ± 1.41% and 10.7 ± 0.91%, respectively) than Hershey’s chocolate syrup (1.4 ± 0.14%). Hershey’s chocolate syrup had a higher total carbohydrate content (60.8%) compared to the POo and SFO chocolate syrups. As indicated on the nutritional facts of Hershey’s chocolate syrup, 51.3% of the total carbohydrate is derived from the sugar content. The higher concentration of cocoa powder increased the fat, protein and ash contents of the POo and SFO chocolate syrups.
SENSORY RESULTS
Figure 13 shows the mean scores of the attributes determined via sensory evaluation. The results show that there was a significant difference between the POo and SFO chocolate syrups and Hershey’s chocolate syrup for all evaluated attributes (p<0.05). The POo and SFO chocolate syrups had a higher acceptance level than Hershey’s chocolate syrup among the panellists. This result could be due to the increased chocolate flavour of the POo and SFO chocolate syrups. There was no significant difference between the POo and SFO chocolate syrups. The apparent viscosity of the POo chocolate syrup was higher than that of the SFO chocolate syrup. POo and SFO oil blends can be used to improve the rheological properties of chocolate syrup.
ACKNOWLEDGMENTS
This work was supported by a Research University Grant from Universiti Kebangsaan Malaysia, UKM-OUP-NBT-08-27-134/2008.
CHOCOLATE SYRUPS
Figure 9 shows the colours of POo, SFO and Hershey’s chocolate syrups. All chocolate syrups showed +a (redness) and –b (blueness) values. Hershey’s chocolate syrup had a higher value of L than the other chocolate syrups (p<0.05). Therefore, Hershey’s chocolate syrup had a lighter colour than the POo and SFO chocolate syrups. the darker colours of the POo and SFO chocolate syrups were due to the high concentration of cocoa powder. There was no significant difference with respect to the degree of redness (+a) among these chocolate syrups. Hershey’s chocolate syrup had a lower degree of blueness (-b) compared to POo and SFO chocolate syrups.
FIGURE 9. Colour of POo, SFO and Hershey’s chocolate syrups
L a
b va
lue
FIGURE 12. Nutritional composition of Hershey’s chocolate syrup
Protein2%
Fat1%
Water35%
Carbohydrate61%
Ash0%
FIGURE 11. Nutritional composition of SFO chocolate syrup
Ash2%
Water37%
Protein5%Fat
11%
Carbohydrate45%
FIGURE 10. Nutritional composition of POo chocolate syrup
Protein5%
Ash2%
Water 37%
Fat11%
Carbohydrate45%

367
REFERENCES
Abdul Karim, S.M. & Ghazali, H.M. 2007. Comparison of melting behaviors of edible oils using conventional and hyper differential scanning calorimetric scan rates. ASEAN Food Journal 14(1): 25-35.
Abramovic, H. & Klofutar, C. 1998. The temperature dependence of dynamic viscosity for some vegetable oils. Acta Chim. Slov. 45(1): 69-77.
Afoakwa, E.O., Paterson, A., Fowler, M. & Vieira, J. 2008. Characterization of melting properties in dark chocolates from varying particle size distribution and composition using differential scanning calorimetry. Food Research International 41(7): 751-757.
AOAC. 1990. Official Methods of Analysis of the Association of Official Analytical Chemists. Ed. ke-15. Arlington: AOAC.
Calliauw, G., Gibon, V., Greyt, W.D., Plees, L., Foubert, I. & Dewettinck, K. 2007. Phase composition during palm olein fractionation and its effect on soft PMF and superolein quality. Journal of the American Oil Chemists’ Society 84(8): 885-891.
Ekthamasut, K. & Akesowan, A. 2001. Effect of vegetable oils on physical characteristics of edible Konjac films. AU Journal of Technology 5(2): 22-28.
Hohenthal, Thalia, A., Weinberg & Michelle.1998. High cocoa/ chocolate liquor syrups with improved flow properties. United States Patent. 5,773,056.
Huang, J.Q. & Sathivel, S. 2008. Thermal and rheological properties and the effects of temperature on the viscosity and oxidation rate of unpurified salmon oil. Journal of Food Engineering 89(2): 105-111.
Kloek, W., Walstra, P. & Vliet, T.V. 2000. Crystallization kinetics of fully hydrogenated palm oil in sunflower oil mixtures. Journal of the American Oil Chemists’ Society 77(4): 389-398.
Nabors, L.O. 2001. Alternatives Sweetener. 3rd Ed. New York: Marcel Dekker Inc.
Nielsen, S.S. 2003. Food Analysis. Ed. ke-3. New York: Kluwer Academic/Plenum Publishers.
Nwokolo, E. 1996. Sunflower (Helianthus annuus L.). Dlm. Food and Feed from Legumes and Oilseeds, Nwokolo, E. & Smartt, J. (ed.). London: Chapman & Hall.
PORIM. 1995. PORIM Test Methods: Methods of Test for Palm Oil and Palm Oil Products. Palm Oil Research Institute of Malaysia.
Siew, W.L. 2000. Characteristics of palm olein from Elaeis guineensis palm oil. MPOB Technology No. 23. Aug: 1-7.
Siew, W.L. & Faridah, M.J. 2000. Compositional and differential scanning calorimetry (DSC) studies of crystals of palm olein. Journal of Oil Palm Research 12(2): 1-13.
Smith, S.A., King, R.E. & Min, D.B. 2007. Oxidative and thermal stability of genetically modified high oleic sunflower oil. Food Chemistry 102(4): 1208-1213.
Sokmen, A. & Gunes, G. 2006. Influence of some bulk sweeteners on rheological properties of chocolate. Swiss Society of Food Science and Technology 39 (10): 1053-1058.
Tan, C.P. & Che Man, Y.B. 2000. Differential scanning calorimetric analysis of edible oils: Comparison of thermal properties and chemical composition. Journal of the American Oil Chemists’ Society 77(2): 143-155.
Wan Nik, W.B., Aini, F.N., Masjuki, H.H. & Eng Giap, S.G. 2005. Rheology of bio-edible oils according to several rheological models and its potential as hydraulic fluid. Industrial Crops and Products 22(2): 249-255.
Wichchukit, S. 2004. Rheological property studies of confectionery products using conventional viscometries and tomographic viscometry. PhD Thesis, University of California, Davis.
Nazaruddin Ramli* & Foo Shih YingSchool of Chemical Sciences and Food TechnologyFaculty of Science and TechnologyUniversiti Kebangsaan Malaysia43600 Bangi, SelangorMalaysia
*Corresponding author; email: [email protected]
Received: 9 December 2009Accepted: 21 October 2010
FIGURE 13. Mean scores of the attributes determined through sensory evaluation