Embed Size (px)
Citation preview

EFFECT OF STAND DENSITY AND STRUCTURE ON THE ABUNDANCE OF NORTHERN RED OAK
ADVANCE REPRODUCTION
Gary W. Miller USDA Forest Service
Timber and Watershed Laboratory P.O. Box 404
Parsons, WV 26287 USA
ABSTRACT
Regenerating northern red oak (Quercus rubra L.) on high-quality growing sites is a continuing problem in the central Appalachian region. Competing species usually exhibit faster height growth after regeneration harvests compared to oak reproduction. The probability of advance oak reproduction becoming codominant in the new stand is positively related to seedling size at the time of the regeneration harvest. Silvicultural techniques are needed that stimulate the growth of oak seedlings before overstory removal without stimulating the growth of competing species. In this study, reproduction data for commercial hardwood species were collected on permanent plots established in mature oak stands in the central Appalachian region. The objective was to quantifjl the effect of stand density and structure on the abundance of advance oak reproduction and that of competing species. Detrended correspondence analysis and canonical correspondence analysis were used to relate species composition to environmental variables. Results indicated that reductions in overstory density that created canopy gaps stimulated competing species, particularly sweet birch (Betula lenta L.), striped maple (Acer pensylvanicurn L.), American beech (Fagus grandifolia Ehrh.), and yellow-poplar (Liriodendron tulipifera L.), and diminished the abundance of northern red oak seedlings. Reductions in understory density that created no canopy gaps increased the abundance of advance oak seedlings, but had a similar effect on sugar maple (Acer saccharurn Marsh.). Additional field trials are needed to test specific shelterwood treatments and to determine their effect on the growth of northern red oak and its major competitors.
INTRODUCTION
Regenerating northern red oak (Quercus rubra L.) on high-quality growing sites is a continuing problem in the central Appalachian region. New stands that develop after regeneration harvests often contain fewer oaks than the preceding stand, and usually the proportion of oak in the new stand does not meet management objectives. The basic problem is that regeneration harvests are applied when the potential for regenerating oaks is relatively low. During the stand initiation stage that follows a regeneration harvest, several hardwood species that compete with oak on these sites exhibit faster height growth than northern red oak. Although small advance oak seedlings may be present before harvest and new seedlings and sprouts often develop aRer harvest, the
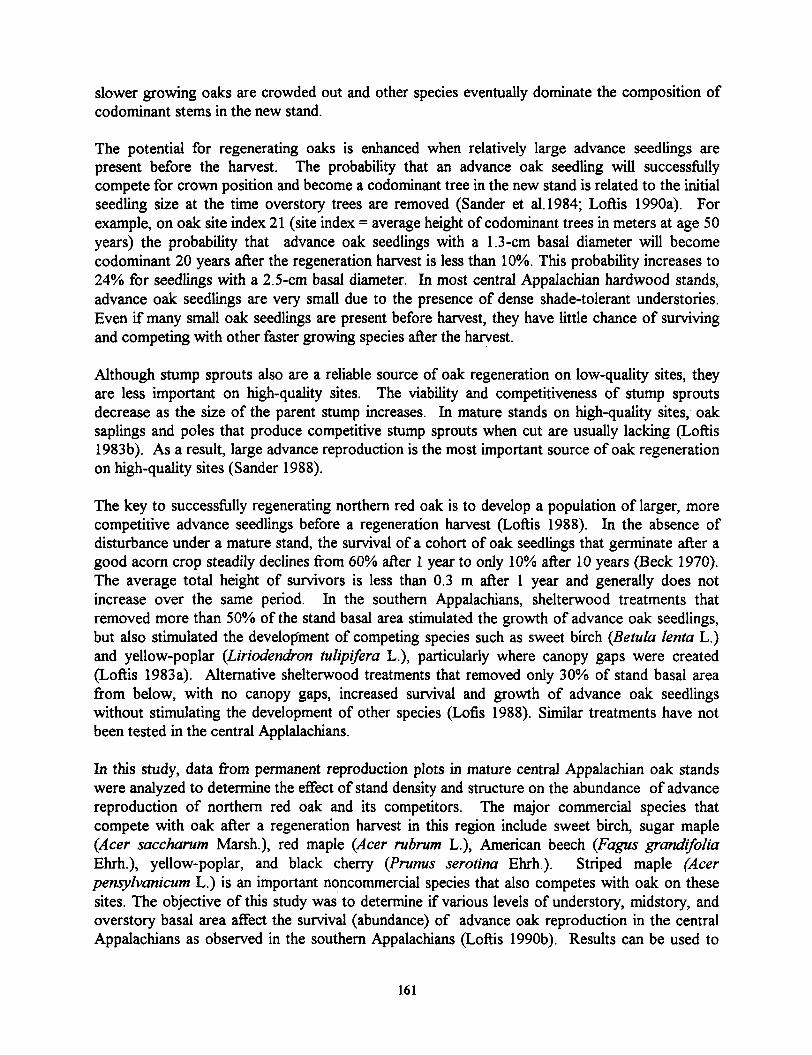
slower growing oaks are crowded out and other species eventually dominate the composition of codorninant stems in the new stand.
The potential for regenerating oaks is enhanced when relatively large advance seedlings are present before the harvest. The probability that an advance oak seedling will successfhlly compete for crown position and become a codorninant tree in the new stand is related to the initial seedling size at the time overstory trees are removed (Sander et al.1984; Loftis 1990a). For example, on oak site index 21 (site index = average height of codominant trees in meters at age 50 years) the probability that advance oak seedlings with a 1.3-cm basal diameter will become codominant 20 years after the regeneration harvest is less than 10%. This probability increases to 24% for seedlings with a 2.5-cm basal diameter. In most central Appalachian hardwood stands, advance oak seedlings are very small due to the presence of dense shade-tolerant understories. Even if many small oak seedlings are present before harvest, they have little chance of sunriving and competing with other faster growing species after the harvest.
Although stump sprouts also are a reliable source of oak regeneration on low-quality sites, they are less important on high-quality sites. The viability and competitiveness of stump sprouts decrease as the size of the parent stump increases. In mature stands on high-quality sites, oak saplings and poles that produce competitive stump sprouts when cut are usually lacking (Loftis 1983b). As a result, large advance reproduction is the most important source of oak regeneration on high-quality sites (Sander 1988).
The key to successfhlly regenerating northern red oak is to develop a population of larger, more competitive advance seedlings before a regeneration harvest (Loftis 1988). In the absence of disturbance under a mature stand, the survival of a cohort of oak seedlings that germinate after a good acorn crop steadily declines from 60% after 1 year to only 10% after 10 years p e c k 1970). The average total height of survivors is less than 0.3 m after 1 year and generally does not increase over the same period. In the southern Appalachians, shelterwood treatments that removed more than 50% of the stand basal area stimulated the growth of advance oak seedlings, but also stimulated the developinent of competing species such as sweet birch (Betula lenta L.) and yellow-poplar (Liriodendron tulipifera L.), particularly where canopy gaps were created (Loftis 1983a). Alternative shelterwood treatments that removed only 30% of stand basal area from below, with no canopy gaps, increased survival and growth of advance oak seedlings without stimulating the development of other species (Lofis 1988). Similar treatments have not been tested in the central Applalachians.
In this study, data from permanent reproduction plots in mature central Appalachian oak stands were analyzed to determine the effect of stand density and structure on the abundance of advance reproduction of northern red oak and its competitors. The major commercial species that compete with oak after a regeneration harvest in this region include sweet birch, sugar maple (Acer saccharum Marsh.), red maple (Acer rubrum L.), American beech (Fagus granwolia Ehrh.), yellow-poplar, and black cherry ( P m u s serotina Ehrh.). Striped maple (Acer pensylvanicum L.) is an important noncommercial species that also competes with oak on these sites. The objective of this study was' to determine if various levels of understory, midstory, and overstory basal area affect the survival (abundance) of advance oak reproduction in the central Appalachians as observed in the southern Appalachians (Loftis 1990b). Results can be used to
formulate shelterwood treatments that increase the potential for successfbl oak regeneration in central Appalachian stands before regeneration harvests.
STUDY AREAS
The Fernow Experimental Forest (39' 03' N, 79' 41' W) is located on the Monongahela National Forest in Tucker County, West Virginia. The ecological landtype encompassing all study sites was defined by the Monongahela National Forest and is located within M221B, the Allegheny Mountain Section of the Central Appalachian Broadleaf Forest (McNab and Avers 1994). The timber stands found on each site had originated as natural regeneration following heavy commercial logging operations from 1905 to 1910. The elevation ranges from 700 to 900 m, and the study plots are located on convex slopes where slope ranges from 5 to 30%. The soil series is described as a Calvin channery silt loam (loamy-skeletal, mixed, mesic Typic Dystrochrept) (USDA Soil Conservation Service 1967). These soils originated from acid shales and sandstones, average soil depth is about 1 m, and soil pH averages 4.5. The annual temperature averages g°C, annual precipitation averages 150 cm, and the frost-fiee season averages 145 days.
When reproduction data were collected, these sites were occupied by 80-year-old upland oak stands that were unmanaged or had received partial cutting treatments in the past 10 years. Site index ranged from 21 to 24 for northern red oak. Oaks were the most common species in the overstory and were found on a range of growing sites. Red maple was an important species on less productive sites, whereas more productive sites supported sugar maple, yellow-poplar, black cherry, and white ash (Fraxims americana L.).
METHODS
Reproduction data were obtained from permanent sample points located in mixed upland oak stands. Study sites were selecfed to include a range of understory and overstory stand density conditions where northern red oak reproduction is possible due to the presence of an adequate seed source. All study plots were located on growing sites that exceeded site index 21 for northern red oak, because it is well documented that the greatest difficulties in regenerating oak occur on the better growing sites (Sander 1988; Loftis 1990a). Reproduction data were collected 2 to 3 years after good acorn crops were observed in the study areas to allow sufficient time for oak seedlings to germinate and compete for several years before evaluating the effect of various stand density and growing site conditions.
At each sample point, a 0.0004-ha circular plot (1.1 m radius) was used to tally small reproduction, defined as woody stems less than 2.5 cm diameter breast height (dbh). Reproduction data from each plot consisted of stem counts for sweet birch, American beech, northern red oak, yellow-poplar, black cherry, sugar maple, striped maple, red maple, white ash, and miscellaneous others.

Also at each sample point, understory basal area (UBA), defined as all stems 2.5-12.6 cm dbh, and midstory basal area (MBA), defined as all stems 12.7-27.8 cm dbh, were measured within a 0.004-ha circular plot (3.6 m radius). Overstory basal area (OBA), defined as all stems 27.9 cm dbh and larger, surrounding each reproduction plot was measured using point-sampling and a 10- factor prism (Grosenbaugh 1952). Thus, stand density was measured in three distinct strata to account for differences in stand structure surrounding each reproduction plot.
Additional environmental variables recorded for each plot included elevation, aspect, position on the slope, and inclination of slope. In summary, the data for each sample plot included a reproduction tally by species, measures of stand density in three strata, and four additional environmental variables that provided information on the growing site.
Ordination of the relative abundance of species was performed by detrended correspondence analysis (DCA) (Hill 1979; Hill and Gauch 1980). Canonical correspondence analysis (CCA) was used to relate species composition to the measured environmental variables. CCA is a direct gradient analysis technique that is gaining popularity in community ecology research because it overcomes some of the problems that occur with indirect gradient analysis methods such as DCA (ter Braak 1986; Palmer 1993). DCA and CCA were camed out using PC-ORD (McCune and Mefford 1995), which utilizes a species matrix consisting of the relative abundance of each species on each plot, and an environmental variable matrix consisting of the standardized stand density and growing site variables for each plot.
RESULTS
Range of environmental conditions
Analyses were based on environmental data and species data from a total of 295 plots. Environmental data included four variables that reflect local conditions of the growing site and three variables that relate to stand density and structure surrounding each plot (Table 1). The average total basal area for all plots was 33.9 m2/ha. However, the range of conditions was quite
Table 1. Summary data on environmental variables for 295 plots
Minimum Maximum Mean
MBA (m2/ha) 0.0 11.5 4.9
OBA (m2/ha) 12.4 50.5 27.5
Elevation (m) 707 890 803
Aspect (azimuth) 45 3 15 180
Position on slopeb 1 .O 3.0 1.8
Inclination of slope ( O h ) 5.0 30.0 13.5
aUnderstory (UBA), midstory (MBA), and overstory (OBA) basal area. b~ositions included 1 = upper side slope, 2 = mid side slope, 3 = lower side slope.

variable, including some plots where understory and rnidstory basal area were zero, and overstory basal area exceeded 50.0 m2/ha. Elevation averaged 803 m and ranged from 707 to 890 m, aspect varied fiom northeast to northwest exposures, slope position varied from lower to upper side slopes, and inclination of slope varied fiom 5 to 30%.
Correspondence analysis
The indirect gradient analysis using DCA showed a clear separation among species along the first two axes (Fig. 1). Along the first axis (eigenvalue = 0.543), species were separated to some degree according to shade-tolerance as indicated by the distance between black cherry, a very shade-intolerant species, and American beech, a very shade-tolerant species. However, the location of yellow-poplar (shade-intolerant) and sugar maple (very shade-tolerant) between the two extreme points does not lend strong support to this interpretation. The first axis also may relate to elevation or slope position as indicated by the separation between black cherry and red maple (northern hardwoods) and yellow-poplar (a cove hardwood). Along the second axis (eigenvalue = 0.425), white ash and sweet birch, species that prefer more mesic sites, are distant
DCA Axis 2
0 100 200 300 400 DCA Axis 1
.
Figure 1. DCA ordination plot based on relative abundance of reproduction present in mature central Appalachian stands. Species are: Quercus rubra, Liriodendron tulipifera, Betula lenta, Acer pensylvanicurn, Acer sacchanun, Fagus grandifolia, Fraxinus americana, Acer rubrum.
Fra arne a Bet len .
Ace rub ~i~ Others
Pru ser- a
Ace sac Fag gra Ace pen •
a u e rub

from northern red oak, a species that is more competitive on drier sites. The second axis indicated a moisture gradient.
Results of the CCA are presented in the intra-set correlation matrix (Table 2) and a joint plot of weighted average species scores with respect to each environmental variable (Fig. 2). The correlation matrix indicates that elevation (r = 0.784) and overstory basal area (r = 0.679) are highly correlated with the first ordination axis, whereas aspect (r = 0.992) and midstory basal area (r = 0.697) are highly correlated with the second ordination axis. Understory basal area also is correlated with the second ordination axis, though the relationship (r = 0.446) is not as strong.
Table 2.--CCA axis eigenvalues and correlation matrix of environmental and stand density variables
Axis I Axis I1 Axis m
Eigenvalue 0.227 0.214 0.119
MBA -0.163 0.697 0.261
Elevation 0.784 0.270 -0.526
Aspect -0.158 -0.922 0.011
Position on slope 0.550 0.252 -0.071
Inclination of slope 0.503 0.03 1 0.827
aUnderstory P A ) , midstory (MBA), and overstory (OBA) basal area. b~orrelations are intra-set correlations of ter Braak (1986).
The orientation of points (i.e., weighted average species scores) and arrows on the CCA diagram provides information on the, nature and strength of relationships between species and environmental variables (Fig. 2) (ter Braak 1988). A point oriented in the same direction as an arrow indicates a direct relationship with that variable, and a point located in the opposite direction indicates an inverse relationship. Arrows indicate an axis for each environmental variable in the diagram, and the distance (projection) fiom a point to an arrow (or its negative extension) indicates the strength of the relationship between the species and the environmental variable in question. Points located close to an arrow indicate a strong relationship. In addition, arrow length and direction in the diagram represent a measure of the strength of correlation between each environmental variable and an ordination axis.
Several examples illustrate how to interpret information in the CCA diagram. Note that sugar maple and northern red oak species are near each other in the diagram, indicating that these two species were often observed on the same plots and that they generally have a similar relationship to the environmental variables. The relative abundance of northern red oak reproduction is related to higher levels of overstory basal area and lower levels of understory and midstory basal area. Conversely, the relative abundance of striped maple is related to higher levels of understory and midstory basal area and lower levels of overstory basal area.

Lir tul * Pru ser
Ace rub
Fra ame * I
Figure 2. CCA ordination plot showing species, environmental variables, and stand density variables. Environmental and stand density variable codes are: elev-elevation, asp-aspect, pos-position on slope, inc- inclination of slope, UBA-understory basal area, MBA-midstory basal area, OBA-overstory basal area. Axis I is horizontal, Axis I1 is vertical.
Species points located on or near the edge of the diagram are either rare in the data set and they occurred by chance at sites with more extreme environmental conditions or they are common in the data set and prefer relatively extreme environmental conditions compared to other species. For example, sweet birch is located at the lower edge of the diagram, correlated with northeastern aspects, relatively low levels of understory and midstory basal area, and moderate reductions in overstory basal area. Because sweet birch was found on 54 plots in the data set, its position in the CCA diagram indicates that it prefers environmental conditions that are extreme relative to other species.
Effect of stand density and structure
Although the CCA diagram can be used to illustrate general relationships between the patterns of species observed and the environmental variables, forest managers need more detailed information on the effects of stand conditions on reproduction to devise silvicultural treatments that meet certain objectives. Data fiom the reproduction plots were hrther analyzed to c l a m the relationship between stand density and the relative abundance of reproduction for each species.

The average basal area for overstory, midstory, and understory were computed for plots that had 0 to 40% relative abundance, in increments of lo%, for a each species (Table 3). Graphs were derived to illustrate the extent to which stand density corresponds to relative abundance of reproduction for oak and its major competitors (Fig. 3).
Table 3. Stand basal area associated with relative abundance of reproduction Relative abundance (%)
Species Stratum 0 XI >10 >20 >30 >40
Quercus rubra UBAa 1.8(162) 1.2(133) 1.3(91) 1.2(65) 0.8(48) 0.5(421b
5.0 3.7 3.6 3.3 2.4 1.8
25.1 26.8 27.4 27.1 27.5 27.5
Liriodendron UBA 2.1(200) 0.4(95) 0.4(77) 0.3(42) 0.3(34) 0.2(21) tulipifera
4.7 3.8 3.8 3.8 3.6 3.5
Betula lenta UBA .8(241) 0.4(54) 0.4(43) 0.3(29) 0.2(18) o(11)
4.9 2.2 1.9 1.5 1.3 0.2
26.7 23.9 24.2 24.0 26.6 23.3
Acer UBA 1.7(122) 1.4(173) 1.4(130) 1.6(91) 1.7(68) 1.9(43) pensylvanicum
4.1 4.7 4.6 5.1 5.3 5.6
Acer saccharurn UBA 1.5(237) 1.5(58) 2.1(31) 2.4(20) 2.7(12) 2.9(7)
4.4 4.3 4.3 4.5 4.4 4.7
26.0 27.1 27.1 26.7 27.5 27.6
Fagus grandifolia UBA 1.4(234) 2.1(51) 2.1(33) 3.8(26) 3.9(21) 4.6(15)
4.3 5.1 5.2 5.4 5.9 6.
26.7 22.9 23.0 18.6 18.2 18.
MBA, OBA are understory, midstory, and overstory basal area, respectively. b~umber of plots in parenthesis.

Although the focus of this analysis is on northern red oak reproduction, it is important tounderstand how changes in stand density and struCture affect competing species. For example, inthis data set the relative abundance of northern red oak reproduction increased as overstorydensity increased and as midstory and understory density decreased. Note that higher overstorybasal area also was associated with higher relative abundance of sugar maple reproduction, ashade-tolerant species that is a potential competitor of oak. At lower levels of overstory basalarea, averaging 25 m2/ha, oak reproduction was absent.
30 Quercus rubra Liriodendron tulipifera25 OBA 20 OBA
15
10
5 MBA===MBA ---
0 UBA UBA
30 Betula lenta Fagus grandifolia
- 25 ."'" ""co " OBA "..c "'"N- 20 "".E OBA';' 15
Q)'-co 10"iU' MBAII) 5 co ~- --UBAm --::: MBA 0 --UBA
30 Acer pensylvanicum Acer saccharum25 ...'."""'.'.."""'."..."".' OBA OBA
20
15
10MBA MBA
5 0 -UBA --UBA
0 10 20 30 40 0 10 20 30 40
Relative abundance (%)
Figure 3. Relative abundance of reproduction by species associated with understory, midstory, andoverstory basal area.
168
"""" ,.-
For species that are more shade-intolerant than sugar maple, key changes in abundance of reproduction occurred between 21 and 26 m2/ha of overstory basal area, the range in which canopy gaps occurred in the study areas. The abundance of yellow-poplar, sweet birch, American beech, and striped maple reproduction, important competitors of northern red oak, increased as overstory density decreased below this range (Table 3). However, on plots where these species were absent, average overstory basal area exceeded 27 m2/ha, approximately the same average overstory density for plots where oaks were present. Thus, higher overstory densities (above 27 m2/ha) tend to favor oak and sugar maple over other species.
DISCUSSION
This preliminary analysis was intended to reveal trends in the effect of stand density and structure on the relative abundance of northern red oak advance reproduction and its major competitors in the central Appalachians. The species data matrix included counts of stems present on each plot, but did not reflect the relative dominance of the stems present, as might be expressed by the height or basal diameter of individual stems. The results, therefore, shed light on the relationship between stand conditions and the potential survival of advance oak reproduction, but not necessarily the subsequent development of individual oak stems in competition with other species.
Certain levels of stand density and structure that increase seedling survival also might increase seedling growth. In this study, the abundance of advance oak reproduction was found to increase as understory and midstory basal area were reduced under a closed canopy. This relationship is consistent with results from similar experimental shelterwood treatments in the southern Appalachians. Loftis (1990b) observed that such shelterwood treatments resulted in both higher survival rates and faster basal diameter growth of advance oak reproduction. The results of this study suggest that such treatments may also be successful in the central Appalachians.
Loftis (1990a) also observed that the probability of advance oak reproduction becoming codominant in the new stand is-positively related to seedling size at the time of the regeneration harvest. Several researchers (Beck 1970; Clark and Watt 1971; Sander 1988; Loftis 1990b) have concluded that successful shelterwood techniques for regenerating northern red oak must stimulate the growth of advance oak seedlings before overstory removal without stimulating the growth of competing species. In this study, increased abundance of yellow-poplar, sweet birch, American beech, and striped maple was related to reduced levels of overstory basal area in which canopy gaps were created. Moreover, oak seedlings were absent at such overstory densities. These results indicate that shelterwood treatments designed to promote advance oak reproduction before regeneration harvests should reduce overstory density by minimal amounts or not at all (Schuler and Miller 1995).
Trends apparent from this study can be used to design experimental shelterwood treatments that might enhance the survival and development of advance northern red oak reproduction, without promoting severe competition from other species, in the central Appalachians. Though various shelterwood treatments must be tested to measure their effect on patterns of regeneration and growth of individual species, stand density and structure variables alone may not provide

sufficient information. Light, moisture, and soil nutrient status also must be included in the matrix of environmental variables in fbture experiments.
The results of this study also have important implications for forest managers who are considering thinning treatments in intermediate oak stands nearing maturity, perhaps in the last 10 to 15 years of the rotation. Thinning treatments that result in reduced overstory basal area in years before a planned regeneration harvest may reduce the probability of successfbl oak regeneration. Canopy gaps tend to promote the development of species that compete with oak seedlings before and after the regeneration harvest. If oak regeneration is a management objective, silvicultural treatments in the latter years of the rotation should be designed to develop larger, more competitive advance oak seedlings while limiting the development of competing species. Such treatments would consist of reductions in understory and midstory basal area, while maintaining a closed canopy. Other treatments may delay the start of a new rotation, thus increasing regeneration costs, or worse, the opportunity to maintain an aak component in the new stand may be lost altogether.
REFERENCES
Beck, D.E. 1970. Effect of competition on survival and height growth of red oak seedlings. Res. Pap. SE-56. Asheville, NC. U.S. Department of Agriculture, Forest Service, Southeastern Forest Experiment Station. 7 p.
Clark, F.B.; Watt, R.F. 1971. Silvicultural methods for regenerating oaks. In: Proceedings of the Oak Symposium, 16-20 August 1971, Morgantown, WV. Upper Darby, PA: U.S. Department of Agriculture, Forest Service, Northeastern Forest Experiment Station. 37- 43.
Grosenbaugh, L.R. 1952. Plotless timber estimates ... new, fast, easy. Journal of Forestry. 50:32- 37.
Hill, M.O. 1979. DECORANA: a FORTRAN program for detrended correspondence analysis and reciprocal averaging. Ithaca, NY: Ecology and Systematics, Cornell University.
Hill, M.O.; Gauch, H.G. 1980. Detrended correspondence analysis: an improved ordination technique. Vegetatio 42:47-58.
Loftis, D.L. 1983a. Regenerating southern Appalchian mixed hardwoods with the shelterwood method. Southern Journal of Applied Forestry. 7:2 12-2 17.
Loftis, D.L. 1983b. Regenerating red oak on productive sites in the southern Appalachians: a research approach. In: Jones, Jr., E.P., ed. Proceedings of the second biennial southern silviculture research conference. 1982 November 4-5. Atlanta. Gen. Tech. Rep. SE-24. Asheville, NC: U. S. Department of Agriculture, Forest Service, Southeatern Forest Experiment Station. 144-1 50.

Loftis, D.L. 1988. Regenerating oaks on high-quality sites, an update. In: Smith, H.C.; Perkey, A.W.; Kidd, W.E. eds. Proceedings: Guidelines for regenerating Appalachian hardwood stands; 1988 May 24-26; Morgantown, WV. SAF Publ. 88-03. Morgantown, WV: West Virginia University Books : 199-209.
Loftis, D.L. 1990a. Predicting post-harvest performance of advance red oak reproduction in the southern Appalachians. Forest Science. 3 6(4):908-9 16.
Loftis, D.L. 1990b. A shelterwood method for regenerating red oak in the southern Appalachians. Forest Science. 3 6(4):9 17-929.
McCune, B.; Mefford, M.J. 1995. PC-ORD. Multivariate Analysis of Ecological Data, Version 2.0. MjM Software Design, Gleneden Beach, Oregon.
McNab, W.H., Avers, P.E., comps. 1994. Ecological subregions ofthe United States: section descriptions. Admin. Publ. WO-WSA-5. Washington, DC: U.S. Department of Agriculture, Forest Service. 267 p.
Palmer, M.W. 1993. Putting things in even better order: the advantages of canonical correspondence analysis. Ecology 74:22 15-2230.
Sander, I.L.; Johnson, P.S.; Rogers, R.R. 1984. Evaluating oak advance reproduction in the Missouri Ozarks. Res. Pap. NC- 251. St. Paul, MN: U.S. Department of Agriculture, Forest Service, North Central Forest Experiment Station. 16 p.
Sander, I.L. 1988. Guidelines for regenerating Appalachian oak stands. In: Smith, H.C.; Perkey, A.W.; Kidd, W.E. eds. Proceedings: Guidelines for regenerating Appalachian hardwood stands; 1988 May 24-26; Morgantown, WV. SAF Publ. 88-03. Morgantown, WV: West Virginia University Books: 189- 198.
Schuler, T.M.; Miller, G.W. 1995. Shelterwood treatments fail to establish oak reproduction on mesic sites in West Virginia-- 10-year results. In: Gottschalk, K.W.; Fosbroke, S.L.C., eds. Proceedings, 10th Central Hardwood Forest Conference; 1995 March 5-8; Morgantown, WV; Gen. Tech. Rep. NE-197. Radnor, PA: U.S. Department of Agriculture, Forest Service, Northeastern Forest Experiment Station. 375-387.
ter Braak, C.J.F. 1986. Canonical correspondence analysis: a new eigenvector technique for multivariate direct gradient analysis. Ecology 67: 1 167- 1 179.
ter Braak, C.J.F. 1988. Chapter 5:Ordination. In: Jongrnann, R.H.G.; ter Braak, C.J.F.; van Tongeren. Data analysis in community and landscape ecology. Pudoc, Wageningen, The Netherlands.
U.S. Department of Agriculture, Soil Conservation Service. 1967. Soil survey of Tucker County, West Virginia. Elkins, WV. U.S. Department of Agriculture, Soil Conservation Service.

P 1.06 Improvement and Silviculture of
Oaks
PROCEEDINGS ADVANCES IN RESEARCH IN
INTERMEDIATE OAK STANDS .;
Conference 27 - 30 July, 1997
Freiburg i. Br. GERMANY
Institute for Forest Growth University of Freiburg