Embed Size (px)
Citation preview

J-STAGE Advance Publication date: 19 January, 2018Paper No.17-00369
© 2018 The Japan Society of Mechanical Engineers[DOI: 10.1299/mej.17-00369]
Vol.5, No.1, 2018Bulletin of the JSME
Mechanical Engineering Journal
Effect of seam characteristics on critical Reynolds number
in footballs
1. Introduction
Because of its direct relationship to the ball flight trajectory, the aerodynamics of sports balls attracts a high level
of interest in terms of both science and engineering (Mehta et al., 1983, Thompson, 1910, Watts and Ferrer, 1987,
Zayas, 1986). An important known characteristic in the aerodynamics of sports balls is that the air drag of a ball in
flight dramatically drops when the boundary layer surrounding a football transitions from a laminar to a turbulent one
(Mehta, 1985). When the boundary layer transitions and the drag dramatically drops (non-dimensional velocity of
flow), the Reynolds number is termed as the critical Reynolds number (Bearman and Harvey, 1976) and forms the most
important aerodynamic indicator that expresses the drag characteristics of a ball.
To date, the critical Reynolds number has often been reported in studies of football aerodynamics (Asai et al.,
2007, Goff and Carré, 2009, Passmore et al., 2012), but in recent years, new demand has arisen to cast light on the drag
characteristics and critical Reynolds number of footballs with varying panel shapes and surface design used in official
matches (Hong and Asai, 2014, Hong et al., 2015). Moreover, the critical Reynolds number is an aerodynamic indicator
directly linked to the ball velocity and flight trajectory, and clarification of the critical Reynolds number of footballs in
recent years has been considered very important from the perspective of sports science and sports engineering as well
as from the perspective of competitive arena. On the other hand, the effect of roughness of a spherical surface on the
critical Reynolds number has been reported in studies based on smooth spheres (Achenbach, 1974). However, the
surface of a football is shaped using a complex combination of panels and grooves of varying forms, and almost
nothing is known about the effect of the various surface shape parameters of footballs on the ball critical Reynolds
number or roughness. Accordingly, studying the ball-surface shape parameters that affect the critical Reynolds number
Abstract In recent years, the design of footballs, including the number and shape of the panels forming the surface of footballs, has undergone a significant change. However, panels of varied shapes and seams are combined in complex ways to form the surface shape of footballs, and almost nothing is known about the effect of these surface shapes on the football drag characteristics. The present study used a wind tunnel to study the relationship between the critical Reynolds number and the length, depth, and width of the panel joints (seams) of 10 most recent football types used in matches in recent years. The results show the tendency that the drag coefficient in the super-critical regime (30 m/s) of a football increases as the panel joint length increases. Moreover, the depth of the panel joint indicates the highest correlation with the critical Reynolds number (r = -0.71, p < 0.01) and is considered to be a strong and convenient indicator that expresses the roughness (large scale) of the football surface. This study reveals the drag characteristics of the latest footballs and enables some degrees of prediction of the critical Reynolds number for the latest football types and those that will be developed in the future. Keywords : Aerodynamics, Air drag, Ball trajectory, Football, Reynolds number
Kiyoshi NAITO*, Sungchan HONG**, Masaaki KOIDO**, Masao NAKAYAMA**, Keiko SAKAMOTO*** and Takeshi ASAI**
* Doctoral Program of Coaching Science, Graduate School of Comprehensive Human Sciences,
University of Tsukuba, Tsukuba 305-8574, Japan
** Institutes of Health and Sports Science, University of Tsukuba, Tsukuba 305-8574, Japan
E-mail: [email protected]
*** School of Sports and Exercise Sciences, Liverpool John Moores University, Liverpool, UK
1
Received: 25 July 2017; Revised: 29 October 2017; Accepted: 10 January 2018

2© 2018 The Japan Society of Mechanical Engineers
Naito, Hong, Koido, Nakayama, Sakamoto and Asai, Mechanical Engineering Journal, Vol.5, No.1 (2018)
[DOI: 10.1299/mej.17-00369]
and roughness of footballs in recent years is very important for not only sports science but also sports engineering
involved in the design and development of footballs.
The present study used a wind tunnel to measure the drag characteristics and revealed the air drag of 10 most
recent football types used in matches in recent years. Furthermore, all parameters of the panel joints, namely, the
extended total length, width, depth, area, and extended total volume, were measured as elements of the indicator that
expresses the roughness (large scale) of the football surface, and their relationship with the critical Reynolds number
was studied using correlation analysis. Thus, we found the tendency that the drag coefficient in the super-critical
regime (30 m/s) of a football increases as the panel joint length increases. The depth of the panel joint is found to have
the highest correlation with the critical Reynolds number (r = -0.71, p < 0.01) and is demonstrated to be a strong and
convenient indicator that expresses the roughness of the football surface. The present study not only reveals the drag
characteristics of the latest footballs but also enables some degree of prediction of the critical Reynolds number of the
latest footballs and those that will be manufactured in the future.
2. Methods
2-1. Wind-tunnel test
Fig. 1 Wind-tunnel setup
The closed (return-flow) type low-speed low-turbulence wind tunnel located at the University of Tsukuba (San
Technologies Co., LTD.) (Figure 1) was used in this experiment. The maximum wind speed was 55 m/s, the nozzle size
was 1.5 m × 1.5 m, the wind speed distribution was within ± 0.5%, the degree of turbulence was less than 0.1%, and
the blockage of the measured soccer ball was within 5% of the nozzle size. For example, when the wind speed was set
to 25 m/s, the measured mean wind speed was 25.28 m/s with a standard deviation from the measurement position in
the range of -0.46 to 0.45 and a wind speed distribution within ± 0.5%. Similarly, the degree of turbulence downstream
of the nozzle when the wind speed was 25 m/s was 0.05 to 0.06 or within approximately ±0.1%. Thus, the error due to
the ball position was believed to have little effect on the wind speed. Furthermore, in the measurement system of this
study, the dynamic pressure can be automatically measured at 0.1 Pa intervals using a Pitot-static tube placed above the
measurement portion of the soccer ball. In addition, because the position of the ball during the measurement procedure
was set at the centre of the nozzle cross section to adjust the distance between the nozzle and the ball to zero, the flow
generated from the support sting and column may not have a direct effect on the flow around the ball. Furthermore, the
length of the sting used in this study was 0.8 m and its width was 0.02 m. The experiment was performed in this wind
tunnel using 10 modern footballs, including Conext15, the official match ball in the 2015 Women’s World Cup, and
Finale, the official Union of European Football Associations Champion’s League football (Figure 2). The forces acting
on the footballs were measured using a sting-type six-component force detector (LMC-61256, Nissho Electric Works).
The aerodynamic force measured in the experiment was converted to drag coefficient (Cd), as shown in equation (1).
𝐶𝑑 = 2𝐷
𝜌𝑈2𝐴 (1)
where ρ is the air density (ρ = 1.2 kg/m3), D is the drag force, U is the flow rate, and A is the projected area of the
football (A = π × 0.112 = 0.038 m
2).
2

2© 2018 The Japan Society of Mechanical Engineers
Naito, Hong, Koido, Nakayama, Sakamoto and Asai, Mechanical Engineering Journal, Vol.5, No.1 (2018)
[DOI: 10.1299/mej.17-00369]
Fig. 2 Footballs used in the test. A (Conext15, 6-panel, Adidas), B (Cafusa, 32-panel, Adidas), C (Jabulani, 8-panel, Adidas),
D (Teamgeist2, 14-panel, Adidas), E (Finale, 32-panel, Adidas), F (Brazuca, 32-panel, Adidas), G (Pelada I,
32-panel, Molten), H (Pelada II, 32-panel, Molten), I (Vantaggio, 32-panel, Molten), and J (Brillant Super, 32-panel,
Select).
2-2. Surface roughness measurement
To study the characteristics of the football surface shape in more detail, the surface shape parameters that affect the
surface roughness were measured. The parameters obtained in the present study were the length of the panel joints
(bonds or seams) and the width and depth of the panel joints. The width and depth were measured using a high-speed
two-dimensional (2D) laser scanner (LJ-V7000, Keyence Corp.) (Figure 3). In addition, the length of the panel joints
was measured using a curvimeter (Concurve 10; Koizumi Sokki Mfg. Co., Ltd.). To measure these parameters, all
seams of the football were covered using clay with the height of the imprint representing the panel joint depth and the
width representing the panel joint width.
For the statistics, we employed correlation coefficient r (Pearson’s r), which measured the strength and direction of
the linear relationship (least square method) between two variables on a scatterplot.
Fig. 3 System using a laser scanner to measure the football seam shape parameters (length, depth, and width of the panel
joints).
2-3. Ball trajectory simulation
We conducted a simple 2D flight simulation to compare the effects of the drag coefficients of Pelada II and Finale in
the super-critical regime (30 m/s) and Brillant Super and Cafusa in the semi-critical regime (10 m/s) on their flight
distance and trajectory (Goff and Carré, 2009). The occurrence of irregular and unsteady lift and side forces known as
the ‘knuckle effects’, has been reported for soccer balls flying with no spin or with a low-speed spin (Asai and
Kamemoto, 2011). However, because this study focused on the relationship between the constant resistance of the ball
and its flight trajectory (Passmore et al., 2008, Tuplin et al., 2012), the knuckle effects were ignored in the trajectory
simulation. In the trajectory simulation, we estimated the drag coefficient with respect to the Reynolds number using a
cubic curve to calculate the 2D coordinates of the ball. Therefore, we omitted the lift and side forces acting on the ball.
Drag coefficient data obtained from the wind-tunnel experiments were used to compare the football trajectories. Two
forces act on a football moving through the air. The first acts down on the ball, namely, the ball weight (mg), where m
is the ball mass and g = 9.80 m/s2 is the constant magnitude of gravitational acceleration near the Earth surface. The
second force is the drag force, whose direction is opposite the ball velocity and has a magnitude given by equation (1).
By considering that the x- axis point along the horizontal and the y- axis point vertically upward, Newton’s second law
is reduced to
3
2© 2018 The Japan Society of Mechanical Engineers
Naito, Hong, Koido, Nakayama, Sakamoto and Asai, Mechanical Engineering Journal, Vol.5, No.1 (2018)
[DOI: 10.1299/mej.17-00369]
�̈� = -βvCd�̇� (2)
and
�̈� = -βvCd�̇�-g (3)
where β = ρA / 2m, v = √�̇�2 + �̇�2, and the dot signifies one total time derivative.
Equations (2) and (3) can be numerically solved under appropriate initial conditions using a fourth-order Runge–Kutta
algorithm (Press et al., 1986). For the speed-dependent Cd in equations (2) and (3), linear interpolation between
experimental wind-tunnel data points was used.
By using the relationship between the Reynolds number and the drag coefficient, which were measured in the
wind-tunnel experiment, we calculated the initial ball velocities of the 2D flight trajectory to be 30 and 10 m/s,
respectively; the ball was launched at an angle of 25° in both cases.
3. Results and Discussion
3-1 Drag coefficient
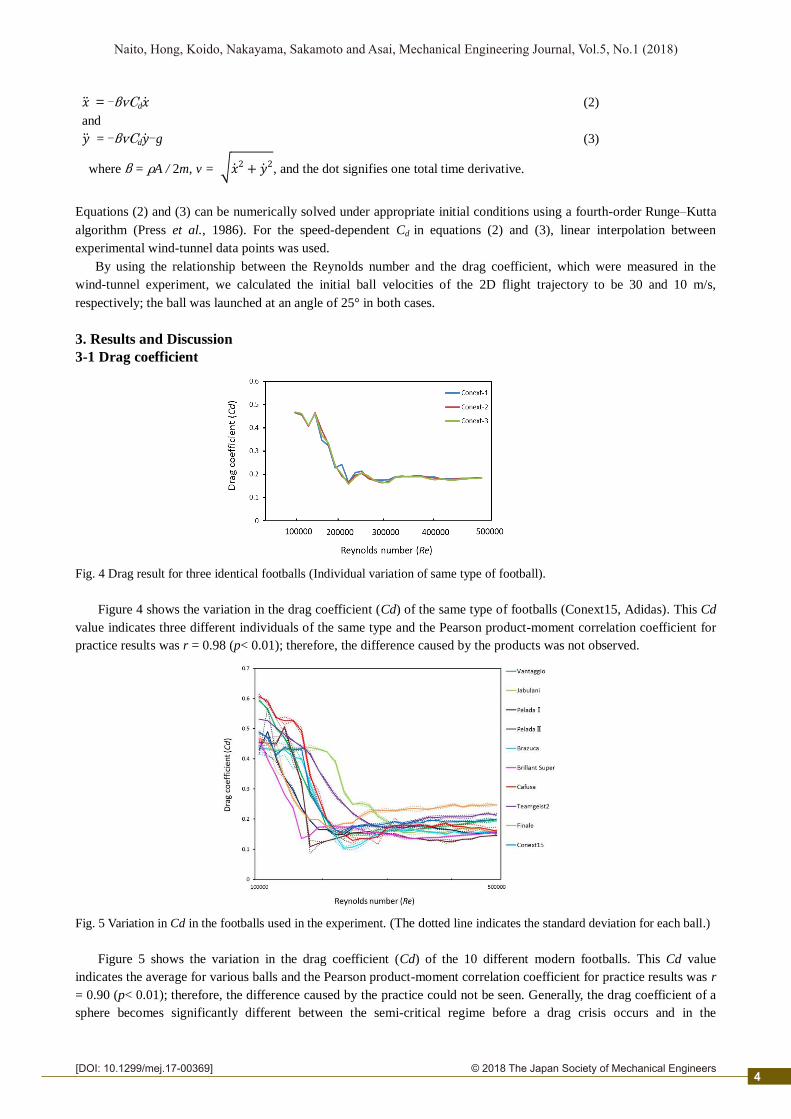
Fig. 4 Drag result for three identical footballs (Individual variation of same type of football).
Figure 4 shows the variation in the drag coefficient (Cd) of the same type of footballs (Conext15, Adidas). This Cd
value indicates three different individuals of the same type and the Pearson product-moment correlation coefficient for
practice results was r = 0.98 (p< 0.01); therefore, the difference caused by the products was not observed.
Fig. 5 Variation in Cd in the footballs used in the experiment. (The dotted line indicates the standard deviation for each ball.)
Figure 5 shows the variation in the drag coefficient (Cd) of the 10 different modern footballs. This Cd value
indicates the average for various balls and the Pearson product-moment correlation coefficient for practice results was r
= 0.90 (p< 0.01); therefore, the difference caused by the practice could not be seen. Generally, the drag coefficient of a
sphere becomes significantly different between the semi-critical regime before a drag crisis occurs and in the
4

2© 2018 The Japan Society of Mechanical Engineers
Naito, Hong, Koido, Nakayama, Sakamoto and Asai, Mechanical Engineering Journal, Vol.5, No.1 (2018)
[DOI: 10.1299/mej.17-00369]
super-critical regime after the drag crisis occurs. The drag coefficient in the super-critical regime becomes larger than
that in the semi-critical regime. The drag coefficient in the super-critical region for the present experiment, (Re = 4.2 ×
105; 30 m/s) showed a small value of 0.127 for Pelada II followed by 0.144 for Brillant Super. In addition, the
experiment showed a large drag coefficient of 0.247 for Finale, followed by 0.208 for Teamgeist2. The drag coefficient
in the sub-critical regime (Re = 1.4 × 10⁵; 10 m/s) showed a small value of 0.281 for Brillant Super, followed by 0.336
for Pelada I. In addition, the experiment showed a large drag coefficient of 0.526 for Cafusa, followed by 0.505 for
Pelada II.
Jabulani was found to have a higher drag than the other balls in the medium-speed section (10–20 m/s). Finale
demonstrated highest Cd in the high-speed section (20–35 m/s). For Pelada, which was constructed from identical panel
shapes (32 pentagons and hexagons), two versions were available: Pelada I with stitched joints and Pelada II with
bonded joints. A comparison of the Cd showed relatively lower results for Pelada II in the medium-speed section.
Furthermore, the drag coefficient in the supercritical range was the lowest for Conext15, which was approximately 0.16
(Re = 2.4 × 10⁵). For the 32-panel balls, it was approximately 0.14 (Re = 2.2 × 10
5) for Pelada I with stitched joints and
approximately 0.10 (Re = 1.8 × 10⁵) for Pelada II with bonded joints. The drag coefficient for 14-panel Teamgeist2 was
approximately 0.17 (Re = 3.0 × 10⁵), and that for six-panel Jabulani was approximately 0.15 (Re = 3.5 × 10⁵).
Using a ball trajectory simulation in the super-critical regime (ball initial velocity: 30 m/s; attack angle: 25°), we
compared the flight distance of Pelada II, which has a small maximum drag coefficient, and Finale, which has a large
one. The flight distances for Pelada II and Finale were approximately 52.8 and 45.7 m, respectively. The Pelada II
flight distance was approximately 7.1 m farther than that of Finale. A ball velocity in this super-critical region (nearly
30 m/s) may be considered as located in a velocity regime that can be used when shooting or making a long kick in
soccer (Passmore et al., 2008). These results suggest that Pelada II is a better ball than Finale in terms of flight during
shooting or kicking. In the same manner, we performed a simulation of the ball flight in the sub-critical regime (ball
initial velocity: 10 m/s; attack angle: 25°) that can be used in passing in soccer. By comparing the flight distance of
Brillant Super (with a small maximum drag coefficient) and Cafusa (with a large maximum drag coefficient), the
Cafusa ball distance (approximately 6.7 m) was approximately 0.5 m shorter than that of Brillant Super (approximately
7.2 m) (Figure 6b). Therefore, in this velocity regime, Brillant Super may be considered as the ball with a better flight.
However, in addition to the small absolute velocity, the difference in the distance is small. Therefore, the effect on an
actual play is presumably relatively small.
Fig. 6 (a) Comparison of the flight distance of Pelada II with that of Finale in the super-critical regime (30 m/s) and (b)
comparison of that of Brillant Super with that of Cafusa in the sub-critical regime (10 m/s).
In the super-critical regime (U = 30 m/s), the correlation coefficient (r) with the panel joint length was 0.45, that
with the panel joint width was -0.03, and that with the panel joint depth was -0.16. The experiments indicated that the
longer the panel joint is, the larger is the drag coefficient (Figure 7a). In addition, the drag coefficient in the
5

2© 2018 The Japan Society of Mechanical Engineers
Naito, Hong, Koido, Nakayama, Sakamoto and Asai, Mechanical Engineering Journal, Vol.5, No.1 (2018)
[DOI: 10.1299/mej.17-00369]
super-critical regime (30 m/s) of a soccer ball increases as the panel joint length increases (r = 0.45, p < 0.1). Therefore,
in the super-critical regime, a ball with a short length in the panel joint tends to have a longer flight than that with a
longer length. Thus, the panel joint length can be one of the factors of the drag coefficient in this regime. Further, in the
sub-critical regime (U = 10 m/s), the correlation coefficient between the drag coefficient and panel joint length was
-0.16, that with the panel joint width was -0.30, and that with the panel joint depth was -0.52. The larger the panel joint
depth is, the smaller is the drag coefficient (Figure 7b). Consequently, in the sub-critical regime, a ball with a deep
panel joint ball tends to have a longer flight than that with a thin panel joint.
Fig. 7 (a) Relationship between the panel joint length and drag coefficient in the super-critical regime (30 m/s) and (b) panel
joint depth and drag coefficient in the semi-critical regime with Pearson’s r.
3-2 Critical Reynolds number
The critical Reynolds number (Re_crit) is a typical velocity indicator that divides the sub-critical and super-critical
regimes in a drag crisis. To study the relationship between the ball surface roughness and Re_crit of all 10 footballs used
in the present study, Re_crit and the joint length, depth, and width of all footballs were measured (Table 1).
Table 1 Relationship between the critical Reynolds number and joint length, depth, and width of all footballs.
Ball type Re_crit Distance (mm) Width(mm) Depth(mm)
Conext15 2.4 × 10⁵ 3320 8.0 1.6
Jabulani 3.5 × 10⁵ 1980 2.2 0.5
Cafusa 2.5 × 10⁵ 4470 3.4 1.1
Teamgeist2 3.0 × 10⁵ 3470 2.3 0.7
Vantaggio 2.5 × 10⁵ 3850 6.8 1.8
Brillant Super 1.7 × 10⁵ 3850 5.0 1.9
Pelada Ⅰ 2.2 × 10⁵ 3850 5.7 1.7
Pelada Ⅱ 1.8 × 10⁵ 3850 4.0 1.0
Brazuca 32p 2.4 × 10⁵ 3850 3.3 0.9
Finale 2.1 × 10⁵ 5100 5.9 1.4
First, the relationship between the panel joint length and critical Reynolds number showed a tendency that the longer
the panel joint length is, the smaller is the critical Reynolds number. Moreover, in terms of the relationship with the
panel joint width, we found that the critical Reynolds number tended to increase as the width decreased. For the
relationship with the panel joint depth, the critical Reynolds number tended to decrease as the seam depth increased.
The correlation coefficients of the panel joint length, width, and depth and the critical Reynolds numbers for these
footballs were calculated (Figure 8). First, the correlation coefficient observed for the length of the panel joints and the
critical Reynolds number was equally high, similar to that in our previous study (Asai and Seo, 2013), with r = -0.67 (p
< 0.01). The correlation coefficient for the depth of the panel joints and the critical Reynolds number was found to
exhibit a strong negative correlation (r = -0.71, p < 0.01). The correlation coefficient for the width of the panel joints
and the critical Reynolds number was found to be quite high (r = -0.54, p < 0.01), although the figures were lower than
6
2© 2018 The Japan Society of Mechanical Engineers
Naito, Hong, Koido, Nakayama, Sakamoto and Asai, Mechanical Engineering Journal, Vol.5, No.1 (2018)
[DOI: 10.1299/mej.17-00369]
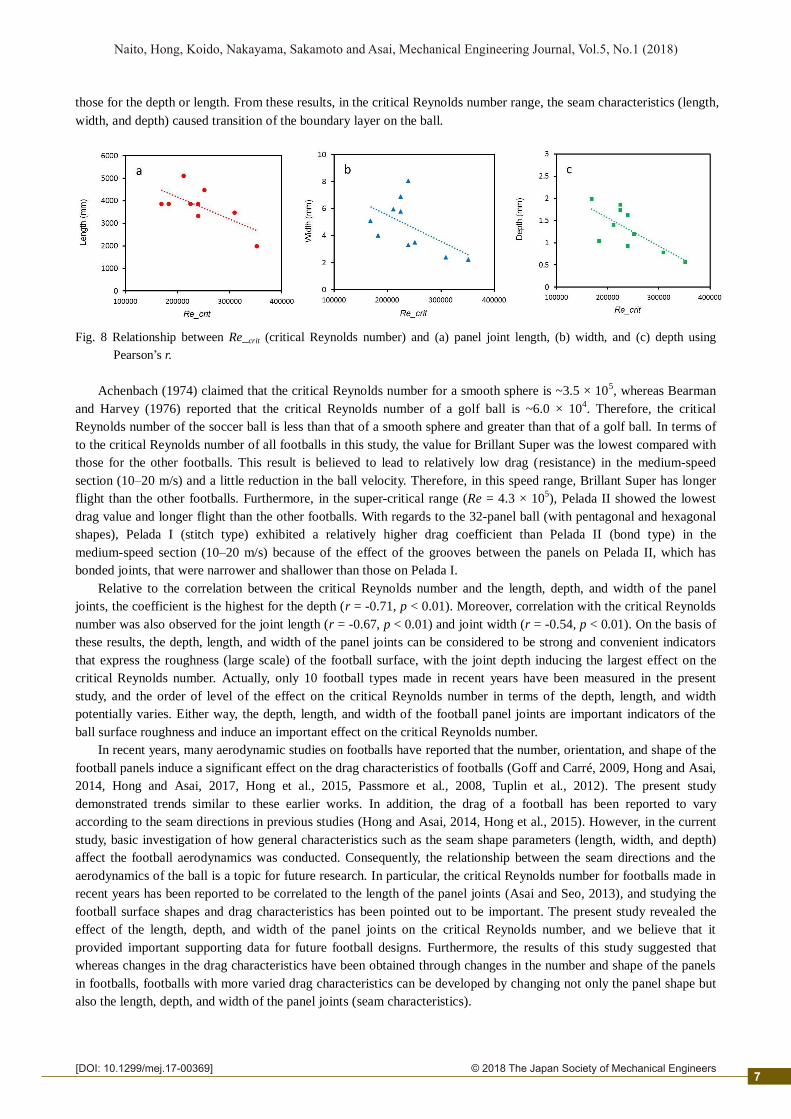
those for the depth or length. From these results, in the critical Reynolds number range, the seam characteristics (length,
width, and depth) caused transition of the boundary layer on the ball.
Fig. 8 Relationship between Re_crit (critical Reynolds number) and (a) panel joint length, (b) width, and (c) depth using
Pearson’s r.
Achenbach (1974) claimed that the critical Reynolds number for a smooth sphere is ~3.5 × 10⁵, whereas Bearman
and Harvey (1976) reported that the critical Reynolds number of a golf ball is ~6.0 × 10⁴. Therefore, the critical
Reynolds number of the soccer ball is less than that of a smooth sphere and greater than that of a golf ball. In terms of
to the critical Reynolds number of all footballs in this study, the value for Brillant Super was the lowest compared with
those for the other footballs. This result is believed to lead to relatively low drag (resistance) in the medium-speed
section (10–20 m/s) and a little reduction in the ball velocity. Therefore, in this speed range, Brillant Super has longer
flight than the other footballs. Furthermore, in the super-critical range (Re = 4.3 × 10⁵), Pelada II showed the lowest
drag value and longer flight than the other footballs. With regards to the 32-panel ball (with pentagonal and hexagonal
shapes), Pelada I (stitch type) exhibited a relatively higher drag coefficient than Pelada II (bond type) in the
medium-speed section (10–20 m/s) because of the effect of the grooves between the panels on Pelada II, which has
bonded joints, that were narrower and shallower than those on Pelada I.
Relative to the correlation between the critical Reynolds number and the length, depth, and width of the panel
joints, the coefficient is the highest for the depth (r = -0.71, p < 0.01). Moreover, correlation with the critical Reynolds
number was also observed for the joint length (r = -0.67, p < 0.01) and joint width (r = -0.54, p < 0.01). On the basis of
these results, the depth, length, and width of the panel joints can be considered to be strong and convenient indicators
that express the roughness (large scale) of the football surface, with the joint depth inducing the largest effect on the
critical Reynolds number. Actually, only 10 football types made in recent years have been measured in the present
study, and the order of level of the effect on the critical Reynolds number in terms of the depth, length, and width
potentially varies. Either way, the depth, length, and width of the football panel joints are important indicators of the
ball surface roughness and induce an important effect on the critical Reynolds number.
In recent years, many aerodynamic studies on footballs have reported that the number, orientation, and shape of the
football panels induce a significant effect on the drag characteristics of footballs (Goff and Carré, 2009, Hong and Asai,
2014, Hong and Asai, 2017, Hong et al., 2015, Passmore et al., 2008, Tuplin et al., 2012). The present study
demonstrated trends similar to these earlier works. In addition, the drag of a football has been reported to vary
according to the seam directions in previous studies (Hong and Asai, 2014, Hong et al., 2015). However, in the current
study, basic investigation of how general characteristics such as the seam shape parameters (length, width, and depth)
affect the football aerodynamics was conducted. Consequently, the relationship between the seam directions and the
aerodynamics of the ball is a topic for future research. In particular, the critical Reynolds number for footballs made in
recent years has been reported to be correlated to the length of the panel joints (Asai and Seo, 2013), and studying the
football surface shapes and drag characteristics has been pointed out to be important. The present study revealed the
effect of the length, depth, and width of the panel joints on the critical Reynolds number, and we believe that it
provided important supporting data for future football designs. Furthermore, the results of this study suggested that
whereas changes in the drag characteristics have been obtained through changes in the number and shape of the panels
in footballs, footballs with more varied drag characteristics can be developed by changing not only the panel shape but
also the length, depth, and width of the panel joints (seam characteristics).
7

2© 2018 The Japan Society of Mechanical Engineers
Naito, Hong, Koido, Nakayama, Sakamoto and Asai, Mechanical Engineering Journal, Vol.5, No.1 (2018)
[DOI: 10.1299/mej.17-00369]
From these results, the seams shape in the football surface is also expected to have the effect of maintaining a
constant boundary layer around the ball. However, because the air flow around the ball was not studied in this
experiment, we need to make a study from multiple angles on how friction resistance due to the seams shapes affects
the boundary layer separation. Thus, in the future, we need to study the ball surface air flow in further details using
visualisation methods such as particle image velocimetry.
4. Conclusions
This study used a wind tunnel to analyse the relationship between the critical Reynolds number and the length,
depth, and width of the panel joints (seams) of 10 most recent football types used in matches in recent years. We found
a trend that the drag coefficient in the super-critical regime (30 m/s) of a football increases as the panel joint length
increases. Therefore, the depth of the panel joint is a strong indicator that expresses the roughness of the football
surface. In addition, the length, depth, and width of the panel joints may be important in predicting the critical
Reynolds number of footballs. The lift coefficient is also one of the important aerodynamic characteristics of footballs.
Therefore, we may need to analyse the effect of surface roughness on the lift coefficient of the football in the future.
References
Achenbach, E., Experiments on the flow past spheres at very high Reynolds numbers, J Fluid Mech., Vol.54, (1972),
pp.565–575.
Achenbach, E., The effects of surface roughness and tunnel blockage on the flow past spheres, J. Fluid Mech., Vol.61,
(1974), pp.113–125.
Asai, T. and Kamemoto, K., Flow structure of knuckling effect in footballs, J Fluid Struct., Vol.27, (2011), pp.727–733.
Asai, T. and Seo, K., Aerodynamic drag of modern footballs, Springer Plus, Vol.2, (2013), Paper No.171.
Asai, T. Seo, K. Kobayashi, O. and Sakashita, R., Fundamental aerodynamics of the football, Sports Eng., Vol.10,
(2007), pp.101–109.
Bearman, P. W. and Harvey, J. K., Golf ball aerodynamics, Aeronautical Quartetly. Vol.27, (1976), pp.112–122.
Goff, J. E. and Carré, M. J., Trajectory analysis of a football, Am. J. Phys., Vol.77, (2009), pp.1020–1027.
Hong, S. and Asai, T., Effect of panel shape of football on its flight characteristics, Sci. Rep., Vol.4, (2014), Paper
No.5068.
Hong, S. and Asai, T., Aerodynamic effects of dimples on soccer ball surfaces, Heliyon, Vol.3, (2017), Paper
No.e00432.
Hong, S., Asai, T. and Seo, K., Visualization of air flow around football using a particle image velocimetry, Sci. Rep.,
Vol.5, (2015), Paper No.15108.
Mehta, R. D., Aerodynamics of sports balls, Annu. Rev. Fluid Mech., Vol.17, (1985), pp.151–189.
Mehta, R. D., Bentley, K., Proudlove, M. and Varty, P., Factors affecting cricket ball swing, Nature, Vol.303, (1983),
pp.787–788.
Passmore, M. et al., Experimental studies of the aerodynamics of spinning and stationary footballs, Proceedings of
IMechE, Part C. Vol.222, (2008), pp.195-205.
Passmore, M. et al., The aerodynamic performance of a range of FIFA-approved footballs, Proceedings of IMechE, Part
P. Vol.226, (2012), pp.61–70.
Press, W. H. et al., Numerical recipes: the art of scientific computing. New York, (1986), Cambridge University Press.
Thompson, J. J., The dynamics of a golf ball, Nature, Vol.85, (1910), pp.2151–2157.
Tuplin, S. et al., The application of simulation to the understanding of football flight, Proceeding of IMechE, Part P.
Vol.220, (2012), pp.134-142.
Watts, R. G. and Ferrer, R., The lateral force on a spinning sphere: Aerodynamics of a curveball, Am. J. Phys., Vol.55,
(1987), pp.40–44.
Zayas, J. M., Experimental determination of the coefficient of drag of a tennis ball, Am. J. Phys., Vol.54, (1986),
pp.622–625.
8


![Seam - ####### [###20080327] - JBoss...Table of Contents JBoss Seam## .....xi 1. Seam ## .....1](https://img.dokumen.tips/doc/110x75/60d604b5fa8e121d9f6a07dc/seam-20080327-jboss-table-of-contents-jboss-seam-xi.jpg)