Embed Size (px)
Citation preview

JAAS
PAPER
Publ
ishe
d on
13
Mar
ch 2
014.
Dow
nloa
ded
by U
nive
rsité
Lav
al o
n 12
/07/
2014
12:
35:2
2.
View Article OnlineView Journal | View Issue
aInstitute of Atomic and Molecular Physic
China. E-mail: [email protected]; huzhanbInstitute of Theoretical Chemistry, Stat
Computational Chemistry, Jilin University, CcState Key Laboratory of Laser Interaction w
Fine Mechanics and Physics, Chinese Academ
Cite this: J. Anal. At. Spectrom., 2014,29, 1105
Received 7th January 2014Accepted 13th March 2014
DOI: 10.1039/c4ja00006d
www.rsc.org/jaas
This journal is © The Royal Society of C
Effect of sample position on collinear femtoseconddouble-pulse laser-induced breakdownspectroscopy of silicon in air
Hongxia Qi,a Suyu Li,a Ying Qi,a Anmin Chen,*ab Zhan Hu,*a Xuri Huang,b
Mingxing Jinac and Dajun Dinga
A femtosecond double-pulse laser was used to induce the plasma of silicon in air. The laser wavelength was
800 nm. The interpulse delay of the femtosecond double-pulse was from �20 ps to 100 ps. During the
experiment, the spectral line was fixed at the wavelength of 288.157 nm. The emission intensity was
observed to lead to a significant increase by choosing the proper sample position. The range of the
sample position is from 5.17 mm to 5.27 mm. And, the best sample position for the higher laser fluence
was different from the position for the lower laser fluence. At the higher laser fluence, the optimized
emission intensity can be obtained at either side of the best focal position for all interpulse delays of the
double-pulse. The phenomena can be explained by the nonlinear propagation of the femtosecond laser
pulse in air. At the lower laser fluence, the best sample position will change from one side to both sides
with the increase of the interpulse delay of the double-pulse. The results showed that the effect of the
sample position can be especially advantageous in the context of femtosecond double-pulse laser-
induced breakdown spectroscopy. The study will lead a further improvement in the applications of the
femtosecond double-pulse laser.
1 Introduction
Laser-induced breakdown spectroscopy (LIBS) is a populartechnique involving laser ablation of a sample and analysis ofthe optical emission from the laser-generated plasma to deter-mine the elements within the sample.1 LIBS has already beenapplied in a wide range of applications, such as civilian andmilitary environmental monitoring, cultural heritage analysisand characterization, and biological and medical identication,as well as space exploration.2–5 In recent years, many newexperimental methods have been used to improve the sensi-tivity of LIBS, such as plasma connement,6–8 fast sparkdischarge,9,10 magnetic eld,11–13 double-pulse,14–17 and so on.
With the development of a variety of laser technologies, afemtosecond laser was introduced into laser ablation. Theinteraction of the femtosecond laser and the material providedsome special features to the ablation process as a lower damagethreshold and a higher efficiency, which are different for thenanosecond laser. The other advantages included the smallheat affected zone, better depth resolution, and faster
s, Jilin University, Changchun 130012,
@jlu.edu.cn
e Key Laboratory of Theoretical and
hangchun 130012, China
ith Matter, Changchun Institute of Optics,
y of Sciences, Changchun 130033, China
hemistry 2014
broadband background decay. By comparing single-shot LIBSwith femtosecond and nanosecond laser pulses, the femto-second spectrum was well-resolved and presented a very lowbackground emission, allowing signal accumulation for a largenumber of pulses. And, plasma emission was found to varymuch more rapidly with time than in the case of the nano-second laser produced plasma. Due to the advantage of thenanosecond double-pulse laser in LIBS, the femtoseconddouble-pulse conguration has been used for the studies ofLIBS. The double-pulse technique can be carried out in twodifferent pulse congurations called orthogonal18,19 andcollinear,20,21 referring to the relative directions of the two laserpulses. In both congurations the laser is red twice with pulseseparation.22 The interpulse delay of two pulses was controlledby the precise stepper motor stage. The range of the interpulsedelay was from 0 ps to hundreds of ps. Compared with theresults induced by the femtosecond single-pulse laser,increasing or decreasing the interpulse delay of the femto-second double-pulse, some new results generated by thefemtosecond double-pulse laser can be obtained. For example,enhancement of plasma emission,23 reducing nanoparticles,24
plume composition control,25,26 and so on. In particular, at thesame whole laser energy, the femtosecond double-pulse tech-nique in LIBS can provide the higher luminosity of plasma incomparison with the femtosecond single-pulse and thus effi-ciently improve the accuracy of the measurements.27–30
Furthermore, some theoretical research has been also carried
J. Anal. At. Spectrom., 2014, 29, 1105–1111 | 1105
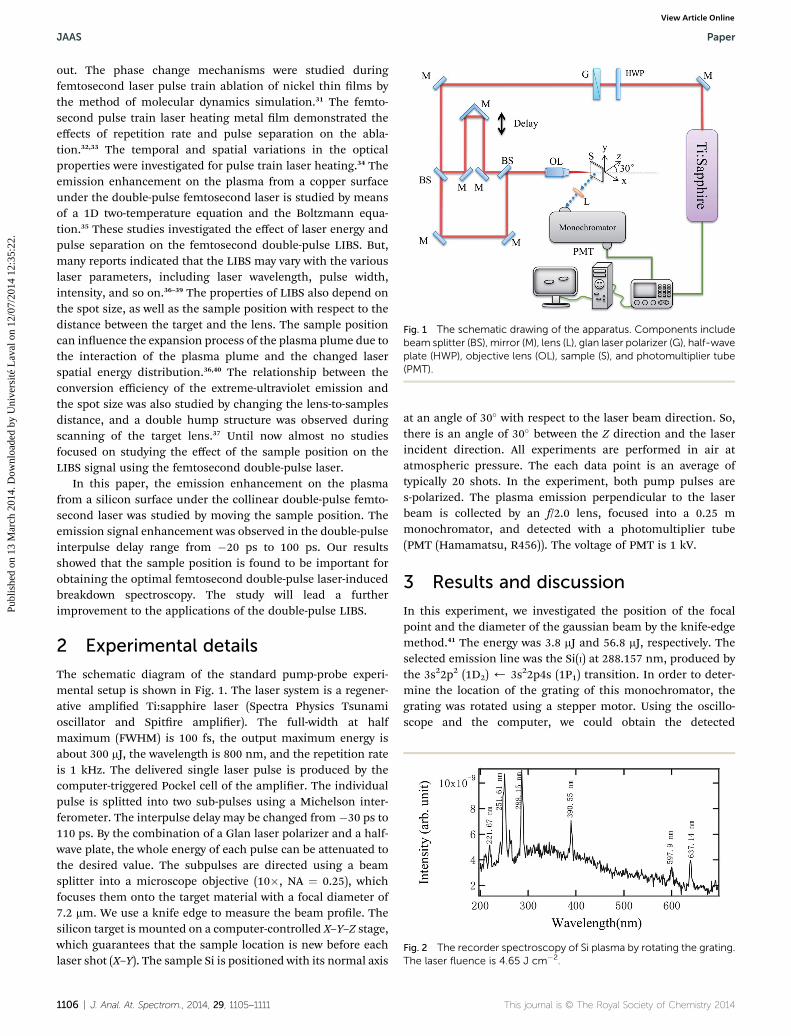
Fig. 1 The schematic drawing of the apparatus. Components includebeam splitter (BS), mirror (M), lens (L), glan laser polarizer (G), half-waveplate (HWP), objective lens (OL), sample (S), and photomultiplier tube(PMT).
Fig. 2 The recorder spectroscopy of Si plasma by rotating the grating.The laser fluence is 4.65 J cm�2.
JAAS Paper
Publ
ishe
d on
13
Mar
ch 2
014.
Dow
nloa
ded
by U
nive
rsité
Lav
al o
n 12
/07/
2014
12:
35:2
2.
View Article Online
out. The phase change mechanisms were studied duringfemtosecond laser pulse train ablation of nickel thin lms bythe method of molecular dynamics simulation.31 The femto-second pulse train laser heating metal lm demonstrated theeffects of repetition rate and pulse separation on the abla-tion.32,33 The temporal and spatial variations in the opticalproperties were investigated for pulse train laser heating.34 Theemission enhancement on the plasma from a copper surfaceunder the double-pulse femtosecond laser is studied by meansof a 1D two-temperature equation and the Boltzmann equa-tion.35 These studies investigated the effect of laser energy andpulse separation on the femtosecond double-pulse LIBS. But,many reports indicated that the LIBS may vary with the variouslaser parameters, including laser wavelength, pulse width,intensity, and so on.36–39 The properties of LIBS also depend onthe spot size, as well as the sample position with respect to thedistance between the target and the lens. The sample positioncan inuence the expansion process of the plasma plume due tothe interaction of the plasma plume and the changed laserspatial energy distribution.36,40 The relationship between theconversion efficiency of the extreme-ultraviolet emission andthe spot size was also studied by changing the lens-to-samplesdistance, and a double hump structure was observed duringscanning of the target lens.37 Until now almost no studiesfocused on studying the effect of the sample position on theLIBS signal using the femtosecond double-pulse laser.
In this paper, the emission enhancement on the plasmafrom a silicon surface under the collinear double-pulse femto-second laser was studied by moving the sample position. Theemission signal enhancement was observed in the double-pulseinterpulse delay range from �20 ps to 100 ps. Our resultsshowed that the sample position is found to be important forobtaining the optimal femtosecond double-pulse laser-inducedbreakdown spectroscopy. The study will lead a furtherimprovement to the applications of the double-pulse LIBS.
2 Experimental details
The schematic diagram of the standard pump-probe experi-mental setup is shown in Fig. 1. The laser system is a regener-ative amplied Ti:sapphire laser (Spectra Physics Tsunamioscillator and Spitre amplier). The full-width at halfmaximum (FWHM) is 100 fs, the output maximum energy isabout 300 mJ, the wavelength is 800 nm, and the repetition rateis 1 kHz. The delivered single laser pulse is produced by thecomputer-triggered Pockel cell of the amplier. The individualpulse is splitted into two sub-pulses using a Michelson inter-ferometer. The interpulse delay may be changed from �30 ps to110 ps. By the combination of a Glan laser polarizer and a half-wave plate, the whole energy of each pulse can be attenuated tothe desired value. The subpulses are directed using a beamsplitter into a microscope objective (10�, NA ¼ 0.25), whichfocuses them onto the target material with a focal diameter of7.2 mm. We use a knife edge to measure the beam prole. Thesilicon target is mounted on a computer-controlled X–Y–Z stage,which guarantees that the sample location is new before eachlaser shot (X–Y). The sample Si is positioned with its normal axis
1106 | J. Anal. At. Spectrom., 2014, 29, 1105–1111
at an angle of 30� with respect to the laser beam direction. So,there is an angle of 30� between the Z direction and the laserincident direction. All experiments are performed in air atatmospheric pressure. The each data point is an average oftypically 20 shots. In the experiment, both pump pulses ares-polarized. The plasma emission perpendicular to the laserbeam is collected by an f/2.0 lens, focused into a 0.25 mmonochromator, and detected with a photomultiplier tube(PMT (Hamamatsu, R456)). The voltage of PMT is 1 kV.
3 Results and discussion
In this experiment, we investigated the position of the focalpoint and the diameter of the gaussian beam by the knife-edgemethod.41 The energy was 3.8 mJ and 56.8 mJ, respectively. Theselected emission line was the Si(I) at 288.157 nm, produced bythe 3s22p2 (1D2) ) 3s22p4s (1P1) transition. In order to deter-mine the location of the grating of this monochromator, thegrating was rotated using a stepper motor. Using the oscillo-scope and the computer, we could obtain the detected
This journal is © The Royal Society of Chemistry 2014

Fig. 4 The distribution of the emission intensity with the interpulsedelay of the double-pulse and the position of the sample. The arrow isthe direction of the laser. The evolution of the focal point is from thesample inside to outside. The laser fluence is 139.63 J cm�2. The flu-ence of each sub-pulse is 69.82 J cm�2. The recorded wavelength is288.157 nm.
Paper JAAS
Publ
ishe
d on
13
Mar
ch 2
014.
Dow
nloa
ded
by U
nive
rsité
Lav
al o
n 12
/07/
2014
12:
35:2
2.
View Article Online
spectroscopy of the PMT. The range of the measured spectros-copy was 200–700 nm. Fig. 2 shows the plot of the emissionspectroscopy of femtosecond laser-induced Si plasma. The laseruence is 4.65 J cm�2. And, we recorded the correspondingrelationship between the location of the stepper motor and thewavelength. By this method, the location of the grating wasxed at the wavelength of 288.157 nm.
The spectroscopy emitted from the plasma can be enhancedby changing the interpulse delay of the femtosecond double-pulse. And, the spectroscopy of the plasma is strongly depen-dent on the laser energy and the target properties. The distri-bution of the emission intensity was obtained by moving thetime delay stepper motor and the Z-axis of the three-dimen-sional stage with the sample. The distribution of the emissionintensity produced by femtosecond double-pulse laser-inducedspectroscopy with the different sample position and the inter-pulse delay aer the onset of plasma are given in Fig. 3 and 4.The whole laser uence was 9.29 J cm�2 and 139.63 J cm�2,respectively. The energy of each sub-pulse was 4.65 J cm�2 and69.82 J cm�2, respectively. The measured position of the focalpoint was Z¼ 5.21 mm.When Z was greater than the position ofthe focal point, the focal point was on the outside of the sample.The emission intensity was the integration of the whole plasmaspectroscopy decay at the wavelength of 288.157 nm. It wasobserved (Fig. 3 and 4) that at a relatively high laser uence(139.63 J cm�2 in Fig. 4), the emission intensity was higher thanthe low laser uence (9.29 J cm�2 in Fig. 3), and the decay timeof plasma was longer observed from the oscilloscope. Since thehigh laser energy caused the plasma brighter and its luminositylasted for a longer period of time.42,43 The emission intensitywas enhanced by changing the interpulse delay of the femto-second double-pulse. The mechanism of the plasma emissionenhancement: it was possible that the emission intensity
Fig. 3 The distribution of the emission intensity with the interpulsedelay of the double-pulse and the position of the sample. The arrow isthe direction of the laser. The evolution of the focal point is from thesample inside to outside. The laser fluence is 9.29 J cm�2. The fluenceof each sub-pulse is 4.65 J cm�2. The recorded wavelength is288.157 nm.
This journal is © The Royal Society of Chemistry 2014
increased because more material was ablated from the targetsurface by the femtosecond double-pulse laser as the result ofthe surface transformation excited by the rst pulse; theenhanced effect may be due to the plasma reheating of thesecond pulse; the hydrodynamic effect produced by the rstpulse may change the propagation of the laser pulse and theexpansion of the plasma plume generated by the secondpulse.15,29,30,44–47
For the different sample position, the plasma emissionintensity rstly began to rise with the interpulse delay, and thendropped. At the interpulse delay of the zero point, the emissionintensity was weak compared with the other interpulse delay ofdouble-pulse (Fig. 3 and 4). Fig. 5 shows the emission intensityselected from Fig. 3 with the interpulse delay of the double-pulse at the different position of the sample. The positions areZ ¼ 5.19 mm, Z ¼ 5.20 mm, Z ¼ 5.23 mm, and Z ¼ 5.24 mm,respectively. As seen from this plot, the enhancement of theemission intensity was sensitive to the interpulse delay of thedouble-pulse. We noticed that two main changing regions inFig. 5(a) were distinguished including the increased region andthe decreased region. However, in Fig. 5(b), the emissionintensity monotonically increased with the interpulse delay ofthe double-pulse. The difference between Fig. 5(a) and (b) is theposition of the sample. In the case of the different sampleposition, the sample position can obviously affect the evolutionof the emission intensity with the interpulse delay of thedouble-pulse. So, the emission intensity of the plasma gener-ated by the femtosecond double-pulse laser should be furtherdiscussed.
In order to understand the problem about the effect of thesample position, the emission intensity selected from Fig. 3with the position of the sample at the different interpulse delayof the double-pulse is shown in Fig. 6. As seen from Fig. 6(a), it
J. Anal. At. Spectrom., 2014, 29, 1105–1111 | 1107

Fig. 5 The emission intensity from Fig. 3 with the interpulse delay ofthe double-pulse at the different position of the sample. The position(Z): (a) 5.20 mm, and 5.23 mm; (b) 5.19 mm, Z ¼ 5.24 mm. The laserfluence is 9.29 J cm�2. The fluence of each sub-pulse is 4.65 J cm�2.The recorded wavelength is 288.157 nm.
Fig. 6 The emission intensity from Fig. 3 and 4 with the position of thesample at the different interpulse delay of the double-pulse. Theinterpulse delay is 0 ps, 20 ps, and 60 ps, respectively. The whole laserfluence is 9.29 J cm�2 (a) and 139.63 J cm�2 (b), respectively. Therecorded wavelength is 288.157 nm.
JAAS Paper
Publ
ishe
d on
13
Mar
ch 2
014.
Dow
nloa
ded
by U
nive
rsité
Lav
al o
n 12
/07/
2014
12:
35:2
2.
View Article Online
was interesting to notice that the emission intensity for theinterpulse delay of 60 ps showed a dip at the best focal position(Z ¼ 5.21 mm) compared with the emission for the interpulsedelay of 0 ps and 20 ps. Hence, the optimized emission intensitycan further be obtained at either side of the best focal positionwith the increase of the interpulse delay (this phenomenon canalso be observed in Fig. 3). This revealed that the emissionintensity was slightly away from the best focal position at theinterpulse delay of 60 ps, where the emission was nearly 50%higher than at the best sample position. However, in Fig. 6(b),the higher laser energy was used in the experiment. The resultshowed that the sample-lens scan effect on the emissionintensity was not almost dependent on the interpulse delay ofthe double-pulse. For the different interpulse delay, the trend ofthe intensity was the same with the change in the sampleposition. A similar dip had also been noticed in the vicinity ofthe best focal position. The focal position is not the bestcondition for obtaining the higher plasma emission. Theseresults showed that the emission intensity will not only berelated to the condition of the laser source (such as: delay, laserenergy, laser wavelength, and so on) and the signal detectionsystem but also be related to the sample position.
In femtosecond single-pulse laser ablation, for metals, theabsorption mechanism is the inverse bremsstrahlung (IB)absorption process.48 However, for semiconductors (silicon),the energy of the laser pulse is rst absorbed by the valence
1108 | J. Anal. At. Spectrom., 2014, 29, 1105–1111
band electrons through inter-band absorption because of thelack of free electrons.43 So, different from the metals, the single-photon or multi-photon (MP) absorption is important forfemtosecond irradiation of silicon.43,49,50 The electrons excitedinto the valence band will absorb more energy of the laser pulseby the IB absorption process, similar to the cases in the metals.The absorbed laser energy of the sample can be divided into twoparts: the thermal energy of the electrons and the energyconsumed to overcome the band gap.49 For the femtoseconddouble-pulse laser, the absorption mechanism of the secondpulse is the major IB process. Because, a large number of freeelectrons have been generated by the rst pulse.49 The absorp-tion efficiency of IB is much higher than the absorption effi-ciency of MP.51 So, the second pulse is crucial for theenhancement of the plasma emission based on the plasmareheating mechanism.
In Fig. 3 and 4, the emission intensity can be obviouslydivided into two higher regions. For the higher laser uence of139.63 J cm�2 (Fig. 4), two higher emission regions wereobserved with the sample position in the beginning. Since, thewhole experiment was carried out in air. The nonlinear pulsepropagation problems of the femtosecond laser should beconsidered, many researchers had directly seen the self-focusing or self-defocusing effect by using laser pulse propa-gation through a transparent medium.52–57 These changes in thespatial energy distribution of the laser beam can be caused by
This journal is © The Royal Society of Chemistry 2014

Paper JAAS
Publ
ishe
d on
13
Mar
ch 2
014.
Dow
nloa
ded
by U
nive
rsité
Lav
al o
n 12
/07/
2014
12:
35:2
2.
View Article Online
nonlinear effects resulting from the femtosecond laser beam.58
Hence, the focal length would become shorter due to the self-focusing effect. It indicated that the redistribution of laserspatial energy would change the emission of plasma spectros-copy induced by the plasma reheating of the second femto-second pulse laser.59 The laser intensity of the second pulse wasimportant for the plasma reheating. The higher laser intensitywill lead to stronger plasma emission. The self-focusing or self-defocusing effect will inuence the laser intensity along thelaser incident direction. That was the Z-axis direction of thestage.
Based on the nonlinear propagation theory of a femtosecondoptical pulse, for the rst femtosecond pulse (or single pulse),the index of refraction was expressed as60
n ¼ n0 + n2I � Dn1 (1)
where n0 is the linear index of refraction in air, n2I is the Kerrnonlinear index of refraction, n2 and I are the coefficient of theKerr nonlinear index of refraction and the laser intensity,respectively. The item of the defocusing is Dn1 ¼ 4pe2N1e(t)/2meu0
2, N1e was the time dependent electron density generatedby rst pulse, e and me were the electronic charge and mass,respectively, and u0 was the frequency of the laser pulse. For thesecond femtosecond pulse, the energy was equal to the energyof the rst pulse, and the index of refraction considered theelectron intensity of the rst pulse (Dn1) was expressed as
n ¼ n0 + n2I � Dn2 � Dn1 (2)
where Dn2¼ 4pe2N2e(t)/2meu02 and N2e is the electron density of
the second pulse. The contours (Fig. 3 and 4) clearly showedthat the higher emission of the plasma moved opposite to the
Fig. 7 Schematic diagram of the spatial distribution for the femto-second laser at the different interpulse delay in air: (a) lower laserfluence (9.29 J cm�2), (b) higher laser fluence (139.63 J cm�2). Thesolid line is the focusing situation of the first pulse; the dashed line isthe focusing situation of the second pulse. The horizontal axis is thenormal geometric focal position (Z ¼ 5.22 mm).
This journal is © The Royal Society of Chemistry 2014
laser incident direction. And, the plasma emission produced bythe femtosecond self-focusing or self-defocusing effect in air isobserved in Fig. 4 and 6(b). In this case, the focal position was inthe self-defocusing.
For the lower laser uence (9.29 J cm�2), in Fig. 3, there werenot two higher regions at the shorter interpulse delay index. Therefocusing effect of the second pulse cannot take place due tothe larger defocusing of Dn1 and Dn2. The range was 0 ps to50 ps. When the interpulse delay was greater than 50 ps, twohigher emission intensity regions may be observed. The evolu-tion schematic diagram of the focusing position was shown inFig. 7(a). At the interpulse delay of near 0 ps, the focus positionof the rst femtosecond pulse was in the front of the focalposition based on the large Kerr nonlinear effect. The focusedposition of the second pulse just was at the original focalposition based on the large electron intensity (small index ofrefraction). Since, the rst femtosecond pulse excited the airand generated a large number of electrons.51 At this time,electron density was maximum. According to eqn (2), the elec-tron density was the sum of the electron density produced bythe rst pulse and the second pulse. The index of refraction wasminimum. The second femtosecond pulse focused at the focalposition. At this position, the laser intensity of the second pulsewas maximum, the effect of plasma reheating was the best, andthe intensity of plasma emission was the highest. With theincrease of the interpulse delay of the double-pulse, the electrondensity decreased,51,61 the index of refraction increased, and thefocused position of the second femtosecond pulse movedopposite to the laser incident direction. Until the focusedposition of the second pulse innitely close to the focal point ofthe rst pulse. The intensity of plasma emission on the sampleposition of the Z-axis varied according to the focused position ofthe second pulse. At this moment (about 50–60 ps), the refo-cusing effect can be observed (Fig. 3). Because, for the secondpulse, the item of the nonlinear Kerr effect (n2I) was greater thanthe item of the defocusing (Dn1 and Dn2). At this lower laseruence (9.29 J cm�2), for the interpulse delay of 50–60 ps, theelectron density produced by the rst pulse decayed to a lowervalue at the rst focused position, the absorption of this ioni-zation region for the second pulse can be ignored, and thetransmitted laser energy obviously increased compared with theshorter interpulse delay.62,63 In this case, the refocusing effect ofthe second pulse can take place by the transmitted laser energy.And, the second focused point will appear. So, in the range of50–90 ps, two focused points appeared at the laser direction(Z-axis). In other words, the second pulse had two high laserintensities along the moved position of the sample. Two higheremission regions along the laser direction can be observed.
However, in Fig. 4, at the beginning (Fig. 6(b)), the enhancedplasma emission produced by the focusing and refocusingeffect can be observed. For the higher laser uence(139.63 J cm�2), when the interpulse delay is near 0 ps, althoughthe electron density produced by the rst pulse was very high atthe rst focused position, the transmitted laser energy of thesecond pulse was large enough to generate the refocusing effect(the second focused point appeared) due to the strongnonlinear Kerr effect. Two higher emission regions can be
J. Anal. At. Spectrom., 2014, 29, 1105–1111 | 1109

JAAS Paper
Publ
ishe
d on
13
Mar
ch 2
014.
Dow
nloa
ded
by U
nive
rsité
Lav
al o
n 12
/07/
2014
12:
35:2
2.
View Article Online
observed. With the increase of the time, the electron densitydecreased at the rst focused position, the transmitted laserenergy gradually increased. The nonlinear Kerr effect becamestronger. The index of refraction also became larger. The posi-tion of the refocusing obviously moved opposite to the laserincident direction at the second focused point. The distancebetween the focusing (the rst focused position) and the refo-cusing (the second focused position) decreased with theincrease of the interpulse delay of the double-pulse. The sche-matic diagram is shown in Fig. 7(b). This provided a betterunderstanding about the effect of sample position in femto-second double-pulse LIBS, leading to better conditions forfemtosecond double-pulse LIBS production.
4 Conclusion
In conclusion, the enhancement of plasma emission wasdemonstrated by the femtosecond double-pulse laser-inducedsilicon plasma in air. The enhancement may be furtherincreased by recording the dependence of emission intensity onthe sample position. For the higher laser uence, the optimizedemission intensity can be obtained at either side of the bestfocal position for all interpulse delays of the double-pulse. Forthe lower laser uence, the best sample position will changefrom one side to both sides with the increase of the interpulsedelay of the double-pulse. The observed phenomena can beexplained by the nonlinear propagation of the femtosecondlaser pulse in air. The results may also be used to understandthe better way to optimize femtosecond double-pulse LIBS.
Acknowledgements
This project was supported by the Fundamental ResearchFunds for the Central Universities in China, the Research Fundfor the Doctoral Program of Higher Education in China (Grantno. 20130061110021), the National Basic Research Program ofChina (973 Program, grant no. 2013CB922200), and theNational Natural Science Foundation of China (grant nos10974069, 11374124, and 11034003).
References
1 L. J. Radziemski and D. A. Cremers, Laser-induced plasmasand applications, CRC Press, 1989, vol. 21.
2 K. Y. Yamamoto, D. A. Cremers, M. J. Ferris and L. E. Foster,Appl. Spectrosc., 1996, 50, 222–233.
3 G. Arca, A. Ciucci, V. Palleschi, S. Rastelli and E. Tognoni,Appl. Spectrosc., 1997, 51, 1102–1105.
4 M. Baudelet, L. Guyon, J. Yu, J.-P. Wolf, T. Amodeo,E. Frejafon and P. Laloi, J. Appl. Phys., 2006, 99, 084701.
5 B. Salle, D. A. Cremers, S. Maurice and R. C. Wiens,Spectrochim. Acta, Part B, 2005, 60, 479–490.
6 Z. Hou, Z. Wang, J. Liu, W. Ni and Z. Li, Opt. Express, 2013,21, 15974–15979.
7 Z. Wang, Z. Hou, S.-l. Lui, D. Jiang, J. Liu and Z. Li, Opt.Express, 2012, 20, A1011–A1018.
1110 | J. Anal. At. Spectrom., 2014, 29, 1105–1111
8 A. M. Popov, F. Colao and R. Fantoni, J. Anal. At. Spectrom.,2010, 25, 837–848.
9 W. Zhou, X. Su, H. Qian, K. Li, X. Li, Y. Yu and Z. Ren, J. Anal.At. Spectrom., 2013, 28, 702–710.
10 K. Li, W. Zhou, Q. Shen, Z. Ren and B. Peng, J. Anal. At.Spectrom., 2010, 25, 1475–1481.
11 P. K. Pandey and R. K. Thareja, Phys. Plasmas, 2013, 20,022117.
12 S. Harilal, M. Tillack, B. Oshay, C. Bindhu and F. Najmabadi,Phys. Rev. E: Stat., Nonlinear, So Matter Phys., 2004, 69,026413.
13 C. Pagano and J. Lunney, J. Phys. D: Appl. Phys., 2010, 43,305202.
14 X. Mao, X. Zeng, S.-B. Wen and R. E. Russo, Spectrochim.Acta, Part B, 2005, 60, 960–967.
15 K. Rifai, S. Laville, F. Vidal, M. Sabsabi and M. Chaker,J. Anal. At. Spectrom., 2012, 27, 276–283.
16 L. Guo, B. Zhang, X. He, C. Li, Y. Zhou, T. Wu, J. Park, X. Zengand Y. Lu, Opt. Express, 2012, 20, 1436–1443.
17 H. Sobral, C. Sanchez-Ake, R. Sangines, E. Alvarez-Zauco andK. Jimenez-Duran, J. Phys. D: Appl. Phys., 2011, 44, 085201.
18 I. Choi, X. Mao, J. J. Gonzalez and R. E. Russo, Appl. Phys. A:Mater. Sci. Process., 2013, 1–8.
19 X. Liu, S. Sun, X. Wang, Z. Liu, Q. Liu, P. Ding, Z. Guo andB. Hu, Opt. Express, 2013, 21, A704–A713.
20 R. Le Harzic, D. Breitling, S. Sommer, C. Fohl, K. Konig,F. Dausinger and E. Audouard, Appl. Phys. A: Mater. Sci.Process., 2005, 81, 1121–1125.
21 T. Donnelly, J. Lunney, S. Amoruso, R. Bruzzese, X. Wangand X. Ni, J. Appl. Phys., 2009, 106, 013304.
22 A. Semerok and C. Dutouquet, Thin Solid Films, 2004, 453,501–505.
23 S. Amoruso, R. Bruzzese and X. Wang, Appl. Phys. Lett., 2009,95, 251501.
24 S. Noel and J. Hermann, Appl. Phys. Lett., 2009, 94, 053120.25 S. Noel, E. Axente and J. Hermann, Appl. Surf. Sci., 2009, 255,
9738–9741.26 S. Amoruso, R. Bruzzese, X. Wang, G. O'Connell and
J. Lunney, J. Appl. Phys., 2010, 108, 113302.27 V. Pinon and D. Anglos, Spectrochim. Acta, Part B, 2009, 64,
950–960.28 V. Pinon, C. Fotakis, G. Nicolas and D. Anglos, Spectrochim.
Acta, Part B, 2008, 63, 1006–1010.29 Z. Hu, S. Singha, Y. Liu and R. J. Gordon, Appl. Phys. Lett.,
2007, 90, 131910.30 S. Singha, Z. Hu and R. J. Gordon, J. Appl. Phys., 2008, 104,
113520.31 X. Li, L. Jiang and H.-L. Tsai, J. Appl. Phys., 2009, 106, 064906.32 L. Jiang and H.-L. Tsai, Int. J. Heat Mass Transfer, 2007, 50,
3461–3470.33 A. Chen, Y. Jiang, L. Sui, D. Ding, H. Liu and M. Jin, Opt.
Commun., 2011, 284, 2192–2197.34 H. S. Sim, S. Park, T.-H. Kim, Y. K. Choi, J. S. Lee and
S. H. Lee, Mater. Trans., 2010, 51, 1156–1162.35 J. Guo, T. Wang, J. Shao, T. Sun, R. Wang, A. Chen, Z. Hu,
M. Jin and D. Ding, Opt. Commun., 2012, 285, 1895–1899.36 S. Harilal, J. Appl. Phys., 2007, 102, 123306.
This journal is © The Royal Society of Chemistry 2014
Paper JAAS
Publ
ishe
d on
13
Mar
ch 2
014.
Dow
nloa
ded
by U
nive
rsité
Lav
al o
n 12
/07/
2014
12:
35:2
2.
View Article Online
37 S. Harilal, R. Coons, P. Hough and A. Hassanein, Appl. Phys.Lett., 2009, 95, 221501.
38 J. T. Schiffern, D. W. Doerr and D. R. Alexander, Spectrochim.Acta, Part B, 2007, 62, 1412–1418.
39 Y. Lu, V. Zorba, X. Mao, R. Zheng and R. E. Russo, J. Anal. At.Spectrom., 2013, 28, 743–748.
40 A. Kasperczuk, T. Pisarczyk, M. Kalal, J. Ullschmied,E. Krousky, K. Masek, M. Pfeifer, K. Rohlena, J. Skala andP. Pisarczyk, Appl. Phys. Lett., 2009, 94, 081501.
41 M. A. de Araujo, R. Silva, E. de Lima, D. P. Pereira andP. C. de Oliveira, Appl. Opt., 2009, 48, 393–396.
42 S. Amoruso, C. Altucci, R. Bruzzese, C. De Lisio, N. Spinelli,R. Velotta, M. Vitiello and X. Wang, Appl. Phys. A: Mater. Sci.Process., 2004, 79, 1377–1380.
43 T. Y. Choi and C. P. Grigoropoulos, J. Appl. Phys., 2002, 92,4918–4925.
44 A. De Giacomo, M. Dell'Aglio, D. Bruno, R. Gaudiuso andO. De Pascale, Spectrochim. Acta, Part B, 2008, 63, 805–816.
45 A. De Giacomo, A. De Bonis, M. DellAglio, O. De Pascale,R. Gaudiuso, S. Orlando, A. Santagata, G. Senesi,F. Taccogna and R. Teghil, J. Phys. Chem. C, 2011, 115,5123–5130.
46 S. Beldjilali, W. Yip, J. Hermann, T. Baba-Hamed andA. Belasri, Anal. Bioanal. Chem., 2011, 400, 2173–2183.
47 C. Goueguel, S. Laville, F. Vidal, M. Sabsabi and M. Chaker,J. Anal. At. Spectrom., 2010, 25, 635–644.
48 A. Vorobyev and C. Guo, Opt. Express, 2006, 14, 13113–13119.49 X. Zhao and Y. C. Shin, J. Phys. D: Appl. Phys., 2013, 46,
335501.50 M. Barberoglou, G. Tsibidis, D. Gray, E. Magoulakis,
C. Fotakis, E. Stratakis and P. Loukakos, Appl. Phys. A:Mater. Sci. Process., 2013, 113, 273–283.
This journal is © The Royal Society of Chemistry 2014
51 A. Chen, S. Li, S. Li, Y. Jiang, J. Shao, T. Wang, X. Huang,M. Jin and D. Ding, Phys. Plasmas, 2013, 20, 103110.
52 L. Sudrie, A. Couairon, M. Franco, B. Lamouroux, B. Prade,S. Tzortzakis and A. Mysyrowicz, Phys. Rev. Lett., 2002, 89,186601.
53 A. Couairon, L. Sudrie, M. Franco, B. Prade andA. Mysyrowicz, Phys. Rev. B: Condens. Matter Mater. Phys.,2005, 71, 125435.
54 P. Polynkin, B. Pasenhow, N. Driscoll, M. Scheller,E. M. Wright and J. V. Moloney, Phys. Rev. A: At., Mol., Opt.Phys., 2012, 86, 043410.
55 A. Couairon, Phys. Rev. A: At., Mol., Opt. Phys., 2003, 68,015801.
56 P. Polynkin and J. V. Moloney, Appl. Phys. Lett., 2011, 99,151103.
57 G. S. He, A. P. Zhang, Q. Zheng, H.-Y. Qin, P. N. Prasad, S. Heand H. Agren, Quantum Electron., 2009, 45, 816–824.
58 A. Couairon and A. Mysyrowicz, Phys. Rep., 2007, 441, 47–189.
59 X. Li, W.Wei, J. Wu, S. Jia and A. Qiu, J. Appl. Phys., 2013, 113,243304.
60 S. L. Chin, Femtosecond laser lamentation, Springer, 2010,vol. 55.
61 T. B. Petrova, H. Ladouceur and A. Baronavski, Phys.Plasmas, 2008, 15, 053501.
62 A. Kumar, D. Dahiya and A. Sharma, Phys. Plasmas, 2011, 18,023102.
63 J. Papeer, D. Gordon, P. Sprangle, M. Botton and A. Zigler,Appl. Phys. Lett., 2013, 103, 244102.
J. Anal. At. Spectrom., 2014, 29, 1105–1111 | 1111