Embed Size (px)
Citation preview
Effect of rainfall and tillage direction on the evolution
of surface crusts, soil hydraulic properties and runoff generation
for a sandy loam soil
Babacar Ndiaye1, Michel Esteves*, Jean-Pierre Vandervaere,Jean-Marc Lapetite, Michel Vauclin
Laboratoire d’etude des Transferts en Hydrologie et Environnement (LTHE, UMR 5564, CNRS, INPG, IRD, UJF)
BP 53 F-38041 Grenoble Cedex 9, France
Received 29 July 2003; revised 6 October 2004; accepted 25 October 2004
Abstract
The study was aimed at evaluating the effect of rainfall and tillage-induced soil surface characteristics on infiltration and runoff
on a 2.8 ha catchment located in the central region of Senegal. This was done by simulating 30 min rain storms applied at a
constant rate of about 70 mm hK1, on 10 runoff micro-plots of 1 m2, five being freshly harrowed perpendicularly to the slope and
five along the slope (1%) of the catchment. Runoff was automatically recorded at the outlet of each plot. Hydraulic properties such
as capillary sorptivity and hydraulic conductivity of the sandy loam soil close to saturation were determined by running 48
infiltration tests with a tension disc infiltrometer. That allowed the calculation of a mean characteristic pore size hydraulically
active and a time to ponding. Superficial water storage capacity was estimated using data collected with an electronic relief meter.
Because the soil was subject to surface crusting, crust-types as well as their spatial distribution within micro-plots and their
evolution with time were identified and monitored by taking photographs at different times after tillage. The results showed that
the surface crust-types as well as their tillage dependent dynamics greatly explain the decrease of hydraulic conductivity and
sorptivity as the cumulative rainfall since tillage increases. The exponential decaying rates were found to be significantly greater
for the soil harrowed along the slope (where the runoff crust-type covers more than 60% of the surface after 140 mm of rain) than
across to the slope (where crusts are mainly of structural (60%) and erosion (40%) types). That makes ponding time smaller and
runoff more important. Also it was shown that soil hydraulic properties after about 160 mm of rain were close to those of untilled
plot not submitted to any rain. That indicates that the effects of tillage are short lived.
q 2004 Elsevier B.V. All rights reserved.
Keywords: Tillage direction; Soil crusting; Rainfall simulation; Tension disc infiltrometer; Ponding time; Senegal
0022-1694/$ - see front matter q 2004 Elsevier B.V. All rights reserved.
doi:10.1016/j.jhydrol.2004.10.016
* Corresponding author. Fax: C33 476 82 5286.
E-mail address: [email protected] (M. Esteves).1 Present address: Departement de Genie Civil, Ecole Superieure
Polytechnique, BP A 10 Thies, Senegal.
1. Introduction
Infiltration is the process of water penetration
through the soil surface. Its evolution during rainfall
determines the available water quantity for runoff
Journal of Hydrology 307 (2005) 294–311
www.elsevier.com/locate/jhydrol

Nomenclature
A soil treatment harrowing tillage across the
slope (t)
a radius of the tension disc infiltrometer (L)
B soil treatment harrowing tillage along the
slope (s)
b parameter (0.55)
C untilled soil treatment
CR cumulative rainfall depth since tillage (L)
Cr runoff coefficient (–)
DEP depositional crust-type (–)
ERO erosion crust-type (–)
g gravitational acceleration (LTK2)
I cumulative infiltration depth (L)
K soil hydraulic conductivity (LTK1)
q volumetric flux density (LTK1)
R rain intensity (LTK1)
RUN runoff crust-type (–)
S capillary sorptivity (LTK1/2)
SIF steady-state flux density emanating from
the disc infiltrometer (LTK1)
SSC surface water storage capacity (L)
STR structural crust type (–)
t time (T)
Tp ponding time (T)
Tr time of appearance of flow at the outlet of
runoff plots (T)
b parameter (0.6)
g constant (0.75)
q volumetric water content (L3LK3)
lc capillary length scale (L)
lm ‘mean’ pore size (L)
rw specific mass of water (MLK3)
s water-soil surface tension (MTK2)
B. Ndiaye et al. / Journal of Hydrology 307 (2005) 294–311 295
and for soil moisture to nourish plants between two
rains. In dry tropical regions, superficial pellicular
features that strongly affect the hydraulic properties of
surface horizons mostly control the soil infiltration
capacity and consequently, runoff and soil water
erosion. In the Sine Saloum region of Senegal, this
phenomenon maintains a low level of soil organic
matter and hinders all improvements of plant
productivity.
In the case of cultivated soils tillage is one of the
main factors that strongly modifies surface-soil
physical and hydraulic properties (e.g. Burwell et al.,
1966; Allmaras et al., 1967) and has a major influence
on the hydrology of an agricultural system (Rawls et
al., 1980; Ahuja et al., 1998). It affects infiltration by
increasing the plough layer porosity (and hence the
moisture storage volume and water movement at high
water content) and surface roughness (and therefore
surface depression storage), and weakens soil struc-
ture. However, studies show that tillage effects are not
always consistent. For example Logsdon et al. (1990)
and Reynolds et al. (1995) reported that tillage
disrupted the continuity of pores from the surface. In
another study, Logsdon et al. (1993) found that no
tillage resulted in faster ponded infiltration rates than
did chisel or mouldboard plough. On the other hand,
Ankeny et al. (1990) found little impact of tillage on
infiltration rates. Meek et al. (1992) showed that
tillage between crops increased the infiltration in
trafficked soil but decreased the rate or had no effect on
non-trafficked one.
Other important aspect of tillage in relation to
infiltration is the development of surface crusts which
sharply decrease both the infiltration rate and the soil
water content and trigger runoff and soil erosion
(McIntyre, 1958; Casenave and Valentin, 1992;
Bielders et al., 1996, among many others). The
crusting in turn is dependent on soil properties,
rainfall characteristics and initial soil conditions
(Allmaras et al., 1967; Sumner and Steward, 1992).
Tension disc infiltrometers have extensively been
used to characterise both soil macroporosity (Watson
and Luxmoore, 1986; Wilson and Luxmoore, 1988;
Dunn and Phillips, 1991; Everts and Kanwar, 1993;
Logsdon et al., 1993; Lin and McInnes, 1995;
Mohanty et al., 1996) and hydraulic properties of
non-crusted soils (Clothier and White, 1981; Perroux
and White, 1988; Smettem and Clothier, 1989;
Ankeny et al., 1991; Reynolds and Elrick, 1991;
Thony et al., 1991; Vauclin and Chopart, 1992;
Logsdon and Jaynes, 1993) as well as of crusted soils
(i.e. Vandervaere et al., 1997). Tension infiltrometer

B. Ndiaye et al. / Journal of Hydrology 307 (2005) 294–311296
have also been used to determine tillage effects on
spatial and temporal variations of soil hydraulic
properties. Most field studies have been conducted
at the soil surface for one tillage system and for one
time (Watson and Luxmoore, 1986; Jarvis et al., 1987;
Ankeny et al., 1991; Thony et al., 1991; Everts and
Kanwar, 1993; Mohanty et al., 1994, 1996). Other
studies have considered different tillage systems (i.e.
Ankeny et al., 1990; Sauer et al., 1990; Dunn and
Phillips, 1991; Vauclin and Chopart, 1992; Chan and
Heenan, 1993; Murphy et al., 1993). A relatively few
studies were focused on temporal variations occurring
on the soil surface due to weathering (i.e. Mapa et al.,
1986; Freebairn et al., 1989; Messing and Jarvis,
1993; Angulo-Jaramillo et al., 1997; Azevedo et al.,
1998). Weathering in this context refers to changes in
surface characteristics due to rainfall, wetting and
drying.
The objectives of the paper are threefold: (i) to
describe the influence of tillage and rainfall energy
upon infiltration into a sandy loam crusting soil from
the central region of Senegal, cumulative rainfall
since tillage being used as an index of rainfall energy;
(ii) to quantify the resulting evolution of some soil
surface hydraulic properties close to saturation, such
as capillary sorptivity, hydraulic conductivity, mean
characteristic pore size as well as time to ponding, and
(iii) to propose an interpretation of the result in light
of the surface crusting dynamics.
2. Materials and methods
2.1. Site description
The study consisted in measuring field infiltration
using simulated rainfall and tension disc infiltrometry
on a range of surface conditions after variable
amounts of rainfall since tillage. The experiment
was conducted on a sandy loam on the Thysse-
Kaymor catchment located in the Senegalese ground-
nut belt (central part of Senegal). The mean annual
rainfall amount is 660 mm with approximately 8
months (October–May) without rain. The mean
annual potential evapotranspiration is 2200 mm.
Summer corresponds to the rainy season with intense
storms and maximum precipitation and runoff. The
catchment (2.8 ha) has a very regular slope close to
1%. It presents a slightly incised and rather broad
thalweg (Fig. 1a). Soil texture is homogeneous down
to 0.2 m depth and correspond to a sandy loam soil
with less than 0.5% organic matter at 0–0.1 m
(Table 1). In this horizon, the mean bulk density is
1.5 (G0.07) (g cmK3). The amount of gravel (ranging
from 5 to 30% in the first 20 cm) increases with depth
to reach 50–60% at 0.45 m where a ferralitic harden
layer is present. Soil surface is subject to develop
crusting caused by rainfall. The catchment is mainly
cropped with groundnut and millet during the rainy
season (June–October).
2.2. Experiments description
Three sites (A, B, C) were selected in the
catchment (Fig. 1a). Sites A and B (28 m long, 5 m
wide, see Fig. 1b) located in a field with groundnut
grown during the rainy season 1998 ended in
September were conventionally tilled on December
with a horse driven harrow to a depth of 7 cm. Tillage
was made perpendicular to the slope for site A and
along the slope for site B. Site C (Fig. 1a) was selected
in a field previously cropped with millet, with no
tillage since the harvest in October 1998.
In the following and for the sake of simplicity
tillage treatments on sites A and B will be noted,
respectively (t slope) and (s slope). On both
treatments A and B simulated rainfall was applied
on plots (1!1 m) bordered by a thin metal sheet
driven to a 0.10 m depth. On each treatment, 5 plots
labelled N from 1 to 5 received N consecutive
simulated rains of about 70 mm hK1 during 30 min.
Micro-plots 1A and 1B received one rainfall, 2A and
2B received two rainfalls, 3A and 3B received three
rainfalls and so on. The time interval between
consecutive rainfalls was 1 week which corresponds
to the necessary time to dry the soil surface horizon.
So, a total of 30 rainfall simulation runs were made for
the study. The rainfall simulator was a 4 m high tower
equipped with a Laechler nozzle (# 461.008.30)
mounted at 3.86 m above the soil surface. For all
the experiments the water pressure was maintained
constant at 70 kPa and the corresponding sprinkled
area was a square of 2 m by 2 m. The amount of
rainfall reaching the soil surface was measured with
four collecting cans (5.5 cm diameter) located at the
four corners of each micro-plot. Runoff was collected
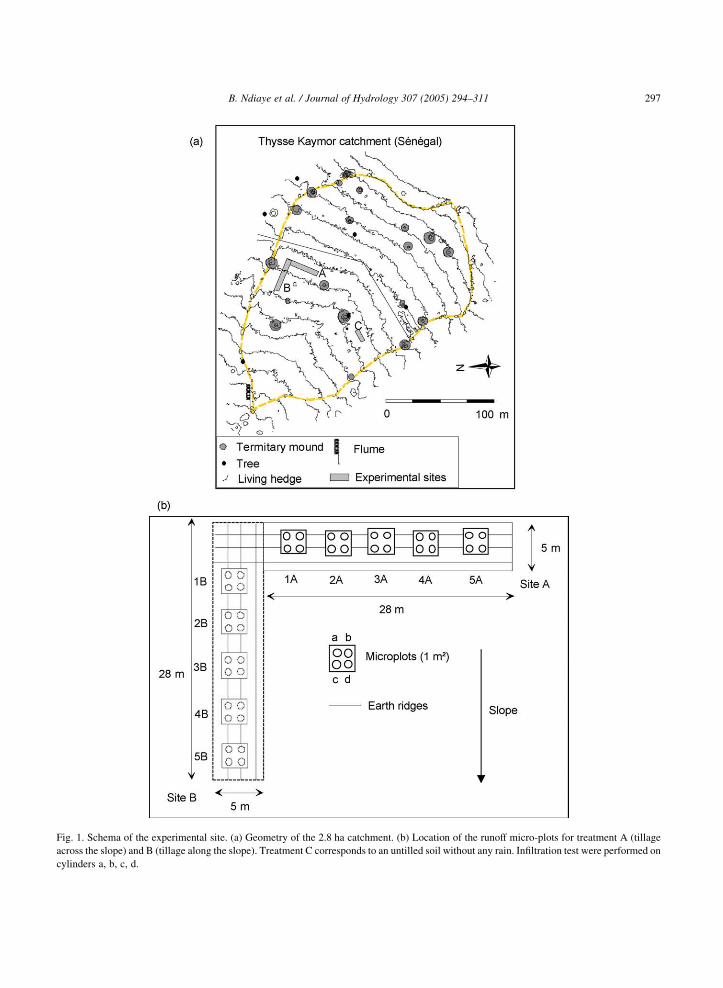
Fig. 1. Schema of the experimental site. (a) Geometry of the 2.8 ha catchment. (b) Location of the runoff micro-plots for treatment A (tillage
across the slope) and B (tillage along the slope). Treatment C corresponds to an untilled soil without any rain. Infiltration test were performed on
cylinders a, b, c, d.
B. Ndiaye et al. / Journal of Hydrology 307 (2005) 294–311 297
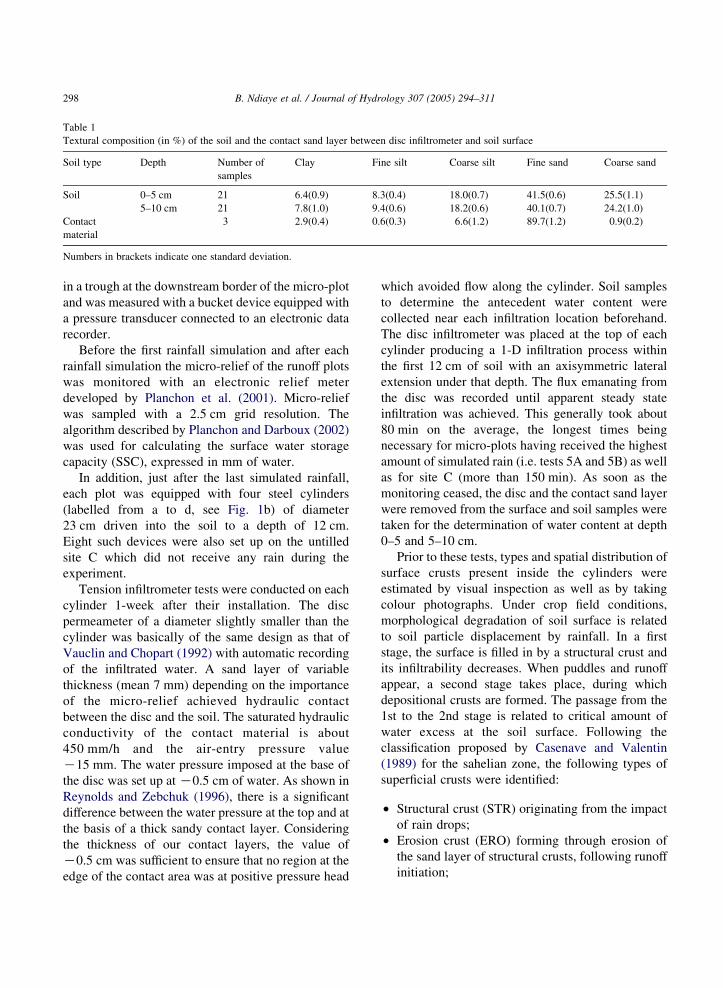
Table 1
Textural composition (in %) of the soil and the contact sand layer between disc infiltrometer and soil surface
Soil type Depth Number of
samples
Clay Fine silt Coarse silt Fine sand Coarse sand
Soil 0–5 cm 21 6.4(0.9) 8.3(0.4) 18.0(0.7) 41.5(0.6) 25.5(1.1)
5–10 cm 21 7.8(1.0) 9.4(0.6) 18.2(0.6) 40.1(0.7) 24.2(1.0)
Contact
material
3 2.9(0.4) 0.6(0.3) 6.6(1.2) 89.7(1.2) 0.9(0.2)
Numbers in brackets indicate one standard deviation.
B. Ndiaye et al. / Journal of Hydrology 307 (2005) 294–311298
in a trough at the downstream border of the micro-plot
and was measured with a bucket device equipped with
a pressure transducer connected to an electronic data
recorder.
Before the first rainfall simulation and after each
rainfall simulation the micro-relief of the runoff plots
was monitored with an electronic relief meter
developed by Planchon et al. (2001). Micro-relief
was sampled with a 2.5 cm grid resolution. The
algorithm described by Planchon and Darboux (2002)
was used for calculating the surface water storage
capacity (SSC), expressed in mm of water.
In addition, just after the last simulated rainfall,
each plot was equipped with four steel cylinders
(labelled from a to d, see Fig. 1b) of diameter
23 cm driven into the soil to a depth of 12 cm.
Eight such devices were also set up on the untilled
site C which did not receive any rain during the
experiment.
Tension infiltrometer tests were conducted on each
cylinder 1-week after their installation. The disc
permeameter of a diameter slightly smaller than the
cylinder was basically of the same design as that of
Vauclin and Chopart (1992) with automatic recording
of the infiltrated water. A sand layer of variable
thickness (mean 7 mm) depending on the importance
of the micro-relief achieved hydraulic contact
between the disc and the soil. The saturated hydraulic
conductivity of the contact material is about
450 mm/h and the air-entry pressure value
K15 mm. The water pressure imposed at the base of
the disc was set up at K0.5 cm of water. As shown in
Reynolds and Zebchuk (1996), there is a significant
difference between the water pressure at the top and at
the basis of a thick sandy contact layer. Considering
the thickness of our contact layers, the value of
K0.5 cm was sufficient to ensure that no region at the
edge of the contact area was at positive pressure head
which avoided flow along the cylinder. Soil samples
to determine the antecedent water content were
collected near each infiltration location beforehand.
The disc infiltrometer was placed at the top of each
cylinder producing a 1-D infiltration process within
the first 12 cm of soil with an axisymmetric lateral
extension under that depth. The flux emanating from
the disc was recorded until apparent steady state
infiltration was achieved. This generally took about
80 min on the average, the longest times being
necessary for micro-plots having received the highest
amount of simulated rain (i.e. tests 5A and 5B) as well
as for site C (more than 150 min). As soon as the
monitoring ceased, the disc and the contact sand layer
were removed from the surface and soil samples were
taken for the determination of water content at depth
0–5 and 5–10 cm.
Prior to these tests, types and spatial distribution of
surface crusts present inside the cylinders were
estimated by visual inspection as well as by taking
colour photographs. Under crop field conditions,
morphological degradation of soil surface is related
to soil particle displacement by rainfall. In a first
stage, the surface is filled in by a structural crust and
its infiltrability decreases. When puddles and runoff
appear, a second stage takes place, during which
depositional crusts are formed. The passage from the
1st to the 2nd stage is related to critical amount of
water excess at the soil surface. Following the
classification proposed by Casenave and Valentin
(1989) for the sahelian zone, the following types of
superficial crusts were identified:
†
Structural crust (STR) originating from the impactof rain drops;
†
Erosion crust (ERO) forming through erosion ofthe sand layer of structural crusts, following runoff
initiation;
B. Ndiaye et al. / Journal of Hydrology 307 (2005) 294–311 299
†
Runoff crust (RUN) resulting from depositionunder running water conditions of material eroded
from upslope;
†
Depositional crust (DEP) corresponding to thesedimentation of particles in still water.
For the RUN and DEP crust types, the deposition
occurs on the top of the initial structural crust.
2.3. Infiltration data analysis
Vandervaere et al. (2000a) have shown that the
transient regime of axisymmetric infiltration from a
tension disc infiltrometer is adequately described by a
two-term equation similar to the Philip’s (1957) one-
dimensional vertical infiltration equation:
I Z C1
ffiffiffiffiffiffitC
pC2t (1)
where I is cumulative infiltration depth (L), t is time
(T).
The coefficients C1 and C2 can be represented, as
proposed by Haverkamp et al. (1994), by the
following expressions:
C1 Z S (2)
C2 Z2 Kb
3K C
gS2
aðq0 KqnÞ(3)
where S is the capillary sorptivity (LTK1/2), K is the
hydraulic conductivity (LTK1), a is the disc radius (L)
and q is the volumetric water content (L3LK3). The
subscripts n and 0 refer, respectively, to initial and
boundary conditions. In Eq. (3) b is a parameter lying
in the interval [0,1]. It can be set to 0.6 (Vandervaere
et al., 2000b). From comparison with experimental
data, Smettem et al. (1994) showed that an appropriate
value for g is a constant equal to 0.75.
All the infiltrometer tests were analysed by the so-
called ‘Differentiated Linearisation’ method (Vander-
vaere et al., 1997) which was shown to be robust
(Vandervaere et al., 2000a). The method consists in
differentiating Eq. (1) with respect toffiffit
p:
dI
dffiffit
p Z C1 C2C2
ffiffit
p(4)
and fitting Eq. (4) to the experimental data as a
function offfiffiffiti
p; DIi and D
ffiffiffiti
pbeing approximated by
finite differences.
The intercept gives an unbiased estimation of
sorptivity (Eq. (2)) and the hydraulic conductivity is
inferred from the slope of the regression line:
K Z3
2 KbC2 K
gC21
aðq0 KqnÞ
� �(5)
The infiltration tests having been performed at the
top of cylinders inserted into the soil, the lateral
effects (second part of term in bracket of Eq. (5)) has
been neglected and K was approximated by:
K Z3
2 KbC2 (6)
with bZ0.6.
As an example, Fig. 2 presents the raw data of an
infiltration test (measured flux emanating from the
disc infiltrometer and cumulative infiltration) per-
formed on the micro-plot 2A (t slope), cylinder b
(Fig. 2a) as well as the corresponding relation
between dI=dffiffit
pand
ffiffit
p(Fig. 2b). The non-linear
behaviour of the early time data is due to the effect of
the sand contact layer lying between the base of the
disc and the soil surface. Such points have been
systematically excluded from the analysis of all the
experiments. It is worthwhile to note that the
behaviour observed in Fig. 2b is quite similar to that
theoretically simulated by Vandervaere et al. (2000a)
(see their Fig. 2d).
The measured hydraulic properties S and K also
allow calculation of a capillary length scale lc (L)
which can be estimated (Philip, 1985; White and
Sully, 1987) by:
lc ZbS2
ðq0 KqnÞðK KKnÞ(7)
where b is a parameter taken as bZ0.55 (White and
Sully, 1987; Warrick and Broadbridge, 1992). The
soil prior to the infiltration tests was dry enough to
neglect KnZK(qn).
From lc and by using capillary theory, Philip (1985)
inferred a ‘mean’ characteristic pore size lm (L):
lm Zs
rwglc
(8)
where s is the surface tension (MTK2), rw is the density
of water (MLK3) and g is the gravitational acceleration
(LTK2).

Fig. 2. Example of infiltration test performed on cylinder b of the micro-plot 2A. (a) Raw data of flux (q) and cumulative infiltration (I) as a
function of time. (b) Transformed data by the differentiated linearisation method to calculate sorptivity and hydraulic conductivity.
B. Ndiaye et al. / Journal of Hydrology 307 (2005) 294–311300
Introducing Eq. (7) into Eq. (8) with sZ72!10K5 M mK1 at 25 8C leads to:
lm Z 13:3ðq0 KqnÞK
S2(9)
The larger lm, the greater the effect of gravity
compared to capillarity, as the infiltration driving
force.
Knowledge of sorptivity and hydraulic conduc-
tivity close to saturation allows to calculate the time
(Tp) for which the soil surface reaches saturation
under a constant intensity rainfall (R) greater than the
field saturated conductivity. For a hortonian process,
all the water infiltrates before Tp and beyond it, only a
fraction of the rain enters the soil and the other part
accumulates on the surface and/or runs. Boulier et al.
(1987) showed that Tp lies between a minimum
and a maximum value given respectively by:
TpminZ
1
2
S2
RKln
R
R KK
� �(10a)
TpmaxZ
1
2
S2
RðR KKÞ(10b)
with ROK
When Tpmin and Tpmax are not too much different
the best estimate of Tp was shown to be given by the
geometric mean of the two limits (Boulier et al., 1987;
Hogarth et al., 1991). In the study we took TpZTpmax
because the rain intensity was only slightly larger than
K making Tpmin values of the order of tenth of
seconds.
The Least Significant Difference Test was used
after an analysis of variance to compare the results.
Least Significant Difference (LSD) test is a statistical
procedure that determines whether the difference
B. Ndiaye et al. / Journal of Hydrology 307 (2005) 294–311 301
found between two tests is due to the tested effect or
the difference is simply due to randomness. For each
set of data, a value termed the LSD is calculated at a
chosen level of significance. If the difference between
the mean of the two tests is greater than this calculated
value then it is said to be a ‘significant difference’ or a
difference not due to random chance.
3. Results and discussion
3.1. Simulated rainfall experiments
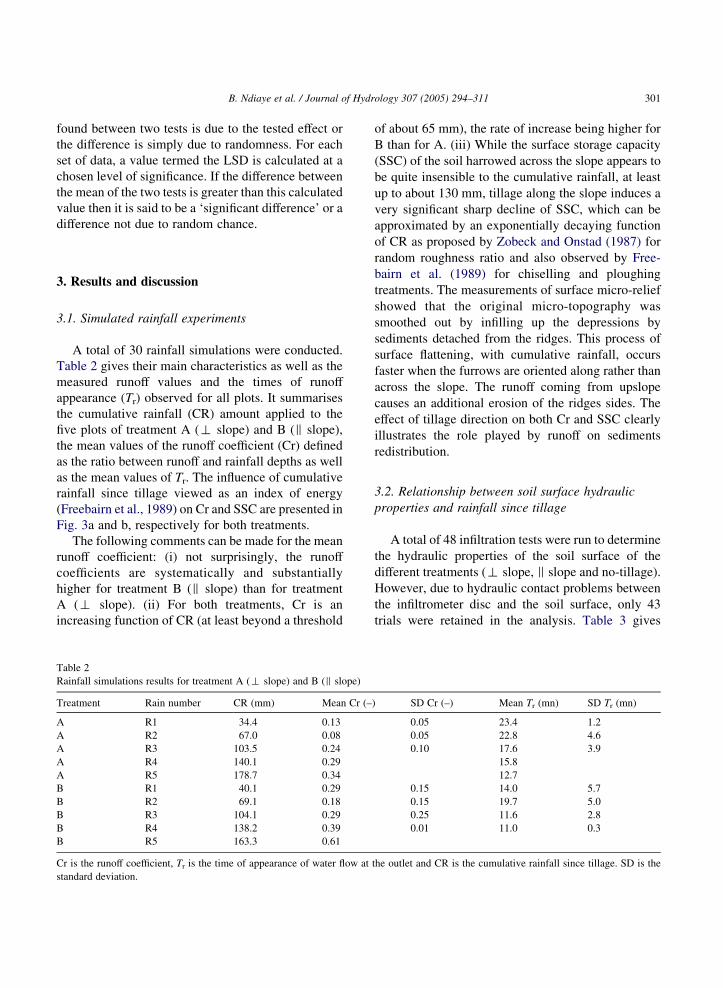
A total of 30 rainfall simulations were conducted.
Table 2 gives their main characteristics as well as the
measured runoff values and the times of runoff
appearance (Tr) observed for all plots. It summarises
the cumulative rainfall (CR) amount applied to the
five plots of treatment A (t slope) and B (s slope),
the mean values of the runoff coefficient (Cr) defined
as the ratio between runoff and rainfall depths as well
as the mean values of Tr. The influence of cumulative
rainfall since tillage viewed as an index of energy
(Freebairn et al., 1989) on Cr and SSC are presented in
Fig. 3a and b, respectively for both treatments.
The following comments can be made for the mean
runoff coefficient: (i) not surprisingly, the runoff
coefficients are systematically and substantially
higher for treatment B (s slope) than for treatment
A (t slope). (ii) For both treatments, Cr is an
increasing function of CR (at least beyond a threshold
Table 2
Rainfall simulations results for treatment A (t slope) and B (s slope)
Treatment Rain number CR (mm) Mean Cr (–
A R1 34.4 0.13
A R2 67.0 0.08
A R3 103.5 0.24
A R4 140.1 0.29
A R5 178.7 0.34
B R1 40.1 0.29
B R2 69.1 0.18
B R3 104.1 0.29
B R4 138.2 0.39
B R5 163.3 0.61
Cr is the runoff coefficient, Tr is the time of appearance of water flow at
standard deviation.
of about 65 mm), the rate of increase being higher for
B than for A. (iii) While the surface storage capacity
(SSC) of the soil harrowed across the slope appears to
be quite insensible to the cumulative rainfall, at least
up to about 130 mm, tillage along the slope induces a
very significant sharp decline of SSC, which can be
approximated by an exponentially decaying function
of CR as proposed by Zobeck and Onstad (1987) for
random roughness ratio and also observed by Free-
bairn et al. (1989) for chiselling and ploughing
treatments. The measurements of surface micro-relief
showed that the original micro-topography was
smoothed out by infilling up the depressions by
sediments detached from the ridges. This process of
surface flattening, with cumulative rainfall, occurs
faster when the furrows are oriented along rather than
across the slope. The runoff coming from upslope
causes an additional erosion of the ridges sides. The
effect of tillage direction on both Cr and SSC clearly
illustrates the role played by runoff on sediments
redistribution.
3.2. Relationship between soil surface hydraulic
properties and rainfall since tillage
A total of 48 infiltration tests were run to determine
the hydraulic properties of the soil surface of the
different treatments (t slope, s slope and no-tillage).
However, due to hydraulic contact problems between
the infiltrometer disc and the soil surface, only 43
trials were retained in the analysis. Table 3 gives
) SD Cr (–) Mean Tr (mn) SD Tr (mn)
0.05 23.4 1.2
0.05 22.8 4.6
0.10 17.6 3.9
15.8
12.7
0.15 14.0 5.7
0.15 19.7 5.0
0.25 11.6 2.8
0.01 11.0 0.3
the outlet and CR is the cumulative rainfall since tillage. SD is the
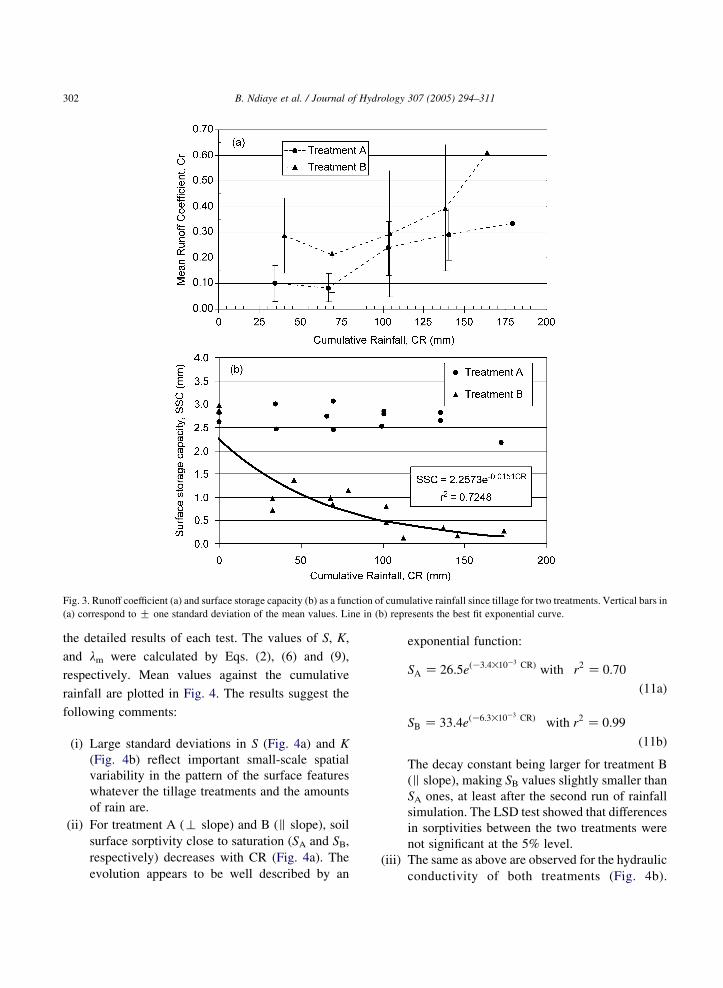
Fig. 3. Runoff coefficient (a) and surface storage capacity (b) as a function of cumulative rainfall since tillage for two treatments. Vertical bars in
(a) correspond to G one standard deviation of the mean values. Line in (b) represents the best fit exponential curve.
B. Ndiaye et al. / Journal of Hydrology 307 (2005) 294–311302
the detailed results of each test. The values of S, K,
and lm were calculated by Eqs. (2), (6) and (9),
respectively. Mean values against the cumulative
rainfall are plotted in Fig. 4. The results suggest the
following comments:
(i)
Large standard deviations in S (Fig. 4a) and K(Fig. 4b) reflect important small-scale spatial
variability in the pattern of the surface features
whatever the tillage treatments and the amounts
of rain are.
(ii)
For treatment A (t slope) and B (s slope), soilsurface sorptivity close to saturation (SA and SB,
respectively) decreases with CR (Fig. 4a). The
evolution appears to be well described by an
exponential function:
SA Z 26:5eðK3:4!10K3 CRÞ with r2 Z 0:70
(11a)
SB Z 33:4eðK6:3!10K3 CRÞ with r2 Z 0:99
(11b)
The decay constant being larger for treatment B
(s slope), making SB values slightly smaller than
SA ones, at least after the second run of rainfall
simulation. The LSD test showed that differences
in sorptivities between the two treatments were
not significant at the 5% level.
(iii)
The same as above are observed for the hydraulicconductivity of both treatments (Fig. 4b).

Table 3
Infiltration tests results. Difference between initial and final soil water content (Delta theta), steady-state flux density (SIF) emanating from the
disc, capillary sorptivity (S), hydraulic conductivity (K) and mean pore dimension (Lamda m) obtained from 48 runs
Test number (–) Delta theta (–) SIF (mm/s) S (mm hK0.5) K (mm/h) Lamda m (micron)
1Aa 0.243 0.0079 19.17 65.2 608
1Ab Experimental problems
1Ac 0.243 0.0078 23.90 44.8 269
1Ad 0.263 0.0069 18.38 53.8 590
1Ba 0.253 0.0103 27.53 82.4 388
1Bb Experimental problems
1Bc 0.261 0.0110 29.48 61.5 260
1Bd 0.237 0.0072 22.47 49.7 328
2Aa 0.247 0.0068 22.22 74.0 522
2Ab 0.224 0.0092 30.09 54.9 191
2Ac 0.286 0.0050 15.23 38.7 672
2Ad 0.261 0.0067 30.03 58.7 239
2Ba 0.190 0.0061 22.54 51.8 274
2Bb 0.203 0.0073 24.59 57.7 273
2Bc 0.286 0.0054 21.10 36.1 327
2Bd 0.293 0.0060 20.39 34.9 346
3Aa 0.250 0.0052 14.57 47.5 790
3Ab Experimental problems
3Ac 0.270 0.0081 17.77 59.4 716
3Ad 0.279 0.0083 23.30 57.3 415
3Ba 0.231 0.0040 18.08 7.3 73
3Bb 0.196 0.0046 17.06 34.0 322
3Bc 0.217 0.0098 14.18 27.2 413
3Bd 0.171 0.0044 17.20 15.2 124
4Aa 0.310 0.0068 18.24 42.3 555
4Ab 0.255 0.0058 23.72 43.8 280
4Ac 0.270 0.0059 15.82 49.9 759
4Ad 0.236 0.0043 13.52 36.5 665
4Ba 0.222 0.0025 9.91 20.1 641
4Bb 0.238 0.0042 13.44 31.1 579
4Bc 0.245 0.0019 12.34 3.1 71
4Bd 0.235 0.0050 19.64 19.5 167
5Aa 0.217 0.0022 9.45 11.6 398
5Ab 0.234 0.0091 19.33 52.9 468
5Ac 0.231 0.0056 13.45 55.4 996
5Ad 0.242 0.0064 12.14 68.1 1577
5Ba 0.249 0.0027 16.35 7.8 102
5Bb Experimental problems
5Bc 0.233 0.0027 12.27 21.7 472
5Bd 0.213 0.0014 6.24 12.5 964
Ca 0.272 0.0035 14.19 65.9 1251
Cb 0.253 0.0032 19.21 13.3 128
Cc 0.273 0.0051 18.14 29.9 349
Cd 0.272 0.0029 18.12 17.9 210
Ce Experimental problems
Cf 0.285 0.0128 30.47 97.2 420
Cg 0.252 0.0027 28.46 68.9 301
Ch 0.253 0.0062 18.73 28.8 293
B. Ndiaye et al. / Journal of Hydrology 307 (2005) 294–311 303
The rate of decrease is more important for
treatment B (s slope) (mean values of KB
varying from about 65 to 14 mm hK1) than for
A (t slope) for which KA just declines from
about 55 to 48 mm hK1. Application of the LSD
test to these results showed that differences in
hydraulic conductivities between the two treat-
ments were significant at the 5% level after

Fig. 4. Soil hydraulic properties as a function of cumulative rainfall since tillage for the three treatments. (a) Sorptivity; (b) hydraulic
conductivity; (c) ‘mean’ pore size. Lines of (a) and (b) represent the best fit exponential curves Eqs. (11a), (11b), (12a) and (12b)). Vertical bars
correspond to G one standard deviation of the mean values.
B. Ndiaye et al. / Journal of Hydrology 307 (2005) 294–311304
B. Ndiaye et al. / Journal of Hydrology 307 (2005) 294–311 305
a cumulative rainfall of 100 mm. This supports
the findings of Rao et al. (1998) who observed
the same evolutions and differences on an Indian
crusting soil of the same type submitted to
similar climatic conditions as encountered in our
study. As for sorptivities, the variations of
hydraulic conductivities with CR can be approxi-
mated by exponential functions, a better fit being
obtained for the KB values:
KA Z 60:9eðK1:7!10K3 CRÞ with r2 Z 0:61
(12a)
KB Z 93:2eðK1:17!10K2 CRÞ with r2 Z 0:94
(12b)
(iv)
Values of S and K for the no-tilled (site C, seeFig. 1) and treatment A (t slope) are close to
each other. That indicates that the effect of
conventional tillage (t slope) on infiltration is
no more significant after receiving a cumulative
rainfall of 163 mm. These evolutions are in
agreement with the findings of Mwendra and
Feyen (1993) who showed that infiltration into
freshly tilled soils was best described by
exponentially decaying functions in which sur-
face conditions and properties, rather than
profile, control the infiltration process.
(v)
On the contrary, the ‘mean’ characteristic poresize lm increases with cumulative rainfall, both
the values and the rates of increase being larger
for the treatment A (t slope) than for the B (sslope) one (Fig. 4c). This indicates that the
gravity effect (as compared to the capillarity
effect) on the infiltration would be more import-
ant for the former than for the latter treatment.
This result is well consistent with the results given
in Fig. 4a and b.
Introducing Eqs (11a), (11b), (12a) and (12b) into
Eq. (9) gives the following relations:
lA Z 277eð5:1!10K3 CRÞ (13a)
lB Z 267eð0:9!10K2 CRÞ (13b)
(lA and lB are in mm) which are plotted in Fig. 4c.
They fit reasonably well, especially for treatment B,
the lm values obtained straightforwardly by using Eq.
(9) alone. Eqs. (13a) and (13b) show that, just before
the first rain simulation (CRZ0), soil of treatments A
(t slope) and B (s slope) are characterised by the
same value of lm. Also, it may be noted that the values
are of the same order of magnitude as those reported
in White and Sully (1987) for several field soils and
that the increase of lm has not yet been clearly
understood.
In addition it is worthwhile to mention that
mercury porosimetry was performed on a soil clod
taken close to the soil surface of treatment A (tslope) after about 170 mm of rain was applied. The
results showed a bimodal pore size distribution with
the first peak at 3!10K2 mm and the second around
40 mm, 80% of the pore size cumulative probability
distribution lying between 2 and 400 mm (Ndiaye,
2001) which is smaller than lm. Once again (White
and Sully, 1987) it appears that mercury porosimetry
method is doubtful to estimate the dimension of pores,
which are hydraulically functioning in field
conditions.
3.3. Ponding time
Fig. 5 presents the values of Tp as a function of CR
for treatment A (t slope) and B (s slope). They were
calculated by Eq. (10b) with the values of the
observed rainfall intensities (Table 2). S and K being
obtained from the infiltration tests (see Fig. 4a and b,
respectively). For comparison purposes, the observed
values of Tr (see Table 2) are also reported. Not
surprisingly, Tp decreases as CR increases, the values
being larger for treatment A than for treatment B, that
is fully consistent with the previous results dealing
with the behaviour of S and K. In addition they are in
fair agreement with Tr, by realising that Tr corre-
sponds to the time at which the runoff flow was first
detected at the outlet of the 1 m2 plots, while Tp is the
time at which the soil surface reaches saturation (in
fact the pressure head of K5 mm of water, imposed at
the base of the disc infiltrometer). As a matter of fact,
the difference TrKTp (about 9 min) can be seen as the
time needed first to fill in the superficial storage
capacity of the surface (about 4 min for treatment A;
from 4 to 1 min for treatment B) and second, to
establish the continuity of water pathways at the
surface, which is required before water runs outside

Fig. 5. Calculated ponding time (Tp) and observed time of
appearance of runoff (Tr) as a function of cumulative rainfall
since tillage for two treatments.
B. Ndiaye et al. / Journal of Hydrology 307 (2005) 294–311306
the plots. Of course, those two processes depend upon
the time evolutions of both micro-topography and
crust types, which are quite different between
treatments, as it is shown in the following. That is
why, it is believed that this agreement is an indicator
of correctness of field estimates of hydraulic
properties.
Note that the increase of both Tp and Tr (and S as
well) between the first and second run of rain
simulation has not yet been fully explained.
3.4. Correspondence between distribution of soil crust
types and hydraulic properties
Visual evidence for the importance of the role
played by soil crusting on infiltration and runoff was
provided by taking photographs of the soil surface at
Fig. 6. Views of the surface of a micro-plot taken immediately (a) after har
100 mm.
different times after tillage. As an example, Fig. 6
pictures the surface feature of plot 5 located on
treatment A, before the first rain (a) and after CRZ100 mm (b). Immediately after tillage one can see that
the micro-relief is organised in ridges and furrows
making the surface rough and that the soil is
constituted of clods improving macroporosity.
Under the raindrop impact, the ridges and furrows
become smoother and smoother as cumulative rainfall
increases and because the soil is subject to surface
crusting, superficial pellicular features appear and
develop. That is clear from Fig. 6b which shows that
the ridges and furrows still remain visible, but with the
presence of crusts organised according to the genetic
model proposed by Bielders et al. (1996): the
structural (STR) and erosion (ERO) crusts are present
on ridges, runoff (RUN) and depositional (DEP) ones
are observed in furrows.
Observed time evolutions of the spatial distribution
of the surface crust types (expressed as the percentage
of cover) are detailed in Figs. 7 and 8 for treatment A
and B, respectively. Also are reported the correspond-
ing measured values of hydraulic conductivity,
sorptivity and lm. Clearly the results show that tillage
direction has a strong influence on the dynamics of
crust types as the cumulative rainfall increases and
consequently on the surface soil hydraulic properties
at least such as inferred by disc infiltrometry. They
suggest the following comments:
(i)
rowing
For CR smaller than 100 mm most of the crust
are of STR type on both treatments, a small
the soil across the slope and (b) after a cumulative rainfall of

Fig. 7. Correspondence between the percentage of surface crust-types and (a) hydraulic conductivity (K), (b) sorptivity (S) and (c) ‘mean’ pore
size (lm) as a function of the number of rains for tillage treatment A (harrowing across slope). Symbols correspond to the measured values of K,
S and lm.
B. Ndiaye et al. / Journal of Hydrology 307 (2005) 294–311 307
proportion (about 15%) of depositional one
being nevertheless observed on treatment B (sslope). This is corroborated by the smoothing of
the micro-relief (see Fig. 3b) that induces a
greater runoff coefficient than on treatment A (tslope) (see Fig. 3a) and a higher rate of
deposition of fine particles in depressional
areas. The progressive flattening of the micro-
topography was also reported in other studies
(e.g. Freebairn et al., 1989; Fox et al., 1998a).
(ii)
For 100!CR!140 mm, one observes the for-mation of a significant amount of RUN crusts on
treatment A (t slope) (45%) and of ERO crusts
on treatment B (s slope) (60%) which leads to an
important decrease of soil hydraulic conductivity
for that treatment. That is supported by the
findings of Valentin and Bresson (1992) who
mentioned that STR crusts may evolve into ERO
ones when the washed surface is eroded by both
splash and runoff. The same trend is observed on

Fig. 8. Correspondence between the percentage of surface crust-types and (a) hydraulic conductivity (K), (b) sorptivity (S) and (c) ‘mean’ pore
size (lm) as a function of the number of rains for tillage treatment B (harrowing along slope). Symbols correspond to the measured values of K, S
and lm.
B. Ndiaye et al. / Journal of Hydrology 307 (2005) 294–311308
treatment A (t slope), but with a lag delay of
about 60 mm of rain.
(iii)
For CRO140 mm, while the presence of theSTR crusts appears to be still dominant on
treatment A (t slope); a very large amount
(80%) of RUN crusts take place on treatment
B (s slope). The longer persistence of the
micro-relief on the former (Fig. 3b) probably
maintains higher infiltration rates than on the
latter one (Fig. 4a and b), due to increased
depth of ponding and greater hydraulic head
gradient, while maintaining a higher conduc-
tivity. That is well highlighted by greater
values of lm (Fig. 4c) and smaller value of
ponding times (Fig. 5) for treatment A than for
treatment B.

B. Ndiaye et al. / Journal of Hydrology 307 (2005) 294–311 309
(iv)
As cumulative rainfall increases, the differen-tiation between treatment becomes more and
more obvious. Within a given treatment the
small-scale spatial variability of crust types tends
to increase as well. That was also observed by
Fox et al. (1998b) who found that seal charac-
teristics vary considerably within a range of a
few centimetres.
4. Conclusions
Aside from the clear demonstration that surface
crusting does occur in a sandy loam field soil under
conditions encountered in the central region of
Senegal, it appears to have a very significant impact
on the hydrologic properties depending on tillage
treatments. Time variations of the infiltration par-
ameters (capillary sorptivity and hydraulic conduc-
tivity) with cumulative rainfall since tillage (viewed
as an index of rainfall energy) were explained by the
crust-types and their temporal dynamics of formation
which both were found different according to tillage
direction: harrowing either along or across the
catchment slope. On the former case (treatment B),
the fast development and the large abundance of
runoff crusts (resulting from deposition of fine
particles eroded from upslope) drastically reduce
infiltration rates, making ponding time values smaller
and runoff ones larger than those observed when the
soil is harrowed across the slope. For the latter
(treatment A), structural crusts (originating from the
impact of rain drops) and to a lesser extent erosion
crusts (formed by erosion of the sandy component of
structural crusts, at the initiation of runoff) are
dominant and have smaller impact on the reduction
of the soil infiltrability.
Surface crust-types were tentatively characterised
by the concept of ‘mean’ pore sizes hydraulically
active. The results show that gravity-driven force
(relatively to capillary one) is more important on
structural and erosion crusts than on runoff ones.
Combined with a longer persistence of the superficial
soil water storage capacity, it explains why harrowing
a soil subject to crusting across the catchment slope
facilitates infiltration and subsequently delays the
onset of surface runoff.
In addition, soil surface hydraulic properties of an
untilled plot not submitted to any rain were found to
be close to those of the conventional treatment plot
(t slope) after receiving a cumulative rainfall of
about 160 mm. That indicates that the effects of tillage
are short lived for the conditions encountered in the
study.
Acknowledgements
This research was supported by the French
National Research Program on Hydrology (PNRH)
and the Institut de Recherche pour le Developpement
(IRD), which are gratefully acknowledged.
References
Ahuja, L.R., Fiedler, F., Dunn, G.H., Benjamin, J.G., Garrison, A.,
1998. Changes in soil water retention curves due to tillage and
natural reconsolidation. Soil Sci. Soc. Am. J. 62, 1228–1233.
Allmaras, R.R., Burwell, R.E., Holt, R.R., 1967. Plow-layer and
surface roughness from tillage as influenced by initial porosity
and soil moisture of tillage time. Soil Sci. Soc. Am. J. 31, 27–32.
Angulo-Jaramillo, R., Moreno, F., Clothier, B.E., Thony, J.L.,
Vachaud, G., Fernandez-Boy, E., et Cayuela, J.A., 1997.
Seasonal variations of hydraulic properties of soils measured
using a tension disc infiltrometer. Soil Sci. Soc. Am. J. 61, 27–
32.
Ankeny, M.D., Kaspar, T.C., Horton, R., 1990. Characterization of
tillage and traffic effects on unconfined infiltration measure-
ments. Soil Sci. Soc. Am. J. 54, 837–840.
Ankeny, M.D., Ahmed, M., Kaspar, T.C., Horton, R., 1991. Simple
field method for determining unsaturated hydraulic conduc-
tivity. Soil Sci. Soc. Am. J. 55, 467–470.
Azevedo, A.S., Kanwar, R.S., Horton, R., 1998. Effect of cultivation
on hydraulic properties of an Iowa soil using tension
infiltrometer. Soil Sci. 163, 22–29.
Bielders, C.L., Baveye, P., Wilding, L.P., Drees, L.R., Valentin, C.,
1996. Tillage induced spatial distribution of surface crusts on a
sandy paleustult from Togo. Soil Sci. Soc. Am. J. 60, 843–855.
Boulier, J.F., Parlange, J.Y., Vauclin, M., Lockington, D.A.,
Haverkamp, R., 1987. Upper and lower bounds of the ponding
time for near constant surface flux. Soil Sci. Soc. Am. J. 51,
1424–1428.
Burwell, R.E., Allmaras, R.R., Sloneker, L.L., 1966. Structural
alteration of soil surfaces by tillage and rainfall. J. Soil Water
Conserv. 21, 61–63.
Casenave, A., Valentin, C., 1989. Les etats de surface de la zone
sahelienne. Influence sur l’infiltration. ORSTOM Ed, Coll.
Didactiques, Paris pp. 226.

B. Ndiaye et al. / Journal of Hydrology 307 (2005) 294–311310
Casenave, A., Valentin, C., 1992. A runoff capability classification
system based on surface features criteria in semi-arid areas of
West Africa. J. Hydrol. 130, 231–249.
Chan, K.Y., Heenan, D.P., 1993. Surface hydraulic properties of a
red earth under continuous cropping with different management
practices. Aust. J. Soil Res. 31, 13–24.
Clothier, B.E., White, I., 1981. Measurement of sorptivity and soil
water diffusivity in the field soil. Soil Sci. Soc. Am. J. 45, 241–
245.
Dunn, G.H., Phillips, R.E., 1991. Macroporosity of a well-drained
soil under no tilled and conventional tillage. Soil Sci. Soc. Am.
J. 55, 817–823.
Everts, C.J., Kanwar, R.S., 1993. Interpreting tension-infiltrometer
data for quantifying soil macropores: some practical consider-
ations. Trans. ASAE 36, 423–428.
Fox, D.M., Le Bissonnais, Y., Quetin, P., 1998a. The implications
of spatial variability in surface seal hydraulic resistance for
infiltration in a mound and depression microtopography. Catena
32, 101–114.
Fox, D.M., Le Bissonnais, Y., Bruand, A., 1998b. The effect of
ponding depth on infiltration in a crusted surface depression.
Catena 32, 87–100.
Freebairn, D.M., Gupta, S.C., Onstad, C.A., Rawls, W.J., 1989.
Antecedent rainfall and tillage effects upon infiltration. Soil Sci.
Soc. Am. J. 53, 1183–1189.
Haverkamp, R., Ross, P.J., Smettem, K.R.J., Parlange, J.Y., 1994.
Three-dimensional analysis of infiltration from the disc
infiltrometer. 2. Physical based infiltration equation. Water
Resour. Res. 30, 2931–2935.
Hogarth, W.L., Sardana, V., Watson, K.K., Sander, G.C.,
Parlange, J.Y., Haverkamp, R., 1991. Testing of approximate
expression for soil water status at the surface during infiltration.
Water Resour. Res. 27, 1957–1961.
Jarvis, N.J., Leeds-Harrrison, P.B., Dosser, J.M., 1987. The use of
tension infiltrometer to assess routes and rates of infiltration in a
clay soil. J. Soil Sci. 38, 633–640.
Lin, H.S., McInnes, K.J., 1995. Water flow in clay soil beneath a
tension infiltrometer. Soil Sci. 159, 375–382.
Logsdon, S.D., Jaynes, D.B., 1993. Methodology for determining
hydraulic conductivity with tension infiltrometers. Soil Sci. Soc.
Am. J. 57, 1426–1431.
Logsdon, S.D., Allmaras, R.R., Wu, L., Swan, J.B., Randall, G.W.,
1990. Macroporosity and its relation to saturated hydraulic
conductivity under different tillage practices. Soil Sci. Soc. Am.
J. 54, 1096–1101.
Logsdon, S.D., Jordhal, J.L., Karlen, D.L., 1993. Tillage and crop
effects on ponded and tension infiltration rates. Soil Tillage Res.
28, 179–189.
Mapa, R.B., Green, R.E, Santo, L., 1986. Temporal variability of
soil hydraulic properties with wetting and drying subsequent to
tillage. Soil Sci. Soc. Am. J. 50, 1133–1138.
McIntyre, D.S., 1958. Soil splash and the formation of surface crusts
by raindrop impact. Soil Sci. 85, 185–189.
Meek, B.D., Rechel, E.R., Carter, L.M., Detar, W.R., Urie, A.L.,
1992. Infiltration rate of a sandy loam soil: effect of traffic,
tillage and plant roots. Soil Sci. Soc. Am. J. 56, 908–913.
Messing, I., Jarvis, N.J., 1993. Temporal variation in the hydraulic
conductivity of a tilled clay soil as measured by tension
infiltrometers. J. Soil Sci. 44, 11–24.
Mohanty, B.P., Ankeny, M.D., Horton, R., Kanwar, R.S., 1994.
Spatial analysis of hydraulic conductivity measured using disc
infiltrometer. Water Resour. Res. 30, 2489–2498.
Mohanty, B.P., Horton, R., Ankeny, M.D., 1996. Infiltration and
macroporosity under a raw crop agricultural field in glacial till
soil. Soil. Sci. 161, 205–213.
Murphy, B.W., Koen, T.B., Jones, B.A., Huxedurp, L.M., 1993.
Temporal variation of hydraulic properties of some soils with
fragile structure. Aust. J. Soil Res. 31, 179–197.
Mwendra, E.J., Feyen, J., 1993. Tillage and rainfall effects on
infiltration and predictive applicability of infiltration equations.
Soil Sci. 156, 20–27.
Ndiaye, B., 2001. Experimental study and modelling of hydrodyn-
amic behaviour of cultivated soils: application to the Thysse
Kaymor catchment (Senegal). Thesis Univ. J. Fourier, Greno-
ble, pp. 183 (in French).
Perroux, K.M., White, I., 1988. Design for disc permeameters. Soil
Sci. Soc. Am. J. 52, 1205–1215.
Philip, J.R., 1957. Theory of infiltration: 4. Sorptivity and algebraic
infiltration equation. Soil Sci. 84, 257–264.
Philip, J.R., 1985. Reply to “Comments on steady infiltration from
spherical cavities”. Soil Sci. Soc. Am. J. 49, 788–789.
Planchon, O., Darboux, F., 2002. A fast, simple and versatile
algorithm to fill the depressions of digital elevation models.
Catena 46, 159–176.
Planchon, O., Esteves, M., Silvera, N., 2001. Micro-relief induced
by tillage. Measurement, modelling, and consequences on
overland flow and erosion. Catena 46, 141–157.
Rao, K.P.C., Steenhuis, T.S., Cogle, A.L., Srinivasan, S.T.,
Yule, D.F., Smith, G.D., 1998. Rainfall infiltration and runoff
from an Alfisol in semi-arid tropical India. II. Tilled systems.
Soil Tillage Res. 48, 61–69.
Rawls, W.J., Onstad, C.A., Richardson, H.H., 1980. Residue and
tillage effects on SCS runoff curve numbers. Trans. ASAE 23,
357–361.
Reynolds, W.D., Elrick, D.E., 1991. Determination of hydraulic
conductivity using a tension infiltrometer. Soil Sci. Soc. Am. J.
55, 633–639.
Reynolds, W.D., Zebchuk, W.D., 1996. Use of contact material in
tension infiltrometer measurements. Soil Technol. 9, 141–159.
Reynolds, W.D., Gregorich, E.G., Curnoe, W.E., 1995. Character-
ization of water transmission properties in tilled and
untilled soils using tension infiltrometers. Soil Tillage Res. 33,
117–131.
Sauer, T.J., Clothier, B.E., Daniel, T.C., 1990. Surface measure-
ments of the hydraulic properties of a tilled and untilled soil.
Soil Tillage Res. 15, 359–369.
Smettem, K.R.J., Clothier, B.E., 1989. Measuring unsaturated
sorptivity and hydraulic conductivity using multiple disc
permeameters. J. Soil Sci. 40, 563–568.
Smettem, K.R.J., Parlange, J.Y., Ross, P., Haverkamp, R., 1994.
Three dimensional analysis of infiltration from the disc
infiltrometer: 1. A capillary based theory. Water Resour. Res.
30, 2925–2929.
B. Ndiaye et al. / Journal of Hydrology 307 (2005) 294–311 311
Sumner, M.E., Steward, B.A., 1992. Soil Crusting: Chemical and
Physical Processes. Advances in Soil Science. Lewis, Boca
Raton, FL.
Thony, J.L., Vachaud, G., Clothier, B.E., Angulo-Jaramillo, R.,
1991. Field measurements of the hydraulic properties of soil.
Soil Technol. 4, 111–123.
Valentin, C., Bresson, L.M., 1992. Morphology, genesis and
classification of surface crusts in loamy and sandy soils.
Geoderma 55, 225–245.
Vandervaere, J.P., Peugeot, C., Vauclin, M., Angulo-
Jaramillo, R., Lebel, T., 1997. Estimating hydraulic conduc-
tivity of crusted soils using disc infiltrometers and
minitensiometers. J. Hydrol. 188–189. See also pages 203–
223.
Vandervaere, J.P., Vauclin, M., Elrick, D.E., 2000a. Transient flow
from tension infiltrometers. Part 1. The two-parameter equation.
Soil Sci. Soc. Am. J. 64, 1263–1272.
Vandervaere, J.P., Vauclin, M., Elrick, D.E., 2000b. Transient
flow from tension infiltrometers. Part 2. Four methods to
determine sorptivity and conductivity. Soil Sci. Soc. Am. J. 64,
1273–1284.
Vauclin, M., Chopart, J.L., 1992. L’infiltrometrie pour la determi-
nation in situ des caracteristiques hydrodynamiques de la
surface d’un sol gravillonnaire de Cote d’Ivoire. Agronomie
Tropicale 46, 259–271.
Warrick, A.W., Broadbridge, P., 1992. Sorptivity and macroscopic
capillary length relationships. Water Resour. Res. 28, 427–431.
Watson, K.W., Luxmoore, R.J., 1986. Estimating macroporosity in
a forest watershed by use of a tension infiltrometer. Soil Sci.
Soc. Am. J. 50, 578–582.
White, I., Sully, M.J., 1987. Macroscopic and microscopic capillary
length and time scales from field infiltration. Water Resour. Res.
23, 1514–1522.
Wilson, G.V., Luxmoore, R.J., 1988. Infiltration, macroporosity,
and mesoporosity distributions on two forested watersheds. Soil
Sci. Soc. Am. J. 52, 329–335.
Zobeck, T.M., Onstad, C.A., 1987. Tillage and rainfall effects on
random roughness. Soil Tillage Res. 9, 1–20.