Embed Size (px)
Citation preview

i
Effect of product bed height and air velocity
on the drying rate of extruded maize pellets
G.B. Pasch
22160493
Dissertation submitted in partial fulfilment of the requirements
for the degree Magister in Mechanical Engineering at the
Potchefstroom Campus of the North-West University
Supervisor: Dr. JJ Janse van Rensburg
November 2015

EFFECT OF PRODUCT BED HEIGHT AND AIR VELOCITY ON THE DRYING RATE OF EXTRUDED MAIZE PELLETS ii
Declaration I hereby declare that the entire content of this dissertation is my own original unaided work,
except where specific reference is made by name or in the form of a numbered reference. The
work herein has not been submitted for a degree at another university.
Signed: .................................. Bartho Pasch

EFFECT OF PRODUCT BED HEIGHT AND AIR VELOCITY ON THE DRYING RATE OF EXTRUDED MAIZE PELLETS iii
Abstract In the food processing industry, specifically food drying and cooling, there is still a lack of
available information that is based on experiments and reliable data. A specific product that has
not been investigated is pure maize extruded pellets used for porridge made for human
consumption. In order to use these pellets as porridge, it is finely milled. To ensure that the
pellets are properly milled, the pellets must be dried and cooled to ensure that the mill has a
good efficiency and that the product has an acceptable shelf life. Therefore, by investigating the
drying and cooling kinetics of the product, an improved and more efficient process can be
obtained. Two factors that have an influence on the drying kinetics, is the ambient air velocity
through the product bed and the product bed height. Through the optimization of the
performance of a counterflow bed dryer and cooler, energy costs and time can be saved.
The purpose of this project is to acquire experimental data by investigating the effect that the
product bed height and the air velocity through the bed has on the drying and cooling
performance in order to ease the design process of a counterflow dryer/cooler with optimized
performance. This exploration will include experiments on an experimental drying test bed. In
these experiments, ambient air will be used at different air velocities and product bed heights.
Performance parameters such as the total moisture loss, the drying rate, the moisture loss rate
and the moisture loss per kilowatt of fan power (kW) will be evaluated in terms of the bed height
and the air velocity. Conclusions can be then reached as to what bed height and air velocity
deliver an optimum cooling/drying performance. This information will then be presented to ease
the design process of the cooler/dryer. A mathematical model is also created to estimate the
drying rate at certain specified parameters. Using the drying rate value can aid the designing
process by estimating the ideal size of the cooler/dryer for a specified rate of product flow
through the cooler/dryer. The model is validated by comparing it to the experimental results.
Research has been done on the mechanical design of a counterflow dryer/cooler to see what
factors are involved in drying and cooling. By evaluating the effect of these factors, the
researcher concluded that increased air velocity in a counterflow dryer/cooler increases the
drying rate; this is due to the mass transfer rate that is increased. However, the air velocity
maximum in a continuous counterflow cooler must not exceed the minimum fluidization velocity,
as the product will start to mix and will prevent even drying and cooling. The increase in product
bed height also increases the drying rate that is caused by a decrease in cooling rate. A decrease
in cooling rate results in a longer time for evaporation and mass transfer from the product, due to
the difference in partial pressure between the water in the air and the water in the product.
By evaluating the performance, the researcher concluded that the optimum parameters in which
to operate the counterflow dryer/cooler, is at a bed depth of 0.4 m and at an air velocity of 1.8
m/s. The best drying rate is obtained at an air velocity of 2.2 m/s, but this velocity causes
fluidization and will not fit the application of this dryer. Furthermore the information presented
can thus be used to design a counterflow cooler/dryer with minimum inputs.
Keywords: Drying; Cooling; Maize; Counterflow cooler; Food processing; Product bed height; Air
velocity; Drying optimization; Drying rate; Extruded maize pellets; Drying performance

EFFECT OF PRODUCT BED HEIGHT AND AIR VELOCITY ON THE DRYING RATE OF EXTRUDED MAIZE PELLETS iv
Contents
1. Introduction ................................................................................................ 1
1.1. Background ........................................................................................................................ 1
1.2. Problem statement ............................................................................................................ 1
1.3. Objective ........................................................................................................................... 2
1.4. Research methodology ...................................................................................................... 2
1.4.1. Literature overview .................................................................................................... 2
1.4.2. Experimental investigation ........................................................................................ 2
1.4.3. Data processing.......................................................................................................... 2
1.4.4. Prelimanary design on a counterflow cooler/dryer ................................................... 3
1.5. Chapter layout ................................................................................................................... 3
1.6. Conclusion ......................................................................................................................... 3
2. Literature study .......................................................................................... 4
2.1. Counterflow cooling .......................................................................................................... 4
2.2. Counterflow cooler physical phenomena .......................................................................... 5
2.3. Parameters and mathematical modelling ......................................................................... 6
2.4. Fluidized bed drying .......................................................................................................... 9
2.5. Fluidization ...................................................................................................................... 10
2.5.1. Minimum fluidization velocity ................................................................................. 11
2.5.2. Bed distribution ....................................................................................................... 12
2.5.3. Stages of fluidization ................................................................................................ 12
2.5.4. Pressure drop ........................................................................................................... 13
2.5.5. Airflow distributor ................................................................................................... 14
2.6. Drying rate ....................................................................................................................... 15
2.6.1. Description ............................................................................................................... 15
2.6.2. Characteristics ......................................................................................................... 17
2.7. Influence of parameters .................................................................................................. 17
2.7.1. Air velocity ............................................................................................................... 18
2.7.2. Bed depth ................................................................................................................ 19
2.8. Background literature on calculations ............................................................................. 19
2.9. Experimental investigations from literature .................................................................... 21
2.10. Design processes for dryers ............................................................................................. 22
2.11. Conclusion ....................................................................................................................... 23

EFFECT OF PRODUCT BED HEIGHT AND AIR VELOCITY ON THE DRYING RATE OF EXTRUDED MAIZE PELLETS v
3. Experimental setup ................................................................................... 24
3.1. Testing bench design and setup ...................................................................................... 24
3.2. Instrumentation and equipment ..................................................................................... 25
3.2.1. Temperature and relative humidity logger .............................................................. 25
3.2.2. Airflow meter ........................................................................................................... 26
3.2.3. Scale ......................................................................................................................... 26
3.2.4. Product moisture analyser ....................................................................................... 26
3.2.5. Blower ...................................................................................................................... 26
3.2.6. Variable speed drive ................................................................................................ 26
3.3. Experimental process ...................................................................................................... 26
3.4. Recapitulation ................................................................................................................. 26
4. Experimental results ................................................................................. 27
4.1. Assumptions .................................................................................................................... 28
4.2. Captured data .................................................................................................................. 28
4.3. Result processing reasoning ............................................................................................ 28
4.4. Moisture analysis ............................................................................................................. 29
4.4.1. Effect of bed height and air velocity on moisture loss ............................................. 29
4.4.2. Drying process efficiency ......................................................................................... 35
4.4.3. Drying effect on product .......................................................................................... 36
4.4.4. Drying rate analysis .................................................................................................. 38
4.4.5. Modelling ................................................................................................................. 39
4.5. Conclusion ....................................................................................................................... 42
5. Model based preliminary design............................................................. 43
5.1. Design parameters .......................................................................................................... 43
5.1.1. Percentage moisture loss required .......................................................................... 43
5.1.2. Residence time......................................................................................................... 43
5.1.3. Air velocity ............................................................................................................... 44
5.1.4. Bed height ................................................................................................................ 44
5.1.5. Bed area ................................................................................................................... 45
5.1.6. Other parameters .................................................................................................... 45
5.2. Dryer dimensions............................................................................................................. 45
5.3. Drying process ................................................................................................................. 46
5.4. Mechanical design ........................................................................................................... 47

EFFECT OF PRODUCT BED HEIGHT AND AIR VELOCITY ON THE DRYING RATE OF EXTRUDED MAIZE PELLETS vi
5.5. Conclusion ....................................................................................................................... 48
6. Conclusions and recommendations ........................................................... 49
6.1. Conclusion ....................................................................................................................... 49
6.1.1. Moisture loss rate .................................................................................................... 49
6.1.2. Drying efficiency ...................................................................................................... 49
6.1.3. Decreases temperature rate. ................................................................................... 49
6.1.4. Experiments and research ....................................................................................... 49
6.1.5. Modelling ................................................................................................................. 50
6.1.6. Model based preliminary design .............................................................................. 50
6.2. Recommendations for further work ................................................................................ 50
6.3. Closure ............................................................................................................................. 51
7. Bibliography .............................................................................................. 52
8. Appendices ............................................................................................... 56
EFFECT OF PRODUCT BED HEIGHT AND AIR VELOCITY ON THE DRYING RATE OF EXTRUDED MAIZE PELLETS vii
Table of Figures Figure 1: Illustration of a counterflow cooler patent [8] .................................................................. 4
Figure 2: Illustration of a Bliss Industries counterflow cooler [10] ................................................... 5
Figure 3: Cross-section view of an experimental counterflow pellet cooler [9] ............................... 7
Figure 4: Outlet moisture content versus air-to-pellet ratio in cooling [9] ....................................... 8
Figure 5: Illustration of a continuous fluidized bed dryer [14] ......................................................... 9
Figure 6: Illustration of bed expanding [24] .................................................................................... 11
Figure 7: Diagram of fluidization stages [29] .................................................................................. 12
Figure 8: Various regimes of a bed of particles at different gas velocities [21] .............................. 13
Figure 9: Minimum recommended values of distributor/bed pressure drop ratio [33] ................. 14
Figure 10: Characteristic drying curves for moist particles [40] ..................................................... 15
Figure 11: Mass and heat transfer illustration ................................................................................ 16
Figure 12: Effect of temperature of drying air [16] ......................................................................... 18
Figure 13: Moisture versus time at 0.19 m/s (packed bed) [6] ....................................................... 18
Figure 14: Moisture versus time at 0.59 m/s (fluidized bed) [6]..................................................... 19
Figure 15: Different solid and bubble flow patterns in small and large fluidized beds [19] ........... 21
Figure 16: Design steps from experimental tests [15] .................................................................... 22
Figure 17: Fluidized bed dryer design steps [48] ............................................................................ 23
Figure 18: Illustration of experimental test tube ............................................................................ 25
Figure 19: Illustration of entire experimental setup ....................................................................... 25
Figure 20: Data processing flow diagram ........................................................................................ 27
Figure 21: Temperature and relative humidity over time at a 0.1 m bed depth ............................ 28
Figure 22: Air temperature difference over time at 1.8 m/s at various product bed heights ......... 30
Figure 23: Cumulative sum of moisture in exiting air over time ..................................................... 30
Figure 24: Exhaust air temperature over time at a 0.4 m bed depth at various air velocities ........ 33
Figure 25: Total moisture lost at 0.4 m bed depth ......................................................................... 33
Figure 26: Effect of air velocity and bed depth on percentage of total moisture lost .................... 34
Figure 27: Effect of air velocity and bed depth on the moisture lost per kilowatt ......................... 36
Figure 28: Specified moisture content at various air velocities ...................................................... 37
Figure 29: Moisture content percentage at air flow and product volume ratio ............................. 38
Figure 30: Drying rate at 0.4 m at different air velocities ............................................................... 39
Figure 31: Surface plot of the drying rate ....................................................................................... 40
Figure 32: Drying rate fitted surface plot ....................................................................................... 40
Figure 33: Cross section of the valve bed ....................................................................................... 47
Figure 34: Final preliminary counterflow cooler/dryer design ....................................................... 48
EFFECT OF PRODUCT BED HEIGHT AND AIR VELOCITY ON THE DRYING RATE OF EXTRUDED MAIZE PELLETS viii
List of Tables Table 1: Experimental counterflow cooling results [9] ..................................................................... 7
Table 2: Specifications for different bed heights [9] ......................................................................... 7
Table 3: Ideal cooling times at different bed depths [9] ................................................................... 8
Table 4: Initial product properties .................................................................................................. 24
Table 5: Ratio of temperature and mass of product ....................................................................... 32
Table 6: Extruder operating parameters ......................................................................................... 37
Table 7: Moisture loss calculation .................................................................................................. 41
Table 8: System specification .......................................................................................................... 45
Table 9: Final process specifications ............................................................................................... 46
Table 10: Research limits ................................................................................................................ 50

EFFECT OF PRODUCT BED HEIGHT AND AIR VELOCITY ON THE DRYING RATE OF EXTRUDED MAIZE PELLETS ix
Acknowledgements I want to thank the following people and institutions in no particular order:
Jan Janse van Rensburg
Melissa Pasch
Monica Pasch
Rikus Pasch
Otto Pasch
Du Toit Peters
Benjamin Lombard
Danie Vorster
CFAM Technologies
Barthlo van der Merwe

EFFECT OF PRODUCT BED HEIGHT AND AIR VELOCITY ON THE DRYING RATE OF EXTRUDED MAIZE PELLETS x
Nomenclature mp Product mass [kg]
M Moisture [%]
g Gravitation constant [m/s2]
Fd Drag force [N]
Fb Buoyancy [N]
Umf Minimum fluidization velocity [m/s]
Pb Pressure drop over bed [Pa]
Wb Product bed weight [N]
Ab Bed cross sectional Area [m2]
Mp Moisture in product [kg/kg]
dt Time interval,[s]
ṁa Mass flow rate of dry air
Ws Solid weight [N]
ṁ Mass flow rate [kg/s]
ṁw Mass flow rates of water from surface of a particle, [g water/s]
X Absolute humidity of air
h1 Specific enthalpy of inlet drying air [kJ/kg]
hm Thermodynamic state of the particle
hfg Latent heat of vaporization of water [kJ/kg]
Cm Specific heat [kJ/ kg K]
Tm Material temperature [°C]
Rc Product drying rate [kg2/m2s]
Ap Surface area of product [m2]
q Rate of heat transfer
hp Heat transfer coefficient [W/m2K]
BH Bed Height [m]
V Air velocity [m/s]
𝑇𝑔 Temperature of the gas [°C]
ρa Density of air [kg/m3]
ρb Bulk density [kg/m3]
tR Residence Time [s]
Hb Height [m]
Wi Interval weight [kg]
ɛ Voidage
Re Reynolds number
p partial pressure [Pa]
evapQ Heat transfer rate due to water evaporation [kJ/s]
lossQ Heat loss (kJ/s),
Subscripts
cv Isobaric process

EFFECT OF PRODUCT BED HEIGHT AND AIR VELOCITY ON THE DRYING RATE OF EXTRUDED MAIZE PELLETS xi
1 Inlet
2 Outlet
v Vapor
g Gas
a Air
p Product

1
Chapter 1
1. Introduction This chapter includes background studies of counterflow dryer/cooler characterization and design.
It also includes the problem statement, where after the objective and research methodology are
presented.
1.1. Background
Fluidized bed dryers and coolers are used throughout the food processing industry to dry or cool
wet granular foods. Various types of counterflow bed dryers and coolers have been developed;
each one optimized for a specific material. In this study, the product that has to be dried and
cooled is extruded maize pellets used for human consumption. By analysing the different
parameters that have an influence on the performance of the dryer or cooler, information can be
revealed that can be used to optimize drying in in a dryer. Various factors such as the product bed
height, air velocity through the bed, air temperature, product density, bulk density, product
shape, product material etc. influence the dryer performance. Literature [1, 2] has indicated that
the drying performance of a dryer is sensitive to the product bed depth and the air velocity.
Maize cereal is produced by cooking maize meal through an extrusion process; this maize product
then has to be dried before it can be milled. The cooked maize meal is then mixed with sugar,
flavourings and colorants to produce an edible and tasty cereal. Cereal can also be used as it is
extruded and since the product must be safe for storage, it must be cooled and dried before
packaging. Drying reduces the moisture content in the food product to improve shelf-life and
enable storage at ambient temperature [3]. It is important to minimize the moisture in the
products to the safe limits that are different for each product [3]. Improper drying can cause
mould growth and endanger the safe storage of the product [4]
In order to dry the extruded product, a counterflow cooler/dryer is normally used. In [5], the
author states that the efficiency in conventional dryers is usually low, therefore the improvement
of the efficiency is very desirable. Due to the ever-increasing costs associated with energy, it is
essential to optimise drying and cooling processes [6] in order to keep costs as low as possible.
Tests and experiments are usually done on dryers to determine the performance of the dryer
under various operating conditions. These conditions include normal operating conditions,
maximum capacity of the dryer under typical operating conditions, maximum drying
performance, maximum cost effectiveness, and parameters for better product quality and
minimum environmental impact [7].
1.2. Problem statement
Selecting or designing the appropriate dryer or cooler to optimize the drying process efficiency
can be difficult; therefore to be able to optimize or design a dryer an in depth knowledge about
dryers and coolers is needed. Experimental data processed into useful information can provide

EFFECT OF PRODUCT BED HEIGHT AND AIR VELOCITY ON THE DRYING RATE OF EXTRUDED MAIZE PELLETS 2
the estimated dimensions and operating parameter values for a dryer with specified input
parameters that can optimize the drying process. In the case of this study, the type of dryer is a
counterflow cooler/dryer, cooling and drying a CFAM Extruder TX80 product made from maize.
This product has specific characteristics that have an influence on the drying performance. The
performance will be analysed and a dryer will be designed accordingly, enabling the optimization
of the drying performance for this product.
In literature, very little empirical data is available on the effect that the product bed height and
the air velocity have on the extruded maize product. The effects of these operating parameters
are considered to be crucial in improving the performance of a counterflow cooler/dryer and they
therefore need to be considered in the design process.
1.3. Objective
This study will focus on two of the operating parameters for the extrusion of maize pellets,
namely air velocity through the product bed and the product bed height. The study investigates
the effect that these two parameters have on the drying rate of the product. The drying process
in a dryer bed usually occurs at a high air temperature, but some drying also occurs at an ambient
air temperature. If air at ambient temperature can be used rather than heated air, it could
decrease production costs considerably.
The objective of this study is to process the collected data in order to design a cooler/dryer. The
data is collected from an experimental test bed of which the air velocity and product bed height
can be varied while logging the relative humidity and dry-bulb temperature. The effect that these
parameters have on the drying rate and eventually the drying performance is investigated.
To accomplish this objective, the following tasks are defined:
Investigate the relevant literature.
Experimental investigation into the product.
Data processing on the experimental results to determine the drying rate and
performance from the logged parameters.
Determine the effect of air velocity and product bed height on the drying rate.
Implement the results into a preliminary design of a counterflow cooler/dryer.
1.4. Research methodology
1.4.1. Literature overview
A literature study will be done on counterflow coolers/dryers. The overview will include an
investigation into the factors that will influence the drying and cooling process. Furthermore, the
overview will state how these factors influence the design of a counterflow cooler/dryer.
1.4.2. Experimental investigation
An experimental test bench will be designed and manufactured to produce data on the extruded
maize product. The air velocity and product bed height will be varied to obtain results concerning
the effect that these parameters have on the drying process.
1.4.3. Data processing
The results obtained from the experimental tests will then be processed. The temperature and
relative humidity are used to calculate the moisture loss curve of the extruded maize product
during the drying process. By investigating the effect of air velocity and product bed height on the

EFFECT OF PRODUCT BED HEIGHT AND AIR VELOCITY ON THE DRYING RATE OF EXTRUDED MAIZE PELLETS 3
drying rate, the performance can be evaluated by investigating the total moisture loss in the
product, moisture loss rate, cooling rate and drying efficiency. A drying rate will be estimated at
each varied parameter with the use of a mathematical model and will be verified with the results
obtained in the experiments.
1.4.4. Prelimanary design on a counterflow cooler/dryer
By using the obtained data to determine the optimal parameters for dryer performance, a
counterflow cooler/dryer will be designed. A model will be created to implement the results into
the preliminary design of a counterflow cooler.
1.5. Chapter layout
Chapter 1 provides a background to the study as well as the problem statement, objective of the
study, and the research methodology.
Chapter 2 presents a literature overview of the research that has been done on the drying of
maize pellets in bed coolers/dryers. It also includes research by numerous authors that describes
the effect that air velocity through the bed and the product bed height have on the drying rate of
foods and counterflow coolers/dryers. The drying rate analysis and definitions will be provided
and investigated.
Chapter 3 illustrates and describes the experimental test bench setup and the methods that were
followed to obtain appropriate data on the effect that the air velocity and product bed height
have on the drying rate of the extruded maize pellets. The test bench setup will be discussed, the
measurement instruments defined, and the application thereof in the experimental tests.
Chapter 4 presents the experimental data that was converted into information that can be used
for future designs. The results mainly consist of the effect that the air velocity and product bed
height have on the drying rate of extruded maize pellets. The chapter also discusses the effect of
the air velocity and the bed height on the drying efficiency and drying rate. Furthermore, this
chapter evaluates and discusses the moisture content percentage of the pellets. Thereafter a
mathematical model will be created with which the drying rate can be estimated at various input
parameters.
Chapter 5 will discuss how the results can be used to design a counterflow cooler/dryer. Critical
parameters are identified that must be taken into consideration during the design process. A
design is then provided based on the requirements specified by using the obtained results and
the mathematical model.
Chapter 6 includes the conclusions drawn from the study. The conclusions will include a
discussion of the results and the effect that various parameters has on the drying of extruded
maize pellets. The chapter also discusses whether the results can be used to design a counterflow
cooler/dryer.
1.6. Conclusion
This chapter presented the background on the study, the problem statement, the objective and
the method that will be used to do the study. The next chapter will present some of the literature
that is available on the subject of this study.

EFFECT OF PRODUCT BED HEIGHT AND AIR VELOCITY ON THE DRYING RATE OF EXTRUDED MAIZE PELLETS 4
Chapter 2
2. Literature study This section will provide the literature that was collected and processed to retrieve information
concerning counterflow dryers and coolers. The goal of this study is to understand the principles
concerning moisture loss in food; therefore the literature review will focus on that.
2.1. Counterflow cooling
Patents for counterflow coolers were introduced in 1989 [8] and they are still used in the food
industry today. The designs of counterflow coolers presented in the years since then were
created using trial and error although the main principle for these dryers stays the same. Hot
extruded pellets are cooled in the cooler using a negatively pressured bed. The hot pellets then
accumulate or fall onto a bed with a series of orifices letting air through and preventing the
product from falling through [8, 9].
To prevent the pellets from thermal shock1, the pellets are gradually cooled as air from the
bottom of the bed increases in temperature as it makes its way to the top of the bed where the
incoming hot pellets enters the cooler. A certain quantity of pellets is then released from the bed
at small intervals once it has reached its specified moisture content and temperature. It is
important to keep the height of the product in the bed as constant as possible throughout the
process to ensure a constant residence time. An illustration of a patent of a counterflow cooler is
shown in Figure 1 [8].
Figure 1: Illustration of a counterflow cooler patent [8]
1 Food that is exposed to high temperature can lose nutrients, change in flavour and texture attributes.

EFFECT OF PRODUCT BED HEIGHT AND AIR VELOCITY ON THE DRYING RATE OF EXTRUDED MAIZE PELLETS 5
Limiting sensors are used to regulate the height of the product in the bed. When the bed floor
shifts to let pellets fall into the hopper, air that gradually cools the pellets and warms the air is
still moving through the bed [8, 9]. Another illustration of a counterflow cooler model developed
by Bliss Industries is shown in Figure 2 [10].
Figure 2: Illustration of a Bliss Industries counterflow cooler [10]
2.2. Counterflow cooler physical phenomena
Some of the advantages of a counterflow cooler include its ability to cover small floor space, its
low maintenance and low energy usage [9, 10]. Another advantage is that the cooler can
excellently control the final moisture content in the product [9]. The improper drying and cooling
of moist solids can cause poor product quality, caking in bags and holding bins, spoilage, and
unwanted weight or weight loss. Cooling and drying processes are directly affected by the
amount of energy and moisture that the air and pellet contain [10]. The cooler designs that exist
are horizontal, vertical, rotary and bunker coolers [9].
Pellets enter the top of the cooler through an airlock valve and fall onto the bed uniformly.
Ambient air enters the product bed through small holes and flows into the discharge grid from
below. The air and pellets flow in opposite directions and the coolest air first makes contact with
the coolest particles and then the warmest air makes contact with the warmest particles. This
pattern of counterflowing ensures that the particle cools down at an appropriately gradual rate
and it helps to preserve the pellet quality [10]. When particles or pellets cool off too quickly, the
surface will become a dry crust preventing moisture transfer from inside the pellet to the surface
to be transferred into the air. This will leave the particle moist inside. The pellet will become
brittle if the moisture inside reaches equilibrium and this will lead to excess fines [10, 11]. In the
Op-Flo2 cooler, the air flow can be adjusted to control the final temperature and moisture
content [12].
The height of the product in the cooler is determined and controlled by the operator using the
control of minimum and maximum bed depth sensors [9]. In a counterflow cooler, adjusting the
2 Counterflow cooler name developed by Bliss Industries.
EFFECT OF PRODUCT BED HEIGHT AND AIR VELOCITY ON THE DRYING RATE OF EXTRUDED MAIZE PELLETS 6
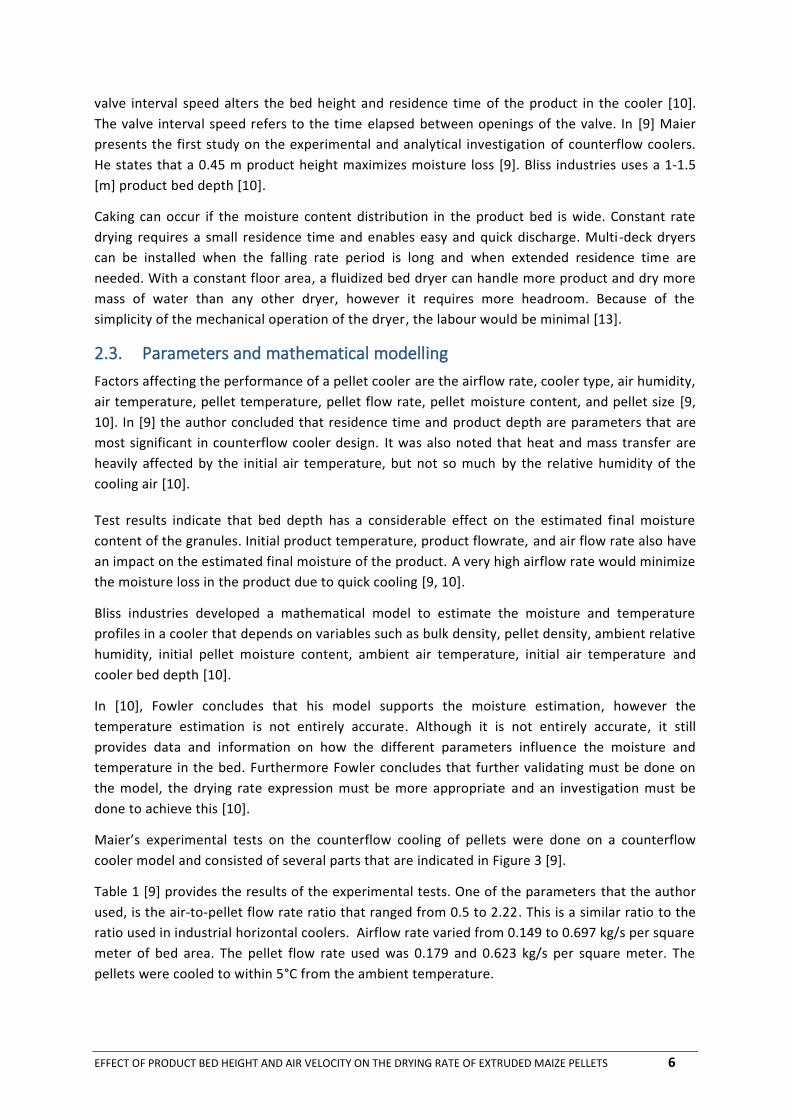
valve interval speed alters the bed height and residence time of the product in the cooler [10].
The valve interval speed refers to the time elapsed between openings of the valve. In [9] Maier
presents the first study on the experimental and analytical investigation of counterflow coolers.
He states that a 0.45 m product height maximizes moisture loss [9]. Bliss industries uses a 1-1.5
[m] product bed depth [10].
Caking can occur if the moisture content distribution in the product bed is wide. Constant rate
drying requires a small residence time and enables easy and quick discharge. Multi-deck dryers
can be installed when the falling rate period is long and when extended residence time are
needed. With a constant floor area, a fluidized bed dryer can handle more product and dry more
mass of water than any other dryer, however it requires more headroom. Because of the
simplicity of the mechanical operation of the dryer, the labour would be minimal [13].
2.3. Parameters and mathematical modelling
Factors affecting the performance of a pellet cooler are the airflow rate, cooler type, air humidity,
air temperature, pellet temperature, pellet flow rate, pellet moisture content, and pellet size [9,
10]. In [9] the author concluded that residence time and product depth are parameters that are
most significant in counterflow cooler design. It was also noted that heat and mass transfer are
heavily affected by the initial air temperature, but not so much by the relative humidity of the
cooling air [10].
Test results indicate that bed depth has a considerable effect on the estimated final moisture
content of the granules. Initial product temperature, product flowrate, and air flow rate also have
an impact on the estimated final moisture of the product. A very high airflow rate would minimize
the moisture loss in the product due to quick cooling [9, 10].
Bliss industries developed a mathematical model to estimate the moisture and temperature
profiles in a cooler that depends on variables such as bulk density, pellet density, ambient relative
humidity, initial pellet moisture content, ambient air temperature, initial air temperature and
cooler bed depth [10].
In [10], Fowler concludes that his model supports the moisture estimation, however the
temperature estimation is not entirely accurate. Although it is not entirely accurate, it still
provides data and information on how the different parameters influence the moisture and
temperature in the bed. Furthermore Fowler concludes that further validating must be done on
the model, the drying rate expression must be more appropriate and an investigation must be
done to achieve this [10].
Maier’s experimental tests on the counterflow cooling of pellets were done on a counterflow
cooler model and consisted of several parts that are indicated in Figure 3 [9].
Table 1 [9] provides the results of the experimental tests. One of the parameters that the author
used, is the air-to-pellet flow rate ratio that ranged from 0.5 to 2.22. This is a similar ratio to the
ratio used in industrial horizontal coolers. Airflow rate varied from 0.149 to 0.697 kg/s per square
meter of bed area. The pellet flow rate used was 0.179 and 0.623 kg/s per square meter. The
pellets were cooled to within 5°C from the ambient temperature.

EFFECT OF PRODUCT BED HEIGHT AND AIR VELOCITY ON THE DRYING RATE OF EXTRUDED MAIZE PELLETS 7
Figure 3: Cross-section view of an experimental counterflow pellet cooler [9]
Table 1: Experimental counterflow cooling results [9]
Results in the experimental counterflow pellet cooler at a bed depth of 0.9 m
Test Air-to-pellet ratio
Air flow [kg/s.m²]
Pellet flow
[kg/s.m²]
Moisture loss percentage points
[% wet bulb.]
Pellet cooling
[ΔC°]
Cooling effect[ Δ°C]
1 2.22 0.564 0.255 2.37 15.5 -1.9
2 1.87 0.564 0.301 1.54 11.8 2.5
3 1.43 0.697 0.488 1.82 14.6 3.1
4 1.27 0.566 0.448 2.01 17.9 0.5
5 1.16 0.259 0.221 1.68 8.1 -1.9
6 0.92 0.571 0.623 1.75 21.9 6.6
7 0.83 0.149 0.179 1.73 19.2 -1.8
8 0.51 0.153 0.31 1.77 23.1 6.4
In Table 2 [9] below the moisture loss and temperature loss data at different bed heights is
indicated.
Table 2: Specifications for different bed heights [9]
Product depth in bed
[m]
Moisture loss
percentage
[% wet bulb]
Temperature
difference [Δ°C]
0.3 1.54 – 1.77 8-23
0.9 1.73 – 2.37 15-19.2

EFFECT OF PRODUCT BED HEIGHT AND AIR VELOCITY ON THE DRYING RATE OF EXTRUDED MAIZE PELLETS 8
In [9] the authors’ prediction of the temperature profiles varied from 10 to 28% and that of
moisture varied from 3 to 60%. The mathematical model did not predict the moisture and
temperature profiles precisely, however the authors’ model can investigate the performance of
the cooler when certain parameters are changed.
The time the air is in contact with the pellets is called the residence time. The residence time in a
cooler can be adjusted for a specified bulk density by changing bed depth, adjusting pellet
flowrate or a combination of the two. Controlling the residence time in a cooler and dryer is
critical in optimizing performance. Being able to change the constant bed depth to a different
height and to control residence time, provide great control over the drying and cooling process
[10].
In [9] the authors analysed the residence times to cool a product to within 5°C of ambient
temperature at specified bed depths. Table 3 [9] present these residence times.
Table 3: Ideal cooling times at different bed depths [9]
Bed depth
[m]
Residence time [min]
0.15 2.6
0.30 5.3
0.45 7.9
0.60 10.5
By increasing the bed depth from 0.15 m to 0.3 m to 0.45 m, the moisture loss was increased
from 0.6 to 0.7 to 0.8 percentage points. The moisture loss reached a maximum after 6 min in a
0.6 m depth bed.
Air-to-pellet mass flow rate can be used as a parameter to estimate residence time. Decreasing
air-to-pellet flow rate results in a decrease in residence time. Moisture content and air-to-pellet
ratio is inversely proportional to each other as is evident in Figure 4 [9].
Figure 4: Outlet moisture content versus air-to-pellet ratio in cooling [9]
Large air-to-pellet ratios result in higher moisture outlets and a higher initial drying rate. By
increasing the air-to-pellet ratio, the pellets cool of more quickly, thus the drying potential is
reduced. There exists an optimum air-to-pellet ratio at a specific bed depth through which a

EFFECT OF PRODUCT BED HEIGHT AND AIR VELOCITY ON THE DRYING RATE OF EXTRUDED MAIZE PELLETS 9
desired final moisture content can be obtained and for which the pellet can be cooled to within
5°C of the ambient temperature [9].
There is little moisture loss beyond a certain bed depth. In fact, moisture and temperature may
increase beyond a certain bed depth. Based on their tests, Nonhebel and Moss [9] concluded that
smaller pellets dried and cooled at a greater rate than a larger sized pellets. The smaller pellets
also lost more moisture than the larger pellets. The authors then concluded that the desired
moisture content for a certain size has an optimum residence time. By altering the product bed
depth and air-to-pellet flow ratio, the exit moisture content can be controlled. The moisture loss
will be more if the pellet is warmer than moderately warm and it will be even more when
residence time is increased. Nonhebel and Moss also found that inlet air temperature, relative
humidity and initial moisture content have little effect on the performance of the cooler and
therefore they did not discuss it in depth in their paper [9]. They concluded that at a bed depth of
0.45 m the moisture loss in a counterflow cooler was maximized. The moisture loss and cooling
rate was significantly influenced by the initial pellet temperature and pellet diameter [9].
2.4. Fluidized bed drying
An illustration of a typical continuous fluidized bed dryer can be seen in Figure 5 [14]. Particles
rest on an air distributor plate that distributes flowing air uniformly over the bed to ensure
uniform drying. Typical components found in a fluidized bed dryer are an air blower, air heater,
and a bed column. Different types of fluidized driers have been studied, tested and evaluated
[15], however this literature study will only contain information on the counterflow dryer as the
design of such a dryer is the goal of the this study.
Figure 5: Illustration of a continuous fluidized bed dryer [14]
The main task of drying in the food industry is to reduce the moisture content in the food product
so that shelf-life can be improved and storage at ambient temperatures enabled [3]. Uneven
moisture distribution in the product cannot be avoided, but can be minimized within the product
limits. It is important to minimize moisture in products to the safe limits that are different for
each product [3]. Typical products that are processed in these dryers are foodstuff, chemicals,
pharmaceuticals in powder or agglomerated form, pesticides, dyestuffs, detergents, surface

EFFECT OF PRODUCT BED HEIGHT AND AIR VELOCITY ON THE DRYING RATE OF EXTRUDED MAIZE PELLETS 10
active agents, biomaterials, ceramics, waste management processes, polymer and resins,
fertilizers, beverage products, and carbohydrates [15].
The main advantages of fluidized bed dryers are a high thermal efficiency and a high rate of heat
and mass transfer to ensure a short drying time. This offers a wide choice in the ways in which
the machine dries [16]. Advantages of these fluidized bed dryers also include easy operation and
maintenance, it can be easily automated and can be used to dry, cool, mix and classify products.
Typical disadvantages of fluidized bed dryers include high pressure drops over the product bed,
attrition of solids, and erosion of the containing surfaces. A full fluidized dryer has a major
disadvantage, namely the uneven distribution of residence time in the dryer. Due to the mixing of
the solids, it is not possible to predict which solid will leave the bed at what time. This leads to an
experimentally proven non-uniform distribution in solid moisture content [14, 16, 17, 18].
The large contact surfaces of the dryer is another advantage of fluidized bed dryers as it shortens
the drying time of the product [19]. In addition to all the advantages due to the fluid like product,
these dryers can use gravity to transport the product in and out of the dryer by means of
pnematical conveying. An undesirable quality of the fluidized bed is a low fluidization quality,
giving rise to a lower performance and operation. Improper drying can cause mould growth and
endanger the safe storage of a product. Temperatures that are too high can cause grain quality
degradation due to increased enzymatic inactivation [4].
2.5. Fluidization
Fluidization occurs when material that is in a packed or stationary state is exposed to flowing air,
causing the material bulk to move to its loosest state possible, to form a fluid like bed [20, 21].
This effect of fluidization occurs when the drag ( dF ) and buoyancy force ( bF ) of the air provided
exceeds the gravitational force of the product as is indicated by this equation:
p d bm g F F (1)
A gas, liquid or liquid-gas can be used as the fluidization agent, however only air will be discussed
in this study, as the model in this study is used in food drying and cooling [21].
To understand the fluidization concept, it is important to understand the movement of solids in
the product bed. Gas hold-up is a term used to characterize the fluidization state of the bed. Gas
hold-up is quantified as the volume fraction of air present in the product bed [21]. In [22],
experimental results indicated that there is an increase in solids concentration (inverse of gas
hold-up) when the product bed depth is increased. This mainly occurs in the middle of the bed,
whereas there was no change at the wall of the bed. This is due to the increase of the bubbles in
the bed caused by the product bed depth increase [21].
It is important to study and characterize the motion of particles in the bed to ensure an efficient
and effective operation. Problems such as hot and cold spots and un-fluidized zones in the bed
can be visually observed [23]. Product quality can be decreased as a result of poor fluidization
caused by attrition of a wider product distribution. Vigirous mixing in a fluidized bed causes a
difference in residence time between the particles and a wider residence time distribution that
leads to uneven product qualty and moisture [19].

EFFECT OF PRODUCT BED HEIGHT AND AIR VELOCITY ON THE DRYING RATE OF EXTRUDED MAIZE PELLETS 11
2.5.1. Minimum fluidization velocity
Minimum fluidization velocity is the velocity at which a packed stationary product bed evolves
into the bubble regime of fluidization. This velocity is one of the most important parameters that
characterize a fluidized bed. This velocity can be determined experimentally and methods such as
the heat transfer method, the pressure drop method and the voidage method are used [20]. The
heat transfer method entails the measurement of the wall heat transfer coefficient as the air
velocity increases amongst others. The point of minimum fluidization is obtained when there is a
drastic increase in the heat transfer coefficient. The cost and high quality experimental setup
make this method undesirable. The pressure drop method uses the measurements of the
pressure drop over the bed against the air velocity. The minimum fluidization velocity point is
reached when the pressure in the correlation between the pressure drop and the air velocity
becomes constant. The voidage method entails the determination of the point where the voidage
in the bed starts to increase as the velocity increases and the bed expands, as is evident in Figure
6 [24]. Because it is very complex to determine this point, it is not used that often [21].
Figure 6: Illustration of bed expanding [24]
In [22], the experimental results obtained for determining the minimal fluidized velocity indicated
that using the pressure drop method agrees with results of theoretical calculations such as the
Ergun equation and other theoretical models. Material properties, material geometry, gas
properties and bed geometry have an influence on minimum fluidization velocity [21, 22]. Hilal et
al. [25] analysed parameters such as bed diameter and the geometry and type of distributor, and
their results showed that both parameters have an influence on the minimum fluidization
velocity. The minimum fluidization velocity increased as the number of holes in the distributor
increased, and decreased with an increase in bed diameter [21, 25].
In the experiments performed by Escudero [21], it was found that the minimum fluidization
velocity increased as the density of the product increased. These tests were performed on
materials with three different densities. The mass of the higher density particles is higher when
the volume stays constant and thus an increased air velocity is needed to overcome the weight of
the particles. Because of this, a larger pressure drop over the bed will be noted [21]. In [21] the

EFFECT OF PRODUCT BED HEIGHT AND AIR VELOCITY ON THE DRYING RATE OF EXTRUDED MAIZE PELLETS 12
authors also concluded that as the height-diameter ratio increased, the minimum velocity stayed
more or less constant [21].
2.5.2. Bed distribution
The solid particles and air bubbles distribution in a fluidized dryer is greatly influenced by the air
flow supply. Fluidization quality depends highly on the bubble distribution. Good fluidization
needs an even distribution of air bubbles through the bed and these air bubbles should be small
and their density large [26]. Images were taken during testing to identify air bubble distribution
and it was noted that the bubbles are concentrated very close to the distributor and is then
distributed over the whole bed to very close to the walls. The bubbles then taper inwards as it
move upwards into the product bed and fuse at a certain height. This profile of distribution
altered when bed height was changed [23, 26, 27] . In [27] it was found that by experimenting
with different bed parameters such as air velocity and bed heights, particles in a fluidized bed
tend to rise in the middle of the bed and move downwards at the sides of the bed.
2.5.3. Stages of fluidization
In terms of the types of fluidizing regimes or stages, Yang [28] noted that there are six different
stages, namely fixed, bubbling, slugging, turbulent, fast and pneumatic conveying. Figure 7 [29]
present a diagram of the different stages of fluidization [21].
Figure 7: Diagram of fluidization stages [29]
In the fixed bed stage, the air does not have sufficient velocity and thus not sufficient force to
move the solids in the bed and only flows through the bed. The bubbling stage is reached when
the air velocity is increased and bubbles start to form in the solids and move upwards, mixing the
product. This velocity is known as the minimum bubbling velocity [21]. In [28] the authors noted
that the slugging fluidized state appears in a product bed which ratio of bed depth to bed
diameter is larger than two. The slugging regime starts when the bubble size reaches two thirds
of the bed diameter and starts merging into one large bubble [21].
Crowe [29] stated that at the air velocity where one big bubble breaks up into more bubbles, the
slugging fluidizing state has been reached. This velocity is determined when the deviations of
pressure fluctuations reach a maximum. Turbulent fluidization occurs at an air velocity larger

EFFECT OF PRODUCT BED HEIGHT AND AIR VELOCITY ON THE DRYING RATE OF EXTRUDED MAIZE PELLETS 13
than the bubbling fluidization velocity and smaller than the fast fluidizing velocity [29, 30, 31].
When the air velocity increases and reaches the transport velocity, it is called the fast fluidization
velocity. The pneumatic conveying state is reached when the velocity is still increased and the
solid particles are then transported out of the bed in a diluted phase [21]. Irregular sizes, shapes
and densities can cause a product to fluidize non-uniformly [21].
2.5.4. Pressure drop
Increasing the air velocity brings about an increase in the pressure drop across the product bed.
The pressure drop stays relatively constant when the air at a minimum fluidization velocity is
further increased [21]. Figure 8 [21] portrays the pressure drop against the velocities reached
from fixed bed to fully fluidizing state.
Figure 8: Various regimes of a bed of particles at different gas velocities [21]
Once the fully fluidized state has been reached, the pressure drop is the total weight of the
product over the area. Thus, pressure drop over the product bed is proportional to the weight of
the product and inversely proportional to the area of the bed [32].
bb
b
WP
A (2)
The gravity force of the particles then equals the buoyancy or drag force that the air exerts [21,
30]. For stable fluidization, the pressure ratio between the distributor and the product bed over a
certain area can be determined as indicated in Figure 9 below [33].

EFFECT OF PRODUCT BED HEIGHT AND AIR VELOCITY ON THE DRYING RATE OF EXTRUDED MAIZE PELLETS 14
Figure 9: Minimum recommended values of distributor/bed pressure drop ratio [33]
2.5.5. Airflow distributor
The distributor supports the weight of the product and admits air to flow uniformly through the
product bed. To ensure good fluidization, air must flow through enough points that are evenly
distributed over the bed area and the air must be supplied to the points from a well-designed
plenum chamber [33]. When there is a shortage of air distribution points, good fluidization
cannot be achieved, bed particles can elutriate, and undesirable air and product flow in the bed,
corrosion and erosion of bed surfaces can occur [33]. An oversupply of air distribution points can
lead to air starvation in the bed in some parts that also causes bad fluidization, undesirable gas
and product flow and erosion and corrosion on bed materials [33]. The air distributor
performance is of key importance to the optimized operation of fluidized beds [34].
Types of distributors that are widely available are ordinary, sandwiched, bubble, cap tuyere and
sparger distributors. A certain pressure drop is needed to obtain good airflow distribution. As a
rule of thumb the pressure difference over the bed must exceed 30% of the pressure difference
over the product bed, to ensure good distribution [15, 28].
Wormsbecker [35] studied the influence that different types of distributor plates have on the
hydroponics on a fluidized bed. Experiments in which the gas velocities and the bed loading were
varied, were performed [35]. The main goal of the distributor is to evenly distribute the air
across the area of the bed and to optimize the air/product contact. The heat and mass transfer
rates can potentially vary with different distributors. As is evident in study [35], the punched
plate provides a higher drying rate of the product than the Dutch weave and perforated plate
designs [35].
Perforated plate has the advantages of simplicity, good performance and a design that has been
studied extensively [33]. Perforated plate usually has an open area ratio of 25-45% [36]. The
advantages of perforated plate are a low installation cost, low pressure drop, good thermal
efficiency, no risk of clogging and high contact efficiency [37, 38]. The characteristics of the

EFFECT OF PRODUCT BED HEIGHT AND AIR VELOCITY ON THE DRYING RATE OF EXTRUDED MAIZE PELLETS 15
particles determine the operation and design of a perforated plate distributor fluidized bed.
These characteristics include particle size, particle distribution, density and shape [36].
To determine the pressure needed from a fan or blower, the hydronomical resistance of the
product bed and the resistance of the distributor is used [39].
If the pressure drop over the distributor plate is high enough and at least equal to the drop over
the product bed, good quality fluidization will occur [6]. It is desirable to install fans with
automatic control to maintain the pressure balance, and to keep the pressure just below
atmospheric pressure above the bed to prevent fines leaking from the dryer [13]. Some suppliers
install a distributor perforated plate with holes of about 1 mm in diameter. When air flows
through the distributor plate, the flow usually increases in the middle of the bed with little air
flow upwards near the walls. This can be improved by dishing the perforated plate in the middle
to distribute the air more to the walls.
2.6. Drying rate
In this section, literature on the drying rate of food will be discussed.
2.6.1. Description
It can be difficult to study the drying rates of a certain product without performing experiments
due to the wide variety of the mechanisms involved in internal moisture transport. These
mechanisms include thermal diffusion, surface diffusion, capillarity, bulk and modular flow and
they depend on the structure and properties of a product [6].
Early experiments on fluidized bed drying show that mass transfer on a single particle occurs in
two stages, at constant rate and then at falling rate. Constant rate drying occurs when free
moisture on the surface and in the outside pores is constantly withdrawn into the drying agent.
The falling rate drying stage is present when diffusion occurs inside the solid, transporting the
moisture to the surface due to a temperature rise in the solid. The critical moisture content is the
moisture content in the product at the stage when the constant rate drying ends and when the
falling rate drying stage starts. Figure 10 [40] below illustrates the characteristic drying curve as
function of time and moisture [40].
Figure 10: Characteristic drying curves for moist particles [40]

EFFECT OF PRODUCT BED HEIGHT AND AIR VELOCITY ON THE DRYING RATE OF EXTRUDED MAIZE PELLETS 16
The maximum drying rate occurs in the constant rate period, and lasts until the moisture reaches
the critical point3. The moisture transfer in the falling rate period is limited by the moisture
diffusion to the surface. The size and extent of the two different drying zones depend on the type
of material dried and its properties. Sand, for example, has a large constant drying period in
comparison with more fibrous materials such as mustard grain or poppy seeds [41, 42].
Despite the simplicity of the operation of the dryer, knowledge of hydronomics combined with
mass transfer is still needed to design a bubbling fluidized dryer. The mass transfer coefficient is
needed to accurately model and analyse the drying kinetics of a certain product in a certain dryer
[40]. External drying factors determine the mass and heat transfer intensity. These factors form
the drying conditions characteristics and they provide a good description of a fluidized bed. The
heat transfer coefficient is mainly determined by experimentation and the value is only valid for a
certain product with a certain size, machine, and conditions. It is then incorporated into different
equations. A heat transfer coefficient is not yet determined for the food in this design in any
study [39].
Drying consists of heat and mass transfer. Heat is provided to the solid via convection and is
needed for evaporation that releases moisture into the airstream, which is the mass flow. The
heat further makes its way to the inside of the solid through conduction. Moisture makes its way
to the surface of the particle and evaporates into the air stream. Figure 11 illustrates the mass
and heat transfer of a food particle [43, 5].
Figure 11: Mass and heat transfer illustration
Through convection, heat is transferred from the surrounding air C to the pellet surface B and
then through conduction from B to C. Moisture moves from the inside of the particle A to the
surface B as vapour or a liquid, and on the surface it evaporates into the air. The temperature
difference between B and C and A and B causes heat transfer. The overarching cause of heat
transfer from surrounding air to the inside of the particle is the difference in temperature
between A and C. At a moisture temperature lower than evaporation temperatures, mass
transfer occurs between B and C due to the difference in partial pressures or concentrations, and
between A and B due to the difference in concentration [39]. In the case when the material
temperature is close to the moisture boiling point, the liquid evaporates within the particle and
moves to the surface and surrounding air [39].
3 The point where drying rate goes from constant to falling

EFFECT OF PRODUCT BED HEIGHT AND AIR VELOCITY ON THE DRYING RATE OF EXTRUDED MAIZE PELLETS 17
A mathematical model of a process is used to represent a real system based on selected features
and properties of the real system. Simulation, control and optimization are the essential
components in these models, and they fall into three categories: White-box that uses the first
principles that are derived from physical and chemical relationships, black-box that is constructed
using experimental data, and grey box that uses both [44]. The minimum product bed depth and
residence time of the product to reach the necessary moisture content and particle temperature
is determined by using the heat transfer coefficient [39]. According to the authors in [39], this
calculation is very inaccurate (more than 100%) due to simplified assumptions and the high
uncertainty of the heat transfer coefficient estimation.
The authors of [5] state that the efficiency in conventional dryers is usually low, therefore
improving the efficiency is very desirable. The recent developments and design modifications
done on fluidized bed dryers make that possible. Optimal energy management has to be
maintained due to an increase in energy cost and the adoption of a more environmentally
friendly operation and strategies [6]. Experiments proved that the drying rate in a fluidized bed is
greater than that in packed beds [6]. Drying rate increases as air temperature increases [6].
Water on the surface of the product evaporates in seconds and this is described as the constant
rate period.
2.6.2. Characteristics
Fluidized bed drying can occur continuous or batchwise. For small scale production or for the use
of drying experiments, a batchwise fluidized bed can be used. Experiments will be performed to
determine the drying rate of the specific product for this design. A batchwise operation is ideal
for this process due to the constant quality of the product through the bed [14]. In continuous
fluidized bed drying, the residence times differ widely as the product dried varies due to the
difference in material properties. Drying rates and fluidization are affected by these material
properties, such as density and the specific heat value of the product [14].
It was noted that the bed temperature and end of process temperature are lower in the packed
bed [6]. The tests and experiments performed by Static et al. [6] show that as the inlet air is
increased, the drying time decreases [6]. Sinivasakannan [41] used the mean residence time,
which increases with an increase in temperature and bed height, to estimate the drying rate in
continuous drying. He also found that a continuous bed has a lower drying rate than a batch
fluidized bed [41].
2.7. Influence of parameters
The influence of the various parameters on the drying will now be discussed. The outlet moisture
decreases as the inlet air temperature increases [16]. The increased air temperature increases the
pellet surface temperature, which reduces the humidity and increases the evaporation rate from
the pellet surface as is evident from Figure 12 [16].An increase in pellet flow rate increases the
moisture outlet because of the lower residence time that is possible. The drying rate of the
product decreases as the pellet diameter increases. A larger particle size means that the surface
area per unit weight decreases and this reduces the drying rate [16].

EFFECT OF PRODUCT BED HEIGHT AND AIR VELOCITY ON THE DRYING RATE OF EXTRUDED MAIZE PELLETS 18
Figure 12: Effect of temperature of drying air [16]
2.7.1. Air velocity
Air velocity has a great effect on the drying rate in the constant drying rate zone and on a product
with a low internal resistance to moisture transfer. However, with a product with high resistance
to moisture transfer, the air velocity has little effect on the drying rate [15]. Higher bed
temperatures lead to higher moisture removal rates and diffusivities. The diffusion effect is
complex and depends largely on the significance of internal and external resistance to moisture
transfer [15, 42].
An increase in airflow also has an increase on power consumption. Smaller grains have a higher
resistance to airflow that causes an increase in moisture removal and a reduced fan output, thus
an increase in power efficiency. A fluidized bed can compete with other air dryers when high
moisture removal and low energy consumption is needed. This type of dryer is reliable and
economical for the drying of light weighted grain [42, 45]. The effect of air velocity on the drying
rate of food particles can be clearly seen Figure 13 [6] and Figure 14 [6]. These graphs indicate
that the drying rate increased as the air velocity increased even though the temperature differs.
TG presents the inlet air temperature.
Figure 13: Moisture versus time at 0.19 m/s (packed bed) [6]

EFFECT OF PRODUCT BED HEIGHT AND AIR VELOCITY ON THE DRYING RATE OF EXTRUDED MAIZE PELLETS 19
Figure 14: Moisture versus time at 0.59 m/s (fluidized bed) [6]
In rough rice, the constant drying rate stage is very small and it converges to zero. The internal
resistance of a product has a great influence on the drying rate and moisture transfer , therefore
its temperature has a greater effect on drying rate than on velocity. Thus, it is important to keep
the internal resistance to moisture in mind when designing a dryer. An increase in air velocity
reduces the external mass transfer resistance and it causes an increase in drying rate. Thus, with
no increase in temperature, the only way to increase drying rate is by increasing air velocity and
because of the high internal resistance of the product, little diffusion will take place [16, 45].
2.7.2. Bed depth
More evaporization of moisture (mass transfer) takes place when the bed height increases.
However, voidage (bed porosity) does not have a significant effect on the drying performance [4].
By using a thin layer drying equation coupled with mass and heat balance equations, a simplified
model was developed for a moving bed dryer. In comparing parallel flow and counterflow drying,
it is evident that counterflow drying is more effective for drying in terms of drying rate and size of
the dryer when air is used as drying agent. At low air temperatures, the difference in effectivity
becomes even larger [46].
According to [45], further research must be done on other food products with a different
moisture content and weight than wheat and rice.
2.8. Background literature on calculations
The complex process calculations and hydronomics describing the dryer are material specific.
Thus, different mathematical models have been created to model the drying kinetics in a dryer.
These analytical models are solved with a variety of empirical models and simplified assumptions,
mostly developed using existing experimental data [47].
In the case of this study, the drying agent is air and to design the dryer different regimes of
fluidization need to be investigated to ensure that drying efficiency is optimized. A fluidized bed
dryer consists of the following parts: a blower, heater and drying column. Thermal balance in the
drying column is derived by applying energy, entropy and mass balances. In a dryer where there is
a single inlet and outlet, the mass rate balance equals [43].

EFFECT OF PRODUCT BED HEIGHT AND AIR VELOCITY ON THE DRYING RATE OF EXTRUDED MAIZE PELLETS 20
1 2
cvg g
dmm m
dt (3)
and a balance of air in water equals
1 2( )p
s a
dMW m X X
dt (4)
where 𝑊𝑠 is the mass of the dry solid, 𝑀𝑝 is the moisture content of the material (uniform
through the bed), 𝑋1 and 𝑋2 are the inlet and outlet absolute humidity of the air and �̇�𝑎 is the
mass flow rate of dry air.
The previous equation can be rewritten as:
1 2 w am m X X (5)
The heat transfer due to the heat of evaporation is significant, but there is also heat transfer to
the surroundings. The energy rate balance is:
1 1 2 2 ( ) ( )cv
evap a a loss
dHQ m h m h Q
dt (6)
Where �̇�𝑒𝑣𝑎𝑝 is heat transfer due to water evaporation in kJ/s, �̇�𝑙𝑜𝑠𝑠 is heat loss in kJ/s, ℎ1 is inlet
air specific enthalpy and ℎ2 is the outlet air specific enthalpy. As the mass flowrate of the dry air
and the mass of dry product stay constant over time, the energy balance can be written as:
2 1
1 2 s m m
evap a loss
W h hQ m h h Q
dt
(7)
The material enthalpy balance for material flow is:
2 1 2 1 m m m m mh h C T T (8)
𝐶𝑚 is the specific heat of the material. The moist air enthalpy ℎ𝑚 is:
a Vh h X h (9)
The heat transfer due to the phase change is [43]:
evap w fgQ m h (10)
Where ℎ𝑓𝑔 is latent heat of the evaporation of water in kJ/kg at the average temperature of the
moist material [43].
The energy balance can be used to derive a first law of thermodynamics energy efficiency for a
drying system. Thermal efficiency can be written as [43]:
ƞ =𝐸𝑛𝑒𝑟𝑔𝑦 𝑡𝑟𝑎𝑛𝑠𝑚𝑖𝑡𝑡𝑒𝑑 𝑡𝑜 𝑡ℎ𝑒 𝑠𝑜𝑙𝑖𝑑
𝐸𝑛𝑒𝑟𝑔𝑦 𝑖𝑛𝑐𝑜𝑟𝑝𝑜𝑟𝑎𝑡𝑒𝑑 𝑖𝑛 𝑡ℎ𝑒 𝑑𝑟𝑦𝑖𝑛𝑔 𝑎𝑖𝑟
And this is:

EFFECT OF PRODUCT BED HEIGHT AND AIR VELOCITY ON THE DRYING RATE OF EXTRUDED MAIZE PELLETS 21
1 2 2 1
1 0
][
s fg p p m m m
da
W h M M c T T
m h h t
(11)
Heat transfer can occur through radiation, convection and conduction, depending on the
operation. The contribution that each mechanism delivers to the system depends on the type of
distributor, flow condition, particle classification, pressure and operating temperature [15].
Heat transfer through convection between a particle and the air is expressed as:
p p p gq h A T T (12)
where 𝑞 is the rate of heat transfer, ℎ𝑝 is the heat transfer coefficient in W/m2K, 𝐴𝑝 is the surface
area of a single particle, 𝑇𝑝 is the temperature of the particle, and 𝑇𝑔 is the temperature of the
gas [15].
2.9. Experimental investigations from literature
Tests and experiments are done on dryers to determine their performance under normal
operation conditions, maximum capacity of dryer under typical operation conditions, optimized
operating parameters for maximum performance, optimum operating parameters for cost
effectiveness, product quality, and minimum environmental impact. The test results can then be
compared to the design data [7].
A fluidized bed dryer can only be scaled up to a full size industrial dryer by using experimental
pilot plot data and not by mathematical models due to the unreliability of these mathematical
models for fluidized bed dryers. Hence, experimental pilot plant tests must first be undertaken to
estimate the performance of the dryer.The biggest problem of scaling up is the fact that the
bubbles in the bed remain the same size although the flow patterns can differ in larger dryers
[19]. In smaller equipment, the bubbles push the product upwards as they rise and not much
mixing is taking place, wheras in larger dryers vigorous mixing takes place due to large scale flow
paterns in the centre and at the wall, as is evident from Figure 15 [19]. This can also happen the
other way around [19].
Figure 15: Different solid and bubble flow patterns in small and large fluidized beds [19]
Difusion or dispersion coeffisients increase as the bed diameter increases. Limitations such as
these require that the specific material must be tested at a pilot plant and experimentally to
EFFECT OF PRODUCT BED HEIGHT AND AIR VELOCITY ON THE DRYING RATE OF EXTRUDED MAIZE PELLETS 22
ensure that an accurate up-scale procedure is followed to evaulate the operation of a industrial
fluidized dryer. Therefore, using only labrotory data and first principles to design and predict the
performance of a dryer is difficult [19]. To determine the heat and mass transfer coefficients with
appropriate accuracy, is always problematic. Heat transfer coefficients are mostly determined by
using the turbulent flow around a sphere, but the flow in a large dryer can vary considerably. An
accurate method to determine these coefficients is the Ranz and Marshall correlation [13, 25].
Models for drying in fluidized dryers are often too specific to a certain material and design and it
is therefore hard to use other models to simulate performance on another material and design.
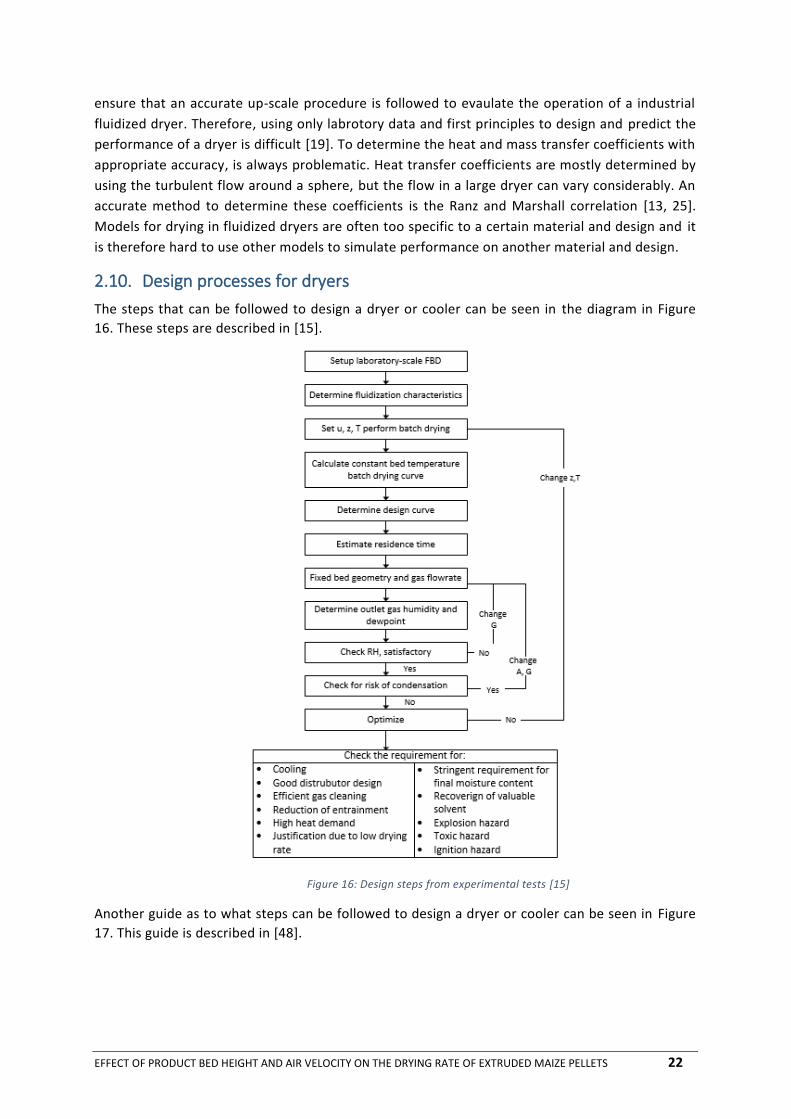
2.10. Design processes for dryers
The steps that can be followed to design a dryer or cooler can be seen in the diagram in Figure
16. These steps are described in [15].
Figure 16: Design steps from experimental tests [15]
Another guide as to what steps can be followed to design a dryer or cooler can be seen in Figure
17. This guide is described in [48].

EFFECT OF PRODUCT BED HEIGHT AND AIR VELOCITY ON THE DRYING RATE OF EXTRUDED MAIZE PELLETS 23
Material and process spesification
Material CharacteristicsPsychometric properties
EquilibriumThermophysical properties
Heat/Mass transfer coeficientsDrying kenetics
Literature dataPrediction
Lab. experiments
Process knowledgeMass and energy balances
ExperienceEquipment information
Small sclae tests
Process SimulationKinetics
Heat and mass transferBoundry conditionsNumerical solution
ResultsTemperature and moisture
profilesDrying times
Main dimensionsQuality attributes
Costs and quality analysis
Figure 17: Fluidized bed dryer design steps [48]
2.11. Conclusion
This chapter presented a literature overview of the research that has been done on the drying of
maize pellets in bed coolers/dryers. It also includes research by numerous authors that describes
the effect that air velocity through the bed and the product bed height have on the drying rate of
foods and counterflow coolers/dryers.
The next chapter will discuss the experimental method and the instruments used to collect data
on the study subject.

EFFECT OF PRODUCT BED HEIGHT AND AIR VELOCITY ON THE DRYING RATE OF EXTRUDED MAIZE PELLETS 24
Chapter 3
3. Experimental setup This chapter will discuss the experimental testing performed in this project. This includes the
instruments used, description of the material tested and the method followed. These tests are
done to determine how the process parameters influence the drying process of extruded maize
pellets
The product used in the experiments is pure maize meal. The maize was extrusion cooked at a
rate of 80 kg/h. The extruder used was a CFAM Technologies extruder named the TX32. The
dosing water used in the extrusion process was fed at a rate of 10 l/h. The maize was extruded
through a die at the end of the barrel that contains holes with a 3 mm diameter. The properties
of the product are shown in Table 4.
Table 4: Initial product properties
Pellet Property Description
Diameter 8-10 mm
Shape Spherical
Material Extrusion cooked maize
Initial temperature 50°C
Bulk density 250 kg.m-³
Initial average moisture 0.12 kg.kg-1
3.1. Testing bench design and setup
The experimental setup consists of a rectangular tube made from Perspex that contain the
product that must be dried. The tube container is 750 mm high and has a cross section of 250 mm
by 250 mm. A distribution perforated plate with holes that are 3 mm in diameter was assembled
onto the bottom of the tube container. This allowed the product to rest on the plate and let the
air through from the bottom. A relative humidity sensor was installed at the top part of the tube
where the air exits the tube. The illustration of the testing tube can be seen in Figure 18.
The testing tube was placed on the ducting that will direct the air to the bottom of the tube and
through the product. A fan that supplies the air was connected to the ducting. An airflow meter
was installed into the ducting, downstream from the fan. The airflow meter from a straight piece
of ducting was placed 500 mm downstream to ensure laminar flow as it reaches the airflow
meter. An illustration of the entire experimental setup can be seen in Figure 19.

EFFECT OF PRODUCT BED HEIGHT AND AIR VELOCITY ON THE DRYING RATE OF EXTRUDED MAIZE PELLETS 25
Figure 18: Illustration of experimental test tube
Figure 19: Illustration of entire experimental setup
3.2. Instrumentation and equipment
In order to determine the drying characteristics of the extruded maize product, various
measurements are required. These measurements include among others, the temperature, the
relative humidity and the air-flow velocity. More details on these measurements are provided
below:
3.2.1. Temperature and relative humidity logger
This logger logs the relative humidity and the dry bulb temperature of the air exiting in the tube
after it flowed through the product. A bracket was made to support the logger. The logged data
was then processed in a computer program called Data Logger Graph.

EFFECT OF PRODUCT BED HEIGHT AND AIR VELOCITY ON THE DRYING RATE OF EXTRUDED MAIZE PELLETS 26
3.2.2. Airflow meter
This meter measures the velocity and total pressure of the supplying air. It was installed into the
ducting, downstream from the air blower.
3.2.3. Scale
A digital scale was used to weigh the initial product that will be placed into the testing tube. For
the verification of the calculation of the moisture loss, the product is also weighed after the test.
3.2.4. Product moisture analyser
A product moisture tester was used to measure the moisture content of the product before and
after each test. This was also used to verify the moisture loss calculation.
3.2.5. Blower
An air blower was used to supply air to the product bed.
3.2.6. Variable speed drive
The variable speed drive (VSD) was used to control the blower speed, which in turn controls the
air velocity by means of altering the frequency of the blower motor.
3.3. Experimental process
Immediately after the extrusion process took place, the product was placed inside the testing
tube onto the perforated plate. Testing was done at 4 different air flow speeds, namely 1, 1.4; 1.8
and 2.2 m/s. To specify the air velocity testing parameter values, testing was done at a bed height
of 0.4 m and the air velocity was increased to the point where the product bed was in the
fluidized state. This velocity value was then chosen to be the highest testing air velocity
parameter, which was 2.2 m/s. Three other values derived from the highest testing parameter at
an interval of 0.4 m/s were chosen, to ensure that the values represent the range of values used
in the industry.
The values of the bed height were chosen to best represent the conditions in industry and
according to the available resources and finances. This lowest value chosen was 0.1 m and it was
increased to 0.4 m in 0.1 m intervals. Testing was then done at each combination of bed height
and air velocity to obtain 16 data points.
3.4. Recapitulation
A custom manufactured experimental test bed setup enabled the investigation to determine the
influence that the air velocity and product bed height had on the drying process of the extruded
maize pellets. The instruments used were an airflow meter, scale, moisture meter and a relative
humidity sensor. Testing was performed at air velocities of 1; 1.4; 1.8; 2.2 m/s in combination
with product bed heights of 0.1; 0.2; 0.3 and 0.4 m.
The next chapter will present the results that were obtained in the experimental tests. It will
include the processing of the results and the presentation of useable information concerning the
cooling/drying performance of extruded maize pellets.
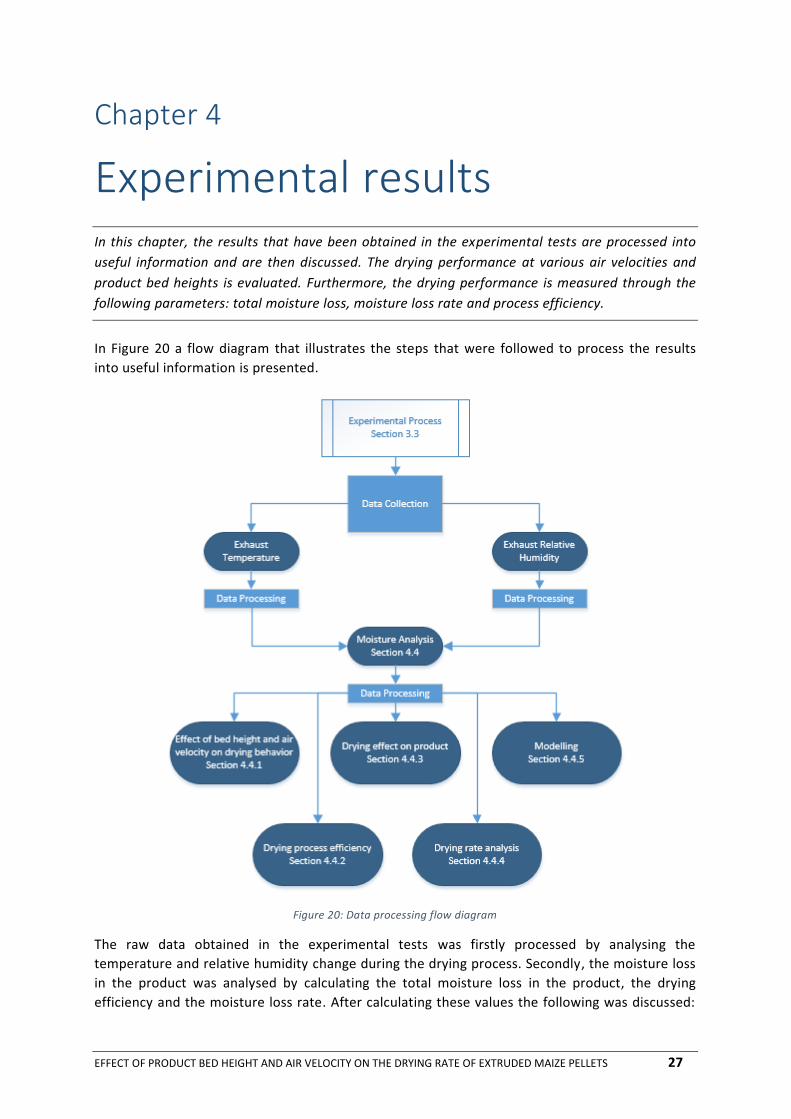
EFFECT OF PRODUCT BED HEIGHT AND AIR VELOCITY ON THE DRYING RATE OF EXTRUDED MAIZE PELLETS 27
Chapter 4
4. Experimental results In this chapter, the results that have been obtained in the experimental tests are processed into
useful information and are then discussed. The drying performance at various air velocities and
product bed heights is evaluated. Furthermore, the drying performance is measured through the
following parameters: total moisture loss, moisture loss rate and process efficiency.
In Figure 20 a flow diagram that illustrates the steps that were followed to process the results
into useful information is presented.
Figure 20: Data processing flow diagram
The raw data obtained in the experimental tests was firstly processed by analysing the
temperature and relative humidity change during the drying process. Secondly, the moisture loss
in the product was analysed by calculating the total moisture loss in the product, the drying
efficiency and the moisture loss rate. After calculating these values the following was discussed:

EFFECT OF PRODUCT BED HEIGHT AND AIR VELOCITY ON THE DRYING RATE OF EXTRUDED MAIZE PELLETS 28
the effect the bed height and air velocity have on the drying behaviour, the drying process
efficiency, the drying effect on the product, drying rate analysis and lastly the mathematical
modelling. These processed results were used to specify the optimal drying process parameters
to dry the extruded maize product.
4.1. Assumptions
The assumptions made during the processing of results are that the:
Dryer is ideally insulated.
Solids are uniform in size, spherical and homogeneous.
Physical properties of the product remain constant over time.
Shrinkage of the solids and temperature gradient inside the pellets are neglected.
The assumptions made have a relatively small effect on the results, while if they were to be
included it would have a dramatic effect on the model complexity. The author in [41] stated that
models are developed to predict drying kinetics; these models include from analytical models
with simplified assumptions to only empirical models based on experimental data [41].
4.2. Captured data
Measurements of the exiting air after it moved through the wet extruded product were taken
during experimental testing. The logger took a reading of the relative humidity and dry-bulb
temperature at a two second interval. The logger’s readings were plotted on a graph, as indicated
in Figure 21. This figure represents the temperature and the relative humidity over time. Similar
graphs for the 0.2, 0.3 and 0.4 m bed heights can be found in Appendix A. The graph below
presents a curve that has the same form than the curves at other bed heights. This data was
processed into sensible information from which good conclusions could be drawn of the effect of
bed height and air velocity on the drying process of extruded maize pellets.
Figure 21: Temperature and relative humidity over time at a 0.1 m bed depth
4.3. Result processing reasoning
The reason why a model based on empirical data was created, especially for the drying of a food
product that has not been experimentally tested, is the following:

EFFECT OF PRODUCT BED HEIGHT AND AIR VELOCITY ON THE DRYING RATE OF EXTRUDED MAIZE PELLETS 29
The mass transfer in foods is based on empirical operation and design due to the lack of mass
transfer properties available for various foods. [39] Process calculations and the intricate
hydronomics are dryer and material specific. Models are developed to predict drying kinetics;
these models include from analytical models with simplified assumptions to only empirical
models based on experimental data [41].
According to [39], the drying of porous foods is rather complex. This is due to the interaction
between heat and mass transfer and the interaction between the airflow and the product.
Solutions for these problems are complex and present complicated computational problems.
Limited progress has been made to predict drying behaviour, which is due to the lack in data of
the thermodynamic properties of foods. The mathematical theoretical calculation model
solutions that are developed still need time to replace the regularly used empirical data in the
design of dryers. A lot of work is still needed to predict drying behaviour and to obtain analytical
solutions for the drying of foods [39].
The author in [9] did experimental tests and developed a model to estimate the moisture content
and temperature of the pellets in a counterflow cooler. The model he developed, predicted the
moisture content of the pellets at 3% to 60%. He concluded that the model can only be used to
predict the behaviour of different parameters. Additional research must be done to increase the
accuracy of the single pellet equation for drying rate in order to generate more accurate output
results. This author states that the temperature he predicted was lower than the temperature
obtained in the experiments. This can be attributed to the increased equilibrium moisture
content that then predicted an increased cooling effect of the evaporation [9].
4.4. Moisture analysis
In this section the moisture loss from the product into the air is analysed by means of different
performance parameters. The temperature and relative humidity readings were processed into a
moisture loss rate value. To achieve this, the moisture ratio content of the incoming air and the
outgoing air was calculated. The difference equals the moisture loss in the product. Air density
was estimated by using the EES built-in function. The mass flow of the moisture loss of the
product is calculated by using the following equation:
a a a bm V A (13)
Where ṁ is the mass flow rate of the air in kilogram per second and Ab the section area of the
product bed. Moisture loss is multiplied by the mass flow of the air to obtain the rate of moisture
loss.
The moisture loss calculations were verified by measuring the moisture in the pellets using a
moisture analyser. Further verification was obtained by weighing the pellets before and after
each test to calculate the moisture loss.
4.4.1. Effect of bed height and air velocity on moisture loss
This section will discuss the moisture loss behaviour in the product bed at different bed heights
and drying air velocities. The bed height and air velocity have an effect on the temperature. This
will be discussed first and then the moisture loss behaviour in the bed for both of these
parameters.

EFFECT OF PRODUCT BED HEIGHT AND AIR VELOCITY ON THE DRYING RATE OF EXTRUDED MAIZE PELLETS 30
4.4.1.1. Effect of bed height on drying behaviour
In Figure 22, the behaviour of the temperature of the exiting air at a constant air velocity of 1.8
m/s and at different bed heights (BH) can be seen. The curve is more or less the same for all the
air velocities and this graph illustrates the typical curve. This is indicating the effect that the
product bed height had on the temperature change of the exiting air. The bed heights were
changed from 0.1 m to 0.4 m in 0.1 m increments. The graph illustrates the temperature
difference between the ambient air and the exiting air that passed through the product. The
velocity was kept constant even though there would have been a pressure difference over the
bed as the bed height changed.
Figure 22: Air temperature difference over time at 1.8 m/s at various product bed heights
Figure 23 shows the percentage of moisture loss in the product over 300 s at various bed heights
at an air velocity of 1.8 m/s. This percentage is the ratio between the weight of the moisture lost
and the dry product.
Figure 23: Cumulative sum of moisture in exiting air over time

EFFECT OF PRODUCT BED HEIGHT AND AIR VELOCITY ON THE DRYING RATE OF EXTRUDED MAIZE PELLETS 31
Figure 22 shows the temperature difference between the ambient air and the exiting air over
time at an air velocity of 1.8 m/s. Evaporation of the moisture on the surface of the pellets
increased the temperature of the air, due to the heat of the moisture on the surface of the pellet.
It can be concluded from equation (14) that the larger the contact area between the pellets and
the air for a constant heat transfer rate, the more the outgoing temperature increases.
( )p i oQ h A T T (14)
In Figure 22 it is portrayed that the temperature change rate at the start of the test was the same
at all bed heights. However, the time period of the temperature change rate at the start was
larger for a 0.4 m bed height than a 0.1 m bed height. This caused a higher temperature
difference at the start of the test and increased the time for the product to reach ambient
temperature. This is due to the increased product bed area and bulk volume of the product. The
larger the volume of the product in the bed, the more heat is available.
An increase in temperature of the surface moisture leads to a decrease in the vapour pressure of
the moisture. This increases the difference between the vapour pressure of the moisture on the
pellet surface and the partial pressure of the moisture in the air, which in turn leads to an
increase in mass transfer. The equation below illustrates the mass transfer of the moisture from
the pellet into the air:
( )mw g p vs vg
dMm k A p p
dt (15)
Where mw is the moisture mass flow, dMm/dt is the moisture loss rate, pvs is the partial pressure of
the solid surface and pvg the partial pressure of the drying air. When the wet and warm pellets
entered the drying chamber, the moisture on the pellets’ surface evaporated due to the
difference in partial pressure mentioned above. When the pellets were subjected to ambient
temperature airflow, it cooled off and gradually lost the ability to evaporate moisture. Therefore,
the slower the cooling rate of the pellet, the longer the time that moisture has to escape by
means of evaporation. The temperature will reach ambient temperature and the product will
stop evaporating when the wet bulb temperature of the air equals the pellet surface
temperature, when no energy is exchanged and there is no difference in partial pressure.
To obtain the total percentage moisture that has been removed by the air, it is necessary to
calculate the area under the moisture loss rate over time. By using the equation below, the total
moisture lost can be determined.
dM
Mdt
(16)
Where M is the moisture in the exiting air, dM the moisture difference and dt the time
difference. To obtain the total percentage moisture lost in the product bed, the following
calculation is used:
%p
MM
W
(17)

EFFECT OF PRODUCT BED HEIGHT AND AIR VELOCITY ON THE DRYING RATE OF EXTRUDED MAIZE PELLETS 32
Figure 23 shows that the bed height had a small effect on the percentage of moisture lost, and
had a total moisture difference of about 0.5% of moisture at various bed heights over 300 s.
To explain this behaviour, it is necessary to calculate the average temperature of each kilogram of
product, to draw the conclusion that the heat distribution at different bed heights stays constant.
In investigating the amount of heat each pellet received, the amount of product per kilogram of
product is divided by the average temperature difference, as illustrated in Table 5. This will help
to understand the effect that the temperature has on the moisture loss and the effect the bed
height has on the cooling rate and moisture loss.
Table 5: Ratio of temperature and mass of product
Bed height (m) Weight of product
(kg)
Average temperature
difference between
ambient and exiting air
(°C)
Ratio [°C/kg]
0.1 0.8 0.6 0.75
0.2 1.6 1.25 0.81
0.3 2.4 2.1 0.88
0.4 3.2 2.4 0.75
The ratio stays more or less constant, which indicates that at each bed height the product per
kilogram receives more or less the same heat. This explains the small difference in moisture loss
at different bed heights. Furthermore, the natural ambient air physical properties changes can
also cause an uneven effect on the moisture loss. This can be due to ambient temperature and
relative humidity fluctuations that affect the evaporation. Although the bed height did not have a
constant correlation with the moisture loss, it can predict the moisture loss to a certain extent.
To conclude, the results obtained show that the final moisture content of the exiting air did not
change as the product bed changed. To verify this result, the author in [2] did a study on the
drying rate of solids in a batch fluidized bed and found that the drying rate is marginally
influenced by the bed height at a height over 50 mm. As holdup increases and air velocity stays
the same, the drying rate decreases due to the decrease in input enthalpy per unit mass [2].
4.4.1.2. Air Velocity
In this section, the moisture loss in the product will be analysed in terms of the air velocity value
through the product bed. To analyse the moisture loss, the temperature curve will be analysed at
different air velocities where after the percentage moisture loss will be analysed and discussed.
Finally, the total percentage moisture lost after 300 s will be plotted on a 3D axis. This will give an
idea of the behaviour of the moisture loss at different bed heights and air velocities.
Figure 24 presents the temperature difference of the exiting air and the ambient air over time at
a product bed depth of 0.4 m and various specified air velocities. Figure 24 shows that the change
in air velocity does not have a constant effect on the temperature change rate of the exiting air.
Thus, it is making the cooling performance very unsteady with the change in air velocity.
The equation below explains the temperature behaviour in terms of the heat transfer coefficient
in the product bed [10, 49].

EFFECT OF PRODUCT BED HEIGHT AND AIR VELOCITY ON THE DRYING RATE OF EXTRUDED MAIZE PELLETS 33
B
p a
p A a
a
d Gh A C G
(18)
where Ga is the air flow rate and dp the pellet diameter. It can be concluded from this equation
that an increase in air flow means an increased heat transfer coefficient. However, it does not
support the results of the experimental tests. Therefore, the small difference in temperature
behaviour at different velocities may be attributed to the difference in flow patterns through the
bed as the velocities changed. This was noticed while the experiments were done. The unstable
behaviour can also be attributed to the random packing of the pellets. A velocity change can
affect the area of the pellets reached by the air. If the area stays constant , the heat transfer
coefficient stays constant although the air velocity varies. Thus, the heat transfer coefficient
remains relatively similar at all air velocities.
Figure 24: Exhaust air temperature over time at a 0.4 m bed depth at various air velocities
Figure 25 presents the total moisture lost from the product at a bed depth of 0.4 m at different
specified air velocities.
Figure 25: Total moisture lost at 0.4 m bed depth

EFFECT OF PRODUCT BED HEIGHT AND AIR VELOCITY ON THE DRYING RATE OF EXTRUDED MAIZE PELLETS 34
Figure 26 presents the effect that the air velocity and the bed depth have on the total moisture
loss percentage of the product.
Figure 26: Effect of air velocity and bed depth on percentage of total moisture lost
It is clear that the total percentage moisture loss increases as the air velocity through the bed
increases. This can be attributed to the mass transfer equation below [2].
4
3
p mf aa
p
D VVK
d
(19)
Where V is the air velocity and K the mass transfer coefficient. As the mass flow rate of the air
increases, the potential of the air to carry the moisture out of the bed at an increased rate also
increases. As seen in a previous discussion, the air velocity did not have a great impact on the
temperature change rate. Therefore, it can be concluded that the reason for the total moisture
difference is the result of the mass transfer rate that has increased. It is therefore concluded that
the big difference in total percentage moisture loss can be attributed to the increased mass
transfer rate and evaporation rate. Furthermore, more moisture is lost due to the increased air
velocity. The higher the air velocity, the more moisture mass can be lifted out of the bed.
Calculating or predicting the mass transfer coefficient is very complex due to the change it
undergoes while drying occurs. Mass transfer, as is evident from the results, comes mostly from
the surface, but while surface moisture is removed mass transfer also occurs inside the product.
The product is dependent on both heat and mass transfer [2]. For the purpose of these
experiments, it was assumed that only mass transfer will be taken into account, since no diffusion
was taking place inside the product. There is no diffusion on the surface due to the low
temperature of the air.
The air velocity has a similar effect on moisture loss at different product bed heights. It shows
that at a higher bed height, there is a more constant correlation between the air velocity and the
EFFECT OF PRODUCT BED HEIGHT AND AIR VELOCITY ON THE DRYING RATE OF EXTRUDED MAIZE PELLETS 35
total moisture loss in the product. Figure 26 shows the effect that the air velocity and the bed
depth have on the moisture loss percentage.
It was evident that air velocity had a significant effect on the drying rate in terms of total
moisture loss in the product bed. The results of this investigation are presented in Figure 25. The
percentage moisture loss represents the percentage of total water per product mass in kg/kg.
Figure 25 indicates that the air velocity has a great effect on the moisture loss percentage per
hour. As the air enters the product from below, the air temperature increases as it moves
upwards through the product, gradually cooling the product from the bottom to the top of the
product bed. Therefore, a low bed depth will increase the cooling rate; thereby increasing the
possibility for thermal shock. As for the effect of the air velocity, more moisture is removed when
the air velocity is high, as this increases the mass transfer rate.
In the results obtained the temperature of the exiting air did not change as the velocity of the air
changed. In a deep bed there is a change in axial air velocity near the wall of the bed as the
porosity changes. The author in [50] states that there is a change of velocity and a pressure drop
along the bed. This velocity behaviour has an influence on the heat and mass transfer coefficient
in a deep bed and the effect seems to increase as the bed height increases [50].
In the results obtained, the moisture content of the exiting air increased as the velocity of the air
increased. This author states that as mass flow increased, so did the mass transfer coefficient and
this resulted in a faster evaporation rate. As the velocity increased, so did the static pressure over
the bed [51]. According to [1], the increase in gas flow rate in the bed dryer decreases the final
moisture content in the food. The author also found that the heat transfer and evaporation
coefficient increased as the velocity increased [1]. Furthermore, the drying rate is increased as
the airflow rate is increased, and the drying rate is decreased when the inlet humidity increases
[2]. According to [2], an increase in air velocity increases the drying rate in the constant drying
rate period and this has a small impact on the falling rate period [2].
4.4.2. Drying process efficiency
In this section, the drying efficiency will be investigated when the air velocity and bed heights are
altered. The drying efficiency is measured by the total moisture lost in 5 minutes per kilowatt of
blower power. Figure 27 shows the mass of moisture, in grams, that is lost from the product per
kilowatt power used by the air blower.

EFFECT OF PRODUCT BED HEIGHT AND AIR VELOCITY ON THE DRYING RATE OF EXTRUDED MAIZE PELLETS 36
Figure 27: Effect of air velocity and bed depth on the moisture lost per kilowatt
The graph indicates that as the air velocity is increased, the moisture loss efficiency increases. As
the air velocity increases through a fixed bed, the pressure drop increases linearly, thereby
increasing the power needed by the air blower. When the fluidization state is reached, the
pressure drop remains constant and the moisture loss rate increases, thereby increasing the
moisture loss efficiency of the drying process.
At an air velocity of 2.2 m/s, all specified bed depths have reached the bubbling fluidization state.
This high velocity was specified to investigate the effect of fluidization on the drying rate of the
maize pellets. Evaluating fluidization in terms of the energy usage is a sensible approach in terms
of optimizing the energy efficiency in a dryer.
Another efficiency that is important to take account for is the bed height and bed area ratio to
ensure even airflow. The airflow at a 0.1 m bed height on an area of 0.04 m2 is sufficient for even
airflow. Even distribution is guaranteed at a bed height of 0.2 m and an area of 0.04 m2 as
witnessed during experimental testing. Thus, there is a ratio of 0.2 between area and height, so A
= 0.2H.
4.4.3. Drying effect on product
The product moisture loss refers to the moisture loss in reference to the initial moisture content
of the product and the effect the moisture loss has on the product quality.
As the product exits the dryer, steam is blown from the product due to the pressure drop and
high temperature as the product exits the hole. The product then has to be transported to the
cooler/dryer, and in the process more moisture is lost. At the inlet of the cooler/dryer , the
average moisture content measured in kilogram water per kilogram product of the maize pellet is
12%. To achieve this moisture content after extrusion and to ensure the moisture content stays
constant all the time, the product flow and water flow rate in the extruder must be kept constant.

EFFECT OF PRODUCT BED HEIGHT AND AIR VELOCITY ON THE DRYING RATE OF EXTRUDED MAIZE PELLETS 37
Table 6 indicates the parameters that the TX32 extruder must be operated at to ensure the
correct pellet moisture content.
Table 6: Extruder operating parameters
Parameter Value
Product flowrate 80 kg/h
Dosing water flowrate 11 l/h
In-barrel moisture content 13.75%
Screw speed 700 rpm
Die hole size 3 mm
Amount of die holes 3
The final moisture content is also be influenced by the screw configuration, size of the barrel, and
the size of the screws. So the parameters mentioned above will just give an indication of the
parameter values and cannot be followed precisely. Other factors that will also influence the
drying rate are the product density, area and volume of the product.
As mentioned earlier, the total moisture content of the maize pellet is 12% when it reaches the
cooler/dryer. As stated by a food extrusion expert [52], when the maize pellet reaches a moisture
content of below 10%, the pellets are safe to store and can be shelved for a reasonable time. This
value is considered to be acceptable in the food industry. So to evaluate the drying of maize in
terms of safe moisture content, graphs will be used to indicate whether the product reaches the
acceptable moisture content in five minutes.
As the batch bed depth does not have a great influence on the drying rate of the pellets, the air
velocity will be evaluated to determine at which velocity the 10% moisture content will be
reached and the time it will take to reach that moisture content.
Figure 28: Specified moisture content at various air velocities

EFFECT OF PRODUCT BED HEIGHT AND AIR VELOCITY ON THE DRYING RATE OF EXTRUDED MAIZE PELLETS 38
The results in Figure 28 indicate that at 10% product moisture content is reached at different
times with a change in air velocity. This means, with an increase in air velocity through the bed,
the product will dry faster. As shown in Figure 28, an air velocity of larger than 1.4 m/s reached
the designated moisture loss in five minutes. However, between the velocities of 1.8 and 2.2 m/s,
the velocity reached a minimum fluidization velocity. Therefore, such a high velocity is not
preferable as this will cause uneven drying if used in a continuous process dryer.
For further investigation the ratio between the different air flows per volume product can be
analysed. This information can be used to see how much airflow is needed to dry a certain
amount of product. Another factor that must also be investigated is the effect that the product
density, area and volume has on the drying rate. To represent this ratio, a graph will present the
moisture content over time at different ratios. Figure 29 illustrates the moisture loss over time at
different airflows and volumes of product ratio, RA. RA has a unit measured in volume flow rate
of air to the volume of product in the bed.
Figure 29: Moisture content percentage at air flow and product volume ratio
It is evident that the higher the ratio, the quicker the moisture reached the accepted content.
However, such a high volume of airflow is not always possible due to financial and floor area
constraints. This graph can then be used to determine what airflow is needed to dry a certain
amount of product to the acceptable moisture content in a certain time.
4.4.4. Drying rate analysis
To analyse the drying rate of the product after the temperature and relative humidity in the
exiting air results were processed, the moisture loss rate over time can be calculated and plotted.
The moisture loss rate refers to the rate of moisture that leaves the product bed, while the drying
rate refers to the moisture loss at a certain product density and surface area.
The theoretical drying rate cR in a constant drying rate period is given by [53]:

EFFECT OF PRODUCT BED HEIGHT AND AIR VELOCITY ON THE DRYING RATE OF EXTRUDED MAIZE PELLETS 39
p
c
p
W dMR
A dt
(20)
Where Rc is the theoretical drying rate with unit kg2/m2s, W is the mass of the product, Ap is the
drying surface area of the product and /dM dt is the moisture loss rate in kg/s. The graph in
Figure 30 indicates the drying rate over time. The drying rate represents the rate at which
moisture will be lost at a certain product density, product surface area and volume. These results
are needed when the same material is used, but the density and the diameter differs. The drying
rate at different air velocities can be seen in Figure 30.
Figure 30: Drying rate at 0.4 m at different air velocities
In the figure above it is evident that this curve is similar to the moisture loss rate curve, since the
drying rate is only multiplied by constants to account for the density, area and volume of the
product.
As the pellet is exposed to higher air velocities, the moisture loss rates are higher than when the
pellets are exposed to low air velocities. Thus, a high air velocity is needed during the evaporation
phase to achieve a high moisture loss before the product temperature is too low to evaporate
any more moisture. The higher drying rate is due to the reduction of the external mass transfer
resistance caused by an increase in air velocity in the product bed.
This graph clearly indicates that, after the curve reached an early peak, the rate changes
constantly as the moisture is lost. This is due to the fact that only surface moisture is removed
and no diffusion is taking place in the pellet. As the velocity increases, the rate of moisture loss
decreases at a slower rate in the same way than with a lower velocity. This is due to the larger
amount of moisture that is lost. To predict the moisture loss or moisture content in a product at
different product bed heights and air velocities, a drying rate function is needed.
4.4.5. Modelling
This section will discuss the created mathematical model used to estimate the moisture loss and
the residence time at different bed heights and air velocities. The model will be created using the
data obtained from the experiments, thus it is empirical in nature. Equation (20) will be used to

EFFECT OF PRODUCT BED HEIGHT AND AIR VELOCITY ON THE DRYING RATE OF EXTRUDED MAIZE PELLETS 40
calculate the drying rate for each product bed height and air velocity. These values of Rc will be
plotted on a surface, as represented in Figure 31. To obtain a mathematical model to represent
the drying rates at a certain product bed height and air velocity, a curve fit will be executed to
obtain a function.
Figure 31: Surface plot of the drying rate
To estimate the drying rate Rc at a certain bed height and air velocity value, a curve fit was done
on the 3D plotted surface obtained from the experimental data, shown in Figure 32.
Figure 32: Drying rate fitted surface plot

EFFECT OF PRODUCT BED HEIGHT AND AIR VELOCITY ON THE DRYING RATE OF EXTRUDED MAIZE PELLETS 41
The function obtained from the surface plot with air velocity on the x-axis and bed height on the
y-axis was:
2
2 3 2 2 3
407.8 633.3 2441 364.4 989.4
8314 78.12 43.75 2426
6
8392
10V BH V V BH
RcBH V V BH V BH BH
(21)
This function can then be used to estimate the drying rate, which can then in turn be used to
estimate the amount of moisture lost after a certain time passed. The third degree polynomial fit
has a 95% coefficient confident bound and an R-square goodness fit of 0.9847.
To verify this model, it will be evaluated and compared to the experimental data. The moisture
loss over a certain time period will be calculated using the fitted function and then compared to
the experimental moisture loss. Table 7 presents the difference in results between the
experimental moisture loss and the moisture loss determined by using the drying rate function in
the constant drying period.
Table 7: Moisture loss calculation
Bed height
[m]
Air velocity
[m/s]
Theoretical drying rate [kg2/m2s]
Theoretical moisture loss
[g]
Experimental moisture loss
[g]
% error [%]
0.1 1 3.82E-05 14.60 15.80 8
0.1 1.4 5.23E-05 19.98 20.30 2
0.1 1.8 5.63E-05 21.47 21.50 0
0.1 2.2 8.00E-05 30.52 30.80 1
0.2 1 6.98E-05 26.66 24.30 -10
0.2 1.4 7.77E-05 29.65 27.50 -8
0.2 1.8 7.67E-05 29.29 30.30 3
0.2 2.2 9.70E-05 37.01 44.30 16
0.3 1 8.44E-05 32.20 33.50 4
0.3 1.4 1.05E-04 40.21 43.50 8
0.3 1.8 1.19E-04 45.40 51.70 12
0.3 2.2 1.55E-04 59.22 53.40 -11
0.4 1 1.32E-04 50.45 49.80 -1
0.4 1.4 1.86E-04 70.89 71.70 1
0.4 1.8 2.33E-04 89.04 85.10 -5
0.4 2.2 3.05E-04 116.36 124.70 7
From Table 7 it is evident that the largest percentage error is 16%, which is acceptable for this
application as some accuracy was sacrificed to simplify the function. The model that the author in
[9] developed, predicted the moisture content of the pellets at 3 to 60%. The model in this study
therefore is more accurate in terms of moisture loss estimation.
To calculate the residence time for a specified moisture loss, the following equation is used. M1
and M2 are the initial and final moisture contents, and by using this equation the residence time
tR can then be solved:
EFFECT OF PRODUCT BED HEIGHT AND AIR VELOCITY ON THE DRYING RATE OF EXTRUDED MAIZE PELLETS 42
1 2( )p
R
p c
Wt M M
A R
(22)
So to conclude, the mathematical model was created and can be implemented to calculate the
drying rate at bed heights between 0.1 and 0.4 m and air velocities of between 1 and 2.2 m/s.
4.5. Conclusion
Estimates of the residence time to dry the weight of the moisture that was recorded in the
experiments were made to see whether the constant drying rate can be applied to the drying that
takes place in ambient air. Looking at the error percentage, it can be concluded that the drying
rates can be used for this application. The constant drying rate can be used due to the fact that
the drying only occurs in the constant rate, since only surface moisture is removed. It is assumed
that no drying takes place during the falling rate period and if the air was hotter than the inside
of the pellet, the moisture will go over into the falling drying rate stage. Furthermore the model
the author in [9] created predicted a moisture content accuracy of between 3 to 60%, thus it can
be said that the model created in this study performs better.
This model can then be used, as will be evident from the next chapter, to design a counterflow
bed cooler/dryer. The drying rate can be estimated for different parameters and further
calculations can then be done to design a dryer with dimensions for optimum drying.
The results were verified with literature, which indicated that the results are in line with previous
literature in terms of the influence the different parameters has on the drying performance.

EFFECT OF PRODUCT BED HEIGHT AND AIR VELOCITY ON THE DRYING RATE OF EXTRUDED MAIZE PELLETS 43
Chapter 5
5. Model based preliminary design In this chapter, the system specification and design of the dryer will be discussed. This will include
a discussion of the design parameters, dryer dimensions and the drying process design. The
information that was collected from the results will be used to design a counterflow cooler.
5.1. Design parameters
In order to start to design a cooler/dryer, certain requirements and parameters must be
specified. To specify these parameters, they must be understood and specified according to
realistic limits. In this section, the design parameters are going to be discussed and the influence
each has on the design of the dryer/cooler.
5.1.1. Percentage moisture loss required
The percentage moisture required can be specified to attain a certain final percentage of
moisture content, or it can be specified to maximum moisture loss in five minutes. The moisture
loss depends on the bed depth, air velocity, residence time, bed area and various material
properties.
The results obtained illustrated the percentage moisture loss at various air velocities and product
bed heights. These results can be used to predict at what bed depth or velocity the required
moisture is optimized. However, other factors must also be taken into account and these factors
will be discussed in the following sections.
5.1.2. Residence time
Residence time is the period of time that the product spends in the cooler/dryer bed. The
specification of residence time is closely linked to the product flow of the process. An increased
product flow rate at a constant bed area and bed height means a decrease in residence time, if
the cooler/dryer operates at a continuous rate. If the bed area is increased at a constant product
flow rate and bed height, the residence time will decrease. If the bed height is increased at a
constant bed area and product flow rate, the residence time will increase.
To calculate the residence time for a certain moisture percentage loss at a specific bed height and
air velocity, equation (22) can be used. After using this equation, a plot can be drawn at specific
parameters and then a polynomial curve fit can be performed.
Another design factor to consider is the fact that the increase in bed depth decreases the cooling
rate of the product. However, the product in all bed depths was cooled to within 5°C of ambient
temperature at 300 s. Therefore it can be assumed that the temperature will not be considered
after 300 s and that the bed depth will only vary between 0.1 m and 0.4 m.

EFFECT OF PRODUCT BED HEIGHT AND AIR VELOCITY ON THE DRYING RATE OF EXTRUDED MAIZE PELLETS 44
5.1.3. Air velocity
As seen before, when the air velocity is increased, the rate and total of percentage of moisture
loss increase. Air velocity can be a determining requirement if the plant only has a certain amount
of air. However, if a certain velocity is not required, it is wise to use the velocity just below the
minimum fluidization velocity, because this will ensure maximum drying performance and no
mixing of the product. When a certain air flow is specified, a balance between area and height
must be kept so that the velocity and power needed are the same.
To obtain the minimum fluidization velocity, the bed height value is needed. A chart can be drawn
up to present the pressure drop, bed height and air velocity.
4 ( ) 1
24 43 0.4Re Re
p s a
mf
a
dU
(23)
Reai a p
a
V d
(24)
The pressure drop over the product bed can be attained by:
(1 ) ( ) gb b s aP H (25)
With
1p
s b b
W
A H
(26)
as the bed height increases, the pressure also increases, while the air velocity decreases.
Therefore, to ensure even air distribution one should rather increase the bed height to ensure an
even airflow than to have a high velocity with an uneven airflow. Therefore it is most important
to keep the air velocity below the fluidization velocity. Through the whole process, efficiency
should always be kept in mind.
5.1.4. Bed height
As pointed out before, the product bed height does not have a significant impact on the drying
rate and total moisture loss at a constant air velocity. Therefore, the consideration that must be
kept in mind with bed height is that it influences the area. The higher the bed, the smaller the
area needs to be to accommodate the needed residence time. As the bed height increases, the
pressure drop increases. Therefore, more power is needed by the fan to produce the same speed
making it more expensive. The bed height does however affect the efficiency of the process,
because the higher the bed, the lower the efficiency. So the bed height can be optimized by
examining the area and the efficiency.
An important consideration that must be taken into account is the fact that a large area with a
low bed has much more potential for uneven air flow due to the small pressure drop. Therefore ,
it is wiser to choose a higher bed height, even though it affects the efficiency.

EFFECT OF PRODUCT BED HEIGHT AND AIR VELOCITY ON THE DRYING RATE OF EXTRUDED MAIZE PELLETS 45
To summarize, the bed depth can be obtained by the area to height ratio. If area is not provided,
the product flow will determine the bed height by using the residence time. A ratio of between 3
and 4 is used in the industry to determine bed depth and area.
5.1.5. Bed area
The bed area has no impact on the drying rate, but it does determine the bed height that is
needed for a specific residence time. As the bed area increases, it can also have a negative impact
on even airflow through the bed. To obtain even air distribution the pressure drop must be as
high as possible. A good bed area to height ratio ensures a good airflow distribution over the bed.
A ratio of 2-3 is usually used in the industry and has proven to achieve a good airflow distribution.
Bed area can be calculated with the area to height ratio and the product flow will determine the
area.
5.1.6. Other parameters
Other parameters such as the bulk density, particle density, and product rate have a significant
impact on the drying rate. These parameters must be considered in the calculations and the
percentage moisture loss rate.
5.2. Dryer dimensions
To obtain the appropriate bed area, the drying rate will be used to calculate the amount of
product that can be dried to specification. The experimental results indicated that a 0.4 m bed
height is ideal. The specification for drying might be 1% or 2% moisture loss according to the
application of the maize pellets. The drying of the maize pellets to a certain specification depends
on the bed depth and air velocity. The calculations were done in Microsoft Excel with input values
from Matlab, these calculations can be seen in Appendix A.
Table 8 can be used as input parameters to determine what floor space area are needed to dry
the product at a certain bed depth, air velocity and moisture content. However, the design for
this study is based on only one bed depth and one air velocity. The design will adhere to the
following specifications: (these specifications are for wet product entering the dryer).
Table 8: System specification
Specification Value
Initial moisture content 12% kg moisture/kg dry product
Bed height 0.4 m
Air velocity 1.8 m/s
Material density 524 kg/m3
Bulk density 200 kg/m3
Pellet diameter 9 mm (±1 mm)
According to the specification, the area needed for optimum moisture loss is 2.083 m2; which will
be rounded down to 2.0 m2 for ease of design. In order to simplify the design, it is best to design
the dryer in a square cross section, as it will keep the manufacturing simpler and easier. By doing
so, the side length will be 1.4 m.
EFFECT OF PRODUCT BED HEIGHT AND AIR VELOCITY ON THE DRYING RATE OF EXTRUDED MAIZE PELLETS 46
5.3. Drying process
In this section the drying process will be specified according to the area, product flow, bulk
density and residence time. The cooler was designed using a swivel valve bed that allows the
product to be released at intervals in order to ensure even drying of the total product. This
interval product height must be calculated when the timer is pre-set at 15 seconds on the valve
to ensure even product flow though the dryer. A 15 second interval is used as this is an interval
that was tried and tested by experienced process engineers and that is used in industry. 15
Seconds is enough to ensure even drying and gradual product flow.
The amount of product that must be dumped in each interval of 15 seconds to ensure a total
product flow of 2 ton/h, must be calculated. By calculating this value, the researchers know how
long the valve must be open at each interval. To evaluate whether the same amount of product is
dropped each time, one must ensure that the height of the bed must be lowered by a certain
value each time. Calculating this value is important to evaluate the amount of product dumped in
each interval. The following equation is used:
i p iW m t (27)
Where Wi is the interval weight to be dumped, ṁp is the product mass flow in kg/s and ti is the
interval time. To calculate the interval height, the following equation is used:
i b
i
b
W Ah
(28)
Where hi is the height of the product that must be dumped in each interval, Ab is the area of the
bed and ρb the bulk density of the product. The interval height is calculated as 0.02 m and the
weight of the product is 8.33 kg per interval.
The ideal air velocity will be just below fluidization air velocity, which is between 1.8 m/s and 2
m/s for a 0.4 m bed .The maximum optimum air flow is calculated using the following equation:
a a bQ V A (29)
To conclude, the final process specification will be shown in Table 9.
Table 9: Final process specifications
Parameter Value
Bed height 0.4 m
Air velocity 1.8 m/s
Interval time 15 sec
Weight per interval 8.33 kg
Height per interval 20 mm
Air flow rate 13500 m3/h
Efficiency 41.72 g/kW
Total moisture loss 85.1 g/s
Kg/h/m2 25 kg moisture/h/m2
Drying rate 2.28E-04 kg/s or 820 g/h
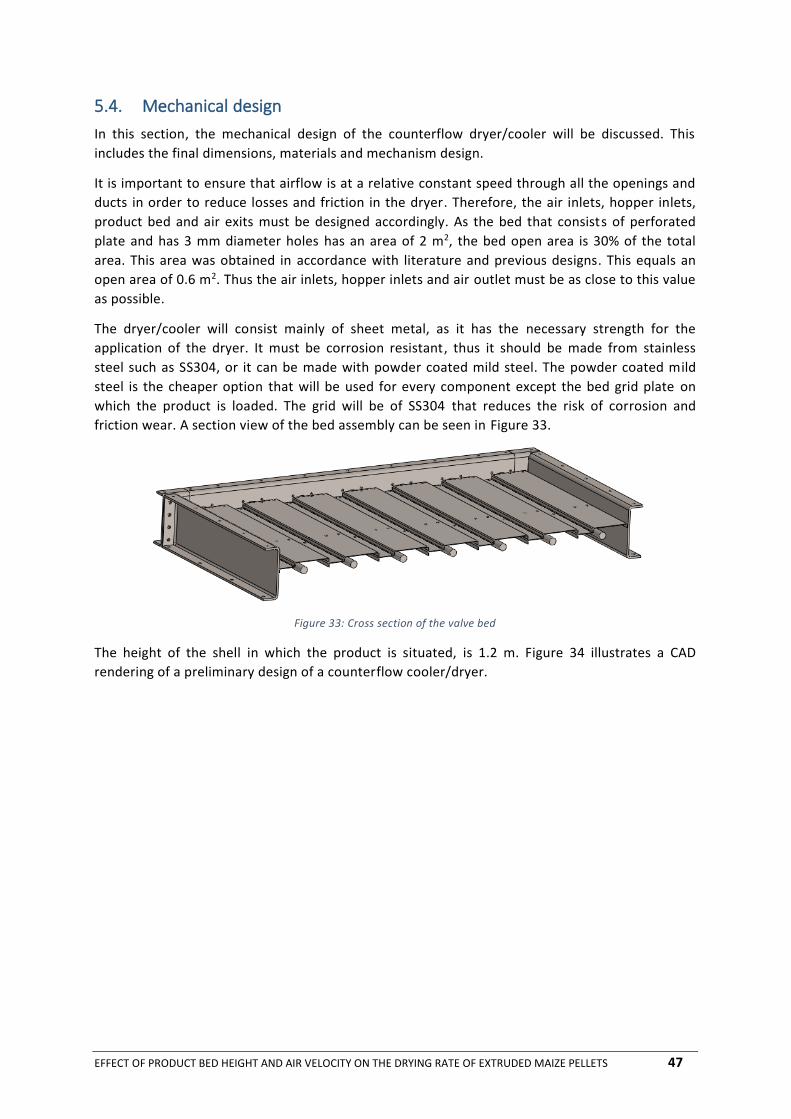
EFFECT OF PRODUCT BED HEIGHT AND AIR VELOCITY ON THE DRYING RATE OF EXTRUDED MAIZE PELLETS 47
5.4. Mechanical design
In this section, the mechanical design of the counterflow dryer/cooler will be discussed. This
includes the final dimensions, materials and mechanism design.
It is important to ensure that airflow is at a relative constant speed through all the openings and
ducts in order to reduce losses and friction in the dryer. Therefore, the air inlets, hopper inlets,
product bed and air exits must be designed accordingly. As the bed that consists of perforated
plate and has 3 mm diameter holes has an area of 2 m2, the bed open area is 30% of the total
area. This area was obtained in accordance with literature and previous designs. This equals an
open area of 0.6 m2. Thus the air inlets, hopper inlets and air outlet must be as close to this value
as possible.
The dryer/cooler will consist mainly of sheet metal, as it has the necessary strength for the
application of the dryer. It must be corrosion resistant, thus it should be made from stainless
steel such as SS304, or it can be made with powder coated mild steel. The powder coated mild
steel is the cheaper option that will be used for every component except the bed grid plate on
which the product is loaded. The grid will be of SS304 that reduces the risk of corrosion and
friction wear. A section view of the bed assembly can be seen in Figure 33.
Figure 33: Cross section of the valve bed
The height of the shell in which the product is situated, is 1.2 m. Figure 34 illustrates a CAD
rendering of a preliminary design of a counterflow cooler/dryer.

EFFECT OF PRODUCT BED HEIGHT AND AIR VELOCITY ON THE DRYING RATE OF EXTRUDED MAIZE PELLETS 48
Figure 34: Final preliminary counterflow cooler/dryer design
5.5. Conclusion
As shown in this chapter, a complete process design can be done based on the results that were
obtained. The main parameters that influence the operation and performance of the dryer/cooler
and the way in which they were implemented in the design process, was discussed. The chapter
also discussed how the performance is affected by a change in the main parameters.
The next chapter will discuss the conclusions derived from this study and recommendations for
future study will be presented.

EFFECT OF PRODUCT BED HEIGHT AND AIR VELOCITY ON THE DRYING RATE OF EXTRUDED MAIZE PELLETS 49
Chapter 6
6. Conclusions and recommendations This chapter will include the conclusions obtained in this study and will make recommendations
for further research. The conclusions are based on the results that were obtained and on whether
or in what way these results solved the problem.
6.1. Conclusion
It can be concluded that the air velocity through the product bed and the product bed height do
have an effect on the drying and moisture loss rate of extruded maize pellets. Furthermore this
information can aid in the design of a counterflow cooler/dryer. The following information will
describe the conclusions made on different subjects which all forms part of the solution to the
problem.
6.1.1. Moisture loss rate
The total moisture lost from the product to the atmosphere increased as the bed depth increased
due to the decreased cooling rate of the pellets and the increased amount of product in the bed.
The total moisture lost from the product to the atmosphere increased as the air velocity through
the product bed increased. Moisture loss with increasing air velocity is mainly increased due to
the increase in mass flow rate. Therefore, by increasing the air velocity, the moisture can leave
the pellets faster. However, a faster air velocity does not influence the cooling rate of the pellet.
This can be due to different flow patterns as the speed increases or because the velocity did not
increase the heat transfer coefficient.
6.1.2. Drying efficiency
The efficiency measured in grams of moisture lost per kW of fan power increased as the product
bed height and air velocity through the product bed increases.
6.1.3. Decreases temperature rate.
An increase in product bed height led to a decreased cooling rate of the pellets that allowed a
longer time in which moisture could evaporate from the pellet surface. Moisture loss is mainly
influenced by the decreased temperature cooling rate that allowed an increase in moisture lost in
the process, resulting in increased evaporation.
Therefore, the conclusion that can be made is that the bed must stay warm for as long as possible
to increase the moisture loss. This can take place when the bed depth is increased.
6.1.4. Experiments and research
By doing experiments, the drying rate has been obtained at various bed depths and air velocities,
for only one time of 300 seconds. Thus, this research can only be used for these specifications
presented in Table 10:

EFFECT OF PRODUCT BED HEIGHT AND AIR VELOCITY ON THE DRYING RATE OF EXTRUDED MAIZE PELLETS 50
Table 10: Research limits
Parameter Description
Residence time 300 s
Bed depth 0.1 to 0.4 m
Air velocity 1 to 2.2 m/s
Product Maize extruded product
Ambient air temperature 18°C to 25°C
This research can account for different product densities and diameters of the same material
than that used in the experiments. All tests were done at an ambient temperature of 18°C to
25°C. The results indicate that the ambient temperature for each test varies too little to draw
conclusions on the effect the inlet temperature has on the drying and cooling process. The
obvious effect that the air temperature is going to have is that as the temperature decreases, the
pellets will cool down quicker. A speculation can be made that this will decrease the drying rate
due to a lack of an evaporation period.
6.1.5. Modelling
This drying rate model can be used to ease the design process by using a simple function to
estimate the drying rate at different bed heights and different air velocities. As many food
machinery designers use their expert experience to design dryers, the information obtained in
this study can help the designer to optimize the design for performance. The model, as indicated
earlier, has a maximum error percentage of 16%, which is acceptable for this application. The
error percentage is a result of the simplification that sacrifices the accuracy of the information.
The author in [9] did experimental tests and developed a model to estimate the moisture content
and temperature of the pellets in a counterflow cooler. The model he developed, predicted the
moisture content of the pellets at 3% to 60%. The model in this study has estimated moisture loss
to 16% accuracy; therefore this model performs better than the model in [9].
6.1.6. Model based preliminary design
The results can be used for a preliminary design of a counterflow cooler, mainly based on the
model created from the experimental data. A fully specified counterflow cooler has been
designed and can be used in the industry. The information presented in the study can also predict
the influence of parameter changes on the drying performance of a design cooler/dryer.
6.2. Recommendations for further work
Performing further experiments at higher air speeds and higher bed depths can provide more
options for the parameters of the dryer that can increase the efficiency and drying rate even
more. To perform tests at a higher test bed, additional financial assistance, that was not available
during the experiments that were performed for this study, is needed. It is recommended that
further tests must be done to investigate the effect that the perforated plate holes has on the
drying rate of the maize pellets. The effect that different air temperatures have on this type of
dryer should also be examined.
The model used can be improved by accounting for mass and heat transfer that will increase the
complexity of the model, but also the accuracy.
The experimental method accuracy can be increased by using more accurate and faster
processing equipment and instruments.

EFFECT OF PRODUCT BED HEIGHT AND AIR VELOCITY ON THE DRYING RATE OF EXTRUDED MAIZE PELLETS 51
6.3. Closure
Experimental tests were done to obtain data for the effect air velocity and bed height has on the
drying rate of extruded maize pellets. The data was then processed and presented into
information can aid the design of a counterflow cooler/dryer. The information includes the
optimum parameters for optimum drying rate and the drying rate model at various air velocities
and bed heights. Thus this information can help to design a counterflow cooler and dryer for
optimum energy efficiency at several parameters. If a cooler/ dryer is already manufactured this
information can help to improve efficiency and estimate the drying rate of the extruded maize
pellets.

EFFECT OF PRODUCT BED HEIGHT AND AIR VELOCITY ON THE DRYING RATE OF EXTRUDED MAIZE PELLETS 52
7. Bibliography
[1] A. N. Wanjari, B. N. Thorat, C. G. Baker and A. Mujumdar, “Design and modeling of plug flow
fluid bed dryers,” Drying Technology: An International Journal, vol. 24, no. 2, pp. 147-157,
2006.
[2] C. Srinivasa Kannan, S. Subba Rao and Y. Varma, “A kinetic model for drying of solids in batch
fluidized beds,” Industrial and engineering chemistry research, vol. 33, no. 2, pp. 363-370,
1994.
[3] I. Alaathar, S. Heinrich, J. Werther and E. Hartge, “Modeling and flowsheet simulation of
continuous fluidized bed dryers,” Powder Technology, vol. 238, pp. 132-141, 2013.
[4] V. Srivastava and J. John, “Deep bed grain drying modeling,” Energy Conversion and
Management, vol. 43, no. 13, p. 1689–1708, 2002.
[5] E. Hajidavallo, “Hydronomic and thermal analysis of a fluidized bed drying system,” Ph.D
Thesis, Halifax, Canada, 1998.
[6] M. Stakic´, P. Stefanovic´, D. Cvetinovic´ and P. Škobalj, “Convective drying of particulate
solids – Packed vs. fluid bed operation,” International Journal of Heat and Mass Transfer, pp.
66-74, 2013.
[7] American Institute of Chemical Engineers. Equipment Testing Procedures Committee, Spray
Dryers: A Guide to Performance Evaluation, New York: American Institute of Chemical
Engineers, 1988.
[8] G. G. Schouten, “Counterflow cooler for pellets”. U.S.A. Patent US 4869162 A, 26 September
1989.
[9] D. E. Maier and F. W. Bakker-Arkema, “The counterflow cooling of feed pellets,” Journal of
agricultural engineering research, vol. 53, no. 13420, pp. 305-319, 1992.
[10] S. L. Fowler, “Optimal sizing of a counterflow cooler for feed pellets,” Oklahoma State
University, Stillwater, Oklahoma, 2004.
[11] P. Hensley, Interviewee, Personal Communication. [Interview].
[12] J. Locke, Interviewee, Personal Communication. [Interview]. 2008.
[13] G. Nonhebel and A. A. Moss, Drying of solids in the chemical industry, London: Butterworths,
1971.
[14] A. Topuz, M. Gur and M. Zafer Gul, “An experimental and numerical study of fluidized bed
drying of hazelnuts,” Applied Thermal Engineering, vol. 24, no. 10, pp. 1535-1547, 2004.
[15] A. S. Mujumdar, Handbook of industrial drying, London: Taylor and Francis Group, 2006.
EFFECT OF PRODUCT BED HEIGHT AND AIR VELOCITY ON THE DRYING RATE OF EXTRUDED MAIZE PELLETS 53
[16] M. Khanali, S. Rafiee, A. Jafari, S. H. Hashemabadi and A. Banisharif, “Mathematical modeling
of fluidized bed drying of rough rice,” Journal of Agricultural Technology, vol. 8, no. 3, pp.
795-810, 2012.
[17] C. Kettner, M. Peglow, T. Metzger and E. Tsotsas, “Distrubuted product quality in fluidized
bed drying,” Proceedings of the 15th International Drying Symposium, 2006.
[18] M. Peglow, U. Cunaus, C. Kettner, T. Metzger and E. Tsotsas, “A population balance approach
for continious fluidized bed dryers,” in 6th European Congress of Chemical Engineering,
Copenhagen, 2007.
[19] W. R. W. Daud, “Fluidized bed dryers — Recent advances,” Advanced Powder Technology,
vol. 19, no. 5, pp. 403-418, 2008.
[20] C. K. Gupta and D. Sathiyamoortthy, Fluid bed technology in materials processing, Boca
Raton: CRC Press, 1999.
[21] D. Escudero and T. J. Heindel, “Bed height and material density effects on fluidized bed
hydrodynamics,” Chemical Engineering Science, vol. 66, no. 16, pp. 3648-3655, 2010.
[22] D. Zhou, S. Dong, H. Wang and H. T. Bi, “Minimum fluidization velocity of a three-phase
conical fluidized bed in comparison to a cylindrical fluidized bed,” Industrial & Engineering
Chemistry Research, vol. 48, no. 1, pp. 27-36, 2008.
[23] A. Soria-Verdugo, L. M. Garcia-Gutierrez, N. García-Hernando and U. Ruiz-Rivas, “Buoyancy
effects on objects moving in a bubbling fluidized bed,” Chemical Engineering Science, vol. 66,
no. 12, pp. 2833-2841, 2011.
[24] D. Kunii and O. Levenspiel, Fluidization Engineering, Elsivier, 2013.
[25] N. Hilal, M. T. Ghannam and M. Z. Anabtawi, “"Effect of bed diameter, distributor and inserts
on minimum fluidization velocity,” Chemical Engineering and Technology, vol. 24, no. 2, pp.
161-166, 2001.
[26] C. N. Lim, M. A. Gilberson and A. L. Harrison, “Bubble distribution and behaviour in bubbling
fluidised beds,” Chemical Engineering Science, vol. 62, pp. 56-69, 2007.
[27] D. Pallares and F. Johnsson, “A novel technique for particle tracking in cold 2-dimensional
fluidized beds,” Chemical Engineering Science , vol. 61, pp. 2710-2720, 2006.
[28] W. C. Yang, Handbook of fluidization and fluid-particle systems, New York: CRC press, 2003.
[29] C. T. Crowe, Multiphase flow handbook, Boca Raton: CRC Press, 2006.
[30] F. Aberuagba, J. O. Odigure, K. R. Adeboye and M. A. Olutoye, “Fluidization characteristics of
a prototype fluidized bed reactor,” Leonardo Journal of Sciences, vol. 6, pp. 29-41, 2005.
[31] G. L. Metheson, W. A. Herbst and P. H. Holt, “Characteristics of fluid-solid systems,”
Industrial and Engineering Chemistry, vol. 41, pp. 1099-1104, 1949.
[32] H. P. Kuo and M. L. Ku, “On the plate design in a countercurrent single-stage fluidized bed

EFFECT OF PRODUCT BED HEIGHT AND AIR VELOCITY ON THE DRYING RATE OF EXTRUDED MAIZE PELLETS 54
system,” Advanced Powder Technology, vol. 19, no. 1, pp. 13-24, 2008.
[33] Unknown, “Mechanical Design Aspects,” Issue 3, pp. 1-105, Section 15.
[34] J. M. Paiva, C. Pinho and R. Figueiredo, “The influence of the distributor plate on the bottom
zone of a fluidized bed approaching the transition from bubbling to turbulent fluidization,”
Chemical Engineering Research and Design, vol. 82, no. 1, pp. 25-33, 2004.
[35] M. Wormsbecker, T. S. Pugsley and H. Tanfara, “The Influence of distributor design on
fluidized bed dryer hydrodynamics,” in The 12th International Conference on Fluidization -
New Horizons in Fluidization Engineering, Saskatoon, 2007.
[36] W. M. Lu, S. P. Ju, K. L. Tung and Y. C. Lu, “Stability analysis of perforated plate type single
stage suspension,” Korean Journal of Chemical Engineering, vol. 16, no. 6, pp. 810-817, 1999.
[37] D. Gauthier and G. Flamant, “Residence time distribution in a series of three tanks with
bypass and back-mixing: application to a multistage fluidized-bed,” Chemical engineering
communications, vol. 100, no. 1, pp. 77-94, 1991.
[38] C. S. Kannan, S. S. Rao and Y. B. Varma, “A study of stable range of operation in multistage
fluidised beds,” Powder Technology, vol. 78, no. 3, pp. 203-211, 1994.
[39] M. A. Rao, S. S. Rizvi and A. K. Datta, Engineering properties of food, CRC Press, 2005.
[40] Y. T. Makkawi and R. Ocone, “Mass transfer in fluidize bed drying of moist particle,”
Birmingham, Chemical Engineering & Applied Chemistry, Aston University, 2011, pp. 525-
548.
[41] C. Srinivasakannan and N. Balasubramanian, “An analysis on modeling of fluidized bed drying
of granular material,” Advanced Powder Technology, vol. 19, no. 1, pp. 73-82, 2008.
[42] N. Balasubramanian and C. Srinivasakannan, “Drying of granular materials in circulating
fluidized beds,” Advanced Powder Technol., vol. 18, no. 2, pp. 135-142, 2007.
[43] S. Husian, A. Horibe and N. Hakuri, “Heat and mass transfer analysis of fluidized bed grain
drying,” Memoirs of the Faculty of Engineering, Okayama University, vol. 41, no. 1, pp. 52-62,
2007.
[44] J. R. Banga, E. Balsa-Canto, C. G. Moles and A. A. Alonso, “Improving food processing using
modern optimization methods,” Trends in Food Science & Technology, vol. 14, no. 4, pp. 131-
144, 2003.
[45] A. A. Ogungbemi and C. O. Anyaeche, “Design and fabrication of a low cost fluidized bed
reactor,” Innovative Systems Design and Engineering, vol. 3, no. 3, pp. 24-35, 2012.
[46] J. J. Saastamoinen, “Comparison of Moving Bed Dryers of Solids Operating in Parallel and
Counterflow Modes,” Drying Technology: An International Journal, vol. 23, no. 5, pp. 1003-
1025, 2005.
[47] C. Sinivasakannan, A. A. Shoaibi and N. Balasubramanian, “Continuous fluidized bed drying
with and without internals: Kinetic model,” Chemical and Biochemical Engineering Quarterly,

EFFECT OF PRODUCT BED HEIGHT AND AIR VELOCITY ON THE DRYING RATE OF EXTRUDED MAIZE PELLETS 55
vol. 26, no. 2, pp. 97-104, 2012.
[48] K. J. Valentas, E. Rotstein and R. P. Singh, Handbook of food engineering practice, New York:
CRC Press, 1997.
[49] J. J. Barker, “Heat transfer in packed beds,” Industrial & Engineering Chemistry, vol. 57, no. 4,
pp. 43-51, 1965.
[50] J. P. Sitompul, Istadi and S. Sumardiono, “Modelling and simulation of momentum, heat, and
mass transfer in a deep-bed grain dryer,” Drying Technology: An international journal, vol.
21, no. 2, pp. 217-229, 2003.
[51] D. Zare and G. Chen, “Evaluation of a simulation model in predicting the drying parameters
for deep-bed paddy drying,” Computers and Electronics in Agriculture, vol. 68, pp. 78-87,
2009.
[52] D. Vorster, Interviewee, [Interview]. September 2015.
[53] P. Smith, Introduction to food process engineering, Lincoln: Springer, 2011.

EFFECT OF PRODUCT BED HEIGHT AND AIR VELOCITY ON THE DRYING RATE OF EXTRUDED MAIZE PELLETS 56
8. Appendices Not all information is given, this is just part of the calculations done to present an idea what
calculations have been done and what software was used.
A. Matlab results

EFFECT OF PRODUCT BED HEIGHT AND AIR VELOCITY ON THE DRYING RATE OF EXTRUDED MAIZE PELLETS 57

EFFECT OF PRODUCT BED HEIGHT AND AIR VELOCITY ON THE DRYING RATE OF EXTRUDED MAIZE PELLETS 58

EFFECT OF PRODUCT BED HEIGHT AND AIR VELOCITY ON THE DRYING RATE OF EXTRUDED MAIZE PELLETS 59
B. Engineering Equation Solver (EES) results processing

EFFECT OF PRODUCT BED HEIGHT AND AIR VELOCITY ON THE DRYING RATE OF EXTRUDED MAIZE PELLETS 60
C. Excel result processing

EFFECT OF PRODUCT BED HEIGHT AND AIR VELOCITY ON THE DRYING RATE OF EXTRUDED MAIZE PELLETS 61