Embed Size (px)
Citation preview

Int. J. Electrochem. Sci., 6 (2011) 6424 - 6441
International Journal of
ELECTROCHEMICAL SCIENCE
www.electrochemsci.org
Effect of pH, Salinity and Temperature on Aluminum
Cookware Leaching During Food Preparation
Essam A. H. Al Zubaidy1, Fathia. S. Mohammad
1 and Ghada Bassioni
2,*
1 Chemical Engineering Department, American University of Sharjah, UAE;
2 Chemical Engineering Departments, the Petroleum Institute, Abu Dhabi, UAE; on leave from Faculty
of Engineering, Ain Shams University, Cairo, Egypt *E-mail: [email protected]
Received: 12 October 2011 / Accepted: 2 November 2011 / Published: 1 December 2011
The amount of aluminum intake hazardous to human beings has been under study for quite some time
and has attracted particular attention from the society as it is believed to enhance diseases like the well-
known Alzheimer disease. This study measures the effect of pH, salinity and temperature of Egyptian
and Indian aluminum cookware during food preparation using different water types, tap water and
drinking water. In this study, the weight loss method is used to study aluminum leaching into different
food solutions. Environmental scanning electron microscopy is used to study the morphology of the
samples before and after exposure to the different food solutions. The Arrhenius equation is applied to
find activation energies. Aluminum is found very sensitive to low and high pH as the corrosion rate
increases in an alkaline environment. Corrosion rates are observed to decrease with drinking water
compared to tap water. Increasing salt concentration increases the corrosion rate up to a certain value
upon which a decrease is observed to reach a plateau of constant corrosion rates. This is attributed to
the combination of high conductivity and oxygen solubility.
Keywords: aluminum cookware, leaching process, aluminum intake, salinity
1. INTRODUCTION
Aluminum is the third most abundant element in the earth’s crust; existing mostly in the form
of insoluble aluminosilicate and oxides [1]. Medical researches link aluminum to various brain, blood,
and bones diseases. The cause of Alzheimer disease is still unknown, but aluminum might play a major
role for the cause of it. Aluminum often binds strongly with other substances in food such as fluoride
and phosphate, which may make it less absorbable. Studies report that beverages (tea, coffee and soft
drinks) and cereals (cakes, puddings, biscuits, breakfast cereals, bread, flour, oatmeal and rice) are the
main sources of aluminum from food. Aluminum-based food additives are widely used in bleaching,

Int. J. Electrochem. Sci., Vol. 6, 2011
6425
preserving and pickling processes, and in powdered foods such as instant coffee, dried milk, and table
salt. Bread, cake, biscuits and baking powders may have high aluminum levels if they contain
aluminum food additives. In order to reduce the amount of unwanted aluminum intake from cookware,
cooking acidic foods in uncoated aluminum pans must be avoided. Many reports suggesting that
fluoride in water increases the aluminum dissolved from cooking utensils have been disproved. Even
the use of aluminum foil during food preparation is assessed to have a significant risk on human health
[2].
Aluminum is naturally present in some water. Also, aluminum sulfate is widely used in the tap
water filtration process. Aluminum intake from water is very small; yet some studies state that the
human body can easily absorb aluminum when found in water. The amount of aluminum present in
drinking water has been recommended to be below 200 µg per liter by the World Health Organization
[3]. Assuming that an adult consumes two liters of water per day, the aluminum intake would be only
0.4 mg; less than one-tenth of the average daily aluminum intake from food. Aluminum salts are added
to water supplies in virtually most areas in the world according to the European Standard based on
aesthetic considerations of water color rather than on any estimate of possible health risk. Alternative
ways of water treatment are more expensive and less effective. Some water filters will remove
aluminum from water though not all are effective. The largest source of aluminum actually comes
from municipal water supplies. Many municipal water supplies are treated with both aluminum sulfate
and aluminum fluoride. The National Institutes of Environmental Health Sciences (NIEHS)
acknowledged that fluoride has been observed to have a synergistic effect on the toxicity of aluminum.
Several chemical coagulants, such as iron compounds and organic polymers, can be used instead of
aluminum-based coagulants [5]. The choice of the coagulant is based on a number of interrelated
factors. Water chemistry (e.g., pH and temperature) is the main factor that determines which type of
coagulant will perform most effectively. The most important reason why aluminum-based coagulants
are chosen is that the alternatives do not always remove pathogens and particles. If a treatment plant is
specifically designed to use alum with a certain type of water, it is not always possible to use an
alternative without adversely affecting the water quality. Aluminum found naturally in untreated water
is generally thought to be in a form that is not easily taken up by the body, and it is therefore of little
concern in terms of health effects. It is only during the alum treatment process that aluminum appears
to change into a form that may be more easily absorbed by the body. Like tap water, bottled waters
vary in their aluminum content. Aluminum may be found in some bottled waters because it occurs
naturally at the source.
Aluminum cookware, apart from other sources of dietary aluminum, is considered to be a
potential source of this metal to human beings. Various research groups report aluminum leaching
experimental results with food, beverages, and water under different experimental conditions modified
by varying the levels of pH as well as organic and inorganic ionic content. The results reported show
marked discrepancies in levels of leached aluminum. The apparent reason for such discrepancy in
leached aluminum levels can be attributed to factors such as non-systematic and non-uniform
experimental designs, non-standard conditions maintained during the experiments, and choice of
method for aluminum analysis [6].

Int. J. Electrochem. Sci., Vol. 6, 2011
6426
The complexing effect takes a very important role in the process of aluminum liberated from
cooking utensils. Increased concentrations of complexing ions (organic acids, fluoride ion, OH-, etc.)
significantly enhance the release of aluminum. The model suggests that in the pH range of most food
(pH 4–8); the aluminum present is predominantly in the form of organic aluminum complexes, which
is harmful to the human body [7]. Leaching of aluminum from utensils made of aluminum, indalium
(alloy of aluminum), stainless steel, and hard anodized aluminum is studied under different conditions
of pH and boiling time [8]. A low pH is found to enhance leaching of aluminum from the utensils. The
leaching is found to be the highest during first-time preparation (new utensils) of all the foods as
compared to second and third-time preparations using the same utensils. Leaching of aluminum during
the preparation of various traditional Indian foods is found to be negligible in hard anodized aluminum
utensils, indicating the advantage of using such vessels for food preparation over simple aluminum,
and indalium utensils [9].
The purpose of this study is to investigate the effect of pH, salinity, exposure time and
temperature on aluminum cookware during food preparation using different water types.
2. MATERIALS AND METHODS
Egyptian and Indian aluminum cookware are chosen from the local UAE market. The
cookware are cut into small rectangular shapes with dimensions of 1x1.2 cm, and each with a small
hole of 1 mm diameter at one end in order to hang them in the water sample. These samples are
exposed to drinking water, tap water as well as the following solutions:
Solution (1): 250 ml of 40% meat extract + 250 ml of tomato juice + 10g of citric acid
Solution (2): 250 ml of 40% meat extract + 250 ml tomato juice + 10 g of citric acid+5 g of salt
Solution (3): 250 ml of 40% meat extract + 250 ml tomato juice + 20 g of citric acid + 5g of salt
Tap and drinking water are used in preparation of the above solutions.
In the present work, the weight loss method (WL) at different temperatures is used to study the
aluminum leaching into different food solution samples. The aluminum specimens are cleaned by
distilled water and acetone, dried, and weighed using a four-digit sensitive balance. After the test,
aluminum samples are cleaned by distilled water followed by acetone and reweighed again. The pH of
the solution is also measured before and after the experiment. The corrosion rate and aluminum intake
per person calculations is presented in our previous work [10]. To assure consistency, all the
experiments are performed in duplicates.
The samples are analyzed, before and after the experiment, using environmental scanning
electron microscopy (ESEM) which is connected with an energy dispersive x-ray (EDX). This test
indicates about the leaching of the metals from the initial condition. Also the picture shows the damage
of the aluminum surface.

Int. J. Electrochem. Sci., Vol. 6, 2011
6427
3. RESULTS AND DISCUSSION
For the Indian samples, the corrosion rate and the aluminum intake per person in drinking
water, tap water, and the previous three food solutions are listed in Tables (1).
Table 1. Effect of food solution prepared in drinking and tap water on the Indian sample after two
hours of exposure at boiling temperatures
Solution Aluminum
Intake
(mg/person)
Corrosion Rate
(mg.cm-2
.hr-1
.10-2
)
Corrosion Rate
(mm/year)
Initial pH /
Final pH
Dri
nkin
g
wat
er
Pure water 100.75 10.5 3.4 7.0 / 9.3
Solution (1) 140.62 14.68 4.7 3.3 / 3.0
Solution (2) 121.11 15.58 5.06 3.0 / 2.8
Solution (3) 181.17 18.87 6.13 2.8 / 2.6
Tap
wat
er Pure water 301.93 31.45 10.2 7.3 / 9.1
Solution (1) 42.65 4.43 1.44 3.5 / 3.6
Solution (2) 61.44 6.64 2.16 3.4 / 3.0
Solution (3) 148.8 15.5 5.03 3.2 / 3.0
The above solutions represent the amount of aluminum leached by food in conditions close to
the real cooking. People usually add tomato paste, lemon juice, table salt and other spices during
cooking. The results show that leaching using drinking water alone is less than the one in tap water.
The leaching is increased in food solutions prepared by drinking water while it is reduced in food
solutions prepared by tap water.
The drinking water solution shows an increase in the leaching value as the salt and citric acid
concentrations increase (Solutions (1), (2), & (3)).The pH of the solutions are 3.3, 3.0 and 2.8,
respectively. This variation in the pH seems to be the reason for such behavior with the increase of
citric acid concentration. This lies in good accord to the study done by Shuing Bi who reports that the
OH- ions
significantly enhance the release of aluminum as the concentration of the complexing ions,
such as organic acids, increase [7]. Aluminum exhibits a passive behavior in aqueous solution due to
the protective compact Al2O3 film on its surface. However, the solubility of this protective film
increases in acidic and alkaline medium. According to Bi [7], the aluminum leaching in aqueous
solution may be explained by the following chemical reaction occurring on the surface of the
aluminum cookware sample:
Al2O3 + 6H+ = 2Al
3+ + 3 H2O
Where, the Al2O3 is the protective film on the whole surface (anode and cathode). The free aluminum
ions in solution react with organic acid found in food such as citric, oxalic and other complexing
ligands like hydroxyl. Most previous works have largely been concerned with the physical chemistry
of the aluminum dissolution and generally the results were thought to reflect chemical and

Int. J. Electrochem. Sci., Vol. 6, 2011
6428
electrochemical corrosion. Verissimo et al and Joshi et al report that aluminum leach more with these
additives [11, 12].
Figure (1A) shows the damage on the Indian sample that is exposed to drinking water at boiling
temperature for two hours. The figure clearly shows the severe localized attack which explains the
lower leaching value compared to tap water.
On the other hand, Figure (1B) shows the damage of the Indian sample that is exposed to
solution (1) which is prepared using tap water. The figure shows more uniform leaching.
A B
Figure 1. ESEM of the Indian sample after two hours of exposure to boiling drinking water (A) and
Solution (1) at boiling temperature in tap water (B).
The previous results indicate that the aluminum cookware is subject to destruction by some
acidic and salty food. Rim Karbouj reported the same conclusion [13].
For the Egyptian samples, the corrosion rate and the aluminum intake per person in drinking
water, tap water, and Solutions (1), (2), & (3) are listed in Table (2). The results show the same trend
as in the Indian samples but with different leaching values.
Table 2. Effect of food solution prepared in drinking water on the Egyptian sample after two hours of
exposure at boiling temperatures
Solution Aluminum Intake
(mg/person)
Corrosion Rate
(mg.cm-2
.hr-1
.10-2
)
Corrosion Rate
(mm/year)
Initial pH /
Final pH
Dri
nkin
g
wat
er
Water 21.39 2.22 0.72 7.0 / 9.1
Solution (1) 65.5 6.3 2.04 3.5 / 3.1
Solution (2) 100.63 10.5 3.4 3.2 / 3.0
Solution (3) 120.77 12.58 4.1 2.8 / 3.0
Tap
wat
er Water 403.8 42.1 13.6 7.3 / 9.4
Solution (1) 42.65 4.43 1.44 3.4 / 3.2
Solution (2) 42.65 4.43 1.44 3.2 / 3.0
Solution (3) 127.62 13.3 4.3 3.2 / 2.9

Int. J. Electrochem. Sci., Vol. 6, 2011
6429
Figure (2A) shows the damage on the Egyptian samples that are exposed to tap water at boiling
temperature for two hours. The leaching value is the highest among all the solutions from both
samples. The figure clearly shows that the damage is almost uniform on the whole sample.
A B
Figure 2. ESEM of the Egyptian sample after two hours of exposure to boiling tap water (A) and to
Solution (1) at boiling temperature in drinking water (B).
The aluminum intake resulting from using drinking water alone is 21.39 mg / person, while it is
three times more in Solution (1), five times more in Solution (2), and six times more when in Solution
(3).
A B
Figure 3. ESEM of the Egyptian sample after two hours of exposure to Solution (3) at boiling
temperature in drinking water (A) and in tap water (B).
Figures (2B) and (3) show the damages that occurred to the Egyptian samples after immersion
in Solutions (1) and (3), respectively. It is clear that the damage occurred due to Solution (3), which

Int. J. Electrochem. Sci., Vol. 6, 2011
6430
contains 20 mg of citric acid and 5 mg of salt, is more severe than the damage occurred due to Solution
(1), which only contains 10 mg of citric acid. In addition to that, the figures show that both samples are
subject to uniform and localized attack.
Figures (3A) and (3B) show the ESEM micrographs of the Egyptian sample after immersion in
Solution (3) prepared using drinking water and using tap water, respectively. The aluminum intake
values using both food solutions are almost similar; 127.62 mg per person resulting from Solution (3)
prepared using tap water and 120.77 mg per person resulting from Solution (3) prepared using drinking
water. Figure (3A) shows that the damage occurred due to the formation of localized corrosion with
little uniform corrosion. On the other hand, Figure (3B) shows that the damage occurred due to the
formation of uniform corrosion with little localized corrosion.
Using tap water, the prepared food solutions show again reduction in the leaching process
compared to tap water alone. Figures (2A) and (3B) show ESEM micrographs of the Egyptian sample
after immersion in tap water alone and in Solution (3), respectively. Figure (3B) shows that the sample
undertook some localized leaching as well as uniform leaching, which might be the reason for the low
leaching value.
The corrosion rate of the Egyptian and the Indian aluminum samples exposed to Solution (1)
prepared in tap water is 1.44 mm/yr. compared to 1.5 mm/yr. reported in a previous work [14].
3.1. Effect of immersion time
The effect of immersion time of the Indian cookware using drinking water at boiling
temperature is studied. The corrosion rate is increasing as the exposure time increases Figure (4).
The aluminum intake (mg/person) is recorded for test durations of 1-7h to be 40.3, 100.75,
120.90, 141.05, 161.20, 181.35 and 201.50, respectively.
0
1
2
3
4
5
6
7
8
0
0,05
0,1
0,15
0,2
0,25
0 1 2 3 4 5 6 7 8
Corrosi
on
Rate
(mg/c
m2.h
r)
Test Duration (hr)
Co
rro
srio
n
Figure 4. Effect of the time of immersion on the corrosion rate of the Indian sample in drinking water
at boiling temperature (solid line for mg/cm2.hr, and dotted line for mm/yr).

Int. J. Electrochem. Sci., Vol. 6, 2011
6431
The calculation of the average life of a pot having a thickness of 2 mm is based on the average
use of two hours per day. The corrosion rate corresponding to two hours is 3.4 mm/yr (Table 2). As a
result, the pots lose 7.8x10⁻⁴
mm from its thickness every day due to the use of pure drinking water
without the addition of any food, acid, or salt during food preparation. Food solutions with additives
increase the corrosion rate as seen in Table (1). If the corrosion mode is assumed to be uniform, then
the pot is damaged completely in about seven years. The life span of the pot is reduced to half in real
cooking conditions with the addition of meat, salt, acids, and spices. The life span is even more
reduced if the corrosion mode is localized, as shown in Figure (1).
Figure (5) shows that the aluminum intake per person increases continuously with the exposure
time. All the values between 40 to 200 mg per person show high levels of leaching; these values are
considered unacceptable related to the limitations and indicate a high health risk. Cooking for
additional hours, more than two, or using the pot to store food, after cooking, would increase the
leaching rate even more.
Figure 5. Effect of time of immersion on the aluminum intake of the Indian sample in drinking water
at boiling temperature.
0
0.2
0.4
0.6
0.8
1
1.2
1.4
1.6
1.8
0
0.02
0.04
0.06
0.08
0.1
0.12
0.14
0.16
0.18
2 24 48 72 408
Weig
ht L
oss
(mg
)
Co
rro
sio
n R
ate
(mg
/cm
2.h
r)
Time Duration (hr)
Figure 6. Effect of time on the corrosion rate and weight loss of the Indian sample in tap water (solid
line for corrosion rate, and dotted line for weight loss).
Int. J. Electrochem. Sci., Vol. 6, 2011
6432
The corrosion rate and weight loss of the Indian sample in tap water at room temperature show
the same behavior of the Indian sample in drinking water at boiling temperature (Figure (6)). The
corrosion rate is lower at room temperature than at boiling temperature. Comparing the leaching rates
of both temperatures for two hours shows that it is two and a half times more at boiling temperature
than at room temperature. It is reported that aluminum leaching is significantly higher at 100°C than at
the ambient temperature [13].
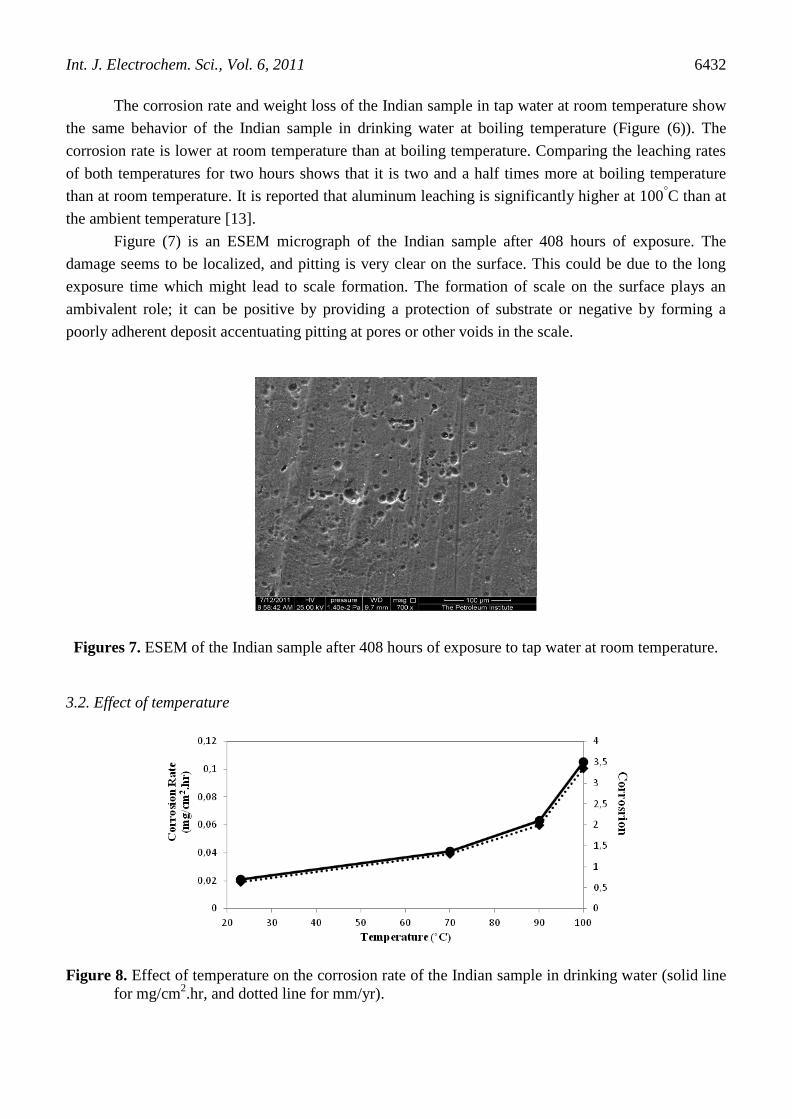
Figure (7) is an ESEM micrograph of the Indian sample after 408 hours of exposure. The
damage seems to be localized, and pitting is very clear on the surface. This could be due to the long
exposure time which might lead to scale formation. The formation of scale on the surface plays an
ambivalent role; it can be positive by providing a protection of substrate or negative by forming a
poorly adherent deposit accentuating pitting at pores or other voids in the scale.
Figures 7. ESEM of the Indian sample after 408 hours of exposure to tap water at room temperature.
3.2. Effect of temperature
Figure 8. Effect of temperature on the corrosion rate of the Indian sample in drinking water (solid line
for mg/cm2.hr, and dotted line for mm/yr).

Int. J. Electrochem. Sci., Vol. 6, 2011
6433
The effect of temperature on the Indian aluminum sample is studied using drinking water after
two hours of exposure (Figure (8)). The corrosion rates and the aluminum intake increase with
temperature. The aluminum leaching is five times higher at 100°C than at ambient temperature; this is
in agreement with the results discussed previously. At 185°C (oven work) the leaching is even more,
and the corrosion rate is more than eight times than that at 100°C.
The aluminum intake (mg/person) is recorded for temperatures (ºC) of 23, 70, 90, 100 and 185
(pan; pan area = 552.7 cm2) to be 20.15, 40.3, 60.45, 100.75 and 333, respectively.
The rate of aluminum leaching to water and food solutions depends on the temperature. As the
temperature increases, the molecules move faster and therefore aluminum contaminate food more
frequently. It is reported that the aluminum leaching is dramatically higher at 100°C than at ambient
temperature [13]. It is also reported that cooking temperature is more important in aluminum leaching
than cooking time [15]. The only way to explain the relationship between temperature and the rate of
corrosion is to assume that the rate of corrosion depends on the temperature at which the leaching is
running.
The temperature dependence of the corrosion rate (C.R.) could be correlated by Svante
Arrhenius equation:
C.R. = A e –Ea/RT
A is the pre-exponential factor or frequency factor
Ea is the activation energy in J/mole
R is the gas constant = 8.314 J/mole K
T is the absolute temperature
The energy of activation and the frequency factor can be found from an Arrhenius plot of Log
corrosion rate against 1/T as shown in Figure (9). The activation energy for the corrosion rate (leaching
process) is equal to 26.407 KJ /mole. This can be concluded from the following explanation.
Figure 9. Activation energy measurement by applying Arrenhius equation.

Int. J. Electrochem. Sci., Vol. 6, 2011
6434
From the above equation, the value of e –Ea/RT
at 23
°C is equal to 2.187 x 10
-5 while at 100
°C
the value is equal to 2.004 x 10⁻⁴
. From these numbers, the aluminum leaching process at boiling
temperature is eight times more than the amount of aluminum leaching at room temperature. The
aluminum leaching at 185 °C is four times more than that at boiling temperature.
The effect of temperature on the Indian aluminum sample is studied using drinking water after
two hours of exposure (Figure (10)). The corrosion rates at temperatures below 100 °C are less than
that in drinking water, while at 100 °C the corrosion rate is three times more than that in drinking
water.
The aluminum intake (mg/person) is recorded for temperatures (ºC) of 23, 70, 90 and 100 to be
20.15, 20.15, 40.3 and 301.93, respectively.
Figure 10. Effect of temperature on the corrosion rate of the Indian sample after two hours exposure to
tap water.
The temperature dependence of the corrosion rate (C.R.) using Arrhenius equation correlation
showed that the activation energy is approximately equal to 86.296 KJ/mole which is higher than the
value of drinking water by a factor of 3.3. This factor is also approximately equated by considering the
aluminum intake values.
From this equation, it can be seen that increasing the temperature from 70 °C to 100
°C caused
an increase in corrosion rate by more than ten times.
3.3. Effect of pH
The effect of the pH on the leaching behavior of the Egyptian cookware in salt solution (3.5
weight percent of NaCl in tap water) at room temperature, after six days of exposure, is reported in
Table (3).
Table (3) shows that the corrosion rate is high at low pH, it decreases after to a minimum pH of
6.4 then increases sharply to very high values at pH of 8 and 10. Similar behavior is reported by Wong
et al [16]. It is also reported that aluminum is very sensitive to high pH and shows a corrosion increase
Int. J. Electrochem. Sci., Vol. 6, 2011
6435
in alkaline environments. This result is almost similar to previous work [14]; also, Shuping Bi
indicated that leaching enhanced dramatically in the ranges of pH < 4 or pH > 8 [7].
Table 3. Effect of pH value on the corrosion rate of the Egyptian sample after six days of exposure to
3.5% NaCl solution in tap water at room temperature
Initial pH
Value
Final pH
Value
Weight Loss
(mg)
Corrosion rate
(mg.cm-2
.hr -1
)
1.2 1.7 20 0.0580
2.8 2.9 9.6 0.028
6.4 (native) 7.8 5 0.0146
8.2 7.6 37 0.1078
10 8.5 60 0.174
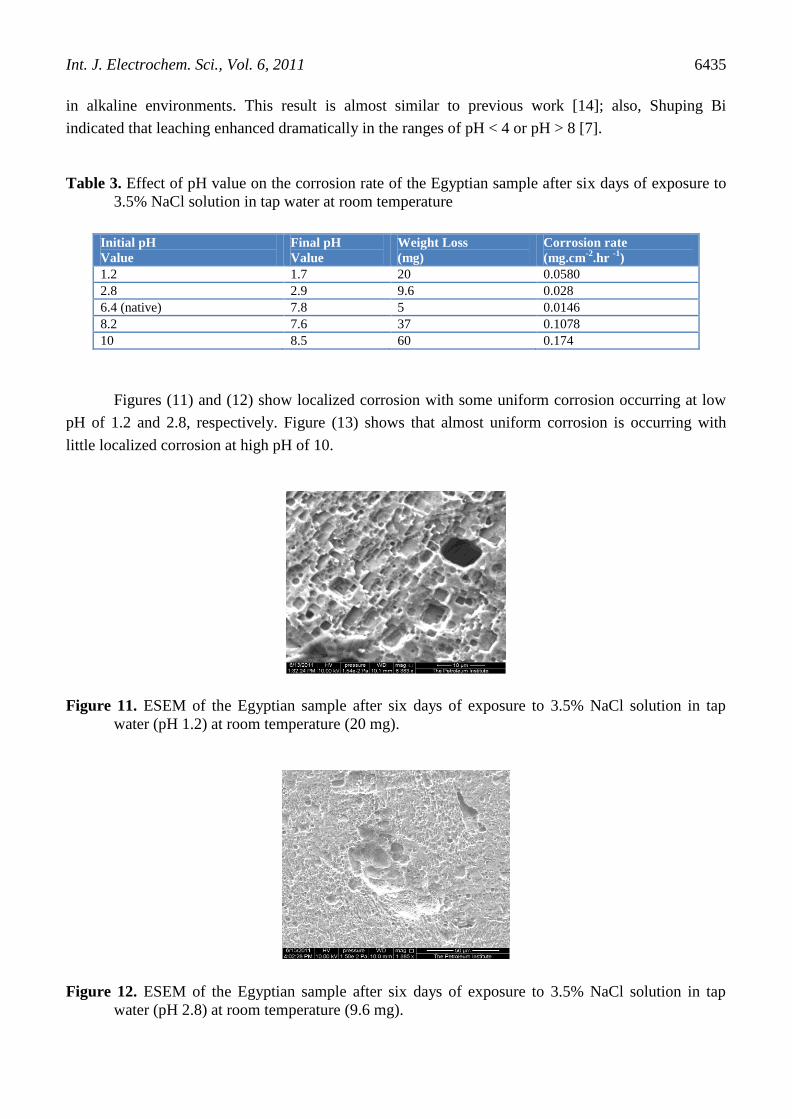
Figures (11) and (12) show localized corrosion with some uniform corrosion occurring at low
pH of 1.2 and 2.8, respectively. Figure (13) shows that almost uniform corrosion is occurring with
little localized corrosion at high pH of 10.
Figure 11. ESEM of the Egyptian sample after six days of exposure to 3.5% NaCl solution in tap
water (pH 1.2) at room temperature (20 mg).
Figure 12. ESEM of the Egyptian sample after six days of exposure to 3.5% NaCl solution in tap
water (pH 2.8) at room temperature (9.6 mg).

Int. J. Electrochem. Sci., Vol. 6, 2011
6436
Figure 13. ESEM of the Egyptian sample after six days of exposure to 3.5% NaCl solution in tap
water (pH 10) at room temperature (60 mg).
Figure (14) resembles the corrosion rate of Egyptian samples in 3.5 wt. % of NaCl in drinking
water at room temperature after two weeks exposure, but with huge reduction in the corrosion rate
compared to the first case. At pH of 2, 2.4, and 3.1 the localized attack is clearly noticed in Figures
(15), (16), and (17), respectively. While at pH of 6.7, there is very low uniform corrosion rate (Figure
(18)). Increasing the pH to 10 shows very severe local attack (Figure (19)); pitting is filling the whole
surface of the sample. It is previously reported that aluminum usually develops a protective surface of
oxide film upon exposure to the atmosphere or to aqueous solutions [17]. This film is responsible for
the corrosion resistance of aluminum in most environments when aluminum is exposed to high
concentration of acids or bases. This solution causes pitting corrosion to the aluminum in the presence
of chloride ions.
0
0.1
0.2
0.3
0.4
0.5
0
0.2
0.4
0.6
0.8
1
1.2
1.4
2 2.4 3.1 6.7 10 11
Co
rrosio
n R
ate
(mm
/yr)
Co
rro
sio
n R
ate
(mg
/cm
2.h
r x
10
-2)
Initail pH Value
Figure 14. Effect of pH on the corrosion rate of the Egyptian sample after two weeks of exposure to
3.5% NaCl solution in drinking water at room temperature (solid line for mg/cm2.hr x 10
-2, and
dotted line for mm/yr).

Int. J. Electrochem. Sci., Vol. 6, 2011
6437
Figures 15. ESEM of the Egyptian sample after 14 days of exposure to 3.5% NaCl solution in drinking
water (pH 2) at room temperature (8.4 mg).
Figure 16. ESEM of the Egyptian sample after 14 days of exposure to 3.5% NaCl solution in drinking
water (pH 2.4) at room temperature (7 mg).
Figure 17. ESEM of the Egyptian sample after 14 days of exposure to 3.5% NaCl solution in drinking
water (pH 3.1) at room temperature (4.4 mg).

Int. J. Electrochem. Sci., Vol. 6, 2011
6438
Figure 18. ESEM of the Egyptian sample after 14 days of exposure to 3.5% NaCl solution in drinking
water (pH 6.7) at room temperature (0.2 mg).
Figures 19. ESEM of the Egyptian sample after 14 days of exposure to 3.5% NaCl solution in drinking
water (pH 10) at room temperature (0.3 mg).
Figure 20. ESEM of the Egyptian sample after 14 days of exposure to 3.5% NaCl solution in drinking
water (pH 11) at room temperature (10 mg).

Int. J. Electrochem. Sci., Vol. 6, 2011
6439
The leaching in the same solution but at pH of 11 is higher than at any other pH. The mode of
reaction is a uniform corrosion; the grains and the grain boundaries are clearly shown in Figure (24).
The leaching is removing all the oxides from the surface. The above finding is in agreement with
previous works [7, 12-13].
3.4. Effect of salinity
Sea water is usually more corrosive than fresh water; this is related to the conductivity and the
penetrating power of the chloride ions through the surface. Egyptian cookware sample in various NaCl
solutions using tap water is studied for six days. This shows that the corrosion rate is increasing with
the concentration of NaCl; maximum value is at 2 wt. % of NaCl. After that, the corrosion rate
decreases to a constant value in 2.5% to 3.5%. The same behavior is reported for steel in various NaCl
solutions, but with a maximum corrosion rate in 2.7 wt. % of NaCl [13]. This is attributed to the
combination of high conductivity and the oxygen solubility to be at a maximum at this point. Solubility
of oxygen is reduced with increasing salt concentration; this is why the corrosion reduces as the
concentration increases.
Figure (21) shows the same behavior of the Egyptian samples in various NaCl solutions using
drinking water after 14 days exposure with the peak at 1.5 wt. % of NaCl.
0
0.1
0.2
0.3
0.4
0.5
0.6
0.7
0.8
0
0.5
1
1.5
2
2.5
3
1 1.5 2.5 3 3.5
Co
rro
sio
n R
ate
(mg
/cm
2.h
r x
10
-2)
Wt. % NaCl
Co
rrosio
nR
ate
(mm
/yr)
Figure 21. Effect of NaCl concentration on corrosion rate of the Egyptian sample (solid line for
mg/cm2.hr x 10
-2, and dotted line for mm/yr).
Figure (22A) indicates that the corrosion mode in 1.5 wt. % of NaCl is uniform, the grains and
the grains boundaries are clearly shown in the ESEM micrograph. Also the big weight loss of 20 mg
explains this behavior, while it is only 0.2 mg in the 2.5 wt. % of NaCl solution. Figure (22B) clearly
shows the pitting on the surface after the exposure to 2.5 wt. % of NaCl solution.

Int. J. Electrochem. Sci., Vol. 6, 2011
6440
A B
Figure 22. ESEM of the Egyptian sample after 14 days of exposure to 1.5% NaCl (20 mg) (A) and to
2.5% NaCl (B) solution in drinking water at room temperature (0.2 mg).
4. CONCLUSIONS
The amount of aluminum leaching depends on pH, salinity, temperature and time of exposure
as well as present ions in the medium. Increased ion concentration significantly increases aluminum
leaching since the complexing effect plays an important role which is studied by using tap water and
an ion-free medium, drinking water. Increasing salinity of the medium increases aluminum leaching
for both Indian and Egyptian samples under investigation with up to an effect of 6 times more than at
salt-free conditions. The aluminum intake per person increases significantly at higher cooking
temperatures. The obtained results indicate the necessity of aluminum leaching societal awareness and
call for undertaking necessary precautions either by aluminum cookware replacement or by the
cheaper option of aluminum passivation.
ACKNOWLEDGEMENT
The authors wish to thank the American University of Sharjah and The Petroleum Institute in Abu
Dhabi, UAE, for financial support.
References
1. G. D. Fasman, C. D. Moore, Proceeding of the National Academy of Sciences of the United States
of America, 9 (1994) 11232.
2. G. Bassioni, F. S. Mohammed, E. Al Zubaidy, I. Kobrsi, Food Chem. Toxicol, (2011), submitted.
3. Aluminum and Alzheimer’s disease, Information Sheet, Al Zeheimer Scotland Action on
Dementia, (2003) Oct. 4.
4. J. McGilton, “Drinking water studies on the effect of aluminum: Alzheimer and Aluminum is there
a connection?”, Nov. 6, 1997, retrieved on Aug. 6, 2011 from:
http://student.biology.arizona.edu/ad/water.html.

Int. J. Electrochem. Sci., Vol. 6, 2011
6441
5. Aluminum and Human Health, 2007, Health Canada, retrieved on Aug. 2, 2011 from:
http://www.hc-sc.gc.ca/ewh-semt/water-eau/drink-potab/aluminum-aluminium_e.html.
6. P. Rajwanshi, V. Singh, M. K. Gupta, S. Dass, Environ. Geochem Health, 19 (1997) 1.
7. S. Bi, Environmental Pollution, 92 (1996) 85.
8. A.D. Semwal, A. Padmashree, M. A. Khan, G. K. Sharma, A. S. Bawa, J. Sci Food Agricul., 86
(2006) 2425.
9. P. O. Snyder, 2008, “The effect of aluminum and iron cooking utensils on food”, Hospitality
Institute of Technology and Management, retrieved on Aug. 8, 2011 from: http://www.hi-tm.com.
10. F. S. Mohammed, E. Al Zubaidy, G. Bassioni, Int. J. Electrochem. Sci., 6 (2011) 222.
11. M. L. Verissimo, S. Oliveira, J. Gomes, Sensors and Actuators B, 118 (2006) 192.
12. S. P. Joshi, R. B. Toma, N. O. Medora, K. Connor, Food Chemistry, 83 (2003) 383.
13. R. Karbouj, Food Chem. Toxicol., 45 (2007) 1688.
14. M. Davies, P. J. B. Scott, “Guide to use materials in water”, NACE International, Houston, Texas
(2003).
15. S. Turhan, Meat Sci., 74 (2006) 644.
16. K. P. Wong, R. C. Alkire, J. Electrochem. Soc., 137 (1990) 3010.
17. A.Y. El-Etre, Corrosion Sci., 45 (2003) 2485.
© 2011 by ESG (www.electrochemsci.org)