Embed Size (px)
Citation preview
Chirdchan Pukkahutaa
Sujin Shobsngobb
Saiyavit Varavinita
a Department of Biotechnology,Faculty of Science,Mahidol University,Bangkok, Thailand
b Department of Chemistry,Faculty of Science,Mahidol University,Bangkok, Thailand
Effect of Osmotic Pressure on Starch: New Methodof Physical Modification of Starch
A new method of physical modification of starch in the presence of high concentratedsalt solution is presented, called “Osmotic Pressure Treatment” (OPT). OPT was intro-duced in order to produce the same physically modified products as obtained byconventional heat-moisture treatment (HMT) of starch. Potato starch was selected forthe comparative study of the two methods. For the OPT method, potato starch wassuspended in a saturated solution of sodium sulfate and heated in an autoclave at1057C and 1207C ,which corresponded to the calculated osmotic pressures of 328 and341 atm (332 and 345 bar, respectively) (assuming sodium sulfate dissociates com-pletely) for 15, 30 and 60 min, respectively. For the HMT method, starch with 20%moisture content was placed in a Duran bottle, then the same heat treatment methodin the autoclave was applied. Light and scanning electron microscopy (SEM) showedthat OPTof starch changed the shape of the starch granules to a folded structure, whilethe starches remained unchanged after HMT. The RVA viscogram for the OPT starchexhibited a decrease in the peak viscosity without a breakdown and an increase of thepasting temperature when increasing the temperature and time, which was in anagreement with the viscosity patterns for the HMT starches. X-ray diffraction patternswere altered from B to A1B for the HMTand from B to A type for the OPTstarch whentreated at 1207C. After OPT, the gelatinization temperatures (To, Tp, and Tc) of the starchincreased significantly with increasing temperature and time, whereas only the Tc ofstarch increases after HMT. The biphasic broadening of the peaks (high Tc-To) can beexplained by an inhomogeneous heat transfer during HMT. Narrow peaks in the DSCcurve can be an indication for a better homogeneity of the OPT samples. However,both methods provide a similar decrease in the gelatinization enthalpy (DH). The amy-lose-amylopectin ratio calculated from the HPSEC patterns was strongly increased forHMTstarches at 1057C for 60 min and 1207C for 30 min and decreased after treatmentat 1207C for 60 min. For OPT starches the ratio was strongly increased at 1207C for15 min and decreased after prolong heating. The OPT provides a uniform heat dis-tribution in the starch suspension. This allows the modified starch to be produced on alarger scale.
Keywords: Heat-moisture treatment; X-ray diffraction; A type pattern; B type pattern;Osmotic pressure; Potato starch
1 Introduction
Physically modified starches have become importantingredients of processed food because their functionalproperties are improved over those of the nativestarches. Moreover, the modification process can besafely used in various food products. Both annealing
(ANN) and heat-moisture treatment (HMT) cause aphysical modification of starches without a gelatiniza-tion or damage of the starch granules. Sizes, shapesand birefringence are unaffected. Both treatmentscause completely different alteration of the internalgranule structure [1]. Collado and Corke [2] discussedthe difference between the ANN and the HMT of starch.They stated that ANN represents “physical modificationof starch slurries in water at temperatures below gelati-nization” whereas HMT referred to the exposure ofstarch to higher temperatures at very restricted moisturecontent (18–27%).
Correspondence: Saiyavit Varavinit, Department of Biotechnol-ogy, Faculty of Science, Mahidol University, Rama 6 Road, Bang-kok 10400, Thailand. Phone: 166–22015315, Fax: 166–3547160, e-mail: [email protected].
78 Starch/Stärke 58 (2007) 78–90
© 2007 WILEY-VCH Verlag GmbH & Co. KGaA, Weinheim www.starch-journal.com
DOI 10.1002/star.200600509
Res
earc
hP
aper
Starch/Stärke 58 (2007) 78–90 Effect of Osmotic Pressure on Starch 79
The heat-moisture treated starches displayed remarkablechanges in X-ray diffraction patterns: crystallinity, starchchain interactions, granule swelling, amylose leaching,viscosity, gelatinization temperatures, retrogradation,acid and enzyme hydrolysis [3]. Although many changesmay equip the starch with new properties, heat-moisturetreated starches generally were produced only on a labo-ratory scale. The problems in the large-scale treatmentinvolve heterogeneous heat distribution and starch pene-tration [4] and condensation of steam during the treat-ment that results in a mixture of gelatinized and heat-moisture treated starch [5].
Sodium sulfate is most often used to protect gelatiniza-tion at high pH and temperature because it provides agood balance between protection and reaction efficiency[6–8]. Jane [9] found that sodium sulfate solutions effec-ted an increased up-field 13C-NMR shift when comparedto sodium chloride solutions, which was matched atequivalent cation concentrations. The result was attrib-uted to the hydration of sulfate ions, which enhanceddipole interactions as the amount of free water wasreduced. Consequently, the inhibitory effect of sodiumsulfate on starch gelatinization can be attributed to thereduction of the mobility of the solvent and a decrease ofthe aw-value thereby impeding the penetration of waterinto the granule.
The osmotic effect of saturated solution of sodium sul-fate on starch granules is introduced as a new physicalmethod of starch modification in this research. Normallyosmotic pressure can be measured with an osmometer.The osmotic pressure of a dilute solution is found toobey a relationship of the same form as the ideal gaslaw:
Posmotic ¼nRT
V
In chemistry texts, the pressure is usually expressed interms of the molarity (M) of the solution and given thesymbol:
p ¼ MR0T
In these relationships, R = 8.3145 J K21 mol21 is the nor-mal ideal gas constant and R’= 0.0821 L atm K21 mol21 isthe gas constant expressed in terms of liters and atmo-spheres; T is the temperature in kelvins.
In the presented study, the osmotic pressure treatment ofstarch is performed by suspending it in a saturatedsodium sulfate solution to obtained a uniform starch sus-pension and heat distribution. The saturated sodium sul-fate solution is also used to inhibit gelatinization duringheat treatment of starch. The properties of modified
starches produce by both HMT and OPT methods arealso reported.
2 Materials and Methods
2.1 Materials
Potato starch was purchased from Emsland-StärkeGmbH (Emlichheim, Germany). Sodium sulfate was pur-chased from Carlo Erba Reagenti SpA (Rodano, MI, Italy).Other reagents were analytical grade, and were pur-chased from Merck Co., Ltd. (Darmstadt, Germany).
2.2 Methods
2.2.1 Preparation of OPT potato starch
In a 500 mL Duran glass bottle (Schott, Mainz, Germany),100 g (dry basis) of starch was suspended in 200mLsaturated sodium sulfate solution (100g Na2SO4: 200mLdistilled water) and heated in an autoclave (TOMY ES-315,TOMY digital biology co., Ltd., Tokyo, Japan) at 1057C and1207C, which corresponds to the calculated osmoticpressure of 328 atm (332 bar) and 341 atm (345 bar)(assuming sodium sulfate dissociated completely) for 15,30 and 60 min. After the OPT process, the glass bottle wasremoved from the autoclave and cooled down to roomtemperature. Then the starch was taken out of the Duranbottle and washed with distilled water (86500 mL) toremove sodium sulfate by centrifugation at 45526g (J-6M/E, Beckman Coulter Inc., Fullerton, CA, USA). Testingfor any residues of sodium sulfate in the starch was pre-formed by precipitation with barium chloride solution.Then, the starch was dried at 407C in a hot air oven(Memmert GmbH, Schwabach, Germany) overnight.
2.2.2 Preparation of HMT potato starch
HMTwas carried out according to the method of Abraham[10]. Starch was adjusted to 20% moisture content byspraying the calculated amount of distilled water on thestarch in a mixing bowl and then mixing thoroughly for15 min. The exact moisture content of the mixture wasmeasured with an auto moisture analyzer (MA-30, Sarto-rius AG, Göttingen, Germany). After that, the moist starchwas placed in a Duran glass bottle with a screw cap andthe moisture of starch was equilibrated for 24 h beforebeing placed in an autoclave and heated at 1057C and1207C for 15, 30 and 60 min, respectively. Afterwards thestarch was removed from the bottle, cooled down to roomtemperature and dried at 407C in a hot air oven overnight.
© 2007 WILEY-VCH Verlag GmbH & Co. KGaA, Weinheim www.starch-journal.com
80 C. Pukkahuta et al. Starch/Stärke 58 (2007) 78–90
2.2.3 Proximate analysis, amylose content andsodium content
Moisture and ash contents of native potato starch weredetermined using the standard methods described in theOfficial Methods of Analysis by AOAC (Association ofOfficial Analytical Chemists) [11]. Protein content wasestimated from the nitrogen content obtained by theKjeldahl method (model VAPODEST 50 Carousel 250 mLautosample, and model Kjeldatherm-Digestion units, with20 digestion tubes 6100, 250 mL, both by Gerhardt,Königswinter, Germany) multiplied by 6.25 [12]. Fat con-tent of the sample was determined by the methoddescribed elsewhere [13]. Carbohydrate content wascalculated by subtracting the percentage of the afore-mentioned compounds from 100. Amylose content ofnative potato starch (based on weight that is free ofmoisture, protein, fat and ash) was determined by theiodine affinity method [14]. Sodium contents of native andOPT starches were determined by inductively coupledplasma optical emission spectrometry (Ultima2 ICP-OESspectrometer, HORIBA Jobin Yvon Inc., NJ, USA). In thisassay, 0.5 g (dry basis) starch sample was mixed with5 mL of HNO3 (67%, w/v) and 0.5 mL HCl (37%, w/v) in acleaned vessel. Then the vessels were heated in a micro-wave oven (Multiwave, Anton Paar GmbH, Graz, Austria)for 40 min until reaching a temperature of 2307C and apressure of 20 bar. After digestion, the solution was dilut-ed to 25 mL with deionized water for ICP-OES analysis.
2.2.4 Morphological observations
2.2.4.1 Light microscopy
Native, HMTand OPT potato starches were suspended indistilled water and dispersed onto microscope slides andviewed under normal and polarized light microscopes(Olympus BX 51, Olympus, Tokyo, Japan) with a cameraset (Olympus DP 12, Olympus, Tokyo, Japan).
2.2.4.2 Scanning electron microscopy (SEM)
A starch sample was mounted on SEM stubs with double-sided adhesive tape and coated with gold. Scanningelectron micrographs were taken using a JOEL JSM-5410LV microscope (JOEL, Tokyo, Japan). The accel-erating voltage and the magnification are given on themicrographs.
2.2.5 Determination of pasting properties
Pasting properties of native and modified starch weredetermined with a Rapid Visco Analyser (Series 4V, New-port Scientific Pty. Ltd, Warriewood, Australia). A starchsample (2.0 g, dry basis) and 25 mL distilled water weremixed in an aluminum can with a paddle. The heating and
cooling cycles were programmed as follows: The starchsuspension was held at 507C for 1 min, heated from 507Cto 957C at a rate of 127C/min and held at 957C for 2.5 min.Finally, it was cooled down to 507C at a rate of 127C/minand held at 507C for 2 min.
2.2.6 X-ray powder diffraction measurement
X-ray diffraction patterns of native starch and modifiedstarches were recorded with a Bruker X-ray powder dif-fractometer (D-8 type, Bruker, Rheinfelden, Germany) withcopper anode X-ray tube (Cu-Ka radiation) at 30 kV and30 mA. The scanning region of the diffraction angle (2Y)was from 57 to 307 at a step size of 0.47 with a count time of1.0 s and rotary speed of thesample holderof30 min21. Thestarch samples were equilibrated in a 100% RH desiccatorfor 24 h at room temperature prior to measurement.
2.2.7 Determination of thermal properties
Thermal properties of native and modified starch wereassessed by DSC (Differential Scanning Calorimeter,Pyris, Perkin Elmer, Belerica, MA, USA). Both native andmodified starches (based on weight free from moisture)were dispersed in distilled water to obtain a starch/waterratio of 1:2. Each starch suspension was then transferredto an aluminum pan (30 mL) and hermetically sealed. Afterequilibration at room temperature for 1 h., the sampleswere heated from 207C to 1007C at 107C/min. An emptypan was used as the reference and the DSC was cali-brated with indium. The onset (To), peak (Tp) and conclu-sion (Tc) temperatures of gelatinization, and the gelatini-zation enthalpy (DH) in J/g of dry starch were recorded.
2.2.8 High performance size exclusionchromatography
The average molecular weight (weight average) and thedegree of polymerization (DP) of HMT and OPT starcheswere determined using high performance size exclusionchromatography (HPSEC) using the method developedby Govindasmy et al. [15]. A Waters Associates (Milford,MA, USA) series liquid chromatography system with arefractive index (RI) detector and a guard column withthree Ultrahydrolgel columns was used. The columns,maintained at 407C, were connected in the followingorder: guard column with Ultrahydrogel linear followed bytwo Ultrahydrogel 120 columns. Deionized water wasused as mobile phase. The columns were calibrated withpolysaccharide standards with molecular weights of788,000, 404,000, 212,000, 112,000, 47,300, 22,800,11,800, 5,900, 738 and 180 (Polymer Laboratory Inc,Amherst, MA, USA), respectively. HPSEC starch sampleswere prepared by following the method of Jane and Chen[16]. Dried starch (0.05 g, base on weight free of moisture
© 2007 WILEY-VCH Verlag GmbH & Co. KGaA, Weinheim www.starch-journal.com
Starch/Stärke 58 (2007) 78–90 Effect of Osmotic Pressure on Starch 81
and protein) was mixed with 0.5 mL distilled water, anddimethyl sulfoxide (4.5 mL) was added. The suspensionwas mechanically stirred for 24 h at 257C to prepare a 1%starch solution. Absolute ethanol (20 mL) was then addedto the solution to precipitate the starch, followed by cen-trifugation to separate the precipitated starch. Pre-cipitated starch was redissolved in boiling water (10 mL)and stirred for 30 min and the final solution was passedthrough a 8.0 mm Millipore Filter (Sartorius, Göttingen,Germany) in order to remove the protein and other impu-rities prior to HPSEC analysis. Standard polysaccharideswere used for preparing the calibration graph used fordetermination of the degree of polymerization.
2.2.9 Statistical analysis
Analytical determinations of individual samples were done intriplicate and mean values and standard deviations report-ed. Data were statistically analyzed by independent sampleT-test and analysis of variance (ANOVA) test procedure andsignificant different were identified by Tukey’s HSD test (p ,
0.05) using SPSS 12.0 for windows (SPSS Inc., IL, USA).
3 Results and Discussion
3.1 Proximate analysis, sodium content ofpotato starch, and yield of OPT starches
The native potato starch employed in this investigationcontained 0.1% protein, 0.02% fat, 0.24% ash, 17.2%moisture and 82.5% carbohydrate (amylose content35.96%). In this study, sodium content of starch beforeand after the OPTat 1207C, 60 min were 101.8 mg/kg and105.3 mg/kg, respectively. These results indicate no sig-nificant change of sodium content after the OPT and thusno reaction had taken place during the treatment. Therecovery yields of the OPT starches were between 97.4and 98.5% based on the initial dry weight of the nativepotato starch.
3.1 Granule morphology
3.1.1 Normal and polarized light micrographs
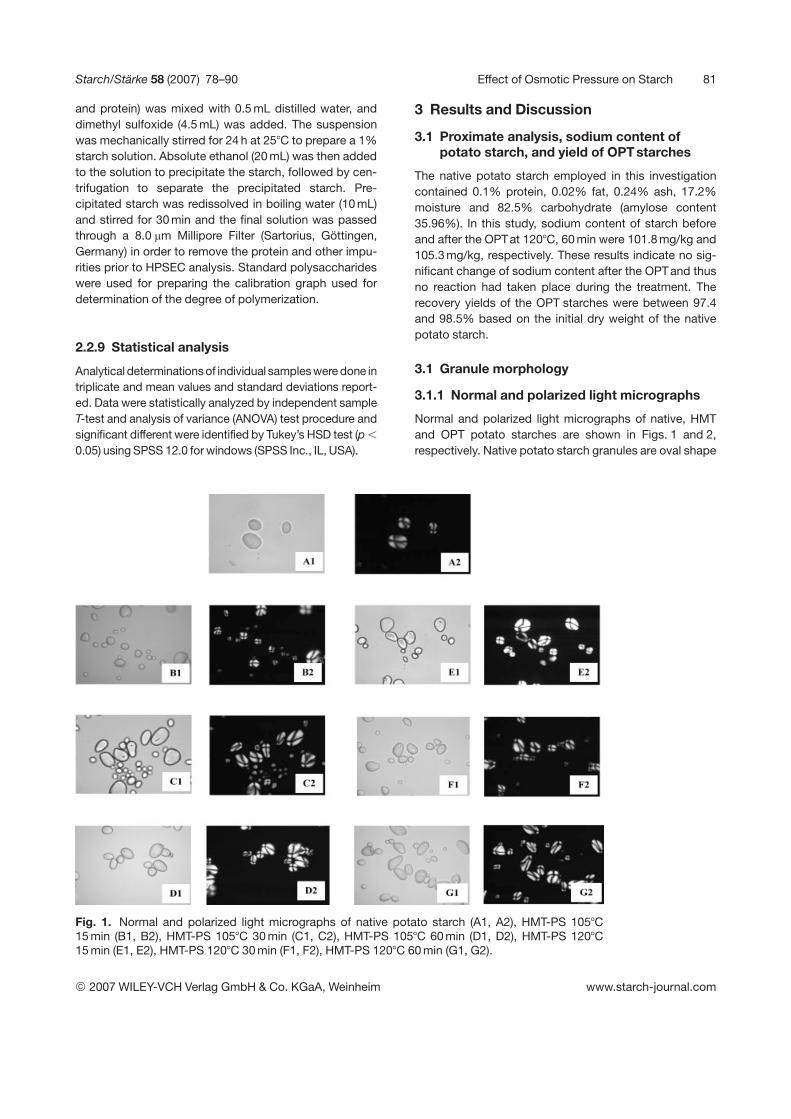
Normal and polarized light micrographs of native, HMTand OPT potato starches are shown in Figs. 1 and 2,respectively. Native potato starch granules are oval shape
Fig. 1. Normal and polarized light micrographs of native potato starch (A1, A2), HMT-PS 1057C15 min (B1, B2), HMT-PS 1057C 30 min (C1, C2), HMT-PS 1057C 60 min (D1, D2), HMT-PS 1207C15 min (E1, E2), HMT-PS 1207C 30 min (F1, F2), HMT-PS 1207C 60 min (G1, G2).
© 2007 WILEY-VCH Verlag GmbH & Co. KGaA, Weinheim www.starch-journal.com
82 C. Pukkahuta et al. Starch/Stärke 58 (2007) 78–90
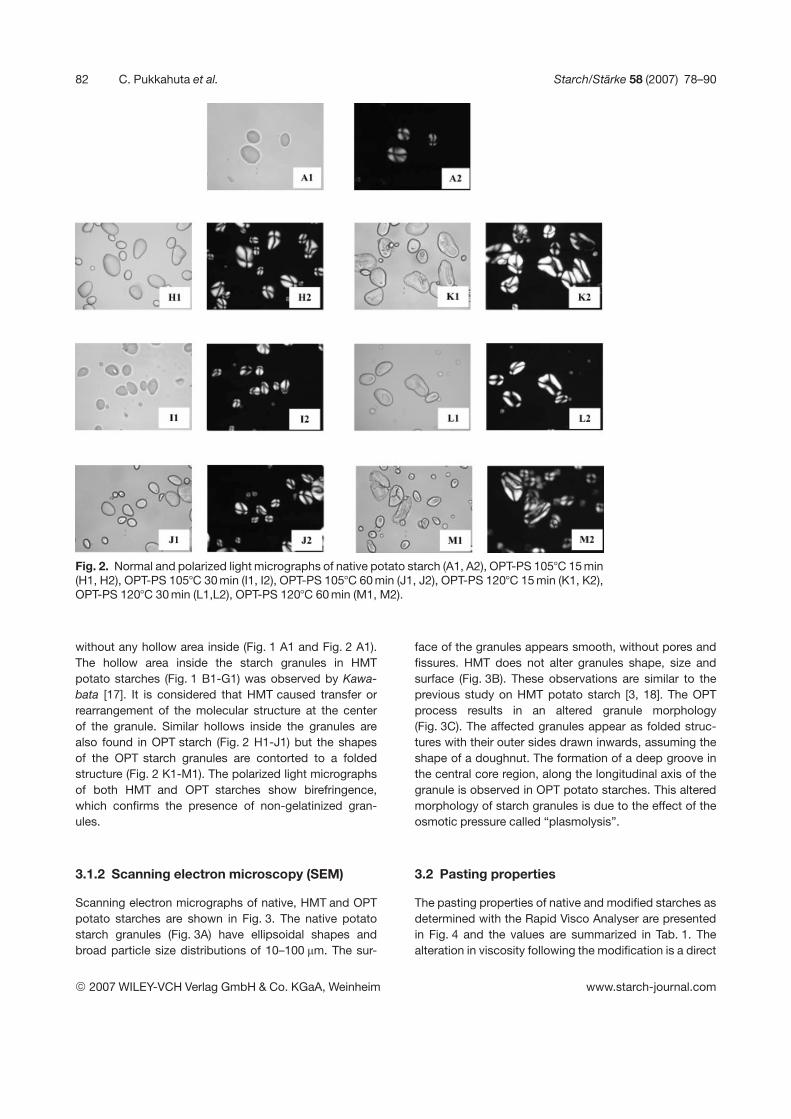
Fig. 2. Normal and polarized light micrographs of native potato starch (A1, A2), OPT-PS 1057C 15 min(H1, H2), OPT-PS 1057C 30 min (I1, I2), OPT-PS 1057C 60 min (J1, J2), OPT-PS 1207C 15 min (K1, K2),OPT-PS 1207C 30 min (L1,L2), OPT-PS 1207C 60 min (M1, M2).
without any hollow area inside (Fig. 1 A1 and Fig. 2 A1).The hollow area inside the starch granules in HMTpotato starches (Fig. 1 B1-G1) was observed by Kawa-bata [17]. It is considered that HMT caused transfer orrearrangement of the molecular structure at the centerof the granule. Similar hollows inside the granules arealso found in OPT starch (Fig. 2 H1-J1) but the shapesof the OPT starch granules are contorted to a foldedstructure (Fig. 2 K1-M1). The polarized light micrographsof both HMT and OPT starches show birefringence,which confirms the presence of non-gelatinized gran-ules.
3.1.2 Scanning electron microscopy (SEM)
Scanning electron micrographs of native, HMT and OPTpotato starches are shown in Fig. 3. The native potatostarch granules (Fig. 3A) have ellipsoidal shapes andbroad particle size distributions of 10–100 mm. The sur-
face of the granules appears smooth, without pores andfissures. HMT does not alter granules shape, size andsurface (Fig. 3B). These observations are similar to theprevious study on HMT potato starch [3, 18]. The OPTprocess results in an altered granule morphology(Fig. 3C). The affected granules appear as folded struc-tures with their outer sides drawn inwards, assuming theshape of a doughnut. The formation of a deep groove inthe central core region, along the longitudinal axis of thegranule is observed in OPT potato starches. This alteredmorphology of starch granules is due to the effect of theosmotic pressure called “plasmolysis”.
3.2 Pasting properties
The pasting properties of native and modified starches asdetermined with the Rapid Visco Analyser are presentedin Fig. 4 and the values are summarized in Tab. 1. Thealteration in viscosity following the modification is a direct
© 2007 WILEY-VCH Verlag GmbH & Co. KGaA, Weinheim www.starch-journal.com

Starch/Stärke 58 (2007) 78–90 Effect of Osmotic Pressure on Starch 83
Fig. 3. Scanning electron micrographs of potato starch granules. A: Native potato starch, B: HMTpotato starch (1207C, 60 min), C: OPT potato starch (1207C, 60 min).
Fig. 4. Pasting profiles of HMT(a) and (b) OPT potato starches.A: native potato starch, B:1057C, 15 min, C: 1057C, 30 min,D: 1057C, 60 min, E: 1207C,15 min, F: 1207C, 30 min, G:1207C, 60 min
© 2007 WILEY-VCH Verlag GmbH & Co. KGaA, Weinheim www.starch-journal.com
84 C. Pukkahuta et al. Starch/Stärke 58 (2007) 78–90
Tab. 1. Pasting properties of HMTand OPTof potato starch with various treatment temperatures and times.
Starchsample
Treatmenttemper-ature [7C]
Treatmenttime[min]
Peakviscosity[RVU]
Holdingstrength[RVU]
Breakdown[RVU]
Finalviscosity[RVU]
Setback[RVU]
Pastingtemperature[7C]
Native 2 2 570.50 6 2.18b 184.83 6 1.61a 385.67 6 0.77b 214.50 6 0.18e 29.67 6 1.48a 68.65 6 0.38a
HMT-PS 105 15 328.42 6 2.19a 283.42 6 1.33b 45.00 6 0.90a 376.92 6 1.01k 93.50 6 2.26b 71.05 6 0.09b
30 N.D. N.D. N.D. 359.17 6 1.61j N.D. 72.65 6 0.42c
60 N.D. N.D. N.D. 334.17 62.02i N.D. 75.00 6 0.10d
120 15 N.D. N.D. N.D. 259.33 6 2.31h N.D. 75.95 6 0.08e
30 N.D. N.D. N.D. 131.50 6 2.29b N.D. 88.00 6 0.11h
60 N.D. N.D. N.D. 113.50 6 1.84a N.D. 92.85 6 0.17j
OPT-PS 105 15 N.D. N.D. N.D. 643.58 6 1.67m N.D. 76.70 6 0.26e
30 N.D. N.D. N.D. 528.58 6 2.26l N.D. 79.85 6 0.19f
60 N.D. N.D. N.D. 252.08 6 1.77g N.D. 84.75 6 0.26g
120 15 N.D. N.D. N.D. 224.92 6 1.12f N.D. 87.20 6 0.13h
30 N.D. N.D. N.D. 173.58 6 1.23d N.D. 89.60 6 0.39i
60 N.D. N.D. N.D. 138.08 6 1.71c N.D. 92.05 6 0.49j
All data represent the mean of three determinations.Mean 6 standard deviation.Means with the same letter in each column are not significantly different (p = 0.05).N.D. = not detectable.
result of reorganization within the granule of the modifiedstarches. The RVA viscograms for the OPTstarch (Fig. 4b)exhibit a decrease in the peak viscosity and an increase inthe pasting temperature with increasing temperature andtime, which is in agreement with the patterns of viscosityfor the HMT starches (Fig. 4a). Lower peak viscosities,less breakdown and higher final viscosities are reportedfor heat-moisture treated potato starch [1]. The decreas-ing of peak viscosity and the breakdown viscosity can beattributed to the reduction in granular swelling. Thisreduction will reduce the destabilization effect on theamorphous region on crystallite melting [3]. Therefore, ahigher temperature will be required for starch swelling(higher pasting temperature) (Tab. 1).
3.3 X-ray diffraction patterns
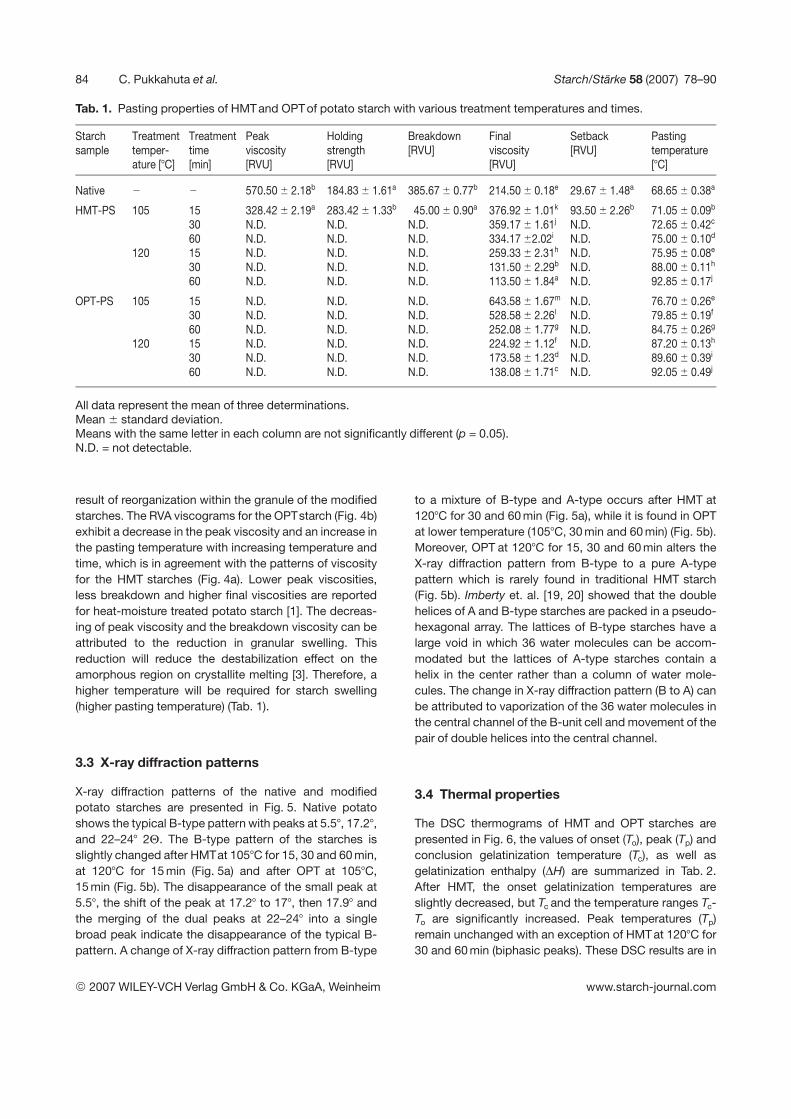
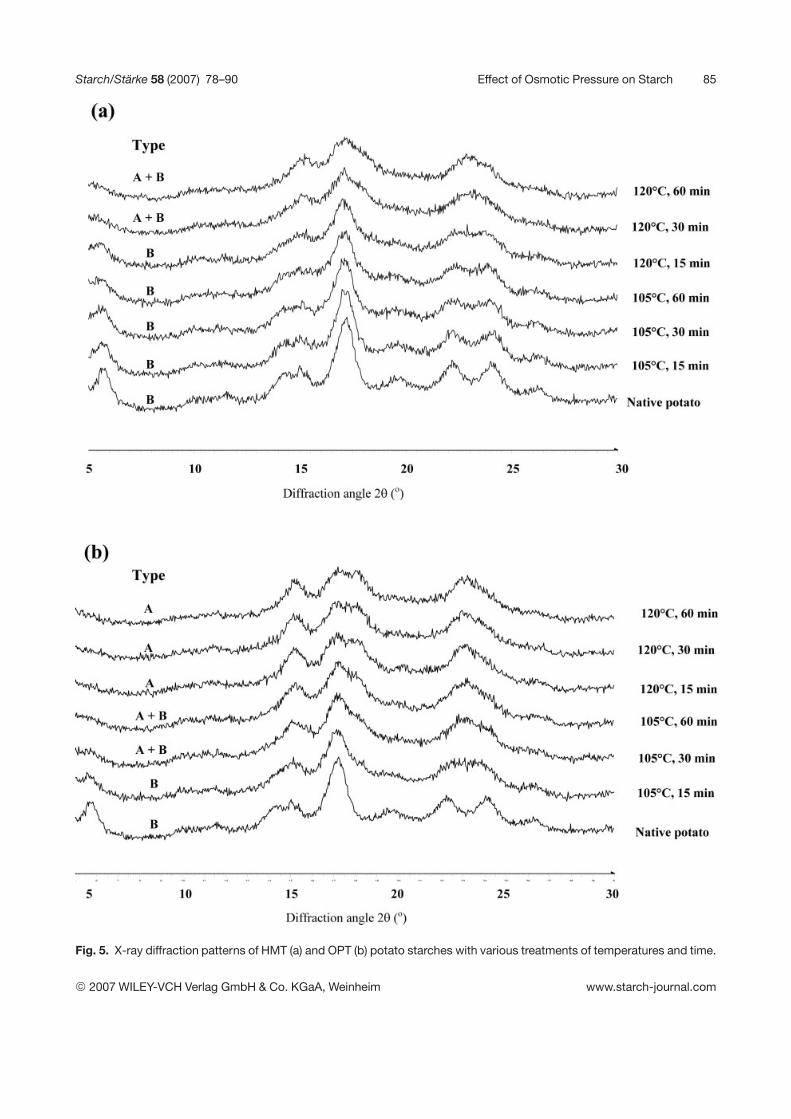
X-ray diffraction patterns of the native and modifiedpotato starches are presented in Fig. 5. Native potatoshows the typical B-type pattern with peaks at 5.57, 17.27,and 22–247 2Y. The B-type pattern of the starches isslightly changed after HMTat 1057C for 15, 30 and 60 min,at 1207C for 15 min (Fig. 5a) and after OPT at 1057C,15 min (Fig. 5b). The disappearance of the small peak at5.57, the shift of the peak at 17.27 to 177, then 17.97 andthe merging of the dual peaks at 22–247 into a singlebroad peak indicate the disappearance of the typical B-pattern. A change of X-ray diffraction pattern from B-type
to a mixture of B-type and A-type occurs after HMT at1207C for 30 and 60 min (Fig. 5a), while it is found in OPTat lower temperature (1057C, 30 min and 60 min) (Fig. 5b).Moreover, OPT at 1207C for 15, 30 and 60 min alters theX-ray diffraction pattern from B-type to a pure A-typepattern which is rarely found in traditional HMT starch(Fig. 5b). Imberty et. al. [19, 20] showed that the doublehelices of A and B-type starches are packed in a pseudo-hexagonal array. The lattices of B-type starches have alarge void in which 36 water molecules can be accom-modated but the lattices of A-type starches contain ahelix in the center rather than a column of water mole-cules. The change in X-ray diffraction pattern (B to A) canbe attributed to vaporization of the 36 water molecules inthe central channel of the B-unit cell and movement of thepair of double helices into the central channel.
3.4 Thermal properties
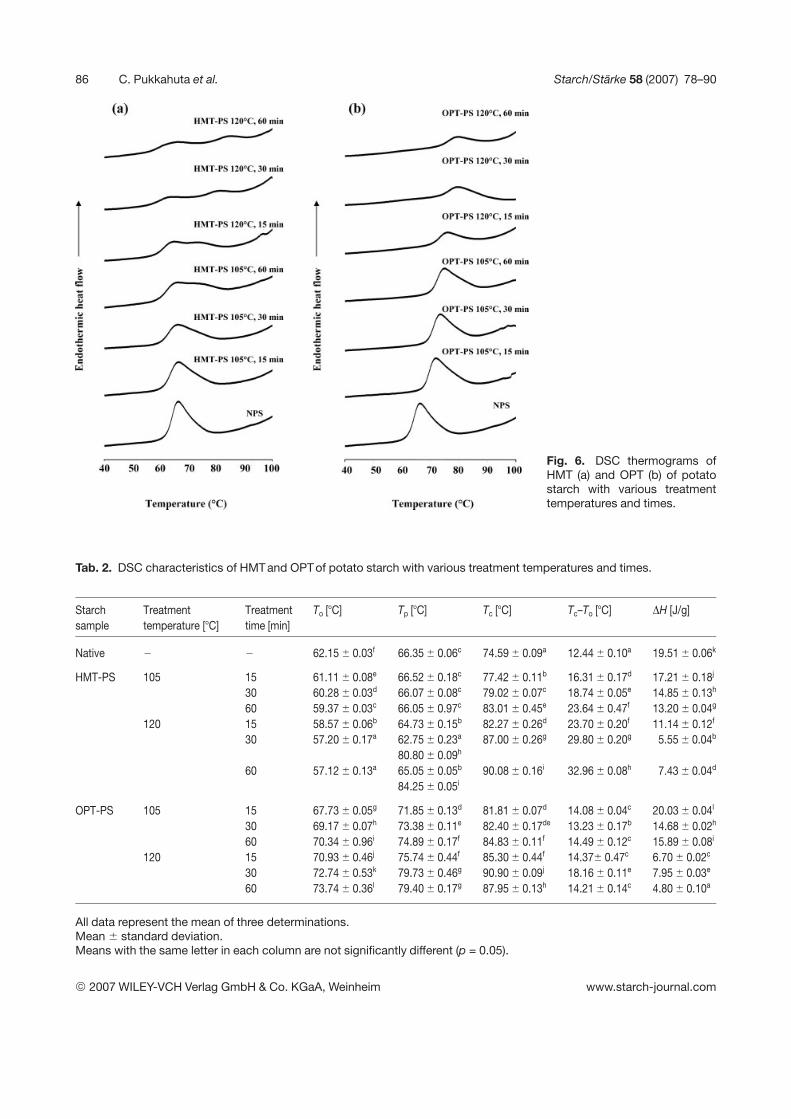
The DSC thermograms of HMT and OPT starches arepresented in Fig. 6, the values of onset (To), peak (Tp) andconclusion gelatinization temperature (Tc), as well asgelatinization enthalpy (DH) are summarized in Tab. 2.After HMT, the onset gelatinization temperatures areslightly decreased, but Tc and the temperature ranges Tc-To are significantly increased. Peak temperatures (Tp)remain unchanged with an exception of HMT at 1207C for30 and 60 min (biphasic peaks). These DSC results are in
© 2007 WILEY-VCH Verlag GmbH & Co. KGaA, Weinheim www.starch-journal.com
Starch/Stärke 58 (2007) 78–90 Effect of Osmotic Pressure on Starch 85
Fig. 5. X-ray diffraction patterns of HMT (a) and OPT (b) potato starches with various treatments of temperatures and time.
© 2007 WILEY-VCH Verlag GmbH & Co. KGaA, Weinheim www.starch-journal.com
86 C. Pukkahuta et al. Starch/Stärke 58 (2007) 78–90
Fig. 6. DSC thermograms ofHMT (a) and OPT (b) of potatostarch with various treatmenttemperatures and times.
Tab. 2. DSC characteristics of HMTand OPTof potato starch with various treatment temperatures and times.
Starchsample
Treatmenttemperature [7C]
Treatmenttime [min]
To [7C] Tp [7C] Tc [7C] Tc–To [7C] DH [J/g]
Native 2 2 62.15 6 0.03f 66.35 6 0.06c 74.59 6 0.09a 12.44 6 0.10a 19.51 6 0.06k
HMT-PS 105 15 61.11 6 0.08e 66.52 6 0.18c 77.42 6 0.11b 16.31 6 0.17d 17.21 6 0.18j
30 60.28 6 0.03d 66.07 6 0.08c 79.02 6 0.07c 18.74 6 0.05e 14.85 6 0.13h
60 59.37 6 0.03c 66.05 6 0.97c 83.01 6 0.45e 23.64 6 0.47f 13.20 6 0.04g
120 15 58.57 6 0.06b 64.73 6 0.15b 82.27 6 0.26d 23.70 6 0.20f 11.14 6 0.12f
30 57.20 6 0.17a 62.75 6 0.23a
80.80 6 0.09h87.00 6 0.26g 29.80 6 0.20g 5.55 6 0.04b
60 57.12 6 0.13a 65.05 6 0.05b
84.25 6 0.05i90.08 6 0.16i 32.96 6 0.08h 7.43 6 0.04d
OPT-PS 105 15 67.73 6 0.05g 71.85 6 0.13d 81.81 6 0.07d 14.08 6 0.04c 20.03 6 0.04l
30 69.17 6 0.07h 73.38 6 0.11e 82.40 6 0.17de 13.23 6 0.17b 14.68 6 0.02h
60 70.34 6 0.96i 74.89 6 0.17f 84.83 6 0.11f 14.49 6 0.12c 15.89 6 0.08i
120 15 70.93 6 0.46j 75.74 6 0.44f 85.30 6 0.44f 14.376 0.47c 6.70 6 0.02c
30 72.74 6 0.53k 79.73 6 0.46g 90.90 6 0.09j 18.16 6 0.11e 7.95 6 0.03e
60 73.74 6 0.36l 79.40 6 0.17g 87.95 6 0.13h 14.21 6 0.14c 4.80 6 0.10a
All data represent the mean of three determinations.Mean 6 standard deviation.Means with the same letter in each column are not significantly different (p = 0.05).
© 2007 WILEY-VCH Verlag GmbH & Co. KGaA, Weinheim www.starch-journal.com
Starch/Stärke 58 (2007) 78–90 Effect of Osmotic Pressure on Starch 87
good agreement with those obtained by Lim and Chang[4]. Several researchers report the increasing of To afterHMT at 1007C for 16 h in a hot air oven [21–24], whereasour HMTstudy was conducted in a much shorter time (15,30 and 60 min). To, Tp and Tc of starches from OPT areshifted to higher temperatures with increase of tempera-ture and time, but there are a little changes in Tc– To
(Tab. 2). Moreover, the biphasic endotherm is not foundafter OPT. Donovan [25] reported that crystalline anddouble helical melting during gelatinization was assistedby hydration and swelling of the starch granule in theamorphous regions. The swelling of amorphous regionsimparts a stress on the crystalline regions, and therebystrips polymer chains from the surface of starch crystal-lites. Amylose-amylose interactions on the HMT will sup-press the mobility of the amorphous regions [26]. Conse-quently, the amorphous regions will require a higher tem-perature to incur swelling that can contribute to thedisruption of the crystalline regions, which explains theincrease in Tp and Tc after HMT. However, the increase ingelatinization temperature due to OPT is affected by theheat treatment of starch in saturated sodium sulfate so-lution. Infrared spectroscopy shows that sulfate ions(structure makers) reduce the fraction of free water [27].On the basis of this theory, the higher gelatinization tem-perature of potato starch in sodium sulfate solution canbe attributed to the diminished fraction of free water.Moreover, the repulsion between the electronegative –OHgroups of starch and the strongly negatively chargedSO4
2- ions increases the resistance of starch gelatiniza-tion [6]. Oosten [28, 29] proposed that the Donan potentialrepels anions from the granule, effectively protecting thegranule from gelatinization, since anions are hypothe-sized to induce gelatinization. In this research, the satu-rated sodium sulfate solution is used to prevent the starchgranule from gelatinization. The peak broadening (highTc– To) (Fig. 6a) found in heat-moisture treated starch hasbeen reported by several researchers [26]. Donovan [30]also found a broad and biphasic transition after HMT ofwheat and potato starches. This phenomenon is notfound in OPT potato starch (Fig. 6b). However, at leastpart of the broadening of the peaks (high Tc–To) can beexplained by an inhomogeneous heat transfer during theHMTof starch. Narrow peaks of the DSC curve can be anindication for a better homogeneity of the OPTsamples [1,31]. The endothermic enthalpy (DH) can be attributed tothe presence of a higher number of double helices and/orweaker interaction between adjacent amylopectin doublehelices within the crystalline domains. The decrease in DHon both treatments (Tab. 2) suggests that some of thedouble helices present in crystalline regions of the granulemay have disrupted under the conditions prevailing dur-ing treatments. Thus, fewer double helices will unraveland melt during gelatinization of modified starches. Lu et
al. [32] reported that the HMT led to the degradation of theamylopectin molecules so that the amount of large mole-cules decreased but the amount of smaller moleculesincreased. In potato starches (B-type) amylopectin ismore mobile, and hence more prone to disruption thanthat of cereal starches (A-type) [3, 32, 33]. Moreover, therepulsion between negatively charged phosphate groupson adjacent amylopectin chains will hinder strong inter-action between double helices [3, 22]. Therefore, crystal-lites of potato starch will be very susceptible to disruptionduring treatment.
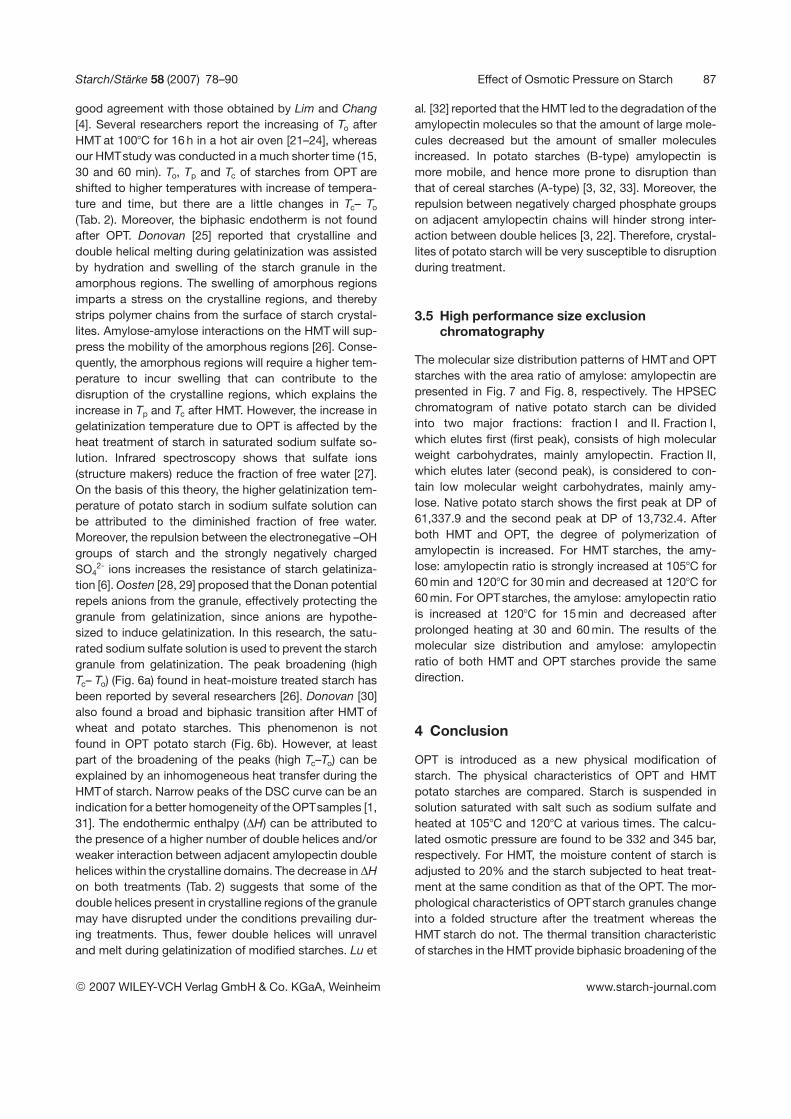
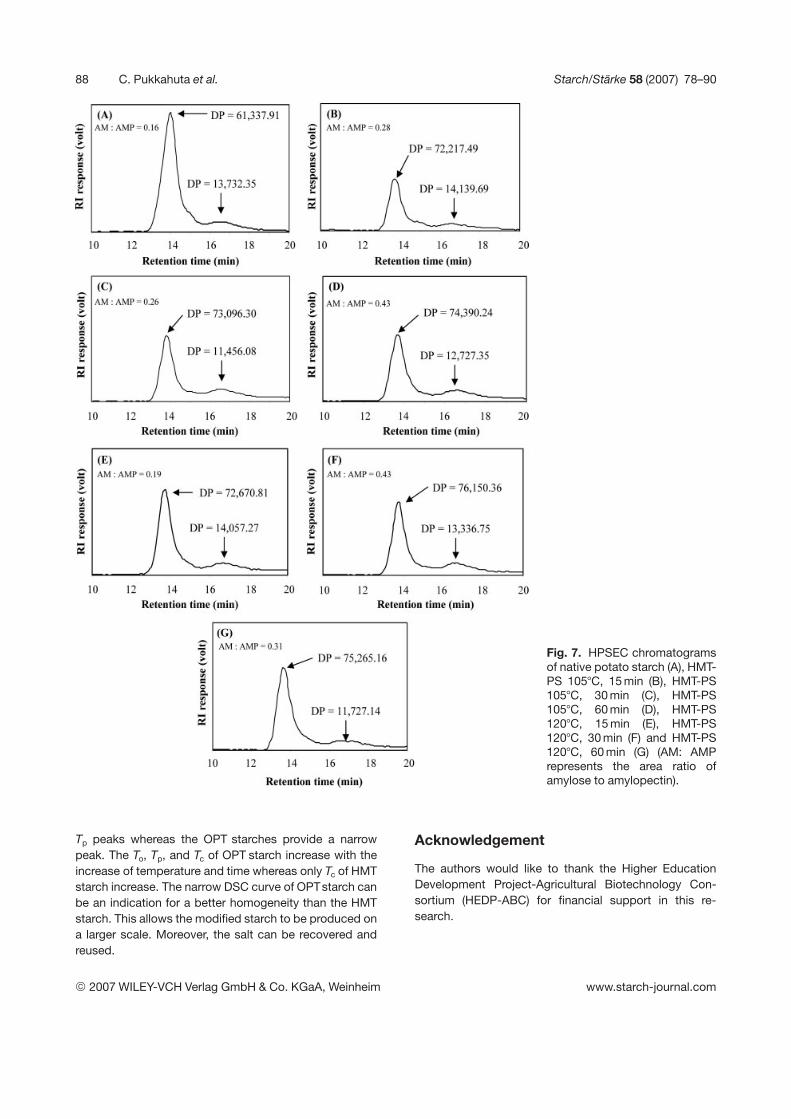
3.5 High performance size exclusionchromatography
The molecular size distribution patterns of HMT and OPTstarches with the area ratio of amylose: amylopectin arepresented in Fig. 7 and Fig. 8, respectively. The HPSECchromatogram of native potato starch can be dividedinto two major fractions: fraction I and II. Fraction I,which elutes first (first peak), consists of high molecularweight carbohydrates, mainly amylopectin. Fraction II,which elutes later (second peak), is considered to con-tain low molecular weight carbohydrates, mainly amy-lose. Native potato starch shows the first peak at DP of61,337.9 and the second peak at DP of 13,732.4. Afterboth HMT and OPT, the degree of polymerization ofamylopectin is increased. For HMT starches, the amy-lose: amylopectin ratio is strongly increased at 1057C for60 min and 1207C for 30 min and decreased at 1207C for60 min. For OPT starches, the amylose: amylopectin ratiois increased at 1207C for 15 min and decreased afterprolonged heating at 30 and 60 min. The results of themolecular size distribution and amylose: amylopectinratio of both HMT and OPT starches provide the samedirection.
4 Conclusion
OPT is introduced as a new physical modification ofstarch. The physical characteristics of OPT and HMTpotato starches are compared. Starch is suspended insolution saturated with salt such as sodium sulfate andheated at 1057C and 1207C at various times. The calcu-lated osmotic pressure are found to be 332 and 345 bar,respectively. For HMT, the moisture content of starch isadjusted to 20% and the starch subjected to heat treat-ment at the same condition as that of the OPT. The mor-phological characteristics of OPTstarch granules changeinto a folded structure after the treatment whereas theHMT starch do not. The thermal transition characteristicof starches in the HMT provide biphasic broadening of the
© 2007 WILEY-VCH Verlag GmbH & Co. KGaA, Weinheim www.starch-journal.com
88 C. Pukkahuta et al. Starch/Stärke 58 (2007) 78–90
Fig. 7. HPSEC chromatogramsof native potato starch (A), HMT-PS 1057C, 15 min (B), HMT-PS1057C, 30 min (C), HMT-PS1057C, 60 min (D), HMT-PS1207C, 15 min (E), HMT-PS1207C, 30 min (F) and HMT-PS1207C, 60 min (G) (AM: AMPrepresents the area ratio ofamylose to amylopectin).
Tp peaks whereas the OPT starches provide a narrowpeak. The To, Tp, and Tc of OPT starch increase with theincrease of temperature and time whereas only Tc of HMTstarch increase. The narrow DSC curve of OPTstarch canbe an indication for a better homogeneity than the HMTstarch. This allows the modified starch to be produced ona larger scale. Moreover, the salt can be recovered andreused.
Acknowledgement
The authors would like to thank the Higher EducationDevelopment Project-Agricultural Biotechnology Con-sortium (HEDP-ABC) for financial support in this re-search.
© 2007 WILEY-VCH Verlag GmbH & Co. KGaA, Weinheim www.starch-journal.com
Starch/Stärke 58 (2007) 78–90 Effect of Osmotic Pressure on Starch 89
Fig. 8. HPSEC chromatogramsof native potato starch (A), OPT-PS 1057C, 15 min (B), OPT-PS1057C, 30 min (C), OPT-PS1057C, 60 min (D), OPT-PS1207C, 15 min (E), OPT-PS1207C, 30 min (F) and OPT-PS1207C, 60 min (G) (AM: AMPrepresents the area ratio ofamylose to the amylopectin).
References
[1] R. Stute: Hydrothermal modification of starches: The differ-ence between annealing and heat/moisture-treatment.Starch/Stärke 1992, 44, 205–214.
[2] L. S. Collado, H. Corke: Heat-moisture treatment effects onsweetpotato starches differing in amylose content. FoodChem. 1999, 65, 339–346.
[3] A. Gunaratne, R. Hoover: Effect of heat-moisture treatmenton the structure and physicochemical properties of tuber androot starches. Carbohydr. Polym. 2002, 49, 425–437.
[4] S.-T. Lim, E.-H. Chang, H.-J. Chung: Thermal transition char-acteristics of heat-moisture treated corn and potato starches.Carbohydr. Polym. 2001, 46, 107–115.
[5] I. Maruta, Y. Kurahashi, R. Takano, K. Hayashi, Z. Yoshino, T.Komaki, S. Hara: Reduced-pressurized heat-moisture treat-ment: A new method for heat-moisture treatment of starch.Starch/Stärke 1994, 46, 177–181.
[6] J.-l. Jane: Mechanism of starch gelatinization in neutral saltsolutions. Starch/Stärke 1993, 45, 161–168.
[7] C. E. Mangels, C. H. Bailey: Relation of concentration toaction of gelatinization agents on starch. J. Am. Chem. Soc.1933, 55, 1981–1988.
[8] X. Shi, J. N. BeMiller: Effect of sulfate and citrate salts onderivatization of amylase and amylopectin during hydro-xypropylation of corn starch. Carbohydr. Polym. 2000, 43,333–336.
© 2007 WILEY-VCH Verlag GmbH & Co. KGaA, Weinheim www.starch-journal.com
90 C. Pukkahuta et al. Starch/Stärke 58 (2007) 78–90
[9] J.-l. Jane: 13C-NMR study of interactions between amylo-dextrin and neutral salts. Starch/Stärke 1993, 45, 172–175.
[10] T. E. Abraham: Stabilization of paste viscosity of cassavastarch by heat- moisture treatment. Starch/Stärke 1993, 45,131–135.
[11] AOAC, Official Method of Analysis, Ash and Moisture Con-tent, 15th ed., Association of Official Analytical Chemistry,Arlington, USA, 1990, 777.
[12] AOAC, Official Method of Analysis, Protein, 15th ed., Asso-ciation of Official Analytical Chemistry, Arlington, USA, 1990,781.
[13] AOAC, Official Method of Analysis, Fat, 15th ed., Associationof Official Analytical Chemistry, Arlington, USA, 1990, 780.
[14] C. A. Knutson: A simplified colorimetric procedure fordetermination of amylase in maize starches. Cereal Chem.1986, 63(2), 89–92.
[15] S. Govindasamy, C. G. Oates, H. W. Wong: Characterizationof changes of sago starch components during hydrolysis bythermosTable alpha-amylase. Carbohydr. Polym. 1992, 18,89–100.
[16] J. L. Jane, J. F. Chen: Effect of amylose molecular size andamylopectin branched chain length on paste properties ofstarch. Cereal Chem. 1992, 69, 60–65.
[17] A. Kawabata, N. Takase, E. Miyoshi, W. Sawayama, T.Kimura, K. Kudo: Microscopic observation and X-ray dif-fractometry of heat/moisture treated starch granules.Starch/Stärke 1994, 46, 463–469.
[18] C. Perera, H. Hoover: The reactivity of procine pancreaticalpha-amylase towards native, defatted and heat-moisturetreated potato starches before and after hydroxypropyla-tion. Starch/Stärke 1998, 50, 206–213.
[19] A. Imberty: A revisit to the three dimensional structure ofB-type starch. Biopolymers 1988, 27, 1205–1221.
[20] A. Imberty, H. Chanzy, S. Perez, A. Buleon, V. Tran: Thedouble helical nature of the crystalline part of A-starch. J.Mol. Biol. 1988, 201, 365–378.
[21] L. Sair: Heat-moisture treatment – Heat moisture treatmentof starches, in Methods in Carbohydrate Chemistry (Ed. R. L.Whistler) Vol. IV, Academic Press, London 1964, p. 283.
[22] L. Sair: Heat-moisture treatment of starches. Cereal Chem.1967, 40, 8–26.
[23] K. Kulp, K. Lorenz: Heat-moisture treatment of starches. I.Physicochemical properties. Cereal Chem. 1981, 58, 46–48.
[24] R. Hoover, T. Vasanthan: Effect of heat-moisture treatmenton the structure and physicochemical properties of cereal,legume, and tuber starches. Carbohydr. Res. 1994, 252, 33–53.
[25] J. W. Donovan: Phase transitions of starch-water systems.Biopolymer 1979, 18, 263–275.
[26] R. Hoover, H. Manuel: The effect of heat-moisture treatmentin the structure and physicochemical properties of legumestarches. Food Res. Int. 1996, 29, 731–750.
[27] J. Paquette, C. Jolicoeur: A near-infrared study of thehydration of various ions and nonelectrolytes. J. SolutionChem. 1977, 6, 403–428.
[28] B. J. Oosten: Tentative hypothesis to explain how electro-lytes affect the gelatinization temperature of starches inwater. Starch/Stärke 1982, 34, 233–239.
[29] B. J. Oosten: Interactions between starch and electrolytes.Starch/Stärke 1990, 42, 327–330.
[30] J. W. Donovan, K. Lorenz, K. Kulp: Differential scanningcalorimetry of heat-moisture treated wheat and potatostarches. Cereal Chem. 1983, 60, 381–387.
[31] R. F. Tester, S. J. J. Debon: Annealing of starch – a review.Int. J. Biol. Macromol. 2000, 27, 1–12.
[32] S. Lu, C. Chen, C. Lii: Gel-chromatography fraction andthermal characterization of rice starch affected by hydro-thermal treatment. Cereal Chem. 1996, 73, 5–11.
[33] M. J. Gidley: Factors affecting the crystalline type (A-C) ofnative starches and model compounds: A rationalization ofobserved effects in terms of polymorphic structure Carbo-hydr. Res. 1987, 161, 301–304.
(Received: March 12, 2006)(Revised: August 28/November 17, 2006)(Accepted: November 17, 2006)
© 2007 WILEY-VCH Verlag GmbH & Co. KGaA, Weinheim www.starch-journal.com