Embed Size (px)
Citation preview

Cleveland State University Cleveland State University
EngagedScholarship@CSU EngagedScholarship@CSU
Mechanical Engineering Faculty Publications Mechanical Engineering Department
1992
Effect of Operating Conditions on Gearbox Noise Effect of Operating Conditions on Gearbox Noise
Fred B. Oswald NASA Lewis Research Center
James J. Zakrajsek NASA Lewis Research Center
Dennis P. Townsend NASA Lewis Research Center
William Atherton Cleveland State University, [email protected]
Hsiang Hsi Lin Memphis State University
Follow this and additional works at: https://engagedscholarship.csuohio.edu/enme_facpub
Part of the Acoustics, Dynamics, and Controls Commons
How does access to this work benefit you? Let us know! How does access to this work benefit you? Let us know!
Recommended Citation Recommended Citation Oswald, Fred B.; Zakrajsek, James J.; Townsend, Dennis P.; Atherton, William; and Lin, Hsiang Hsi, "Effect of Operating Conditions on Gearbox Noise" (1992). Mechanical Engineering Faculty Publications. 6. https://engagedscholarship.csuohio.edu/enme_facpub/6
This Report is brought to you for free and open access by the Mechanical Engineering Department at EngagedScholarship@CSU. It has been accepted for inclusion in Mechanical Engineering Faculty Publications by an authorized administrator of EngagedScholarship@CSU. For more information, please contact [email protected].

E 732—
NASA
AVSCOMTechnical Memorandum 105331
Technical Report 91—C-031
Effect of Operating Conditionson Gearbox Noise
Fred B. Oswald, James J. Zakrajsek,and Dennis P. TownsendLewis Research CenterCleveland, Ohio
William AthertonCleveland State UniversityCleveland, Ohio
and
Hsiang Hsi LinMemphis State UniversityMemphis, Tennessee
Prepared for theSixth International Power Transmission and Gearing Conferencesponsored by the American Society of Mechanical EngineersPhoenix, Arizona, September 13-16, 1992
US ARMYAVIATIONJVNASA SYSTEMS COMMAND

EFFECT OF OPERATING CONDITIONS ON GEARBOX NOISE
Fred B. Oswald, James J. Zakrajsek, and Dennis P. TownsendNational Aeronautics and Space Administration
Lewis Research CenterCleveland, Ohio 44135
William AthertonCleveland State University
Cleveland, Ohio 44115
and
Hsiang Hsi LinMemphis State University?Memphis, Tennessee 38152
ABSTRACT
Low-contact-ratio spur gears were tested in the NASA gear-noise rig to study the noise radiated from the top of the gearbox.The measured sound power from the gearbox top was obtained froma near-field acoustic intensity scan taken at 63 nodes just above thesurface. The sound power was measured at a matrix of 45 operatingspeeds and torque levels. Results are presented in the form of aspectral speed map and as plots of sound power versus torque (atconstant speed) and as sound power versus speed (at constant torque)Because of the presence of vibration modes, operating speed wasfound to have more impact on noise generation than torque level.
A NASA gear dynamics code was used to compute the geartooth dynamic overload at the same 45 operating conditions used forthe experiment. Similar trends were found between the analyticalresults for dynamic tooth overload and experimental results for soundpower. Dynamic analysis may be used to design high-quality gearswith profile relief optimized for minimum dynamic load and noise.
INTRODUCTION
A major source of helicopter cabin noise (which has beenmeasured at over 100 dB sound pressure level) is the gearbox.Reduction of this noise is a NASA and U.S. Army goal. Gearmeshnoise is typically in the frequency range of 1000 to 3000 Hz, a rangeimportant for speech. A requirement for the U.S. Army/NASAAdvanced Rotorcraft Transmission project is a 10-dB noise reductioncompared to current designs. A combined analytical/experimentaleffort is underway to study effects of design parameters on noiseproduction.
The information in the literature relating gearbox noise tooperating conditions such as speed and torque is not consistent.Much of the confusion may be the result of (1) differing levels ofaccuracy of the gears used by the various researchers, (2) variationin structural effects (mechanical resonance), and (3) differences inthe radiation efficiencies of different structures.
Houser (1991) suggests that a perfect gearbox may radiate 10-9of its input power as noise. For a very high-quality gearbox, this
ratio is on the order of IT T to 10-8 . If the noise represents a constant fraction of power, doubling either speed or torque wouldproduce a 3-dB noise increase. Houser cites references reporting anoise level increase from 2 or 3 dB to 10 dB for doubling of speed.Likewise, doubling gearbox torque has produced reported noise levelincreases from 3 to 6 dB.
A simplified equation presented in an appendix to Bossier et al.(1978) predicts that, for spur gears, the sound power levelin decibels at the meshing frequency will vary by a factor of20 LOC(r) + 37.8 LOG(f) where r is the transmitted torque andf is the gearmesh frequency in Hz. This indicates that the soundpower will increase by 6 dB as the torque doubles and by 11 dB asthe speed doubles.
Levine and DeFelice (1977) report sound power increases of1.2 dB for bevel gears and 3 to 4 dB for planetary gears for a dou-bling of horsepower. Shahan and Kamperman (1966) contains fig-ures relating sound pressure level to specific tooth load and torotation speed. They show an approximate 2.5-dB sound pressurelevel (SPL) increase for a doubling of specific tooth load and asimilar 2.5-dB SPL increase for doubling of speed for gears with aprofile error of 0.0002 in. (This tolerance translates to ALMAclass 13 for small gears such as those tested in the present work.)Watanabe and Rouverol (1990) plot noise level as a function ofspeed for various automotive timing gears. Their curves typicallyshow a 10-dB increase for a doubling of speed. Atherton et al.(1987) present a plot showing sound power at mesh frequency whichshows little torque effect. Finally, Houser (1991) mentions thatsome researchers report a noise level decrease as torque is increased.
Various analytical codes are available to simulate gear dynamics,vibration, and noise. These include DANST (dynamic analysis of spur-gear transmissions) (Lin et al., 1987a, 1987b, and 1989), GEARDYN(gear dynamics) (Boyd and Pike, 1987 and Pike, 1981); and GRD(geared rotor dynamics) (Kahraman et al., 1990). Finite elementmethods may also be used to predict the structural vibration proper-ties of a gearbox. The boundary element method for acoustic predic-tion (BEMAP) may be used to predict the noise from vibration data(Seybert et al. 1991).
Part of NASA gear noise research is directed toward validatingcomputer codes so that the codes may be used as design tools.Earlier work in this project produced dynamic load and stress datafor validation of the NASA gear dynamics code DANST (Oswald et al.,1991). A related project provided validation data for the acousticscode BEMAP (Oswald et al., 1992).
The goal of this effort has been to provide experimental data toassess the effects of speed and torque on the noise produced by agearbox. Results presented include narrow-band spectra of thesound power and trends of mesh frequency sound power as speed andtorque are varied. This paper compares the trends of dynamic overloadas predicted by the DANST code with measured gearbox noise.
APPARATUS
Test Facility
The NASA Lewis gear-noise rig (Fig. 1) was used for thesetests. This rig features a single-mesh gearbox powered by a 150-kW
Dynamometer -1
Optional i
Optional output flywheel
input flywheel -1 Test
(a) Layout.
(b) Test gearbox showing measurement grid and RAIMS robot withsound intensity probe.
Figure 1.—NASA gear-noise rig.
(200-hp) variable-speed electric motor. An eddy-current dynamome-ter loads the output shaft. The gearbox can be operated at speedsup to 6000 rpm. The rig was built to carry out fundamental studiesof gear noise and the dynamir, behavior of gear systems. It is designedto allow testing of various configurations of gears, bearings, dampers,and supports. To reduce unwanted reflection of noise, acoustic-absorbing foarn baffles covered the test cell walls, floor, and othernonmoving surfaces. The material used attenuates the reflectedsound by 20 dB for frequencies of 500 Hz and above.
A poly-V belt drive was used as a speed increaser between themotor and input shaft. A soft coupling was installed on the inputshaft to reduce input torque fluctuations, which were caused bynonuniformity at the belt splice.
The test gears were identical spur gears (at 1:1 ratio) machinedto AGMA Class 15 accuracy. The gear profiles were modified withlinear tip relief chosen for optimum operation at design load. Testgear parameters are shown in Table I.
TABLE I.—TEST GEAR PARAMETERS
Spur gear type ........ Standard involute, full-depth toothNumber of teeth .............................. 28Module, mm (diametrical pitch in. -1 ) ........... 3.175 (8)Face width, mm (in.) .................... 6.35 (0.25)Pressure angle, deg ............................ 20Nominal (100 percent) torque, N-m (in.-lb) ... 71.77 (635.25)Theoretical contact ratio ....................... 1.64Modification amount, mm (in.) ........... 0.018 (0.0007)Modification start, deg ........................ 24. 5
A 63-node measurement, grid was marked out on the top of thegearbox. The grid covers an area 228 by 304 mm (9 by 12 in.)centered on the 286- by 362-mm (11.25- by 14.25-in.) top. Thegearbox with its measurement grid and some instrumentation areshown in Fig. 1(b).
Instrumentation and Test Procedure
An experimental modal test was performed to determine themodes of vibration and natural frequencies of the gearbox top. An800-line, 2-channel dynamic signal (FFT) analyzer collected frequency-domain data. Commercial modal software running on a personalcomputer was used for the analysis. The modal tests were per-formed with the top installed on the gearbox and with the gearboxheated to operating temperature. The structure was excited sequen-tially at each of the 63 nodes using a load-cell-equipped modalhammer to measure excitation forces. The response was measuredwith a small piezoelectric accelerometer mounted at a referencelocation near the center of the gearbox top.
Acoustic intensity measurements were performed under stable,steady-state operating conditions with the aid of a computer-controlledrobot designated RAIMS (robotic acoustic intensity measurementsystem). The RAIMS software (1) commanded the robot to move anintensity probe over a prescribed measurement grid; (2) recordedacoustic intensity spectra in the analyzer for each node of the grid;and (3) transmitted the spectra to the computer for storage on disk.RAIMS is more completely described in Flanagan and Atherton(1985) and in Atherton et al. (1987).
The acoustic intensity probe consists of a pair of phase-matched 12-mm microphones mounted face-to-face with a 12-minspacer. The probe has a frequency range of 125 to 5000 flz (fl dB).Measurements were made at a distance of 75 mm between theacoustic center of the microphones and the gearbox top.
N
m
30ac00
b 30
t
90
60
The 63 intensity spectra collected at each operating conditionwere averaged, then multiplied by the radiation area to compute an800-line sound power spectrum. The radiation area was assumed tobe the area of the rid plus one additional row and column of ele-ments or 0.0910 m . The actual area of the top is 0.1034 m 2 . Themeasurement grid did not extend completely to the edges of thegearbox top because (1) the edge of the top was bolted to a stiffmounting flange which would not allow much movement, and (2) meas-urements taken close to the edge of the top would be affected bynoise radiated from the sides of the box. Noise measurements fromthe gearbox sides were not attempted for the following reasons:(1) the top is not as stiff as the sides; thus, noise radiation from thetop dominates; (2) the number of measurement locations were keptreasonable; and (3) shafting and other projections made such meas-urements difficult.
Sound power measurements were made at a matrix of 45 testconditions: 5 speeds (2000, 3000, 4000, 5000, and 6000 rprn) and9 torque levels (16, 31, 47, 63, 79, 94, 110, 126. and 142 percent ofthe reference torque 71.8 N-m (635 in-lb)). During measurements,speed was held to within f4 rpm and torque to ±1 N-m. Acousticdata was recorded over the bandwidth 0 to 3200 Hz.
ANALYTIC MODEL
Computer program DANST employs four torsional degrees offreedom. These degrees of freedom represent the input (motor), thetwo gears, and the output (load) (Lin, 1987x, 1987b, 1989, andOswald et al., 1991). Equivalent mass and stiffness elements wereestimated to represent the input (motor) and output (dynamometer)elements of the gear-noise rig. The gear tooth profiles were modeledas perfect involutes from the low point of tooth contact to the startof modification; the tooth tips are modified with linear tip relief asspecified in Table 1. DANST provided a dynamic solution for geartooth loads.
RESULTS AND DISCUSSION
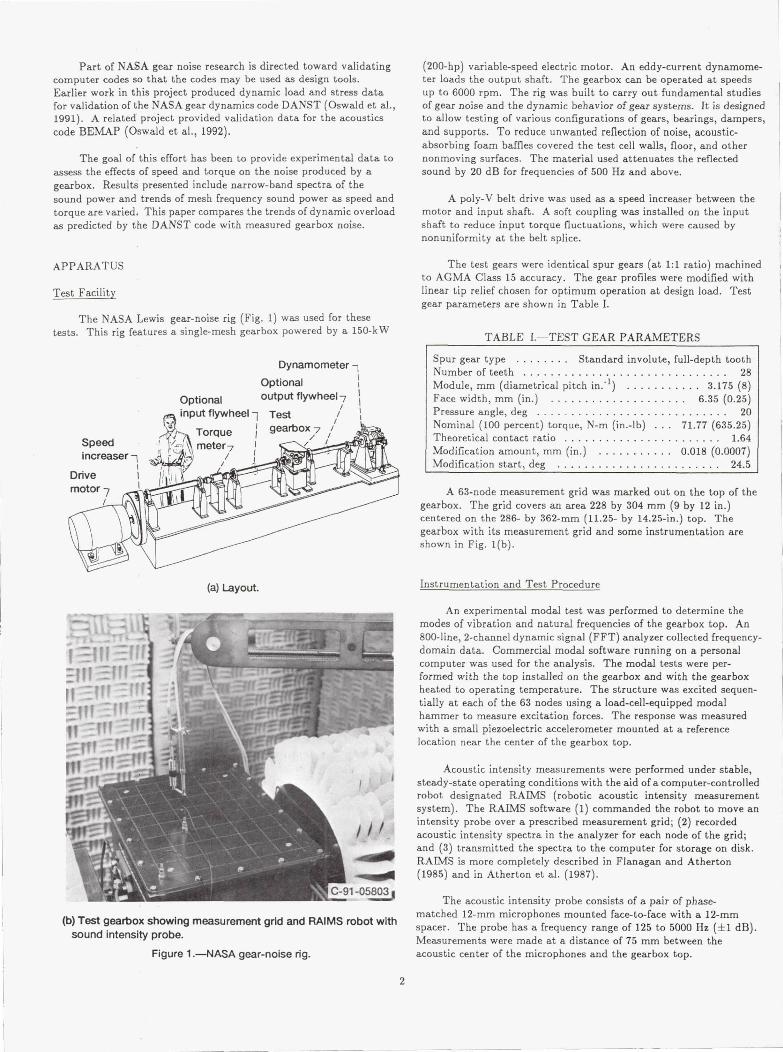
Plots of the first four vibration modes found from modal testsare shown in Fig. 2. (These modes occur at slightly different fre-quencies than those reported in Seybert et al. (1991). The differenceis due to different clamping conditions for the top. A soft corkgasket under the gearbox top has been replaced by a rubber O-ringin a machined groove. The O-ring allows stiffer clamping.)
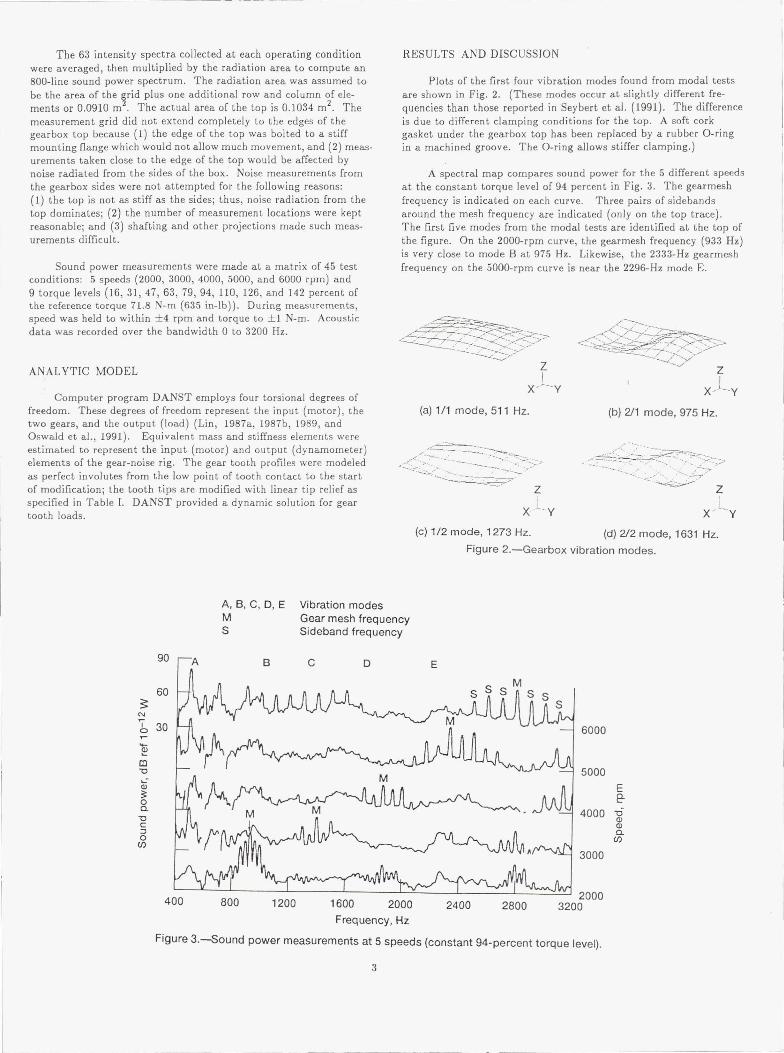
A spectral map compares sound power for the 5 different speedsat the constant torque level of 94 percent in Fig. 3. The gearmeshfrequency is indicated on each curve. Three pairs of sidebandsaround the mesh frequency are indicated (only on the top trace).The first five modes from the modal tests are identified at the top ofthe figure. On the 2000-rpm curve, the gearmesh frequency (933 Hz)is very close to mode B at 975 Hz. Likewise, the 2333-Hz gearmeshfrequency on the 5000-rpm curve is near the 2296-Hz mode E.
zI
X'`--Y(a) 1A mode, 511 Hz. (b) 2/1 mode, 975 Hz.
I_X Y X Y
(c) 1/2 mode, 1273 Hz. (d) 212 mode, 1631 Hz.
Figure 2.—Gearbox vibration modes.
zI
X-''-Y
A, B, C, D, E Vibration modesM Gear mesh frequencyS Sideband frequency
6000
5000
E1?
4000 oma
3000
20003200
Figure 3.—Sound power measurements at 5 speeds (constant 94-percent torque level).
400 800 1200 1600 2000 2400 2800Frequency, Hz

The measured sound power includes some noise originating thefrom the motor, shafting, or other noise sources refracted or reflectedto the measurement location. Most of this noise from sources otherthan the gearbox occurs at low frequencies (below about 400 Hz).Low-frequency noise is expected to contaminate the measurementsbecause the acoustic baffles decline in absorption ability at lowfrequencies and because low-frequency noise is more likely to berefracted to the intensity probe. Because of this low-frequency noise,frequencies below 400 Hz are not shown in the spectra of Fig. 3.Even somewhat above 400 Hz, there were a few frequency bands inwhich the sound intensity flow direction was toward the gearbox;hence, the intensity was negative. These frequencies show up asgaps in the sound power curves.
The data used in the spectra in Fig. 3 and similar data fromthe other eight torque levels tested were used to compute the meshsound power. The mesh sound power is defined here as the sum ofthe sound power at gearmesh frequency and at three pairs of side-bands (i.e., the sum of seven values). These data are shown for 45test conditions (5 speeds and 9 torques) in Figs. 4 and 5.
Figure 4 presents mesh sound power as a function of speed at thenine torque levels. The highest noise levels are found at 5000 and2000 rpm. The noise levels at 5000 rpm are highest at low torque,whereas the 2000-rpm levels are greatest at high torque. The expectedtrend of generally rising noise level with speed has been overwhelmedby modal response in Fig. 3. The highest noise levels are producedby operation at speeds (2000 and 5000 rpm) which excite vibrationmodes. It is difficult to find a general trend in this data for theeffect of speed on gearbox noise caused by the presence of vibration
modes.
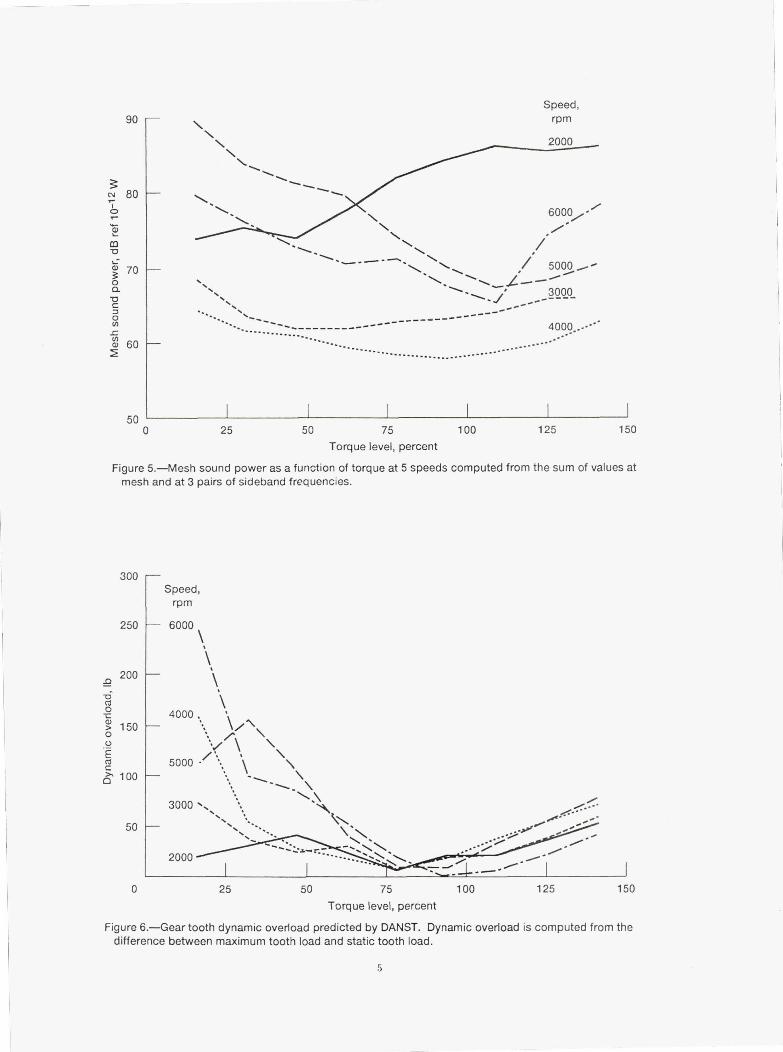
Figure 5 presents mesh sound power as a function of torque atfive speed levels. Each curve shows a minimum-noise torque level.This minimum-noise level appears to be speed-dependent: At thelowest speeds (2000 and 3000 rpm), minimum noise occurs at approx-imately 50-percent torque. At the higher speeds (especially 5000 and6000 rpm), the minimum noise occurs near 100-percent torque.Operation at torque much above or below the optimum level pro-duces much higher noise. Especially notable is the 5000-rpm curvein which the noise at 16-percent torque is 22 dB greater than that at110-percent torque. High-speed, low-torque operation may producegear rattle where the gear teeth momentarily lose contact, thencollide. These tooth collisions produce high overloads. Gear dynamicresponse at light load is discussed in Rebbechi et al. (1992).
In the results presented in Fig. 5, no general trend of gearboxnoise rising with increasing torque can be found although the torquewas varied by a factor of 7 to 1, Indeed, certain torque levels seemto produce minimum noise. Houser (1991) discusses designing gearsfor minimum transmission error (and hence minimum noise). Figure 5suggests that the profile modifications, which were chosen frorn ananalysis using DANST, are nearly optimum for 100-percent load. Atlow-torque operation the profile modification is excessive and noise ishigh.
Since the DANST gear dynamics code cannot account for themodal properties of the gearbox, it is not meaningful to compare thetrend of gearbox noise to DANST predictions as speed is varied.However, torque variation, which affects the meshing action of thegears, is considered by DANST. Figure 6 shows the result of usingDANST to simulate the 45 operating conditions for the experimentaldata in Fig. 3. The figure shows the dynamic overload (defined as
B C D E90
Torque
level,percent
.,, 16
N 80 ------ 31
o \ 47
M \\\`. 94 i ^1 \\•
110 i ,• / /Q) 126 ;A "CL 142 ^ ,:•%/ %' _ ^
oLo
W 60
502000 3000 4000 5000 6000
Speed, rpm
1000 1500 2000 2500
Mesh frequency, Hz
Figure 4.—Mesh sound power as a function of speed at 9 torque levels computed from the sum ofvalues at mesh and at 3 pairs of sideband frequencies.
Speed,
90 \ rpm
\ 2000
80 \
\ \ 6000/
\ \ 5000,-\ ^1^
C1 3000c ` -U ------- -N '----------- ----
- 4000.....L60
............
500 25 50 75 100 125 150
Torque level, percent
Figure 5.—Mesh sound power as a function of torque at 5 speeds computed from the sum of values atmesh and at 3 pairs of sideband frequencies.
300
250
200
aro0
> 1500U
CJC
0>1 100
50
0 25 50 75 100 125 150
Torque level, percent
Figure 6.—Gear tooth dynamic overload predicted by DANST. Dynamic overload is computed from thedifference between maximum tooth load and static tooth load.
5

the maximum dynamic load minus the maximum static load) as afunction of torque at five speeds. All curves show a minimum at79- or 94-percent torque. Except for the 2000- and 3000-rpm curves,the minimum overload occurs at a torque level similar to that forminimum sound power in Fig. 5.
CONCLUSIONS
Measurements of gearbox noise were made in the NASA gear-noise rig to investigate the effect of operating conditions (speed andtorque) on gearbox noise. Results were also compared to predictionsof the gear dynamics code DANST. The following conclusions wereobtained.
1. Similar trends were found between analytical results fordynamic tooth overload and experimental results for sound power.This indicates the dynamic analysis simulates the noise excitation ofthe gears.
2. Operating speed impacts gearbox noise generation more thantorque, chiefly because of the presence of vibration modes. Opera-tion at speeds which excite modes may produce very high noiselevels.
3. High-quality spur gears, with proper profile relief, operatewith minimum noise at the torque level which produces minimumdynamic response. Very low-torque operation may produce highdynamic loads and, therefore, high noise levels because of gear rattle
4. The dynamic tooth loads and noise of high-quality spur gearsmay be minimized by proper choice of profile modification. Thismodification may be chosen using an analytical model of the gearpai r.
REFERENCES
Atherton, W.J., Pintz, A., and Lewicki, D.G., 1987, "Auto-mated Acoustic Intensity Measurements and the Effect of GearTooth Profile on 'Poise," Mechanical Signature Analysis—MachineryVibration, Flow-Induced Vibration, and Acoustic Noise Analysis,S. Braun, et al., eds., ASME, pp. 109-113 (also, NASA TM-100155).
Bossier, R.B., Bowes, M.A., and Royal, A.C., 1978, "An Analyt-ical Method for Designing Low Noise Helicopter Transmissions,"Helicopter Acoustics, NASA CP-2052, Part 2, pp. 657-677.
Boyd, L-S., and Pike, J.A., 1987, "Expansion of Epicyclic GearDynamic Analysis Program," NASA CR-179563.
Flanagan, P.M., and Atherton, W.J., 1985, "Investigation onExperimental 'Techniques to Detect, Locate and Quantify GearNoise in Helicopter Transmissions," NASA CR-3847.
Mouser, D., 1991 ; "Gear Noise," Dudley's Gear Handbook,D. Townsend, ed., McGraw Hill Book Co., Chapter 14.
Kahraman, A., et al., 1990, "Dynamic Analysis of GearedRotors by Finite Elements," NASA TM-102349.
Levine, L.S., and DeFelice, J.J., 1977, "Civil HelicopterResearch Aircraft Internal Noise Prediction," NASA CR-145146.
Lin, H.H., Huston, R.L., and Coy, J.J., 1987a, "On DynamicLoads in Parallel Shaft Transmissions. 1: Modelling and Analy-sis," NASA TM-100180.
Lin, H.H., Huston, R.L., and Coy, J.J., 19876, "On DynamicLoads in Parallel Shaft Transmissions. 2: Parameter Study,"NASA TM-100181.
Lin, H.H., Townsend, D.P., and Oswald, F.B., 1989, "ProfileModification to Minimize Spur Gear Dynamic Loading, " 1289International Power Transmission and Gearing Conference, 5th;Proceedings, ASME, Vol. 1 ; pp. 455-465 (also, NASA TM-89901).
Oswald, F.B., et al., 1991, "Comparison of Analysis and Exper-iment for Dynamics of Low Contact Ratio Spur Gears," NASATM-103232, Proceedings of the 13th Biennial Conference onMechanical Vibration and Noise, ASME, Miami, FL, 1991.
Oswald, F.B., et al., 1992, "Comparison of Analysis and Experi-ment for Gearbox Noise," To be presented at the 1992 InternationalPower Transmission and Gearing Conference, ASME, Phoenix, A!,1992. (Also, to be published as NASA TM-105330.)
Pike, J.A., 1981, "Interactive Multiple Spur Gear MeshDynamic Load Program," NASA CR- 165514.
Rebbechi, B., et al., 1992, "A Comparison Between TheoreticalPrediction and Experimental Measurement of the Dynamic Behaviorof Spur Gears," To be presented at the 1992 International PowerTransmission and Gearing Conference, Phoenix, AZ, 1992. (Also, tobe published as NASA TM-105362.)
Seybert, A.F., et al., 1991, "Acoustical Analysis of Gear HousingVibration," NASA TM-103691.
Shahan, J.E. and Karnperrnan, G., 1966, Machine ElementsNoise, McGraw Hill Book Co.
Watanabe, Y., and Rouverol, W.S., 1990, "Maximum-ConjugacyGearing," Gear Design, Manufacturing and Inspection Manual,Society of Automotive Engineers, pp. 57-71.
Form ApprovedREPORT DOCUMENTATION PAGE OMB No. 0704-0188
Publicreporting burden for this collection of information is estimated to average 1 hour per response, including the time for reviewing instructions, searching existing data sources,gathering and maintaining the data needed, and completing and reviewing the collection of information. Send comments regarding this burden estimate or any other aspect of thiscollection of information, including suggestions for reducing this burden, to Washington Headquarters Services, Directorate for information Operations and Reports, 1215 JeffersonDavis Highway, Suite 1204, Arlington, VA 22202-4302, and to the Office of Management and Budget, Paperwork Reduction Project (0704-0188), Washington, DC 20503.
1. AGENCY USE ONLY (Leave blank) 2. REPORT DATE 3. REPORT TYPE AND DATES COVERED1992 Technical Memorandum
4. TITLE AND SUBTITLE 5. FUNDING NUMBERSEffect of Operating Conditions on Gearbox Noise
WU 505-63-36IL16221IA47A6. AUTHOR(S)
Fred B. Oswald, James J. Zakrajsek, Dennis P. Townsend, William Atherton,and Hsiang Hsi Lin
7. PERFORMING ORGANIZATION NAME(S) AND ADDRESS(ES) 8. PERFORMING ORGANIZATIONNASA Lewis Research Center REPORT NUMBERCleveland, Ohio 44135-3191and E-6732 Propulsion DirectorateU.S. Army Aviation Systems CommandCleveland, Ohio 44135-3191
9. SPONSORING/MONITORING AGENCY NAMES(S) AND ADDRESSES) 10. SPONSORING/MONITORING
National Aeronautics and Space AdministrationAGENCY REPORT NUMBER
Washington, D.C. 205460001and NASA TM-105331U.S. Army Aviation Systems Command AVSCOM—TR-91—C-031St. Louis, Mo. 63120-1798
11. SUPPLEMENTARY NOTESPrepared for the Sixth International Power Transmission and Gearing Conference sponsored by the American Society of Mechanical Engineers, Phoenix,Arizona, September 13-16, 1992. Fred B. Oswald, James J. Zakrajsek, and Dennis P. Townsend, NASA Lewis Research Center; William Atherton,Cleveland State University, Cleveland, Ohio 44115 and Hsiang Hsi Lin, Memphis State University, Memphis, Tennessee 38152. Responsible person, FredB. Oswald, (216) 433-3957.
12a. DfSTRIBUTION/AVAILABILITY STATEMENT 12b. DISTRIBUTION CODE
Unclassified -UnlimitedSubject Category 37
13. ABSTRACT (Maximum 200 words)
Low-contact-ratio spur gears were tested in the NASA gear-noise rig to study the noise radiated from the top of thegearbox. The measured sound power from the gearbox top was obtained from a near-field acoustic intensity scan takenat 63 nodes just above the surface. The sound power was measured at a matrix of 45 operating speeds and torque levels.Results are presented in the form of a spectral speed map and as plots of sound power versus torque (at constant speed)and as sound power versus speed (at constant torque). Because of the presence of vibration modes, operating speed wasfound to have more impact on noise generation than torque level. A NASA gear dynamics code was used to compute thegear tooth dynamic overload at the same 45 operating conditions used for the experiment. Similar trends were foundbetween the analytical results for dynamic tooth overload and experimental results for sound power. Dynamic analysismay be used to design high-quality gears with profile relief optimized for minimum dynamic load and noise.
14. SUBJECT TERMS 15. NUMBER OF PAGES
Gear noise; Spur gears; Acoustic intensity; Sound power 816. PRICE CODE
A0217. SECURITY CLASSIFICATION 18. SECURITY CLASSIFICATION 19. SECURITY CLASSIFICATION 20. LIMITATION OF ABSTRACT
OF REPORT OF THIS PAGE OF ABSTRACT
Unclassified Unclassified Unclassified
NSN 7540-01-280-5500 Standard Form 298 (Rev. 2-89)Prescribed by ANSI Std. Z39-18298-102