Embed Size (px)
Citation preview

AQUATIC MICROBIAL ECOLOGYAquat Microb Ecol
Vol. 66: 211–222, 2012doi: 10.3354/ame01576
Published online July 9
INTRODUCTION
Marine cyanobacteria, both unicellular Prochloro-coccus and Synechococcus and colonial Tricho -desmium spp., play important roles in the ocean car-bon cycle and the biological carbon pump, particularlyin the subtropical and tropical gyres (e.g. Partensky et
© Inter-Research 2012 · www.int-res.com*Email: [email protected]**These authors contributed equally to the design and execu-
tion of the experiments and are listed in alphabetical order
FEATURE ARTICLE
Effect of ocean acidification on cyanobacteria in thesubtropical North Atlantic
M. W. Lomas1,*, B. M. Hopkinson2,3,**, J. L. Losh2,** D. E. Ryan2,**, D. L. Shi2,4,**,Y. Xu2,**, F. M. M. Morel2
1Bermuda Institute of Ocean Sciences, St. George’s GE01, Bermuda2Department of Geosciences, Princeton University, Princeton, New Jersey 08544, USA
3Present address: Department of Marine Sciences, University of Georgia, Athens, Georgia 30602, USA4Present address: State Key Laboratory of Marine Environmental Science, College of the Environment and Ecology,
Xiamen University, Xiamen 361005, PR China
ABSTRACT: Cyanobacteria make significant contribu-tions to global carbon and nitrogen cycling, particu-larly in the oligotrophic subtropical and tropical gyres.The present study examined short-term (days) physio-logical and acclimation responses of natural cyanobac-terial populations to changes in pH/pCO2 spanning thelast glacial minimum, ~8.4/~150 ppm, to projected year2100 values of ~7.8/~800 ppm. Fe- and P-repletecolonies of Trichodesmium increased N2-fixation rates(nmol N colony−1 h−1) at pH 7.8 by 54% (range 6 to156%) over ambient pH/pCO2 conditions, while N2-fixation at pH/pCO2 8.4 was 21% (range 6 to 65%)lower than at ambient pH/pCO2; a similar pattern wasobserved when the rates were normalized to colony C.C-fixation rates were on average 13% (range −72 to112%) greater at low pH than at ambient pH and 37%(−53 to 23%) greater than at high pH. Whole commu-nity assemblages dominated by Prochlorococcus andSynechococcus (47 to 95% of autotrophic biomass),whether nutrient-replete or P-limited, did not show aclear response of C-fixation rates to changes inpH/pCO2. Comparison of initial and final C-fixationresponses across pH/pCO2 treatments suggests rapidacclimation of cellular physiology to new pH/pCO2
conditions. Changes in cell size and pigment contentfor Prochlorococcus and Synechococcus were minorand did not vary in a consistent manner with changesin pH/pCO2. These results for natural populations of all3 cyanobacteria concur with previous research andsuggest that one important response to changes inocean pH and pCO2 might be an increase in N2 and Cfixation by Trichodesmium under nutrient-replete con-ditions. The response of single-cell cyanobacteria tochanges in pH/pCO2 will likely be indirect and con-trolled by the response to other variables, such asnutrients.
OPENPEN ACCESSCCESS
At sea ocean acidification experiments show contrastingresponses between dominant unicellular and colonial naturalcyanobacteria populations. Insets (top to bottom): Synechococ-cus (epifluorescence microscopy), Prochlorococcus (bright-field microscopy) and Trichodesmium (bright-field microscopy)
Photos: S. Jaeger and M. Lomas
KEY WORDS: Cyanobacteria · North Atlantic · SargassoSea · Acidification · Nitrogen fixation · Photosynthesis
Resale or republication not permitted without written consent of the publisher

Aquat Microb Ecol 66: 211–222, 2012
al. 1999, Capone et al. 2005). The ongoing acidificationof the surface ocean by dissolution of anthropogeniccarbon dioxide from the atmosphere will likely affectthe growth of these and other important phytoplank-ton and therefore their roles in the ocean carboncycle. While a large number of studies have examinedthe effect of high pCO2/low pH on various culturedphytoplankton (Hutchins et al. 2009 and referencestherein), only a few of those studies have focused onthe growth and physiology of marine cyanobacteria.Furthermore, mesocosm experiments and incubationswith natural autotrophic populations have primarilybeen done in nutrient-rich systems where cyanobac-terial contributions to total autotrophic biomass arelow enough to be considered negligible (e.g. Tortell etal. 2002, Engel et al. 2005, Kim et al. 2006, Hare et al.2007, Riebesell et al. 2007, Sommer et al. 2007, Tortellet al. 2008, Feng et al. 2009).
Most of the research on cyanobacterial responsesto changes in pH/pCO2 has focused on the diazo -troph Trichodesmium, which is thought to accountfor about half of the total N2-fixation in the oceans(Barcelos e Ramos et al. 2007, Hutchins et al. 2007,Levitan et al. 2007, Kranz et al. 2009, 2010). Only 2studies have examined the response of other dia-zotrophs: Crocosphaera (Fu et al. 2008) and Nodu-laria spumigena (Czerny et al. 2009). In nutrient-replete culture studies, increasing pCO2 (decreasingpH) consistently resulted in a substantial increase inboth N2 fixation (35 to 120%) and C fixation (15 to100%) by Trichodesmium erythreaum IMS101 dueto the alleviation of inorganic C limitation at lowand ambient pCO2 levels. Growth of T. erythreaumat high pCO2 resulted in elevated cellular C:P andN:P but not C:N ratios. The relative increase in cel-lular C and N quotas was less than the increase inC- and N2-fixation rates, suggesting the net releaseof P-depleted DOM at high pCO2 (Hutchins et al.2007). Increased dissolved organic matter produc-tion, relative to particulate organic matter produc-tion, at high pCO2 may also be common in naturalsystems (Yoshimura et al. 2010, Kim et al. 2011)with minimal cyanobacterial populations. To ourknowledge, only one study has published similarexperiments with natural Trichodesmium popula-tions. Hutchins et al. (2009) report that Tricho -desmium colonies collected from a bloom in theGulf of Mexico increased N2-fixation rates by 6 to41% with a doubling of pCO2 from 380 ppm to750 ppm, which is consistent but on the low end ofpredictions from culture studies. The single cell dia-zotroph Croccosphaera also demonstrated an in -crease in C-fixation (20 to 100%) and N2-fixation
(40 to 80%) rates at high pCO2 but only under nutri-ent-replete conditions; iron-limited cultures did notshow any response (Fu et al. 2008). A study of theBlack Sea diazotroph Nodularia spumigena showedthe exact opposite effect of high pCO2, with a ~25%reduction in N2-fixation and a ~40% reduction ingrowth rate (Czerny et al. 2009); this contrastingresponse may reflect differences between non- heterocystous and heterocystous cyanobacteria, butthis is unknown. Based on studies with cultured Tri-chodesmium, ocean acidification would likely resultin a positive feedback on the growth and physiologyof natural populations, resulting in a positive changein their role in ocean carbon and nitrogen cycles.
The response of non-diazotrophic cyanobacteria topCO2 changes is less well understood. Fu et al. (2007)reported that doubling pCO2 alone had no significanteffect on the growth of either Synechococcus orProchlorococcus in culture, whereas ‘greenhouse’conditions (doubling pCO2 and increasing tempera-ture by 4°C) significantly increased growth rates,photosynthetic capacity, and cellular pigment levelsin Synechococcus but not Prochlorococcus. Thesedifferent responses between Synechococcus andProchlorococcus have been attributed to differencesin inorganic carbon acquisition systems associatedwith carbon limitation at low pCO2 in Synechococcus(Fu et al. 2007). In contrast, an enclosure experimentthat compared the growth of the natural phytoplank-ton assemblage (stimulated by addition of nutrients,10 μmol l−1 NO3
− and 0.5 μmol l−1 PO4−3) at 3 levels of
pH/pCO2 found the only significant difference to bea lower abundance of Synechococcus and a higherabundance of picoeukaryotes at high pCO2 (Paulinoet al. 2008). The response of natural cyanobacterialpopulations to elevated pCO2 in the nutrient-depletesubtropical and tropical seas remains an importantgap in our knowledge of the changing ocean (Rost etal. 2008, Hutchins et al. 2009), particularly given thepotential for increased areal extent of the oligotro-phic gyres due to ocean warming and increasedstratification (e.g. Boyd & Doney 2002).
Here, we report the results of several experimentscarried out between July 2009 and April 2010 at theBermuda Atlantic Time-series Study (BATS) stationwhere we examined the C-fixation responses of nat-ural assemblages dominated by Synechococcusand Prochlorococcus and the N2- and C-fixationresponses of isolated Trichodesmium colonies to pHmanipulations. Seasonally, the phytoplankton com-munity at BATS shifts from a spring bloom commu-nity co-dominated by nanoeukaryotes, in particularmembers of the haptophyte group, and Synechococ-
212

Lomas et al.: Effect of ocean acidification on cyanobacteria
cus (e.g. Lomas et al. 2010) to a community domi-nated by cyanobacteria, of all 3 genera, in late sum-mer (e.g. Orcutt et al. 2001, Steinberg et al. 2001). Ofparticular note with respect to the goals of the pres-ent study is the well documented slow acidification ofthe surface ocean at BATS (Bates 2007) and theincreasing contribution of Synechococcus biomass(and the decreasing importance of larger eukaryotes)during the winter/spring bloom (Lomas et al. 2010)over the past 2 decades.
MATERIALS AND METHODS
Field site and experimental design
Experiments were carried out on board the RV‘Atlantic Explorer’ at the BATS site (31° 40’ N,64° 10’ W), located in the subtropical North AtlanticOcean ~86 km south-east of Bermuda. Tricho -desmium thiebautii colonies were collected with a330 μm net that was hand-towed through the surfacemixed-layer (~20 m). Colonies were picked andrinsed in 0.22 μm filtered seawater immediately afterthe tow and distributed into duplicate experimentalbottles filled with filtered (0.2 μm) surface seawaterwhere the pH had been adjusted to represent past(pH ~8.4) and future (pH ~7.8) conditions (see section
‘pH/pCO2 manipu lation’) as well as a control bottlewith no pH adjustment. Both pH treatments and thecontrols were supplemented with 50 nmol l−1 phos-phate and 5 nmol l−1 FeCl3 (‘incubation media’). InExpts A−D, the colonies were allowed to acclimatefor 24 h in a shaded (30% surface irradiance) flow-through incubator, while in Expts E to I, rate measurements were begun immediately (Table 1).Colonies in Expts A to D were visually examinedafter acclimation and showed no obvious detrimentaleffects of the acclimation period, and all colonies ini-tially added were accounted for after the acclimationperiod.
For experiments with the bulk phytoplankton com-munity, water was collected using either a rosettesampler (March and April) or a trace-metal clean diaphragm pump (September), gently mixed in ashaded polycarbonate carboy, and dispensed intotriplicate acid-washed polycarbonate bottles. Sam-ples were collected from the approximate mid-pointof the mixed layer, which in September was ~10 m, inMarch ~50 m, and in April ~35 m. After pH/pCO2
adjustment, the following nutrient combinationswere added: P-limited treatment: 5 μmol l−1 NO3,5 μmol l−1 Si, 2 nmol l−1 Fe; N-limited treatment:0.5 μmol l−1 PO4, 5 μmol l−1 Si, 2 nmol l−1 Fe; Replete:5 μmol l−1 NO3, 0.5 μmol l−1 PO4, 5 μmol l−1 Si, 2 nmoll−1 Fe. Bottles were placed in a flow-through incuba-
213
Experiment Date Collection SST Duration Ambient Chl a NO3/2 PO4 Autotrophicdesignation (mo/d/yr) depth (m) (°C) (d)a pH (ppm) (μg l−1) (μmol l−1) (μmol l−1) carbon (%)
Trichodesmium experimentsA 7/14/2009 0–30 26.8 1 8.10 <0.03 <0.01 −B 7/16/2009 0–30 26.8 1 8.12 0.07 ~13b
C 7/17/2009 0–30 1 8.11 −D 7/19/2009 0–30 27.3 1 8.08 −E 7/20/2009 0–30 0 8.14 −F 8/14/2009 0–30 28.6 0 8.11 −G 8/15/2009 0–30 28.6 0 8.08 0.06 <0.03 <0.01 ~15H 8/16/2009 0–30 28.8 0 8.10 −I 8/17/2009 0–30 29.1 0 8.11 −
Whole community experiments09-09_Repletec 9/10/2009 0–30 28.1 2.8 8.08 0.06 ~95d
03-10_Replete 3/24/2010 50 18.9 3.2 8.07 0.62 ~4704-10_Replete 4/7/2010 35 18.9 1.5 8.07 0.41 ~52
aDuration of acclimation period to manipulated C system conditions prior to tracer incubationbEstimated contribution of Trichodesmium colonies to autotrophic C using colony abundances for these months from Orcuttet al. (2001) and C per colony from the present study (Fig. 2). Total algal C estimated from chl a and C:chl a ratio for theBermuda Atlantic Time-series Study (BATS) as in natural population experiments
cExperimental notation, MM-YY_nutrient conditiondCombined contribution of Synechococcus and Prochlorococcus carbon to total algal carbon (see ‘Materials and methods’).Total algal C estimated from chl a and C:chl a ratio at BATS. Synechococcus and Prochlorococcus cell C estimated fromflow cytometer forward scatter signal as in J. R. Casey et al. (unpubl.)
Table 1. Ambient environmental data associated with Trichodesmium and natural population experiments. SST: sea surface temperature

Aquat Microb Ecol 66: 211–222, 2012
tor shaded to ~30% of surface irradiance. In manycases, rate measurements were made immediatelyafter pH/pCO2 adjustment/ nutrient amendment, butin all experiments, the community was allowed togrow for 1 to 3 d under pH-adjusted conditions priorto final measurement of C-fixation and other param-eters. Final nutrient, but not Fe, concentrations weremeasured. With the exception of the N-limited treat-ments, dissolved inorganic nitrogen concentrationswere >1 μmol l−1.
pH/pCO2 manipulation
In all the low pH experiments, the pH was reducedto ~7.8, the approximate predicted year 2100 value.We used only high-purity HCl addition for the Tri-chodesmium incubations to minimize the chance ofcontamination. For the longer lasting incubationswith bulk phytoplankton in which the DIC draw-down might have become substantial, we addedequimolar additions of high-purity HCl andNaHCO3, effectively mimicking the ongoing rise inCO2, which also increases DIC. As shown by Shi et al.(2009), the method makes no difference as long asthe DIC drawdown is small. In the high pH experi-ments, the pH was increased to 8.4, similar to lastglacial minimum values, using high-purity NaOH.The pH was measured using an electrode calibratedon the USA National Bureau of Standards scale.These measurements were converted to the totalhydrogen ion scale by intercalibration with spec-trophotometric measurements of pH (on the totalhydrogen ion scale) using thymol blue (Zhang &Byrne 1996). All pH values are reported on the totalhydrogen ion scale. Based on pH and average DICconcentrations at BATS (N. Bates pers. comm.), theestimated pCO2 values for each treatment were asfollows: low pH: 800 to 820 ppm CO2, ambient pH:350 to 405 ppm CO2, high pH: 150 to 165 ppm CO2
(Lueker et al. 2000). pH measurements are a verygood indicator of change in CO2 concentrations dueto consumption or gas exchange (Gattuso et al. 2010).Values changed little between the beginning and theend of the incubation, suggesting that the carbon sys-tem was stable (data not shown).
Biomass measurements
Chlorophyll a (chl a) samples were collected bygentle vacuum filtration onto glass fiber filters (GF/F)and stored in liquid nitrogen. Onshore, the filters
were extracted overnight in a 90% acetone and 10%water solution at −20°C, and chl a was quantified fluorometrically (Parsons et al. 1984). Particulateorganic material was collected by gentle filtration onprecombusted GF/F filters and stored at −20°C. Priorto analysis, the filters were exposed to fuming HCl toremove inorganic carbon and then dried in an ovenat 60°C. Particulate organic carbon (POC) and nitro-gen (PON) masses and isotopic composition weremeasured using an elemental analyzer coupled to anisotope ratio mass spectrometer (e.g. Orcutt et al.2001). Particulate organic phosphorus (POP) wasanalyzed on a magnetic sector field HR-ICP-MS (Ele-ment 2, ThermoFinnigan) following the method ofTang & Morel (2006).
Rate measurements
Trichodesmium thiebautii colonies (in incubationmedia) were sealed in 30 ml glass serum vials towhich 15N2 gas (Cambridge Isotope Laboratory, 98%enriched) and 13C-NaHCO3 (Cambridge Isotope Lab-oratory, 98% enriched, 100 μmol l−1 final concentra-tion for an atom% enrichment of 4.5%; the additionalters pH by ≤0.02 units) were added and then incu-bated for 6 to 8 h around local noon at ~30% incidentirradiance in a flow-through incubator (Orcutt et al.2001). N2-fixation rates were quantified based on theincorporation of 15N2 into biomass and calculated following the methods of Montoya et al. (1996). C- fixation rates were measured by quantifying theincorporation of 13C-NaHCO3 into particulate bio-mass and calculated using equations analogous tothose for N2-fixation (e.g. Slawyk et al. 1977). DICconcentrations for these calculations were estimatedfrom the BATS climatology (e.g. Bates et al. 1996).Relative changes in N2- and C-fixation rates werecalculated as follows:
(1)
where Rtrt is the rate for a treatment (either high orlow pH), and Ramb is the rate at ambient pH.
For the bulk phytoplankton community experi-ments, C-fixation rates were measured using 14C-bicarbonate. To a 100 ml seawater sample, 5 μCi14C-bicarbonate was added, incubated for 2 to 3 h,centered on local noon, at ~30% incident irradi-ance in a flow-through incubator, and then gentlyfiltered through a GF/F filter. The filter was satu-rated with 2% HCl and allowed to degas overnightto remove inorganic carbon before addition of scin-
fractional change trt amb
amb= −( )R R
R
214
Lomas et al.: Effect of ocean acidification on cyanobacteria
tillation fluid and counting on a Perkin Elmer Tri-Carb 2900 TR low activity liquid scintillationanalyser. Samples for total 14C activity added weretaken at the beginning of the incubation and pre-served with an equal volume of β-phenethylamine.C-fixation rates were calculated based upon thecalculated 14C specific activity for each experimentand activity retained in the particulate fraction(Hopkinson et al. 2010).
Flow cytometry
Samples for analytical flow cytometric analysiswere collected from the whole community experi-ments and fixed with paraformaldehyde (0.5% finalconcentration, ~4°C for 1 to 2 h) before storage in liq-uid nitrogen until analysis. Samples were analyzedon a Becton Dickinson (formerly Cytopeia) influxcytometer as described by Lomas et al. (2010).Cyanobacteria were identified as either Synechococ-cus or Prochlorococcus based on cell size and thepresence or absence of phycoerythrin, respectively.Based upon these gating criteria, the number of cellsin each identified population was enumerated and
converted to cell abundances using the volume ana-lyzed method (Sieracki et al. 1993). Geometric meanvalues of red fluorescence (relative chlorophyll con-tent), orange fluorescence (relative phycoerythrincontent), and forward laser scatter (FSC, relativesize) for gated Synechococcus and Prochlorococcuspopulations were calculated using FCS Express v3.0.The geometric mean FSC signals for Synechococcusand Prochlorococcus were used to calculate meancellular POC using a direct POCcell vs. FSC calibra-tion curve specific to this instrument (J. R. Casey etal. unpubl.). In brief, the geometric mean FSC andPOCcell (via elemental analyzer) were determined ona wide range of cultures and flow cytometricallysorted natural populations up to ~20 μm in size. Arobust direct correlation was found between meanFSC and POCcell regardless of sample origin or size.In the present study, the mean FSC Synechococcusand Prochlorococcus was used to calculate POCcell,and this POCcell value was converted to POC per tax-onomic population by multiplying by abundance,summed across Synechococcus and Prochlorococcus,and expressed as a percentage of the total auto -trophic C estimated from chl a and the C:chl a ratiofor each cruise (data not shown).
215
Fig. 1. Trichodesmium thiebautii. (A,B) N2- and (C,D) C-fixation rates in response to low (black), ambient (light grey) and high(dark grey) pH for each of the 9 independent experiments, in terms of N or C fixed (A,C) per colony (col.) or (B,D) normalized
to colony C content. See Table 1 for experimental descriptions

Aquat Microb Ecol 66: 211–222, 2012
RESULTS AND DISCUSSION
Trichodesmium incubations
Colony normalized N2-fixation rates at ambientpH/pCO2 averaged (±SD) 0.031 ± 0.026 (range0.014 to 0.082; n = 9; Fig. 1A) nmol N colony−1 h−1,which is at the low end of rates previously meas-ured at BATS using 15N2 incubations (0.05 to0.5 nmol N colony−1 h−1; Orcutt et al. 2001). A pos-sible reason for this is the size of the colonies sam-pled. Orcutt et al. (2001) measured an averagecolony N quota of ~100 to 200 nmol N colony−1
which is slightly higher than the values of ~50 to125 nmol N colony−1 observed in the present study(Fig. 2A). Due to the possibility of changes incolony size or elemental composition between sam-pling points, N2-fixation rates were also normalizedto colony POC (Fig. 1C,D). In all 9 Trichodesmiumtheibautii experiments, nutrient-replete (see ‘Meth-ods’) N2-fixation rates increased at low pH relative
to rates at ambient pH with no significant difference(Student’s t-test, p = 0.372) between experimentswith (0.032 ± 0.026 N colony−1 h−1) and without(0.030 ± 0.029 N colony−1 h−1) the 24 h acclimationperiod (Fig. 1A). Further, normalization to colony Cdid not change the general pattern of data, and N2- fixation rates were significantly higher (Student’st-test; p < 0.01) at low pH (Table 2). On average,the N2-fixation rate at low pH was 54% (range 6 to156%) greater (HSD and t-tests, p < 0.05) than atambient pH conditions (Table 2). The results ofour field experiments with T. thiebautii are verysimilar, qualitatively and quantitatively, with thoseobtained in cultures of T. erythraeum (Barcelos eRamos et al. 2007, Hutchins et al. 2007, Levitan etal. 2007) and Trichodesmium spp. from the Gulf ofMexico (Hutchins et al. 2009). N2-fixation ratesdecreased in all but one incubation at high pH rel-ative to ambient pH (Fig. 1A, Table 2). N2-fixationrates at high pH were on average 21% (range 4 to63%) lower than at ambient pH (HSD and t-tests,
p < 0.05, Table 2) but still measura-ble at 0.027 ± 0.028 nmol N colony−1
h−1. This is in contrast to the find-ings of Hutchins et al. (2007), whofound that at low pCO2 (~180 ppm,similar to our low pH experiment),cultured T. erythraeum would notgrow. This finding suggests thatthere may be species-specific thres -holds for growth at low pCO2 orthat natural populations of Tricho -desmium have a greater resilienceto low pCO2, and perhaps othersub-optimal environmental condi-tions, than cultured representatives;this highlights the need to study theeffects of ocean acidification withnatural planktonic assemblages aswell as cultured representatives.
The C-fixation rates were morevariable but nonetheless show that in6 out of 9 experiments, C-fixationrates decreased with increasing pH(Fig. 1C). On average, C-fixationrates were 22 to 24% (range −53 to23%) lower at high pH than at ambi-ent pH and 37% (−72 to 112%) lowerthan at low pH, but the differenceswere not significant regardless ofnormalization (Table 2). These rela-tive changes are in good agreementwith previous work in cultures of
216
Fig. 2. Trichodesmium thiebautii. Biochemical characterization in response tochanges in pH. (A) Chlorophyll a (chl a) per colony (col.) (left partition), partic-ulate organic nitrogen (PON) per colony (middle partition), and particulate or-ganic carbon (POC) per colony (right partition). (B) Colony C:chl a ratio (leftpartition) and colony C:N ratio (right partition). ×: values for all experimentsgrouped by pH treatment; filled circle: mean. L, A, H represent low, ambient
and high pH treatments, respectively

Trichodesmium erythraeum, which showed a 15 to128% increase in C-fixation from present conditionsto future high pCO2 conditions (750 ppm; Hutchinset al. 2007). The two experiments where C-fixationrates decreased at low pH (C and G; Fig. 1B) werealso 2 of the lowest in terms of N2-fixation response,suggesting that some other constraint in those ex -periments may have mitigated the response tochanging pCO2.
The increases in N2-fixation and C-fixation undernutrient-replete, low pH conditions are consistentwith the upregulation of cellular machinery leadingto enhancement of growth rates (growth rates them-selves were not likely to have increased over thisshort acclimation and measurement period) as previ-ously shown (Barcelos e Ramos et al. 2007, Hutchinset al. 2007, Levitan et al. 2007). There are at least 2possible physiological explanations for this observa-tion. First, it is possible that the specific activity ofthe enzymes mediating these rate processes (i.e.nitrogenase and RUBISCO) changes in response tochanges in pH (Levitan et al. 2010). Second, upregu-lation may be attributed to reallocation of cellularenergy demand from the C concentrating mecha-nism allowing for enhancement of overall cellulargrowth rates (Kranz et al. 2010). Genetic evidencesuggests Trichodesmium has a C concentratingmechanism similar to other cyanobacteria (Badger etal. 2006); however, the observation that C-fixation athigh pH is depressed at short (Fig. 1) and acclimatedtimescales (Hutchins et al. 2007) suggests that theability to acquire inorganic carbon is limited or ener-
getically expensive at ambient and lower pCO2 lev-els. Consistent with the hypothesized upregulationof cellular growth at low pH is an average increasein mean colony chl a content at high pCO2 relative tochl a per colony at low pCO2 (Fig. 2A; 1-wayANOVA, p = 0.108), which would provide the addi-tional cellular energy needed for the energy inten-sive pathways of N2- and C-fixation. However, wedo not have data on variable fluorescence that wouldexplain whether the hypothesized change in energyallocation is due to increased energy transfer effi-ciency or due to changes in chl a and therefore totallight harvested. The average increase in the colonyC:chl a ratio with increasing pH (Fig. 2B) might sug-gest the latter, but this remains to be determined.Interestingly, there was a slight, but not significant(1-way ANOVA, p = 0.099), decrease in the particu-late C:N ratio during incubation at high pH (C:N =7.5 ± 0.83) and low pH (C:N = 6.5 ± 0.85; Fig. 2B),consistent with the slightly higher stimulation ofcolony-normalized N2-fixation relative to C-fixation(Fig. 1). The ratio of C and N-specific uptake rates(i.e. N2 fixation normalized to colony N and C fixa-tion normalized to colony C) at high pH (ratio = 6.6 ±2.9) and low pH (6.3 ± 2.3) also suggests little changein the cellular demand for C:N as a function of inor-ganic carbon cycle changes (data not shown). Fur-ther research is required to determine whether thisstability of the cellular C:N ratio is actively con-trolled by physiological mechanisms (e.g. changes inenzyme specific activity) and whether there are con-ditions under which they become uncoupled.
Lomas et al.: Effect of ocean acidification on cyanobacteria 217
Experiment N2-fixation N2-fixation C-fixation C-fixation(nmol N col.−1 h−1) (nmol N nmol-col.-C−1 h−1) (nmol C col.−1 h−1) (nmol C nmol-col.-C−1 h−1)Low pH High pH Low pH High pH Low pH High pH Low pH High pH
A 0.66 −0.04 0.62 0.47 0.40 −0.44 −0.36 −0.02B 1.56 nd 1.44 nd −0.03 nd −0.02 ndC 0.22 0.11 0.57 0.28 −0.49 −0.31 −0.34 −0.20D 0.11 −0.11 0.60 0.27 1.06 −0.10 1.06 −0.36E 0.06 −0.63 0.21 −0.37 −0.72 −0.27 −0.53 −0.16F 0.57 −0.29 0.678 −0.46 −0.47 −0.53 −0.50 −0.67G 0.10 −0.48 −0.07 −0.48 0.45 −0.04 0.24 −0.03H 0.82 −0.12 1.17 −0.32 −0.14 −0.44 0.20 −0.54I 0.74 −0.09 −0.04 −0.09 1.12 0.23 0.52 0.21
Average 0.54 −0.21 0.58 −0.09 0.13 −0.24 0.03 −0.22SD 0.49 0.24 0.51 0.38 0.67 0.25 0.53 0.29Statistic Student’s t-test Student’s t-test Mann-Whitney rank Mann-Whitney rank
p = 0.001 p = 0.009 sum p = 0.36 sum p = 0.31
Table 2. Fractional changes in N2- and C-fixation rates at high and low pH relative to rates measured at ambient pH. Dataare presented for colony normalized and colony (col.) C normalized rates. Negative values represent decreases in rates rela-tive to rates at ambient pH. Statistical tests report values for low pH vs. high pH comparisons for the same normalized rate
measurements. nd: no data

Aquat Microb Ecol 66: 211–222, 2012
Whole community incubations
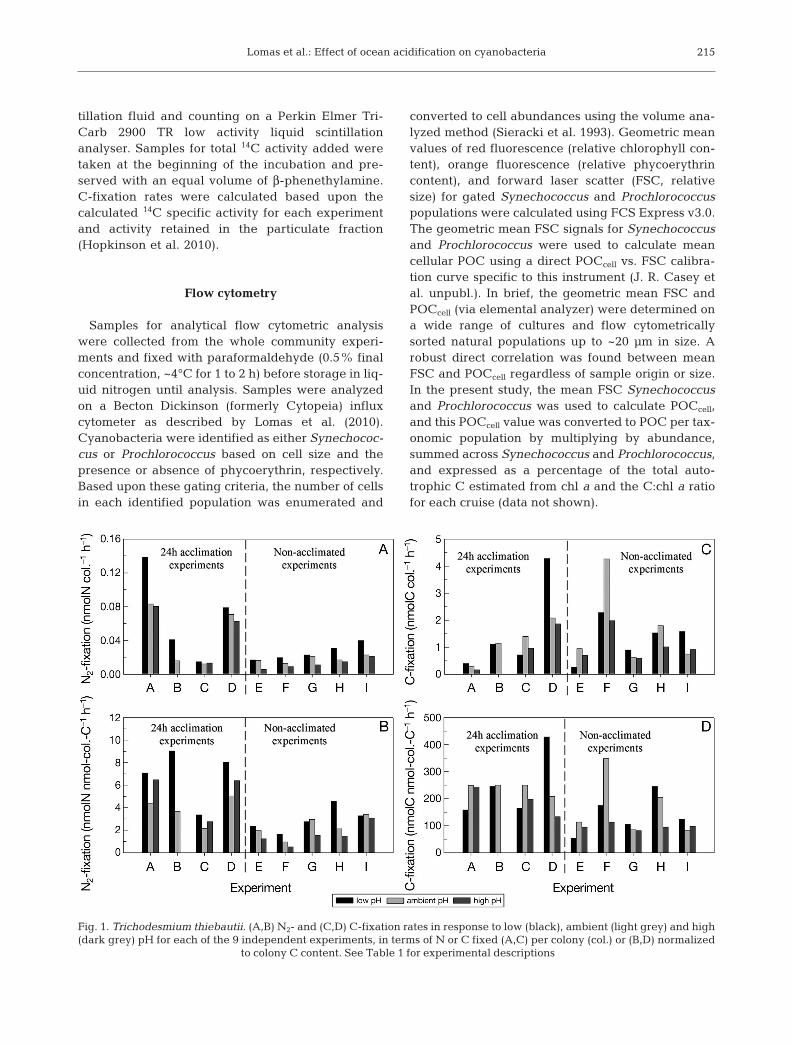
During September 2009, March 2010, and April2010, similar incubation experiments were per-formed at varying pH/pCO2 with the natural phy -toplankton assemblage, of which 47 to 95% ofthe autotrophic carbon biomass was attributed toPro chlorococcus and Synechococcus (Table 1).The remainder of the autotrophic biomass was dominated by pico- and nanoeukaryotes (data notshown). When 14C experiments were performedimmediately after pH adjustment and nutrient addi-tion (September and March only), a significant (p =0.002, t-test, 2-tailed distribution) increase in chl anormalized C-fixation (i.e. assimilation number)with decreasing pH was observed (Table 3). Therelative change in assimilation number over the fullexperimental pH range was 25 to 33% (Table 3).This differential effect was short-lived as no signifi-cant difference in assimilation number betweenpCO2 conditions was observed after 1 to 3 d of incu-bation in any treatment or month (Table 3). Therewere differences between the initial and finalassimilation number values, likely due to variablenutrient status in the various treatments at the endof the incubation. For example, in all P- limited andreplete incubations during all of the cruises, thechl a concentration (as a proxy for biomass) andSynechococcus cell number consistently increased.In the March and April experiments, chl a increasedto >2 μg l−1, which likely resulted in substantial con-sumption of added nutrients, whereas in September,chl a also increased 3-fold but remained <0.2 μg l−1,and nutrients were not substantially reduced.Regardless of the treatment or month, the relativechange in assimilation number over the full range ofpH treatments did not exceed 18% and averaged 11± 7%. These results suggest that natural phyto-plankton assemblages dominated by cyanobacteriahave the ability to immediately respond, viachanges in assimilation number, to either increasesor de creases in the ambient pCO2 condition. On theacclimation time scale (days), however, the assimila-tion numbers equalized, likely through adjustmentof the C concentrating mechanism. Therefore, thepCO2 response in single cell cyanobacteria, unlikethat observed above for Trichodesmium, appears tobe transient. On the timescale of cell division, pho-tosynthesis adjusts to optimize growth at the newconditions, and therefore, cell growth is unlikely tobe controlled by changes in the inorganic carboncycle but rather by macronutrient or micronutrientavailability (Beardall et al. 2009).
As expected, net cell growth was low and did notvary with pH treatment in either the P-limited ‘con-trol’ or P-replete treatments. The trends in netgrowth across pH treatments were not consistentbetween nutrient treatments (Table 3). Synechococ-cus cell numbers increased with decreasing pH in theabsence of added phosphate but decreased withdecreasing pH when phosphate was added. Thesame general pattern as a function of pH held forProchlorococcus. However, overall, there was a sub-stantial drop in cell abundance between initial valuesand those at the end of the incubation. These datasupport prior research that tight grazer control onpicoplankton under increasing pCO2 might be main-tained as long as the picoplankton community com-position does not change significantly, as was thecase in these experiments (Rose et al. 2009). In addi-tion, they suggest that there may be an interactionbetween nutrient status and pH manipulation thatshould be considered further in additional experi-ments, but treatment responses are likely to be small.
Because the cyanobacteria were analyzed usingflow cytometry, information was also gained onrelative cell size and pigment content (assessed byfluorescence) for Synechococcus and Prochlorococ-cus as a function of pH and nutrient conditions.Cell size (based upon forward light scatter as aproxy) changed little (≤20%) between the initialpopulation and most nutrient treatments and wasonly related to pH (increasing with increasing pH)in the September experiment for Synechococcus(Table 3). In March, the mean cellular chl a andphycoerythrin fluorescence for Synechococcus andProchlorococcus decreased ~50% in all tests, likelydue to photoacclimation, as cells were incubated atirradiances higher than what they were exposed toin the field. Consistent with this explanation is themuch smaller reduction in cellular pigment fluo-rescence during the incubation in April when themixed layer depth had shoaled to ~60 m within theeuphotic zone (~95 m; Siegel et al. 2001) from the>200 m in March (BATS unpubl. data). Cellularpigments, both chl a and phycoerythrin, werelargely independent of changes in pH treatment,with the exception of Synechococcus in September,which showed a consistent decrease in pigmentper cell with a decrease in pH (Table 3). Prochloro-coccus exhibited no change in cellular pigmentlevels in response to pH or nutrient treatments,suggesting that the 2 important single cellcyanobacteria do not have the same physiologicalresponse to the same environmental manipulations.Our data from the fall and spring cruises when
218
Lomas et al.: Effect of ocean acidification on cyanobacteria 219
Par
amet
er
M
onth
Init
ial
TfP
-lim
ited
T
fN
-lim
ited
T
fre
ple
te
L
A
H
L
A
H
L
A
H
L
A
H
S
7.76
8.0
8
8.3
0
−
−
−
−
−
−
7.
76
8.0
8
8.3
0
M
pH
7.
7000
00
8.
07
8.3
7
7.7
7
8.1
4
8.4
5
−
−
−
7.80
8
.14
8
.42
A
7.68
8.0
8
8.3
7
7.6
7
8.0
5
8.3
2
7.7
0
8.0
9
8.3
7
7.7
0
8.0
9
8.3
6
Wh
ole
co
mm
un
ity
A
ssim
. no.
S
0
.44
(0.0
9)
0.3
9 (0
.06)
0.35
(0.
04)
−
−
−
−
−
−
0.9
4 (0
.20)
0.83
(0.
23)
0
.88
(0.0
3)(m
ol C
g−
1
M
0.
63 (
0.00
)
0.50
(0.
00)
0
.47
(0.0
0)
0.
30 (
0.05
)
0.2
9 (0
.03)
0.26
(0.
04)
−
−
−
0
.39
(0.0
3)
0.
35 (
0.03
)
0.3
4 (0
.00)
chl
ah
−1 )
A
−
−
−
0.4
1 (0
.05)
0.33
(0.
08)
0
.35
(0.0
6)
0.
48 (
0.08
)
0.5
5 (0
.05)
0.43
(0.
05)
0
.33
(0.0
5)
0.
30 (
0.01
)
0.0
3 (0
.02)
Ch
l a
(μg
l−
1 )
S
0.05
(0.
01)
−
−
−
−
−
−
0.1
6 (0
.02)
0.18
(0.
03)
0
.18
(0.0
3)
M
0.
34 (
0.00
)
1.3
8 (0
.69)
1.37
(0.
72)
1
.69
(0.8
8)
−
−
−
3.1
5 (1
.61)
4.16
(2.
09)
4
.16
(2.0
9)
A
0.
69 (
0.00
)
0.7
7 (0
.15)
0.85
(0.
03)
0
.81
(0.0
0)
0.
42 (
0.03
)
0.3
9 (0
.03)
0.44
(0.
03)
2
.31
(0.2
5)
2.
49 (
0.00
)
2.2
0 (0
.12)
Par
ticu
late
S
−
−
−
−
−
−
−
−
−
−ca
rbon
M
−
11
.83
(2.4
6)
11.
68 (
1.94
)
12.4
1 (0
.45)
−
−
−
13
.40
(1.3
1)
15.
17 (
1.10
)
14.7
9 (0
.26)
(μm
ol C
l−
1 )
A
8.83
(0.
76)
1
2.66
(1.
70)
18.
08
1
4.46
(0.
76)
16
.18
(1.5
7)
17.
69 (
2.41
)
16.5
9 (0
.98)
1
7.88
(1.
96)
18
.17
(0.7
3)
16.
50 (
0.99
)
Par
ticu
late
S
−
−
−
−
−
−
−
−
−
−
nit
rog
en
M
−
1
.38
(0.2
8)
1.
60 (
0.34
)
1.5
4 (0
.06)
−
−
−
1
.91
(0.2
5)
2.
18 (
0.14
)
2.2
4 (0
.09)
(μm
ol N
l−
1 )
A
0.99
(0.
04)
1
.49
(0.1
2)
2.1
9
1.5
6 (0
.00)
1.22
(0.
04)
1
.36
(0.1
3)
1.
27 (
0.02
)
2.7
2 (0
.27)
2.82
(0.
11)
2
.47
(0.1
4)
Par
ticu
late
A
−
−
−
−
−
−
−
−
−
−
ph
osp
hor
us
S
−
−
−
−
−
−
−
−
−
−(μ
mol
P l
−1 )
M
−
0.06
6 (0
.007
) 0
.090
(0.
022)
0.0
67 (
0.00
6)
−
−
−
0.17
6 (0
.011
) 0
.236
(0.
051)
0.2
39 (
0.01
6)
C:N
rat
io
S
−
−
−
−
−
−
−
−
−
−
(mol
mol
−1 )
M
−
8
.59
(0.1
9)
7.
35 (
0.38
)
8.0
8 (0
.59)
−
−
−
7
.36
(0.4
2)
6.
85 (
0.20
)
6.6
7 (0
.18)
A
8.93
(0.
44)
8
.47
(0.4
9)
8.2
7
9.2
8 (0
.51)
1
3.20
(0.
84)
13
.02
(0.8
4)
13.
06 (
0.76
)
6.5
7 (0
.11)
6.45
(0.
10)
6
.68
(0.0
5)
C:P
rat
io
S
−
−
−
−
−
−
−
−
−
−
(mol
:mol
−1 )
M
−
−
−
−
−
−
−
−
−
−
A
−
18
3.5
(56.
4)
132
.8 (
21.6
)
179
.5 (
8.6)
−
−
−
7
7.1
(14.
2)
66
.0 (
11.9
)
62
.0 (
4.4)
Syn
ech
oco
ccu
s
Cel
l ab
un
dan
ce S
10.1
(4.
5)
−
−
−
−
−
−
5
1.1
(4.6
)
4
8.0
(2.2
)
4
6.1
(4.3
)(×
103
cell
s m
l−1 )
M
49.
7
100
6
3.3
6
5.1
−
−
−
12
.4
76.
3
99.
3
A
16.
1
49.
3
45.
6
29.
5
−
−
−
30.7
4
7.9
4
8.2
For
war
d s
catt
er S
1.57
(0.
22)
−
−
−
−
−
−
2.3
6 (0
.04)
2.56
(0.
07)
2
.82
(0.1
1)(F
SC
syn; r
fu)
M
2.2
6
1.7
4
1.6
9
1.7
1
−
−
−
1.66
1
.68
1
.67
A
2
.25
2
.21
2
.19
2
.18
−
−
−
2.
23
2.2
0
2.2
0
Ch
l a
S
0.
34 (
0.15
)
−
−
−
−
−
−
1
.26
(0.3
3)
1.
09 (
0.06
)
1.0
1 (0
.36)
flu
ores
cen
ce
M
2
.76
1
.16
1
.15
1
.16
−
−
−
1.
48
1.3
8
1.3
9(R
FL
syn; r
fu)
A
1.8
7
1.4
8
1.3
9
1.3
5
−
−
−
1.51
1
.52
1
.53
PE
S
0.
56 (
0.28
)
−
−
−
−
−
−
2
.89
(0.5
9)
2.
18 (
0.07
)
1.7
0 (0
.47)
flu
ores
cen
ce
M
3
.85
1
.94
1
.98
2
.01
−
−
−
1.
83
1.6
6
1.4
5(O
FL
syn; r
fu)
A
2.6
6
2.0
4
1.7
3
1.5
6
−
−
−
2.09
2
.06
1
.79
Tab
le 3
. Su
mm
ary
of w
hol
e co
mm
un
ity,
Syn
ech
ococ
cus
and
Pro
chlo
roco
ccu
sre
spon
se t
o p
CO
2/p
H m
anip
ula
tion
s. I
nit
ial v
alu
es w
ere
tak
en im
med
iate
ly a
fter
pH
was
adju
sted
; all
oth
ers
(Tf)
wer
e at
th
e en
d o
f th
e in
cub
atio
n p
erio
d. D
ata
are
mea
n (
SD
). –
: no
sam
ple
col
lect
ed. I
nit
ial
sam
ple
s w
ere
only
col
lect
ed f
rom
th
e am
bie
nt
(A)
con
dit
ion
, so
low
(L) a
nd
hig
h (H
) col
um
ns
are
left
op
en. F
low
cyt
omet
er fl
uor
esce
nce
val
ues
are
nor
mal
ized
to v
alu
es fo
r 0.
53 μ
m b
ead
s. E
rror
est
imat
es fo
r fl
ow c
ytom
-et
ry d
ata
wer
e d
eriv
ed a
s th
e co
effi
cien
t of
var
iati
on (
CV
) fo
r ea
ch p
aram
eter
for
eac
h o
f th
e cy
anob
acte
ria
pop
ula
tion
s; n
= 5
03 t
o 27
71 i
nd
ivid
ual
cel
ls c
oun
ted
for
Pro
chlo
roco
ccu
san
d n
= 1
912
to 1
507
1 in
div
idu
al c
ells
for
Syn
ech
ococ
cus.
CV
s w
ere
FS
Csy
n=
90.
3%
, FS
Cp
ro=
58.
8%
, RF
Lsy
n=
49.
5%
, RF
Lp
ro=
63.
0%
, OF
Lsy
n=
48.
4%
,an
d O
FL
pro
= 5
2.1
% (F
SC
: for
war
d s
catt
er; R
FL
: red
flu
ores
cen
ce; O
FL
: ora
ng
e fl
uor
esce
nce
). T
o al
l tre
atm
ents
, 5 μ
mol
l−1
NO
3, 0
.5 μ
mol
l−1
PO
4, 5
μm
ol l−
1S
i an
d 2
nm
oll−
1F
e w
as a
dd
ed e
xcep
t as
fol
low
s: P
-lim
ited
, P
O4
was
om
itte
d;
N-l
imit
ed,
NO
3w
as o
mit
ted
. L
, A
, H
: lo
w,
amb
ien
t, a
nd
hig
h p
H t
reat
men
ts,
resp
ecti
vely
; S
, M
, A
: Sep
tem
ber
, Mar
ch, a
nd
Ap
ril s
amp
lin
g e
ffor
ts, r
esp
ecti
vely
; PE
: ph
ycoe
ryth
rin
; rfu
: rel
ativ
e fl
uor
esce
nce
un
its

Aquat Microb Ecol 66: 211–222, 2012
cyanobacteria are very important contributors toautotrophic carbon biomass show relatively littledirect effect of pH on net growth (by changes incell number), carbon assimilation and cellular pig-ment levels. This is in accord with the results ofthe laboratory study of Fu et al. (2007), in whichmost of the effect observed in Synechococcusgrowth was caused by high temperature ratherthan increased pCO2. These observations suggestthat, unlike Trichodesmium, which is limited byinorganic carbon at low pCO2, single cell cyano -bacteria are not C-limited at low pCO2.
CONCLUSIONS
According to the results of the present field study,the only consistent and significant effect of decreas-ing pH on the cyanobacterial phytoplankton at BATSwas an increase in N2- and C-fixation by Tri-chodesmium. This increase, which was seen in iso-lated T. thiebautii colonies in the field, is similar towhat has been observed in several studies with purecultures of T. erythreum IMS101 (e.g. Barcelos eRamos et al. 2007, Hutchins et al. 2007). The implica-tion is that rising pCO2 in surface seawater couldlead to a substantial augmentation of N2-fixationrates by Trichodesmium and thus an increasing inputof fixed N into marine ecosystems where this organ-ism thrives. A major caveat is that, like most fieldmeasurements, our results were obtained under con-ditions of excess P and Fe, 2 nutrients that often limitthe growth of Trichodesmium in the ocean (Paerl etal. 1994, Lenes et al. 2001, Sañudo-Wilhelmy et al.2001, Achilles et al. 2005). Stratification will likelyonly increase in a future pCO2-enriched ocean, thusreducing vertical nutrient inputs in the subtropicaland tropical gyres where Trichodesmium is mostimportant (Sarmiento et al. 2004). Hutchins et al.(2007) showed that under P limitation, Trichodes -mium maintained near maximum growth rates duea reduction in cellular P quota, likely through substi-tution of sulfolipids for phospholipids (Van Mooy etal. 2009), thus countering potential reductions ingrowth rate associated with increased nutrient limi-tation associated with increased stratification (e.g.Rost et al. 2008).
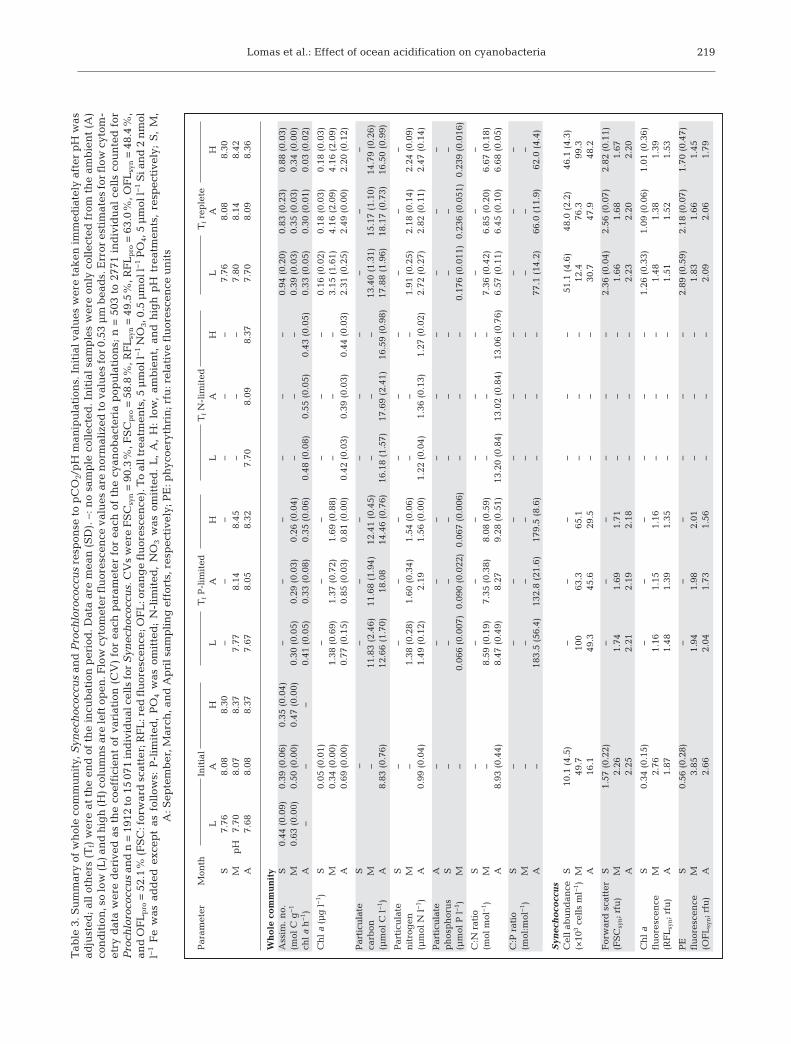
Bulk communities dominated by Synechococcusand Prochlorococcus, while showing a short term pHresponse (depression of C-fixation at high pH), rap-idly acclimate and up-regulate photosynthetic capac-ity such that pH-dependent responses are no longerevident after 1 to 3 d, the temporal resolution of these
220
Par
amet
er
M
onth
Init
ial
TfP
-lim
ited
T
fN
-lim
ited
T
fre
ple
te
L
A
H
L
A
H
L
A
H
L
A
H
S
7.76
8.0
8
8.3
0
−
−
−
−
−
−
7.
76
8.0
8
8.3
0
M
pH
7.
7000
00
8.
07
8.3
7
7.7
7
8.1
4
8.4
5
−
−
−
7.80
8
.14
8
.42
A
7.68
8.0
8
8.3
7
7.6
7
8.0
5
8.3
2
7.7
0
8.0
9
8.3
7
7.7
0
8.0
9
8.3
6
Pro
chlo
roco
ccu
s
C
ell
abu
nd
ance
S
25
.2 (
2.6)
−
−
−
−
−
−
7
.8 (
0.5)
8
.1 (
1.2)
11.
1 (1
.9)
(×10
3ce
lls
ml−
1 ) M
10
15
.3
13.
1
12.
3
−
−
−
7.1
1
7.5
9
.2
A
9.
7
11.
5
11.
2
7.8
−
−
−
3
.6
7.
8
7.
1
For
war
d s
catt
er S
0.38
(0.
05)
−
−
−
−
−
−
0.3
6 (0
.00)
0.36
(0.
00)
0
.36
(0.0
0)(F
SC
pro
; rfu
)
M
0
.44
0
.41
0
.40
0
.41
−
−
−
0.
33
0.3
9
0.3
1
A
0.5
8
0.5
5
0.5
5
0.5
7
−
−
−
0.47
0
.48
0
.49
Ch
l a
S
0.
06 (
0.00
)
−
−
−
−
−
−
0
.05
(0.0
1)
0.
05 (
0.01
)
0.0
5 (0
.01)
flu
ores
cen
ce
M
0
.18
0
.08
0
.08
0
.08
−
−
−
0.
08
0.0
8
0.0
8(R
FL
pro
; rfu
)
A
0
.11
0
.08
0
.08
0
.08
−
−
−
0.
08
0.0
8
0.0
8
PE
S
−
−
−
−
−
−
−
−
−
−fl
uor
esce
nce
M
0.0
3
0.0
3
0.0
3
0.0
3
−
−
−
0.03
0
.03
0
.04
(OF
Lp
ro; r
fu)
A
0.0
3
0.0
3
0.0
3
0.0
3
−
−
−
0.03
0
.03
0
.03
Tab
le 3
(co
nti
nu
ed)

Lomas et al.: Effect of ocean acidification on cyanobacteria
experiments. Our observations of small and non-sig-nificant effects of pH on Prochlorococcus and Syne-chococcus growth and physiological parameters arealso in accord with the results of laboratory experi-ments with pure cultures (Fu et al. 2007) and furtherhighlight the differences in response of similarphytoplankton to the same change in an environ-mental parameter. While a number of studies ofphytoplankton response to increased pCO2 havereported a variety of potentially significant responses(reviews by Fabry 2008, Hutchins et al. 2009), it maybe important to remember that many experiments inwhich no measurable effect of increasing pCO2 weredetected have probably not been published. In thefield of ocean acidification, all responses are impor-tant to understand how future autotrophs willrespond to these environmental changes.
Acknowledgements. We thank the Captain and crew of theRV ‘Atlantic Explorer’ for their assistance in conducting thisresearch and S. Goldberg for flow cytometric analyses. Thiswork was supported by NSF funding to F.M.M.M. and NSFaward OCE-0752161 to M.W.L. We thank the National Sci-ence Foundation Chemical and Biological OceanographyPrograms for continued support of the BATS program (OCE-0752366). This is BIOS contribution No. 2021.
LITERATURE CITED
Achilles KM, Lipschultz F, Sedwick P, Luther G, Church T(2005) Importance of iron to Trichodesmium colonies inthe western North Atlantic. ASLO 2005 Aquatic SciencesConference Abstract Book 4, Feb 20–25, Salt Lake City
Badger MR, Price GD, Long BM, Woodger FJ (2006) Theenvironmental plasticity and ecological genomics of thecyanobacterial CO2 concentrating mechanism. J Exp Bot57: 249−265
Barcelos e Ramos J, Biswas H, Schulz KG, La Roche J,Riebesell U (2007) Effect of rising atmospheric carbondioxide on the marine nitrogen fixer Trichodesmium.Glob Biogeochem Cycles 21, GB2028, doi: 10.1029/ 2006GB 002898
Bates NR (2007) Interannual variability of the oceanic CO2
sink in the subtropical gyre of the North Atlantic Oceanover the last two decades. J Geophys Res 112, C09013,doi: 10.1029/2006JC003759
Bates NR, Michaels AF, Knap AH (1996) Seasonal and inter-annual variability of oceanic carbon dioxide species atthe US JGOFS Bermuda Atlantic time-series study(BATS) site. Deep-Sea Res II 43: 347−383
Beardall J, Stojkovic S, Larsen SH (2009) Living in a highCO2 world: impacts of global climate change on marinephytoplankton. Plant Ecol Divers 2: 191−205
Boyd PW, Doney SC (2002) Modelling regional responses bymarine pelagic ecosystems to global climate change.Geophys Res Lett 29, 1806, doi: 10.1029/2001GL014130
Capone DG, Burns JA, Montoya JP, Subramaniam A andothers (2005) Nitrogen fixation by Trichodesmium spp.: an important source of new nitrogen to the tropical and
subtropical North Atlantic Ocean. Glob BiogeochemCycles 19, GB2024, doi:10.1029/2004GB002331
Czerny J, Barcelos e Ramos J, Riebesell U (2009) Influ -ence of elevated CO2 concentrations on cell divisionand nitrogen fixation rates in the bloom-forming cya -no bacterium Nodularia spumigena. Biogeosciences 6: 1865−1875
Engel A, Zondervan I, Aerts K, Beaufort L and others (2005)Testing the direct effect of CO2 concentration on a bloomof the coccolithophorid Emiliania huxleyi in mesocosmexperiments. Limnol Oceanogr 50: 493−507
Fabry VJ (2008) Marine calcifiers in a high-CO2 ocean. Science 320: 1020−1022
Feng Y, Hare CE, Leblanc K, Rose JM and others (2009)Effects of increased pCO2 and temperature on the NorthAtlantic Spring Bloom. I. The phytoplankton communityand biogeochemical response. Mar Ecol Prog Ser 388: 13−25
Fu FX, Warner ME, Zhang Y, Feng Y, Hutchins DA (2007)Effects of increased temperature and CO2 on photo -synthesis, growth, and elemental ratios in marine Synechococcus and Prochlorococcus (Cyanobacteria).J Phycol 43: 485−496
Fu FX, Mulholland MR, Carcia NS, Beck A and others (2008)Interactions between changing pCO2, N2 fixation andFe limitation in the marine unicellular cyanobacteriaCrocosphaera. Limnol Oceanogr 53: 2472−2484
Gattuso JP, Gao K, Lee K, Rost B, Schulz KG (2010)Approaches and tools to manipulate the carbonate chem-istry. In: Riebesell U, Fabry VJ, Hansson L, Gattuso JP(eds) Guide to best practices for ocean acidificationresearch and data reporting. Publications Office of theEuropean Union, Luxembourg
Hare CE, Leblanc K, DiTullio GR, Kudela RM and others(2007) Consequences of increased temperature and CO2
for phytoplankton community structure in the BeringSea. Mar Ecol Prog Ser 352: 9−16
Hopkinson BM, Xu Y, Shi DL, McGinn PJ, Morel FMM(2010) The effect of CO2 on the photosynthetic physiol-ogy of phytoplankton in the Gulf of Alaska. LimnolOceanogr 55: 2011−2024
Hutchins DA, Fu FX, Zhang Y, Warner ME and others (2007)CO2 control of Trichodesmium N2 fixation, photosynthe-sis, growth rates, and elemental ratios: implications forpast, present, and future ocean biogeochemistry. LimnolOceanogr 52: 1293−1304
Hutchins DA, Mulholland MR, Fu FX (2009) Nutrient cyclesand marine microbes in a CO2-enriched ocean.Oceanography (Wash DC) 22: 128−145
Kim JM, Lee K, Shin K, Kang JH and others (2006) Theeffect of seawater CO2 concentrations on growth of a nat-ural phytoplankton assemblage in a controlled meso-cosm experiment. Limnol Oceanogr 51: 1629−1636
Kim JM, Lee K, Shin K, Yang EJ, Engel A, Karl DM, Kim HC(2011) Shifts in biogenic carbon flow from particulate todissolved forms under high carbon dioxide and warmocean conditions. Geophys Res Lett 38, L08612, doi: 10.1029/2011GL047346
Kranz SA, Sultemeyer D, Richter KU, Rost B (2009) Carbonacquisition by Trichodesmium: the effect of pCO2 anddiurnal changes. Limnol Oceanogr 54: 548−559
Kranz SA, Levitan O, Richter KU, Prá$il O, Berman-Frank I,Rost B (2010) Combined effects of CO2 and light on theN2-fixing cyanobacterium Trichodesmium IMS101: physiological responses. Plant Physiol 154: 334−345
221

Aquat Microb Ecol 66: 211–222, 2012
Lenes JM, Darrow BP, Cattrall C, Heil CA and others (2001)Iron fertilization and the Trichodesmium response on theWest Florida shelf. Limnol Oceanogr 46: 1261−1277
Levitan O, Rosenberg G, Setlik I, Setlikova E and others(2007) Elevated CO2 enhances nitrogen fixation andgrowth in the marine cyanobacterium Trichodesmium.Glob Change Biol 13: 531−538
Levitan O, Brown C, Sudhaus S, Campbell DA, LaRoche J,Berman-Frank I (2010) Regulation of nitrogen metabo-lism in the marine diazotroph Trichodesmium IMS101under varying temperatures and atmospheric CO2 con-centrations. Environ Microbiol 12: 1899−1912
Lomas MW, Steinberg DK, Dickey T, Carlson CA, Nelson NB,Condon RH, Bates NR (2010) Increased ocean carbon ex-port in the Sargasso Sea is countered by its enhancedmesopelagic attenuation. Biogeosciences 7: 57−70
Lueker TJ, Dickson AG, Keeling CD (2000) Ocean pCO2 cal-culated from dissolved inorganic carbon, alkalinity andequations for K1 and K2: validation based on laboratorymeasurements of CO2 in gas and seawater at equilib-rium. Mar Chem 70: 105−119
Montoya JP, Voss M, Kahler P, Capone DG (1996) A simple,high-precision, high-sensitivity tracer assay for N2 fixa-tion. Appl Environ Microbiol 62: 986−993
Orcutt KM, Lipschultz F, Gundersen K, Arimoto R, MichaelsAF, Knap AH, Gallon JR (2001) A seasonal study of thesignificance of N2 fixation by Trichodesmium spp. at theBermuda Atlantic Time-series Study (BATS) site. Deep-Sea Res II 48: 1583−1608
Paerl HW, Prufert-Bebout LE, Guo C (1994) Iron stimulatedN2 fixation and growth in natural and cultured popula-tions of the planktonic marine cyanobacteria Tri-chodesmium spp. Appl Environ Microbiol 60: 1044−1047
Parsons TR, Maita Y, Lalli CM (1984) A manual of chemicaland biological methods for seawater analysis. Pergamon,Oxford
Partensky F, Hess WR, Vaulot D (1999) Prochlorococcus, amarine photosynthetic prokaryote of global significance.Microbiol Mol Biol Rev 63: 106−127
Paulino AI, Egge JK, Larsen A (2008) Effects of increasedatmospheric CO2 on small and intermediate sizedosmotrophs during a nutrient induced phytoplanktonbloom. Biogeosciences 5: 739−748
Riebesell U, Schulz KG, Bellerby RGJ, Botros M and others(2007) Enhanced biological carbon consumption in ahigh CO2 ocean. Nature 450: 545−548
Rose JM, Feng Y, Gobler CJ, Gutierrez R, Hare CE, LeblancK, Hutchins DA (2009) Effects of increased pCO2 andtemperature on the North Atlantic spring bloom. II.Microzooplankton abundance and grazing. Mar EcolProg Ser 388: 27−40
Rost B, Zondervan I, Wolf-Gladrow D (2008) Sensitivity ofphytoplankton to future changes in ocean carbonatechemistry: current knowledge, contradictions and re -search directions. Mar Ecol Prog Ser 373: 227−237
Sañudo-Wilhelmy SA, Kustka AB, Gobler CJ, Hutchins DAand others (2001) Phosphorus limitation of nitrogen fixa-tion by Trichodesmium in the central Atlantic Ocean.Nature 411: 66−69
Sarmiento JL, Slater RD, Barber RT, Bopp L and others(2004) Response of ocean ecosystems to climate warm-ing. Glob Biogeochem Cycles 18, GB3003, doi: 10. 1029/2003 GB002134
Shi D, Xu Y, Morel FMM (2009) Effects of the pH/pCO2 con-trol method on medium chemistry and phytoplanktongrowth. Biogeosciences 6: 1199−1207
Siegel DA, Westberry TK, O’Brien MC, Nelson NB and oth-ers (2001) Bio-optical modeling of primary production onregional scales: the Bermuda BioOptics project. Deep-Sea Res II 48: 1865−1896
Sieracki ME, Verity PG, Stoecker DK (1993) Plankton com-munity response to sequential silicate and nitrate deple-tion during the 1989 North Atlantic spring bloom. Deep-Sea Res II 40: 213−226
Slawyk G, Collos Y, Auclair JC (1977) The use of 13C and 15Nisotopes for the simultaneous measurement of carbonand nitrogen turnover rates in marine phytoplankton.Limnol Oceanogr 22: 925−932
Sommer U, Aberle N, Engel A, Hansen T and others (2007)An indoor mesocosm system to study the effect of climatechange on the late spring and summer succession ofBaltic Sea phyto- and zooplankton. Oecologia 150: 655−667
Steinberg DK, Carlson CA, Bates NR, Johnson RJ, MichaelsAF, Knap AH (2001) Overview of the US JGOFSBermuda Atlantic Time-series Study (BATS): a decade-scale look at ocean biology and biogeochemistry. Deep-Sea Res II 48: 1405−1447
Tang DG, Morel FMM (2006) Distinguishing between cellu-lar and Fe-oxide-associated trace elements in phyto-plankton. Mar Chem 98: 18−30
Tortell PD, DiTullio GR, Sigman DM, Morel FMM (2002)CO2 effects on taxonomic composition and nutrient uti-lization in an Equatorial Pacific phytoplankton assem-blage. Mar Ecol Prog Ser 236: 37−43
Tortell PD, Payne CD, Li YH, Trimborn S and others (2008)CO2 sensitivity of Southern Ocean phytoplankton. Geo-phys Res Lett 35, L04605, doi:10.1029/2007GL032583
Van Mooy BAS, Fredricks HF, Pedler BE, Dyhrman ST andothers (2009) Phytoplankton in the ocean use non-phos-phorus lipids in response to phosphorus scarcity. Nature458: 69−72
Yoshimura T, Nishioka J, Suzuki K, Hattori H, Kiyosawa H,Watanabe YW (2010) Impacts of elevated CO2 on organiccarbon dynamics in nutrient depleted Okhotsk Sea sur-face waters. J Exp Mar Biol Ecol 395: 191−198
Zhang HM, Byrne RH (1996) Spectrophotometric pH meas-urements of surface seawater at in-situ conditions: absorbance and protonation behavior of thymol blue.Mar Chem 52: 17−25
222
Editorial responsibility: Hugh MacIntyre,Halifax, Nova Scotia, Canada
Submitted: September 27, 2011; Accepted: May 15, 2012Proofs received from author(s): June 22, 2012