Embed Size (px)
Citation preview

1
Effect of Obesity on Antioxidant enzymes and Type 2
Diabetes Mellitus
By
Alok Sharma MD (Medicine), Department of Cardiology Jawaharlal Nehru Medical College & Associated group of Hospitals, Ajmer & Reenu Sharma* Ph.D Scholar (Clinical Biochemistry), Department of Biochemistry Jawaharlal Nehru Medical College, Ajmer *Phone: 09414433013, *Email: [email protected] *(Address for correspondence: G-34, G-block, Makarwali Road, Vaishali Nagar, Ajmer- 305006) Abstract Obesity refers to body mass index (BMI) greater than 30kg/m2. The present study aims
to assess firstly, obesity as an independent risk factor for decreased activity of
antioxidant enzymes in humans and secondly, its role in complicating glucose and lipid
metabolism in type 2 diabetic subjects.
The study was conducted on two groups; Group 1 had 50 obese subjects with two
subgroups: (a) including 25 type 2 diabetic subjects and (b) 25 obese with different
grades of obesity (30-50 kg/m2) with no history of type 2 diabetes, hypertension, and
hyperlipidemia. Group 2 included 25 non-obese type 2 diabetic subjects. Results were
compared with 25 age matched healthy controls. Parameters assessed were BMI (weight
in kg/height2 in metres), lipid profile, erythrocyte Superoxide dismutase (SOD) and
2
Glutathione peroxidase (GPX). They were assessed spectrophotometrically using
appropriate kits.
The subjects with healthy BMI had significantly higher (p<0.001) erythrocyte
SOD (1443.45 ± 176.84 units/gHb) and GPX (95.1 ± 3.6 units/g Hb) than those with
BMI above 40kg/m2 (986.0 ± 25.0 units/gHb) and (80.8 ± 7.2 units/gHb). The values (in
mg/dl) of cholesterol (C) 276.03 ± 4.62, triglycerides (TG) 186.6 ± 4.02, high density
lipoprotein-C (HDL-C) 30.98 ± 0.92,very low density lipoprotein-C (VLDL-C) 37.3 ±
0.76 and low density lipoprotein–C (LDL-C) 207.75 ± 9.23 respectively were
significantly higher (p<0.001) in subgroup (a) compared to group2 (231.0 ± 8.43, 160.0
± 5.53, 33.94 ± 1.37, 31.69 ± 1.09, 165.29 ± 6.69). TC, TG, VLDL, HDL-C and LDL-C
showed a significantly increasing pattern with increase in BMI. Plasma glucose both
fasting and post prandial levels (in mg/dl) showed a highly significant pattern (p<0.001)
in subgroup (a) (151.7 ± 21.8, 223.03 ± 5.09) compared to group 2(130.34 ± 3.59, 158.2
± 8.9). FPG and 2hr PG values in obese non diabetic subjects with BMI 40-44 Kg/
m2,45-50 Kg/m2 showed significantly higher values compared to subjects with BMI 30-
34 Kg/ m2 [FPG:0.03, 0.001 ;2hrPG: 0.08(not quite significant),0.0005].
It is concluded from the results that obesity independent of additional
factors such as hypertension, diabetes mellitus, hyperlipidemia and smoking
causes decreased activity of antioxidant enzymes. It should receive the similar
attention as obesity with complications. Also, with obesity insulin resistance
worsens and the dyslipidemia in type 2 diabetics impairs further.
Introduction
Obesity is a condition in which the natural energy reserve stored in the fatty tissue of
humans is increased to a point where it is associated with certain health conditions.

3
Although obesity is an individual clinical condition, it is increasingly viewed as a serious
and growing public health problem. Excessive body weight has been shown to
predispose to various diseases particularly cardiovascular diseases, diabetes mellitus type
2, sleep apnea and osteoarthritis1.
The degree of overweight can be expressed in several ways, but the most useful is
body mass index (BMI). This index is the body weight in Kgs divided by square of the
height in metres (W/H2). Healthy weight is defined as a BMI between 19 and 25 kg/m2.
Overweight is a BMI of 25-30 kg/m2 and is associated with low risk. A BMI greater than
30 kg/m2 is almost always associated with increased mortality and various diseases2, 3.
The cutoff value for healthy BMI in Indians is below 23 kg/m2. Despite having lean
BMI an adult Indian has more chances of having abdominal obesity. The national Indian
survey showed that upper body adiposity was more common (50.3%) than overweight4, 5.
The new generation of children and adolescents show unprecedented levels of obesity.
This foretells not only an epidemic of obesity to be tackled. But also a great burden of
treating weight related chronic diseases such as diabetes and cardiovascular diseases 6.
CHANGES IN DIET REDUCED PHYSICAL
ACTIVITY
Increased calories Improved modes of transport
Increased refined CHO Less physical exertion at work
Decreased complex CHO Sedentary habits
Decreased Fiber
Increased Fat
Obesity
Insulin Resistance
Stress Factors
Diabetes

4
Changes due to urbanization
The international obesity task force estimates that upto 1.7 billion people may be
exposed to weight related health risks which includes Asian population with a BMI of 23
or more7. Recently, obese populations have also been shown to be vulnerable to
oxidative stress. Obesity is an independent risk factor for a reduction in erythrocyte
antioxidant enzyme activities and is associated with lower levels of serum antioxidants
such as vit. E and B Carotene. It has also been put forward, that production of reactive
oxygen species (ROS) is increased significantly in adipose tissue of non diabetic obese
and accompanied by decreased antioxidative enzymes only in fat tissues. Inhibition of
ROS production attenuated the dysregulation of adipocytokines and improved insulin
resistance, diabetes and hyperlipidemia8.
Obesity is the most powerful environmental risk factor for type 2 diabetes
mellitus also and BMI is a standard predictor of diabetic status. The prevalence of
diabetes is 2.9 times higher in overweight (BMI > 27.8 in men and > 27.3 in women)
than in normal weight subjects9, 10. The conversion to diabetes is enhanced by the low
thresholds for the risk factors such as age, BMI and upper body adiposity. With a high
genetic predisposition and the high susceptibility to the environmental insults, the Indian
population faces a high risk for diabetes and its associated complications. Diabetologists
are now observing a sharp increase in type 2 DM primarily because of increases in
sedentary life style and obesity11, 12.
Also, Obesity and type 2 diabetes both are independent risk factors for
hypertension and dyslipidemia. Multiple modifications of serum lipids and lipoproteins
as evidenced in this study are frequently noted in overweight/obese individuals. The
most common modifications are hypertriglyceridemia and decreased HDL-C levels.
There is a strong negative correlation between obesity and HDL-C levels. It has been
postulated that there is a decrease of approximately 0.4 mg/dl of HDL-C with each
Kg/m2 increment of BMI13, 14.
Aims and objectives
The present study was planned to assess:

5
• Obesity as an independent risk factor for decreased activity of antioxidant
enzymes in humans,
• Its role in complicating glucose and lipid metabolism in type 2 diabetic subjects
• To evaluate the effect of obesity on glucose and lipid levels in type 2 diabetics.
Material and methods
The study was conducted on obese and non-obese type 2 diabetic subjects as well as
obese non diabetic subjects of either sex, middle aged admitted in wards and attending
OPD of J.L.N. Medical College and Associated Group of Hospitals. The results were
compared with 25 age matched healthy controls.
The subjects were grouped as follows –
Group I (n = 50):
Subgroups: (a) 25 obese type 2 diabetic.
(b) 25 obese with different grades of obesity (30-50 kg/m2)
with no history of type 2 diabetes, hypertension and
hyperlipidemia.
Group II (n = 25): Non obese type 2 diabetic subjects.
Group III (n = 25): Healthy controls
Fasting blood samples were collected by venipuncture in vacutainers. Plain
vacutainers were employed for assay of serum lipid profile, EDTA vacutainers for assay
of plasma glucose and antioxidant enzymes.
Following parameters were assessed –
1. BMI (Body mass index): A ratio of weight and square of height (expressed as
kg/m2).
2. Plasma Glucose (fasting and post prandial):
Method: Caraway W.T., Bergmayer H.V.15
3. Lipid Profile :
Serum cholesterol (CHO)
Method – Meiattini F et al.16
Serum triglycerides (TG)

6
Method – Buccolo G et al. 17
Serum High density lipoprotein cholesterol (HDL-C)
Method – Allain CC et al.18
Serum Very low density lipoprotein = VLDL and
Low density lipoprotein – cholesterol = LDL-C calculated according to
Friedwald’s equation.19
VLDL = TG/5
LDL – C = CHO – (HDL-C + TG/5)
4. Super Oxide Dismutase (SOD) :
Method – McCord and Fridovich.20
5. Glutathione Peroxidase (GPx)
Method ─ Paglia and Valentine.21
Statistical analysis
Results were shown as mean ± standard deviation (SD). Changes in values of controls
and SCH patients were analysed by student’s t test. Values p<0.05 were accepted as
statistically significant.
Observations
Table 1
Activities of Erythrocyte SOD and GPx in Normal and Obese Non Diabetic
Subjects
BMI (Kg/m2) SOD (Units/gHb)
Mean ± SD GPx (Units/gHb) Mean ± SD
19-22 (n=25) (Healthy Controls)
1443.45 ± 176.84a 95.1 ± 3.6a*
30-39 (n=15) (Obese non diabetics)
1218.0 ± 31.0b 92.3 ± 3.2b*

7
40-49 (n=10) (Obese non diabetics)
986.0 ± 25.0c 80.8 ± 7.2c*
a and b, a* and b* show P < 0.001, a and c, a* and c* show P < 0.0001
Figure 1
SOD and GPx values in Healthy controls and obese nondiabetic subjects
0
200
400
600
800
1000
1200
1400
1600
19-22
(n=2
5)
(Hea
lthy C
ontrols)
30-39
(n=1
5)
(Obes
e non d
iabeti
cs)
40-49
(n=1
0)
(Obes
e non d
iabeti
cs)
BMI (Kg/m2)
CO
NC
.(U/L
)
SOD(Units/gHb)Mean GPx(Units/gHb)Mean

8
Table 2
Levels of various Biochemical Parameters assessed in Lipid Profile in Various
Groups of Subjects (Healthy Controls, Non Obese type 2 Diabetics and Obese type
2 Diabetics)
Parameters (mg/dl)
Group III (n=25) Mean ± SD
Group II (n=25) Mean ± SD
Group I (a) (n=25) Mean ± SD
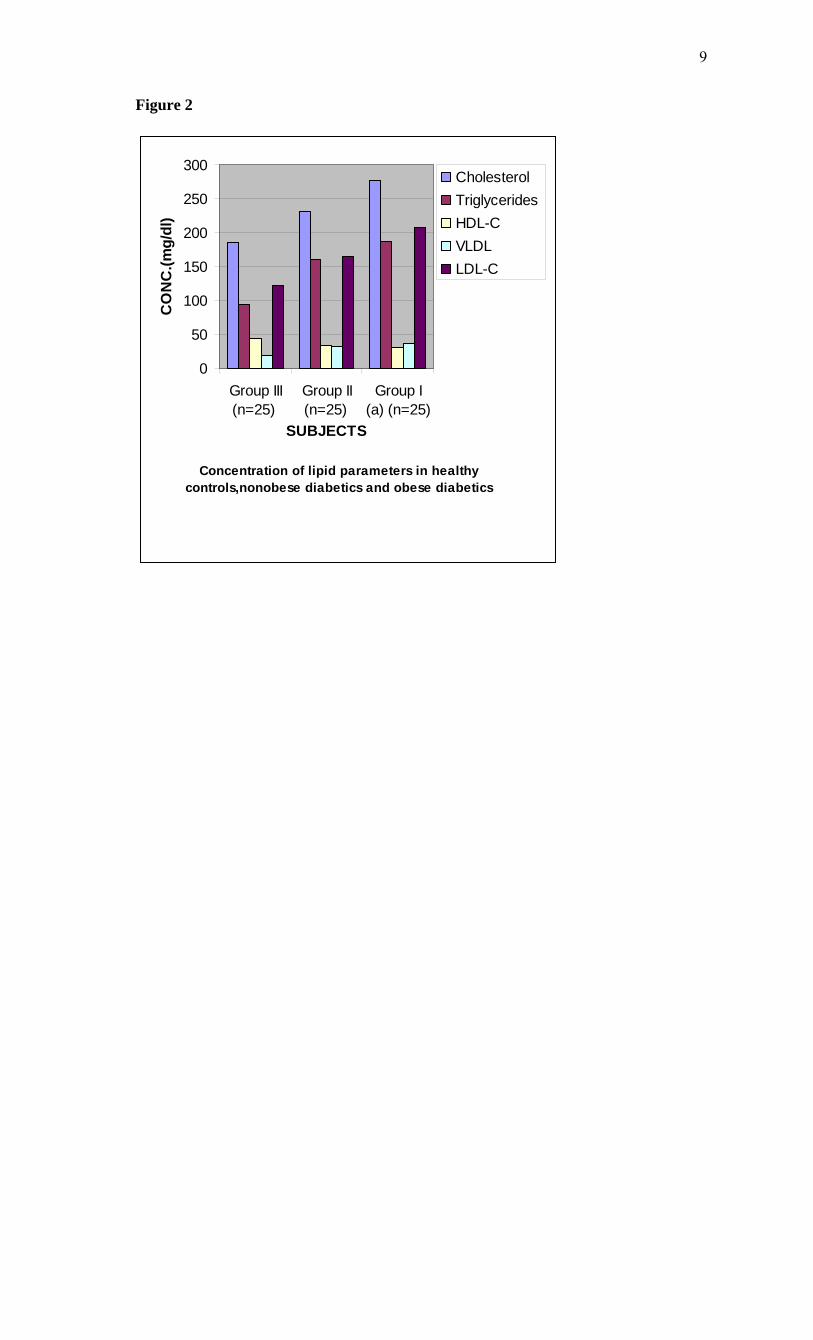
Cholesterol 184.68 ± 4.52º 231.0 ± 8.43* 276.03 ± 4.62#
Triglycerides 94.10 ± 5.65º 160.0 ± 5.53* 186.6 ± 4.02#
HDL-C 44.28 ± 2.36º 33.94 ± 1.37* 30.98 ± 0.92#
VLDL 18.82 ± 1.13º 31.69 ± 1.09* 37.3 ± 0.76#
LDL-C 121.58 ± 10.12 165.29 ± 6.69* 207.75 ± 9.23#
º vs* P < 0.001(Very significant)
* vs #, º vs # P < 0.0001(Highly significant)
9
Figure 2
Concentration of lipid parameters in healthy controls,nonobese diabetics and obese diabetics
0
50
100
150
200
250
300
Group III(n=25)
Group II(n=25)
Group I(a) (n=25)
SUBJECTS
CO
NC
.(mg/
dl)
Cholesterol Triglycerides HDL-C VLDL LDL-C

10
Table 3
Concentrations (expressed as mean ± SD) of lipid profile parameters in obese non
diabetic subjects (group IIb) in various ranges of BMI
BMI (kg/m2) TC (mg/dl) TG (mg/dl) VLDL (mg/dl)
HDL-C (mg/dl)
LDL-C (mg/dl)
30-34a (n=7) 180.0±10.3 119.0±10.3 23.7±2.06 45.2±1.56 111.0±11.0
35-39b (n=8) 190.0±7.13 121.0±7.13 24.2±1.42 44.4±1.41 121.0±7.56
40-44c (n=5) 199.0±6.15 130.0±5.36 25.9±1.05 42.7±1.08 131.0±6.92
45-50d (n=5) 208.0±4.04 139.0±5.56 27.7± 39.5±1.60 140.0±4.89
P values a Vs b TC, TG, VLDL, HDL-C, LDL-C are 0.04 (S), 0.55 (NS), 0.54 (NS), 0.30 (NS), 0.05(S) P values a Vs c TC, TG, VLDL, HDL-C, LDL-C are 0.004 (VS), 0.05 (S), 0.05 (S), 0.01 (S), 0.005 (S) P values a Vs d TC, TG, VLDL HDL-C, LDL-C are 0.0002 (HS), 0.002(VS), 0.002 (VS), < 0.0001 (HS), 0.0002 (HS). P values b Vs c TC, TG, VLDL, HDL –C, LDL-C are 0.04 (S), 0.05 (S), 0.05 (S), 0.03 (S), 0.05 (S). P values b Vs d TC, TG, VLDL, HDL-C, LDL-C are 0.0004 (HS), 0.0008 (HS), 0.0008 (HS), 0.0001 (HS), 0.0004 (HS). P values c Vs d TC, TG, VLDL, HDL-C, LDL-C are 0.03 (S), 0.03 (S), 0.03 (S), 0.006 (VS), 0.03 (S). S = Significant NS = Non significant VS = Very significant HS = Highly significant

11
Figure 3
Table 4 Values of Fasting and Post Prandial Plasma Glucose (FPG, 2hr PG) in Healthy
Controls, Non-Obese type 2 Diabetics and Obese type 2 Diabetics
Parameters (mg/dl)
Group III (n=25) Mean ± SD
Group II (n=25) Mean ± SD
Group I (a) (n=25) Mean ± SD
FPG 74.7 ± 6.5 130.34 ± 3.59* 151.7 ± 21.8#
2hr PG 104.3 ± 5.2 158.2 ± 8.9* 223.03 ± 5.09#
* and # P < 0.0001 (Highly significant)
Concentrations of lipid parameters in obese non DM subjects within various ranges of BMI
0
50
100
150
200
250
30-34(n=7)
35-39(n=8)
40-44(n=5)
45-50(n=5)
BMI (kg/m2)
CONC
.(mg/
dl)
TC (mg/dl)
TG (mg/dl)
VLDL (mg/dl)
HDL-C (mg/dl)
LDL-C (mg/dl)

12
Figure 4
FPG and 2hr PG values in healthy controls, nonobese diabetics and
obese diabetics
0
50
100
150
200
250
Group III(n=25)
Group II(n=25)
Group I (a)(n=25)
SUBJECTS
CO
NC.
(mg/
dl)
FPG2hr PG

13
Table 5 Concentrations (expressed as mean ± SD) of FPG and 2hr PG in obese non diabetic
subjects (group IIb) in various ranges of BMI
BMI (kg/m2)
FPG (mg/dl) P value 2 hr PG
(mg/dl) P value
30-34a (n=7) 97.5±6.80 a vs b 0.08 (NS)
110.0±6.62 a vs b 0.84 (NS)
35-39b (n=8) 103.0±4.53 a vs c 0.03 (S) a vs d 0.001 (VS)
110.0±5.36 a vs c 0.08 (NS) a vs d 0.0005 (HS)
40-44c (n=5) 109.0±8.38 b vs c 0.13 (NS) b vs d 0.002 (VS)
119.0±9.64 b vs c 0.05 (S) b vs d 0.0002 (HS)
45-50d (n=5) 121.0±11.8 c vs d 0.09 (NS)
136.0±11.0 c vs d 0.03 (S)
S = Significant NS = Non significant VS = Very significant HS = Highly significant

14
Figure 5
Results
The results of the study that is values of antioxidant enzymes SOD and GPx, Lipid profile and
Glucose in the subjects are given in tables 1-5 respectively and in figures1-5.
Table 1 (Figure1) shows an inverse relationship between BMI and erythrocyte SOD activity. The
mean erythrocyte SOD activity of subjects with healthy body weight (1443.45 ± 176.84 units/g
Hb) was significantly higher (P<0.001) than in subjects with BMI greater than 30 kg/m2 (1218.0 ±
31.0 units/g Hb). The table also shows that subjects with BMI above 40 kg/m2 have the lowest
activity of erythrocyte SOD (986.0 ± 25.0 units/g Hb). Table 1 also shows an inverse relationship
between the erythrocyte cytoprotective enzyme GPX and BMI. The activity of this enzyme in
individuals with healthy BMI (95.1±3.6 units/g Hb) was significantly higher (P<0.001) than the
value in those with BMI greater than 30 kg/m2 (92.3±3.2 units/g Hb). Subjects with BMI greater
than 40 kg/m2 had the least activity of this enzyme (80.8 ± 7.2units/g Hb). Thus the results
FPG and 2hr PG values in obese non DM subjects within various ranges of BMI
0
20
40
60
80
100
120
140
160
30-34(n=7)
35-39(n=8)
40-44(n=5)
45-50(n=5)
BMI(Kg/m2)
CONC
.(mg/
dl)

15
support the role of obesity in decreasing the activities of antioxidant enzymes or in other terms
enhancing oxidative stress.
In Table 2 (Figure 2) the values of various biochemical parameters measured in lipid
profile showed a highly significant pattern in group II (p< 0.001) and Group I(a) (p<0.0001)
subjects compared to healthy controls. Also, the values were significantly higher (P < 0.0001) in
group I (a) compared to group II supporting the effect of obesity in further impairing the lipid
levels in type 2 diabetics.
In Table 3 (Figure 3) the values of TC, TG, VLDL, HDL-C and LDL-C showed
significantly increasing patterns with increase in BMI. Significantly high values for TC and
LDL-C were obtained in group IIb subjects with BMI 35-39 Kg/ m2 compared to those with
BMI 30-34Kg/ m2 (0.04, 0.05).Further, subjects with BMI 40-44 Kg/ m2 showed significantly
high values for all lipid parameters (0.004, 0.05, 0.05, 0.01, 0.005) compared to those with
BMI 30-34Kg/ m2.Significant differences in values were obtained in subjects with BMI 45-
50 Kg/ m2 (0.0002, 0.002, 0.002, < 0.0001, 0.0002) compared to those with BMI 30-34Kg/
m2.
Even when subjects with BMI 35-39Kg/ m2 were compared to those with BMI 40 - 44
Kg/ m2 significant differences in values were obtained (0.04, 0.05, 0.05, 0.03, 0.05). Further,
on comparing subjects with BMI 35-39Kg/ m2 with BMI 45 - 50 Kg/ m2 significant
differences in values were obtained (0.0004, 0.0008, 0.0008, 0.0001, 0.0004).Values for
subjects with BMI 45 - 50 Kg/ m2 were significantly higher when compared to subjects with
BMI 40-44 Kg/ m2 (0.03, 0.03, 0.03, 0.006,0.03).
In table 4 (figure 4) the plasma glucose values (FPG and 2hr PG) were significantly higher
(P < 0.0001) in group I (a) compared to group II reflecting the effect of obesity in impairing the
glucose levels further, in subjects with type 2 diabetes.
In table 5 (figure 5) the FPG and 2hr PG values in obese non diabetic subjects with BMI
40-44 Kg/ m2,45-50 Kg/m2 showed significantly higher values compared to subjects with BMI

16
30-34 Kg/ m2 [FPG:0.03, 0.001 ;2hrPG: 0.08(not quite significant),0.0005]. Further, 2hr PG
values showed a significant pattern in subjects with BMI 40-44 Kg/ m2 compared to those with
BMI 35-39 Kg/ m2(0.05) and 45-50 Kg/ m2(0.03).FPG and 2hr PG values were higher in subjects
with BMI 45-50 Kg/ m2 compared to subjects with BMI 35-39 Kg/ m2 (0.002, 0.0002).
Discussion
The obesity epidemic is of considerable importance since it runs parallel to the type 2 DM and
metabolic syndrome epidemic, we are currently experiencing. It is important to single out obesity
as it plays an important role in the development of abnormalities related to glucose and lipid
metabolism22.
In our study we noted a decrease in levels of antioxidant enzymes viz. SOD and Gpx
with increase in BMI. The decrease was significant in subjects with BMI 40-49 Kg/m2 (P <
0.0001) compared to subjects with BMI 19-22 Kg/m2. The decrease in SOD and Gpx
activities in obese could be due to increased H2O2 production in adipose tissue of obese.
SOD is believed to play a major role in the metabolism of reactive oxygen
species (ROS). It is the first enzyme involved in the destruction of superoxide (O2−) anion
radicals. It converts O2− into hydrogen peroxide (H2O2). Animal cells contain two
intracellular forms of SOD, the cytoplasmic or copper zinc form (Cu – Zn SOD) and
mitochondrial or manganese form (Mn-SOD). This enzyme is the first line of defense
against O2− anion radicals and can be induced rapidly in some conditions such as exposure to
oxidative stress (OS) of cells or organs23, 24.
H2O2 is metabolized by Gpx in synergy with glutathione reductase (GSH). Gpx
has a much higher affinity for H2O2 than catalase suggesting that H2O2 is mainly degraded
by Gpx under normal condition23,24.Furukawa et al., (2004) suggested that adipose tissue is
the major source of elevated plasma ROS. In normal conditions a state of redox homeostasis

17
is present which is the normal physiologic process of reduction and oxidation in order to
repair unstable, damaging ROS which include toxic oxygen free radicals [O2− and OH−
(hydroxyl radical)], the highly unstable pro-oxidant oxygen non radicals (H2O2, singlet
oxygen and organic analogues). OS implies a loss of redox homeostasis with an excess of
ROS. OS is associated with an overproduction of ROS as well as an impairment of
antioxidant defensive capacity as found in type 2 DM, metabolic syndrome and obesity
alone.25
Obesity increases the OS by three possible mechanisms. Firstly, it increases the
mechanical and metabolic load on the myocardium, thus increasing myocardial oxygen
consumption. A negative consequence of the elevated myocardial oxygen consumption is the
production of ROS such as O2−, hydroxyl radical and hydrogen peroxides from the increased
mitochondrial respiration. Leakage of electrons out of the mitochondrial election transport
chain promotes a one electron reduction of molecular oxygen resulting in the formation of
O2− radicals.26
The second mechanism by which obesity can independently cause OS is by progressive
and cumulative cell injury resulting from pressure from the large body mass. Cell injury
causes the release of cytokines especially tumour necrosis factor alpha (TNF- α) which
generates ROS from the tissues 27.
A third possible mechanism is through diet which is probably a predominant cause in
India. Nutritional obesity implies the consumption of hyperlipidemic diets which may be
involved in oxygen metabolism. Double bonds in the fatty acid molecules are vulnerable to
oxidation reactions and may consequently cause lipid peroxidation.28
Thus, the decreased values of SOD and GPx observed in our study could be due to
increased OS caused by obesity which causes stimulation of antioxidant enzymes. But over a
period of time the stores of antioxidant enzymes are depleted and cannot keep pace with
increasing OS.

18
In our study we also observed a significant increase in TC, TG, VLDL-C, LDL-C values
(P = 0.0002, P = 0.002, P = 0.002, P = 0.0002) in obese non diabetics with BMI 45-49 kg/m2
compared to those with BMI 30-34 kg/m2.
Further, comparison of obese diabetic subjects (Group IIa) with obese non diabetics
(Group IIb) yielded significant results suggesting that with obesity insulin resistance worsen
and dyslipidemia in type 2 diabetics impairs further29, 30. This causes raised TC, TG, VLDL-
C, LDL-C and lower levels of HDL-C in obese diabetics compared to obese non diabetes.
According to Grundy (2005) dyslipidemia associated with obesity is multi-factorial, and is
frequently associated with a cluster of interrelated cardiovascular disease risk factors.
Obesity is a critical determinant of dyslipidemia and operates through a number of metabolic
influences that include reduced insulin sensitivity and changes in fatty acid metabolism.
Variations in the nature and magnitude of the dyslipidemia are due to the interaction of
genetic factors with environmental influences most notably diet and physical activity, and
possibly stress31.
Among the major effects of excess adiposity on plasma lipoproteins are increases in
levels of TG rich VLDL particles. Both adipocyte derived fatty acids and cytokines, or
adipokines, can promote increased TG synthesis, leading to increased hepatic secretion of
TG enriched VLDL. Plasma VLDL levels can increase further as a result of reduced
lipolysis and clearance due to the lower peripheral activity of lipoprotein lipase (LPL)
associated with adiposity. Partially lipolysed VLDL remnants can then return to the liver,
adding to the TG pool available for VLDL secretion32.
As TG level increases in obese individuals the diameter of major LDL species
decline. The mechanism for increased LDL according to Berneis (2002) is that a higher level
of plasma TG is associated with larger VLDL particles are lipolysed less efficiently by LPL.
This gives rise to remnant particles. These remnants have increased content of the apoprotein
C III. Their slow lipolysis lead to reduced receptor mediated plasma clearance33.
19
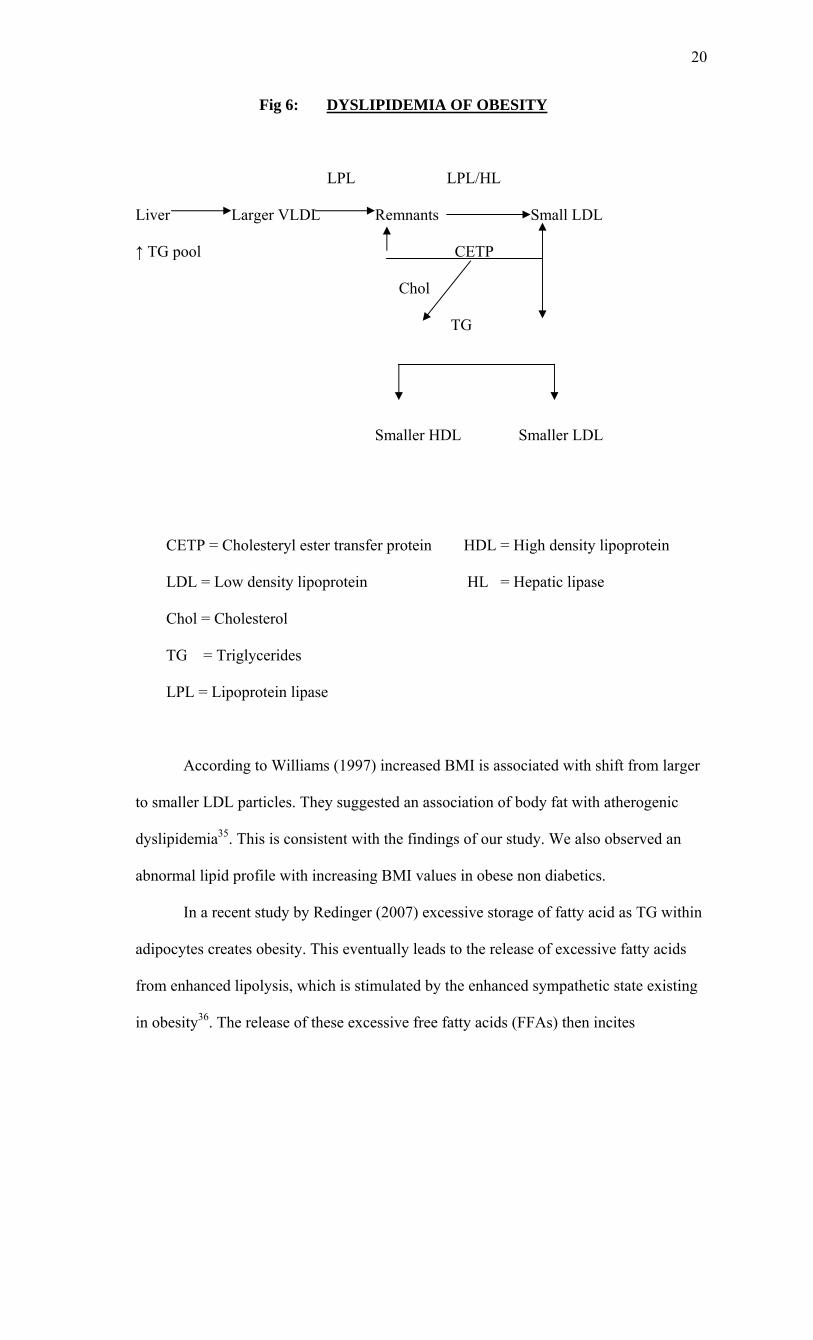
The remnants are further lipolysed by the combined action of LPL and hepatic lipase
(HL) a process mediated by cholesterol ester transfer protein (CETP). The resulting TG is, in
addition delipidated and remodeled to form smaller, lipid depleted LDL. These particles
have lower affinity for LDL receptor. Moreover, higher levels of remnant particles lead to
increased exchange of TG for cholesterol in both LDL and HDL, a process mediated by
CETP. TG rich LDLS and HDLS are degraded further by HL, leading to yet smaller LDLs
and to smaller and less stable HDLs that are more rapidly catabolised, resulting in reduced
HDL cholesterol (Fig. 6). There is a strong negative correlation between obesity and HDL-C
levels with a decrease of approximately 0.4 mg/dl of HDL-C with each kg/m2 increment of
BMI33, 34.
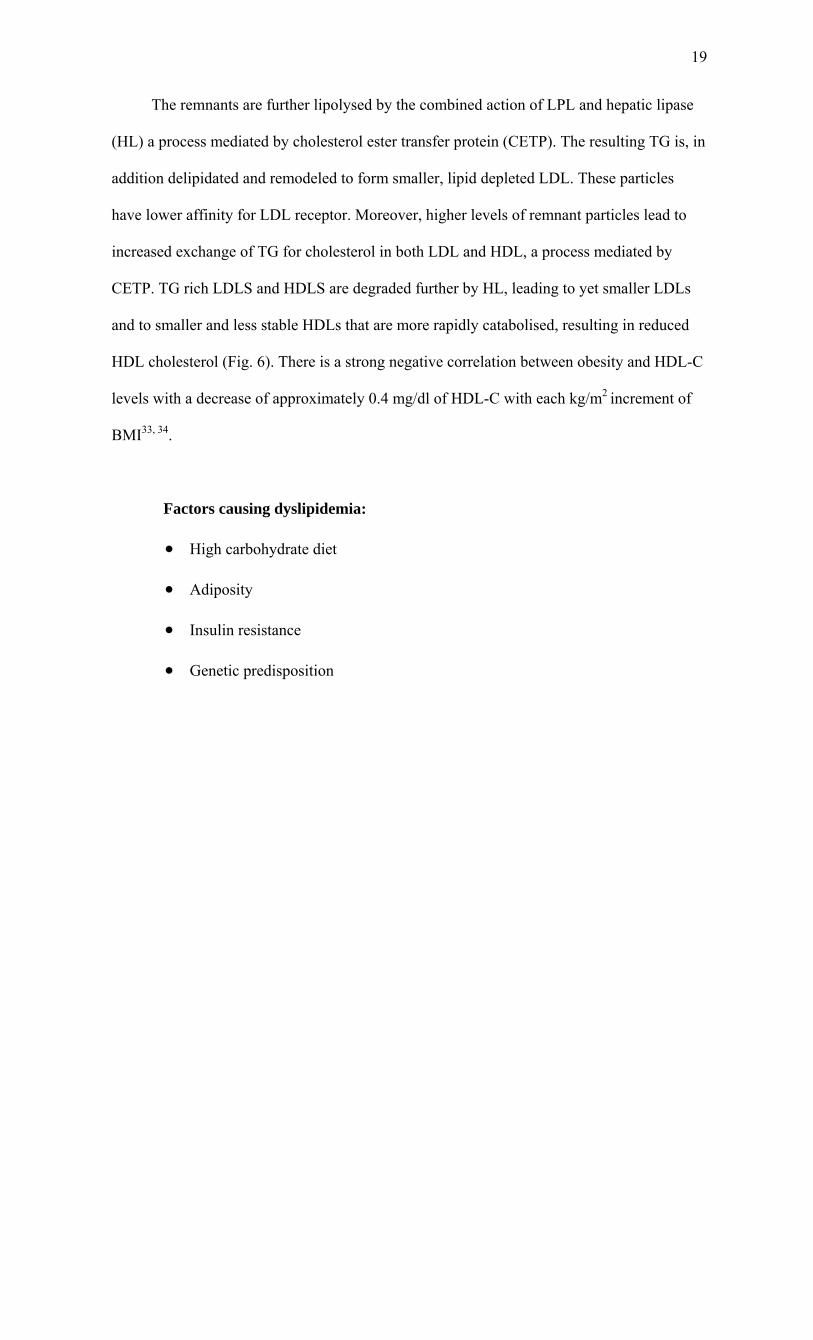
Factors causing dyslipidemia:
• High carbohydrate diet
• Adiposity
• Insulin resistance
• Genetic predisposition
20
Fig 6: DYSLIPIDEMIA OF OBESITY
LPL LPL/HL
Liver Larger VLDL Remnants Small LDL
↑ TG pool CETP
Chol
TG
Smaller HDL Smaller LDL
CETP = Cholesteryl ester transfer protein HDL = High density lipoprotein
LDL = Low density lipoprotein HL = Hepatic lipase
Chol = Cholesterol
TG = Triglycerides
LPL = Lipoprotein lipase
According to Williams (1997) increased BMI is associated with shift from larger
to smaller LDL particles. They suggested an association of body fat with atherogenic
dyslipidemia35. This is consistent with the findings of our study. We also observed an
abnormal lipid profile with increasing BMI values in obese non diabetics.
In a recent study by Redinger (2007) excessive storage of fatty acid as TG within
adipocytes creates obesity. This eventually leads to the release of excessive fatty acids
from enhanced lipolysis, which is stimulated by the enhanced sympathetic state existing
in obesity36. The release of these excessive free fatty acids (FFAs) then incites

21
lipotoxicity, as lipids and their metabolites create oxidant stress to the endoplasmic
reticulum and mitochondria. This affects adipose as well as non adipose tissue,
accounting for its pathophysiology in many organs such as the liver and pancreas, and in
metabolic syndrome37, 38. The FFAs released from excessively stored TG deposits also
inhibit lipogenesis, preventing adequate clearance of serum TG levels that contribute to
hypertriglyceridemia39.
The above mechanism probably causes insulin receptor dysfunction. This results
in an insulin resistant state that creates hyperglycemia with compensated
gluconeogenesis39, 40. The above explanation supports the results of our study as elevated
FPG and 2 hr PG levels were observed in obese non diabetics.
The obesity induced hyperglycemic state also increases hepatic glucose
production. This accentuates the insulin resistance in obese as BMI increases. It is also
decreases utilization of insulin stimulated muscle glucose contributing further to
hyperglycemia39, 40.
A significant pattern of increase in levels of FPG and 2 hr PG was observed in
obese non diabetic subjects with increase in BMI from 30 to 50 kg/m2. This can be
substantiated by the significant results obtained an comparing obese subjects with BMI
30-34 kg/m2 with subjects in BMI ranges 35-39 kg/m2, 40-44 kg/m2 and 45-50 kg/m2
respectively (P = 0.08, P = 0.03, P = 0.001 for FPG values) (P = 0.84, P = 0.08, P =
0.0005 for 2 hr PG)(Table5).
The above results are in agreement with the following concept that resistance to
insulin action augments with increasing severity of obesity. With passage of time the
functional capacity of the insulin secreting cells of islets of langerhans first increases, as
a result of hypertrophy and perhaps limited hyperplasia. When the total functional
capacity of the system is reached the decompensation and perhaps true exhaustion of the

22
insulin producing ability occurs. This results in a gradual yet continuous deterioration of
glucose intolerance in the obese subjects who are likely to end up with type 2 DM41.
The above mechanism illustrates the role of obesity in causing DM. However,
also in our study the obese diabetic subjects (group IIa) showed a more atherogenic lipid
profile and also significantly higher FPG and 2 hr PG values compared to obese non
diabetic subjects. This suggests that the above discussed effects of obesity on lipids and
glucose are amplified in diabetics with obesity.
The decreased levels of antioxidant enzymes observed in obese non diabetics may
also play a role in impairing glucose tolerance in these subjects. We have discussed
previously that obesity causes increases in OS. It is known that OS impairs both insulin
secretion by pancreatic β cells, glucose transport in muscle and adipose tissue 23.
The possible mechanism could be that increased production of ROS is
accompanied by augmented expression of nicotinamide adenine dinucleotide phosphate
(NADPH) oxidase and decreased expression of antioxidative enzymes and OS. This
causes dysregulated production of adipocytokines (fat derived hormones). Excessive and
long term exposure to ROS reduces insulin sensitivity and impairs glucose as well as
lipid metabolism23 (Fig. 7).

23
Fig.7. ROS production in accumulated fat contributes to insulin resistance, DM and
atherosclerosis
Obesity causes
↑ NADPH oxidase ↓ Antioxidative enzymes
↑ ROS ↑ ROS
OS to remote tissues ↑ OS, dysregulation of
adipocytokines
Insulin resistance, Diabetes mellitus and Atherosclerosis
Conclusion
From the study it is indicated that obesity is an independent risk factor to cause
decreased activity of antioxidant enzymes. Obesity is an exaggeration of normal
adiposity and is a central player in the pathophysiology of DM, insulin resistance,
dyslipidemia, hypertension and atherosclerosis. Obesity is a major contributor to the
metabolic dysfunction involving lipid and glucose as well as in complicating the clinical
symptoms in subjects already suffering from type 2 diabetes. Thus, it may be suggested
that weight control is a prerequisite for an obese so as to avoid the associated metabolic
complications. It is also of considerable concern in India as urbanisation has resulted in
several changes in life style which is causing a clustering of cardiovascular risk factors
namely central adiposity, obesity, hyperinsulinemia, dyslipidemia, hypertension and
glucose intolerance.

24
Literature cited
1. U.S Dept. of Health and Human Service, National Institutes of Health “Clinical
Guidelines on the Identification, Evaluation and Treatment of Overweight and
Obesity in Adults”. The Endocrine Report (2000). NHLBI document 98 – 4083.
2. US Department of Health and Human Services. The Surgeons general report on
Nutrition and Health US Department of Health and Human Services:
Washington, DC, 1988, Department of Health and Human Services Publication
88-50210.
3 Manson JE, Stampfer MJ, Hennekens CH, Willet WC. Body weight and
longevity. A reassessment. JAMA 1987; 257: 353-358.
4 Banerji MA, Faridi N, Atluri R et al. Body composition ,visceral fat, leptin and
insulin resistance in Asian Indian Men. J clin Endocrinol and Metab
1999;84:1137 – 44
5 Ramachandran A, Snehalatha C, Kapur A, et al. Prevalence of diabetes and
impaired glucose tolerance in India. National Urban Diabetes Survey.
Diabetologia 2001; 44: 1094 – 1101.
6 Ramachandran A, Snehalatha C, Kapur A, Vinitha R et al. Prevalence of
overweight in urban Indian adolescent school children . Diab Res Clin
Pract.2002; 57:185 – 90.
7 Obesity. Preventing and managing the global epidemic, report of a WHO
Consultation .WHO Technical Report Service 2000; 894:1 – 253.
8 Shimomura I and colleagues. Oxidants link obesity to diabetes .The Journal of
Clinical Investigation, 2004; 114(12): 1752 – 1761.

25
9 American Association of Clinical Endocrinologists/ American College of
Endocrinology (AACE/ACE). AACE/ ACE Position Statement on the
Prevention, Diagnosis and Treatment of Obesity (1998 Revision). Endocrine
Practice 1998; 4: 297-330.
10 National Institutes of Health Consensus Development Panel on the Health
Implications of Obesity. Health implications of obesity: National Institutes of
Health Consensus Development Conference Statement. Ann Intern Med 1985;
103:1073-7.
11 Ramachandran A. Epidemiology of diabetes in India – 3 decades of research.
JAPI, 2005; 53: 34 – 38.
12 . Zimmet P. Kelly .Challenges in diabetes epidemiology from west to rest. Diabetes
Care.1992; 15: 232 – 252.
13 Despres JP. Obesity and lipid metabolism: relevance of body fat distribution.
Curr. Opin Lipidol 1991; 2: 5-15.
14 Albrink MJ, Krauss RM, lIndgren Ft and Wood PD. Intercorrelation among
plasma High density lipoprotein, obesity and triglycerides in a normal population.
Lipids, 1980; 15:668.
15 Caraway WT. Carbohydrates. In Fundamentals of Clinical Chemistry by Tietz
N.W. ed , W.B. Saunders Co., Philadelphia PA, 1976: Chapter 6, page 243.
16 Meiattini F. et al. The 4–hydroxybenzoate / 4 aminophenazone Chromogenic
system. Clin Chem.1978; 24(12): 2161 – 2165.
17 Buccolo G. et al. Quantitative determination of serum triglycerides by use of
enzymes. Clin Chem.1973; 19(5):476 – 482.

26
18 Allain CC, Poon LS, Chan CSG, Tichmond W and Fu PC. Estimation of High
density lipoprotein cholesterol by phosphotungstate Method. Clin Chem. 1974;
20:470 – 475.
19 Friedwald WT, Levy RI and Fredrickson DS. Estimation of concentration of LDL
–C in plasma without the use of preparative ultra centrifuge. Clin Chem. 1972;
18: 499 – 502.
20. McCord JM, Fridovich I. Superoxide dismutase. An enzymatic
function for erythrocuprein (hemocuprein). J Biol Chem 1969; 244: 6049-6055.
21. Paglia DE, Valentine WN. Studies on the quantitative and qualitative
characterization of erythrocyte glutathione peroxidase. J Lab Clin Med 1967; 70:
158-169.
22. Grundy SM: Metabolic complications of obesity. Endocrine.
13(2):155-165, 2000.
23. Fridovich I. Superoxide dismutase: regularities and irregularities.
Harvey Lect 79: 51-75, 1985.
24. Viroonudomphol D, Pongpaew P, Tungtrongchitr R, Phonrat B,
Supawan V, Vudhivai N, Schelp FP: Erythrocyte antioxidant enzymes
and blood pressure in relation to overweight and obese Thai in
Bangkok. South east Asian J. Trop Med. Public Health 31 (2): 325- 334, 2000.
25. Furukawa S, Fujita T, Shimabukuro M, Iwaki M, Yamada Y, Nakajima
Y, Nakayama O, Makishima M, Matsuda M, Shimomura I. Increased

27
oxidative stress in obesity and its impact on metabolic syndrome. The
Journal of Clinical Investigation 114 (12): 1752-1761, 2004.
26. Turrens JF: Superoxide production by the mitochondrial respiratory
chain. Biosci Rep 17: 3-8, 1997.
27. Lechieitner M, Koch T, Harold M, Dzien A, Hoppiahler F: Tumour
necrosis factor alpha plasma level in patients with type 1 diabetes
mellitus and its association with glycemic control and cardiovascular
risk factors. J Intern Med. 248: 67-76, 2000.
28. Moor de Burgos A, Wartanowics M, Ziemlanski S: Blood vitamin and
lipid levels in overweight and obese women. Eur J Clin Nutr 46: 803-
808, 1992.
29. Alexander CM, Landsman PB, Teutsch SM: Diabetes mellitus,
impaired fasting glucose, atherosclerotic risk factors and prevalence of
coronary heart disease. Am J Cardiol 86; 897-902, 2000.
30. Lewis GF, Carpentier A, Adeli K, Giacca A: Disordered fat storage
and mobilization in the pathogenesis of insulin resistance and type 2
diabetes. Endocr Rev 23; 201-229, 2002.
31. Grundy SM: Obesity, metabolic syndrome and cardiovascular disease.
J Clin Endocrinol Metab 89; 2595-2600, 2005.

28
32. Krauss RM, Siri PW: Metabolic abnormalities: triglyceride and low
density lipoprotein. Endocrinol Metab Clin North Am 33: 405-415,
2004.
33. Berneis KK, Krauss RM: Metabolic origins and clinical significance of
LDL heterogeneity. J Lipid Res. 43: 1363-1379, 2002.
34 Albrink MJ, Krauss RM, Lindgren FT, Wood PD. Intercorrelations
among plasma high density lipoprotein, obesity and triglycerides in a
normal population. Lipids 15:668, 1980.
35. Williams PT, Krauss RM: Associations of age, adiposity, menopause,
and alcohol intake with low density lipoprotein subclasses.
Arterioscler Thromb Vasc Biol 17: 1082-1090, 1997.
36. Redinger RN: Pathophysiology of obesity and its clinical
manifestations. Gastroenterology and hepatology 3(11): 856-863,
2007.
37 Evans RM, Barish GD, Wang YX, PPARs and the complex journey to
obesity. Nat Med 10; 355-361, 2004.
38 Hutley L, Prins JB.Fat as an endocrine organ: relationship to the
metabolic syndrome. Am J Med Sci 330; 280-289, 2005.
39 Pan DA, Lillioja S, Kriketos AD, Milner MR, Baur LA: Skeletal

29
muscle triglyceride levels are inversely related to insulin action.
Diabetes 46; 983-988, 1997.
40 Boden G, Chen X, Ruiz J, White JV, Rosseti L: Mechanism of fatty
acid induced inhibition of glucose uptake. J Clin Invest 93: 2438-2446,
1994.
41 Rao GMM, Morghum LO.Relationship of obesity to diabetes. Horm. Metab.Res
16:209-210, 1984.