Embed Size (px)
Citation preview

1985
EFFECT OF NITROGEN AND PHOSPHOROUS ON GROWTH AND FLOWERING IN TUBEROSE
(Polianthes tuberosa L.) cv. DOUBLE
ThesisThesisThesisThesis
by
ASHUTOSH SHARMA
Submitted in partial fulfilment of the requirements for the degree of
MASTER OF SCIENCE
(HORTICULTURE)
FLORICULTURE AND LANDSCAPE
ARCHITECTURE
COLLEGE OF HORTICULTURE Dr Yashwant Singh Parmar University of Horticulture and Forestry, Nauni,
Solan - 173 230 (H.P.), INDIA
2013
Dr. S.V.S. Chaudhary Associate Professor
Department of Floriculture and Landscaping College of Horticulture Dr Y S Parmar University of Horticulture and Forestry, Nauni-Solan – 173 230 (HP)
CERTIFICATE- I
This is to certify that the thesis entitled, “Effect of nitrogen and phosphorus
on growth and flowering in tuberose (Polianthes tuberosa L.) cv. Double” , submitted in
partial fulfilment of the requirements for the award of degree of MASTER OF SCIENCE
(HORTICULTURE) FLORICULTURE AND LANDSCAPE ARCHITECTURE to Dr.
Yashwant Singh Parmar University of Horticulture and Forestry, Nauni, Solan (H.P.) is a
record of bonafide research work carried out by Mr. Ashutosh Sharma (H-2010-17-M)
under my guidance and supervision. No part of this thesis has been submitted for any other
degree or diploma.
The assistance and help received during the course of investigations have been fully
acknowledged.
Place: Nauni-Solan (Dr. S.V.S. Chaudhary) Dated: 2013 Chairman
Advisory Committee
CERTIFICATE - II
This is to certify that the thesis entitled, “Effect of nitrogen and phosphorus on
growth and flowering in tuberose (Polianthes tuberosa L.) cv. Double”, submitted by Mr.
Ashutosh Sharma (H-2010-17-M) to Dr. Yashwant Singh Parmar University of Horticulture
and Forestry, Nauni, Solan (H.P.) in partial fulfilment of the requirements for the award of
degree of MASTER OF SCIENCE (HORTICULTURE) FLORICULTURE AND
LANDSCAPE ARCHITECTURE has been approved by the Student’s Advisory
Committee after the thesis viva-voce examination in collaboration with the internal examiner.
Dr. S.V.S. Chaudhary Internal Examiner (Associate Professor) Dr. J.S. Chandel
Chairman, Advisory Committee (Professor) Deptt. of Fruit Science
Members of Advisory Committee
Dr. Y. C. Gupta Dr. D. Tripathi Dr. Anju Thakur
(Professor and Head) (Sr. Scientist) (Professor) Deptt. of Deptt. of SSWM Deptt. of Basic Science
Floriculture & Landscaping
Dean’s Nominee
Dr. N.S. Thakur Professor
Deptt. of Food Science and Technology
Professor and Head Deptt. of Floriculture & Landscaping
Dean
College of Horticulture

CERTIFICATE- III
This is to certify that all the mistakes and errors pointed out by the external examiner
have been incorporated in the thesis entitled, “Effect of nitrogen and phosphorus on
growth and flowering in tuberose (Polianthes tuberosa L.) cv. Double”, submitted to Dr
Y.S. Parmar University of Horticulture and Forestry, Nauni, Solan (H.P.) by Mr. Ashutosh
Sharma (H-2010-17-M) in partial fulfilment of the requirements for the award of degree of
MASTER OF SCIENCE (HORTICULTURE) FLORICULTURE AND LANDSCAPE
ARCHITECTURE.
________________________________
(Dr. S.V.S. Chaudhary)
Associate Professor Chairman
Advisory Committee
________________________________
(Dr Y.C. Gupta) Professor and Head
Department of Floriculture & Landscaping Dr Y S Parmar UHF, Nauni, Solan (H.P.)

ACKNOWLEDGEMENTS
With limitless humility, I bow in devotion to ‘Lord Shiva’ for bestowed me with physical, mental and spiritual strength to shoulder the responsibilities of life.
“The satisfaction and euphoria for the completion of any work would be incomplete unless we mention the names of people who made it possible, whose constant guidance and encouragement served the beam of light and crowded efforts with success.”
I own this pride place to my Mummy, Papa and my brothers, who always believed in giving a strong educational wing, the most revered personalities in my life, who have always encouraged and supported me at the cost of their comforts.
I express my heartiest veneration and gratitude to my esteemed advisor Dr. SVS
Choudhary, Associate professor of Department of Floriculture and Landscaping Dr. Y.S. Parmar university of Horticulture and forestry, Nauni, Solan (H.P.) for his keen interest, valuable, guidance, unflinching judgement and constant encouragement during the entire course of my study.
I avail this opportunity to express my loyal venerable thanks to Dr. Y C Gupta (Professor and Head, FLS) for this moral support, inspiring advice & innovative suggestions throughout the investigation. I gratefully acknowledge the help rendered by the members of my advisory committee Dr. D. Tripathi (Sr. Scientist, SSWM) and Dr. Anju Thakur (Professor) for their valuable suggestion counsel, supportive attitude and enthusiastic interest in scrutinizing this manuscript.
Thanks are due to all respected teachers of my department, especially Dr. Rajesh Bhalla, Dr. H S Baweja, Dr. BP Sharma, Dr. SR Dhiman, Dr. BS Dilta, Dr. Priyanka Thakur, Dr. Pooja Sharma and Dr. Bharti Kashyap for their ideological contribution and prized suggestions.
I place on record my gratefulness to Dr. BS Dilta for his invaluable guidance during the course of study and thesis writing. I can’t forget the timely help and cooperation from the technical and field staff of the Department of Floriculture and Landscaping.
I would like to own my thanks to respected seniors Dr. Arvinder Singh, Dr. Nomita Laishram, Dr. Rohit Bist, Harish Chandra Raturi, Harpal Singh, Sandeep Kumar Singh, Nidhika Thakur, Gurvinder Kaur, Priyanka Sharma Bhavya Bhargava, Kalkame, Jujhar Singh, Rajkumar Rana and Pratibha Chouchan, friends Palmsey Sangma, Rishu Sharma, Avneesh Banswal, Kishore Thakur, BR Negi, Balkar Singh, Nipun Sharma, Heerendra Sagar, Nitish, Mukesh, Sahil Katoch, Fatteh Singh Meena, Surendra Makar, Geeta Verma, Rakesh Sharma, Yamini Sharma, Chandresh Guleria, Arvind Thakur, Nazan, Neha Dogra, Jagriti Gupta, Sapna, Dasta Giri, Velru Bharghava, Awaneesh Kumar Singh, Rohit Verma for their personal interest and moral support throughout the course of investigation.
Needless to mention errors and omissions are mine.
Place: Nauni, Solan
Date: (Ashutosh Sharma)

CCoonntteennttss
Chapter Title Page(s)
1. INTRODUCTION 1-2
2. REVIEW OF LITERATURE 3-19
3. MATERIALS AND METHODS 20-28
4. EXPERIMENTAL RESULTS 29-47
5. DISCUSSION 48-52
6. SUMMARY and conclusions 53-55
7. REFERENCES 56-63
abstract 64
Appendices I-IV

LIST OF TABLES
TABLE TITLE PAGE(S)
MATERIALS AND METHODS
1. Initial physico- chemical analysis of the experimental area
21
EXPERIMENTAL RESULTS
1. Effect of nitrogen and phosphorus on number of days taken for sprouting of bulbs of tuberose (Polianthes
tuberosa L.) cv. “Double”
29
2. Effect of nitrogen and phosphorus on per cent sprouting of bulbs of tuberose (Polianthes tuberosa L.) cv. “Double”
30
3. Effect of nitrogen and phosphorus on plant height (cm) of tuberose (Polianthes tuberosa L.) cv. “Double”
31
4. Effect of nitrogen and phosphorus on number of leaves per plant of tuberose (Polianthes tuberosa L.) cv. “Double”
32
5. Effect of nitrogen and phosphorus on number of days taken for spike emergence of tuberose (Polianthes
tuberosa L.) cv. “Double”`
33
6. Effect of nitrogen and phosphorus on number of days taken for basal florets opening of tuberose (Polianthes
tuberosa L.) cv. “Double”
34
7. Effect of nitrogen and phosphorus on spike length (cm) of tuberose (Polianthes tuberosa L.) cv. “Double”
35
8. Effect of nitrogen and phosphorus on number of florets per spike of tuberose (Polianthes tuberosa L.) cv. “Double”
36
9. Effect of nitrogen and phosphorus on rachis length (cm) of tuberose (Polianthes tuberosa L.) cv.“Double”
37
10. Effect of nitrogen and phosphorus on fresh weight of spike (g) of tuberose (Polianthes tuberosa L.) cv. “Double”
38

TABLE TITLE PAGE(S)
11. Effect of nitrogen and phosphorus on fresh weight of 100 florets (g) of tuberose (Polianthes tuberosa L.) cv. “Double”
39
12. Effect of nitrogen and phosphorus on floret diameter (cm) of tuberose (Polianthes tuberosa L.) cv. “Double”
40
13. Effect of nitrogen and phosphorus on number of flowering stems per plant of tuberose (Polianthes
tuberosa L.) cv. “Double”
41
14. Effect of nitrogen and phosphorus on number of bulbs produced per plant of tuberose (Polianthes
tuberosa L.) cv. “Double”
41
15. Effect of nitrogen and phosphorus on weight of bulbs per plant (g) of tuberose (Polianthes tuberosa L.) cv. “Double”
42
16. Effect of nitrogen and phosphorus on vase life of tuberose (Polianthes tuberosa L.) cv. “Double”
43
17. Effect of nitrogen and phosphorus on available nitrogen (kg/ha) in soil
44
18. Effect of nitrogen and phosphorus on available phosphorus (kg/ha) in soil
45
19. Effect of nitrogen and phosphorus on available potassium (kg/ha) in soil
46
20. Economics of different doses of N and P on tuberose cv. Double
47

LIST OF PLATES
Plate Title Between
Pages
1. Pictorial view of the experimental field (Vegetative stage) 25-26
2. Pictorial view of the experimental field at starting of flowering
25-26
LIST OF FIGURE
Figure Title Between
Pages
1. Mean monthly temperature (maximum and minimum), relative humidity and rainfall recorded during 2011
21

ABBREVIATIONS USED
% : Per cent kg/ha : kilogram per hectare
cm : centimeter t/ha : tonnes per hectare
cv. : cultivar EC : Electrical conductivity
et al. : co- workers OC : Organic carbon
g : gram KMnO4 : Potassium permanganate
ha : hectare NaOH : Sodium hydroxide
kg : kilogram H2SO4 : Sulfuric acid
m : meter RBD : Randomized block design
mg : miligram Viz That is namely
Ca : Calcium KH2PO4 : Potassium dihydrogen phosphate
Zn Zinc Na2H PO4 : Disodium hydrogen orthophosphate
mm : millimeter (NH4)2SO4 : Ammonium sulfate
q : quintal NaCl : Sodium chloride
e.g. : for example KCl : Potassium chloride
C : Celcius Sncl2 : Stannous chloride
@ : At the rate dSm-1 : decisiemens per meter
M : Molar ppm : parts per million
mM : millimolar nm : nano meter
F : Fahrenheit Var. : Variety
E : East FYM : Farm yard manure
N : North VAM : Vesicular Arbuscular Mycorrhizas
g/m2 : gram per square meter PSB : Phosphate Solubilizing Bacteria
Chapter-1
INTRODUCTION
Tuberose (Polianthes tuberosa L.) commonly known as ‘Rajnigandha’
belongs to family Amaryllidaceae and is native to Mexico. It is one of the most
important commercial bulbous ornamentals of sub-tropical and tropical areas and
is always in great demand for its attractive and fragrant spikes as well as for
producing its loose flowers. The generic name Polianthes is derived from the two
Greek words namely ‘Polios’ meaning shining or white and ‘anthos’ which
means a flower, in allusion to the blooms of the common tuberose and species
‘tuberosa’.
Tuberose is one of the most popular and commercial bulbous flower crop
grown in India for its fragrant flowers to mitigate the domestic and export
requirements. The spikes are used as cut flowers for the purpose of vases
decoration and bouquets, while individual flowers as loose flowers are used for
making gajras, venis, garlands, button-holes and crowns etc. The flowers of
tuberose are also a good source of tuberose oil which is one of the constituents of
the expensive raw material for the perfume industry. The cut spikes of tuberose
remain fresh for long time and can also withstand long distance transportation
owning to the reason that tuberose cut flowers have longer vase life.
It is cultivated on a large scale in India and its commercial importance is
mainly confined to Karnataka, Uttar Pradesh, West Bengal, Tamil Nadu,
Maharashtra, Andhra Pradesh, Gujarat, Haryana, Punjab and Delhi including low
mid hill areas of Himachal Pradesh, Uttrakhand and Jammu & Kashmir. In India,
about 3500 ha area is under bulbous ornamentals and out of this 800 ha area is
under tuberose cultivation (Desh Raj, 2011).
The increased production of quality flowers and bulbs plant is the main
objective to be reckoned in commercial flower production of tuberose. Though,
the quality of cut flowers is primarily a varietal trait, but is greatly influenced by

2
climatic, geographical and nutritional factors among which the nutrition plays a
very crucial role. The nutritional requirements of tuberose vary with the
prevailing climatic conditions and soil types besides the availability of nutrients
in the soil. The information regarding nutrition of tuberose is very scanty and
exhibited wide variation in terms of quantity of nutrients to be applied for
different tuberose growing areas (Singh and Godara, 1995; Singh et al., 1976;
Yadav et al., 1985).
The tuberose is a voracious feeder of NPK and responds well to the
organic and inorganic nutrient application particularly nitrogenous fertilizers
(Sadhu and Bose, 1973). Among the major nutrients required for the optimum
growth, development and flowering of tuberose, nitrogen (N) has greater
influence right from cell division to the development of vegetative and
reproductive organs. It is an integral component of nucleic acids, proteins,
protoplasm and chlorophyll. It is one of the most mobile of all the mineral
nutrients absorbed by the plants. In determining the yields of flower crops,
phosphorus (P) is also one of the major and crucial limiting factors. Thus, it has
been called as “the key to life” because it is directly involved in most life
processes. It is an essential part of many sugar phosphates involved in
photosynthesis, respiration and other metabolic processes. Deficiency of
phosphorus may adversely affect the plant in maintaining the full supply of N and
K and excess application of P may result in various nutritional problems
including Ca and Zn deficiency.
To date a very little work has been conducted ascertain the efficacy of
fertilizers on commercial bulbous ornamental crops, particularly the tuberose
under mid-hill conditions of Himachal Pradesh. Therefore, the present study
entitled, “Effect of nitrogen and phosphorus on growth and flowering in
tuberose (Polianthes tuberosa L.) cv. Double” was undertaken with the
following objectives:
i) To standardize the doses of nitrogen and phosphorus for tuberose under
mid-hill areas of Himachal Pradesh.
ii) To find out the cost-benefit ratio

Chapter-2
REVIEW OF LITERATURE
The relevant literature on the effect of nitrogen and phosphorus in relation
to growth and flowering characteristics of different bulbous ornamentals in
general and tuberose in particular has been reviewed under subheads:
a) General nutrition
b) Effect of nitrogen and phosphorus on growth and flowering of tuberose
c) Effect of nitrogen and phosphorus on growth and flowering of other
bulbous ornamental crops
2.1. GENERAL NUTRITION Among the major nutrients required for the normal growth and
development, nitrogen (N) has a greater influence right from cell division to
development of vegetative and reproductive organs. It is an integral component of
amino acids and related proteins, which are critical not only as building blocks for
plant tissue but also in the cell nuclei and protoplasm in which heredity control is
vested. Nitrogen is essential for carbohydrate use within the plant (Brady, 1996
and Tisdale and Nelson, 1975) and also stimulates root growth and development
as well as the uptake of other nutrients. Phosphorus on the other hand is an
essential part of many sugar phosphates involved in photosynthesis, respiration
and other metabolic processes and it is also a part of nucleotides (as in RNA and
DNA) and of the phospholipids present in the cell membranes. Phosphorus also
plays an essential role in energy metabolism because of its presence in ATP,
ADP, AMP and pyrophosphate (pi) (Salisbury and Ross, 1992). Phosphorus has
been called as “the key to life” because of its direct involvement in most life
processes. The nucleus of each plant cell contains phosphorus for the reason of
which cell division and growth are not possible without adequate phosphorus
(Donahue et al., 1958 and Troeh and Thompson, 1993).

4
The favorable effects of nitrogen and phosphorus on growth and flower
production of tuberose were emphasized by many workers. Nitrogen is highly
beneficial for increasing leaf numbers, number of spikes and number of florets,
phosphate is also beneficial for good quality flowers. A fertilizer dose of 10-20 g
N, 20-40 g P2O5 and 20-40 g K2O per square meter is suggested by Randhawa and
Mukhopadhyay (1986) for tuberose cultivation. Militu et al. (1970) have found
that nitrogen is the most important factor in controlling flower quality.
2.2. EFFECT OF NITROGEN AND PHOSPHORUS IN RELATION TO
GROWTH AND FLOWERING OF TUBEROSE Jana et al. (1974), while working with tuberose have found that high
levels of nitrogen and phosphorus proved very effective in increasing the number
of leaves and bulbs. These two elements also increase the number of spikes and
flowers. Deficiency of either of these elements suppresses flowering and low K
reduces the number of flowers in rachis. Similarly, Motial (1973) also suggested
that high doses of nitrogen increase the yield of fresh flowers. Ailincai (1960) has
reported that an application of granular super phosphate at 60 g per square meter
combined with phospho-bacteria increases the number of flowering plants,
number of flowers per inflorescence and also the life of the flowers.
Mukhopadhyay and Banker (1978) have observed that N is the most
important factor in controlling vegetative and floral characters. They reported that
application of N (20 g/m2) has increased plant height and other growth
parameters in tuberose cv. ‘Single’. Banker and Mukhopadhyay (1990) further
studied the effect of NPK on growth and flowering of tuberose and observed that
the higher number of spikes per meter square was obtained with the highest
nitrogen rate and also recommended that for advanced flowering and improving
the growth of tuberose, application of N:P2O5:K2O @ 20:20:20: g/m2 is optimum.
Arora (1998) reported that application of 20 g N and P2O5 per square
meter is optimum for flower production of tuberose. Gowda et al. (1991)
investigated the effect of N, P and K on growth and flowering of tuberose

5
(Polianthes tuberosa Linn.) cv. ‘Double’ and recommended the application of
200, 75 and 125 kg NPK/ha for higher yield and quality flowers.
Nanjan et al. (1980) obtained highest flower production and economic
returns from the plants treated with N, P2O5 and K2O at 200:60:0 kg/ha in
tuberose cv. ‘Single’ in soil characterized by low N and available P but high K.
Yadav et al. (1985) observed that higher application of nitrogen in two
split doses i.e; 300 kg nitrogen and 200 kg phosphorus per hectare proved very
beneficial in increasing the plant growth and yield of the flowers in tuberose.
Studies on nutritional requirement of tuberose under Bangalore conditions
were investigated by Mukhopadhyay and Bankar (1986). The best results with
respect to vegetative and floral parameters were observed at a maximum dose of
N (20 g/m2) and P2O5 (40 g/m2). Application of K2O was found non-significant in
the growth and flowering of tuberose.
In another similar experiment, effect of NPK on growth and flowering in
tuberose cv. ‘Double’ was studied by Bankar and Mukhopadhyay (1990). They
observed that nitrogen application significantly improved growth and flowering
attributes. The content of NPK in leaves was significantly increased with
application of N, P and K doses in proportion to their supply. The nitrogen
application significantly decreased the P and K content of leaves. A positive
correlation was observed with N content of leaves and number of spikes produced
but the content of P and K in leaves was negatively correlated. The dose of 20 g
N, 20 g P2O5 and 20 g K2O/m2 recorded higher yields.
Parthiban and Khader (1991) in an experiment to determine the fertilizer
requirements of Polianthes tuberosa cv. ‘Single’ found that application of 100 kg
N + 75 kg P + 62.5 kg K/ha resulted in the highest number of spikes/plant (1.72),
number of flowers/spike (39.67) and the highest flower yield (3578.6 kg/ha).
Gowda et al. (1991), while studying the effect of N, P and K observed
increase in plant height with increase in nitrogen. N and K2O application

6
influenced the number of days required for flower spike emergence and
increasing P and K2O rates resulted more number of flower spike and flowers per
spike. The highest yield of flowers, longest spikes and duration of flowering were
observed when treated with 200 kg N + 75 kg P2O5 + 125 kg K2O/ ha fertilizers
application.
Parthiban et al. (1992) applied tuberose cv. ‘Single’ plants with 50, 75,
100 or 125 kg N/ha, 25, 50 or 75 kg P/ha and 37.5, 62.5 or 87.5 kg K/ha. They
observed the greatest plant height (58.93 cm) with 125 kg N + 50 kg P + 62.5 kg
K/ha treatment combination. The highest mean number of leaves (41.34) and
number of side suckers/clump were obtained with the 100 kg N + 75 kg P + 62.5
kg K/ha.
Ashok et al. (1995) recorded increase in the plant height, number of
leaves, leaf area and dry matter production in tuberose cv. ‘Single’ with 400 kg
N/ ha application when grown in well drained sandy loam soil.
Gopalakrishnan et al. (1995) studied the effect of N, P and K on the
quality of tuberose (Polianthes tuberosa L.) var. Single. N was applied at 60, 90
or 120 kg, P at 30, 45 or 60 kg P2O5 and K at 0 or 30 kg K2O/ha on tuberose
grown for cut flowers. Average number of flowers/spike and flower diameter
were greatest with 120 kg N + 60 kg P2O5 + 30 kg K2O/ha.
Singh and Godara (1995) carried out an experiment on nutritional
requirement of tuberose (Polianthes tuberosa L.) cv. Single with five levels of
nitrogen (0, 100, 200, 300 and 400 kg/ha) and three levels (0, 100 and 200 kg/ha)
each of phosphorus and potash. The increasing levels of nitrogen, phosphorus and
potassium reduced the sprouting period and increased the number of leaves per
plant and plant height significantly. However, potassium did not influence the
sprouting period considerably.
Singh et al. (1996a) studied the effect of NPK on flowering and flower
quality of tuberose (Polianthes tuberosa L.) cv. ‘Single’ on a sandy loam soil.
The experiment comprised of 5 rates of N (0, 100, 200, 300 and 400 kg/ha) and 3

7
rates each of P and K (0, 100 and 200 kg/ha). Application of high rates of N, P
and K delayed spike emergence and considerably prolonged the flowering period
and shelf-life of florets in both years. Length of spike and rachis increased
significantly in both years at both developmental stages (opening of first floret
and last floret) with increasing doses of N and P fertilizer and increasing K
application increased rachis length at opening of the last floret, but not the first
floret.
Singh et al. (1996b) conducted an experiment to ascertain the effect of
NPK on bulb production in tuberose (Polianthes tuberosa L.) cv. Single and
observed maximum number of bulbs/plant with highest level of N, P, K and N×P
fertilizer. However, these treatments decreased the average weight of bulbs. The
yield of bulbs increased with increasing levels of fertilizer up to 30 g N, 20 g
P2O5 and 20 g K2O per square meter.
Sita Ram et al. (1997) reported increase in plant height, number of leaves
per plant and other growth characters in tuberose cv. ‘Single’ and ‘Double’ under
Andman conditions. Flowering was advanced by low N application rates i.e. upto
10 g/m2 but delayed by higher rates 15 or 20 g/m2. Flower weight per spike and
number of marketable spikes increased upto 20 g/m2 in both the cultivars of
tuberose. In tuberose, total flower yield increased with increasing N rate reaching
8.20 and 9.48 t/ha at the highest N rate. Increasing P rate also increased flower
yield but K application had only slight effect (Singh and Godara, 1998).
Patel et al. (1997) evaluated the effect of spacing and fertilizer levels on
growth and yield of tuberose cv. ‘Double’. Leaf number was highest with the
widest spacing and highest NPK fertilizer rate. The yield of flower spikes/plant
was similar in all treatments but the yield/ha was highest at the closest spacing
(1,047,503 spikes/ha). Spike length and the number of florets/spike were highest
at the closest spacing with the highest NPK rate. The highest cost: benefit ratio
were obtained with the closest spacing (45 cm x 15 cm) and the highest NPK rate
or organic manure.

8
A multifactor study consisting of 36 treatment combinations in a Factorial
Randomized Block Design viz., four level of nitrogen (0, 100, 200 and 300
kg/ha), three sizes of bulbs (1.5-2.0, 2.1-2.5 and 2.6-3.0 cm) and three planting
distances (20x20cm, 30x20cm and 30x30cm) were tested for their influence on
growth, flowering and yield of tuberose (Polianthes tuberosa Linn). The best
performance was projected with the application of 300 kg N/ha, planting larger
bulbs (2.6-3.0 cm) and wider spacing of plants i.e.30 cm apart (Kumar and Singh,
1998)
Singh and Godara (1998) studied the effect of nutritional requirement of
tuberose (Polianthes tuberosa L.) cv. ‘Single’ in a 2 year trial at Hisar. Nitrogen
was applied at 0, 100, 200, 300 or 400 kg/ha and P and K each at 0, 100 or 200
kg/ha. Total flower yield increased with increasing N rate reaching 8.20 at the
highest N rate. Increasing P rate also increased flower yield but K application had
only a slight effect.
Swaminathan et al. (1999) studied the effect of Azospirillum,
Phosphobacteria and inorganic nutrients on the growth and yield of tuberose cv.
‘Mexican Single’. The highest spike length (96.33 cm), number of flower per
spike (23.66), flower yield per plant (10.20 g) and per hectare (2.75 tonnes/ha),
number of bulbs per plant and bulbs weight (866.66 g) were recorded with
treatment NPK 120:65:62.5 + Azospirillum + Phosphobacteria.
Balak-Ram et al. (1999) conducted a field experiment at Lucknow to
determine the N and plant spacing requirements of P. tuberosa, grown in sodic
soil. Application of 180 Kg N/ha with a plant spacing of 45 x 30 cm significantly
influenced growth (plant height, leaf area, number of spikes and spike length) and
was found to be the best treatment for promoting flower yield.
Mohanty et al. (1999) in their study with tuberose observed that 325 kg N
+ 125 kg P2O5 + 125 kg K2O/ha and spacing (30 cm x 30 cm) and its combination
resulted in the highest N, P and K uptake both at 50% flowering and harvesting
stage.

9
The tuberose planted as 6 tubers per hill resulted in the highest number of
shoots, leaves and leaf area per plant while 3 tubers per hill resulted in the highest
plant growth, flower yield and number of spikes. Among the fertilizers rates,
250:200:200 kg NPK/ha doses resulted in the highest number of shoots, leaves
and spikes, maximum plant height and flower yield. Application of 250:200:200
kg/ha and 3 tubers per hill resulted in the highest flower, spikes yield and plant
growth in tuberose cv. ‘Double’ (Patil et al., 1999).
Application of 30:30:15 g/m2 of NPK recorded the highest vegetative
growth of the plants that resulted to high yield of loose flowers however, for cut
flowers 15:90:15 g/m2 of NPK doses were suitable in tuberose. The yield of bulbs
was maximum with 30:60:15 g/m2 NPK treatment (Nair et al., 2000).
Singh et al. (2000) studied the nutrient status of tuberose plants treated
with different N, P and K levels (0, 10, 20, 30 and 40 kg N/ha, 0, 10 and 20 kg
P/ha and 0, 10 and 20 kg K/ha) and observed that the foliar NPK increased with
increase in N, P and K doses of fertilizers respectively. Leaf P and K
concentrations decreased with increasing N fertilizers rate. N, P and K contents in
leaves were higher than those in bulbs. Bulb N increased with increasing rates of
all fertilizers. Bulb P content was affected by N and P fertilizers but not by K
fertilizers and K content also increased with increasing rates of all fertilizers.
Further they applied fertilizers that result in a non significant effect on the
vegetative as well as floral characters except for length of spike and number of
spike per clump. The length of spike at opening of last floret and number of
spikes per clump were highest in the NPK @ 20:20:20 g/m2 treatment over the
control (Singh et al., 2004).
In a pot culture experiment with sandy loam soil to evaluate the effect of
N (0, 60, 120, 180, and 240 ppm as urea) and P (0, 20, 40, 60, and 80 ppm as
KH2PO4) on the growth and dry matter yield of tuberose cv. Double, the
application of N and P greatly improved the growth (plant height and number of
leaves) and dry matter yield (dry weight of leaves and spike) and total dry weight
(leaves+spike). Growth and dry matter yield increased up to 180 ppm N and 60

10
ppm P levels; however, further increments in N above 180 ppm and P above 60
ppm adversely affected growth and dry matter yield (Dahiya et al., 2001).
A field investigation was carried out in loamy sand soil to evaluate the
effect of N (0, 50, 100, 150 and 200 kg/ha) and Zn (0, 5, 10, and 20 kg/ha) on
floral characters, bulb production and leaf nutrient content in tuberose.
Application of nitrogen significantly improved the floral characters (spike length,
rachis length, number and weight of florets) at 150 and 200 kg and bulb
production (number of bulbs/plant, weight and size of bulb) at the highest level of
N. Application of zinc significantly improved the floral characters. Leaf N and
Zn content increased with increasing doses of their application. About 2.0% N
and 45 ppm Zn in leaf at flowering stage were recorded optimum for tuberose
cultivation. Leaf P and K content remained unaffected with N and Zinc
application (Yadav et al., 2002).
Mishra et al. (2002) conducted an experiment in Bhubaneswar, Orissa
with tuberose (Polianthes tuberosa) cv. Single involving 4 levels of N and 2
spacing. Plant height and number of plants per clump observed after 3 months of
planting were higher (4.45 cm) with 30 g N/m2 followed by 20 g N/m2 as
compared to other treatments. Application of N delayed spike emergence; the
maximum delay of 10 days was noticed in plant receiving 30 g N/m2 compared to
untreated ones. P application showed no appreciable effect on different growth
parameters studied, but flowering attributes such as spike length, rachis length,
and weight of florets per spike and weight of 100 florets improved due to P
application at 20 g or 30 g/m2. Yield of flowers/ha (weight basis) also improved
due to P treatments at 20 or 30 g/m2, but yield of florets per spike (weight basis)
was significantly increased at 30 g/m2.
Planting of whole clumps of tuberose and application of 100:50:50 kg
NPK/ha resulted in the earliest flowering of the crop. However, planting of one
bulb of tuberose per spot and application of 250:200:200 kg NPK/ha obtained the
best flower quality including the largest spike and rachis, widest spike girth,
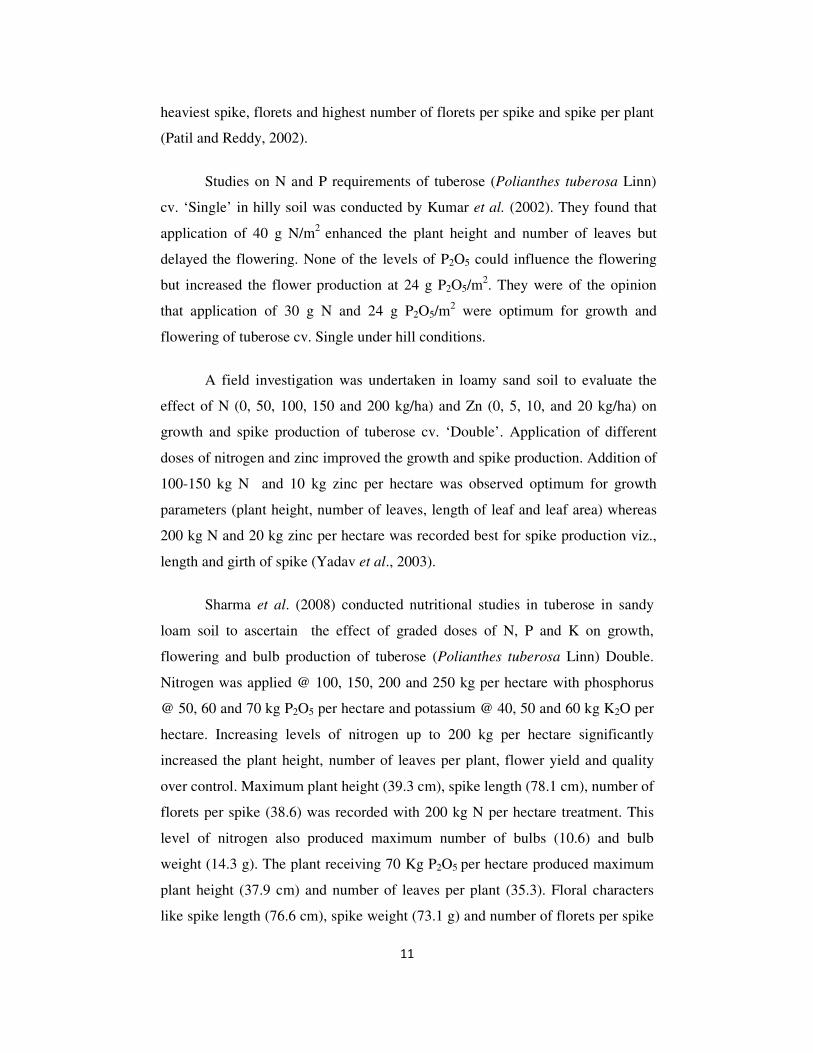
11
heaviest spike, florets and highest number of florets per spike and spike per plant
(Patil and Reddy, 2002).
Studies on N and P requirements of tuberose (Polianthes tuberosa Linn)
cv. ‘Single’ in hilly soil was conducted by Kumar et al. (2002). They found that
application of 40 g N/m2 enhanced the plant height and number of leaves but
delayed the flowering. None of the levels of P2O5 could influence the flowering
but increased the flower production at 24 g P2O5/m2. They were of the opinion
that application of 30 g N and 24 g P2O5/m2 were optimum for growth and
flowering of tuberose cv. Single under hill conditions.
A field investigation was undertaken in loamy sand soil to evaluate the
effect of N (0, 50, 100, 150 and 200 kg/ha) and Zn (0, 5, 10, and 20 kg/ha) on
growth and spike production of tuberose cv. ‘Double’. Application of different
doses of nitrogen and zinc improved the growth and spike production. Addition of
100-150 kg N and 10 kg zinc per hectare was observed optimum for growth
parameters (plant height, number of leaves, length of leaf and leaf area) whereas
200 kg N and 20 kg zinc per hectare was recorded best for spike production viz.,
length and girth of spike (Yadav et al., 2003).
Sharma et al. (2008) conducted nutritional studies in tuberose in sandy
loam soil to ascertain the effect of graded doses of N, P and K on growth,
flowering and bulb production of tuberose (Polianthes tuberosa Linn) Double.
Nitrogen was applied @ 100, 150, 200 and 250 kg per hectare with phosphorus
@ 50, 60 and 70 kg P2O5 per hectare and potassium @ 40, 50 and 60 kg K2O per
hectare. Increasing levels of nitrogen up to 200 kg per hectare significantly
increased the plant height, number of leaves per plant, flower yield and quality
over control. Maximum plant height (39.3 cm), spike length (78.1 cm), number of
florets per spike (38.6) was recorded with 200 kg N per hectare treatment. This
level of nitrogen also produced maximum number of bulbs (10.6) and bulb
weight (14.3 g). The plant receiving 70 Kg P2O5 per hectare produced maximum
plant height (37.9 cm) and number of leaves per plant (35.3). Floral characters
like spike length (76.6 cm), spike weight (73.1 g) and number of florets per spike

12
(39.3) were also observed maximum with 70 kg P2O5 per hectare treatment. This
treatment also improved the bulb production. The plants applied with 40 kg K2O
per hectare significantly improved the vegetative growth, floral characters and
bulb production over control, however, this treatment was statistically at par with
higher levels of potassium 200 kg N, 70 kg P2O5 and 40 kg K2O per hectare was
found optimum for tuberose cultivation under Haryana conditions.
Talukdar et al. (2003) found lowest number of days before spike
emergence and opening with the application of 80:40:80 g NPK/m2, whereas,
number of florets per spike, diameter of florets, flowering duration, vase life and
yield of spikes were highest with the application of 80:40:60 g NPK/m2. Floret
diameter, weight of clump and number of bulbs per clump were also highest with
80:40:80 g NPK/m2 application.
Tripathi et al. (2012) conduced a field experiment to determine the
comparative effect of integrated nutrient management on the cut flower
production of tuberose in randomized block design (RBD), having 12 treatments
viz., T1 RDF (240:160:100 kg NPK ha−1), T2 75% RDF ha−1, T3125% RDF ha−1,
T4 75% RDF + 250q FYM ha−1, T5 75% RDF + 500 q FYM ha−1, T6 75% RDF +
125 q Vermicompost ha−1, T7 75% RDF + 250q Vermicompost ha−1, T8 75%
RDF + 250q FYM +125 q Vermicompost ha−1, T9 75% RDF + 250q FYM + 250
q Vermicompost ha−1, T10 75% RDF + 500 q FYM + 250 q Vermicompost ha−1,
T11 75% RDF + 500q FYM + 250 q Vermicompost ha−1 and untreated
(control)which were replicated thrice during spring season 2008 and 2009. All
the treatments had the comparable better floral qualities as well as higher cut
flower production than un-treated control. Among all the treatments, the
maximum number of shoot clump−1 (18.95) and number of leaves shoot−1 (19.44)
were recorded with the application of 75% recommended dose of NPK + 500 q
FYM ha−1 + 250 q Vermicompost ha−1. The maximum spike yield (205030.71
spikes/ha) were recorded with the application of 75% recommended dose of NPK
+ 500 q ha−1 FYM + 250 q ha−1 Vermicompost followed by 75% recommended
dose of NPK + 500 q ha−1 FYM + 125 q ha−1 Vermicompost (199778.50
spikes/ha) although both the treatments did not varied significantly.

13
The effects of N (0, 60, 120, 180 or 240 ppm) as urea and P (0, 20, 40, 60
or 80 ppm) as potassium dihydrogen phosphate on the nutrient content of P.
tuberosa were studied under greenhouse conditions. The leaf N content at harvest
increased with increasing N rate. The highest leaf N content (2.64%) was
obtained with 240 ppm N + 40 ppm P. The leaf P content decreased when N was
applied at 120 to 240 ppm. The leaf P content increased with increasing P level.
The highest leaf P content was obtained with 0 ppm N (0.26%) and 80 ppm P
(0.25%). The leaf K content was reduced from 3.64% (control) to 3.42% with
240 ppm N and from 3.62% (control) to 3.39% with 80 ppm P. The highest spike
N content (2.59%) was recorded for 240 ppm N + 40 ppm P. The highest spike P
content (0.53%) was obtained with 60 ppm N + 80 ppm P. The K content of
spikes was reduced from 2.53% (control) to 2.35% at 240 ppm N
(Mohanasundaram et al., 2003).
Influence of graded levels of nitrogen and sulphur on growth, flowering
and essential oil content in tuberose cultivar ‘Mexican Single’ was studied in a
Factorial Randomized Block Design (Sharma and Mohammad, 2004). The
experiment comprised of 12 treatment combinations viz., four level of nitrogen (0,
100, 200 and 300 kg/ha) and three levels of sulphur (0, 40 and 80 kg/ha)
replicated thrice. Application of 200 kg nitrogen and 80 kg sulphur/ha resulted in
the production of maximum plant height, number of leaves/plant, length of spike
and rachis, number and weight of florets/spike and early flowering as well as
percent essential oil content in flowers.
Desai et al. (2005) conducted an experiment to study the effect of spacing
and fertilizers applications alone or in combination with FYM on growth and
multiplication of tuberose. Plant spacing at 30 x 30 cm and 250:250:250 kg
NPK/ha obtained the tallest plants and highest number of shoots, leaves per plant,
early sprouting of bulbs and bulb quality such as size of the daughter bulb, weight
of bulb and bulblets per clump in tuberose cv. ‘Shringar’.
Singh et al. (2005) found an increase in the number of leaves per plant,
more florets per spike and taller plants with increase in N, P and their
14
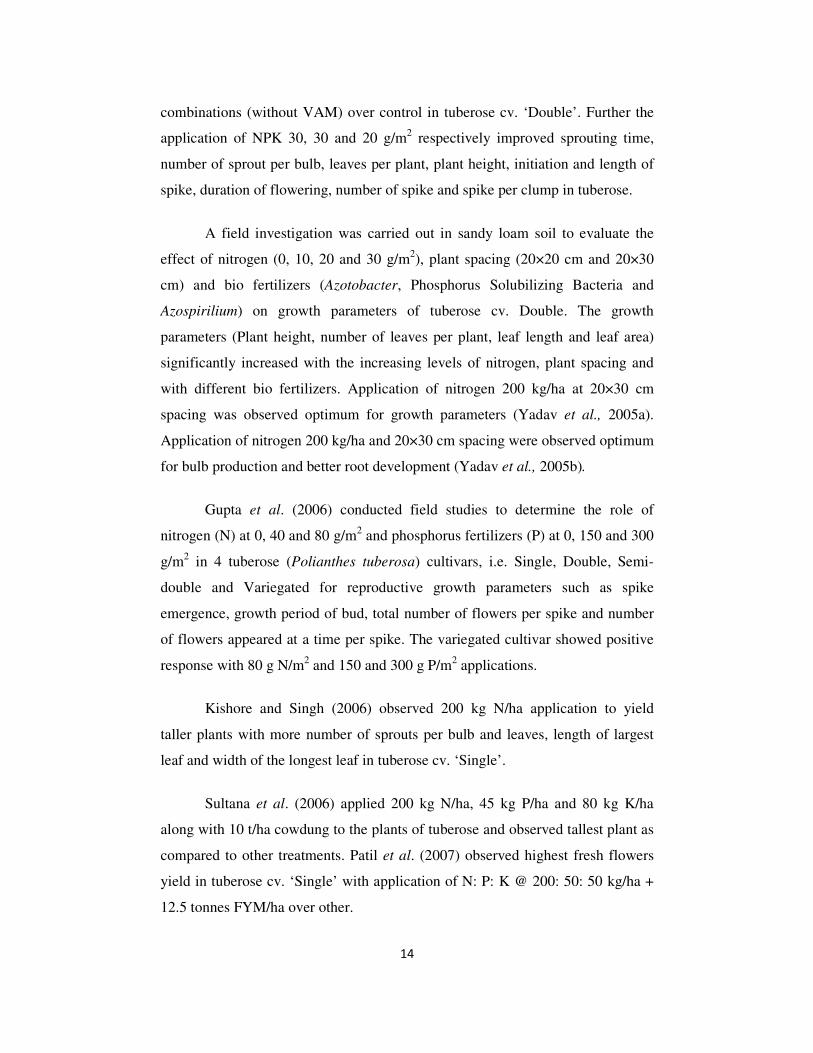
combinations (without VAM) over control in tuberose cv. ‘Double’. Further the
application of NPK 30, 30 and 20 g/m2 respectively improved sprouting time,
number of sprout per bulb, leaves per plant, plant height, initiation and length of
spike, duration of flowering, number of spike and spike per clump in tuberose.
A field investigation was carried out in sandy loam soil to evaluate the
effect of nitrogen (0, 10, 20 and 30 g/m2), plant spacing (20×20 cm and 20×30
cm) and bio fertilizers (Azotobacter, Phosphorus Solubilizing Bacteria and
Azospirilium) on growth parameters of tuberose cv. Double. The growth
parameters (Plant height, number of leaves per plant, leaf length and leaf area)
significantly increased with the increasing levels of nitrogen, plant spacing and
with different bio fertilizers. Application of nitrogen 200 kg/ha at 20×30 cm
spacing was observed optimum for growth parameters (Yadav et al., 2005a).
Application of nitrogen 200 kg/ha and 20×30 cm spacing were observed optimum
for bulb production and better root development (Yadav et al., 2005b).
Gupta et al. (2006) conducted field studies to determine the role of
nitrogen (N) at 0, 40 and 80 g/m2 and phosphorus fertilizers (P) at 0, 150 and 300
g/m2 in 4 tuberose (Polianthes tuberosa) cultivars, i.e. Single, Double, Semi-
double and Variegated for reproductive growth parameters such as spike
emergence, growth period of bud, total number of flowers per spike and number
of flowers appeared at a time per spike. The variegated cultivar showed positive
response with 80 g N/m2 and 150 and 300 g P/m2 applications.
Kishore and Singh (2006) observed 200 kg N/ha application to yield
taller plants with more number of sprouts per bulb and leaves, length of largest
leaf and width of the longest leaf in tuberose cv. ‘Single’.
Sultana et al. (2006) applied 200 kg N/ha, 45 kg P/ha and 80 kg K/ha
along with 10 t/ha cowdung to the plants of tuberose and observed tallest plant as
compared to other treatments. Patil et al. (2007) observed highest fresh flowers
yield in tuberose cv. ‘Single’ with application of N: P: K @ 200: 50: 50 kg/ha +
12.5 tonnes FYM/ha over other.

15
The application of 150 kg N/ha took minimum days to the sprouting of
bulbs with greatest number of sprouts per bulb and flowers per spike, spike
length, rachis length, spike diameter, weight of largest bulb per clump. The
number days to the opening of florets was lowest for 125 kg N/ha and the highest
number of bulblets per clump was recorded in 100 kg N/ha in tuberose cv.
‘Double’ (Rajwal and Singh, 2006).
Patel et al. (2006) studied the effect of nitrogen, phosphorus and spacing
on growth and flowering in tuberose (Polianthes tuberosa Linn) cultivar ‘Single’.
The treatments comprised four levels of nitrogen (100, 200, 300 and 400 kg
N/ha), three levels of phosphorus (100, 150 and 200 kg P2O5/ha) and three
spacing (30x20, 30x30 and 30x40 cm). The results revealed that for higher yield
of spikes and bulbs tuber could be planted at a close spacing of 30x20 cm and
fertilized with 400 kg N and 200 kg P2O5 per hectare. Number of days to first
flowering was advanced at higher level of nitrogen. The effect of Phosphorus was
non-significant on vegetative characters while flower characters viz. rachis length
and number of florets/spike were found significant. Bulb yield in terms of clump
weight (t/ha) was also found significant and 200 kg P2O5/ ha recorded the higher
values.
In tuberose cv. ‘Shringar’ plant height, number of leaves per plant,
number of flowers per spike, length of spike, length of rachis, number of spike
per plot and weight of flowers per spike was remarkably increased with N and P
fertilizers alone and in combinations. The weight of flowers per spike were
higher with combination of 20 g N and 12 g P per plot (Yadav, 2007).
Chaudhary (2007) ascertained the response of nitrogen, phosphorus and
bio fertilizers on plant growth and bulb production in tuberose. Treatments
comprised of N (0, 50, 100 and 200 kg/ha) and P (0, 25, 50 and 100 kg/ha) in
combination with bio fertilizers (no bio fertilizer, Azotobacter, PSB and VAM).
Application of bio fertilizers in combination with N at the rate of 100 kg per
hectare and P at the rate of 50 kg per hectare proved to be equally effective to N
at the rate of 200 kg/ha and P at the rate of 100 kg/ha in increasing the plant
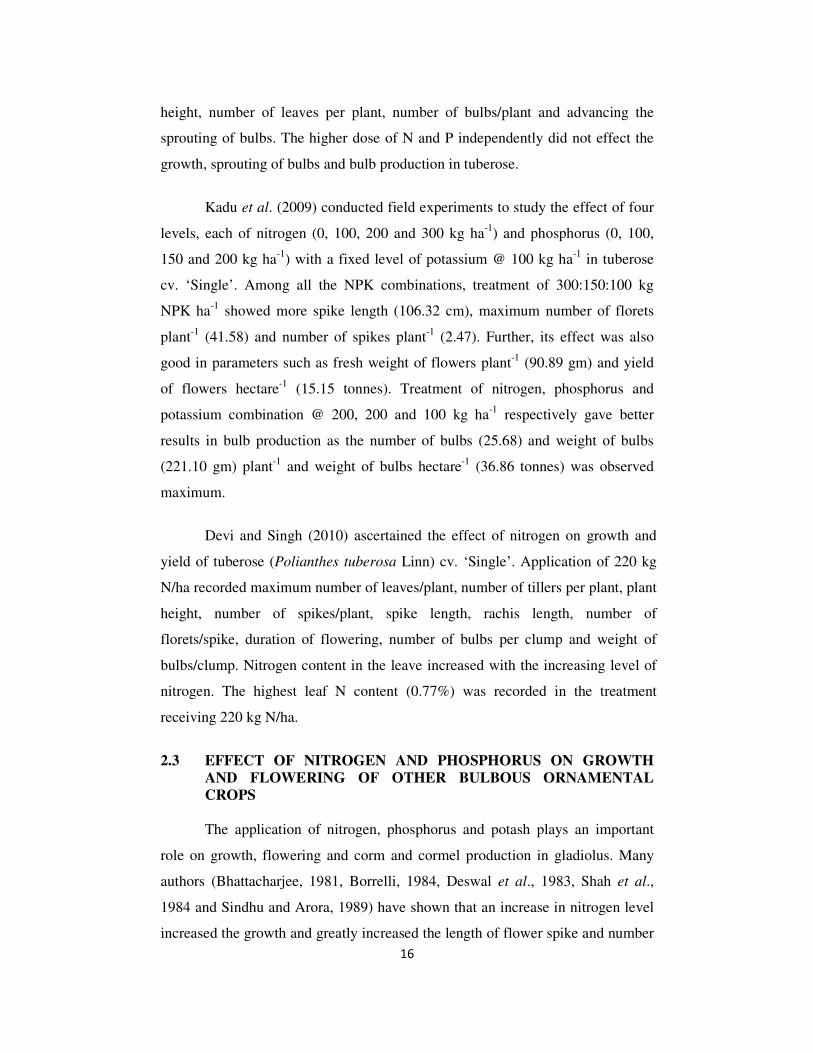
16
height, number of leaves per plant, number of bulbs/plant and advancing the
sprouting of bulbs. The higher dose of N and P independently did not effect the
growth, sprouting of bulbs and bulb production in tuberose.
Kadu et al. (2009) conducted field experiments to study the effect of four
levels, each of nitrogen (0, 100, 200 and 300 kg ha-1) and phosphorus (0, 100,
150 and 200 kg ha-1) with a fixed level of potassium @ 100 kg ha-1 in tuberose
cv. ‘Single’. Among all the NPK combinations, treatment of 300:150:100 kg
NPK ha-1 showed more spike length (106.32 cm), maximum number of florets
plant-1 (41.58) and number of spikes plant-1 (2.47). Further, its effect was also
good in parameters such as fresh weight of flowers plant-1 (90.89 gm) and yield
of flowers hectare-1 (15.15 tonnes). Treatment of nitrogen, phosphorus and
potassium combination @ 200, 200 and 100 kg ha-1 respectively gave better
results in bulb production as the number of bulbs (25.68) and weight of bulbs
(221.10 gm) plant-1 and weight of bulbs hectare-1 (36.86 tonnes) was observed
maximum.
Devi and Singh (2010) ascertained the effect of nitrogen on growth and
yield of tuberose (Polianthes tuberosa Linn) cv. ‘Single’. Application of 220 kg
N/ha recorded maximum number of leaves/plant, number of tillers per plant, plant
height, number of spikes/plant, spike length, rachis length, number of
florets/spike, duration of flowering, number of bulbs per clump and weight of
bulbs/clump. Nitrogen content in the leave increased with the increasing level of
nitrogen. The highest leaf N content (0.77%) was recorded in the treatment
receiving 220 kg N/ha.
2.3 EFFECT OF NITROGEN AND PHOSPHORUS ON GROWTH
AND FLOWERING OF OTHER BULBOUS ORNAMENTAL
CROPS The application of nitrogen, phosphorus and potash plays an important
role on growth, flowering and corm and cormel production in gladiolus. Many
authors (Bhattacharjee, 1981, Borrelli, 1984, Deswal et al., 1983, Shah et al.,
1984 and Sindhu and Arora, 1989) have shown that an increase in nitrogen level
increased the growth and greatly increased the length of flower spike and number
17
of florets/spike. Borelli (1984) reported that increasing nitrogen supply (0, 10, 20
or 30 g/m2) increased the number of corms and cormels produced and higher rate
of nitrogen declined in corm and cormel size associated with close spacing,
however, Cirrito and Vita (1980) found that there was no relation between
planting density and cormel production in gladiolus. The best results were
obtained with 7.5 kg ammonium sulphate, 10 kg super phosphate and 10 kg
muriate of potash per 100 m2 (Mishra and Singh, 1989). Higher rate of nitrogen
delayed the time of flowering and increased the spike length, weight and size of
the corms and number of cormels, where as higher rates of phosphorus and
potash tended to improve flower quality, cormel growth and corm production in
cv. ‘Friendship’ (Bhattacharjee, 1981).
Different response was observed on cormel yield of gladiolus, i.e.
phosphorus @ 100 kg/ha without nitrogen application produced the highest
cormel yield (25 g/plant) in contrast with nitrogen @ 150 kg/ha and without
phosphorus produced the lowest cormel yield (1.95 g/plant). Haider et al. (1981)
found that 50 kg nitrogen/ha gave the highest corm and cormel yield/plant (142
+8.6 and 18 +1.4, respectively) over control. Mukhopadhyay (1984) also found
that yield of corm was higher at 100 kg phosphorus/ ha, i.e. at higher dose.
Research was conducted at the Biology and Environmental Science
Department of the University of Sussex, UK to investigate the influence of
cultivar or nutrients application on the growth and development of the common
hyacinth. Results indicated that the application of (NH4)2SO4 or Na2HPO4
enhanced vegetative growth of hyacinth, plants fertilised with 60-90 mM
(NH4)2SO4 recorded higher vegetative growth, delayed in senescence, and
produced higher bulb and bulblets yield than the control and those fertilised with
Na2HPO4. In general, the application of Na2HPO4 at the rate of 60-90 mM to the
plants resulted in good flower quality (Addai, 2011).
Mahgoub et al. (2006) who worked on Irish bulb reported that plant
height, leaf biomass and inflorescence length increased when the bulb was
fertilised with nitrogen at the rate of 40 g plus 30 g K/m2. It has already been

18
established that (Addai, 2010) after planting, the level of reserved carbohydrates
stored in flower bulbs decreased during and after sprouting. Thus replenishing the
nutrients lost from the bulb during sprouting, through nutrients application is
responsible for the relatively high growth and development of this flower bulb as
compared to the control.
Hamit et al. (2001) also observed that the application of phosphorus
increased the number of spikes, but the number of florets per plant in Freesia
hybrida was not affected.
Effects of various levels of NPK applied after 30 and 45 days of planting
on plant growth and flowering characteristics of Gladiolus hortulanus L. cv.
Wind Song, were studied as a mean of achieving better management, production
and ascertaining NPK utilization by plants. Plant height (cm), number of leaves,
leaf length (cm) and spike length (cm) were maximum with 10:10:5 g pot-1 NPK
whereas emergence of spike, opening of first and last floret, corm diameter and
corm weight were maximum with 5:5:5 g pot-1 NPK. Number of florets per spike
was maximum with 10:5:5 g pot-1 NPK. High nitrogen application rate along with
moderate phosphorus and potassium enhanced vegetative growth characteristics
while moderate doses of NPK exhibited more pronounced effect on floral
characteristics and corm development of gladiolus (Khan and Ahmad, 2004).
Increasing level of N advanced the time of flowering and greatly increased flower
spike length, corm weight and size and number of cormels per plant in gladiolus
(Bhattacharjee, 1981) while Shah et al. (1984) stated that increasing N rates
delayed flowering but augmented plant growth, number of leaves, spike length
and number of florets per spike.
Foliar nutrition with NPK in addition to soil application significantly
affects vegetative growth and floral characters (Roy et al., 1995), whereas, Singh
et al. (1996a) attributed that application of higher rate of fertilizer delayed spike
emergence and considerably prolonged the flowering period and shelf life of
florets. Fertilizer application also affects flower colour of gladiolus but not in a
systematic manner (Devecchi and Barni, 1997). It was observed by Barman et al.

19
(1998) that effect of N and K were much more pronounced than those of P on
number, size and weight of corms and cormels in gladiolus.
Mukesh et al. (2001) reported that application of NPK @ 50:10:20 g/m2
in Gladiolus grandiflorus resulted in maximum spike weight, number of flowers
per spike, flower diameter and size, number and weight of corms
Haitbura and Misra (1999) stated that 30 g N m-2 is best for enhancing
vegetative growth and maximum number of florets per spike of gladiolus. Pandey
et al. (2000) observed that 20 g N and 40 g P/m2 produced maximum number of
leaves of gladiolus. Bhattacharjee (1981) stated that increasing the level of N
advanced the time of flowering. He also observed that increasing the level of N
greatly increased number of florets per spike.
Borrelli (1984) observed that by increasing the supply of nitrogen, the
number of flowering shoots corms and cormels were improved, similarly Deswal
et al. (1983) observed that plants receiving the higher nitrogen rates were tallest
(31.6 cm) and produced the greatest number of florets/spikes (4.9) and
corms/plant (19.5) in gladiolus.

Chapter-3
MATERIALS AND METHODS
The present investigations entitled, “Effect of nitrogen and phosphorus
on growth and flowering in tuberose (Polianthes tuberosa L.) cv. Double”
were carried out at the experimental farm of the Department of Floriculture and
Landscaping, Dr Y S Parmar University of Horticulture and Forestry, Nauni,
Solan (H.P.) during 2011. The materials used and methodology adopted for
carrying out these studies has been described in this chapter under different sub
heads as below:
3.1 EXPERIMENTAL SITE
3.1.1 Location and Climate The Research Farm of the Department of Floriculture and Landscaping is
located at 30o52′30″ North Latitude and 77o11′30″ East Longitude at an altitude
of 1276 meters (amsl). The area falls in the mid hill zone of Himachal Pradesh.
The climate is generally sub-temperate to sub-tropical, characterized by mild
summers and cool winters. May and June being the hottest months while,
December and January are the coldest ones. The annual rainfall ranges between
1000-1300 mm and out of it nearly 75% is received during June to September.
Winter rains with occasional hail storms and snow fall are received during the
months of January and February. The mean monthly meteorological data during
the course of the present studies is embodied in Appendix-I
3.1.2 Soil Characteristics
The soil was analyzed for various physico-chemical properties viz., macro
nutrients (NPK), pH, Electrical conductivity (EC) and Organic carbon (OC)
before planting and after harvesting of the crop. The composite surface soil
samples (0-15 cm) were collected from the experimental field. The soil samples
were air dried in shade and ground with the help of wooden pestle and mortar and

Fig. 1. Mean monthly temperature (maximum and minimum), relative humidity and rainfall recorded during 2011
Source: Meteorological Observatory, DepaY.S. Parmar University of Horticulture and Forestry, Nauni, Solan (H.P.) 173 230
passed through 2 mm sieve. The processed soil samples were stored in cloth bags
with the suitable labels for further chemical analysis. Si
followed for analyzing the NPK status for different experimental plots after
harvesting the crop. The methods employed and results obtained for NPK status
of the soil of experimental area have been summarized as below.
Table 1 Initial physico- chemical analysis of the experimental area
Chemical Analysis
Available N (kg/ha)
Available P (kg/ha)
Available K (kg/ha)
pH
EC (dSm-1)
OC (%)
21
Mean monthly temperature (maximum and minimum), relative humidity and rainfall recorded during 2011
Meteorological Observatory, Department of Environment Science, Dr. Y.S. Parmar University of Horticulture and Forestry, Nauni, Solan
passed through 2 mm sieve. The processed soil samples were stored in cloth bags
with the suitable labels for further chemical analysis. Similar procedure was
followed for analyzing the NPK status for different experimental plots after
harvesting the crop. The methods employed and results obtained for NPK status
of the soil of experimental area have been summarized as below.
chemical analysis of the experimental area Value Obtained Method employed
384.07 Alkaline Potassium Permanganate Method (Subbiah and Asija, 1956)
39.42 Olsen’s Method (Olsen et al., 1954)
127.74 Normal, Neutral ammonium acetate method (Merwin and Peech, 1951)
7.30 Soil-water suspension (1:2 ratio)(Jackson,1973)
0.75 Soil-water suspension (1:2 ratio): (Jackson ,1973)
1.20 Chromic acid titration method (Walkley and Black method, 1934).
Mean monthly temperature (maximum and minimum), relative
rtment of Environment Science, Dr. Y.S. Parmar University of Horticulture and Forestry, Nauni, Solan
passed through 2 mm sieve. The processed soil samples were stored in cloth bags
milar procedure was
followed for analyzing the NPK status for different experimental plots after
harvesting the crop. The methods employed and results obtained for NPK status
Alkaline Potassium Permanganate Method (Subbiah and Asija, 1956)
., 1954)
Normal, Neutral ammonium acetate method (Merwin and Peech, 1951)
2 ratio)
2 ratio):
Chromic acid titration method (Walkley and Black method, 1934).

22
3.2 PREPRATION OF BEDS FOR EXPERIMENTAL TRIALS
The field selected for the experimental study was prepared by ploughing
thoroughly with tractor and leveled properly. The stubbles of previous crop,
weeds and grasses were removed and then field was finally leveled to make the
soil pulverized. The beds of the dimensions of 1.00 m x 1.00 m in length and
breadth i.e. 1 sq m were prepared for planting of the bulbs. The bulbs were
spaced 25 x 25 cm apart thereby accommodating 16 bulbs per plot of size one
square meter. Vermicompost @ 2.5 kg/m2 was applied uniformly and mixed well
in to the soil prior to planting.
3.3 PLANT MATERIAL
The bulbs of tuberose used for the experiment were procured from the
experimental farm of the Department of Floriculture and Landscaping, Dr Y S
Parmar University of Horticulture and Forestry, Nauni, Solan (H.P.). The healthy
and disease free tuberose bulbs of requisite and uniform size were selected and
used for the experimental studies.
3.4 EXPERIMENTAL DETAILS
The trial was laid out in randomized block design (factorial) with four
levels of nitrogen (i.e. 0, 100, 200 and 300 kg/ha) and four levels of phosphorus
(i.e. 0, 50, 100 and 150 kg/ha) replicated thrice. The experiment was comprised
of sixteen different treatment combinations of different doses of nitrogen and
phosphorus. Half dose of nitrogen and full dose of phosphorus were applied as
basal dose just before planting of bulbs while remaining half dose of the nitrogen
was applied after one month of planting (i.e. 30 days after planting). Nitrogen
was applied in the form of urea and phosphorus in form of single super phosphate
(SSP). A uniform dose of potassium @ 150 kg/ha in form of muriate of potash
(MOP) was given as basal dose in all plots including control before the planting
of bulbs.
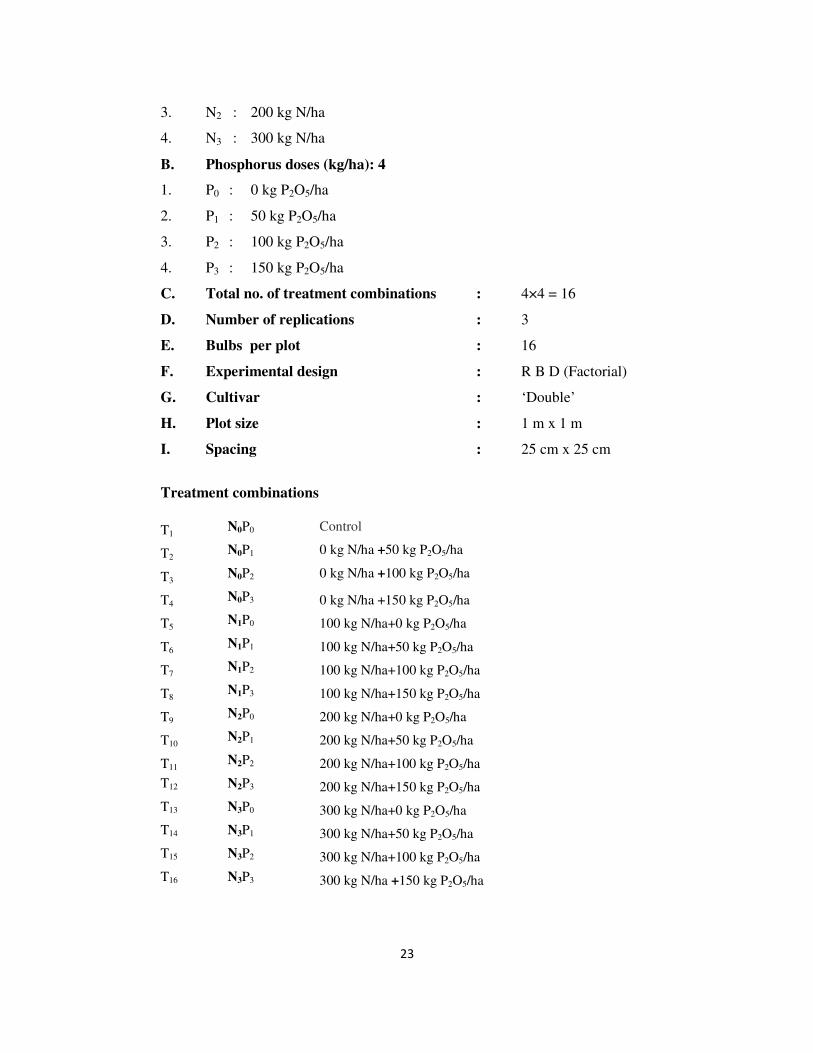
A. Nitrogen doses (kg/ha): 4
1. N0 : 0 kg N/ha
2. N1 : 100 kg N/ha
23
3. N2 : 200 kg N/ha
4. N3 : 300 kg N/ha
B. Phosphorus doses (kg/ha): 4
1. P0 : 0 kg P2O5/ha
2. P1 : 50 kg P2O5/ha
3. P2 : 100 kg P2O5/ha
4. P3 : 150 kg P2O5/ha
C. Total no. of treatment combinations : 4×4 = 16
D. Number of replications : 3
E. Bulbs per plot : 16
F. Experimental design : R B D (Factorial)
G. Cultivar : ‘Double’
H. Plot size : 1 m x 1 m
I. Spacing : 25 cm x 25 cm
Treatment combinations
T1 N0P0 Control
T2 N0P1 0 kg N/ha +50 kg P2O5/ha
T3 N0P2 0 kg N/ha +100 kg P2O5/ha
T4 N0P3 0 kg N/ha +150 kg P2O5/ha
T5 N1P0 100 kg N/ha+0 kg P2O5/ha
T6 N1P1 100 kg N/ha+50 kg P2O5/ha
T7 N1P2 100 kg N/ha+100 kg P2O5/ha
T8 N1P3 100 kg N/ha+150 kg P2O5/ha
T9 N2P0 200 kg N/ha+0 kg P2O5/ha
T10 N2P1 200 kg N/ha+50 kg P2O5/ha
T11 N2P2 200 kg N/ha+100 kg P2O5/ha
T12 N2P3 200 kg N/ha+150 kg P2O5/ha
T13 N3P0 300 kg N/ha+0 kg P2O5/ha
T14 N3P1 300 kg N/ha+50 kg P2O5/ha
T15 N3P2 300 kg N/ha+100 kg P2O5/ha
T16 N3P3 300 kg N/ha +150 kg P2O5/ha

24
3.5 CULTURAL PRACTICES
A successful tuberose crop stand was raised by following the standard
cultural practices except various treatments of inorganic fertilizers (NPK).
Irrigation twice a week during summer and once a week in winter were applied
while during the rainy season, irrigation was done as and when needed depending
upon weather conditions. From time to time weeding and hoeing of the field was
done. Although, tuberose is not so prone to insects-pests and diseases, yet all the
precautionary measures were taken in to consideration through out the cropping
period.
3.6 OBSERVATIONS RECORDED: The observations on various growth, flowering and bulb production of
tuberose were recorded as per the details given below:
3.6.1 Number of days taken for sprouting of bulbs: This observation was
recorded as the time taken in days from the date of planting of bulbs to the
appearance of cotyledonary leaves.
3.6.2 Per cent sprouting of bulbs: The per cent sprouting of bulbs was
calculated as the number of bulbs sprouted out of the total number of
bulbs planted per bed and multiplied by hundred.
3.6.3 Number of leaves per plant: The total numbers of leaves produced per
plant were counted at the time of spike emergence.
3.6.4 Plant height (cm): This observation was recorded as the length from the
visible base of the plant to the tip of the longest leaf.
3.6.5 Number of days taken for spike emergence: Number of days taken for
appearance of spike were recorded as the time in days from date of
planting of bulbs to the date of appearance of the spike.
3.6.6 Spike length (cm): Length of spike was measured from the base of the
plant to the tip of the floret of the spike.

25
3.6.7 Number of days taken for basal florets opening: The time taken for
basal florets opening was calculated as the time taken in days from the
date of planting of bulbs to the date of opening of basal florets.
3.6.8 Number of florets per spike: The total number of florets per spike was
recorded as the total number of florets produced in a spike.
3.6.9 Rachis length (cm): The distance between the base of the basal floret to
the apex of the top most floret of the spike was measured.
3.6.10 Fresh weight of spike (g): The fresh weight of spike was recorded at
harvesting stage (i.e. basal floret opening stage) by removing the spike
from the plant just above the ground level and the weight was recorded
with the help of digital weighing balance.
3.6.11 Fresh weight of 100 florets: This was recorded by picking one hundred
fully opened florets from the spikes in each treatment randomly at the
time of peak flowering.
3.6.12 Florets diameter (cm): The diameter of fully open florets was recorded
from the spikes in each treatment. The size was recorded with the help of
scale as average of size from north to south and east to west direction.
3.6.13 Number of flowering stems per plant: This was recorded as the total
number of spikes produced per plant during the whole cropping period.
3.6.14 Number of bulbs produced per plant: This observation was recorded as
the total number of bulbs produced per plant and counted at the time
harvesting of the bulbs.
3.6.15 Weight of bulbs per plant (g): After harvesting, the bulbs were separated
carefully without damaging its basal plate and roots. The weight of the
bulbs was measured with the help of digital weighing balance and the
weight of bulbs produced in each plant was recorded accordingly.
3.6.16 Vase life (days): Vase life is the number of days from putting the spike
into the vase containing distilled water up to fading of the last or topmost
floret.

Plate 1. Pictorial view of the experimental field (Vegetative stage)
Plate 2. Pictorial view of the experimental field at starting of flowering

26
3.7 ANALYSIS OF SOIL FOR AVAILABLE N, P AND K CONTENT
3.7.1 Available Nitrogen (Subbiah and Asija, 1956)
Five gram of the soil sample was moistened with 2 ml of distilled water
and was added to Kjeldahl distillation flask. 25 ml of 0.32 % KMnO4 and 25 ml
of 2.5% NaOH solution were added to the assembly and the cork was fitted
immediately. 20 ml of 0.02 N H2SO4 was taken in a conical flask and to it 3 drops
of methyl red indicator was added. Hot plate was switched on to distill ammonia
gas and 30 ml of distillate in 0.02 N H2 SO4 was collected. The excess of H2SO4
collected in the conical flask was titrated against 0.02 N NaOH and the change in
colour (pink to yellow) was noted.
Where,
A = Volume of 0.02 N NaOH used
ppm of available Nitrogen in sample =Available Nitrogen percentage x 10,000
Available Nitrogen kg/ha = ppm x 2.24
3.7.2 Available Phosphorus (Olsen et al., 1954)
One gram of the soil sample was taken in a conical flask and a pinch of
Darco-G 60 and 20 ml of 0.5 N Sodium bicarbonate was added to it. The contents
were shaken for 30 minutes and thereafter filtered to obtain clear filtrate. 5 ml of
the filtrate was taken in which 5 ml of ammonium molybdate was added. The
mixture was thoroughly shaken to remove the CO2 evolved. Then the contents of
the flask were diluted to about 20 ml. One ml of working solution of SnCl2 was
added and its volume was made to 25 ml in the volumetric flask. The contents
were mixed thoroughly and the blue colour intensity was measured after 5
minutes at 660 nm and appropriate blank was also run simultaneously.
ppm of available P in sample = A x Total dilution Where,
A = Concentration of P read from the standard curve.
Available Phosphorus kg/ha = ppm x 2.24
Available Nitrogen percentage = (10-A) x 0.00028
x 100 Weight of soil

27
3.7.3 Available Potassium (Merwin and Peech, 1951)
Available K was extracted with neutral normal ammonium acetate, after
shaking 5 gm of the soil sample in 25 ml of extractant for 5 minutes and then
filtered. Volume the filtrate was made to 100 ml and Available K was determined
on flame photometer. The flame photometer was standardized by feeding
standard solution of known concentration prepared by KCl. The standard curve
was prepared by the standard fed to the equipment and reading of the test sample
was extrapolated.
ppm of available K in the sample = Y x Total dilution
Where,
Y = ppm as read from the standard curve.
Available Potassium kg/ha = ppm x 2.24
3.7.4 Estimation of soil pH
Estimation of pH in soil-water suspension (1:2 ratio) – 20 g of the soil
sample was taken in a 50 ml beaker and 40 ml of the distilled water was added to
it. The beaker was stirred at least four times with in a period of half an hour. This
time is required for the soil and water to attain equilibrium. After half an hour
again the soil suspension was stirred and pH was measured on a digital pH-meter
(Jackson, 1973).
3.7.5 Estimation of electrical conductivity (EC)
20 g of the soil sample was taken in a 50 ml beaker and 40 ml of the
distilled water was added to it. The beaker was stirred intermittently 4-5 times
and left overnight for getting a clear supernatant solution. The Electrical
conductivity (EC) of the supernatant solution was measured by systronic’s
conductivity meter and was expressed in dSm-1(Jackson, 1973).
3.7.6 Organic carbon (OC)
Organic carbon content of the sample was determined by Chromic acid
titration method suggested by Walkley and Black method (1934).

28
3.8 STATISTICAL ANALYSIS All the data pertaining to growth, flowering and bulb production
characters were subjected to statistical analysis as per Randomized Block Design
(Factorial) suggested by Gomez and Gomez (1984).
3.8.1 Analysis of Variance
The statistical analysis was done as per design of the experiment as
suggested by Gomez and Gomez (1984). The analysis of variance table was
prepared as follows:
Source of
variance
df Sum of
squares
Mean sum of
squares
Variance
ratio (V R)
Replications (r) r-1 Sr Sr / r-1= Mr Mr / Me Treatments Nitrogen (N) (n-1) Sn Sn/(n-1)=Mn MN/Me
Phosphorus (P) (p-1) Sp Sp /(p-1)=Mp MP/Me Interaction (N×P) (N×P) SI Si /(N×P)=Mi Mi/Me Error (e) (r-1) (t-1) Se Se/(r-1)(t-1)= Me
Where,
r = Number of replication N = Nitrogen P = Phosphorus N×P = Interaction
Critical difference was calculated as follows: For nitrogen = 2.074* sqrt (2*Mss due to error/12)
For phosphorus = 2.074* sqrt (2*Mss due to error/12)
For interaction = 2.074* sqrt (2*Mss due to error/3)
Partitioning of degree of freedom for analysis of variance table is given below:
Source of variation Degree of freedom
Replications 2 Treatments Water Depth 2 Irrigation Interval 3 Interaction 6 Error (e) 22
Chapter-4
EXPERIMENTAL RESULTS
The results of the present study entitled, “Effect of nitrogen and
phosphorus on growth and flowering in tuberose (Polianthes tuberosa L.) cv.
Double” carried out during the year 2011 have been presented in this chapter.
The analysis of variances for various parameters under study have been given in
Appendix-II
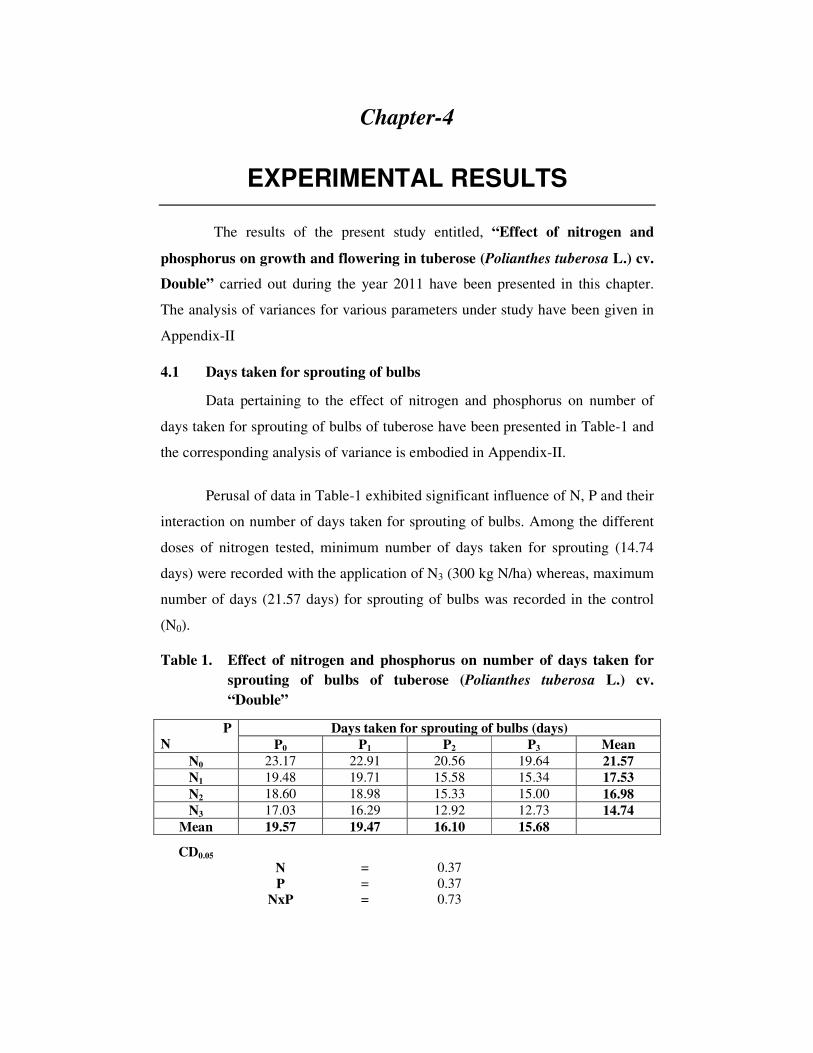
4.1 Days taken for sprouting of bulbs
Data pertaining to the effect of nitrogen and phosphorus on number of
days taken for sprouting of bulbs of tuberose have been presented in Table-1 and
the corresponding analysis of variance is embodied in Appendix-II.
Perusal of data in Table-1 exhibited significant influence of N, P and their
interaction on number of days taken for sprouting of bulbs. Among the different
doses of nitrogen tested, minimum number of days taken for sprouting (14.74
days) were recorded with the application of N3 (300 kg N/ha) whereas, maximum
number of days (21.57 days) for sprouting of bulbs was recorded in the control
(N0).
Table 1. Effect of nitrogen and phosphorus on number of days taken for
sprouting of bulbs of tuberose (Polianthes tuberosa L.) cv.
“Double”
P N
Days taken for sprouting of bulbs (days)
P0 P1 P2 P3 Mean
N0 23.17 22.91 20.56 19.64 21.57
N1 19.48 19.71 15.58 15.34 17.53
N2 18.60 18.98 15.33 15.00 16.98
N3 17.03 16.29 12.92 12.73 14.74
Mean 19.57 19.47 16.10 15.68
CD0.05 N = 0.37 P = 0.37 NxP = 0.73

30
As regards the effect of phosphorus, minimum time (15.68 days) for
sprouting of bulbs was recorded with the application of P3 (150 kg P2O5/ha) and
was found to be significantly higher over all other treatments. Whereas,
maximum time (19.57 days) taken for sprouting of tuberose bulbs was recorded
in control (P0) which was found to be at par with P1 (19.47 days).
The interaction, N×P was found to be significant. Minimum days (12.73
days) for sprouting were recorded with the treatment combination, N3P3 (i.e. 300
kg N/ha + 150 kg P2O5/ha) and found to be statistically at par with N3P2 (12.92
days). However, maximum number of days (23.17 days) for sprouting were
recorded with N0P0 (control) and found to be at par with N0P1 (22.91 days).
4.2 Per cent sprouting of bulbs
Data pertaining to the effect of nitrogen and phosphorus on per cent
sprouting of tuberose bulbs have been presented in Table-2 and the corresponding
analysis of variance has been embodied in Appendix-II. Perusal of data revealed
that per cent sprouting of bulbs was significantly influenced by nitrogen,
phosphorus and their interaction. As regards the effect of nitrogen, plant raised
with the application of N2 (200 kg N/ha) observed maximum per cent sprouting
(99.97%) followed by (99.81%) in N3 (300 kg N/ha). However, both the
treatments were statistically at par with each other. The minimum per cent
sprouting (91.37%) was recorded in control (N0).
Table 2. Effect of nitrogen and phosphorus on per cent sprouting of bulbs of
tuberose (Polianthes tuberosa L.) cv. “Double”
P
N
Per cent sprouting of bulbs (%)
P0 P1 P2 P3 Mean
N0 92.77 (9.68)* 90.47 (9.56) 91.55 (9.62) 90.68 (9.58) 91.37 (9.61)
N1 95.80 (9.84) 95.73 (9.84) 97.97 (9.95) 96.95 (9.90) 96.61 (9.88)
N2 99.97 (10.05) 99.90 (10.05) 100 (10.05) 100 (10.05) 99.97 (10.05)
N3 99.93 (10.05) 99.30 (10.02) 100 (10.05) 100 (10.05) 99.81 (10.04)
Mean 97.12 (9.90) 96.35 (9.87) 97.38 (9.92) 96.90 (9.89)
CD0.05
N = (0.04) P = (0.04) NxP = (0.04)
*Values in parenthesis are the square root transformation of the original values

31
As regards the effect of phosphorus, plant raised with P2 (100 kg P2O5/ha)
recorded maximum per cent sprouting (97.38%) which was found to be
statistically at par with P0 (0 kg P2O5/ha) and P3 (150 kg P2O5/ha) recording 97.12
and 96.90% sprouting, respectively. Whereas, minimum per cent sprouting
(96.35%) was observed in P1 (150 kg P2O5/ha) which was statistically at par with
P3 (96.90%).
Interaction between N x P showed that maximum (100%) per cent
sprouting was noticed with N2P2, N2P3, N3P2 and N3P3. These interactions were
found to be statistically at par with N2P0, N3P0, N2P1, and N3P1, respectively.
Minimum per cent sprouting (90.47%) of bulbs was observed in N0P1 followed
by N0P3 (90.68%) and N0P2 (91.55%).
4.3 Plant height (cm)
The data recorded on plant height as influenced by different nitrogen and
phosphorus doses are presented in Table-3 and the corresponding analysis of
variance follows in the Appendix-II. Results indicated that the effects of nitrogen
and phosphorus on plant height were found to be significant. Perusal of data
revealed that maximum plant height (48.07 cm) was recorded with 200 kg N/ha
(N2) which was found to be at par with N3 (300 kg N/ha).The minimum plant
height (42.65 cm) was recorded with control (N0).
Table 3. Effect of nitrogen and phosphorus on plant height (cm) of tuberose
(Polianthes tuberosa L.) cv. “Double”
P
N
Plant height (cm)
P0 P1 P2 P3 Mean
N0 41.89 42.02 43.22 43.45 42.65
N1 44.07 44.32 45.54 45.55 44.87
N2 47.85 47.97 48.38 48.06 48.07
N3 47.65 47.77 48.00 48.02 47.86
Mean 45.37 45.52 46.29 46.27
CD0.05
N = 0.60 P = 0.60 NxP = NS

32
As regards the effect of phosphorus, tallest plants (46.29 cm) were
produced with 100 kg P2O5/ha i.e. (P2) which was found to be statistically at par
with 150 kg P2O5/ha (P3). However, minimum plant height (45.37 cm) was
recorded with control (P0) which was statistically at par with P1 (45.52 cm).
The interaction effects were found to be non significant. However,
maximum plant height (48.38 cm) was noticed in treatment combination N2P2
followed by 48.06 cm and 48.02 cm in the treatment combinations N2P3 and N3P3,
respectively. The minimum plant height (41.89 cm) was noticed with N0P0.
4.4 Number of leaves per plant
Data pertaining to the effect of nitrogen and phosphorus on number of
leaves per plant of tuberose have been presented in Table-4. The corresponding
analysis of variance follows in Appendix-II. Significantly highest number of
leaves produced per plant (46.98) were recorded with the application of 200 kg
N/ha (N2) which was found to be at par with 300 kg N/ha (N3).The minimum
number of leaves were recorded (36.45) with control (N0).
Table 4. Effect of nitrogen and phosphorus on number of leaves per plant of
tuberose (Polianthes tuberosa L.) cv. “Double”.
P N
Number of leaves per plant
P0 P1 P2 P3 Mean
N0 35.20 35.29 37.60 37.69 36.45
N1 39.12 39.14 43.68 43.76 41.43
N2 46.39 46.53 47.59 47.42 46.98
N3 46.73 47.09 47.01 46.90 46.93
Mean 41.86 42.01 43.97 43.94
CD0.05
N = 0.78 P = 0.78 NxP = 1.56
Perusal of data in Table-4 showed that highest number of leaves (43.97) was
recorded with 100 kg P2O5/ha (P2) which was found to be statistically at par with
150 kg P2O5/ha (P3) and minimum numbers of leaves (41.86) were recorded with
P0 which was statistically at par with P1 (42.01).
33
The interaction N×P was found to affect number of leaves per plant
significantly. Maximum number of leaves per plant (47.59) were recorded with
treatment combination N2P2 and found to be at par with N2P3, N3P1, N3P2, N3P3,
N3P0, N2P1 and N2P0. The minimum number of leaves per plant (35.20) were
observed with control (N0P0).
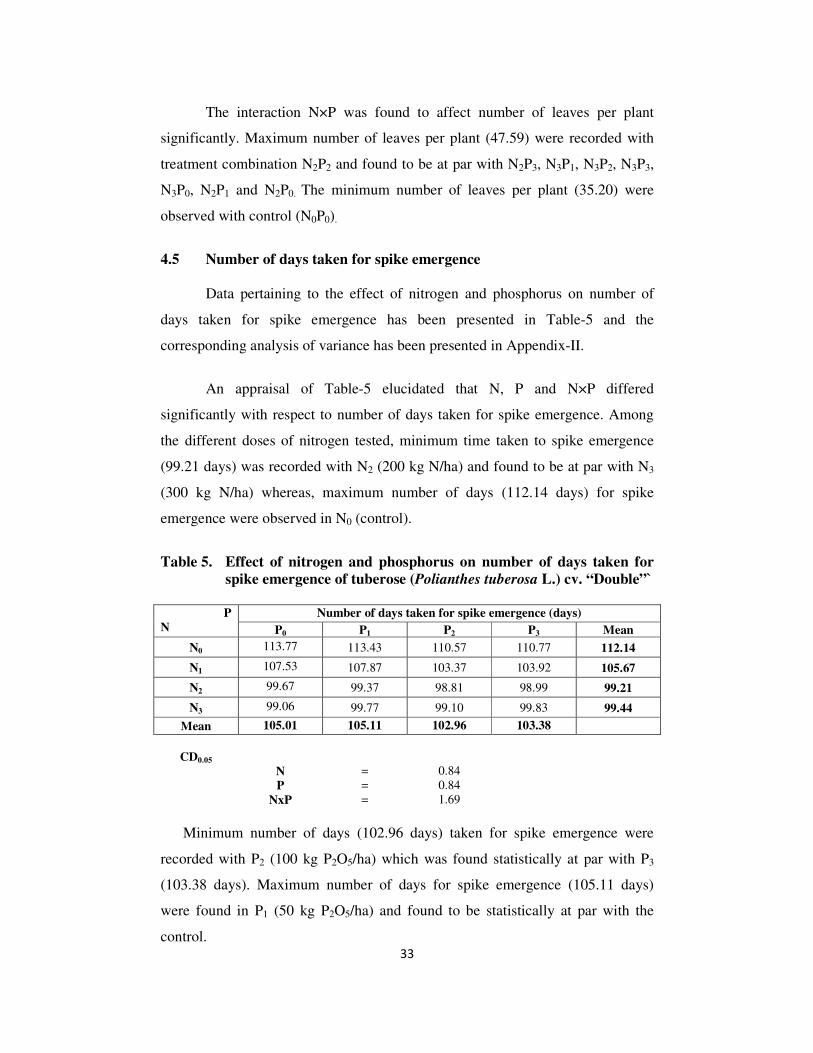
4.5 Number of days taken for spike emergence
Data pertaining to the effect of nitrogen and phosphorus on number of
days taken for spike emergence has been presented in Table-5 and the
corresponding analysis of variance has been presented in Appendix-II.
An appraisal of Table-5 elucidated that N, P and N×P differed
significantly with respect to number of days taken for spike emergence. Among
the different doses of nitrogen tested, minimum time taken to spike emergence
(99.21 days) was recorded with N2 (200 kg N/ha) and found to be at par with N3
(300 kg N/ha) whereas, maximum number of days (112.14 days) for spike
emergence were observed in N0 (control).
Table 5. Effect of nitrogen and phosphorus on number of days taken for
spike emergence of tuberose (Polianthes tuberosa L.) cv. “Double”`
P
N
Number of days taken for spike emergence (days)
P0 P1 P2 P3 Mean
N0 113.77 113.43 110.57 110.77 112.14
N1 107.53 107.87 103.37 103.92 105.67
N2 99.67 99.37 98.81 98.99 99.21
N3 99.06 99.77 99.10 99.83 99.44
Mean 105.01 105.11 102.96 103.38
CD0.05
N = 0.84 P = 0.84 NxP = 1.69
Minimum number of days (102.96 days) taken for spike emergence were
recorded with P2 (100 kg P2O5/ha) which was found statistically at par with P3
(103.38 days). Maximum number of days for spike emergence (105.11 days)
were found in P1 (50 kg P2O5/ha) and found to be statistically at par with the
control.

34
N×P interaction indicated that minimum number of days taken for spike
emergence were recorded in N2P2 (98.81 days) and found to be at par with N2P3,
N3P0, N3P2, N2P1, N2P0, N3P1 and N3P3, respectively. However, N0P0 registered
maximum number of days (113.77 days) taken for spike emergence.
4.6 Number of days taken for basal florets opening
The time taken for basal florets opening of tuberose was found to be
significantly affected by various levels of N, P and N×P. The corresponding
analysis of variance has been embodied in Appendix-II.
An inquisition of data in Table-6 indicated minimum time (120.21 days)
for basal florets opening with the application of 200 kg N/ha (N2) followed by N3
and N1. However, maximum number of days taken for basal florets opening
(124.07 days) were observed in case of control (N0).
Table 6. Effect of nitrogen and phosphorus on number of days taken for
basal florets opening of tuberose (Polianthes tuberosa L.) cv.
“Double”
P
N
Number of days taken for opening of basal florets (days)
P0 P1 P2 P3 Mean
N0 124.40 124.31 123.60 123.97 124.07
N1 122.40 122.14 122.11 122.15 122.20
N2 121.78 120.79 119.10 119.16 120.21
N3 121.68 119.95 120.52 120.64 120.70
Mean 122.57 121.80 121.33 121.48
CD0.05 N = 0.44 P = 0.44 NxP = 0.88
As regards the effect of phosphorus minimum number of days taken for
basal florets opening (121.33 days) were recorded with application of 100 kg
P2O5/ha (P2) and found to be statistically at par with P3 (150 kg P2O5/ha).
However, maximum number of days taken for basal florets opening (122.57
days) were recorded in control.

35
In case of interaction between N and P, minimum time taken for basal
florets opening (119.10 days) was registered with combined dose of 200 kg N/ha
and 100 kg P2O5/ha (N2P2) which was found to be statistically at par with N2P3
(119.16 days) and N3P1 (119.95 days). The maximum number of days taken for
basal florets opening (124.40 days) was recorded under control.
4.7 Spike Length (cm)
The data pertaining to spike length of tuberose as influenced by various
levels of N, P and N×P have been summarized in Table-7 and their corresponding
analysis of variance are embodied in Appendix-II.
A cursory glance of data in Table-7 indicated that maximum spike length
(80.24 cm) was recorded with 200 kg N/ha (N2) and found to be statistically at
par with 300 kg N/ha (N3). However, the minimum spike length (73.72 cm) was
found in control (N0).
Table 7. Effect of nitrogen and phosphorus on spike length (cm) of
tuberose (Polianthes tuberosa L.) cv. “Double”
P
N Spike length (cm)
P0 P1 P2 P3 Mean
N0 72.56 73.41 74.53 74.36 73.72
N1 74.55 75.45 77.99 77.55 76.39
N2 79.65 79.91 80.88 80.53 80.24
N3 79.67 79.68 80.23 80.01 79.90
Mean 76.61 77.11 78.41 78.11
CD0.05
N = 0.58 P = 0.58 NxP = 1.17
Plants supplied with 100 kg P2O5/ha (P2) noticed maximum spike length
(78.41 cm) which was statistically at par with 150 kg P2O5/ha (P3) whereas,
minimum (76.61 cm) spike length was noticed in case of control (P0).
The interaction effect of nitrogen and phosphorus (NxP) on spike length
was found to be significant. Data revealed that maximum spike length (80.88 cm)
was registered with application of N2P2 which was statistically at par with N2P3

36
(80.53 cm), N3P2 (80.23 cm) N3P3 (80.01) and N2P1 (79.91 cm), respectively.
However, minimum spike length (72.56 cm) was observed under control (N0P0).
4.8 Number of florets per spike
The Table-8 indicated the data on the effect of nitrogen and phosphorus
with respect to number of florets produced per spike and the corresponding
analysis of variance has been presented in Appendix-II.
Various levels of N, P and their interactions affected the number of florets
per spike significantly. The application of 200 kg N/ha (N2) resulted in maximum
number of florets per spike (30.17) followed by N3 (29.96). However, minimum
(25.80) number of florets per spike was recorded in control (N0).
Table 8. Effect of nitrogen and phosphorus on number of florets per spike
of tuberose (Polianthes tuberosa L.) cv. “Double”
P
N Number of florets per spike
P0 P1 P2 P3 Mean
N0 25.33 25.87 26.03 25.95 25.80
N1 26.51 27.08 27.90 27.57 27.27
N2 29.85 29.91 30.48 30.44 30.17
N3 29.75 29.95 30.12 30.00 29.96
Mean 27.86 28.20 28.63 28.49
CD0.05
N = 0.12 P = 0.12 NxP = 0.24
As regards the effect of phosphorus, plant supplied with 100 kg P2O5/ha
(P2) registered maximum number of florets per spike (28.63) followed by P3
(28.49) whereas, minimum (27.86) number of florets per spike were observed in
control (P0).
The interaction between nitrogen and phosphorus (N×P) revealed that
treatment combination of 200 kg N/ha and 100 kg P2O5/ha (N2P2) recorded
maximum number of florets per spike (30.48) which was statistically at par with
N2P3. However, minimum number of florets per spike (25.33) were recorded in
control (N0P0).

37
4.9 Rachis length (cm)
Data pertaining to the effect of nitrogen and phosphorus on rachis length
of tuberose have been embodied in Table-8 and the corresponding analysis of
variance has been presented in Appendix-II.
Among the various nitrogen levels tested, N2 (200 kg N/ha) produced
maximum rachis length (28.54 cm) which was found to be at par with N3 (28.45
cm). However, minimum rachis length (24.39 cm) was observed in N0 (control).
As regards the effect of phosphorus, maximum rachis length (27.53 cm)
was recorded with P2 (100 kg P2O5/ha) which was statistically at par with P3
(27.22 cm). Whereas, minimum rachis length (26.10 cm) was found in control.
Table 9. Effect of nitrogen and phosphorus on rachis length (cm) of
tuberose (Polianthes tuberosa L.) cv.“Double”
P
N Rachis length (cm)
P0 P1 P2 P3 Mean
N0 23.64 24.52 24.81 24.57 24.39
N1 25.15 25.33 26.32 26.16 25.74
N2 27.41 27.07 29.95 29.74 28.54
N3 28.18 28.20 29.03 28.39 28.45
Mean 26.10 26.28 27.53 27.22
CD0.05
N = 0.50 P = 0.50 NxP = 1.00
Nitrogen and phosphorus (N×P) interaction was found to be significant
with respect to rachis length. N2P2 (200 kg N/ha and 100 kg P2O5/ha) treated
plants resulted in maximum rachis length (29.95 cm), which was at par with N2P3
(29.74 cm) and N3P2 (29.03 cm) whereas minimum rachis length (23.64 cm) was
recorded with N0P0 (control).
4.10 Fresh weight of spike (g)
Perusal of data in Table-10 revealed that application of N2 (200 kg N/ha)
recorded maximum fresh weight (69.73 g) of spikes and was statistically at par

38
with N3 (69.53 g) whereas, fresh weight of spike was recorded minimum (65.09
g) in N0.
As regards the effect of phosphorus, plants supplied with 100 kg P2O5/ha
(P2) recorded maximum fresh weight (68.57 g) of spike and found to be at par
with P3 (68.22 g). However, minimum fresh weight of spike (67.02 g) was
noticed in P0.
Table 10 . Effect of nitrogen and phosphorus on fresh weight of spike (g) of
tuberose (Polianthes tuberosa L.) cv. “Double”
P
N
Fresh weight of spike (g)
P0 P1 P2 P3 Mean
N0 64.06 64.66 65.93 65.70 65.09
N1 66.00 66.38 67.45 67.05 66.72
N2 68.68 68.73 70.89 70.62 69.73
N3 69.35 69.27 70.00 69.49 69.53
Mean 67.02 67.26 68.57 68.22
CD0.05
N = 0.40 P = 0.40 NxP = 0.80
In case of interaction between nitrogen and phosphorus, maximum fresh
weight of spike (70.89 g) was observed with N2P2 which was found to be at par
with N2P3 (70.62 g). However, minimum fresh weight of spike (64.06 g) was
recorded in N0P0 (control).
4.11 Fresh weight of 100 florets (g)
The data recorded on the fresh weight of 100 florets have been
summarized in Table-11 and the corresponding analysis of variance follows in
Appendix-II.
The effect of N, P and their interaction (N×P) on fresh weight of 100
florets was found to be significant. Perusal of data presented in Table-11 revealed
that maximum fresh weight of 100 florets (178.99 g) was recorded with N2 (200
kg N/ha), being at par with N3 (178.91 g) while N0 (control) recorded minimum
fresh weight of 100 florets (156.93 g).

39
Table 11. Effect of nitrogen and phosphorus on fresh weight of 100 florets
(g) of tuberose (Polianthes tuberosa L.) cv. “Double”
P
N Fresh weight of 100 florets (g)
P0 P1 P2 P3 Mean
N0 150.79 153.19 161.97 161.77 156.93
N1 164.07 167.09 173.92 173.37 169.61
N2 177.96 178.75 179.71 179.54 178.99
N3 178.45 179.00 179.14 179.06 178.91
Mean 167.82 169.51 173.69 173.44
CD0.05
N = 1.06 P = 1.06 NxP = 2.12
Among the various phosphorus levels tested, P2 (100 kg P2O5/ha)
recorded maximum fresh weight of 100 florets (173.69 g) followed by P3 (173.44
g). However, minimum fresh weight of 100 florets (167.82 g) was observed in P0
(control).
The interaction between nitrogen and phosphorus revealed maximum
fresh weight of 100 florets (179.71 g) with N2P2 and was found to be at par with
N2P3, N3P2, N3P3, N3P1, N2P1, N3P0 and N2P0. However, minimum fresh weight of
100 florets (150.79 g) was recorded in the control.
4.12 Floret Diameter (cm)
Data embodied in Table-12 revealed significant effects of nitrogen,
phosphorus and their interaction (N×P) on floret diameter (cm) in tuberose and its
corresponding analysis of variance has been embodied in Appendix-II.
The maximum floret diameter (3.35 cm) was recorded with N2 (200 kg
N/ha) which was found to be at par with N3 (300 kg N/ha) whereas, minimum
floret diameter (3.25 cm) was observed in N0 (control).
Maximum floret diameter (3.41 cm) was recorded with P2 (100 Kg
P2O5/ha) and found to be at par with P3 (3.37 cm). However, the minimum floret
diameter (3.19 cm) was observed in P0 (control).

40
Table 12. Effect of nitrogen and phosphorus on floret diameter (cm) of
tuberose (Polianthes tuberosa L.) cv. “Double”
P
N Floret diameter (cm)
P0 P1 P2 P3 Mean
N0 3.16 3.24 3.31 3.29 3.25
N1 3.17 3.24 3.39 3.33 3.29
N2 3.19 3.25 3.51 3.45 3.35
N3 3.22 3.26 3.44 3.40 3.33
Mean 3.19 3.25 3.41 3.37
CD0.05
N = 0.04 P = 0.04 NxP = 0.07
The interaction between nitrogen and phosphorus was found to be
significant. Maximum floret diameter (3.51 cm) was recorded with the treatment
combination N2P2 and found to be statistically at par with N2P3 (3.45 cm) and
N3P2 (3.44 cm). Whereas, the minimum floret diameter (3.16 cm) was observed
in N0P0 (control) and found to be at par with N1P0 (3.17 cm), N2P0 (3.19 cm) and
N3P0 (3.22 cm).
4.13 Number of flowering stems per plant
The data presented in Table -13. It revealed significant effect of N, P and
N×P on number of flowering stems per plant. Among the different doses of
nitrogen, N2 (200 kg N/ha) treated plants produced maximum number of
flowering stems per plant (2.13), which was statistically at par with N3 (300 kg
N/ha) producing (2.12) number of flowering stems. Whereas, minimum number
of flowering stems per plant (1.72) were produced in N0 (control).
In case of phosphorus, P2 (100 kg P2O5/ha) raised plant produced
maximum number of flowering stems per plant (2.04), which was found to be at
par with P3 (2.03). However, minimum number of flowering stems per plant
(1.93) were produced in P0 which was statistically at par with P1 (1.93).
The interaction (N×P) was found to be significant. Maximum number of
flowering stems per plant (2.23) produced in N2P2 followed by N2P3 (2.19)
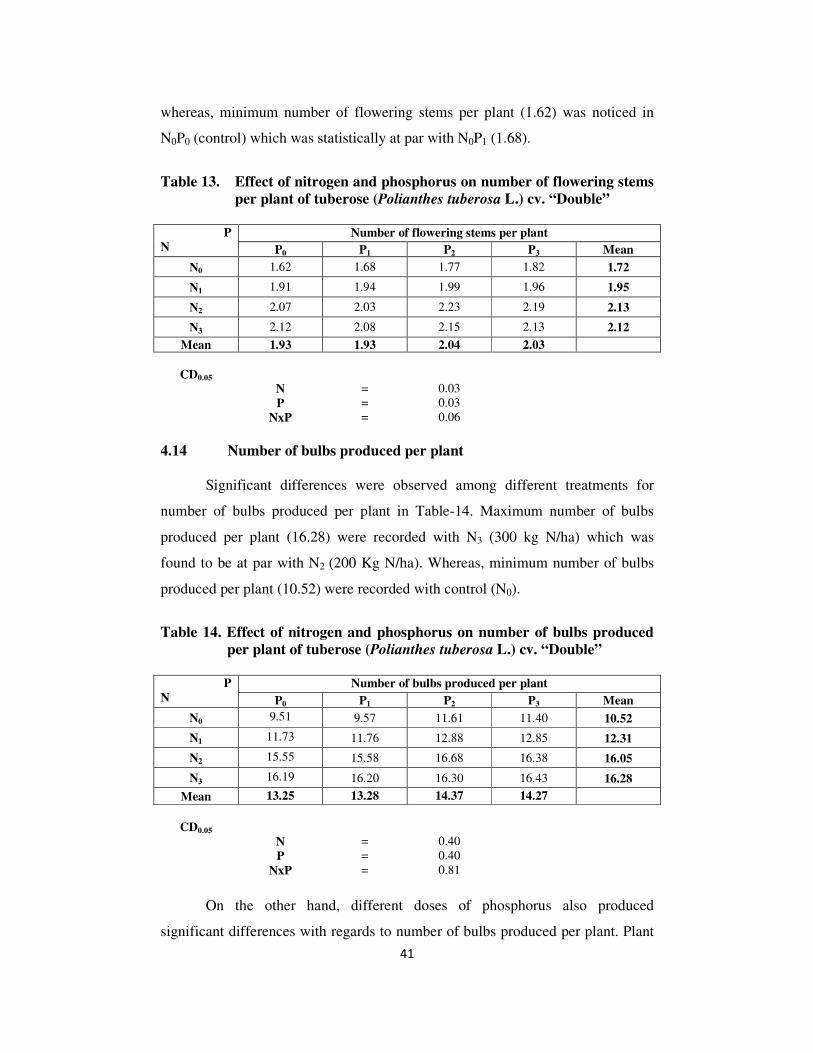
41
whereas, minimum number of flowering stems per plant (1.62) was noticed in
N0P0 (control) which was statistically at par with N0P1 (1.68).
Table 13. Effect of nitrogen and phosphorus on number of flowering stems
per plant of tuberose (Polianthes tuberosa L.) cv. “Double”
P
N Number of flowering stems per plant
P0 P1 P2 P3 Mean
N0 1.62 1.68 1.77 1.82 1.72
N1 1.91 1.94 1.99 1.96 1.95
N2 2.07 2.03 2.23 2.19 2.13
N3 2.12 2.08 2.15 2.13 2.12
Mean 1.93 1.93 2.04 2.03
CD0.05 N = 0.03 P = 0.03 NxP = 0.06
4.14 Number of bulbs produced per plant Significant differences were observed among different treatments for
number of bulbs produced per plant in Table-14. Maximum number of bulbs
produced per plant (16.28) were recorded with N3 (300 kg N/ha) which was
found to be at par with N2 (200 Kg N/ha). Whereas, minimum number of bulbs
produced per plant (10.52) were recorded with control (N0).
Table 14. Effect of nitrogen and phosphorus on number of bulbs produced
per plant of tuberose (Polianthes tuberosa L.) cv. “Double”
P
N
Number of bulbs produced per plant
P0 P1 P2 P3 Mean
N0 9.51 9.57 11.61 11.40 10.52
N1 11.73 11.76 12.88 12.85 12.31
N2 15.55 15.58 16.68 16.38 16.05
N3 16.19 16.20 16.30 16.43 16.28
Mean 13.25 13.28 14.37 14.27
CD0.05
N = 0.40 P = 0.40 NxP = 0.81
On the other hand, different doses of phosphorus also produced
significant differences with regards to number of bulbs produced per plant. Plant

42
supplied with P2 (100 kg P2O5/ha) recorded maximum number of bulbs produced
per plant (14.37) which was found statistically at par with P3 (14.27) and
minimum (13.25) were recorded in P0 (control) followed by P1 (13.28).
The interaction (N×P) effect was also recorded significant. Maximum
number of bulbs produced per plant (16.68) were recorded with N2P2 and found
to be statistically at par with N2P3, N3P3, N3P2, N3P1 and N3P0 whereas, N0P0
registered minimum number of bulbs produced per plant (9.51) which was
statistically at par with N0P1 (9.57).
4.15 Weight of bulbs per plant (g)
The data contained in Table-15 revealed that the weight of bulbs per plant
were influenced by different doses of N, P and their interaction (N×P). The effect
of different nitrogen doses was found to be significant. Maximum weight of bulbs
per plant (263.42 g) were observed in N3 (300 kg N/ha) whereas, the minimum
weight of bulbs per plant (143.34 g) were observed in N0 (control).
The phosphorus levels showed significant effects on weight of bulbs
produced per plant. P2 (100 kg P2O5/ha) recorded the maximum weight of bulbs
produced per plant (224.07 g). However, the minimum weight of bulbs (197.06 g)
were recorded in control (P0).
Table 15. Effect of nitrogen and phosphorus on weight of bulbs per plant
(g) of tuberose (Polianthes tuberosa L.) cv. “Double”
P
N Weight of bulbs per plant (g)
P0 P1 P2 P3 Mean
N0 124.38 126.65 162.72 159.60 143.34
N1 170.45 175.14 194.11 192.01 182.93
N2 230.30 231.42 276.03 268.51 251.56
N3 263.12 263.30 263.43 263.84 263.42
Mean 197.06 199.13 224.07 220.99
CD0.05 N = 1.18 P = 1.18 NxP = 2.37

43
The interaction of N×P had significant effect on weight of bulbs per plant.
The maximum weight of bulbs per plant (276.03 g) were recorded with N2P2 (200
kg N/ha + 100 Kg P2O5/ha). However, the minimum (124.38 g) weight of bulbs
per plant were recorded in N0P0 and found to be at par with N0P1 (126.65 g). [
4.16 Vase life (days)
Data for vase life as influenced by various levels of nitrogen, phosphorus
and their interaction have been presented in Table-16 and the corresponding
analysis of variance follows in Appendix-II.
Perusal of data in Table-16 depicts that application of 0 kg N/ha (N0)
recorded maximum vase life (9.77) followed by N1 (8.89 days) whereas,
minimum vase life (6.88 days) was recorded with N3.
Spikes from 150 kg P2O5/ha (P3) treatment were kept longest vase life
(8.80 days) which was found to be at par with P2 (8.61 days) and minimum vase
life (7.96 days) was noticed in P0 which was statistically at par with P1 (8.18
days).
Table 16. Effect of nitrogen and phosphorus on vase life of tuberose
(Polianthes tuberosa L.) cv. “Double”
P
N
Vase life
P0 P1 P2 P3 Mean
N0 9.45 9.56 10.01 10.05 9.77
N1 8.53 8.57 9.10 9.36 8.89
N2 7.75 7.90 8.12 8.23 8.00
N3 6.09 6.68 7.19 7.57 6.88
Mean 7.96 8.18 8.61 8.80
CD0.05 N = 0.30 P = 0.30 NxP = NS
Effect of N×P interaction on vase life of cut flowers of Polianthes
tuberosa cv. ‘Double’ was found to be non significant.

44
4.17 Available Nitrogen (kg/ha)
It is apparent from Table-17 revealed nitrogen and phosphorus levels
exerted significant influence on the available nitrogen content in soil.
Nitrogen had shown remarkable effect on available nitrogen content in
soil. The maximum amount of available nitrogen (457.55 kg/ha) was recorded in
N3 (300 kg N/ha) which was followed by N2 (424.50 kg/ha). Whereas, minimum
amount of available nitrogen (304.98 kg/ha) was recorded in N0 (control).
Amongst the phosphorus levels, the maximum amount of available
nitrogen (398.74 kg/ha) was noticed in P3 (150 kg P2O5/ha) followed by P2
(391.32 kg/ha). However, the minimum amount (370.99 kg/ha) of available
nitrogen in P0 (control).
The interaction effect between nitrogen and phosphorus levels on
available nitrogen in soil was found to be significant. Maximum (462.71 kg/ha)
amount of available nitrogen was observed in N3P3 (300 kg N/ha + 150 kg
P2O5/ha) followed by N3P2 (461.83 kg/ha) and N3P1 (458.69 kg/ha). Whereas,
minimum amount of available nitrogen (298.43 kg/ha) was recorded on N0P0
(control).
Table 17. Effect of nitrogen and phosphorus on available nitrogen (kg/ha)
in soil
P
N
Available nitrogen (kg/ha) P0 P1 P2 P3 Mean
N0 298.43 303.06 306.54 311.89 304.98
N1 337.46 353.93 360.27 371.32 355.75
N2 401.08 411.25 436.63 449.02 424.50
N3 446.97 458.69 461.83 462.71 457.55
Mean 370.99 381.73 391.32 398.74
CD0.05 N = 0.77 P = 0.77 NxP = 1.54
4.18 Available Phosphorus (kg/ha) It is evident from Table-18 that available P contents were significantly
influenced by application of N, P and N×P interaction.

45
Effect of different nitrogen doses depicted that maximum amount
available phosphorus (63.55 kg/ha) was recorded with N2 (200 kg N/ha) followed
by N3 (56.41 kg/ha) whereas, minimum amount of available phosphorus (35.81
kg/ha) was noticed in N0.
The effect of phosphorus indicates that plant raised in P3 (150 kg P2O5/ha)
were recorded maximum amount of available phosphorus (53.21 kg/ha) which
was statistically at par with P2 (52.62 kg/ha) and minimum amount of available
phosphorus (46.65 kg/ha) was recorded in P0 (control).
Table 18. Effect of nitrogen and phosphorus on available phosphorus
(kg/ha) in soil
P
N
Available phosphorus (kg/ha) P0 P1 P2 P3 Mean
N0 32.66 35.09 36.37 39.14 35.81
N1 40.65 43.54 48.26 49.49 45.48
N2 62.37 63.00 66.39 62.44 63.55
N3 50.93 53.49 59.48 61.75 56.41
Mean 46.65 48.78 52.62 53.21
CD0.05 N = 0.74 P = 0.74 NxP = 1.47
Interaction between N×P showed that maximum amount of available
phosphorus (66.39 kg/ha) content was noticed in N2P2 followed by N2P1 (63.00
kg/ha), N2P3 (62.44 kg/ha) and N2P0 (62.37 kg/ha), respectively. However,
minimum amount of available phosphorus (32.66 kg/ha) was observed in N0P0
(control).
4.19 Available Potassium (kg/ha)
Data registered for available potassium (K2O) in soil as affected by
various levels N, P and their interaction have been presented in Table-19. It
revealed that the effect of nitrogen, phosphorus and N×P on available potassium
in soil were found to be significant.
An application of 200 kg N/ha (N2) resulted in the maximum amount of
available potassium (185.20 kg/ha) in soil followed by N3 (164.12 kg/ha)

46
whereas, the minimum amount of available potassium (124.44 kg/ha) was found
in N0 (control).
In case of phosphorus application the maximum amount of available
potassium (160.97 kg/ha) was recorded with 150 kg P2O5/ha (P3) followed by P2
(158.13 kg/ha) whereas, the minimum amount of available potassium (149.08
kg/ha) was found in P0 (control).
Table 19. Effect of nitrogen and phosphorus on available potassium (kg/ha)
in soil
P
N
Available potassium (kg/ha) P0 P1 P2 P3 Mean
N0 117.39 121.99 126.32 132.04 124.44
N1 138.76 145.13 151.19 157.45 148.13
N2 179.82 182.07 192.52 186.40 185.20
N3 160.34 165.68 162.50 167.98 164.12
Mean 149.08 153.72 158.13 160.97
CD0.05
N = 1.50 P = 1.50 NxP = 2.99
Interaction N×P was found to be significantly affects the available
potassium (K2O) in soil. Maximum amount of available potassium (192.52 kg/ha)
was recorded in combined dose of 200 kg N/ha and 100 kg P2O5/ha (N2P2)
followed by N2P3 (186.40 kg/ha) and N2P1 (182.07 kg/ha) whereas, minimum
amount of available potassium (117.39 kg/ha) was noticed in N0P0 (control).
4.20 Economics of different treatments (per m2) It is evident from the Table-20 that the highest benefit cost ratio (2.69)
was recorded with T11 (200 kg N/ha+100 kg P2O5/ha) and followed by (2.61) in
T12 (200 kg N/ha+150 kg P2O5/ha). However, all the other treatments also
superior over the control. The lowest cost benefit ratio was recorded in control T1
(1.24). The labour charges of Rs 120/day have been taken an average basis
however, these charge vary from region to region and place to place but the
procedure for benefit cost ratio is same. The maximum net return (Rs. 246.53/m2)
and benefit cost ratio (2.69) was recorded with T11 (200 kg N/ha+100 kg P2O5/ha)
followed by T12 and least cost net return (Rs.113.00/m2) and benefit cost ratio
(1.24) recorded in T1 (control).

47
Table 20. Economics of different doses of N and P on tuberose cv. Double
Treatment Marketable Yield
(Numbers)
Total cost of
cultivation
treatment wise
(Rs/m2)
Gross income
(Rs/m2 )
Total gross
income (a+b)/m2
(Rs/m2)
Net profit
(Rs/m2)
B:C
Ratio
Spikes Bulbs Spike (a) Bulbs (b)
T1 (control) 25.92 152.16 91.00 51.84 152.16 204.00 113.00 1.24
T2 (0kg N/ha+ 50kg P2O5/ha) 26.88 153.12 91.24 53.76 153.12 206.88 115.64 1.27
T3 (0kg N/ha+ 100kg P2O5/ha) 28.32 185.76 91.48 56.64 185.76 242.40 150.92 1.65
T4 (0kg N/ha+ 150kg P2O5/ha) 29.12 182.40 91.72 58.24 182.40 240.64 148.92 1.62
T5 (100kg N/ha+ 0kg P2O5/ha) 30.56 187.68 91.12 61.12 187.68 248.80 157.68 1.73
T6 (100kg N/ha+ 50kg P2O5/ha) 31.04 188.16 91.36 62.08 188.16 250.24 158.88 1.74
T7 (100kg N/ha+ 100kg P2O5/ha) 31.84 206.08 91.60 63.68 206.08 269.76 178.16 1.94
T8 (100kg N/ha+ 150kg P2O5/ha) 31.36 205.60 91.84 62.72 205.60 268.32 176.48 1.92
T9 (200kg N/ha+ 0kg P2O5/ha) 33.12 248.80 91.23 66.24 248.80 315.04 223.81 2.45
T10 (200kg N/ha+ 50kg P2O5/ha) 32.48 249.28 91.47 64.96 249.28 314.24 222.77 2.44
T11 (200kg N/ha+100kg P2O5/ha) 35.68 266.88 91.71 71.36 266.88 338.24 246.53 2.69
T12 (200kg N/ha+150kg P2O5/ha) 35.04 262.08 91.95 70.08 262.08 332.16 240.21 2.61
T13 (300kg N/ha+ 0kg P2O5/ha) 33.92 259.04 91.35 67.84 259.04 326.88 235.53 2.58
T14 (300kg N/ha+ 50kg P2O5/ha) 33.28 259.20 91.59 66.56 259.20 325.76 234.17 2.56
T15 (300kg N/ha+100kg P2O5/ha) 34.40 260.80 91.83 68.80 260.80 329.60 237.77 2.59
T16 (300kg N/ha+150kg P2O5/ha) 34.08 262.88 92.07 68.16 262.88 331.04 238.97 2.60

Chapter-5
DISCUSSION
The experimental results of the present study entitled “Effect of nitrogen
and phosphorus on growth and flowering in tuberose (Polianthes tuberosa
L.) cv. Double” have been elaborated in the preceding chapter. In this chapter
attempt has been made for discuss the experimental results in the light of
available literature and classical knowledge under following heads:
1. Vegetative growth parameters
2. Floral parameters
3. Underground Parameters
4. Available soil nutrient N, P and K
5. Cost of cultivation of tuberose per m2
1. GROWTH PARAMETERS
Sprouting period of bulbs was significantly reduced with the application
of increasing doses of nitrogen (5-6 days) and phosphorus (2-3 days) in alone and
in combination (9-10 days) over the control. Early sprouting in tuberose with
high doses of nitrogen, phosphorus and their interaction might be due to the
stimulation of bulbs by comparatively high nutrient availability (N and P) and
their respective absorption through bulbs surface and primary roots. The findings
of the research are in agreement with the research of Bankar and Mukhopadhyay,
(1990) and Singh et al. (1976). Dahiya et al. (2001) also opined the same reason
for the hastening of sprouting in tuberose with increased application of nitrogen
and phosphorus doses.
The per cent sprouting of tuberose bulbs increase significantly with the
increasing doses of nitrogen, phosphorus and their interaction which may be due
to the higher availability of nitrogen and phosphorus which resulted in maximum
sprouting of tuberose bulbs. These findings are in close agreement with the
earlier findings of Sukhda (1999) when he has worked on biofertilizers.

49
The application of nitrogen and phosphorus exhibited positive correlation
with the plant height and consequently the plant height increased with the
increasing doses of nitrogen and phosphorus in alone as well as in combination.
Nitrogen, a constituent of protein and is essential for formation of protoplasm,
cell division and cell enlargement and also increase the chlorophyll content in
leaves, while phosphorus a part of nucleic acids and also responsible for root
development and hence the combined effect of higher availability of both
nutrients in plant vicinity enhance the vegetative growth of the plant. The present
findings get the support of work of Dahiya et al. (2001) and Yadav et al. (2005a).
Application of nitrogen and phosphorus interacted positively with the
plant height and number of leaves per plant. The increase in the doses of nitrogen
and phosphorus significantly enhanced the plant height and number of leaves per
plant of tuberose. Nitrogen, a constituent of protein is essential for formation of
protoplasm, cell division and cell enlargement and also increase the chlorophyll
content in leaves, while phosphorus a part of nucleic acids and also responsible
for root development and hence the combined effect of higher availability of both
nutrients in plant vicinity enhanced the vegetative growth of the plant. The results
are in line with the findings of Dahiya et al. (2001), Yadav et al. (2005a) and
Devi and Singh (2010).
2. FLORAL PARAMETERS
Spike emergence in tuberose hastens with the increased level of nitrogen,
phosphorus and their respective combinations. Least time for spike emergence
(98.81 days) was taken with the treatment 200 kg N/ha and 100 kg P2O5/ha which
was significantly less than that of the control i.e. N0P0 (113.77 days). The earlier
emergence of spikes with higher doses of nitrogen and phosphorus in alone and
in combination might be due to the higher absorption of nitrogen and phosphorus
by bulbs or primary roots leading for the more stimulation of bulb metabolism
and hence the early emergence. According to Marschner (1983) a balanced
supply of nitrogen and phosphorus promotes the translocation of phytohormones
to the shoots, which probably induced the early flower initiation/spike
emergence. The results are in agreement with the work of Bankar and

50
Mukhopadhyay (1990). Similar results have also been documented by Kashyap
(2010) who reported better floral attributes with the application of nitrogen,
phosphorus and biofertilizers alone or in combination in tuberose cv. ‘Double’.
Various levels of nitrogen and phosphorus application and their
interaction resulted in reduction variation in the number of days taken for the
basal floret opening in comparison to control. The treatment N2P2 (200 N + 100
P2O5 kg/ha) reduced time taken for the basal floret opening (i.e. 119.10 days)
significantly over the control i.e. N0P0 treatment (124.40 days). Reason for earlier
basal floret opening must be increased phytostimulation by the higher nitrogen
and phosphorus levels in alone and in combination and ultimately leading for fast
growth and flowering in less time. The present results got support from the work
of Jana et al. (1974), Gowda et al. (1991) and Singh et al. (2005) in tuberose. The
similar results have been documented by Daft and Okuryna (1973) in petunia, our
findings are also in close agreement with the earlier work of Kashyap (2010) and
Tripathi et al. (2012) in tuberose cv. ‘Double’.
Spike length, rachis length and number of florets per spike are also
positively influenced by the increasing doses of nitrogen, phosphorus and their
interactions. Maximum values for these parameters were recorded with the
application of N2P2 (200 N + 100 P2O5 kg/ha). The enhanced spike length, rachis
length and increased number of florets per spike might be due to the
improvement in plant metabolism i.e. higher amino acid production, chlorophyll
formation at faster rate, transformation of carbohydrates, translocation of
phytoharmones more quickly and efficiently and stimulation of more nutrient
absorption through primary roots. There more growth because of higher
availability of nitrogen and phosphorus in the soil particularly in the vicinity
plants. Similar results have also been reported by Kumar and Singh (1998),
Sharma et al. (2008), Tripathi et al. (2012) and Devi and Singh (2010) in
tuberose.
The higher levels of N, P and combination of both positively influenced
the fresh weight of spike as well as weight of the 100 florets and recorded higher

51
values with the treatment N2P2 (70.89 g and 179.71 g, respectively). Similar
trends of increase in weight of spikes and weight of 100 florets were also
reported by Sharma et al. (2008), Singh et al. (1976), Yadav et al. (1985) and
Chaudhary et al. (2007) in tuberose. Significant increase in the fresh weight of
spike and weight of 100 florets may be due to the higher availability of nitrogen
and phosphorus that induced positive growth both vegetative as well as the floral.
Floral diameter and number of florets per plant also followed similar
trends i.e. maximum floret diameter and flowering stems per plant were observed
with the application of N2P2 (3.51 cm and 1.44). Most probable reason for the
increased floral size and flowering stems per plant is the positive influence of
higher N, P and their interaction on the growth and development of plants. The
results are in conformity to those of Nanjan et al. (1980), Gowda et al. (1991)
and Parthiban and Khader (1991).
Maximum vase life of cut spikes of tuberose cv. ‘Double’ was noticed
without application of nitrogen. It may be due to the fact that the higher doses of
nitrogen increased ABA concentration in the leaves and the petals which
probably resulted in poor vase life. The results are in conformity with the finding
made by Joiner and Smith (1962), Rober (1971) and Lodhi et al. (1991) for
various cultivars of chrysanthemum. Beneficial effects of nitrogen on vase life of
cut flowers have been reported by other workers viz, Viradia and Singh (2002)
and Gaurav et al. (2002) in roses and gerberas. Maximum vase life of cut spikes
of tuberose cv. ‘Double’ was achieved with P3 (150 kg/ha). Lodhi et al. (1991)
observed the longer life of cut flowers of chrysanthemum cv. ‘Flirt’, with the
higher doses of phosphorus. However, the differences observed in the rate of
phosphorus applications for the above flowering parameters seemed to be due to
variety of soils in use and also variation in Physico-chemical properties.
3. UNDERGROUND PARAMETERS
The number and weight of bulbs per plant increased significantly with the
increasing levels of nitrogen and phosphorus in alone and in combination.
Maximum number of bulbs and maximum weight of bulbs per plant were
recorded with the application of N2P2 (i.e. 16.68 bulbs per plant and 276.03 g

52
bulb weight per plant) which is significantly higher than that of control N0P0 (i.e.
9.51 bulbs per plant and 124.38 g bulbs weight per plant).
The increase in weight and number of bulbs per plant with the increase in
dose N, P and their combination may be because both principle inorganic
nutrients are structural and physiological constituent of plant and with increased
availability of those to the plant enhanced the vegetative plant growth which in
turn leads to superior bulb quality. Similar trends have also been reported earlier
by Devi and Singh (2010), Singh et al. (1996b), Yadav et al. (2005b) and Sharma
et al. (2008) in tuberose.
4. AVAILABLE N, P AND K NUTRIENT CONTENT IN THE SOIL
The availability of N, P and K increased with the increasing levels of
nitrogen, phosphorus and their combination. Availability of nitrogen in soil was
reported maximum for the treatment N2P2 (461.71 kg/ha) which is in the medium
range. Availability of phosphorus in the soil also showed same progression i.e.
maximum for treatment N2P2 (66.39 kg/ha) which is in extremely higher range.
Increased availability of the nitrogen and phosphorus is due to their higher
application in soil besides being attributed by the environmental fixations in case
of nitrogen as well as action of natural microflora of soil both on nitrogen and
phosphorus sources applied to soil. The results are in agreement with the findings
reported by Singh et al. (2000) and Bankar and Mukhopadhyay (1990) in
tuberose.
5. COST OF CULTIVATION OF TUBEROSE PER M2
Higher cost (Rs. 91.95/m2) was incurred with (200 kg N/ha+150 kg
P2O5/ha) and minimum (Rs. 91.00/m2) in control followed by T5. This was due to
the fact that cost of nitrogen and phosphorus is very high as compared to other
treatments because the dose of nitrogen and phosphorus is more so that the cost
of treatment is also more. Consequently, net profit gained was also higher in
treatments T11 as compared to control. Maximum sale returns (Rs. 338.24/m2)
and maximum net profit (Rs. 246.53/m2) was gained in T11 and minimum sale
returns (Rs. 204.00/m2) as well as net profit (Rs. 113.00/m2) in control.

Chapter-6
SUMMARY AND CONCLUSION
The present investigation entitled “Effect of nitrogen and phosphorus
on growth and flowering in tuberose (Polianthes tuberosa L.) cv. ‘Double”
was conducted at the department of Floriculture and Landscaping, Dr. Y.S.
Parmar University of Horticulture and Forestry, Nauni, Solan (H.P.) during 2011.
The experiment comprises of sixteen treatments laid out in a factorial randomized
block design with three replications.
The results obtained from the present investigation and conclusion drawn
are summarized as under:
1. Increasing levels of nitrogen and phosphorus had reduced the sprouting
period of tuberose. Minimum number of days taken for sprouting was
recorded in N3P3 (300 kg N/ha + 150 kg P2O5/ha). This treatment was
statistically at par with N3P2 (300 kg N/ha + 100 kg P2O5/ha).
2. Per cent sprouting of bulbs were increased with application of nitrogen
and phosphorus. Maximum per cent of bulbs was noticed with N2P2 (200
kg N/ha + 100 kg P2O5/ha) which was statistically at par with N2P0, N3P0,
N2P1and N3P1. However, minimum per cent sprouting of bulbs was
observed with N0P1 (0 kg N/ha + 50 kg P2O5/ha).
3. The application of nitrogen N2P2 (200 kg N/ha + 100 kg P2O5/ha) was the
most efficacious in enhancing growth characteristics. Maximum plant
height (48.38 cm) and number of leaf per plant (47.59) were recorded in
this combination and minimum plant height (41.89 cm) and minimum
number of leaves per plant (35.20) were noticed with control.
4. Days taken for spike emergence and number of days taken for basal
florets opening was decreased with the application of nitrogen and
phosphorus. Minimum days taken for spike emergence (98.81 days) and

54
number of days taken for basal florets opening (119.10 days) were
recorded in N2P2 (200 kg N/ha + 100 kg P2O5/ha). Whereas, maximum
days taken for spike emergence in (113.77 days) and number of days
taken for basal florets opening (124.40 days) was observed with control.
5. Maximum spike length (80.88 cm), number of florets per spike (30.48)
and rachis length (29.95 cm) was observed with N2P2 (200 kg N/ha + 100
kg P2O5/ha). Maximum fresh weight of spikes (70.89 g) and fresh weight
of 100 florets (179.71 g) were also recorded with the same treatment.
6. An increase in N and P doses increased the floret diameter and number of
flowering stem per plant significantly. The longest floret diameter (3.51
cm) and maximum number of flowering stem per plant (2.23) was noticed
with N2P2 (200 kg N/ha + 100 kg P2O5/ha).
7. The average number of bulbs produced per plant and weight of bulbs per
plant were increased with increasing level of nitrogen and phosphorus.
Maximum number of bulbs (16.68) produced and weight of bulb per plant
(276.03 g) was obtained with N2P2 (200 kg N/ha + 100 kg P2O5/ha) and
minimum in control (N0P0).
8. Maximum vase life (10.05 days) was recorded with N0P3 (0 kg N/ha +
150 kg P2O5/ha). However, minimum vase life (6.09 days) was noticed in
N3P0 (300 kg N/ha + 0 kg P2O5/ha).
9. The maximum amount of available nitrogen (462.71 kg/ha), phosphorus
(66.39 kg/ha) and potassium (192.52 kg/ha) were obtained with the
application of N2P2 (200 kg N/ha + 100 kg P2O5/ha). However, minimum
amount of available N, P and K was noticed in control (N0P0).
10. The maximum net return (Rs. 246.53/m2) and benefit cost ratio (2.69) was
recorded with T11 (200 kg N/ha+100 kg P2O5/ha) followed by T12 and
least cost net return (Rs.113.00/m2) and benefit cost ratio (1.24) recorded
in T1 (control)

55
CONCLUSION
Application of nitrogen and phosphorus increased most of the vegetative
growth, flowering, multiplication of bulbs and maximum benefit cost ratio
besides increasing the availability of macro nutrient in the soil. So, from the
present investigation it can be concluded that nitrogen and phosphorus at
optimum dose should be applied to get the desired results.
The application of 200 kg N/ha + 100 kg P2O5/ha (N2P2) was found to be
optimum for the most of the characters of tuberose under evaluation.

Chapter-7
REFERENCES
Addai I K. 2010. Growth and biochemistry of the common hyacinth (Hyacinthus
orientalis L.) and the lily (Lilium longiflorum L.). PhD Thesis, Biology, University of Sussex, UK.
Addai I K. 2011. Influence of cultivars or nutrients application on growth, flower production and bulb yield of the common Hyacinth. American Journal of
Scientific and Industrial Research 2(2): 229-245.
Ailincai N. 1960. The influence of some fertilizers on flowering of Polianthes
tuberosa. Lucrari Stintifica Institutional Agronomy 355-360
Arora J S. 1998. Bulbous plants. In: Introductory Ornamental Horticulture. Kalyani Publishers, New Delhi.138-148p.
Ashok S H, Sujatha K and Prabhakar M. 1995. Growth, yield, water relation and its use in tuberose (Polianthes tuberosa L.) as influenced by irrigation regime and nitrogen level. Indian Journal of Agricultural Sciences 65 (12): 866-869.
Balak Ram, Katiyar R S, Tewari S K and Singh C P. 1999. Effect of nitrogen and plant spacing on the growth and flower yield of tuberose (Polianthes
tuberosa) cv. ‘Single’ on sodic soils. Journal of Medicinal and Aromatic
Plant Sciences 21(4): 959-962.
Bankar G J and Mukhopadhyay A.1990. Effect of NPK on growth and flowering in tuberose cv. ‘Double’. Indian Journal of Horticulture 47(1): 120-126.
Barman G, Chanda S and Roychoudhary N. 1998. Production of Corms and Cormels of Gladiolus through application of N, P and K. Horticulture Journal 11: 87–92.
Bhattacharjee S K. 1981. Influence of Nitrogen phosphorus and potassium fertilization on flowering and corm production in gladiolus. Singapur Journal
of Primary Industries 9(1):23-27.
Borrelli A. 1984. Planting density and nitrogen fertilizing in the cultivation of gladiolus in summer and autumn. Horticultural Abstract 57 (6):440-445.
Brady N C. 1996. Nitrogen and sulphur economy of soils. In: Nature and Properties of Soils. Tenth edition. Prentice-Hall of India Pvt. Ltd. New Delhi.110001. 315pp.
Chaudhary S S. 2007. Effect of nitrogen, phosphorus and bio-fertilizer application on plant growth and bulb production in tuberose. Haryana
Journal of Horticultural Sciences 36(1/2): 82-85.

57
Cirrito M and Vita M De. 1980. A comparison of three different planting densities for increasing the size of gladiolus corms. Ann. Dell. Inst. Speri.
Flori. 11(1): 169-194.
Daft M J and Okusnya B O. 1973. Effect of endogene mycorrhizas on plant growth VI: Influence of infection on the anatomy and reproductive development in four hosts. New Phytologist 72: 1333-1339.
Dahiya S S, Mohansundram S, Singh S and Dahiya D S. 2001. Effect of nitrogen and phosphorus on growth and dry matter yield of tuberose (Polianthes
tuberosa L.). Haryana Journal of Horticultural Sciences 30(3/4): 198-200.
Damke M M, Jadhao B J, Hedau C V and Patil S V. 1997. Effect of nitrogen phosphorus fertilization on post harvest life of chrysanthemum
(chrysanthemum Coronarium) cv. Yellow Bijali. P K V Research Journal 21(2):188-190.
Desai N, Vasundhara M and Biradar S L. 2005. Studies on rate of bulb multiplication in tuberose (Polianthes tuberosa L.) cv. Shringar as affected by spacing and fertilizer levels. Mysore Journal of Agricultural Sciences 39(3): 379-384.
Desh Raj. 2011. Ornamental bulbous plants. In: Floriculture at a glance. Kalyani Publishers, Ludhiana, India. 268-280 pp.
Deswal K S, Patil V K and Anserwadekar K W. 1983. Nutritinal and plant population studies in gladiolus. Indian Journal of Horticulture 40(3/4): 254-259.
Devecchi M. and Barni E.1997. Effect of fertilizers on the colour of gladiolus spikes. Culture Protette 26: 79–82.
Devi K L and Singh U C. 2010. Effect of nitrogen on growth, flowering and yield of tuberose (Polianthes tuberose L.) cv. Single. Journal of Ornamental
Horticulture 30(3):228-232.
Donahue R L, Shickuna J C and Robertson L S. 1958. Soils and plant nutrition. In: Soils–An introduction to soils and plant growth. Third edition, Prentice – Hall Inc. Englez Wood Cliffs, New Jersey 222-241p
Gomez K A and Gomez A A. 1984. Statistical procedures for agricultural research. John Wiley and Sons. Inc., New York pp. 357-427.
Gopalakrishnan M, Sadawarte K T, Mahorkar V K, Jadhao B J and Golliwar V J. 1995. Effect of N, P and K on the quality of tuberose (Polianthes tuberosa L.) cv. ‘Single’. Journal of Soils and Crops 5(2): 148-150.
Gowda J V N, Jacob S and Huddar A G. 1991. Effect of N, P and K on growth and flowering of tuberose (Polianthes tuberosa Linn.) cv. ‘Double’. Indian
Perfumer 35(2): 100-101.
Gupta R R, Shukla M and Kumar S. 2006. Effect of nitrogen and phosphorus on flowering of tuberose (Polianthes tuberosa L.). Crop Research Hisar 32(3): 539-541.

58
Gurav S B, Singh B R, Katwate S M and Yadav E D. 2002. Standardization of fertilizer does for flower production of gerbera under protected condition. In: Floriculture Research Trend in India (ed.), 313-314pp.
Haider M M, Rai M V and Murthy A S.1981. Effect of nitrogen on growth and development of gladiolus. Indian Journal of Horticulture 38(3/4): 241-245.
Haitbura P and Misra R L. 1999. Effect of nitrogen sources on vegetative and floral characters of gladiolus cv. Dhanvantari. Journal of Ornamental
Horticulture New Series 2: 111–114.
Hamit Altay, Canan Öztokat, Mürsel Güven. (2001). Effect on Yield and Quality of varying Applications of nitrogen and phosphorus to Greenhouse Cultivation of Freesia Hybrida. Çanakkale Onsekiz Mart University.
Jackson M L. 1973. Soil Chemistry Analysis Prentice Hall of India Private Limited, New Delhi, India, pp.151-154.
Jana B K, Roy S and Bose T K. 1974. Studies on the nutrition of ornamental plants. III. Effect of nutrition on growth and flowering of dahlia and tuberose. Indian Journal of Horticulture 31(2): 182-185.
Joiner J N and Smith T C. 1962. Effect of nitrogen and potassium levels on growth and flowering response on chrysanthemum morifolium cv. ‘Blue Chip’ grown in sand culture. Proceedings American Society for Horticultural
Science 80: 571-580.
Kadu A P, Kadu P R and Sable A S. 2009. Effect of nitrogen, phosphorus and potassium on growth, flowering and bulb production in tuberose cv. ‘Single’. Journal of Soils and Crops 19(2): 367-370.
Kashyap R. 2010. Integrated nutrient management studies in tuberose (Polianthes
tuberosa L.) M Sc. Thesis Dr. Y. S. Parmar University of Horticulture and forestry, Nauni, Solan (H.P.), India.
Khan M A and Ahmad I. 2004. Growth and flowering of Gladiolus hortulanus L. cv. Wind Song as influenced by various levels of NPK. International Journal
of Agriculture and Biology 6(6): 1037-1039.
Kishore G R and Singh P V. 2006. Effect of N, P and K fertilization on vegetative growth of tuberose (Polianthes tuberosa L.) cv. ‘Single’. Plant
Archives 6(1): 377-378.
Kumar R, Gobind S and Yadav D S. 2002. Studies on N and P requirement of tuberose (Polianthes tuberosa Linn.) cv. Single in hilly soils. Haryana
Journal of Horticultural Sciences 31(1/2): 52-54.
Kumar S and Singh R P.1998. Effect of nitrogen, bulb size and spacing on bulb and bulblet production of tuberose (Polianthes tuberosa L.). South Indian
Horticulture 46(3/6): 294-298.
Lodhi A K S, Tewari G N and Pathak R K. 1991. Effect of nitrogen and phosphorus application on vase-life of cut flowers of chrysanthemum
(chrysanthemum morifolium Ram). The Hort. J. 4(1):49-51.
59
Mahgoub H M, Rawia A E and Lila B H A. 2006. Response of Iris bulbs grown in sandy soil to Nitrogen and potassium fertilization. Journal of applied
science research 2(11):899-903.
Marschner H. 1983. Introduction to the mineral nutrition of ornamental plants. Hand book Plant physiol. 154: 31-38.
Merwin H D and Peech M. 1951. Exchangeable of soil potassium in the sand, silt and clay fractions as influenced by nature of the complimentary exchangeable cations. Soil Science American Proceedings 15: 125-128.
Militu A, Vierasu E and Iliescu.1970. The influence of chemical fertilizers on flower quality and bulb production in tuberose growing. Lucrari Stintifica,
Institutional Agronomic ‘N. Balacesen, B 13:115-20.
Mishra M, Mohapatra A and Mohanty C R.2002. Effect of N, P and spacing on tuberose. In: Proceedings of the National Symposium on Indian Floriculture
in the New Millennium, Lal Bagh, Bangalore, 25-27-February. 338-339pp.
Mishra R L and Singh B. 1989. Gladiolus. In: Commrcial Flowers, Eds., Bose, T K. and Yadav, L. P. Naya.
Mohanasundaram S, Dahiya S S and Singh S. 2003. Effect of nitrogen and phosphorus on the nutrient content of tuberose (Polianthes tuberosa L.). Haryana Journal of Horticultural Sciences 32(1/2): 64-66.
Mohanty B K, Sankar C R and Dayanand T. 1999. Effect of NPK and spacing on nutrient content of leaves and uptake in tuberose (Polianthes tuberosa L.). South Indian Horticulture 47(1/6): 327-330.
Motial V S. (1973). Report of the work on tuberose presented at the Second Workshop in Floriculture (ICAR).
Mukesh K, Chattopadhyay T K and Kumar M. 2001. Effect of NPK on yield and quality of gladiolus (Gladiolus grandiflorus) cv. Tropic sea. Environment
and Ecology 19: 868–871.
Mukhopadhyay A and Banker G J. 1978. Effect of N, P and K on flower and bulb production and keeping quality of flowers and bulbs of tuberose (Polianthes
tuberose Linn.). XX International Horticultural congress, Sydney, Australia. 15:23 Abstract No. 1913.
Mukhopadhyay A and Banker G J. 1986. Studies on nutritional requirement of tuberose. South Indian Horticulture 34(3): 167-172.
Mukhopadhyay A. 1984. Nutritional studies in gladiolus cv. Vink’s Glory. All India Coordinated Floriculture Improvement Project. ICAR, New Delhi, India.
Nair S A, Attri B L and Sharma T V R S. 2000. Effect of N and P on growth and flowering of tuberose (Polianthes tuberosa L.). Journal of Tropical
Agriculture 38(1/2): 66-68.

60
Nanjan K, Nambisan K M P, Veeraragavathatham D and Krishnan B M.1980. The effect of nitrogen, phosphorus and potash on the yield of tuberose (Polianthes tuberosa L.). National Seminar on Production Technology for
Commercial Flower Crops. 76-78.
Olsen S R, Cole C V, Watanabe F S and Dron L A. 1954. Estimation of available phosphorus by extraction with sodium with bi-carbonate. USDA. Circular. 939: 19.
Pandey R K, Rathore P, Singh M K and Rathore P. 2000. Effect of different levels of N and P on growth of Gladiolus under Agra conditions. Journal of
Ornamental Horticulture 3: 60–61.
Parthiban S and Khader M A.1991. Effect of N, P and K on yield components and yield in tuberose. South Indian Horticulture 39(6): 363-367.
Parthiban S, Khader M A and Thamburaj S. 1992. Effect of N, P and K on growth and development of tuberose (Polianthes tuberosa L.). South Indian
Horticulture 40(3): 166-171.
Patel B M, Patel B N and Patel R L. 1997. Effect of spacing and fertilizers levels on growth and yield of tuberose (Polianthes tuberosa L.) cv. Double. Journal
of Applied Horticulture 3(1/2): 98-104.
Patel M M, Parmar P B, Parmar B R.2006. Effect of nitrogen, phosphorus and spacing on growth and flowering in tuberose (Polianthes tuberosa L.) cv. ‘Single’. Journal of Ornamental Horticulture 9(4): 286-289.
Patil K D, Dabake D J and Gokhle N B. 2007. Integrated plant nutrient management in tuberose cv. Single in lateritic soil of Konkan. Journal of
Maharashtra Agricultural Universities 32(2): 189-191.
Patil P R and Reddy B S. 2002. Flowering and flower quality in tuberose as influenced by community planting and fertilizer levels. Journal of
Mahasashtra Agriculture Universities 27(1): 31-34.
Patil P R, Reddy B S, Patil S R and Kulkarni B S. 1999. Effect of community planting and fertilizers levels on growth and flower yield of tuberose (Polianthes tuberosa L.) cv. Double. South Indian Horticulture 47(1/6): 335-338.
Rajwal N and Singh R K.2006. Effect of different levels of nitrogen on the performance of tuberose (Polianthes tuberosa L.) cv. ‘Double’. International
Journal of Plant Sciences 1(1): 111-112.
Randhawa G S and Mukhopadhya A.1986. Commercial Floriculture.In: Floriculture in India.34/1 Meanee Avenue Road, Bangalore 560042. 344 – 425pp.
Rober R. 1971. Gartenbauwiss. 36:189-200.
Roy R K, Sharma S C, and Sharga A N. 1995. Effect of foliar nutrition on vegetative and floral characters of gladiolus. Journal of Ornamental
Horticulture 31: 41–44.

61
Sadhu M K and Bose T K. 1973. Tuberose for most artistic gardens. Indian
Journal of Horticulture 18(3): 17-21.
Salisburry F B and Ross C W.1992. Mineral nutrition. In: Plant physiology. Fourth edition. Cengage Learning India Pvt. Ltd. New Delhi – 110092.
Shah A, Lal S D and Seth J N.1984. Effect of different level of nitrogen and phosphorus on growth, flowering and corm yield of of gladiolus cv. Vinks Glory. Progressive Horticulture 16(3-4):305-307.
Sharma J R, Panwar R D, Gupta R B and Singh S. 2008. Nutritional studies in tuberose (Polianthes tuberosa L.). Haryana Journal of Horticultural Sciences 37(1/2): 85-86.
Sharma R K and Mohammad S. 2004. Influence of graded levels of nitrogen and sulphur on growth, flowering and essential oils content in tuberose cultivar Maxican Single. Journal of Ornamental Horticulture 7(1):52-57.
Sidhu, G S and Arora J S. 1989. Response of gladiolus varieties to nitrogen application. Indian Journal of Horticulture 46 (2): 250-54.
Singh A and Godara N R.1995.Studies on the nutritional requirement of tuberose (Polianthes tuberosa L.) cv. ‘Single’ during growth. Haryana Agricultural
University Journal of Research 25: 171-174.
Singh A and Godara N R.1998. Effect of nutritional requirement of tuberose (Polianthes tuberosa L.) cv. ‘Single’ on flower yield characters. Haryana
Agricultural University Journal of Research 28(1): 15-20.
Singh A, Godara N R and Gupta A K. 2000. Effect of nitrogen, phosphorus and potash application on N.P.K. content in leaves and bulbs of tuberose (Polianthes tuberosa L.). Haryana Journal of Horticultural Sciences 29(1/2): 27-29.
Singh A, Godara N R and Kumar A.1996a. Effect of NPK on flowering and flower quality of tuberose (Polianthes tuberosa L.) cv. ‘Single’. Haryana
Agricultural University Journal of Research 26(1): 43-49.
Singh A, Godara N R and Kumar A.1996b. Effect of NPK on bulb production in tuberose (Polianthes tuberosa L.) cv.‘Single’. Haryana Agricultural
University Journal of Research 26(3): 187-190.
Singh R S, Motial V S and Singh L B.1976. Effect of nitrogen, phosphorous and potash fertilization on tuberose. Indian Journal of Horticulture 33:289-294.
Singh S R P, Kumar D and Singh V K.2004 Effect of NPK combinations on growth and flowering of tuberose (Polianthes tuberosa L.) cv. ‘Double’. Plant Archives 4(2): 515-517.
Singh S, Godara, M R and Sharma, B P.2005. Effect of VA-mycorrhizae, nitrogen and phosphorus on growth and flowering in tuberose (Polianthes tuberosa L.). Integrated Plant Disease Management 39: 241-245.

62
Sita Ram, Attri B L, Sharma T V R S and Anil Kumar A. 1997. Standardization of agro-techniques in tuberose under Andman conditions In: Effect of nitrogen on growth and flowering. Journal of Ornamental Horticulture 5(1-2):1-6.
Subbiah B V and Asija G L. 1956. A rapid procedure for estimation of available nitrogen in soils. Current Science 25: 259-260.
Sukhda M.1999. Biofertlizers for horticultural crops. Indian Horticulture, (Jan-March): 32-35.
Sultana S, Khan F N, Haque M A, Akhter S and Noor S. 2006. Effect of NPK on growth and flowering in tuberose. Journal of Subtropical Agricultural
Research and Development 4(2): 111-113.
Swaminathan V, Ramaswami N and Pillai O A A. 1999. Effect of Azospirillum, phosphobacteria and inorganic nutrients on the growth and yield of tuberose. South Indian Horticulture 47(1-6): 331-334.
Talukdar M C, Baruah N and Mahanta. S. 2003. Response of graded levels of NPK on yield and quality of tuberose (Polianthes tuberosa L.) cv. ‘Single’. Journal of Ornamental Horticulture, New-Series 6(4): 335-340.
Tisdale S L and Nelson W L.1975. Elements required in plant nutrition. In: Soil fertility and Fertilizers. Mac Milan Publishing Co., Inc. 866 Third Avenue, New York. 10022. 66-104pp.
Tripathi S K, Malik S, Singh I P, Dhayani B P, Kumar V, Dhaka S S and Singh J P. 2012. Effect of integrated nutrient management on cut flower tuberose (Polianthes tuberosa L.) var. Suvasini. Annual of Horticulture 5(1):108-115.
Troeh F R and Thompson L M. 1993. Phosphorus. In: Soils and Soil Fertility. Oxford University Press, Inc. 200 Madison Avenue, New York, 10016. 215-234pp.
Viradia R R and Singh S P. 2002. Studies on nitrogen nutrition and plant density in rose. In: Floriculture Research Trend in India (eds. Mishra R L and Mishra S), 228-229pp.
Walkley A and Black I A. 1934. An examination of the Degtjareff method for determining organic carbon in soils: Effect of variations in digestion conditions and of inorganic soil constituents. Soil Science 63:251-263.
Yadav B S, Ahlawat V P, Singh S and Sehrawat S K. 2002. Effect of nitrogen and zinc on floral characters, bulb production and nutrient content in tuberose (Polianthes tuberosa Linn.) cv. ‘Double’. Haryana Journal of Horticultural
Sciences 31(3/4): 210-212.
Yadav B S, Ahlawat V P, Singh S and Sehrawat S K. 2003. Effect of nitrogen and zinc on growth and spike production of tuberose (Polianthes tuberosa Linn.) cv. ‘Double’. Haryana Journal of Horticultural Sciences 32(3&4): 216-218.

63
Yadav B S, Gupta A K and Singh S. 2005a. Studies on the effect of nitrogen, plant spacing and bio fertilizers on growth parameters in tuberose cv. ‘Double’. Haryana Journal of Horticultural Sciences 34(1/2): 78-80.
Yadav B S, Gupta A K and Singh S and Sehrawat S K. 2005b. Impact of nitrogen, plant spacing and bio fertilizers on bulb production and root character in tuberose cv. ‘Double’. Haryana Journal of Horticultural
Sciences 34(1/2): 81-83.
Yadav L P, Bose T K and Maiti R G.1985. Response of tuberose (Polianthes
tuberosa L.) to nitrogen and phosphorous fertilization. Progressive
Horticulture 17:83-86
Yadav P K. 2007. Effect of nitrogen and phosphorus on growth and flowering of tuberose (Polianthes tuberosa) cv. ‘Shringar’. Progressive Agriculture 7(1/2): 189.

64
Dr. Y.S. Parmar University of Horticulture and Forestry, Nauni, Solan (H.P.) 173 230
Department of Floriculture and Landscaping
Title of Thesis : “Effect of nitrogen and phosphorus on growth and
flowering in tuberose (Polianthes tuberosa L.) cv.
Double.”
Name of the Student : Ashutosh Sharma Admission Number : H-2010-17-M Major Advisor : Dr. S.V.S Chaudhary Major Field : Floriculture and Landscaping Minor Field(s) : i) Plant Physiology
ii) Soil Science and Water Management
Degree Awarded : M.Sc. (Horticulture) Floriculture and Landscape Architecture
Year of Award of Degree : 2013 No. of pages in Thesis : 64+IV No. of words in Abstract : 234
ABSTRACT
The investigation entitled “Effect of nitrogen and phosphorus on growth and
flowering in tuberose (Polianthes tuberosa L.) cv. Double” was conducted at experimental farm of the Department of Floriculture and Landscaping, Dr. Y. S. Parmar University of Horticulture and Forestry, Nauni, Solan (H.P.) during 2011. The experiment was laid out in factorial randomized block design with sixteen treatments replicated thrice. Among the treatments, T11 (200 kg N/ha + 100 kg P2O5/ha) was recorded maximum per cent sprouting of bulbs (100%), plant height (48.38 cm), number of leaves per plant (47.59), number of days taken for spike emergence (98.81 days), number of days taken for basal florets opening (119.10 days), spike length (80.88 cm), number of florets per spike (30.48), rachis length (29.95 cm), fresh weight of spike (70.89 g), fresh weight of 100 florets (179.71 g), floret diameter (3.51 cm), number of flowering stems per plant (2.23), number of bulbs produced per plant (16.68), weight of bulbs per plant (276.03 g), available phosphorus (66.39 kg/ha), available potassium (192.52 kg/ha), minimum cost of production (Rs. 91.71/m2), maximum net returns (Rs. 246.53/m2) and benefit cost ratio (2.69). However, minimum number of days taken for sprouting of bulbs (12.73 days) and maximum amount of available nitrogen (462.71 kg/ha) were recorded in N3P3 (300 kg N/ha + 150 kg P2O5/ha). The maximum vase life (10.05 days) was recorded in N0P3 which was closely followed by N0P2, N0P1 treatments.
Signature of the Major Advisor Signature of the Student
Countersigned
Professor and Head
Department of Floriculture and Landscaping
Dr. Y.S. Parmar University of Horticulture & Forestry
Nauni, Solan, (H.P.) - 173 230

i
APPENDIX-I
Mean monthly meteorological data of Dr. Y.S. Parmar University of Horticulture and
Forestry, Nauni, Solan (H.P.) for the year 2011
(w.e.f. January, 2011 to December, 2011)
Months Temperature (oC) Relative
humidity (%)
Rainfall
(mm) Maximum Minimum Mean
January 18.10 0.40 9.25 55.00 23.20
Febuary 19.40 4.40 11.90 60.00 61.50
March 24.40 8.30 16.35 48.00 18.20
April 26.50 10.70 18.60 51.00 33.70
May 32.30 16.40 24.35 46.00 31.70
June 29.10 17.70 23.40 66.00 178.20
July 27.40 19.20 23.30 80.00 263.60
August 28.00 19.20 23.60 80.00 189.80
September 28.40 16.40 22.40 74.00 30.00
October 29.90 9.80 19.85 67.00 NIL
November 24.50 5.60 15.05 50.00 NIL
December 20.50 0.90 10.70 48.00 28.20
Source: Meteorological Observatory, Department of Environment Science, Dr. Y.S.
Parmar University of Horticulture and Forestry, Nauni, Solan (H.P.)

ii
APPENDIX-II
Cost of cultivation of tuberose for one bigha area (800 m2)
PARTICULARS Qty. Rate
(in Rs.)
Total Cost
(in Rs.)
A. Input Cost
1. Preparatory cultivation
a. Land preparation (Ploughing through power tiller)
2 hours 500/hr 1,000
b. Preparation of beds 2 man-days 120/man-days 240
c. Planting material (Bulbs) 9600 2 Rs/bulb 19200
d. Basal application of Vermicompost, fertilizers and layout
1 man-days 120/man-days 120
e. Planting and irrigation 3 man-days 120/man-days 360
2. Manuring
a. Vermicompost (@ 2.5 kg/m2) 1400 kg 15/kg 21000
b. Cost of fertilizers
i. Urea - 5.37/kg -
ii. Single Super Phosphate (SSP) - 7.70/kg -
iii. Muriate of Potash (MOP) - 16.80/kg -
3. Intercultural operations
a. Spraying insecticides 3 man-days 120/man-days 360
b. Irrigation 28 120/man-days 3360
c. Weeding and hoeing 20 120/man-days 2400
d. Staking 4 man-days 120/man-days 480
4. Plant Protection
a. Dithane M 45 1 kg 347/kg 347
b. Bavistin ½ kg 80/200g 200
c. Profenophos 500 ml 490/l 245
d. Metasystox 300 ml 275/250 ml 330
5. Harvesting of spike and bulb including grading packing
8 man-days 120/man-days 960
6.Transport 3000
7. Miscellaneous 1000
B.Total Cost 54602

iii
APPENDIX- III
Treatment wise cost of cultivation of tuberose calculated based on variable cost (800m2)
Treatment
Marketable Yield
(Numbers) Total Cost of
Cultivation
(Rs/800m2)
Gross income
(Rs/800m2) Total gross
income (a+b)
(Rs/800m2)
Net profit
(Rs/800m2) B :C Ratio
Spikes Bulbs Spike (a) Bulbs (b)
T1 (control) 15552.00 91296.00 54600.00 31104 91296 122400 67800.00 1.24
T2 (0kg N/ha+ 50kg P2O5/ha) 16128.00 91872.00 54744.00 32256 91872 124128 69384.00 1.27
T3 (0kg N/ha+ 100kg P2O5/ha) 16992.00 111456.00 54888.00 33984 111456 145440 90552.00 1.65
T4 (0kg N/ha+ 150kg P2O5/ha) 17472.00 109440.00 55032.00 34944 109440 144384 89352.00 1.62
T5 (100kg N/ha+ 0kg P2O5/ha) 18336.00 112608.00 54672.00 36672 112608 149280 94608.00 1.73
T6 (100kg N/ha+ 50kg P2O5/ha) 18624.00 112896.00 54816.00 37248 112896 150144 95328.00 1.74
T7 (100kg N/ha+ 100kg P2O5/ha) 19104.00 123648.00 54960.00 38208 123648 161856 106896.00 1.94
T8 (100kg N/ha+ 150kg P2O5/ha) 18816.00 123360.00 55104.00 37632 123360 160992 105888.00 1.92
T9 (200kg N/ha+ 0kg P2O5/ha) 19872.00 149280.00 54738.00 39744 149280 189024 134286.00 2.45
T10 (200kg N/ha+ 50kg P2O5/ha) 19488.00 149568.00 54882.00 38976 149568 188544 133662.00 2.44
T11 (200kg N/ha+100kg P2O5/ha) 21408.00 160128.00 55026.00 42816 160128 202944 147918.00 2.69
T12 (200kg N/ha+150kg P2O5/ha) 21024.00 157248.00 55170.00 42048 157248 199296 144126.00 2.61
T13 (300kg N/ha+ 0kg P2O5/ha) 20352.00 155424.00 54810.00 40704 155424 196128 141318.00 2.58
T14 (300kg N/ha+ 50kg P2O5/ha) 19968.00 155520.00 54954.00 39936 155520 195456 140502.00 2.56
T15 (300kg N/ha+100kg P2O5/ha) 20640.00 156480.00 55098.00 41280 156480 197760 142662.00 2.59
T16 (300kg N/ha+150kg P2O5/ha) 20448.00 157728.00 55242.00 40896 157728 198624 143382.00 2.60
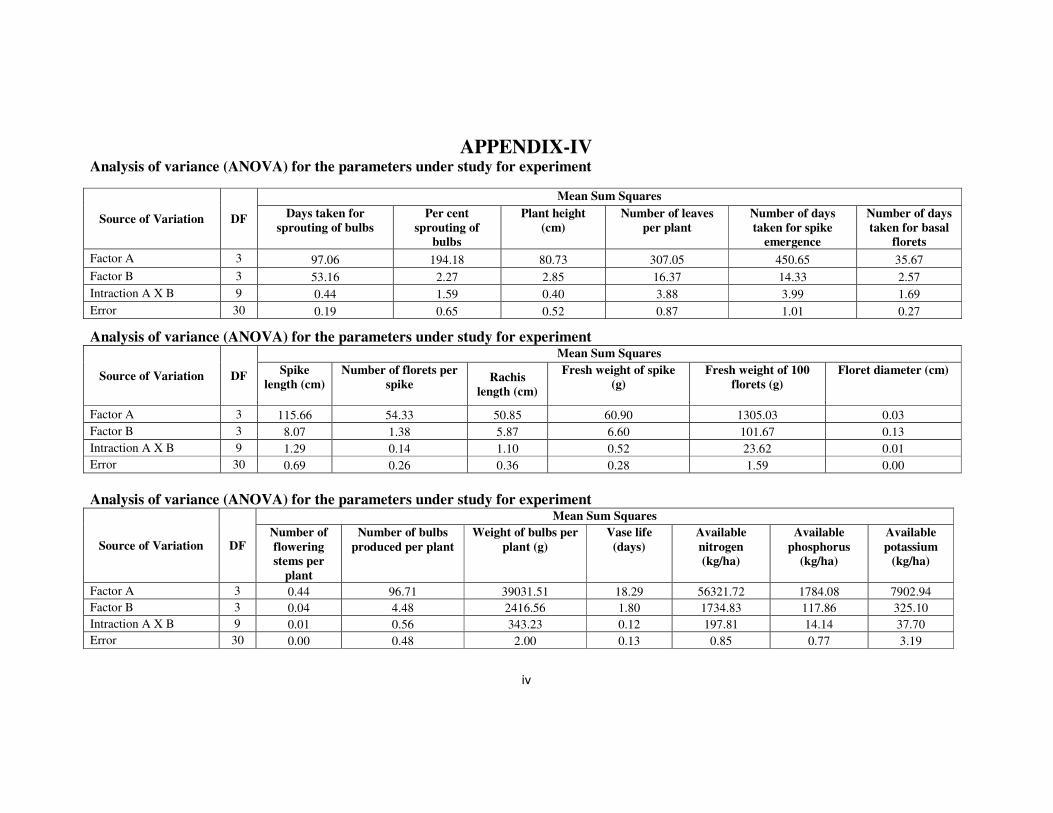
iv
APPENDIX-IV Analysis of variance (ANOVA) for the parameters under study for experiment
Source of Variation DF
Mean Sum Squares
Days taken for
sprouting of bulbs
Per cent
sprouting of bulbs
Plant height
(cm)
Number of leaves
per plant
Number of days
taken for spike emergence
Number of days
taken for basal florets
Factor A 3 97.06 194.18 80.73 307.05 450.65 35.67 Factor B 3 53.16 2.27 2.85 16.37 14.33 2.57 Intraction A X B 9 0.44 1.59 0.40 3.88 3.99 1.69 Error 30 0.19 0.65 0.52 0.87 1.01 0.27
Analysis of variance (ANOVA) for the parameters under study for experiment
Source of Variation DF
Mean Sum Squares
Spike
length (cm)
Number of florets per
spike
Rachis
length (cm)
Fresh weight of spike
(g)
Fresh weight of 100
florets (g)
Floret diameter (cm)
Factor A 3 115.66 54.33 50.85 60.90 1305.03 0.03 Factor B 3 8.07 1.38 5.87 6.60 101.67 0.13 Intraction A X B 9 1.29 0.14 1.10 0.52 23.62 0.01 Error 30 0.69 0.26 0.36 0.28 1.59 0.00
Analysis of variance (ANOVA) for the parameters under study for experiment
Source of Variation DF
Mean Sum Squares
Number of
flowering stems per
plant
Number of bulbs
produced per plant
Weight of bulbs per
plant (g)
Vase life
(days)
Available
nitrogen (kg/ha)
Available
phosphorus (kg/ha)
Available
potassium (kg/ha)
Factor A 3 0.44 96.71 39031.51 18.29 56321.72 1784.08 7902.94 Factor B 3 0.04 4.48 2416.56 1.80 1734.83 117.86 325.10 Intraction A X B 9 0.01 0.56 343.23 0.12 197.81 14.14 37.70 Error 30 0.00 0.48 2.00 0.13 0.85 0.77 3.19

CIRRICULUM VITAE
Name : Ashutosh Sharma
Father’s Name : Sh. Yogesh Kumar Sharma
Date of Birth : 23.11.1987
E- mail address : [email protected]
Sex : Male
Marital Status : Unmarried
Nationality : Indian
Education Qualifications:
Certificate/Degree Class/Grade Board/University Year
Matric Second UP Board 2004
10+2 First UP Board 2006
B.Sc. Agriculture First RK PG college Shamli 2010
Whether sponsored by : No
some state/Central Govt/
Univ/SAARC
Scholorship/Stipend/Fellowship : No
any: other assistance received
during study period
(Ashutosh Sharma)