Embed Size (px)
Citation preview

EFFECT OF LONG-CONTINUED MUSCULAR EXERCISE UPON THE CHEMICAL COMPOSITION OF THE MUSCLES AND OTHER TISSUES OF BEEF CATTLE '
By H. H. MITCHELL, Chief in Animal Nutrition, and T. S. HAMILTON, Associate in Animal Nutritiony Department of Animal Husbandry, Illinois Agricultural Experiment Station ^
INTRODUCTION
The quality and palatability of meat are dependent to a great extent upon the chemical and physical properties of the lean, which consists largely of muscle tissue. Among the factors affecting the quality of lean, therefore, muscular exercise may very well be of out- standing importance. Attempts to modify the composition of lean nieat by varying the ration fed to the animal have not been successful, since it is evident that cellular protoplasm is capable of maintaining its composition in the face of a varying food supply. But variations in the intensity of functioning of muscle are known to occasion varia- tions in the content of certain of its constituents.
Many investigations have been concerned with a study of the effect of contraction upon the composition of muscle, and much light, espe- cially in recent years, has been thrown upon the problems of muscular metabolism and of the origin of muscular energy. But the ephemeral changes associated with contraction, relaxation, and recovery are not of direct importance to the question of the differences in the composi- tion of meat in an animal accustomed to muscular exercise and in one unaccustomed to muscular exercise. The effects of muscular training on the composition of muscle tissue may be expected to be of a much more permanent nature.
REVIEW OF LITERATURE
Rogozinski {2^)^ found that the muscles of a dog that had been worked for 12 days contained less water and less fat than did those of a dog that had not been worked. However, the data obtained in an experiment with another pair of dogs did not support the conclusion that long-continued work causes a withdrawal of water. Gerhartz {12) experimenting with two pairs of dogs, confirmed the conclusion that muscular work decreases the water content of muscles. On the other hand, Embden and Habs {8) and Procter and Best {22) found no such effect of training.
The most consistent outcome of experiments concerned with the effect of long-continued muscular work on the chemical composition of muscle relates to the content of glycogen. Although the immediate effect of muscular contraction is to lower the glycogen stores, even
1 Received for publication Nov. 28, 1932; issued June, 1933. ? The investigations described in this paper were performed in cooperation with the Beef Cattle Division
and the Meat Division of the Illinois Agricultural Experiment Station and the Bureau of Animal Industry of the U. S. Department of Agriculture. Each of these groups undertook independent studies, the results of which will be reported elsewhere. The contribution of the Division of Animal Nutrition was the product of a team of workers, for whose efforts the authors here make due acknowledgment. The contributions of the following members of the staff and part-time workers deserve special mention: F. J. McClure, W. T. Haines, F. I. Nakamura, Frank Simpson, H. D. Preston, T. E. Aspinall, and Mrs. Harriette King Kla- bunde.
3 Reference is made by number (italic) to Literature Cited, p. 939.
Journal of Agricultural Research, Vol. 46, No. 10 Washington, D. C. May 15, 1933
Key No. I11.-52 (917)

918 Journal of Agricultural Research voi. 46, No. lo
to almost complete exhaustion in the case of protracted work, the repeated performance of muscular work has been found, in many experiments, to increase markedly the glycogen content of muscle, as much as two or three times the normal value, according to -^Embden and Habs (5), who used rabbits trained for periods of 2 to 6 weeks. The high content of glycogen in the trained muscles disappears very gradually after the training period is terminated. Procter and Best {22) in their experiments on dogs found that training periods of 7 to 16 days induced a marked increase in glycogen storage in muscles, but that longer periods of training, 20 to 42 days, produced no dis- tinct effect. These results suggested to the authors that there is an optimum period of training for the production of increased glycogen stores and hence that these induced excessive stores are not an essen- tial concomitant of increased ability to perform muscular exercise.
The eiïect of muscular training on the creatine content of muscle has not been so clearly determined. The most comprehensive of recent investigations concerned with this question are those of Palladin and Ferdmann {21)^ who experimented with rabbits. Muscular stim- ulation was brought about by an induction current, applied over the biceps femoris of one leg, the biceps femoris of the other leg serving as a control. In the first experiment, two rabbits were killed after a 5-minute period of stimulation, and the two biceps femoris analyzed. In both rabbits, the stimulated muscle was greatly impoverished in glycogen and contained approximately 4.5 per cent more water than did the unstimulated. The percentage of creatine on the fresh basis was lower in the stimulated muscle than in its control, but expressed either on the dry basis or as a percentage of the total nitrogen con- tent, the percentage of creatine was very nearly the same in stimu- lated and unstimulated muscle. An entirely different result was obtained, however, when repeated stimulation to induce a condition of muscular training was resorted to. When a 3-minute stimulation was repeated every 4 hours for periods of 5 to 15 days and when the rabbits were sacrificed for chemical examination 48 hours after the last stimulation, the creatine content of the trained biceps femoris was markedly increased over that of the untrained in eight experi- mental animals. The glycogen content was increased also, while in two of the rabbits on which determinations are reported, there was no difference in moisture content. One or two days training was not sufficient to bring about these results, and it was also shown, in other rabbits, that the effect on the creatine content of the muscle had largely disappeared in 2 or 3 days and entirely in 6 days. The increased glycogen content was plainly evident after six days.
In apparent contradiction to these excellent and consistent experi- ments of Palladin and Ferdmann may be cited the earlier negative experiments of Mellanby {18) on isolated frog muscle and rabbit muscle in situ, and of Brown and Cathcart {5) on decerebrated frogs and later on rabbits. In fact, in the latter case stimulation appeared to have depressed the creatine content of muscle. However, these experiments did not involve the training of muscle, but rather short- time stimulation. In the experiments of Embden and Habs {8) no change in the creatine content of the trained muscle was observed in two rabbits, while in two other rabbits what appeared to be a significant depression in creatine content was found. On the other hand, Ferdmann and Feinschmidt (P), using much the same pro-
May 15,1933 Efect oj Musculav ExcTcises on Tissues of Beef Cattle 919
cedures as Palladin and Ferdmann and the same species of animal, were able to show that, under their conditions, training increased the creatine-phosphoric acid content of muscle and that this increase disappeared in the course of six days of muscular rest. In these experiments the hexose-phosphoric acid and the pyrophosphoric acid of muscle were not affected by muscular training.
These investigations on the effect of muscular work upon the com- position of muscle indicate (1) that the first effects of work are related to the reactions occurring during contraction and recovery, from which the energy is derived; (2) that continued work, or muscular training, produces changes in composition, such as an increase in the content of glycogen and of creatine, either the direct reverse of those related to the contraction phase, or unrelated to them; and (3) that protracted training may cause the first effects of training to disappear gradually and even may cause contrary effects to appear, such as a decrease in creatine content.
The experiments reported in this paper relate to the effects of long- continued muscular training.
PLAN OF THE EXPERIMENTS
The experiments extended over two years, from February, 1929, to May, 1931. In each experiment, the subjects were eight steer calves of predominantly Hereford blood, obtained from the same locality and of the same breeding and previous treatment. They weighed initially from slightly less than 500 pounds to sjightly more than 600 pounds, and in each experiment they were fairly uniform, especially in the second year's work. The experimental treatment continued in the first experiment from February 13 to June 15, a period of 122 days, and in the second from January 7 to May 18, a period of 131 days.
In the first experiment,^ the eight steers were divided into two lots of four each, one lot being exercised daily, the other lot being closely confined. The exercised lot were worked individually for one hour each day on a treadmill set at a slight angle, and the work continued up to the day before slaughter. Each steer walked the equivalent of 450 miles on the horizontal plane, an average of 3.6 miles per day. The exercised steers were full fed a ration of shelled corn, cottonseed meal, corn silage, and alfalfa hay. The unexercised lot were fed the same ration, but in amounts limited so that their gains and conditions would approximate those of the exercised steers. These steers were confined in a small pen in a feeding shed open to the east. The exer- cised steers also were kept in this pen except during the exercise period, when they were removed to a treadmill next to the pen.
The slaughter weights of the exercised steers averaged 833 pounds, and those of the unexercised steers, 826 pounds. The average daily gains in the two lots were, respectively, 2.33 and 2.56 pounds.
At the time of slaughter, samples of blood for examination and analysis were taken from each steer. Also a special sample of muscle tissue was taken from the upper and inner round for immediate analysis. The livers and hearts (trimmed) were also taken for analysis. From the chilled carcasses, the total lean from each of the nine wholesale cuts from one-half of the carcass, separated from all overlying fat by knife, was ground and sampled for chemical analysis.
* For reasons explained below, this experiment is hereafter designated as experiment 2.

920 Journal of Agricultural Research voi. 46, No. lo
The plan of the second experiment ^ was the same as that of the first, with three exceptions. The steer calves were paired as to initial weight and grade, one calf of each pair being exercised, and during the experimental period the weights of each pair were kept approximately the same by restricting the food consumption of the unexercised calf, the other calf having unrestricted access to food. The ration fed was the same as in the preceding experiment, but the exercise imposed was much greater. Starting at one hoards exercise daily, the period of work was increased to approximately three and a half hours daily. Each exercised steer walked the equivalent of 1,181 miles in 381 working hours, amounting to 8.8 miles per day at a rate of 3.1 miles per hour. As in the preceding experiment, the work was continued up to the day of slaughter. At the time of slaughter, the same samples were taken as in the first experiment, but the selection of lean samples from the chilled carcasses was different, being confined to certain selected muscles from a number of the wholesale cuts of one-half of each carcass. The muscles and the cuts from which they were taken are as follows:
(1) From the round, taken from the rump to the stifle joint, the following muscles were separated: The semimembranosus and ad- ductor muscles, the semitendinosus muscle, and the biceps femoris muscle.
(2) From the short loin, the longissimus dorsi and psoas major muscles were taken.
(3) From the sixth to the twelfth ribs, inclusive, the longissimus dorsi was removed.
(4) From the flank cut, the obliquus externus abdominis was taken.
(5) From the chuck, the triceps brachii muscle was removed from the head of the humérus to the elbow.
The slaughter weights of the unexercised steers in the second experi- ment averaged 751 pounds, and those of the exercised steers 729 pounds. The average daily gains were, respectively, 1.70 and 1.57 pounds.
In the samples taken, moisture was determined by drying in an electric oven at 105° C. for 5 hours, fat by continuous extraction of the dried samples with ether for 48 hours, nitrogen by the Kjeldahl method, using mercury and potassium sulphate in the digestion mix- ture and distilling into 4 per cent boric acid, and ash by ignition in an electric muffle furnace at temperatures below 700°. Iron was deter- mined by a slight modification of the Kennedy (14-) method, hemo- globin by a modification of Whipple^s method (31)j and creatine by the procedure developed by Rose, Helmer, and Chanutin (26). The collagen and elastin determinations were made by a method developed in this laboratory (19),
RESULTS OF THE EXPERIMENT
Although the experiment involving the greater degree of muscular exercise was performed after the experiment involving the smaller degree, it seems advisable to consider it first in the discussion of the results obtained, because the effects of training would be the more pronounced and the more easily discerned. Therefore, in the following discussion it will be referred to as experiment 1.
6 For reasons explained below, this experiment is hereafter designated as experiment 1.
May 15,1933 Efect oj Musculav Exevcises on Tissues of Beef Cattle 921
THE BLOOD
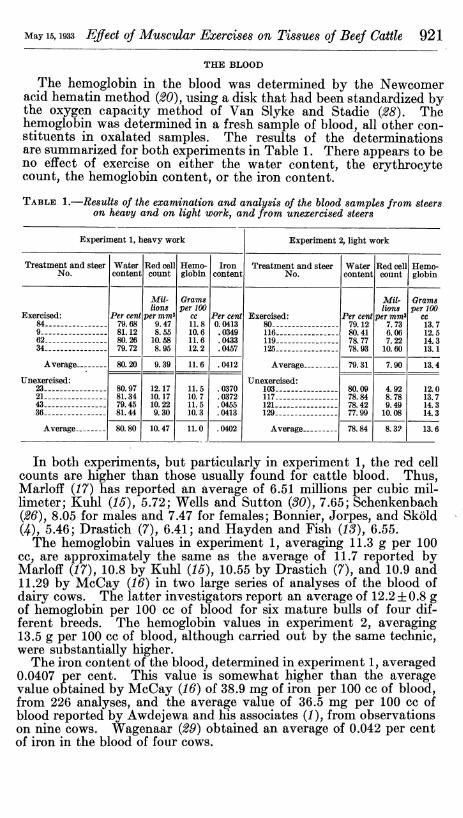
The hemoglobin in the blood was determined by the Newcomer acid hematin method (20), using a disk that had been standardized by the oxygen capacity method of Van Slyke and Stadie (28), The hemoglobin was determined in a fresh sample of blood, all other con- stituents in oxalated samples. The results of the determinations are summarized for both experiments in Table 1. There appears to be no effect of exercise on either the water content, the erythrocyte count, the hemoglobin content, or the iron content.
TABLE 1.—Results of the examination and analysis of the blood samples from steers on heavy and on light worky and from unexercised steers
Experiment 1, heavy work Experiment 2, light work
Treatment and steer No.
Water content
Red cell count
Hemo- globin
Iron content
Treatment and steer No.
Water content
Red cell count
Hemo- globin
Exercised: 84
Per cent 79.68 81.12 80.26 79.72
Mil- lions
per mm^ 9.47 8.55
10.68 8.95
Grams per 100
cc 11.8 10.6 11.6 12.2
Per cent 0.0413 .0349 .0433 .0457
Exercised: 80 -
Per cent 79.12 80.41 78.77 78.93
Mil- lions
per mm^ 7.73 6.06 7.22
10.60
Grams per 100
cc 13.7
9 116 12 5 62 119 14 3 34 125 13.1
Average Average - 80.20 9.39 11.6 .0412 79.31 7.90 13 4
Unexercised: 103-
unexercised: 23 80.97
81.34 79.45 81.44
12.17 10.17 10.22 9.30
11.5 10.7 11.5 10.3
.0370
.0372
.0455
.0413
80.09 78.84 78.42 77.99
4.92 8.78 9.49
10.08
12.0 21 117 13 7 43 121 14.3 36 129 14 3
Average Average. 80.80 10.47 11.0 .0402 78.84 8.3? 13 6
In both experiments, but particularly in experiment 1, the red cell counts are higher than those usually found for cattle blood. Thus, Marloif (17) has reported an average of 6.51 millions per cubic mil- limeter; Kuhl (16), 5.72; Wells and Sutton (30), 7.65; Schenkenbach (26), 8.05 for males and 7.47 for females; Bonnier, Jorpes, and Sköld (4), 5.46; Drastich (7), 6.41; and Hayden and Fish (13), 6.55.
The hemoglobin values in experiment 1, averaging 11.3 g per 100 cc, are approximately the same as the average of 11.7 reported by Marloif (17), 10.8 by Kuhl (15), 10.55 by Drastich (7), and 10.9 and 11.29 by McCay (16) in two large series of analyses of the blood of dairy cows. The latter investigators report an average of 12.2 ±0.8 g of hemoglobin per 100 cc of blood for six mature bulls of four dif- ferent breeds. The hemoglobin values in experiment 2, averaging 13.5 g per 100 cc of blood, although carried out by the same technic, were substantially higher.
The iron content of the blood, determined in experiment 1, averaged 0.0407 per cent. This value is somewhat higher than the average value obtained by McCay (16) of 38.9 mg of iron per 100 cc of blood, from 226 analyses, and the average value of 36.5 mg per 100 cc of blood reported by Awdejewa and his associates (1), from observations on nine cows. Wagenaar (29) obtained an average of 0.042 per cent of iron in the blood of four cows.

922 Journal of Agricultural Research Vol. 46, No. 10
THE IRON AND HEMOGLOBIN CONTENTS OF THE TISSUES
Hemoglobin determinations were made upon the heart and the special sample from the round in experiment 1 (heavy work), and upon the liver, round, ribs, and shank samples in addition in exper- iment 2. The results of these analyses, expressed in percentage of the fresh tissue, are summarized in Table 2. They are of interest, in view of the scarcity of such information in the literature, even though they do not demonstrate any effect of muscular training. In exper- iment 2 (light work) the averages for five of the six samples are higher for the exercised than for the unexercised steers. However, the variations among the steers within each group were so great that average group differences are obviously insignificant.
TABLE 2.—Hemoglobin content {per cent) of the tissues from steers on heavy and on light work, and from unexercised steers
Experiment 1, heavy work Experiment 2, light work
Hemoglobin in—
Treatment and steer No.
Hemoglobin in —
Treatment and steer No.
Heart Special sample
of round
Liver Heart Special sample
of round
Round Ribs Shank
Exercised: 84 0.404
.382
.325
.463
0.283 .387 .354 .389
Exercised: 80 0.328
.352
.405
.297
0.286 .348 .412 .361
0.295 .225 .211 .260
0.258 .195 .171 .194
0.198 .196 .162 .174
0.258 9 - — — 116 .232 62 119 .239 34 125 .336
Average
Unexercised: 103
Average .394 .353 .346 .352 .248 .205 .183 .266
Unexercised: 23 .393
.448
.354
.451
.388
.370
.346
.361
.418
.290
.393
.164
.338
.325
.292
.264
.190
.242
.280
.308
.170
.208
.181
.170
..189
.184
.192
.161
.257 21 -_ __. 117 __ .210 43- 121 .192 36 129 . .253
Average Average .412 .366 .316 .305 .255 .182 .182 .228
In experiment 1 (heavy work) all of the eight samples of muscles taken from the chilled carcasses were analyzed for iron, making a total of 64 analyses. The results revealed no appreciable differences be- tween cuts and no significant differences between exercised and unex- ercised groups. The average result was 0.003075 ± 0.000042 per cent of iron in the fresh tissues.
In experiment 2 (light work) iron analyses were made upon the marrow from one of the femur bones of each of the carcasses. On the same samples, analyses were made also for dry substance and fat. The results in Table 3 show that, in the group of exercised steers, the marrow contained 20 per cent less iron than did that of the unexer- cised group. By applying Fisher's modification of Student's method (11, p. 107) to these two groups of results, a value of / = 4.83 is obtained, and the probability that a difference as great as that observed (0.00052) would result from chance is considerably less than 0.01. This lowering of the iron content of the marrow was asso- ciated with an increased content of dry matter, but essentially no dif- ference in fat content. There was an average of 4.14 per cent of dry matter not fat in the marrow samples from the exercised steers and an

May 15,1933 Effect oj Musculav Exercises on Tissues of Beef Cattle 923
average of only 1.94 per cent of dry matter not fat in the marrow samples from the unexercised steers.
TABLE 3.—Chemical composition (per cent) of the marrow from the femur bones from steers on light work (experiment 2) and from unexercised steers
Treatment and steer No.
Dry sub- stance
Ether extract Iron Treatment and
steer No. Dry sub-
stance Ether extract Iron
Exercised: 80 97.43
97.88 95.58 97.41
95.23 94.62 89.32 92.58
0.00197 .00216 .00206 .00214
Unexercised: 103 - 96.79
96.71 91.24 95.21
97.53 93.58 89.45 91.63
0.00237 116 117 00282 119 121 __ .00256 125 129 .00266
Average Average 97.08 92.94 .00208 94.99 93.05 .00260
THE FAT AND WATER CONTENTS OF THE TISSUES
The results of the analysis of the tissue samples for fat and water are given in Table 4. The fat percentages are on the fresh basis, but the water percentages are computed on the protoplasmic (fat- free) basis, in order to eliminate the considerable influence of varia- tions in fat content.
TABLE 4.—Fat and water content of tissue samples from steers on heavy and on light work, and from unexercised steers
EXPERIMENT 1, HEAVY WORK, PERCENTAGE OF FAT ON THE FRESH BASIS
Heart Liver
Special sam- ple of round
Round muscles Short loin Ribs Flank Chuck
Treatment and steer No. Semi-
mem- brano-
sus
Semi- tendi- nosus
Biceps femoris
Longis- simus dorsi
Psoas major
Longis- simus dorsi
Obli- quus exter- nus ab-
dom- inis
Tri- ceps
brachii
Exercised: 84.. 9
2.38 2.86 2.97 2.88
1.67 1.54 1.63 1.56
1.06 1.73 1.13 1.28
0.80 2.37 1.01 1.38
1.26 2.00 1.24 1.68
1.30 1.46 2.32 L39
1.19 2.78 .96
2.20
2.67 4.22 2.26 3.08
1.78 3.06 1.68 2.14
3.48 5.20 2.06 2.77
1.24 2.34
62. 1.97 34 1.83
Average 2.77 1.60 1.30 1.39 1.54 1.62 1.78 3.06 2.16 3.38 1.84
Unexercised: 23 3.20
3.62 2.56 3.63
2.36 2.00 2.39 2.90
1.53 1.52 1.62 1.60
1.39 1.54 2.50 1.65
1.27 2.00 1.40 1.75
2.14 1.40 L86 2.25
2.33 1.58 1.49 1.98
4.50 3.16 2.61 3.15
1.98 2.07 2.52 2.05
2.90 3.46 2.49 2.67
3.39 21 2.18 43.. L95 36 2.60
Average ._ 3.25 2.41 1.57 1.77 1.60 L91 1.84 3.36 2.16 2.88 2. 5ÍÍ
EXPERIMENT 1, HEAVY WORK, PERCENTAGE OF WATER ON THE PROTOPLASMIC BASIS
Exercised: 84. _ 80.60
80.21 8L08 81.11
71.01 7L52 71.20 70.94
75.73 75.71 76.31 76.60
76.13 75.65 76.13 76.11
76.07 76.20 76.39 76.05
76.40 76.20 76.48 76.57
75.85 76.32 75.92 76.23
77.54 76.99 77.95 77.87
76.91 76.34 76.88 76.79
76.86 75.79 76.49 76.08
76.54 9 76.51 62 34 _ _ -
77.32 77.58
Average 80.75 71.17 76.09 76.01 76.18 76.41 76.08 77.59 76.73 76.30 76.99
Unexercised: 23 _- 8L63
81.56 82.18 8L12
72.27 72.36 73.54 74.26
76.93 77.23 77.25 76.44
76.48 76.66 77.74 76.23
76.19 76.98 76.97 76.37
76.83 77.25 76.54 77.30
76.43 76.44 76.68 76.07
78.39 78.33 78.14 77.86
77.00 77.00 78.16 76.53
77.91 77.69 76.65 77.33
78.40 21 _-_ 77.71 43 77.51 36 77.20
Average 8L62 73.11 76.96 76.78 76.63 76.98 76.40 78.18 77.17 77.39 77.70

924 Journal of Agricultural Research Vol. 46, No. 10
TABLE 4.—Fat and water content of tissue samples from steers on heavy and on light work, and from unexercised steers
EXPERIMENT 2, LIGHT WORK, PERCENTAGE OF FAT ON THE FRESH BASIS
Treatment and steer No.
1 > 3
a> a
II So
1 o Xi
Xi
1 Ö 'S
a
1 S
Exercised: 80 116 119
1.58 1.86 1.97 2.19
1.54 1.36 2.05 1.92
2.34 2.58 3.40 3.02
4.10 4.60 4.71 3.51
9.47 8.38 9.00 7.77
5.87 4.45 5.02 4.38
7.20 5.28 6.51 5.31
8.05 6.60 8.90 7.04
6.51 6.52 7.05 5.78
13.49 14.15 13.80 12.24
6.81 7.35 7.45 6.67
12.27 11.88 10 21
125 8! 21
Average 1.90 1.72 2.84 4.23 8.66 4.93 6.08 7.65 6.47 13.42 7.07 10.64
Unexercised: 103 .._
2.55 2.17 2.14
2.68 2.72 2.54 2.57
4.13 2.34 2.51 2.27
5.14 4.37 2.20 3.62
12.13 8.94 8.81 9.45
4.67 5.15 3.99 5.96
8.06 5.31 6.19 5.28
10.46 8.26 7.07 6.82
9.43 5.29 5.29 6.47
14.93 13.35 10.54 12.96
8.69 6.93 6.99 7.23
9.80 9.94 8.00
117 121 129.
Average _ _ _ 2.38 2.63 2.81 3.83 9.83 4.94 6.21 8.15 6.62 12.95 7.46 9 37
EXPERIMENT 2, LIGHT WORK, PERCENTAGE OF WATER ON THE PROTOPLASMIC BASIS
Exercised: 80 - 116 _„
79.99 81.34 80.86 81.54
70.44 71.10 71.64 72.69
75.34 75.85 75.86 75.93
75.79 76.51 76.35 75.97
76.26 75.81 75.52 75.39
75.42 77.26 75.84 76.53
76.26 76.82 76.76 76.51
76.14 77.08 76.38 75.60
75.57 76.60 76.22 76.46
76.93 77.11 76.68 76.14
76.56 77.24 77.19 76.32
75.17 76 06
119. 125
75.27 75 06
Average 80.93 71.47 75.74 76.15 75.74 76.26 76.59 76.30 76.21 76.46 76.82 75 39
Unexercised: 103 117. 121
81.85 80.99 81.04 8L23
73.62 73.55 74.31 73.27
76.25 75.34 76.07 75.05
76.13 76.97 76.26 75.67
77.28 77.26 76.68 76.27
77.24 76.59 76.61 75.94
77.49 76.82 76.27 76.15
76.67 76.35 77.67 75.86
76.32 77.53 76.04 76.56
76.11 77.03 76.07
. 76.47
77.09 77.09 76.70 76.73
75.85 75 69
129 - 75.06
Average... 81.28 73.69 75.68 76.26 76.87 76.59 76.68 76.64 76.61 76.42 76.90 76.53
« The excess fat was not trimmed from this sample before analysis. «» This sample was lost.
In experiment 1 there is a general tendency for the tissues from the exercised steers to exhibit a smaller fat content than the corre- sponding tissues from the unexercised steers. Of the 11 tissues exam- ined, only 2, the longissimus dorsi muscle of the rib cut and the obliquus externus abdominis of the flank cut, failed to show this relation between the averages of the two groups of steers.
The most pronounced difference in fat content occurred in the case of the liver samples. Here the average difference amounts to 0.81 per cent of fat; the value of t (essentially the ratio of the average differ- ence to the standard deviation of percentages from their respective group mean) is 4.33, and the probability that as marked a difference as this could have been the result of chance is considerably less than 0.01. Thus, even with these small groups of values, a clear demon- stration of an effect of muscular training in reducing the concentration of ether-soluble substances in the liver was obtained.
However, no other tissue showed a difference between exercised and unexercised steers sufficiently marked, in relation to the variation occurring within each group, to indicate that muscular training had produced it. The heart tissue, the special sample from the round, and the chuck muscle come the nearest to a demonstration, but the

May 15,1933 Efect oj Musculav Exevcises on Tissues of Beef Cattle 925
probabilities that chance may have produced the average differences are so large (0.15, 0.13, and 0.13, respectively) that they can not be neglected. Even if all the muscle samples are considered together in two groups of 36 analyses each, and the deviations are computed from the averages of each group of four samples in arriving at the standard deviation, the probability obtained is greater than 0.10, and hence the possibility that chance was responsible for group differences can not be neglected.
In experiment 2, involving light work, the fat content of the livers of the exercised steers is again significantly lower than that of the unexercised steers, the average difference amounting to 0.91 per cent of fat. The value of #, according to Fisher's method, is 5.46, giving a probability for 7^ = 6 of considerably less than 0.01 that chance conditions alone brought about this distribution of values into the two groups. It may, therefore, be concluded that the work imposed upon the steers in one of these groups was responsible for lowering the content of ether-soluble constituents in the liver.
The heart samples also suggest strongly an effect of work similar to the effect upon the liver, but the probability in this case amounts to about 0.044 that chance factors may have brought this result about, equivalent to odds of 1 in 24. Any great amount of reliance can not, therefore, be placed on the significance of this comparison.
With respect to the fat contents of the muscle samples in experiment 2, nothing can be said concerning a possible effect of muscular training. Considering group averages only, in eight comparisons the exercised steers gave the lower figure, while in four comparisons the reverse was true.
Table 4 shows that with respect to all tissue samples taken in experiment 1, the water content on the protoplasmic basis averaged less for the exercised steers than for the unexercised steers. The difference was greatest and most distinct for the liver, amounting to 1.94 per cent of water. The value of t in this case is 3.90, and from Fisher's table (11, p. 139), only one value in a hundred (n being equal to 6) will exceed 3.707 by chance; hence, the difference is highly significant. It may, therefore, be concluded that continued exercise lowered the water content of the livers of these steers.
For a number of other samples, the differences between the two groups of steers in the percentage of water are significant, the value of P being less than 0.033, corresponding to odds of 1 in 30 that chance alone would produce the result, that is, heart 0.032, special sample of round 0.026, biceps femoris (round) muscle 0.032, and obliquus externus abdominis (flank) muscle 0.018. If the results on all the muscles are combined in a single statistical analysis, in which the standard deviation is computed from the deviations of each group of four percentages from its mean, the mean difference is 0.0668 per cent and the value of t becomes 7.67, n being 70. This value of t is far beyond the range of Fisher's table, so that it is perfectly clear that, as the statistician would say, the percentages of water in the muscles from the exercised and unexercised steers were not drawn from the same ''population. " Hence, it may be concluded that, continued muscular exercise of the intensity imposed in this experiment reduces the moisture content of liver, heart, and muscles.
In experiment 2 the percentages of water on the protoplasmic basis were also lower for the exercised steers with the exception of

926 Journal of Agricultural Research voi. 46, No. lo
two samples, the plate and the special sample of round, but the average differences are considerably smaller than those obtained in experiment 1 and, hence, less certainly caused by the difference in muscular activity. With only two samples is the probability that all analyses are from the same population sufficiently small that it may be neglected. For the liver samples, the average difference in water content was 2.22 per cent, the value of t being 4.24, and the probability considerably less than 0.01. Also for the rib samples the average difference was 1.13 per cent, the value of ^ 3.63, and the probability approximately 0.011. If all the muscle samples are combined in one analysis, as was done in the discussion of the corresponding results of experiment 1, the mean difference is 0.265 (as compared with 0.668), the value of t becomes 2.45 (as compared with 7.67), and P is somewhat less than 0.02. It appears, therefore, that in this experiment also the exercise imposed has markedly lowered the moisture content of liver and also that of the muscles, though to a less pronounced extent, than did the more severe muscular exercise imposed in experiment 1.
The analyses of fat and water in a number of tissues from 16 differ- ent steer calves offers an opportunity of studying statistically the relation between the composition of different muscular tissues in the same animal. This relationship is of general interest, and in addition it bears directly upon the interpretation of the data with respect to the effect of continued muscular exercise upon the fat and water con- tent of the muscles, since it will show to what extent the analyses of the different samples are interdependent, and conversely, to what extent each sample analyzed is an independent test of the effect of muscular work. The product-moment correlation method was there- fore applied to the water and fat analyses in each experiment, the standard deviations being computed from the deviations of each group of four analyses from its own mean. In computing the devia- tion porducts every possible pair of deviations was taken from all the muscle samples of each steer.
In experiment 1 the correlation coefficient for fat content was + 0.360, and that for water content +0.182. In experiment 2 the correlation coefficients were, respectively, +0.519 and +0.346. These coefficients measure the degree to which variations in the fat and water content in one sample of muscle tissue are associated with variations in another sample, perfect correlation being measured by a coefficient of 1 and the positive sign indicating that a high content in one muscle tends to be associated with a high content in another. Evidently a closer correlation exists among the different tissues with respect to fat than with respect to water, and also, apparently, there is a closer correlation between the fat content, as well as the water content, of lean samples from the same carcass, freed roughly from visible fat with a knife, than between the fat content or the water content of individual muscles, dissected out in a manner better calcu- lated to avoid contamination with intermuscular fat. The correla- tion coefficients obtained in the first experiment are inconsiderable, though significant in all probability in indicating the existence of some degree of positive correlation. The coefficients obtained in the sec- ond experiment are somewhat larger, though still too small to indicate that the fat or moisture content of one lean sample may be predicted satisfactorily from that of another.

May 15,1933 E^ffcct oj Musculav Exevcises on Tissues qf Beef Cattle 927
BOUND WATER IN MUSCLE
In experiment 1 (heavy work) an attempt was made to determine whether trained muscle possessed a different percentage of ^^bound'' water than untrained muscle. The conception of ^*bound'' water followed was that of Rubner, according to which ^*bound" water is that fraction of the water in the tissue which does not freeze at tem- peratures as low as —20° C. The method of determining bound water was essentially that of Robinson (23)y which is a modification of the method of Thoenes (27). The sample used for the determina- tion was the special sample from the round, taken immediately after slaughter, and the determinations were made within 48 hours. The results are assembled in Table 5.
TABLE 5.—Bound-water content of the special samples of round lean from steers on heavy work, experiment 1
[All results are expressed on the fat-free basis]
Total water
Bound water
Treatment and steer No.
Total water
Bound water
Treatment and steer No. As per-
centage of total water
As per- centage of fat-
free sub-
stance
Per gram of fat-free
dry matter
As per- centage of total water
As per- centage of fat- free sub-
stance
Per gram of fat-free
dry matter
Exercised: 84
Per cent 75.73 75.71 76.31 76.60
Per cent 14.3 14.6 12.6 13.7
Per cent 10.8 11.0 9.6
10.5
Gram 0.45 .45 .41 .45
Unexercised: 23 --
Per cent 76.93 77.23 77.25 76.44
Per cent 14.5 11.9 12.1 13.2
Per cent 11.1 9.2 9.3
10.1
Qram 0.48
9 21 .40 62 . 43 - -- .41 34 36 . .43
Average--- Average.-- 76.09 13.8 10.5 .44 76.96 12.9 9.9 .43
It is clear that no evidence was obtained of an effect of training on the bound-water content of muscle.
THE NITROGEN CONTENT OF THE FAT-FREE DRY MATTER OF THE TISSUES
The nitrogen content of the tissue samples in both experiments has been expressed on the basis of the fat-free dry matter, in order to eliminate the variations in fat and water, which have been shown to be, to some extent, influenced by muscular training. The per- centages of nitrogen thus expressed are presented in Table 6.
In considering experiment 1 involving heavy work, first, it appears that for all tissues examined except two the average percentage of nitrogen for the exercised steers is lower than that for the unexercised. In one case, the semitendinosus muscle of the round, the averages for the two groups of steers are the same, while in another case, the biceps femoris of the round, there is a difference of 0.02 per cent in favor of the exercised steers.
As in all other cases in which training has affected the chemical composition of tissues, the composition of the liver is affected the most. In this instance, the average reduction of the nitrogen content of the fat-free dry matter is 1.33 per cent of nitrogen. Applying Fisher's method of statistical analysis, the standard deviation s is 0.502, t of 3.75, and the probability that the two sets of data are from the same population is less than 0.01. There can be little doubt that

928 Journal oj Agricultural Research Vol. 46, No. 10
muscular training has reduced the nitrogen content of the fat-free dry matter of the Uver.
TABLE 6.—Nitrogen content {per cent) of the fat-free dry matter of the tissues from steers on heavy and on light work, and from unexercised steers
EXPERIMENT 1, HEAVY WORK
Heart Liver
Special sample
of round
Round muscles Short loin Ribs Flank Chuck
Treatment and steer No. Semi-
mem- bran- osus
Semi- ten-
dino- sus
Bi- ceps fem- oris
Lon-* gissi- mus dorsi
Psoas major
Lon- gissi- mus dorsi
Obli- quus exter- nus ab-
dom- inis
Tri- ceps
brachii
Exercised: 84 14.68
14.67 14.98 15.42
11.12 11.59 11.26 11.18
14.91 15.17 15.20 15.24
14.70 14.72 15.19 15.03
14.90 15.48 15.69 15.63
14.86 15.65 15.04 15.32
14.46 15.25 14.88 14.84
16.01 15.15 15.36 15.62
14.90 15.08 15.27 15.24
15.00 15.34 14.81 15.26
14.50 14 82 9
62 15 07 34 14 99
Average 14.94 11.29 15.13 14.91 15.43 15.22 14.86 15.54 15.12 15.10 14 85
Unexercised: 23 14.90
15.19 15.09 15.50
11.96 12.29 12.70 13.53
15.40 15.79 15.64 15.27
15.14 15.14 16.18 15.10
14.80 15.34 15.76 15.81
14.91 15.47 14.94 15.46
14.68 15.01 15.02 15.17
16.81 15.44 15.27 14.93
15.44 15.36 15.83 15.27
15.85 15.41 15.11 15.78
14 95 21 15.50 43 14 78 36 15 35
Average.- 15.17 12.62 15.53 15.39 15.43 15.20 14.97 15.61 15.48 15.54 15.15
EXPERIMENT 2, LIGHT WORK
Treatment and steer No. ^ Ï
ft
il a S
M
1 P
1 1 ,
W ^A œ PH PH PH yA OQ « f^ O PH
Exercised: 80 14.27 11.10 14.70 15.03 15.50 15.64 15.12 15.54 15.11 15.23 15.70 15.98 116 15.02 11.72 15.51 14.99 14.76 16.06 15.35 15.51 16.14 15.32 15.36 15.73 119 15.72 12.17 15.18 14.82 14.59 14.77 16.38 15.94 15.11 15.77 15.63 15.31 125 16.17 11.98 15.12 15.01 14.58 16.09 15.51 15.17 15.73 15.71 15.38 16.34
Average 15.30 11.74 15.13 14.96 14.86 15.64 15.59 15.54 15.52 15.51 15.52 15.84
Unexercised: 103 12.82 15.25 14.71 15.22 16.18 15.41 15.37 15.06 15.01 15.01 117 14.52 13.18 14.41 15.35 15.60 15.72 15.90 15.81 15.88 15.33 15.53 15.29 121 14.99 13.30 15.60 14.81 15.00 15.32 15.14 16.24 15.20 15.27 15.14 15.71 129 14.36 13.17 14.89 14.29 15.26 15.64 15.23 15.38 15.56 15.63 15.28 15.03
Average 14.62 13.12 15.04 14.79 15.27 15.72 15.42 15.70 15.43 15.31 15.24 15.34
In the special sample of tissue from the round, there was an average différence of 0.40 per cent of nitrogen, a standard deviation of 0.196, a value of t is 2.88, and a probability of about 0.032 that the two sets of data are the result of the operation of the same factors. The indications are clear with this tissue also, muscular training has lowered the nitrogen content of the fat-free dry matter. The other muscle samples, secured from the chilled carcasses, do not individually show clear evidence of such an effect of training ; the longissimus dorsi muscle of the ribs gives the most significant evidence, but the prob- ability that the two groups of analyses may have been produced by

May 15,1933 Efect oj Musculav Exevcises on Tissues of Beef Cattle 929
the same factors is too large (0.054) to be safely neglected. However, if all of these eight muscle samples are considered together in the same statistical analysis, computing the standard deviation from the devia- tions of each group of four analyses from its own mean, an average difference of 0.217 per cent is obtained between exercised and unexer- cised steers, the standard deviation is 0.334, t is 2.59, and the proba- bility that the same factors operated in determining the percentage for both groups of steers is less than 0.02. Such a low probability of a chance outcome may be neglected, and it may be concluded that, in muscle tissue generally, the effect of muscular training is to lower the nitrogen content of the fat-free dry matter.
In experiment 2 (light work) the liver undoubtedly has suffered the same large reduction (1.38 per cent) in the nitrogen content of the fat-free dry matter. The value of t in this comparison is 5.40, and the probability is considerably less than 0.01. But the heart and the special round sample show no such relation, and of the nine muscle samples from the chilled carcasses only three show an average reduc- tion in the percentage of nitrogen for the exercised steers. Evidently the intensity of the work imposed in this experiment was not sufBcient to affect appreciably the nitrogen content of the fat-free dry matter.
THE GLYCOGEN CONTENT OF THE FRESH MUSCLE
In accounting for the reduction in the nitrogen content of the fat- free dry matter of the tissues brought about by muscular training and especially evident in the results of experiment 1, one naturally, perhaps, thinks first of an increase in glycogen. But it would require an improbably large increase in the glycogen content of the tissues to account for the decreases in nitrogen observed. In experiment 1, in which the average nitrogen content of the liver on the fat-free dr\^- matter basis decreased from 12.62 to 11.29 per cent, it would require an increase of glycogen equal to 10.54 per cent of the dry matter. In experiment 2, the average reduction in the nitrogen percentage in the liver was from 13.12 to 11.74, which would again call for an increase in glycogen equal to 10.52 per cent of the dry matter. In the case of the fresh round sample in experiment 1, the nitrogen content decreased on an average from 15.53 per cent of the fat-free dry matter to 15.13 per cent. If this had been brought about by an increased deposition of glycogen, the increase would have to equal 2.58 per cent of the fat- free dry matter.
Glycogen determinations were made upon the fresh samples of the round taken in experiment 1, using the usual method of alkali decom- position of the tissues and alcohol precipitation of the glycogen. The special technic recommended by Fisher and Lackey {10) was fol- lowed in these analyses. The results for exercised steers, in the order in which they have been arranged in the tables, are 3.92, 3.10, 3.63, and 3.73 per cent of glycogen on the fat-free dry matter basis, aver- aging 3.60 per cent. For the unexercised steers the results are, in the order given in the tables, 2.96, 1.48, 2.45, and 3.28 per cent of glycogen, averaging 2.54 per cent. These values indicate that muscular train- ing may have increased the glycogen content of the dry muscle. Statistical analysis gives a probability of 0.05 that the two series of analyses resulted from the same combination of factors, so that the above interpretation can not be said to have been demonstrated.
930 Journal of Agricultural Research voi. 46, No. lo
THE LIPOID CONSTITUENTS OF THE TISSUES
Since an accumulation of glycogen in the tissues of the trained ani- mals can not reasonably account in full for the reduction in the nitrogen content of the fat-free dry matter, another possibility is that there is an increased content of lipoids in the tissues of the trained animals. It is known that ether will not extract all the lipoids from tissues. Although none of the data obtained in this investigaiton can throw any direct light upon this question, reference may be made, in support of the explanation offered above, to the work of Bloor {3) ,who, in investigations of the lipoid content of a few selected beef muscles, found that the contents of cephalin and lecithin varied from muscle to muscle in the order of what might be considered to be their activity, the more active the muscle the higher its percentage content of phos- pholipid. Furthermore, Cowdry {6) in a recent discussion of the mitochondrial constituents of protoplasm (in all probability largely phosphoHpid in character), has noted the association of mitochondria with intense protoplasmic activity. He says {6, jp. 82):
In cytomorphosis, for example, they are especially numerous in the active stages in the life of the cell and they diminish with senility in both plants and animals. There is a sharp increase in mitochondria with regenerative activity, in compensatory hypertrophy, and in many other conditions.
Of particular interest to the interpretation of the results of these experiments are the following observations of Cowdry:
* * * there is a distinct reciprocal relationship between the amount of mitochondria and the amount of fat. Where there are few mitochondria there is much fat, and vice versa. Decreased oxidation favors the accumulation of fat and increased oxidation favors its elimination, which suggests at once some connection between the amount of mitochondria and oxidation; and their abundance in the active stages of the life of the cell, where protoplasmic respiration is rapid, points to the same conclusion.
Hence, the decrease in ether-soluble constituents observed in the exercised as compared with the unexercised steers (Table 4) may be considered indirect evidence of an increased phospholipid content.
CREATING CONTENT OF THE TISSUES
In experiment 1 creatine was determined in all the tissues. In experiment 2 only six of the samples were thus analyzed. The results obtained have been summarized in Table 7. They are expressed (1), on the protoplasmic basis to eliminate the effect of variations in the fat content of the tissues, (2) on the fat-free and water-free basis, to eliminate the effect of variations in both the fat and the water content of the tissues, and (3) for the data of experiment 1 only the creatine nitrogen is expressed as a percentage of the total nitrogen.

May 15,1933 Efect oj Musculav Exevcises on Tissues of Beef Cattle 931
TABLE 7.—Creatine content of the tissue samples from steers on heavy and on light work, and from unexercised steers
EXPERIMENT 1, HEAVY WORK, PERCENTAGE OF CREATINE ON THE PROTOPLASMIC BASIS
Heart Liver
Spe- cial
sample
round
Round muscles Short loin Ribs Flank Chuck
Treatment and steer No. Semi-
mem- brano-
sus
Semi- ten- dino- sus
Biceps fem- oris
Lon- gissi- mus dorsi
Psoas major
Lon- gissi- mus dorsi
Obli- quus exter- nus ab-
dom- inis
Tri- ceps
brachii
Exercised: 84 0.274
.2.32
.234
.238
0.010 .020 .020 .024
0.440 .380 .380 .389
0.461 .402 .431 .499
0.567 .546 .563 .518
0.466 .484 .461 .465
0.460 .420 .441 .467
0.619 .627 .564 .554
0.469 .424 .448 .485
0.456 .399 .405 .449
0.406 9 _ - .427 62 - .402 34_ .419
Average.- .245 .019 .397 .448 .549 .469 .447 .591 .457 .427 .414
Unexercised: 23 21 .-
.245
.263
.263
.276
.012
.020
.044
.058
.515
.470
.428
.439
.434
.437
.461
.511
.525
.577
.686
.639
.443
.473
.469
.503
.414
.477
.437
.484
.519
.663
.533
.597
.450
.477
.426
.491
.463
.473
.416
.434
.381
.439 43 . - _ .444 36 .448
Average .262 .034 .463 .461 .582 .472 .453 .578 .461 .447 .428
EXPERIMENT 1, HEAVY WORK, PERCENTAGE OF CREATINE ON THE FAT-FREE AND WATER-FREE BASIS
Exercised: 84 9 62 34 _ - -
1.41 1.17 1.24 1.26
0.035 ,071 .071 .084
1.81 1.56 1.60 1.66
1.93 1.65 1.81 2.09
2.37 2.29 2.38 2.16
1.97 2.03 1.96 1.98
1.90 1.77 1.83 1.96
2.76 2.72 2.56 2.50
2.03 1.79 1,94 2,09
1.97 1.65 1.72 1.88
1.73 1.82 1.77 1.87
Average 1.27 .065 1.66 1.87 2.30 1.99 1.87 2,64 1,96 1.81 1.80
unexercised: 23 21
1.33 1.43 1.48 1.46
.044
.074
.166
.224
2.23 2.06 1.88 1.86
1.84 1.87 2.07 2.15
2.20 2.51 2.54 2.70
1.91 2.08 2.00 2.22
1.76 2.02 1.87 2.02
2.40 3.06 2,44 2.70
1.96 2.07 1.95 2.09
2.10 2.12 1.78 1.91
1.76 1.97
43 1.97 36 1.96
Average 1.42 .127 2.01 1.98 2.49 2.05 1.92 2.65 2.02 1.98 1.92
EXPERIMENT 1, HEAVY WORK, CREATINE NITROGEN AS A PERCENTAGE OF THE TOTAL NITROGEN
Exercised: 84 9 - -
3.16 2.64 2,73 2,70
0.101 .197 .201 .240
3.94 3.37 3,42 3,54
4.25 3.68 3.85 4.52
5.16 4.85 4.93 4.51
4.32 4.23 4.27 4,21
4.27 3.84 3.98 4.34
5.67 6.02 5.46 5.30
4.45 3,93 4,14 4,49
4.36 3.63 3.81 4.05
3.87 4.03
62 3.85 34 4.07
Average 2.81
2,96 3.12 3,22 3.14
.185
.119
.193
.430
.550
3,57
4,72 4,26 3.92 3.98
4.08
3.96 4.03 4.21 4.64
4.86
4.84 5.35 5.25 5.58
4.26
4,20 4.37 4,37 4.70
4,11
3,93 4,39 4,06 4.36
5.61
4.80 6.56 5.26 5.98
4,25
4,15 4.42 4.05 4.48
3.96
4.37 4,57 3.88 4,00
'3.96
Unexercised: 23 - - 3.92 21 4.16 43 - 4,37 36 4.21
Average 3.11 .323 4.22 4.21 5.26 4,41 4.19 5.65 4.28 4.21 4.17
179377—33-

932 Journal oj Agricultural Research Vol. 46, No. 10
EXPERIMENT 2, LIGHT WORK, PERCENTAGE OF CREATINE ON THE PROTOPLASMIC BASIS
Treatment and steer No. Liver Heart Special
sample of round
Round Ribs Shank
Exercised: 80 0.041
.041
.043
.047
0.261 .228 .233 .226
0.441 .434 .459 .425
0.411 .392 .407 .432
0.418 .287 .401 .394
0.358 116, - . .291 119 .346 125 .332
Average— -. .043 .237 .440 .411 .375 .332
Unexercised: 103 .032
.035
.053
.041
.223
.265
.288
.295
.471
.476
.487
.471
.423
.384
.413
.416
.411
.393
.406
.432
.347 117 . - .322 121 .371 129 .364
Average -.. .040 .268 .476 .409 .411 .351
EXPERIMENT 2, LIGHT WORK. PERCENTAGE OF CREATINE ON THE FAT-FREE AND WATER-FREE BASIS
Exercised: 80 0.139
.142
.152
.172
L30 1.22 1.22 L22
1.79 L80 1.90 1.77
1.70 1.67 1.72 1.80
1.76 1.19 1.64 L60
1.46 116 1.28 119 1.43 125 1.41
Average -- - - .151
.121
.132
.206
.153
L24
1.23 1.39 1.52 1.57
L82
1.98 L93 2.04 1.89
1.72 1.55 1.40
Unexercised: 103 L77
L67 1.74 1.71
1.81 1.73 1.74 1.82
1.52 117 1.38 121 . 1.59 129 L51
Average. . -- . -.^ - - .153 1.43 1.96 1.72 1.78 1 50
Of the 11 tissue samples analyzed for creatine in experiment 1, 10 showed smaller average percentages of creatine on the protoplasmic basis for the exercised steers than for the unexercised. While this outcome is suggestive of an effect of muscular training it falls short of a demonstration. The average differences are in the main slight, and the application of statistical analysis, either to the analytical results of individual tissues or of all muscular tissues combined, does not give any clear indication that the creatine content of the tissues of the two groups of steer calves was determined by any factors but those common to both groups. It is worthy of note that the creatine percentages for the different muscle samples are all of about the same order of magnitude, except those for the semitendinosus of the round and the psoas major of the short loin, which contain more than 0.1 per cent more creatine.
The percentages of creatine expressed on the fat-free and water- free basis for experiment 1 offer clearer evidence of a depressing effect of muscular training on the creatine content. All tissue samples show a lower average percentage of creatine for the exercised steers. Statistical analysis of the results of individual tissues reveals a decisive result only in the case of the special sample of round. Here the average difference is 0.35, the standard deviation is 0.145, t is 3,41, and the probability is about 0.015 that the values for the two groups of steers were the result of common factors only. It seems fair to neglect this small probability and to conclude that with respect to this sample some factor operating in one group but not in the other

May 15,1933 Efcct of Musculav Exevcises on Tissues oj Beej Cattle 933
accounted for the average depression in creatine content. This factor could only have been the muscular work imposed on one of the groups of steers.
A comparison of the creatine percentages of the two groups of steers with respect to heart muscle indicates a probability of slightly less than 0.05 that a random operation of common factors alone determined the difference between groups. While this probability is too large to be neglected, it is highly suggestive that muscular training was involved in the production of the lower percentages for the exercised steers.
A further statistical analysis was made by combining all the analyses of muscle samples that contain approximately the same percentage of creatine, except the special sample from the round which gave significant results by itself. The two muscles with a high creatine content, the semitendinosus and the psoas major, were thus excluded. For the remaining six niuscles, the unexercised steers gave an average creatine content of 1.9771 per cent of the fat- free dry matter, while the exercised steers gave an average of 1.8808 per cent, a difference of 0.0963. The standard deviation from these two averages is 0.1260, and the value of t is 2.644; for this value of t and n is 46, the probability desired is about 0.01. It may, therefore, be concluded that the preponderance of evidence shows that pro- longed muscular training has lowered the creatine content of the muscular tissues generally.
The creatine calculations expressed as percentages of creatine nitrogen on the total nitrogen do not reveal any more distinct differ- ences than do the percentages of creatine in the fat-free dry matter.
It is noteworthy that the liver does not show any significant differences in creatine content on any basis of calculation, in contrast with all other comparisons, in which the effect of muscular training was more marked and clear cut with respect to the liver than with respect to any other tissue. This is true not only for the data of experiment 1, but also for the data of experiment 2.
In experiment 2, as in the first experiment, the special sample of round muscles shows the most marked effect of muscular training. The percentages of creatine on the protoplasmic basis show an average difference of 0.036, a standard deviation of 0.0115, and a value of t of 4.43, indicating a probability of considerably less than 0.01 that a chance combination of factors common to both groups of steers accounts for the average difference observed. This probability is small enough to be neglected. For the same sample, the average percentages of creatine on the fat-free and water-free basis for the two groups differ by 0.14 , the standard deviation is 0.0616, the value of t is 3.21, and the probability is about 0.019 that chance factors only were responsible for the group difference. Again, this is small enough to be neglected. The probability that chance factors accounted for the difference between average percentages of creatine for the heart is about 0.05.
If a single analysis is made of the creatine results for the round, ribs, and shank, the probabihty that the average percentages on the protoplasmic basic are the result of common factors only is about 0.10, while, for the average percentages on the fat-free dry matter, the probability is 0.02 0 = 2.52, n = 22). The latter probability is sufficiently low to neglect. It may be concluded, therefore, that in

934 Journal oj Agricultural Research Vol. 46, No. 10
this as well as in the other experiment, the data indicate clearly that prolonged muscular training depresses the creatine content of muscle, an effect that is most clearly discernible only when variations in the fat and water content of the muscle have been eliminated by com- puting the creatine content as a percentage of the fat-free dry matter.
In order to determine the extent to which creatine percentages on the protoplasmic basis in one muscle sample were related to creatine per- centages in other muscle samples from the same carcass, correlations were made between deviations of each group of four percentages from its own mean, and deviations of all other groups, making all possible pairings of deviations relating to the same steer. In experiment 1 288 such pairings were made from all the muscle samples except the heart, and the correlation coefficient is +0.206, perfect correlation being represented by +1. For the four muscle samples of experiment 2, there were 48 possible pairings, and the coefficient of correlation is +0.406. Putting its rightful emphasis upon the former coefficient, it may be concluded that only a slight correlation exists between the creatine content of one muscle and that of another in the same carcass.
COLLAGEN AND ELASTIN CONTENT OF THE MUSCLES
The results of the determinations of collagen and elastin in the muscle tissue, expressed as collagen and elastin nitrogen in per cent of the total nitrogen, are summarized and averaged in Table 8.
TABLE 8.—Collagen and elastin contents of the tissue samples from steers on heavy and on light work and from unexercised steers
EXPERIMENT 1, HEAVY WORK, COLLAGEN NITROGEN AS PERCENTAGE OF TOTAL NITROGEN
Heart
Special sample
of round
Round muscles Short loin Ribs Flank Chuck
Treatment and steer No. Semi-
mem- bran- osus
Serai- ten-
dino- sus
Biceps femoris
Longis- simus dorsi
Psoas major
Longis- simus dorsi
Obli- quus exter- nus ab-
dominis
Triceps brachii
Exercised: 84 n.6
9.3 9.5
13.3
7.5 13.6 4.0 7.8
5.5 6.3 6.3 5.3
5.2 7.7
1L8 14.0
4.6 7.0 8.4 6.9
3.1 5.9 5.1 4.8
4.6 6.8 5.3
10.4
2.9 4.4 4.4 4.6
6.7 10.2 8.4 9.2
5.5 9 7.4 62 . . 6.6 34 10.3
Average 10.9 8.2 5.8 9.7 6.7 4.7 6.8 4.1 8.6 7.4
Unexercised: 23 12.8
11.8 12.8 11.9
8.5 7.5 4.1 8.5
5.4 6.4 7.1 5.0
5.2 8.1
10.7 11.4
4.8 9.1 9.3 7.8
3.2 6.8 5.8 4.4
4.2 6.6 7.6 9.1
3.1 5.6 5.8 5.6
6.0 7.3 8.9 8.6
6.3 21 8.3 43 36
8.3 10.1
Average 12.3 7.2 6.0 8.8 7.8 5.0 6.9 4.9 7.7 8.2
EXPERIMENT 1, HEAVY WORK, ELASTIN NITROGEN Ag NITROGEN
PERCENTAGE OF TOTAL
Exercised: 84 9
0.26 .32 .30 .11
0.16 .11 .26
0.070 .112 .082 .116
L7 2.5 2.0 3.3
0.23 .10 .16 .10
0.062 .042 .051 .080
0.102 .081 .057 .108
0.056 .046 .095 .049
0.143 .100 .087 .200
0.095 .042
62 _ . .110 34 .079
Average .25 .18 .095 2.4 .15 .059 .087 .062 .132 .082
Unexercised: 23 21
.36
.38
.35
.32
.12
.14
.13
.09
.112
.098
.082
.084
2.8 3.0 2.9 2.4
.20
.14
.16
.13
.077
.064
.054
.074
.089
.063
.049
.058
.055
.075
.056
.044
.135
.090
.112
.136
.106
.047 43 36
.100
.072
Average .35 .12 .094 2.8 .16 .067 .065 .058 .118 .081

May 15,1933 Efcct oj Musculav Exevcises on Tissues oj Beef Cattle 935
TABLE 8.—Collagen and elastin contents of the tissue samples from steers on heavy and on light work and from unexercised steers—Continued
EXPERIMENT 2, LIGHT WORK, COLLAGEN NITROGEN AS PERCENTAGE OF TOTAL NITROGEN
Treatment and steer No. Heart
Special sample
of round
Round Ribs Shank Loin end
Short loin Rump Plate Chuck Flank
Exercised: 80 _ 7.5
8.8 7.8 8.3
5.5 5.2 5.3 4.2
12.4 9.5
12.8 12.0
11.2 12.1 13.7 7.8
"24.'7' 23.1
8.6 9.7 8.4
12.0
11.5 9.3
1L6 11.2
1L2 9.5 n.i 12.4
15.4 14.3 15.6 14.4
15.7 14.3 15.5 16.1
13.6 116 14.1 119 125 - -
12.4 12.6
Average. - 8.1 5.0 n.7 11.2 23.9 9.7 10.9 n.o 14.9 15.4 13.2
Unexercised: 103 8.4
5.1 7.9 5.3
10.7 12.6 11.1 12.0
13.8 13.4 8.3
13.1
23.3 26.4 21.1 2L6
11.4 n.6 10.5 11.7
12.2 11.2 1L8 10.2
13.2 n.o n.6 13.4
12.8 16.0 14.4 14.0
14.8 15.7 16.3 16.3
117 121
11.8 8.0 7.8
14.9 16.4
129 10.6
Average 9.2 6.7 n.6 12.2 23.1 n.3 11.4 12.3 14.3 15.8 14.0
EXPERIMENT 2, LIGHT WORK, ELASTIN NITROGEN AS PERCENTAGE OF TOTAL NITROGEN
Exercised: 80 .. 0.20
.22
.20
.20
0.082 .110 .116 .062
0.48 .37 .42 .47
L03 .81 .92 .94
0.08 .25 .36
0.16 .12 .18 .11
0.43 .22 .40 .38
0.26 .18 .20 .20
2.0 L2 L6 L4
0.49 .40 .40 .49
1.71 116._ .69 119 1.33 125 - 1.08
Average .20 .092 .44 .92 .23 .14 .36 .21 L6 .44 L20
Unexercised: 103 .118
.180
.101
.097
.58
.29
.25
.71
.99
.93
.70 LIO
.10
.15
.20
.32
.20
.17
.14
.10
.43
.46
.29
.36
.28
.21
.21
.30
2.1 L6 L2 2.0
.57
.49
.43
.51
117 121
.36
.39
.19
L34 .96
129 L09
Average - .31 .124 .46 .93 .19 .15 .38 .25 L7 .60 1.13
It was evident during the making of these determinations that the collagen results were too high, due to the inclusion in the gelatin fil- trates of nongelatin material identified by its content of tryptophane. The determinations of experiment 2 were run in no orderly fashion, but those of experiment 1, undertaken the following year, were run in pairs, so that, for each muscle tissue, a sample from an exercised and an unexercised steer were run simultaneously. In each determination, the gelatin filtrate was tested for tryptophane by the Ehrlich colori- metric reagent, and each test was graded roughly according to the intensity of color as faint, medium, and strong. When these tests were assembled and compared at the end of the experiment, it was evident that there was a strong tendency for determinations made simultaneously to give similar tryptophane colorations in the gelatin filtrates. Of 39 such simultaneous determinations on which color gradings were recorded, 37 were given equal gradings and only 2 un- equal gradings. It thus appears that, although all collagen deter- minations are too high, those run simultaneously, having been sub- mitted to more nearly equal conditions of time and temperature, contain similar contaminations of nongelatin nitrogen in the gelatin filtrate and hence are comparable.
The steers in experiment 1 were paired for collagen determinations as follows: Nos. 84 and 23, 9 and 21, 62 and 43, and 34 and 36.

936 Journal of Agricultural Research Vol. 46, No. 10
When the determinations are thus paired, and the result for the exercised steer of each pair is subtracted from the result for the un- exercised steer, the differences collected in Table 9 are obtained.
TABLE 9.—Differences in the 'percentage of collagen nitrogen between the tissues from pairs of steers upon which determinations were made simultaneously, Experi- ment 1, heavy work
Heart Special sample ofround
Round muscles Short loin Ribs Flank Chuck
Pair composed of steers, Nos. Semi-
mem- brano-
sus
Semi- tendi- nosus
Biceps femoris
Longis- simus dorsi
Psoas major
Longis- simus dorsi
Obli- quusex- ternus
abdom- inis
Triceps) brachii
84 and 23 _ _ 1.17 2.52 3.32
-1.46
1.05 -6.10
.13
.72
-0.14 .11 .80
-.28
0.04 .41
-1.09 -2.53
0.18 2.06 .86 .89
0.09 .96 .72
-.40
-0.34 -.25 2.29
-1.30
0.21 1.12 .94
1.02
-0.70 -2.82
.56 -.62
0.73 9 and 21 87 62 and 43-- _ 1.70 34 and 36 -.22
It will be noted that, of the 40 differences, 26 are positive and 14 are negative, indicating that in general the muscles from the exer- cised steers contained less collagen than the muscles from the unex- ercised steers. Furthermore, one of the negative differences involves an aberrant result on the special round sample of one of the exer- cised steers (No. 9), a result that is much higher than any other and may represent a different type of muscle sample than the others, in- cluding a different selection of muscles or possibly the inadvertent inclusion of more tendinous tissue.
If all of the differences, with the exception of the difference above noted representing the special round comparison of steers 9 and 21, are averaged, a result of +0.29 ±0.13 is obtained. Since this differ- ence is only a little more than twice its probable error, it is not statis- tically significant, but it is nevertheless suggestive of an effect of muscular training.
Among the comparisons of collagen analyses on the individual muscles, only two, that for the biceps femoris of the round and the longissimus dorsi of the ribs, indicate a significant difference between exercised and unexercised steers or a difference approaching signifi- cance. In the case of the biceps femoris, the average difference is + 1.00, the standard deviation 0.676, the ratio of the two, 2, is 1.5, and the probability according to Student is only 0.04 that the aver- age is a result of chance. For the longissimus dorsi muscle of the ribs, the average difference is +0.82, the standard deviation 0.36, the ratio z is 2.3, and the probability is only 0.014. If the differences representing the longissimus dorsi muscle in the rib cut and in the short loin are combined, the mean difference is +0.71, the standard deviation 0.53, z is 1.33, and the probability that the mean is the result of a random combination of factors common to both groups of steers is only 0.0049. This and the preceding probability are so small as to be negligible, so that it may be concluded that for this muscle at least the evidence is clear that muscular training has de- creased the collagen content. In the case of no muscle was there any indication approaching significance that muscular training had in- creased the percentage of collagen nitrogen.

May 15,1933 Eßect oj Musculav ExcTcises on Tissues of Beef Cattle 937
The elastin analyses of experiment 1 do not indicate any general significant effect of muscular training, except with respect to the heart muscle. Here, in every pair of analyses, the result on the unexercised steer was greater than that on the exercised, the average difference being 0.10 per cent. The standard deviation of the four differences is 0.0634, the ratio z is 1.66, and the probability that chance produced the average difference is only 0.033.
In experiment 2, involving the lighter intensity of work there are no clear indications of an effect of muscular training, although again there are suggestions that the percentage of collagen nitrogen, and also of ela"fetin nitrogen, have been depressed by work. In 8 of the 11 samples of muscle analyzed, the average percentage of collagen nitrogen was lower for the exercised steers than for the unexercised, and in 9 of the 11 samples the average percentage of elastin nitrogen was lower for the exercised than for the unexercised steers. However, the variations among individual analyses are too great to permit any positive interpretation of these average differences.
An interesting confirmation of these results on the collagen contents of the muscles of exercised and unexercised steers are the results ob- tained on the tenderness of the cooked ribs obtained from the half carcasses not submitted to chemical study. This work was done by the United States Department of Agriculture. A committee trained in the grading of the various factors contributing to the palatability of cooked meat, including its tenderness, tested all of the 16 rib roasts ^ from the steers of this experiment. In addition, the cooked roasts were subjected to a mechanical test for tenderness employing the method described in Technical Bulletin 217 of the United States Department of Agriculture (2). Through the courtesy of the department the writers have been permitted to refer to these results here in so far as they relate to tenderness. In a series of roasts cooked by a carefully standardized method as these were, it is to be expected that tenderness would vary inversely with the coUagen content of the raw meat.
In 1929, when the experiment involved the lesser decree of exercise, there was an indication that the meat from the exercised cattle \yas more tender than that from the unexercised cattle. This conclusion is based upon both the average committee ^radings and the average resistances of the meat to the mechanical device. However, variation among individual roasts, together with the small number involved in each group, detracts from the significance of this indication.
In the 1930 experiment, when there was much more exercise involved and the eight animals were paired, there was a greater differ- ence in tenderness between the exercised and unexercised cattle as shown by the average committee gradings and mechanical tests on the cooked roasts. With three of the four pairs the judges found the meat from the exercised cattle more tender than that from the unexercised cattle. With the other pair the difference was too small to be regarded as of any significance. For that pair of roasts the mechanical test showed, in fact, that exercise had made the meat less tender. With this exception the mechanical test supported the gradings hy the judges.
In addition to the roast, a round steak was cooked from each of the 16 cattle in the two years' work. In 1929 the steaks were from the
6 These rib roasts were taken from the half carcasses not submitted to chemical analysis.

938 Journal of Agricultural Research voi. 46, No. lo
heel of the round and were somewhat lacking in uniformity, due to variations in cutting. For this and other reasons it was impossible to cook (broil) the steaks b;^ a method as well standardized as that employed in roasting the rib cuts. Therefore the value of the data may be questioned but they suggest results in accord with those obtained from the rib cuts from the same experiment.
The round steaks in 1930 were uniformly cut and were taken from a more desirable part of the round than were those of 1929. Again the method of broiling was not standardized, but it is believed that there was greater uniformity in the cooking of the eight steaks than in 1929. Considering both committee gradings and mechanical tests of tender- ness the data suggest that the steaks from the exercised cattle were slightly more tender than those from the unexercised cattle.
Any general statement of results must take into account the small total number of animals involved, the variability observed, and the lack of precision in the methods available for measuring tenderness. Making allowance for them, the data indicate that exercise was a factor contributing to tenderness, but the results can not be looked upon as altogether conclusive. When exercise was light, the com- parative figures suggested that exercise increased tenderness; when exercise was heavy, the comparative figures showed a slightly greater association of tenderness with exercise.
ASH CONTENT OF THE TISSUES
The tissue samples obtained in experiment 1 were analyzed for total ash, but since the results were very uniform and disclosed no effect of muscular training they will not be given in detail. Expressed on the protoplasmic basis, the ash content of the heart samples aver- aged 1.075 per cent, that of the livers, 1.435 per cent, and that of the 72 muscle samples 1.145 per cent. The coefficient of variation of the latter group of results was only 4.45.
SUMMARY AND CONCLUSIONS
The effect of muscular activity on the chemical composition of the tissues of Hereford steer calves has been investigated in experiments covering 2 years. Each experiment involved 8 calves, 4 closely confined and 4 exercised daily on a treadmill. The exercise was continued for 122 days in one year and for 131 days in the other. In one experiment the muscular work imposed was much more intense than in the other, the working period averaging about 3 hours daily as compared with 1 hour daily. All steers were slaughtered at weights of 750 to 850 pounds, and samples of blood, heart, liver, and muscles were taken for analysis. In one experiment the total lean from each of the nine wholesale cuts from one-half of the carcass, separated from all visible fat by knife, constituted the muscle sam- ples. In the other experiment, eight selected muscles were analyzed separately, and in both experiments a special sample of the inner and upper round were taken from the fresh carcasses for immediate study. The results obtained warrant the following statements with reference to the effect of long-continued muscular activity on the chemical characteristics of beef muscle and of other tissues:
No effect on the water, iron, hemoglobin, or red-cell content of the blood was produced.

May 15,1933 Effect oj Musculav Exercises on Tissues of Beef Cattle 939
No effect on the iron and hemoglobin content of the tissues was noted except the iron content of the bone marrow. In the one ex- periment (light work) in which this tissue was examined, muscular work clearly and markedly reduced the iron content.
While the results of the fat determinations suggested that muscular work tends to lower the content of ether-soluble material in all tissues, only the liver showed a clear and decisive effect, evident in both experiments. The results for the heart muscle were more nearly decisive than those for any other muscle sample.
In the experiment involving the heavier degree of work the evidence is clear that work lowers the content of water in liver, heart, and skeletal muscle, the effect on the liver being the most pronounced. The lighter work markedly lowered the water content of the liver, but its effect on the water contained in the muscles was less evident than in the other experiment. These findings were revealed by calculating the water content to the fat-free, so-called protoplasmic, basis.
No evidence was obtained that the condition of the water in muscle, that is, whether bound or free as measured by the heat-of-fusion method, was at all affected by muscular work.
The heavier degree of work distinctly lowered the nitrogen content of the fat-free dry substance in the liver and exerted a general though less distinct depression of this percentage in the muscles. The effect of the lighter degree of work was only evident in the liver. It appears probable that this general reduction in the nitrogen content of the dry substance of the tissues produced by the heavier degree of work is the result of three changes: (1) A decrease in nitrogenous extrac- tives; (2) an increase in glycogen; and (3) an increase in lipoids not extractable by ether.
In both experiments the evidence indicates clearly that prolonged muscular training depresses the creatine content of muscle, an effect that is most clearly discernible only when variations in the fat and water content have been eliminated by computing the creatine con- tent as a percentage of the fat-free dry substance. The muscle sam- ple taken from the carcass immediately after slaughter and analyzed immediately showed this effect of work more clearly than did the muscle samples taken from the chilled carcasses.
Muscular work tends to lower the collagen content of muscle, expressed as a percentage of collagen nitrogen on the total nitrogen. Possibly the muscular work induced a hypertrophy of muscle tissue with no corresponding increase in the conjiective tissue elements.
The ash content of the tissues was not appreciably affected by the kind and degree of muscular work imposed in these experiments.
LITERATURE CITED
(1) AwDEjEWA, M. S., GERASIMOVITCH, W. W., IWANOWA, E. J., MESSINEWA, N. A., PBOWATOROWA, E. L., and SAWTISCH, N. G.
1930. DIE CHEMISCHEN UND PHYSIKALISH-CHEMISCHEN EIGENSCHAFTEN DES BLUTES BEIM RINDE, IHRE SCHWANKUNGEN UND INDIVID- UELLEN UNTERSCHIEDE. Ztschr. Tierzüchtuüg u. Züchtungs- biol. 19 : 128-149, illus.
(2) BLACK W. H., WABNER, K. F., and WILSON, C. V. 1931. BEEF PRODUCTION AND QUALITY AS AFFECTED BY GRADE OF STEER
AND FEEDING GRAIN SUPPLEMENT ON GRASS. U. S. Dept Agr. Tech. Bui. 217, 44 p., illus.

940 Journal oj Agricultural Research voi. 46, No. lo
(3) BLOOR, W. R.
1927. DISTRIBUTION OF UNSATURATED FATTY ACIDS IN TISSUES. II. VOLUNTARY MUSCLE OF BEEF. Jour. Biol. Chem. 72 : 327- 343.
(4) BONNIER, G., JORPES, E., and SKöLD, E.
1929. A STUDY OF SOME BLOOD COMPONENTS IN CATTLE. Ztschr. Tierzüchtung u. Züchtungsbiol. 13 : [343]-370.
(5) BROWN, T. G., and CATHCART, E. P. 1909. THE EFFECT OF WORK ON THE CREATINE CONTENT OF MUSCLE.
Biochem. Jour. 4 : 420-426. (6) COWDRY, E. V.
1918. THE MITOCHONDRIAL CONSTITUENTS OF PROTOPLASM. Carnegie Inst. Wash. Contrib. Embryology 8 (25) : 39-160, illus.
(7) DRASTICH, L.
1928. LE TAUX DE L'HÉMOGLOBINE DANS LES HÉMATIES EST-IL CONSTANT CHEZ TOUS LES ANIMAUX? Compt. Rend. Soc. Biol. [Paris] 98 : 266-267.
(8) EMBDEN, G., and HABS, H. 1927. ÜBER CHEMISCHE UND BIOLOGISCHE VERÄNDERUNGEN DER MUS-
KULATUR NACH ÖFTERS WIEDERHOLTER FARADISCHER REIZUNG. i. MITTEILUNG. Hoppe-Seyler's Ztschr. Physiol. Chem. 171 : [16]-39.
(9) FERDMANN, D., and FEINSCHMIDT, O.
1929. ÜBER DEN EINFLUSS DES TRAINIERENS DES MUSKELS AUF SEINEN GEHALT AM PHOSPHORVERBINDUNGEN. Hoppe-Seyler's Ztschr. Physiol. Chem. 183 : 261-268.
(10) FiSHER, N. F., and LACKEY, R. W.
1925. THE GLYCOGEN CONTENT OF THE HEART, LIVER AND MUSCLE OF NORMAL AND DIABETIC DOGS. Amer. Jour. Physiol. 72 : 43-49.
(11) FISHER, R. A. 1928. STATISTICAL METHODS FOR RESEARCH WORKERS. Ed. 2, reV. and
enl., 269 p., illus. Edinburgh and London. (12) GERHARTZ, H.
1910. UNTERSUCHUNGEN üBER DEN EINFLUSS DER MUSKELARBEIT AUF
DIE ORGANE DES TIERISCHEN ORGANISMUS, INSBESONDERE
IHREN WASSERGEHALT. Pflüger's Arch. Physiol. 133 : [397]- 499 illus.
(13) HAYDEN, C. E., and FISH, P. A.
1928. THE NORMAL BLOOD OF SOME DOMESTICATED ANIMALS. Cornell Vet. 18 : 197-203.
(14) KENNEDY, R. P. 1927. THE QUANTITATIVE DETERMINATION OF IRON IN TISSUES. Jour.
Biol. Chem. 74 : 385-391, illus. (15) KUHL, P.
1919. DAS BLUT DER HAUSTIERE MIT NEUREREN METHODEN UNTER- SUCHT. I. UNTERSUCHUNG DES PFERDE-, RINDER- UND HUNDE- BLUTES. Pflüger's Arch. Physiol. 176 : [263]-284, illus.
(16) JVICCAY, C. M.
1931. THE HEMOGLOBIN AND TOTAL PHOSPHORUS IN THE BLOOD OF COWS
AND BULLS. Jour. Dairy Sei. 14 : 373-378. (17) MARLOFF, R.
1919. DIE FRüHEREN ZäHLUNGEN DER ERYTHROCYTEN IM BLUTE VER- SCHIEDENER TIERE SIND TEILWEISE MIT GROSSEN FEHLEREN
BEHAFTET. Pflüger's Arch. Physiol. 175 : [355]-370. (18) MELLANBY, E.
1908. CREATiN AND CREATININ. Jour. Physiol. 36 I [447]-487, illus. (19) MITCHELL, H. H., HAMILTON, T. S., and HAINES, W. T.
1928. SOME FACTORS AFFECTING THE CONNECTIVE TISSUE CONTENT OF BEEF MUSCLE. Jour. Nutrltion 1 : 165-178.
(20) NEWCOMER, H. S.
1919. ABSORPTION SPECTRA OF ACID HEMATIN, OXYHEMOGLOBIN, AND
CARBON MONOXIDE HEMOGLOBIN. A NEW HEMOGLOBINOM-
ETER. Jour. Biol. Chem. 37 : 465-496, illus. (21) PALLADIN, A., and FERDMANN, D.
1928. ÜBER DEN EINFLUSS DES TRAININGS DER MUSKELN AUF IHREN KREATiNGEHALT. Hoppe-Seyler's Ztschr. Physiol. Chem. 174 : [284J-294.

May 15,1933 Eßcct oj Musculav Exevcises on Tissues of Beef Cattle 941
(22) PROCTER, H. A., and BEST, C. H. 1932. CHANGES IN MUSCLE GLYCOGEN ACCOMPANYING PHYSICAL TRAIN-
ING. Amer. Jour. Physiol. 100 : 506-510. (23) ROBINSON, W.
1928. RELATION OF HYDROPHILIC COLLOIDS TO WINTER HARDNESS OF INSECTS. In Weiser, H., ed., Colloid Symposium Monograph V. 5, p. 199-218, illus. New York.
(24) ROGOZINSKI, F. 1906. ÜBER DEN EINFLUSS DER MUSKELARBEIT AUF GEWICHT, ZUSAM-
MENSETZUNG UND WASSERGEHALT DER ORGANE DES TIERKÖRPERS. Biochem. Ztschr. 1 : [207]-228.
(25) ROSE, W. C, HELMER, O. M., and CHANUTIN, A. 1927. A MODIFIED METHOD FOR THE ESTIMATION OF TOTAL CREATININE
IN SMALL AMOUNTS OF TISSUES. Jour. Biol. Chem. 75 : 543- 548.
(26) SCHENKENBACH, H. 1926. DER EINFLUSS DES WEIDEGANGS AUF DIE BILDUNG VON ROTEN
BLUTKöRPERCHEN IM VERGLEICH ZUR STALLHALTUNG. BRES- lau. (Inaug.-Diss.)
(27) THOENES, F. 1925. UNTERSUCHUNGEN ZUR FRAGE DER WASSERBINDUNG IN KOLLOID-
EN UND TIERISCHEN GEWEBEN. Biochem. Ztschr. 157 : [174]- 186.
(28) VAN SLYKE, D. D., and STADIE, W. C. 1921. THE DETERMINATION OF THE GASES OF THE BLOOD. JoUr. Biol.
Chem. 49 : 1-42. (29) WAGENAAR, M.
1930. ÜBER DEN NACHWEIS DER BLUTMENGE. Ztschr. Analvt. Chem. 81 : 207-212.
(30) WELLS, J. J., and SUTTON, J. E. 1915. BLOOD COUNTS IN THE FROG, THE TURTLE AND TWELVE DIFFERENT
SPECIES OF MAMMALS. Amer. Jour. Physiol. 39 : 31-36. (31) WHIPPLE, G. H.
1926. THE HEMOGLOBIN OF STRIATED MUSCLE. I. VARIATIONS DUE TO AGE AND EXERCISE. Amer. Jour. Physiol. 76:693-707.