Embed Size (px)
Citation preview

Effect of Liberalization on Banking Competition
Gloria O. Pasadilla
Melanie S. Milo
27 June 2005
Philippine Institute for Development Studies
07/20/2005 Slide # 2Pasadilla-Milo
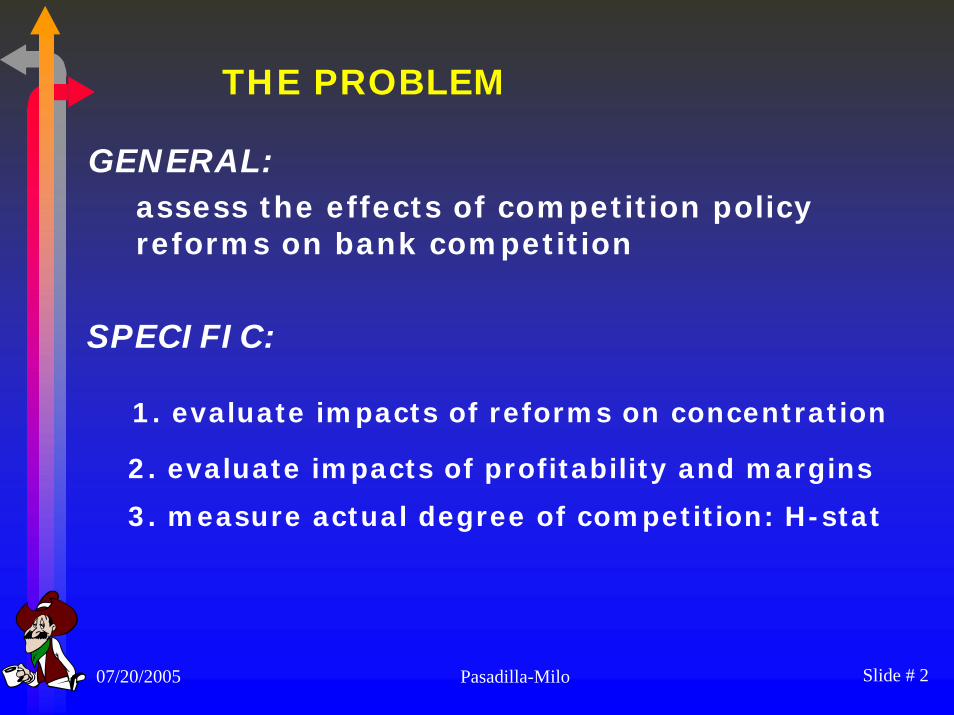
THE PROBLEM
GENERAL:
SPECIFIC:
1. evaluate impacts of reforms on concentration
2. evaluate impacts of profitability and margins
3. measure actual degree of competition: H-stat
assess the effects of competition policy reforms on bank competition
07/20/2005 Slide # 3Pasadilla-Milo
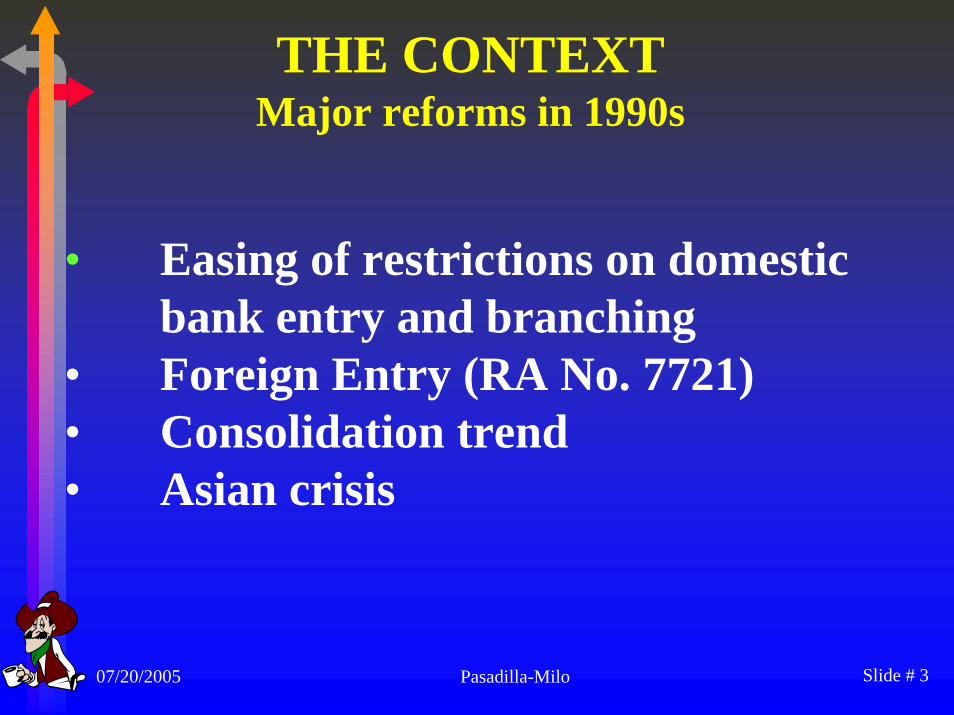
THE CONTEXTMajor reforms in 1990s
• Easing of restrictions on domestic bank entry and branching
• Foreign Entry (RA No. 7721)• Consolidation trend • Asian crisis
07/20/2005 Slide # 4Pasadilla-Milo
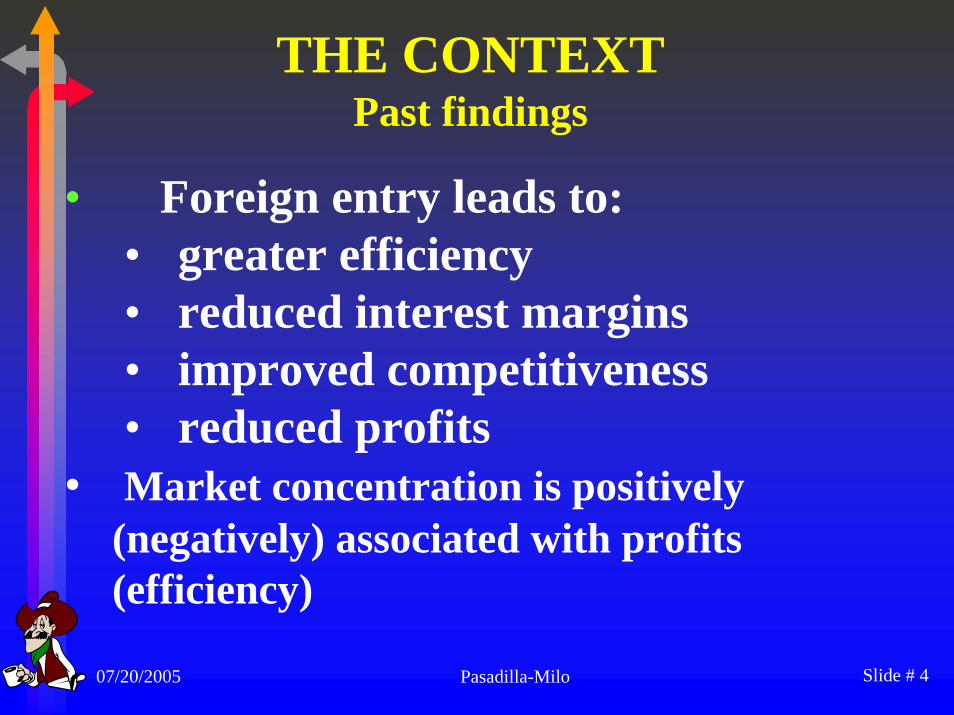
THE CONTEXTPast findings
• Foreign entry leads to:• greater efficiency • reduced interest margins• improved competitiveness• reduced profits
• Market concentration is positively (negatively) associated with profits (efficiency)

07/20/2005 Slide # 5Pasadilla-Milo
Effect on the Number of Banks
0
10
20
30
40
50
60
1985 1995 1996 1997 1998 1999 2000 2001 2002 2003
Total banks Foreign banks
8 domestic, 10 foreign
banks entered
6 bank mergers
07/20/2005 Slide # 6Pasadilla-Milo
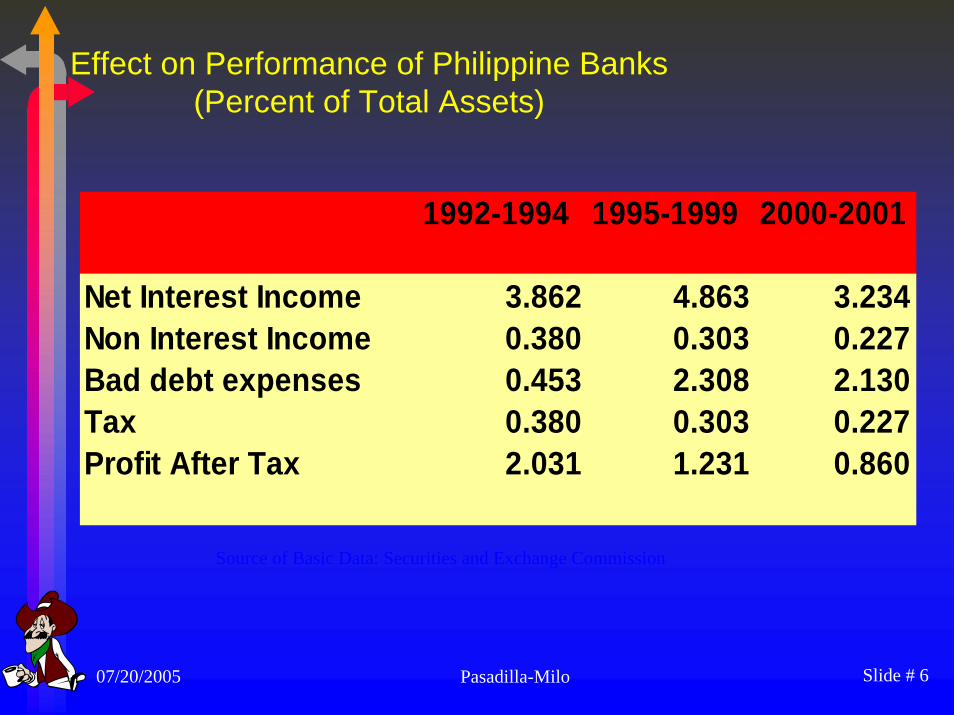
Effect on Performance of Philippine Banks(Percent of Total Assets)
Source of Basic Data: Securities and Exchange Commission
1992-1994 1995-1999 2000-2001
Net Interest Income 3.862 4.863 3.234Non Interest Income 0.380 0.303 0.227Bad debt expenses 0.453 2.308 2.130Tax 0.380 0.303 0.227Profit After Tax 2.031 1.231 0.860
07/20/2005 Slide # 7Pasadilla-Milo
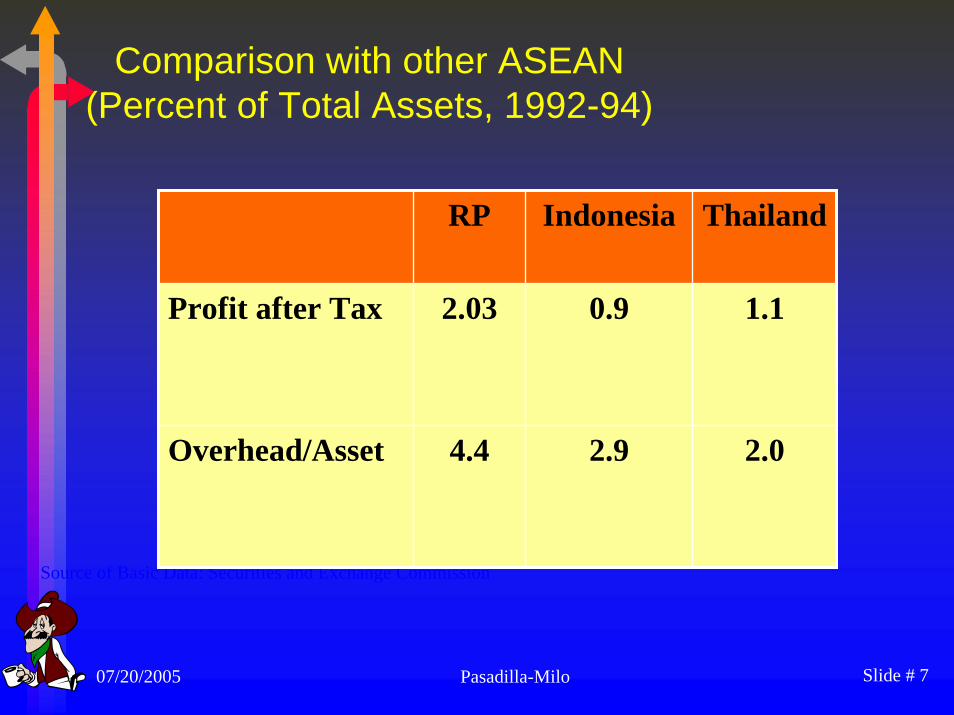
Comparison with other ASEAN(Percent of Total Assets, 1992-94)
Source of Basic Data: Securities and Exchange Commission
RP Indonesia Thailand
Profit after Tax 2.03 0.9 1.1
Overhead/Asset 4.4 2.9 2.0

07/20/2005 Slide # 8Pasadilla-Milo
Effect on MarginsBank Average Lending Rates, Savings and Short-term Deposit Rates and Bank
Interest Spread
Bank Average Short-TermYEAR Lending Rate2 Savings1 Time Deposits
(1) (2) (3) (1-2) (1-3)
1990-94 19.36 9.73 14.67 9.63 4.691995-97 15.25 8.37 10.53 6.88 4.721998-99 15.07 9.14 10.92 5.93 4.162000-03 10.41 5.82 6.94 4.59 3.47
Bank Spread
Source: BSP SPEI, BSP Statistics online.
07/20/2005 Slide # 9Pasadilla-Milo
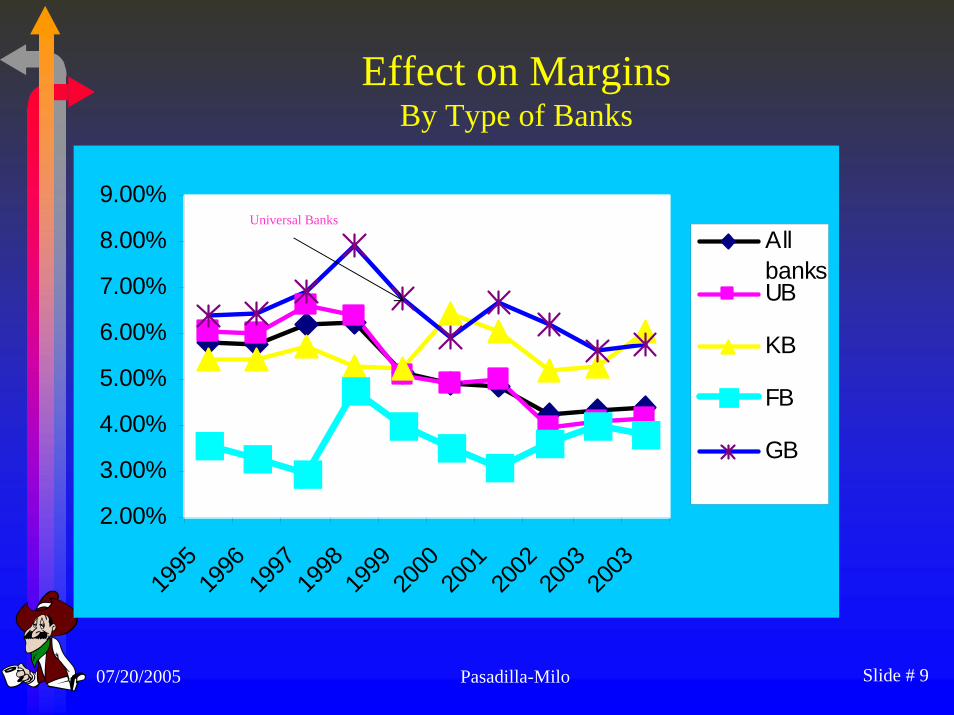
Effect on MarginsBy Type of Banks
2.00%
3.00%
4.00%
5.00%
6.00%
7.00%
8.00%
9.00%
1995
1996
1997
1998
1999
2000
2001
2002
2003
2003
AllbanksUB
KB
FB
GB
Universal Banks
07/20/2005 Slide # 10Pasadilla-Milo
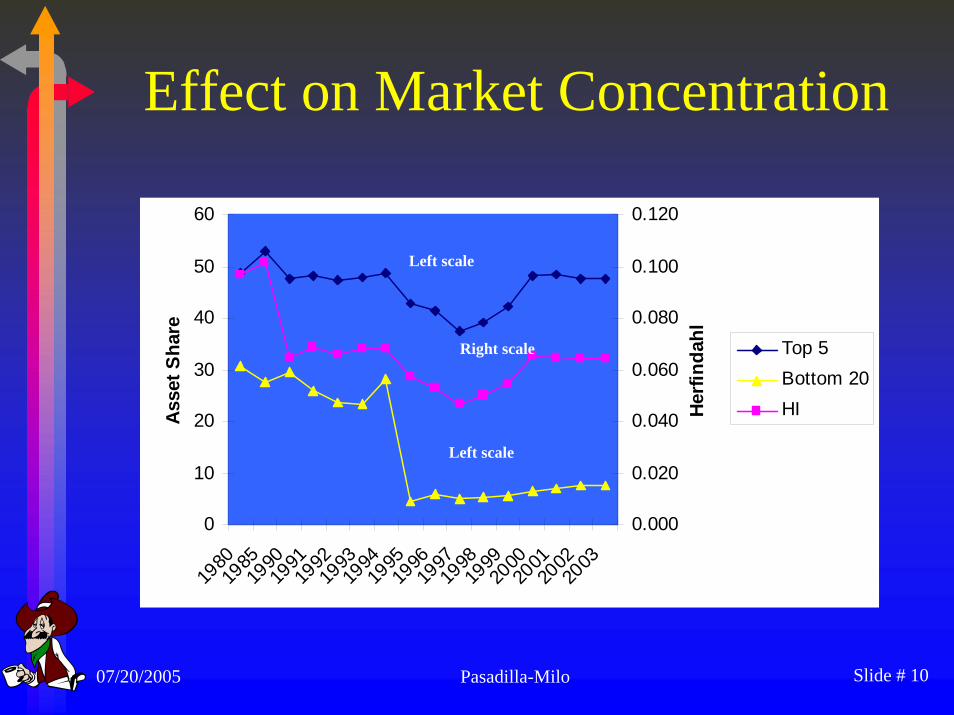
Effect on Market Concentration
0
10
20
30
40
50
60
1980
1985
1990
1991
1992
1993
1994
1995
1996
1997
1998
1999
2000
2001
2002
2003
Ass
et S
hare
0.000
0.020
0.040
0.060
0.080
0.100
0.120
Herfi
ndah
l
Top 5Bottom 20HI
Left scale
Left scale
Right scale
07/20/2005 Slide # 11Pasadilla-Milo
Measuring Competitiveness- Problems with other methods
• margins – affected by many other factors• no exact benchmark for competitive returns
- Alternative Method- Structural or contestability approach e.g. Panzar-Rosse Method

07/20/2005 Slide # 12Pasadilla-Milo
Contestability Literature – short excursion
- S-C-P Paradigm does not always hold
• threat of entry can enforce competition despite degree of concentration
- e.g. US and Canadian Banking market
• conversely, collusive action can exist even when there are many firms
- e.g. small banks in EU countries

07/20/2005 Slide # 13Pasadilla-Milo
Contestability Literature – short excursion
- No definitive relationship between market concentration and degree of competition
• Some found evidence that concentration impairs competitiveness (Bikker and Haaf, 2001)
• degree of competition unrelated to market structure. Contestability and market openness affects competition more (Claessens and Laeven, 2003).

07/20/2005 Slide # 14Pasadilla-Milo
AlternativeMeasure of Competitiveness: H – statistic
- H-stat = sum of revenue elasticities with respect to changes in input prices
H ≤ 0 collusive oligopoly or monopoly
H=1 perfect competition 0<H<1 monopolistic
competition
- Regression of revenue on input prices and other variables that shift either demand or supply of loans
07/20/2005 Slide # 15Pasadilla-Milo
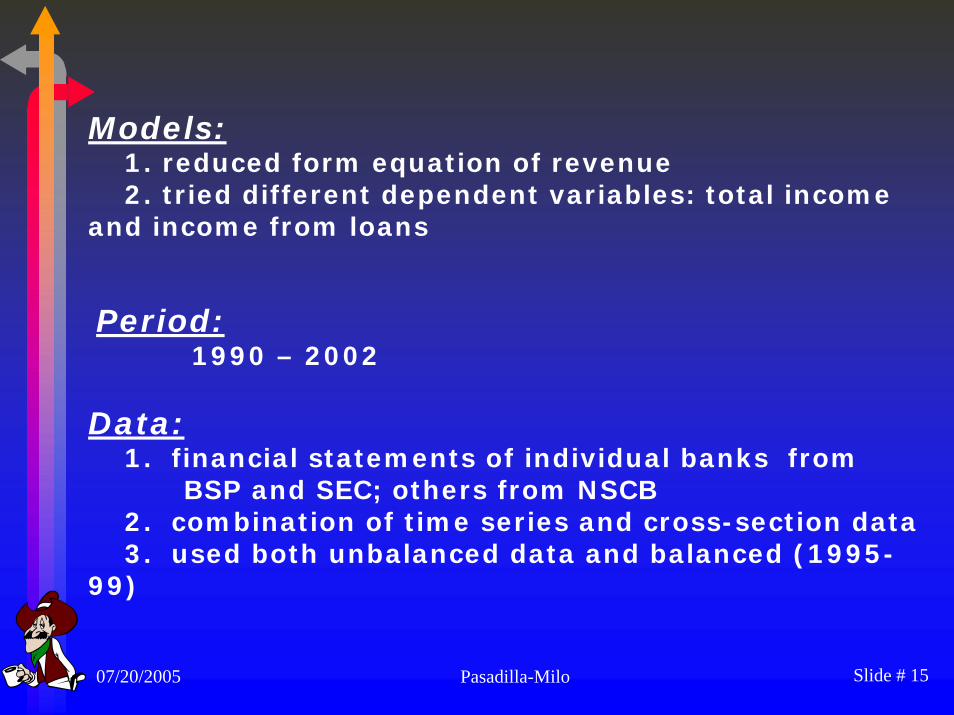
Period:1990 – 2002
Data: 1. financial statements of individual banks from
BSP and SEC; others from NSCB2. combination of time series and cross-section data3. used both unbalanced data and balanced (1995-
99)
Models:1. reduced form equation of revenue 2. tried different dependent variables: total income
and income from loans
07/20/2005 Slide # 16Pasadilla-Milo
MAJOR FINDINGS
1. Banking sector is fairly competitive
2. Competition in Loans business is more intensethan fee generating business
07/20/2005 Slide # 17Pasadilla-Milo
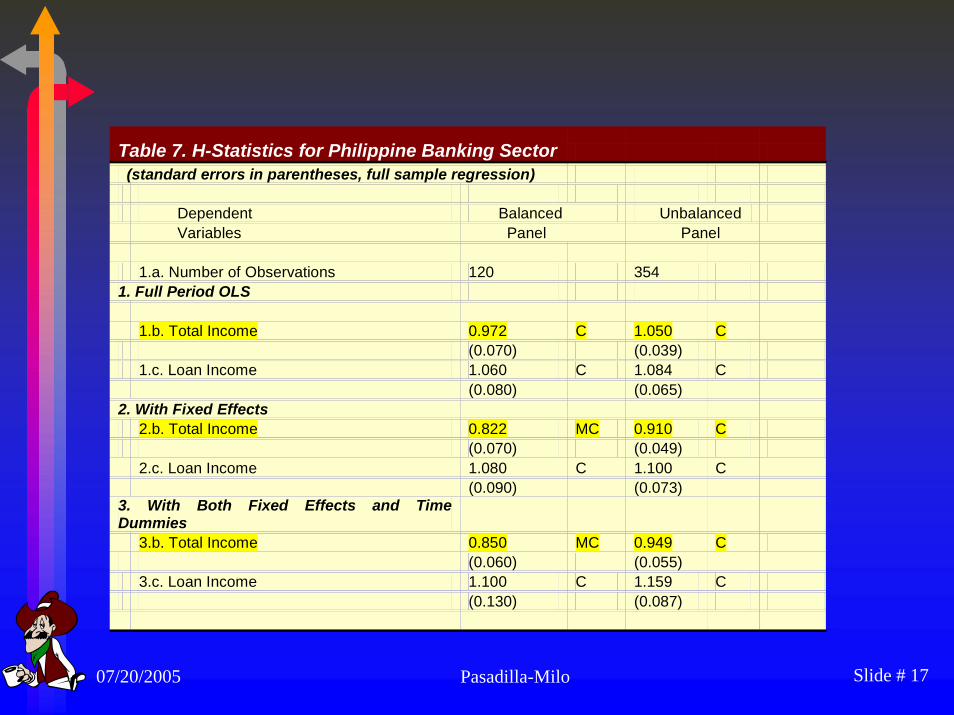
Table 7. H-Statistics for Philippine Banking Sector (standard errors in parentheses, full sample regression) Dependent Balanced Unbalanced Variables Panel Panel 1.a. Number of Observations 120 354 1. Full Period OLS 1.b. Total Income 0.972 C 1.050 C (0.070) (0.039) 1.c. Loan Income 1.060 C 1.084 C (0.080) (0.065) 2. With Fixed Effects 2.b. Total Income 0.822 MC 0.910 C (0.070) (0.049) 2.c. Loan Income 1.080 C 1.100 C (0.090) (0.073) 3. With Both Fixed Effects and Time Dummies 3.b. Total Income 0.850 MC 0.949 C (0.060) (0.055) 3.c. Loan Income 1.100 C 1.159 C (0.130) (0.087)
07/20/2005 Slide # 18Pasadilla-Milo
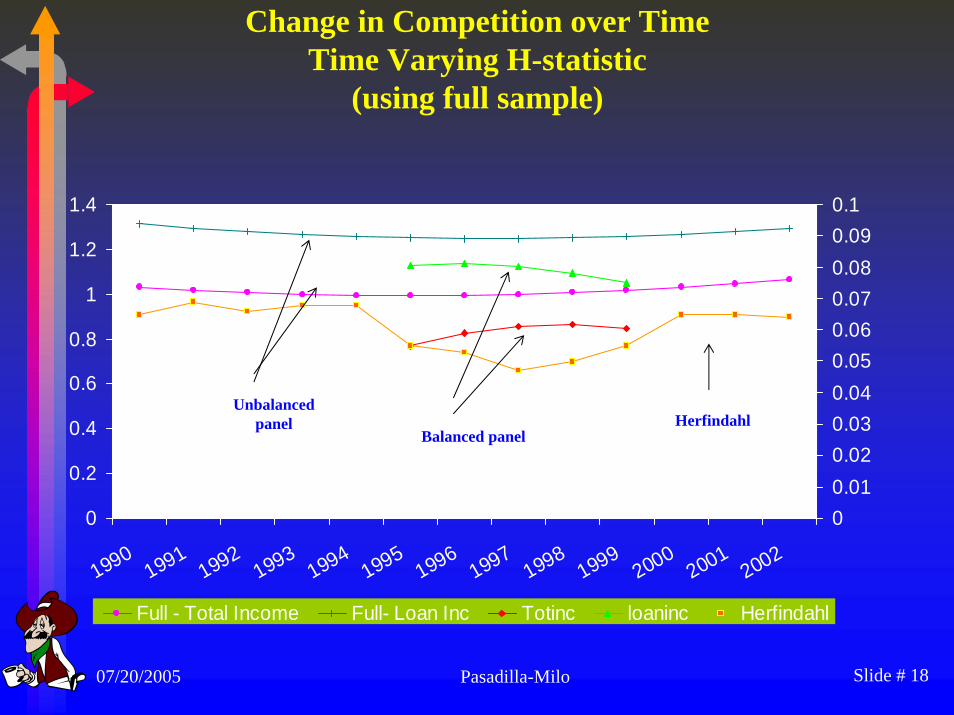
Change in Competition over TimeTime Varying H-statistic
(using full sample)
0
0.2
0.4
0.6
0.8
1
1.2
1.4
19901991
19921993
19941995
19961997
19981999
20002001
2002
00.010.020.030.040.050.060.070.080.090.1
Full - Total Income Full- Loan Inc Totinc loaninc Herfindahl
HerfindahlBalanced panel
Unbalanced panel
07/20/2005 Slide # 19Pasadilla-Milo
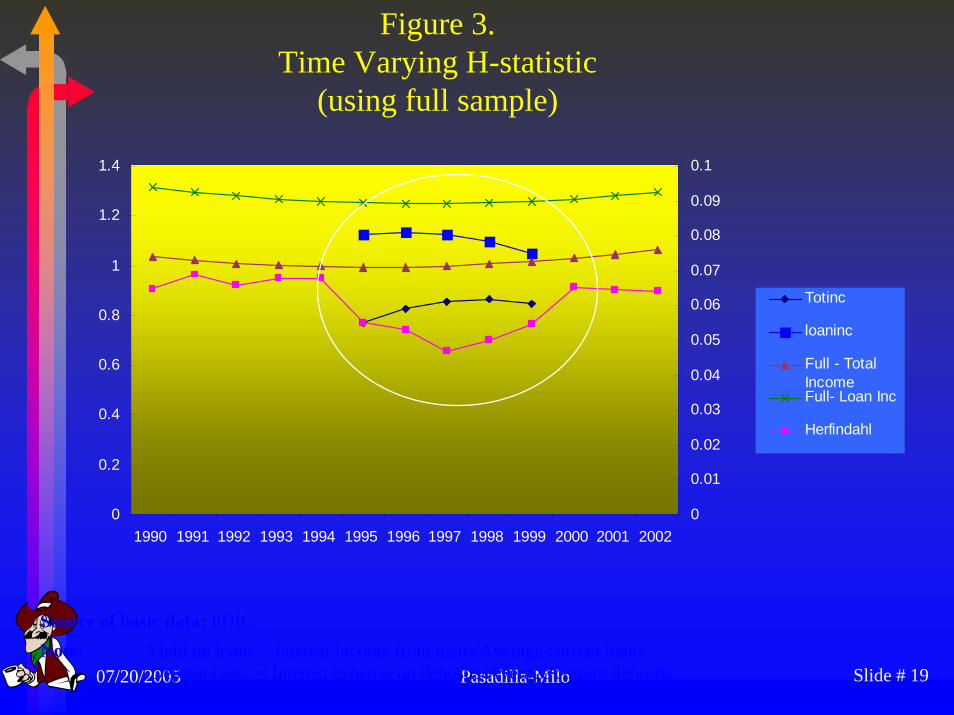
Figure 3.Time Varying H-statistic
(using full sample)
0
0.2
0.4
0.6
0.8
1
1.2
1.4
1990 1991 1992 1993 1994 1995 1996 1997 1998 1999 2000 2001 20020
0.01
0.02
0.03
0.04
0.05
0.06
0.07
0.08
0.09
0.1
Totinc
loaninc
Full - TotalIncomeFull- Loan Inc
Herfindahl
Source of basic data: PDIC.Note: a Yield on loans = Interest income from loans/Average current loans
Deposit cost = Interest expense on deposits/Average current deposits

07/20/2005 Slide # 20Pasadilla-Milo
MAJOR FINDINGS
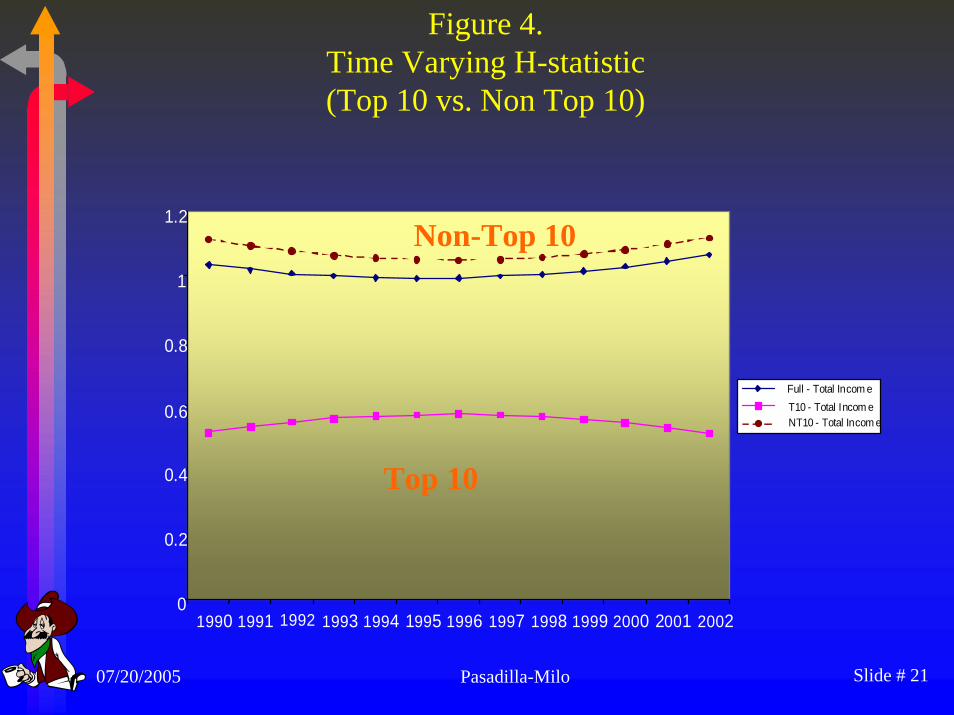
3. Increase in competition among small banks and decrease in competition among big banks
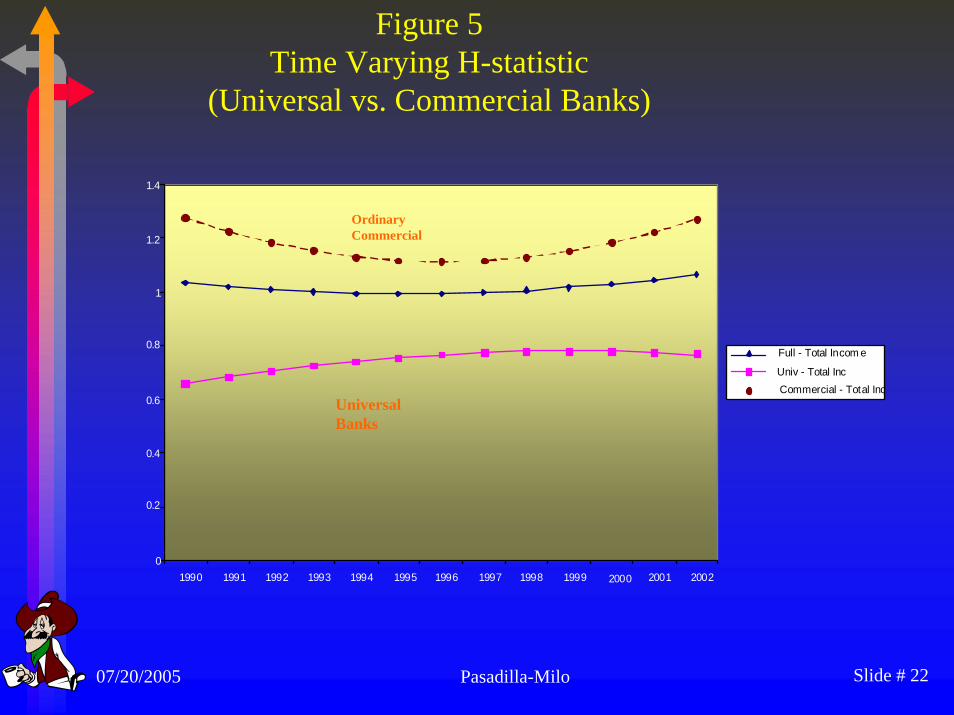
4. Increase in competition among commercial banks and decrease in competition among universal banks
5. Increase in competition among merged banks
07/20/2005 Slide # 21Pasadilla-Milo
Figure 4.Time Varying H-statistic(Top 10 vs. Non Top 10)
0
0.2
0.4
0.6
0.8
1
1.2
1990 1991 1992 1993 1994 1995 1996 1997 1998 1999 2000 2001 2002
Full - Total Incom e T10 - Total Incom e NT10 - Total Incom e
Top 10
Non-Top 10
07/20/2005 Slide # 22Pasadilla-Milo
Figure 5Time Varying H-statistic
(Universal vs. Commercial Banks)
0
0.2
0.4
0.6
0.8
1
1.2
1.4
1990 1991 1992 1993 1994 1995 1996 1997 1998 1999 2000 2001 2002
Full - Total Incom e Univ - Total Inc Commercial - Total Inc
UniversalBanks
Ordinary Commercial

07/20/2005 Slide # 23Pasadilla-Milo
Figure 6Time Varying H-statistic
(Merged vs. Not Merged Banks)
0
0.2
0.4
0.6
0.8
1
1.2
1.4
1.6
1990 1991 1992 1993 1994 1995 1996 1997 1998 1999 2000 2001 2002
Full - Total Incom e Merged - Total Inc Not - Total Inc
Merged Banks
Non-Merged Banks
07/20/2005 Slide # 24Pasadilla-Milo
Summary
Herfindahl index points to no undue concentration
Sector characterized by few large banks and many smallbanks on the fringe
Entry of more market players are correlated with drop in interest spread and profit, possibly due to dissipation of previous monopoly profits
07/20/2005 Slide # 25Pasadilla-Milo
Summary
H-stat disclose no monopoly or collusive behavior. Fairly competitive environment exists.
Trend shows increased banking competition in latter 1990s. Competition is more intense in loan business than in fee-generating services.
Big banks show competition decline and are more monopolisticcompetitors, small banks are more competitive. Much of the increase in competition was due to presence of small banks

07/20/2005 Slide # 26Pasadilla-Milo
PIDS Research Papers can be downloaded at:
www.pids.gov.ph