Embed Size (px)
Citation preview

Listening. Learning. Leading. ®
Effect of Immediate Feedback and Revision on Psychometric Properties of
Open-Ended Sentence-Completion Items
Yigal Attali
Don Powers
John Hawthorn
April 2008
ETS GRE Board Research Report No. 03-15
ETS RR-08-16

Effect of Immediate Feedback and Revision on Psychometric
Properties of Open-Ended Sentence-Completion Items
Yigal Attali, Don Powers, and John Hawthorn
ETS, Princeton, NJ
GRE Board Research Report No. 03-15
ETS RR-08-16
April 2008
The report presents the findings of a research project funded by and carried out under the auspices of the Graduate
Record Examinations Board.
Educational Testing Service, Princeton, NJ 08541

*********************
Researchers are encouraged to express freely their professional judgment. Therefore, points of view or opinions stated in Graduate Record Examinations Board reports do no necessarily represent official Graduate Record Examinations
Board position or policy.
The Graduate Record Examinations and ETS are dedicated to the principle of equal opportunity, and their programs, services,
and employment policies are guided by that principle.
*********************
As part of its educational and social mission and in fulfilling the organization's non-profit Charter and Bylaws, ETS has and continues to learn from and also to lead research that furthers educational and measurement research to advance quality and
equity in education and assessment for all users of the organization's products and services.
ETS, the ETS logos, GRADUATE RECORD EXAMINATIONS, GRE, and LISTENING. LEARNING.
LEADING. are registered trademarks of Educational Testing Service (ETS).
Educational Testing Service Princeton, NJ 08541
Copyright © 2008 by ETS.. All rights reserved.

Abstract
Registered examinees for the GRE® General Test answered open-ended sentence-completion
items. For half of the items, participants received immediate feedback on the correctness of their
answers and up to two opportunities to revise their answers. A significant feedback-and-revision
effect was found. Participants were able to correct many of their initial incorrect answers,
resulting in higher revised scores. In addition, the reliability of the revised scores and their
correlation with GRE verbal scores were higher. The possibility of using revision scores as a
basis for measuring potential future learning is discussed.
Key words: Constructed-response tasks, feedback, answer-revision, computer-based testing,
reliability, validity
i

Introduction
Providing people with feedback regarding their task performance is one of the most
frequently applied of all psychological interventions (see Kulhavy & Stock, 1989, for a review).
Thorndike (1913) provided the initial theoretical arguments for the effectiveness of feedback
with his law of effect, in which feedback was regarded as a contingent event that reinforced or
weakened responses. More recently, the cognitive revolution has provided a new framework for
understanding feedback’s role in learning, highlighting its informational role. From this
perspective, errors are viewed as a source of information about students’ cognitive processes (see
Bruning, Schraw, & Ronning, 1999). Feedback helps learners determine performance
expectations, judge their level of understanding, and become aware of misconceptions. It may
also provide clues about the best approaches for correcting mistakes and improving performance.
Considering the major role that it occupies in learning and instruction, it is curious that feedback
has had almost no role in assessment. In this respect it is helpful to distinguish between
knowledge of one’s performance and allowing revision of one’s response. Although this
distinction has no place in learning and instruction, it is almost ubiquitous in a testing
environment to provide one or the other (or neither) but not both.
The availability of answer review and change options is taken for granted on most paper-
and-pencil tests. For technical reasons, however, it is usually impractical to provide item-by-item
feedback on performance. Researchers have studied answer review and change behavior on
paper-and-pencil tests for some time (for a review, see Waddel & Blankenship, 1995). As a
whole, this research shows that a small percentage of answers is typically changed, that more
answers are changed from wrong to right than from right to wrong, and that a large proportion of
examinees change answers to at least some questions.
Surprisingly, even answer review by itself is less common on computer-based tests
(CBTs), especially when the test items are administered adaptively based on the examinee’s
performance on previously answered items. Arguments against the use of item review on
computer-adaptive tests (CATs) have focused mostly on increases in testing time, possible
reductions in measurement precision, complications in item administration algorithms, and
reduced test score validity resulting from answer-response strategies that yield inflated ability
estimates (Wainer, 1993). In general, examinees strongly favor answer review, presumably
because it provides a less stressful testing experience (Vispoel, 2000).
1
In the context of computer-based tests, knowledge of results, but without answer review,
has also been studied (Betz, 1977). One reason that the combination of immediate knowledge of
results and answer review is not provided in computer-based (non-adaptive) tests may be that
most tests are in multiple-choice (MC) format. With this item format, providing feedback on the
correctness of an answer raises the probability of answering correctly in a subsequent trial simply
as a result of the decreasing number of options.
An exception is the answer-until-correct scoring method (Wilcox, 1982) that provides
both immediate feedback and allows answer review for MC items by providing partial credit
based on the number of trials until the correct option for an MC item is selected. However, this
scoring method is rarely used in assessments. It is also interesting to note that the MC item
format itself inherently provides negative feedback, because examinees who do not find their
answer in the set of options know their answer is not correct.
In summary, traditional assessments rarely provide immediate feedback about the
correctness of an answer with an opportunity to revise answers. However, even in the context of
the tutoring literature where feedback is a major tool for enhancing learning, feedback is
typically provided in an acquisition or training phase, but not when the effects of learning are
assessed. For example, Schmidt, Young, Swinnen, and Shapiro (1989) investigated the timing of
feedback with respect to the acquisition of motor skills. Subjects received feedback about their
performance following a variable number of trials in a motor-skills learning task. When learning
was assessed, however, no feedback was provided. Schooler and Anderson (1990) investigated
the same timing-of-feedback question in the context of learning computer programming skills.
During training, subjects received different types of feedback; however, when the effects of these
types of feedback were tested, no feedback was provided.
Finally, the view of dynamic assessment (Feuerstein, Rand, & Hoffman, 1979) on
feedback should also be considered. In contrast to standard assessments, which are static, the
objective of dynamic assessments is to explore the examinee’s potential for learning. It is based
on an interactive approach to assessment that embeds intervention within the assessment
procedure. This approach is related to Vygotsky's (1934/1986) concept of the zone of proximal
development: the gap between what can be learned unaided and what can be learned with the
help of a more capable peer. The test-teach-retest procedure, whereby the difference in
performance between the two tests is the focus of assessment, is common in dynamic
2

assessment. Embretson (1992) found support for the validity of cognitive modifiability for
predicting learning in a spatial domain. However, as in the tutoring literature, the tests used as
the basis for assessing modifiability are static (MC in Embretson, 1992) and do not provide
immediate feedback and opportunity to revise answers.
The purpose of this study is to investigate the psychometric effects of providing both
immediate feedback on the correctness of an answer and opportunity to revise answers on the
performance of examinees in the test itself. That is, the focus of this study is not on the possible
future learning effects of feedback but on the possibility of using revised answers as the actual
test indicators.
The advance of technology and computerized testing facilitates such an intervention by
making it more feasible to use constructed-response (CR) tasks that can be scored automatically
on the fly (as soon as the student submits the response). In such a CR testing environment it is
possible to inform examinees that an initial answer is incorrect and ask them to revise it, without
encountering the problems noted above for MC tests.
There are a few basic questions concerning such an intervention. The first is whether
examinees will be able to correct their initial errors. It is not at all obvious that simply providing
correctness feedback to an open-ended question can provide enough information to enable the
examinee to correct it. Even if some examinees are able to correct their initial answers, it is not
clear whether their revised answers are valid from a psychometric point of view. In other words,
do revised answers contribute positively to measurement of the construct? Finally, regardless of
the informational contribution of feedback, there is a potential motivational aspect to this
intervention. Would examinees be less or more anxious during the test when they are given
feedback regarding their performance and asked to correct their errors? This last question was
not directly addressed in this study, although the attitudes of examinees toward the feedback
intervention were assessed using a post-test questionnaire.
In this study, we used CR variants of sentence-completion items. Sentence-completions
and vocabulary items are important item types in many standardized tests of scholastic aptitude.
These items measure two basic verbal abilities: (a) knowledge of the meaning and use of words
and (b) understanding of the logical structure of a sentence or an argument.
A significant practical advantage for using CR variants of these items is the fact that the
response to these items is one word (or phrase) in length or a set of single words. This is in
3

contrast to other item types, like reading-comprehension items or essay-writing assessments. One
of the most difficult problems in the large-scale use of CR items is the difficulty of scoring the
responses. This is especially true for verbal domains. As a consequence, it is difficult to
incorporate CR items in large-scale assessments. However, items that require only one word as a
response might be easier to score and thus may be more feasible to use in assessments. In this
study we evaluated the simplest approach to scoring, development in advance of a list of possible
correct answers to each item. In addition, an interactive spell-checker was used to prevent
examinees from submitting incorrectly spelled responses. More sophisticated natural language
processing techniques might have produced more accurate scoring, but the use of such methods
was beyond the scope of this study.
The items used in this study were adapted from disclosed GRE® items; half of these
were vocabulary in context (VIC) items and half were logical structure of sentence (LSS) items.
These two item types appear in the verbal section of the GRE General Test in MC format.
For the VIC items, a complete sentence is presented to the examinee, with one word highlighted
in bold. This word is difficult and the examinee is asked to replace it with another, appropriate
word. An example of this item type is:
The study of successful foreign industries identified strategies for domestic
companies to emulate.
Possible correct answers for this item are imitate and copy.
For the LSS items, an incomplete sentence with one missing word is presented and the
examinee is asked to complete the sentence in a way that best fits the meaning of the sentence.
An example is:
His ____ to explain the operation of the machine led the observers to doubt his
expertise in this field.
Possible correct answers for this example are failure and inability.
These items were administered to registered GRE applicants shortly before their
operational test. The study used a Web-based delivery system that allowed participants to take
the test from any Internet-connected computer. Half of the items were delivered in the feedback
condition, where students received immediate feedback on the correctness of their answer and
could submit up to three answers (or two revisions) if their answer was incorrect. The other half
4

of the items was administered with no feedback and permitted only a single answer. Following
the test the participants were asked several questions about their attitude toward these CR items.
Method
Participants
Study participants were recruited from GRE test registration files. The applicants were
approached by e-mail and invited to participate in a Web-based study to evaluate experimental
item types. As an incentive, five $100 gift certificates were promised to be randomly distributed
among study participants. The applicants were approached one to two weeks before their
operational GRE test date, when test takers’ motivation is thought to be greatest. A total of 253
participants completed the study, 99 in a first administration and 154 in a second administration.
Out of the 253 participants, 240 (95%) were subsequently identified in the GRE scoring files. A
comparison of the study participants with the general population of GRE test takers (GRE Guide
to the Use of Scores, 2005) show that the major difference between the study sample and the
general population was that more examinees are women (73% compared to 54%). The
quantitative score distribution of the study participants (M = 594, SD = 148) is very similar to
that of the general population (M = 597, SD = 148). The verbal scores of the study participants
(M = 516, SD = 115) are higher on average than those of the general population (M = 469, SD =
120), but have similar variability.
Materials
A total of 16 VIC and 16 LSS open-ended items were adapted from regular multiple-
choice GRE sentence-completion items that were included in the GRE Big Book (1995). Both
types of items were further separated into roughly equivalent sets of 8 items (sets A and B). For
each item, two lists were prepared: a list of correct answers and a list of “close-to-correct”
answers that prompted feedback that was different from other incorrect answers. In general, the
LSS item stems were nearly identical to the original MC items. For example, the following
original MC item was adapted:
Only by ignoring decades of mismanagement and inefficiency could investors
conclude that a fresh infusion of cash would provide anything more than a ______
solution to the company's financial woes.
5

1. fair
2. temporary
3. genuine
4. realistic
5. complete
The only change to the stem in the CR version was to replace the a that appears before
the blank with a/an to prevent examinees from eliminating possible answers based on article
agreement. The initial list of correct answers for this item was:
brief, cosmetic, ephemeral, evanescent, fleeting, fugitive, illusory, interim,
momentary, partial, passing, short-lived, short-term, specious, stopgap, superficial,
temporary, transient, transitory
The initial list of near-correct answers was:
arbitrary, deceptive, inadequate, incomplete, minimal, rudimentary
The VIC items generally underwent more extensive adaptations. First, by the definition
of this item type, the blank itself was replaced by a correct difficult word. The original MC items
often had two blanks, so in the CR version one of the blanks was removed. Finally, the target
word itself was sometimes replaced. For example, the following original MC item was adapted:
The belief that science destroys the arts appears to be supported by historical
evidence that the arts have _____ only when the sciences have been _____ .
1. declined..attacked
2. flourished..neglected
3. matured..unconcerned
4. succeeded..developed
5. floundered..constrained
The CR version was:
The belief that science destroys the arts appears to be supported by historical
evidence that the arts have flourished only when the sciences have been neglected.
6

The initial list of correct answers for this item was:
bloomed, blossomed, boomed, burgeoned, flowered, prospered, succeeded, waxed,
thrived
The initial list of near-correct answers was:
coalesced, developed, grown, stabilized
Procedure
Test administration used an existing testing platform that had been developed at ETS (the
C3 platform). The examinees used their Web browser to navigate to a login page that was
included in the invitation e-mail. After viewing an initial introduction and general instructions
page, the examinees answered two example items (the items presented above in the
introduction). The examinees were randomly assigned to one of four test forms that differed by
whether the A item or the B item sets were presented with feedback, and whether the feedback
items were presented before or after the no-feedback items (see Table 1). Both the feedback and
no-feedback sections were timed at 25 minutes (for 16 items). In each section, the 8 LSS items
were presented before the 8 VIC items. The order of the items within type and section was
constant. Following the test, the survey questions were presented, and finally, the participants
received a report with all their answers and the correct answers.
Table 1
Order of Section Presentation
Feedback position
Feedback set Feedback first Feedback second
A FA – NFB NFB – FA
B FB – NFA NFA – FB
After a first administration was completed (with 99 examinees), all the incorrect answers
(that is, the answers that were not in the correct or near-correct lists) were scored by human
content experts. The answers that were found to be correct were added to the lists of correct
answers, and a second administration of the test was conducted with 154 examinees.
7
Results
The analysis of results from the first administration revealed that two LSS items, one from
the A list and another from the B list, were problematic in that many different answers could in
fact be regarded as correct answers. Consequently, all the analyses excluded these two items.
Analysis of Answers
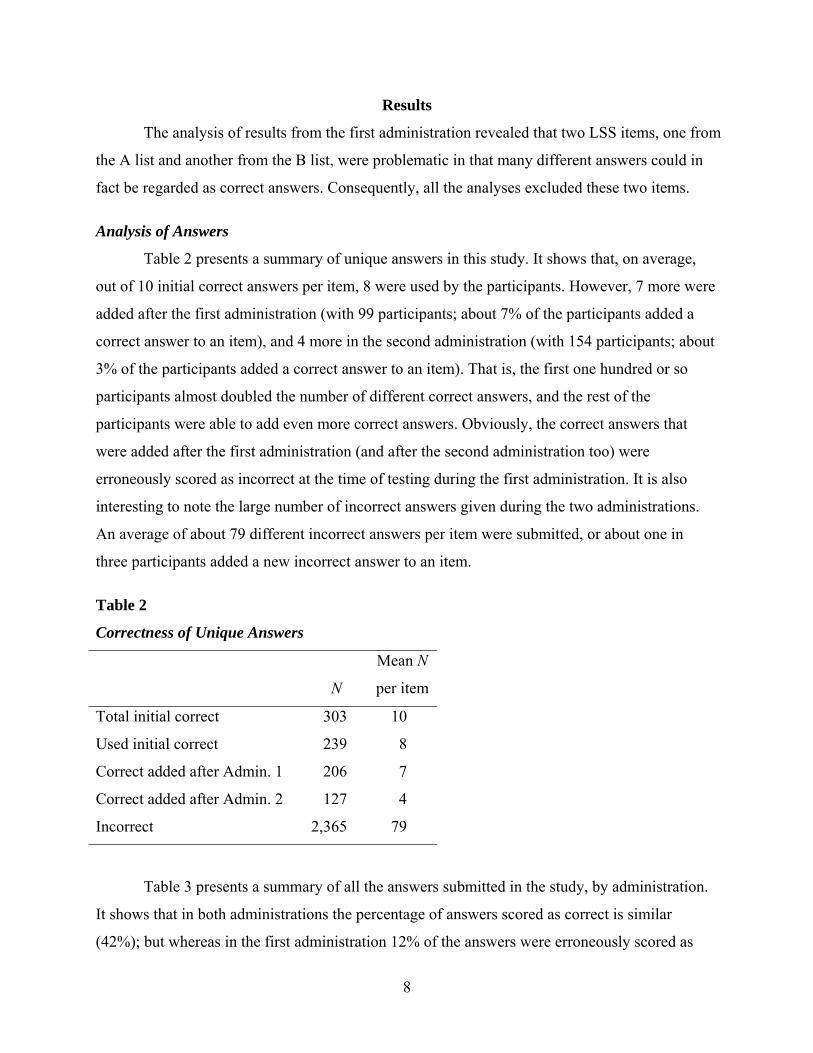
Table 2 presents a summary of unique answers in this study. It shows that, on average,
out of 10 initial correct answers per item, 8 were used by the participants. However, 7 more were
added after the first administration (with 99 participants; about 7% of the participants added a
correct answer to an item), and 4 more in the second administration (with 154 participants; about
3% of the participants added a correct answer to an item). That is, the first one hundred or so
participants almost doubled the number of different correct answers, and the rest of the
participants were able to add even more correct answers. Obviously, the correct answers that
were added after the first administration (and after the second administration too) were
erroneously scored as incorrect at the time of testing during the first administration. It is also
interesting to note the large number of incorrect answers given during the two administrations.
An average of about 79 different incorrect answers per item were submitted, or about one in
three participants added a new incorrect answer to an item.
Table 2
Correctness of Unique Answers
N
Mean N
per item
Total initial correct 303 10
Used initial correct 239 8
Correct added after Admin. 1 206 7
Correct added after Admin. 2 127 4
Incorrect 2,365 79
Table 3 presents a summary of all the answers submitted in the study, by administration.
It shows that in both administrations the percentage of answers scored as correct is similar
(42%); but whereas in the first administration 12% of the answers were erroneously scored as
8

incorrect, in the second administration only 3% of the answers scored as incorrect were
subsequently found as correct. If we look at the first administration as a small pretest, we can
conclude that, although a significant number of new correct answers were added after the pretest
(in the second administration), overall the percentage of incorrect scoring decisions after the
pretest is small.
Table 3
Correctness of All Answers
Admin. 1
(99 students)
Admin. 2
(154 students)
Correct 1,763 (42%) 2,799 (42%)
Correct, scored as incorrect 487 (12%) 189 (3%)
Incorrect 1,951 (46%) 3,623 (55%)
The extreme skewness of the frequency of use of answers can be seen in Table 4. It
shows that 74% of the incorrect answers were given only once (out of 253 participants).
Table 4
Relative Frequency of Occurrence of Answers, by Real Correctness
Frequency Incorrect Correct
1 74% 36%
2 12% 15%
3 5% 9%
4 3% 5%
5 1% 5%
6 1% 4%
> 6 4% 24%
Success in Revision
An important question in the context of this study is, to what extent can participants correct
their previous incorrect answers in response to the feedback they received? The overall percentage
correct of first answers in the feedback condition was 50%. Table 5 shows that 26% of second
9

answers (that is, revised answers of initially incorrect answers in the feedback condition) were
correct, and 15% of third answers were correct. Since 50% of the first answers in the feedback
condition were correct, these figures mean that the first revision raised the overall percentage
correct from 50% to 63% (26% of the initial 50% incorrect responses), and the second revision
raised the overall percentage correct further, from 63% to 69% (15% of the 74% second
submissions that were not corrected of the initial 50% incorrect responses). These are noteworthy
results considering that the feedback only indicated the incorrectness of the current answer.
Table 5
Success in Revision
First
answer
Second
answer
Third
answer
% of all answers 100% 50% 37%
% correct of attempts 50% 26% 15%
Cumulative % correct 50% 63% 69%
Breakdown of revision answers
Not revised 12% 29%
Revised correctly 26% 15%
Revised incorrectly 61% 56%
The previous analysis did not take into account whether the incorrect response that was
revised was later found to be correct after all. When the success of first revisions (second
answers) is broken down by the true correctness of the first answer, we get 25% success in
revision for truly incorrect first answers versus 38% success for truly correct first answers. For
the second revision, we get 14% success in revision for truly incorrect second answers versus
30% success for truly correct second answers. Although these figures show greater success for
revisions of truly correct answers, they are not dramatically different from revisions of truly
incorrect answers.
Test Scores
Table 6 presents descriptive statistics, reliabilities, correlations with GRE Verbal
(GRE-V) scores, and correlations between feedback and no-feedback subtests for various test
10

scores. All analyses are based on actual scores computed during the test, and not on true scores
following the response review after administrations. The scores presented are the first-answer
score, a partial-credit score that assigns 1/2 of a point for a second-attempt correct answer and no
credit for a third-attempt correct answer, a partial-credit score that assigns 2/3 of a point for a
second-attempt correct answer and 1/3 of a point for a third-attempt correct answer, and a score
based on the best of all answers (the maximum score). These scores increasingly depend on
information from later attempts. For the items answered in the no-feedback subtest, only the first
score exists.
Table 6
Test Score Reliabilities and Correlations (Based on 15 Items, 253 Examinees)
M SD αa rva rf
a Corrected rf
Without feedback
First answer 7.80 2.86 .620 .635
With feedback
First answer 7.43 3.02 .669 .703 .603 .937
Partial-Credit 2b 8.40 2.99 .726 .717 .628 .936
Partial-Credit 3b 9.01 2.99 .750 .713 .628 .921
Maximum 10.23 3.14 .742 .668 .598 .882
a α, rv (GRE-V correlation), and rf (correlation between feedback and no-feedback scores) are
averages of two figures based on which items (A or B) examinees answered in feedback
condition. b Partial-Credit 2 assigns 1/2 of a point for a second-attempt success. Partial-Credit 3
assigns 2/3 of a point for a second-attempt success and 1/3 for third attempt.
Beyond the mean and standard deviation (SD) of scores, the table presents coefficient
Cronbach alpha estimates of reliability, correlations with GRE-V scores and, for the scores in the
feedback subtest, correlations between feedback scores and no-feedback scores. Since examinees
differed with respect to which items (the A items or the B items) were answered with feedback,
the reliabilities and correlations presented are the averages for the two groups. Finally, rf is also
corrected for unreliability of scores by dividing it by the square root of the product of reliabilities
in the two subtests.
11

Two effects are of interest here. The first is the feedback effect; that is, the comparison
between first-answer scores with and without feedback. (The question is, can the mere effect of
knowing that a second chance of answering the item would be given make a difference in the
first answers with respect to success in answering, reliabilities, and correlations with the GRE
scores?) The second is the combined feedback-and-revision effect, the comparison between first-
attempt scores without feedback and feedback scores based on later attempts.
With respect to mean scores, the table shows that, surprisingly, there is a negative feedback
effect. The first-attempt scores with feedback are actually lower than those without feedback.
These within-subject differences are significant (M = .38, SD = 2.79, t(252) = 2.14, p = .03, two-
tailed, d = .14). A possible explanation for this effect is that when test takers knew they would not
get another chance to answer, they tried harder in the first (and only) attempt they had.
The combined feedback-and-revision effect on scores is significant for all feedback
scores. Even when partial-score 2 is compared to first-attempt scores without feedback, the
within-subject differences are significant (M = .60, SD = 2.70, t(252) = 3.54, p < .001, one-tailed,
d = .22), with a small effect size (Cohen, 1988). For partial-score 3, the effect size is .45 (still
small) and, for the maximum score, it is .86 (large).
The feedback effect on correlations with GRE-V is not significant. The (correlated)
correlation of the first answer in the feedback condition (.703) is higher, but not significantly
higher, than the correlation of the first answer in the no-feedback condition (.635) (z = 1.72,
p = .085, two-tailed; see Meng, Rosenthal, & Rubin, 1992, for details on comparing correlated
correlations). The combined feedback-and-revision effect on GRE-V correlations (the difference
between the .635 correlation in the no-feedback condition to the partial-credit correlations) is
significant for partial-score 2 (z = 2.16, p = .015, one-tailed) and partial-score 3 (z = 2.05,
p = .020, one-tailed), but not for the maximum score (z = .81, p = .210, one-tailed).
The feedback effect on reliabilities is not significant. The Cronbach alpha of first
attempts in the feedback condition (.669) is higher, but not significantly, than the Cronbach alpha
in the no-feedback condition (.620) (t = 1.37, p = .17, two-tailed; see Feldt, Woodruff, & Salih,
1987, for details on comparing correlated coefficient alphas). However, the combined feedback-
and-revision effect on reliabilities is significant for all feedback scores—Partial-Credit 2
(t = 3.34, p < .001, one-tailed), Partial-Credit 3 (t = 4.29, p < .001, one-tailed), and maximum
score (t = 3.85, p < .001, one-tailed).
12

Finally, the corrected correlations between no-feedback scores and feedback scores range
from .94, when only first-attempt feedback scores are considered, to .88, when maximum scores
are considered. The correlations are monotonically decreasing as more information from later
attempts is considered.
Response Time
In this study, response times were recorded per item rather than per attempt. This
prevents us from analyzing the amount of time examinees took to answer in each of their
attempts. In the following analyses, the longest response times of over 219 seconds per item
(99th percentile value) were not included.
Table 7 presents a summary of item-response times for the measurable conditions (in this
study) formed by feedback, correctness of final response, and number of attempts. The overall
comparison between feedback and no-feedback conditions (means in the “All” column) shows
that the mean response time for all attempts in the feedback condition (47 seconds) was higher
by 12 seconds than the mean response time without feedback (35 seconds). The median
difference is only 8 seconds. One can also compare the correct responses in the first attempt and
see that the mean response time in the feedback condition is lower (26 seconds versus 32
seconds). This provides further evidence to the hypothesis that examinees in the feedback
condition were less careful in their first attempt.
Table 7
Mean and Median Response Times (Seconds)
Correct Incorrect All
Attempts N M SD Mdn N M SD Mdn N M SD Mdn
Without feedback
1 1966 32 24 25 1,797 39 28 30 3763 35 26 27
With feedback
1 1874 26 18 21
2 490 52 29 46
3 208 76 37 68 1,144 73 41 64 1347 74 40 65
All 2572 35 27 26 1,144 73 41 64 3716 47 36 35
13

The overall feedback-and-revision effect on response time is significant (M = 11.9, SD =
31.8, t(7477) = 16.2, p < .001, one-tailed), but the effect size of d = .37 is small, although
examinees were given up to two more attempts.
Survey Answers
The following table presents the results of the survey questions asked after the test.
Except for the fifth question there were no significant differences between administrations, so the
table shows the results for all examinees.
Table 8
Survey Answers
MC
CR without
feedback and
revision
CR with
feedback and
revision
1. Preference 57% 6% 37% 2. Fairer indicator of ability 29% 25% 46% 3. Least stressful 54% 9% 36% Yes Not sure No
4. Was it helpful to know
feedback will be provided? 73% 17% 11%
None One More than one
5. Were there cases feedback
was incorrect? 31% 35% 34%
No Some degree Considerably
6. Did feedback help correct
answers? 11% 77% 13%
Yes Not sure No
7. Was it helpful to know
answer will be spell-checked? 79% 9% 11%
Note. (N = 254). CR = constructed response, MC = multiple choice.
14

The answers show that examinees prefer an MC test over a CR one (z = 2.14, p = .033,
two-tailed), even with feedback-and-revision opportunity. However, they do feel that the CR test
is a better indicator of verbal ability (z = 6.66, p < .001, two-tailed). Curiously, a large minority
(25%) feel that it is fairer not to provide feedback in a CR test. The responses to the question
about which kind of test is least stressful are very similar to the preference question.
A large majority said it was helpful to know feedback will be provided before they
submitted an answer, although most examinees said they felt the feedback was incorrect at least
once (probably because a large majority acknowledged that the feedback helped them correct
answers, at least to some degree). A breakdown of the overall percentage of examinees saying
there were no errors in feedback (31%) into the two administrations showed only a modest
increase — from 22% in the first administration to 36% in the second. This is not a dramatic
increase and may reflect the fact that, even in the second administration, there were scattered
cases of incorrect scoring. Although examinees were ambiguous about their preference between
MC and CR tests, there seem to be much less hesitation about the receiving feedback and
opportunity to revise answers in an open-ended (OE) test. The answers to questions 1, 2, 3, and
6, show that examinees mostly preferred the feedback condition over the no-feedback condition.
Finally, a large majority of examinees felt it was helpful to know that answers will be spell-
checked before submission.
Discussion
The main purpose of this study was to examine the effect of providing immediate
feedback and opportunity to revise answers in the context of CR sentence-completion items. In
particular, we were interested to know whether examinees are able to improve their scores in
response to feedback that indicated that their answer was incorrect, and whether scores based to
different degrees on the revised answers prove to be more reliable and more highly correlated
with operational GRE verbal scores.
Psychometric Effects
With respect to scores, this study found a significant beneficial effect to providing
feedback and allowing subsequent revision of answers. Examinees were able to increase their
scores considerably by using the second and third chance of answering the items. Their revised
scores were more reliable and had higher correlations with GRE-V scores than scores based on
15

no feedback. The additional answers are valid in the sense that they improve the precision of
measurement.
Even the first answers of examinees in the feedback-and-revision condition were not less
reliable or less correlated with the GRE-V scores than the no-feedback scores. On the contrary,
there was a small, nonsignificant increase in reliability and GRE correlation (despite the small
(but significant) decrease in first-attempt scores and corresponding response times in the
feedback condition compared to no-feedback answers).
The increase in reliabilities can be translated into gains in test length. If we apply the
Spearman-Brown formula to the no-feedback reliability (.620) and predict the amount of
lengthening of the test needed to reach the partial-score 3 reliability (.750) or the maximum score
reliability (.742), we get a factor of 1.84 and 1.76, respectively. That is, the no-feedback test has
to be lengthened by about 80% in order to reach the same reliability of scores based on feedback
and two revisions. Even if the increase in response time in the feedback condition is taken into
account (34%, from 35 seconds to 47 seconds), the remaining gain is still very significant. It is
important, however, to note that simply increasing response times in the no-feedback condition
(either by allowing more time or by somehow forcing examinees to take more time to answer)
will likely have a very small effect on reliabilities, since this test was not speeded (see Attali,
2005, for an exception with highly speeded number-right MC tests).
This means that the beneficial effect on score quality cannot be explained by the
increased time on the task. A plausible explanation is that the feedback enables a cognitive re-
interpretation of the task. With this explanation, the task that the examinee faces after an initial
incorrect response is different from the initial task before the initial answer. Although the item is
the same in both cases, the examinee knowledge is different. In a sense, the second (and third)
attempt forces examinees to solve a different problem than they faced before the first attempt.
With this interpretation, feedback and the opportunity for revision of answers do really add new
items to the test.
In this paper, we did not attempt to find the optimal way to assign scores based on
multiple attempts. Three intuitive scores were computed: a partial-credit score that takes into
account only the first two attempts (with 1/2 a point for a second-attempt success), a partial-
credit score with a reward proportional to the number of attempts, and a maximum score with a
fixed reward irrespective of the number of attempts. A comparison of the quality of these three
16

scores showed that maximum reliability was achieved for Partial-Credit 3, and maximum
GRE-V correlation was achieved for Partial-Credit 2. The corrected correlations between these
feedback scores and the scores based on no feedback decreased as more information from later
attempts was considered. For the maximum score, the corrected correlation (.88) was below .90.
This is an indication that knowledge measured under the feedback condition is not the same as
knowledge measured when revision is not allowed.
A related issue is the question of best maximum number of attempts. Only a few
preliminary results from this study can shed light on this issue. On the one hand, the percentage
of correct third-attempt responses (15%) indicate that a fourth attempt would not be useless for
examinees. On the other hand, increasing the number of attempts has a cost in increased response
time. A comparison of Partial-Credit 2 and 3 can be used to compare the contributions of the
second and third attempts to quality of scores. The GRE correlations for Partial-Credit 3 is not
significantly higher than that for Partial-Credit 2 (z = -.66), but the reliability of Partial-Credit 3
is significantly higher than Partial-Credit 2 (t = 5.43, p < .001, one-tailed).
Dynamic Assessment Interpretation
A possible exciting interpretation of the results of this study is to view the provision of
feedback and opportunity for answer revision as a minimal intervention in the tradition of
dynamic assessment, and the revised answer as an occasion for retest. With this interpretation,
the success in revising answers can be seen as a separate ability to modify and revise answers.
That is, the difference in scores that is normally measured in dynamic assessment between two
separate tests may be measured during the course of a single test by providing examinees second
chances to answer questions. Embretson (1992) was able to measure and validate cognitive
modifiability by using an appropriate psychometric model for estimating individual differences
in modifiability, based on a multidimensional Rasch model for measuring learning and change
(Embretson, 1991). It might be possible to use a similar approach to measure revision scores,
although these measurements are complicated by the fact that revision scores exist only for a
subset of questions, those answered incorrectly.
Response Times
Several conclusions emerge from the analysis of item response times. First, response
times for these CR items were generally short (35 seconds without feedback and 47 seconds with
17

feedback and up to three attempts). These are surprisingly low response times. The average
response time for a pool of 55 GRE MC sentence-completion items administered to around
17,000 examinees was found to be 54 seconds when administered as part of the 30-item and 30-
minute adaptive verbal section (the average percentage correct for the items was 61%).
Comparison of these operational results to those of this study is limited. On the one hand,
examinee motivation was lower in the study, which could lead to lower latencies. On the other
hand, in this study the time limits were more generous ― 16 items in 25 minutes ― which could
encourage examinees to spend more time answering questions. However, these results do suggest
that it is possible to get shorter response time for CR than for their MC counterparts. Past
research in the mathematical domain found that CR items took longer to answer (Braswell &
Kupin, 1993). However, it may be possible that sentence-completions in an MC format
(especially when the items include two blanks) are more complicated and take longer to answer
than in a CR format. An example of this case is the LSS item presented in the Materials above.
The results of this study also show that a correct first answer in the feedback condition is
shorter on average than a correct first answer in the no-feedback condition. This may be related
to the lower first-attempt scores compared to the no-feedback scores. However, the results also
show that correct responses in the second and third attempt take on average the same time as first
attempt correct responses.
Motivational Effects
In this study we did not measure directly the motivational effects of the feedback
intervention. However, the comparison of first attempts in the feedback and no-feedback
conditions, which showed faster response times and slightly more valid scores in the feedback
condition, indicate that examinees may have been less anxious in the feedback condition. This is
supported by the examinees’ strong preference for receiving feedback and opportunity to revise
answers.
Accuracy of Scoring
Examinees in this study were very creative in coming up with new answers to the items.
On average, 79 incorrect answers and 19 more correct answers per item were produced by 253
examinees. Of the incorrect answers, 74% were given only one time in the study. Nonetheless,
the percentage of answers erroneously scored as incorrect was 12% for the first 99 examinees,
18

and dropped to 3% for the next 154 examinees. The kappa statistic corrects the percentage
agreement between two ratings for agreement due to random assignment of scores. If kappa is
computed for the agreement between actual and true scores, the above figures correspond
roughly to kappas of .76 and .94. We can expect that further responses to these items would be
scored even more accurately. However, it is difficult to expect perfect scoring with this item
type. Although the human scores in this study were taken as true scores we can expect some
disagreement even between human raters.
Factors Associated With Success in Revision
Providing immediate feedback and opportunity to revise answers had an overall
beneficial effect both on test-taker performance and on the quality of scores from a psychometric
point of view. This intervention may have also had an overall beneficial effect on test anxiety. In
future research we should better understand the factors that contribute to or interfere with success
in revision. Tests that require different cognitive demands might result in different revision
effects. We are currently pursuing similar studies in mathematical reasoning and content-based
subject matters. Similarly, examinee background factors, like ability and gender, might have an
effect on revision success.
Conclusion
Advances in technology may provide more opportunities to administer CR tasks in tests,
and score the answers to these tasks on the fly. This in turn opens an intriguing possibility to
provide immediate feedback to examinees and allow them to revise their answers. This study
found that allowing such interactivity in the testing environment was beneficial to examinees’
scores and contributed to the reliability of the scores and to their relation with external measures
of ability. These results suggest that this interactivity allows additional cognitive processing of
the test items that is not usually manifested in a static test and is beneficial to the measurement of
examinees’ ability.
19

References
Attali, Y. (2005). Reliability of speeded number-right multiple-choice tests. Applied
Psychological Measurement, 29, 357–368.
Betz, N. E. (1977). Effects of immediate knowledge of results and adaptive testing on ability test
performance. Applied Psychological Measurement, 1, 259–266.
Braswell, J., & Kupin, J. (1993). Item formats for assessment in mathematics. In R. E. Bennett &
W. C. Ward (Eds.), Construction versus choice in cognitive measurement: Issues in
constructed response, performance testing, and portfolio assessment (pp. 167–182).
Hillsdale, NJ: Lawrence Erlbaum.
Bruning, R., Schraw, G., & Ronning, R. (1999). Cognitive psychology and instruction.
Columbus, OH: Merrill Prentice Hall.
Cohen, J. (1988). Statistical power analysis for the behavioral sciences (2nd ed.). Hillsdale, NJ:
Erlbaum.
Embretson, S. E. (1991). A multidimensional latent trait model for measuring learning and
change. Psychometrika, 56, 495–515.
Embretson, S. E. (1992). Measuring and validating cognitive modifiability as an ability: A study
in the spatial domain. Journal of Educational Measurement, 29, 25–50.
ETS. (1995). GRE big book. Princeton, NJ: Author.
ETS. (2005). GRE guide to the use of scores. Princeton, NJ: Author.
Feldt, L. S., Woodruff, D. J., & Salih, F. A. (1987). Statistical inference for coefficient alpha.
Applied Psychological Measurement, 11, 93–103.
Feuerstein, R., Rand, Y., & Hoffman, M. (1979). Dynamic assessment of the retarded performer.
Baltimore, MD: University Park Press.
Kulhavy, R. W., & Stock, W. A. (1989). Feedback in written instruction: The place of response
certitude. Educational Psychology Review, 1(4), 279–308.
Meng, X. L., Rosenthal, R., & Rubin, D. B. (1992). Comparing correlated correlation
coefficients. Psychological Bulletin, 111, 172–175.
Schmidt, R. A., Young, D. E., Swinnen, S., & Shapiro, D. C. (1989). Summary knowledge
results for skill acquisition: Support for the guidance hypothesis. Journal of Experimental
Psychology: Learning, Memory and Cognition, 15, 352–359.
20

Schooler, L. J., & Anderson, J. R. (1990). The disruptive potential of immediate feedback. The
Proceedings of the twelfth annual conference of the Cognitive Science Society,
Cambridge, MA.
Thorndike, E. L. (1913). Educational psychology. Vol. 1: The original nature of man. New York:
Columbia University, Teachers College.
Vygotsky, L. (1934/1986). Thought and language. Cambridge, MA: MIT Press.
Vispoel, W. P. (2000). Reviewing and changing answers on computerized fixed-item vocabulary
tests. Educational and Psychological Measurement, 60, 371–384.
Waddel, D. L., & Blankenship, J.C. (1995). Answer changing: A meta-analysis of the prevalence
and patterns. Journal of Continuing Education in Nursing, 25, 155–158.
Wainer, H. (1993). Some practical considerations when converting a linearly administered test to
an adaptive format. Educational Measurement: Issues and Practices, 12, 15–20.
Wilcox, R. R. (1982). Some new results on an answer-until-correct scoring procedure. Journal of
Educational Measurement, 19, 67–74.
21

GRE-ETS PO Box 6000
Princeton, NJ 08541-6000 USA
To obtain more information about GRE programs and services, use one of the following:
Phone: 1-866-473-4373 (U.S., U.S. Territories*, and Canada)
1-609-771-7670 (all other locations)
Web site: www.gre.org
* America Samoa, Guam, Puerto Rico, and US Virgin Islands