Embed Size (px)
Citation preview
1
EFFECT OF HEALTH EDUCATION ON KNOWLEDGE AND ATTITUDES TO SICKLE CELL DISEASE AND SCREENING
AMONG YOUTH CORPS MEMBERS IN LAGOS STATE
SUBMITTED BY
DR FOLUKE ADENIKE OLATONA
TO
THE NATIONAL POSTGRADUATE MEDICAL COLLEGE OF NIGERIA
IN PART FULFILLMENT OF THE REQUIREMENTS FOR THE AWARD
OF THE FINAL FELLOWSHIP OF THE MEDICAL COLLEGE IN
PUBLIC HEALTH (FMCPH)
NOVEMBER, 2008

2
DECLARATION
I hereby declare that the research work presented in this dissertation was done by me
under appropriate supervision, and any assistance given has been duly
acknowledged.
I also certify that this dissertation has not been previously submitted in part or in full for
any other examination.
_____________________________ __________
Dr Foluke Adenike Olatona Date
Department of Community Health
Lagos University Teaching Hospital
Idi-Araba, Lagos State.

3
DEDICATION
This project is dedicated to God Almighty who has been my all in all and has been
blessing and enabling me more than I can ever ask or imagine.

4
CERTIFICATION
I hereby certify that this study was carried out by Dr Foluke Adenike Olatona and the
dissertation written by her under my direct supervision in the Department of
Community Health of the Lagos University Teaching Hospital, Idi-Araba, Lagos State.
To the best of my knowledge, the contents of this study have not been submitted to
any other examination board or for publication in any journal.
Supervisor:
Dr Kofo Odeyemi, MPH, FMCPH
Department of Community Health __________________
Lagos University Teaching Hospital Signature/Date
Idi- Araba, Lagos State
_____________________________
Dr. A.T Onajole, MPH, FMCPH
Head of Department of Community Health
Lagos University Teaching Hospital
Idi-Araba, Lagos

5
ACKNOWLEDGEMENTS
First and foremost, I give God all the glory for giving me the opportunity to start and
complete the program. I wish to express my immense gratitude to the head of
department, Dr A.T Onajole for his encouragement and push that made it possible for
the proposal to be ready on time and his invaluable support that made this dream a
reality. I am very grateful to my supervisor, Dr Kofo Odeyemi for her patience, diligent
counsel, thoroughness, thoughtfulness and invaluable guidance at every stage of the
study.
I also thank all my other teachers in the programme, Prof Oyediran, Prof. E. Ekannem,
Dr Ogunnowo, for ensuring that I got the best of the residency training progamme. I
also recognize the contributions of some other consultants in the Faculty of Public
Health, National Post Graduate Medical College of Nigeria; and encouragement of my
good friends and colleagues in the programme.
My profound gratitude goes to the NYSC zonal inspectors as well as the chief liaison
officers for the corps members in 2007/2008 batch B in Lagos Island and Ikeja Local
Government Areas. I cannot but appreciate the efforts of the project coordinator of the
Sickle Cell Foundation Nigeria, Mr Ebenezer Adeleye in getting some materials and
pictures for the health education programme. To all the people who helped me with
the data collection and entry I also say thank you.

6
I thank my wonderful husband whose understanding, care, love, and financial support
made the journey smoother than expected. You are a great treasure for you have
encouraged me to aim for the best in life. My appreciation also goes to my parents,
children, pastors, partners in ministry, siblings and friends, especially Feyi Ayodele,
Rev & Dr (Mrs) Goodman and Toyin Olusola for their understanding and
encouragement through out the course.
SUMMARY
Introduction
In Nigeria, sickle cell disease has remained an unresolved health problem as in most
parts of sub-Saharan Africa. Twenty four percent (24%) of the population are carriers
and WHO puts its prevalence (at birth) in 2006 at 20 per 1000 births1. People should
know their genotype long before considering marriage, receive genetic counseling if
necessary and be able to make informed decisions. This study was carried out to
determine the effect of an health education programme on the knowledge and
attitudes to sickle cell disease and screening among unmarried NYSC members in
Lagos state.
Methodology The study was a quasi-experimental study. A multistage sampling technique was used
to determine the respondents for the intervention and control groups. Semi-structured
self administered questionnaire was used to obtain baseline information from both
control and intervention groups. It was followed by an health education programme on
sickle cell disease and screening for the intervention group and genotype screening
was offered free of charge for willing participants immediately after the health

7
education at the venue. Three months later, post intervention data using the same
questionnaire was collected from both groups.
Results Almost all (99% from both groups) the respondents were aware but only 25.3% and
23.5% had good level of knowledge about sickle cell disease in the intervention and
control groups respectively. Most of the respondents (at least 63%) had positive
attitudes to many aspects of sickle cell disease; but their perception of risk of the trait
in relatives and partners and risk of the disease in children among those who were not
aware of their genotype was very low. Most of them (79%) supported screening for
sickle cell genotype generally. Majority (83% in intervention and 81% in control
groups) were aware of their genotype. There was a significant relationship between
level of knowledge and awareness of genotype (p<0.05).
The health education intervention caused a significant (p< 0.05) increase (64.1%) in
the level of knowledge in intervention group. The respondents’ attitudes to sickle cell
disease and screening also improved significantly in most areas. The proportion who
knew their genotypes also increased (by 11.9%) significantly in the intervention group
(P>0.05).
Conclusion
Health education of youth corps members improved their level of knowledge about
sickle cell disease and screening significantly while it improved their attitudes to sickle
cell disease and screening in many of the aspects considered and increased the
proportion that was aware of their genotypes.

8
Recommendation
Sustained health education through school curriculum, mass media and health
institutions would be relevant in an effort to influence undergraduates and new
graduates to have better knowledge and attitudes towards sickle cell disease and
screening. This will enable them to make informed decisions about pro-creation later
in life.
TABLE OF CONTENTS
TITLE PAGES
Declaration ii
Dedication iii
Certification iv
Acknowledgements v
Summary vi
Table of contents viii
List of abbreviations ix
List of tables and figures x
Chapter One: Introduction 1-5

9
Objectives 6
Chapter Two: Literature review 7- 34
Chapter Three: Materials and methods 35-46
Chapter Four: Results 47-86
Chapter Five: Discussion 87
Conclusion 100
Recommendations 101
References 102
Appendix 114
LIST OF ABBREVIATIONS/ACRONYMS
SCD Sickle cell disease
SCT Sickle cell trait
WHO World Health Organization
CD Community development
NYSC National Youth Service Corps
Grp Group
Interv. Intervention group
Cont Control group
Pre-interv/ Pre Pre-intervention
Post-interv/ Post Post-intervention
Yrs Years

10
HE Health Education
NCD Non-Communicable Disease
LIST OF TABLES AND FIGURES
Tables
Pages
Table 1: Socio-demographic characteristics of respondents
48
Table 2: Distribution of respondents by awareness and sources of information
about sickle cell disease
50
Table 3: Respondents' knowledge about racial distribution of sickle cell

11
disease pre-intervention
50
Table 4: Distribution of respondents by knowledge of cause of sickle cell
disease pre- intervention
52
Table 5: Respondents' knowledge about pattern of inheritance of sickle cell
disease pre-intervention
52
Table 6: Distribution of respondents by knowledge of severity and cure
of sickle cell disease pre-intervention
53
Table 7: Distribution of respondents by knowledge of complications of
sickle cell disease pre-intervention
53
Table 8: Distribution of respondents by level of knowledge about sickle cell
disease pre-intervention
54
Table 9: Respondents' knowledge about possibility of prenatal diagnosis
and neonatal screening for sickle cell disease pre-intervention
56

12
Table 10: Respondents knowledge of how to detect the sickle cell gene in an adult
56
Table 11: Distribution of respondents by level of knowledge about screening
for sickle cell disease and trait pre-intervention
56
Table 12: Distribution of respondents by level of knowledge about sickle cell
disease and screening pre-intervention
57
Table 13: Respondents' attitude to people with sickle cell disease
pre-intervention
58
Table 14: Attitude of respondents to the possibility of existence of sickle cell
disease in their families pre-intervention
60
Table 15: Distribution of respondents by having proposed marriage
partners and partners having done genotype test
60
Table 16: Attitude of respondents who were not aware of their partners’
genotypes to the possibility of partners being carriers pre-intervention
60

13
Table 17: Likely decisions of respondents if they and their partners were
discovered to be carriers (pre-intervention)
61
Table 18: Respondents' attitudes to prenatal diagnosis with selective
abortion and mandatory newborn screening pre-intervention
62
Table 19: Respondents' attitude to usefulness of knowing their individual
genotypes pre-intervention
63
Table 20: Attitude to premarital genotyping and willingness to ask partners
to do the test pre-intervention
63
Table 21: Respondents' attitudes to possible barriers to testing pre-intervention
65
Table 22: Respondents' reasons for having not done genotype pre-intervention
66
Table 23: Perception of risk of having children with sickle cell disease and
willingness to be tested among respondents who had not done genotype
test. (pre-intervention)
66

14
Table 24: Uptake of genetic counseling among respondents who have
sickle cell disease or sickle cell trait and willingness to receive it
among those who have not received counseling (pre-intervention)
69
Table 25: Willingness of respondents who are carriers to discussing
their status with their partners pre-intervention
69
Table 26: Willingness of respondents to receive more information
about sickle cell disease pre-intervention 69
Table 27: Relationship between sex and level of knowledge about
sickle cell disease pre-intervention
70
Table 28: Relationship between higher institution attended and level of
knowledge about sickle cell disease pre-intervention
71
Table 29: Relationship between sex and attitude to premarital genotype
test amongst couples pre-intervention
72
Table 30: Relationship between religion and attitude to prenatal

15
diagnosis and selective abortion
73
Table 31: Relationship between sex and awareness of individual’s
genotype pre-intervention
74
Table 32: Relationship between level of sickle cell disease knowledge
and awareness of individual’s genotype pre-intervention
75
Table 33: Effect of health education on knowledge of aetiology, racial
distribution, manifestation, severity and treatment of sickle cell disease
77
Table 34: Effect of health education on knowledge of complications of
sickle cell disease
78
Table 35: Effect of health education on knowledge about screening
for sickle cell disease and sickle cell trait
79
Table 36: Effect of health education on level of knowledge about sickle cell
Disease
80

16
Table 37: Effect of health education on attitude to sickle cell disease
81
Table 38: Effect of health education on attitude of respondents if they
and their partners were discovered to be carriers
82
Table 39: Effect of health education on attitude to people with sickle cell
disease
83
Table 40: Effect of health education on attitude to screening for sickle cell
disease
84
Table 41: Effect of health education on awareness of individual’s genotype 85
Table 42: Effect of health education on willingness to discuss trait
status with partners among carriers
86
List of figures
Figure 1: Respondents' knowledge about manifestation of sickle cell
disease in carriers.
54

17
Figure 2: Respondents' attitude to sickle cell disease being a major problem
58
Figure 3: Respondents' attitude to usefulness of screening for sickle cell
disease
62
Figure 4: Distribution of respondents by awareness of their genotypes
65
Figure 5: Distribution of respondents by their individual genotypes
68
Figure 6: Distribution of respondents by reasons for doing genotype test
68
CHAPTER 1
INTRODUCTION
Sickle cell disease refers to a group of autosomal recessive disorders caused by
inheritance of a pair of abnormal haemoglobin genes, including the sickle cell gene.
Sickle cell trait occurs in people with one sickle cell gene and one normal gene and
such people do not have any clinical manifestation of illness. Genetic testing however
can identify persons with the trait who can transfer the gene to their offspring leading
to the disease, if their partners also transfer the gene.

18
About 5% of the world’s population carries genes responsible for
haemoglobinopathies1. Sickle-cell anaemia is particularly common among people
whose ancestors come from sub-Saharan Africa, India, Saudi Arabia and
Mediterranean countries. In some areas of sub-Saharan Africa, up to 2% of all
children are born with the condition1.
In broad terms, the prevalence of the sickle-cell trait ranges between 10% and 40%
across equatorial Africa and decreases to between 1% and 2% on the north African
coast and <1% in South Africa. In West African countries such as Ghana and Nigeria,
the frequency of the trait is 15% to 30% whereas in Uganda it shows marked tribal
variations, reaching 45% among the Baamba tribe in the west of the country.
Specifically in Nigeria, about 24% of the population are carriers of the mutant gene 1.
The frequencies of the carrier state determine the prevalence of sickle-cell disease at
birth. Each year about 300 000 infants are born with major haemoglobin disorders in
the world; including more than 200 000 cases of sickle-cell anaemia in Africa 2.
Sickle cell disease has remained an unresolved health problem in Nigeria as in most
parts of sub-Saharan Africa. It is the commonest genetic disorder in Nigeria and WHO
puts its prevalence (at birth) in Nigeria in 2006 at 20 per 1000 births which means that
about 150,000 children are born with sickle cell disease genotype annually in Nigeria
alone1. The country harbours the highest number of sickle cell disease sufferers in the
whole world.
Affected children are usually well until about 4-6 months old. Haemoglobin S gene
causes the red cells to become hard, sticky and sickle-shaped, making them easily
destroyed and causing blockage of blood vessels and depriving body organs of blood

19
and oxygen. This results in a chronic, slow deterioration of multiple organ systems
culminating in recurrent episodes of severe pain, anaemia, serious infections and
damage to vital organs. Further complications include stroke, kidney damage and
respiratory problems. Several studies have also proved that growth failure and
maturational delay remain significant chronic problems in children with SCD 3.
Moreover, pregnancies in patients with sickle cell disease are characterized by high
maternal and fetal morbidity and mortality4.
Its impact on human health may be assessed against the yardsticks of infant and
under-five mortality. As not all deaths occur in the first year of life, the most valid
measure is under-five deaths. Increasing proportions of affected children now survive
past five years of age but remain at risk of premature death. When health impact is
measured by under-five mortality, sickle-cell anaemia contributes the equivalent of 5%
of under-five deaths on the African continent, more than 9% of such deaths in West
Africa, and up to 16% of under-five deaths in individual West African countries 1.
In the United States of America, median survival was estimated in 1994 to be 42 years
for men and 48 years for women, whereas comparable figures for Jamaica published
in 2001 suggested 53 years for men and 58.5 years for women5 .The median survival
age of patients with sickle-cell anaemia on the African continent is estimated to be
less than 5 years 6. In sub-Saharan Africa, most of the affected children do not survive
childhood largely because of malaria and bacterial infections and lack of access to
appropriate care7 .
Sickle-cell disease also has major social and economic implications for the affected
child as well as the family. A recent study among relatives of SCD patients showed

20
that objective psychosocial burden indices were significantly higher for relatives of
SCD patients in crisis in comparison with relatives of SCD patients in stable condition.
Moreover, when compared with a similar study of cancer patients, relatives of patients
in SCD crisis perceived similar financial, family routine burdens and psychological
distress scores 8. Recurrent sickle-cell crises interfere with the patient’s life, especially
with regard to education, work and psychosocial development. Studies have also
shown that quality of life is affected in children with sickle cell disease (SCD) and to a
lesser extent in those with sickle cell trait (SCT) 9. Moreover there’s recurrent huge
national expenditure on the management of the condition.
In high-resource countries several methods are available for the management of the
disease. Examples of such methods include: prenatal and neonatal screening
programs, long-term treatment with hydroxyurea, bone marrow and cord blood
transplantation. In Africa however, overall treatment of patients is still poor and, in
some places, inadequate10.
Therefore for Africans and in particular Nigerians, an important approach for
controlling the disease is preventive; and this depends upon education, the detection
of carriers, genetic counseling, prenatal screening for fetal genotype done in couples
who are both carriers and newborn screening for sickle cell genotype. There is,
however, a palpable lack of information and education about the disorder, which, with
the increasing prevalence, has encouraged the growth of myths, misinformation,
inappropriate treatment, frustration and stigmatization 11.
A study among new graduates of Nigerian tertiary institutions, who may be described
as educated and elite by Nigerian standards revealed severely deficient knowledge on

21
the transmission of sickle cell disease and implications of heterozygous state12. It was
concluded that unmarried youths in or graduating from higher institutions may be a
most suitable target for information, carrier detection and genetic counseling in the
prevention of sickle cell disease.12
The concern about genetic testing is that those with the trait are generally healthy;
therefore many might not make informed decision at the time of marriage or
procreation. People should know their genotype long before they consider marriage,
receive genetic counseling if necessary and be aware in advance of what could
happen and all the options available; so that even if they have children with sickle cell
disease, it will be no surprise. That way, they are in a position not only to make
decisions based on knowledge of the facts but to prepare them selves mentally to
accept the consequences of those decisions.
In view of the above, people who are close to making a decision on who to marry or
have just made such a decision are a good target group for health education on sickle
cell disease and screening. Such people can be found among new graduates of
higher institutions because people at that age usually give much thought to issues
about marriage. The National Youth Service Corps programme offers a unique access
to a good sample of such unmarried new graduates. Most of the “corps members” are
usually between the ages of 20 and 30 years, unmarried (about 90%) 12 and represent
different ethnic, socio-economic, cultural and religious groupings in Nigeria
This study aims to determine the effect of health education on the level of knowledge
and attitudes to sickle cell disease and screening among unmarried youth corps

22
members in Lagos State. The result will be useful for health care providers and policy
makers regarding health education of unmarried undergraduates and new graduates
of higher institutions concerning sickle cell disease and screening. This will in turn
enhance making informed decisions about marriage and procreation among them.
OBJECTIVES
General objective
• To study the effect of health education on knowledge and attitudes to sickle cell
disease and screening among unmarried National Youth Service Corps
members in Lagos State.
Specific objectives:
• To determine the level of knowledge about sickle cell disease among National
Youth Service Corps members (known as “corps members”).

23
• To determine the level of knowledge about screening for genotype among the
“corps members”.
• To assess their attitudes towards sickle cell disease
• To assess their attitudes towards screening for genotype.
• To determine the percentage of the “corps members” who know their genotype
• To provide health education for the “corps members” in the intervention group
on sickle cell disease and screening.
• To evaluate the effect of the intervention on their knowledge and attitudes
towards sickle cell disease and screening compared with those who did not
receive the intervention, three months after.
CHAPTER 2
LITERATURE REVIEW
HISTORICAL BACKGROUND OF SICKLE CELL DISORDERS
In the US in 1846, a paper entitled "Case of absence of the spleen" (from the
Southern Journal of Medical Pharmacology), was probably the first to describe sickle
cell disease13 but the disease was not understood then. The earliest factual
descriptions in the Western medical literature were based on features of the disorder
as observed in descendants of Africans (predominantly West Africans) living in the
New World by Dr. James Herrick in 1904. As a physician practicing in the USA, he first
noted the presence of red blood cells which were shaped like a sickle in the blood of

24
an anaemic West Indian medical student. This historic observation linked the “peculiar
and elongated sickle shaped red blood corpuscles” with severe anaemia.14 The first
formal report of sickle cell disease came out of Chicago in 1910 and in 1922, after
three more cases were reported, the disease was named "sickle cell anemia." 13
Although the HbS gene is most common in Africa, sickle cell disease went unreported
in African medical literature until the 1870s. This may be because the symptoms were
similar to those of other tropical diseases in Africa and because blood was not usually
examined. In addition, children born with sickle cell disease usually died in infancy and
were typically not seen by physicians. Most of the earliest published reports of the
disease involved black patients living in the US.13
African tribal populations were all too familiar with the disease and created their own
names for it. In Nigeria, children who died soon after birth were called "ogbanjes" (Ibo)
and Abiku (Yoruba) meaning children who come and go. The tribe’s people believed
that an evil spirit was trying to be born into a family with ogbanje children, but the
babies bravely died to save the rest of the family from the demon 13. It is just possible
that some of these deaths may have been caused by sickle cell disease.14
MOLECULAR GENETICS OF SICKLE CELL DISEASE
The blood and red blood cells
The blood comprises of the plasma and the cellular components including the red
blood cells. The mature RBC is a circular biconcave disc and it contains haemoglobin
which is formed within it. The haemoglobin is responsible for the transport of oxygen
from the lungs to the tissues and vice versa. The haemoglobin is made up of two

25
molecules which are chemically linked: the haem and the globin. In the normal adult
haemoglobin, the globin molecule consists of four polypeptide chains which are two
alpha chains and two beta chains and this is called haemoglobin A, while in the
embryonic stage there are two alpha and two gamma chains and this is known as
haemoglobin F.
Molecular genetics of sickle cell disease
Mutations within the genes which code for the α or β globin protein subunits can result
in an imbalance of globins that disrupt the function and oxygen binding ability of red
blood cells. Abnormal haemoglobins are designated by the type of mutations present
within these globin chains. For example, homozygous sickle cell disease is designated
as HbSS, compound heterozygote formed by one S β-globin chain and one C β-globin
chain is distinguished Hemoglobin SC disease.
Other mutations within the β globin genes, when forming compound heterozygote with
Hb S, can result in features similar to Homozygous Hb SS sickle cell disease. Normal
adult hemoglobin is maintained with an equal balance of α globin and β globin chains.
Mutations that disrupt this careful balance can lead to a range of hematological
disorders 15. For example, the βº thalassemia mutation results in a lack of expression
of that β globin chain. If this mutation is inherited with the Hb S mutation, only Hb S
will be expressed resulting in the sickle cell disease phenotype. Other hemoglobin
variants that can cause complications when inherited with an Hb S mutation are the
Hb C mutation, Hb O-Arab, Dpunjab
, Hb E and β+ thalassemia 16

26
MODE OF INHERITANCE OF SICKLE CELL DISEASE
The sickle cell haemoglobin (HbS) is an example of a single point mutation in which
the codon determining the amino acid at position 6 from the N terminal of the beta
chain has changed from GAG coding for glutamic acid to GTG coding for valine.17,. In
the case of HbC, this position 6 of the beta chain is occupied by lysine.
The inheritance of sickle cell disease obeys the principle of Mendelian inheritance.
When one parent is heterozygous for the sickle cell gene and the other parent is
normal, the offspring would have an equal chance of having either sickle cell trait or a
normal AA genotype. If both parents have the sickle cell trait, there is a 1 in 2 chance
of the offspring having the sickle cell trait, and a 1 in 4 chance of the offspring being
normal (AA) or having SS pregnancy regardless of the result of previous
pregnancies.18
PATHOLOGY OF SICKLE CELL DISEASE
Deoxygenated HbS tends to polymerize non-covalently into long strands that deform
the erythrocyte, giving the characteristic "sickle cell" morphology.19 Polymerization
occurrence depends on other factors including increased hemoglobin concentration,
dehydration, acidity, temperature and the presence of other haemoglobins, such as
fetal hemoglobin which inhibits polymerization. Polymer formation is reversible with
oxygenation; however, it causes an increase in the membrane permeability for
sodium, potassium, magnesium and calcium, leading to further dehydration of the red
blood cells. Increased hemoglobin density accelerates polymerization further adding to
the cycle of red blood cell sickling 20

27
These polymerization/depolymerization cycles contribute to the increased haemolysis
of sickle cell disease (The process generates toxic substances called "free radicals”
which can irreversibly damage the cell wall and increase its rigidity) decreasing the
lifespan of erythrocytes to as few as 20 days, as compared to the 120 day lifespan of
healthy red blood cells.
The most widely accepted hypothesis is that erythrocytes deform as they release their
oxygen in the capillaries and their deformed sickled shape decreases their ability to
pass through the blood vessels leading to vascular occlusion. The blockade of blood
flow produces areas of tissue ischemia, regional hypoxia and acidosis which further
increases the sickling process. These two basic pathological phenomena, i.e.,
inflexibility of the red blood cells and occlusion of the small blood vessels by entangled
red blood cells result in the myriad of clinical problems seen with sickle cell disease.
Recently, investigators have focused on other factors outside the red cell that could
contribute to the manifestations of sickle cell disease. Hebbel and colleagues first
showed that sickle erythrocytes adhere abnormally to vascular endothelial cells. Their
observations were confirmed and extended by other workers. The endothelial cells
may abnormally express adhesion receptors, perhaps in response to activators
released from sickle red cells (e.g., reactive oxygen species).21 Sickle cell disease
has also been considered a hypercoagulable state, in which both platelet activation
and thrombin activation generation are abnormally increased, and this plays a major
role in the vaso occlusive complications associated with it 22.
TYPES OF SICKLE CELL DISEASE

28
The genotypes that constitute sickle cell disease are HbSS, HbSC, HbS thalassaemia,
HbSE, HbSF, “high gene”, Hb SD, etc.23 The most common of these in West Africa
are sickle cell anaemia (Hb SS), sickle cell haemoglobin C disease (Hb SC) and sickle
beta thalassaemia (Hb beta thal).24
Sickle cell anaemia
This form of sickle cell disease occurs in individuals who inherit both abnormal Hb S
genes (HbSS) or one Hb S and one Hb C (HbSC). They are usually referred to as
‘sicklers’ and symptoms usually begin about the fourth month of life by which time the
level of Hb F which prevents polymerization has considerably reduced.25
SICKLE CELL TRAIT
This term is used to describe a person who has inherited one normal haemoglobin (Hb
A) from one parent and one abnormal gene from the other parent. This state is also
known as the heterozygous S (or AS) state, and such individuals are known as
carriers. The hematocrit is normal for people with sickle cell trait. They do not typically
manifest symptoms of the disorder as they have at least 50% normal hemoglobin;
however, they may appear anemic due to the reduced expression of normal β globin
subunits.
Sickle cell trait can pose a grave risk for some athletes. Exercise-physiology research
shows how and why sickle red cells can accumulate in the bloodstream during intense
exercise bouts and lead to sickling collapse. Sickling collapse is a medical emergency
but fortunately, screening and precautions can prevent it and enable sickle-trait
athletes to thrive in their sports 26.
29
EPIDEMIOLOGY OF SICKLE CELL DISEASE
Haemoglobinopathies, i.e., the thalassaemias and sickle cell disorders are globally
widespread and affect about 5% of the world’s population with up to 300,000 infants
born annually with a major haemoglobin disorder 1. Sickle cell disease is the
commonest haemoglobin disorder.
Present figures (2006) indicate that 72,000 (1 in 3,777 or 0.03%) and 15,954 people
have sickle cell anaemia in the USA and UK respectively. Incidence rate for sickle cell
anaemia in the USA is put as 1 in 34,000 (or 8,000 people) with 1 in 500 black
American and 1 in 1000-1400 Hispanic American births annually, and 1772 new cases
in the UK.27
Sickle cell disease is most common among people living in or originating from sub-
Saharan Africa. The disorder also affects people of Mediterranean, Caribbean,
Middle Eastern, and Asian origin. The sickle cell gene is most common in areas
where malaria is endemic, sickle cell trait affects about 10–30% of Africa's tropical
populations 1. Sickle cell disease affects an estimated 2% of newborns in Africa
annually 1. In Nigeria, individuals with Sickle cell disease account for 2% of the
population with 24% carrying the trait and 20 per 1000 babies born with Hb SS.
This translates to over 150,000 babies born annually with sickle cell anaemia
genotype 1.
CLINICAL FEATURES OF SICKLE CELL DISEASE
Sickle cell disease usually manifests early in childhood. Infants are protected largely
by elevated levels of Hb F until after the sixth month of life. The clinical manifestation
in sickle cell disease is highly variable. They include the following:

30
Anaemia (haemolytic): In general, patients with sickle cell disease have hematocrits
that are roughly half the normal value (e.g., about 25% compared to about 40-45%
normally).
Sickle cell crises: This refers to the onset of acute symptoms generally due to
sudden in vivo sickling in an individual with sickle cell disease usually due to a
precipitating factor.
There are four main types of crises:
Vaso-occlusive or painful crises: This is the most common symptom characterized
by episodes of intense pain which result from infarction in the affected tissues,
particularly bone.
Haemolytic crisis: There is rapid destruction of red cells leading to severe anaemia
and jaundice.
Sequestration crises: This is characterized by rapid enlargement of the spleen or
liver as a result of engorgement by sickled red cells, in young patients with functioning
spleens.
Aplastic or hypoplastic crisis: Bone marrow failure may occur especially with folic
deficiency or acute infections such as malaria and viruses, particularly parvovirus
B19.28 This leads to severe anaemia and haemoglobin level falls drastically.
COMPLICATIONS IN THE VARIOUS SYSTEMS OF THE BODY
Reticulo-endothelial system

31
There is increased susceptibility to infections, especially Streptococcus pneumoniae,
Salmonella, and malaria. There is also associated hepatosplenomegaly, jaundice,
generalized lymphadenopathy, and finger clubbing and autosplenectomy.
Musculoskeletal system
Frequent bone and joint pains are the commonest symptoms especially among
patients with Hb SS and SC. Other features include dactylitis, bossing of the skull,
sickle cell gnathopathy, avascular necrosis of articular bone, osteomyelitis, leg ulcers,
pathological fracture and growth disturbance.
Genitourinary system
Priapism occurs in adolescent and young adult males with sickle cell disease and may
be spontaneous or brought on by sexual excitement. When prolonged it may lead to
impotence. Other complications in this system include polyuria, haematuria delayed
maturation of the external genitalia in both males and females, delayed puberty
(especially in girls) and hypogonadism.
Central nervous system
The most severe manifestation is stroke, resulting in varying degrees of neurological
deficit. The stroke is mostly thrombotic, but it may also be hemorrhagic.
Cardiovascular and respiratory systems: Both ventricles and the left atrium are
all dilated. Acute chest syndrome which is characterized by chest pain, fever and
tachycardia can occur and may lead to acute respiratory distress syndrome
(ARDS). Bronchopneumonia usually occurs and pulmonary hypertension may also
develop.
32
The psychosocial complication
People with sickle cell disease, especially those with frequent attacks and frequent
yellow eyes often feel they are different and inferior to others. In a review conducted at
Imperial College London, psychological complications were identified in both children
and adults with SCD, and included inappropriate pain coping strategies; reduced
quality of life owing to restrictions in daily functioning, anxiety and depression; and
neuro-cognitive impairment 29.
The result of another study conducted in Ilorin, Nigeria showed SCD children were
significantly more likely to report social impairment than the control groups. On the
Rutter Scale A2, the SCD children were more likely than the controls to report neurotic
symptoms but less likely than controls to bully other children 30.
Complications associated with pregnancy
Many complications such as spontaneous abortion, intrauterine growth restriction
preterm labour and premature delivery, perinatal mortality, low birthweight, increased
maternal mortality, anaemia, infections, pseudotoxaemia, and even infertility are
associated with pregnancy in a sickle cell disease patient. A retrospective study of
pregnancy outcome carried out in LUTH showed that pregnancy was complicated in
96.6% of cases (n = 58). Pregnancy complications from sickle cell crisis, remain a
major problem in the care of these patients31.
MANAGEMENT OF SICKLE CELL DISEASE
This entails taking a good history, thorough physical examination, laboratory
investigations and treatment.

33
Laboratory investigations
Full blood count usually reveals anaemia and the level of haemoglobin is within the
range of 6-8g/dl with a high reticulocyte count (10-20%).32 Other tests that can be
done include blood films, haemoglobin electrophoresis, biochemistry test, liver
function tests, x-rays, abdominal sonogram, transcranial doppler ultrasonography.
Treatment
Reassurance and sympathy have been found to be important in allaying anxiety and
establishing rapport with the patient, and in the case of children, their parents.
Pain relief: Pain control should be prompt and effective and is best achieved by the
administration of opioids.
Treatment of infections: At any age, all infections must be treated promptly with
broad-spectrum antibiotics until a causative organism is identified and therapy is
tailored according to its antibiotic sensitivity.
Blood transfusion: Anaemia is best treated with bed rest, oxygen inhalation and
prompt red cell transfusion. A study of more than 2,000 children during the stop study
shows that regular blood transfusions can prevent strokes in children who have
abnormal blood vessels in their brain33. Administration of folic acid is essential in
the management of the chronic condition.
Malaria prophylaxis: The geographical distribution of the gene for hemoglobin S and
the distribution of malaria in Africa virtually overlap. A person with sickle cell disease is
at an extreme survival disadvantage because malaria constitutes a life threatening
event by means of its propensity for initiating vaso-occlusive and anaemic crises. It is

34
a common cause of morbidity and mortality in these children34. All patients with sickle
cell disease should be given prophylactic antimalarials such as proguanil (Palludrine)
in daily doses, or pyrimethamine (Daraprim) in weekly doses in both children and
adults because malaria can be dangerous in someone who has sickle cell disease35.
In a certain investigation conducted in 2001, the issue about protection of people with
homozygous and heterozygous HbC against malaria was finally settled36. Hemoglobin
C heterozygote as well as homozygous had significantly fewer episodes of P.
falciparum malaria than did controls with only hemoglobin A.
Pneumococcal prophylaxis: Prevention of infection improves chances of survival in
sickle cell disease. Daily oral penicillin prophylaxis, or monthly injections commencing
in infancy (second month of life) and continued throughout childhood reduces the
frequency of infections with Streptococcus pneumoniae. One summary of a systematic
review which looked at children under age 5 revealed that children who took penicillin
were less likely to get infections like pneumonia and meningitis 37. It was however
discovered in a randomized controlled trial that taking antibiotics regularly might
benefit younger children (< 5 year olds) only 38.
Vaccine to prevent infection in children: The use of a pneumococcal vaccine at age
2 years with a booster dose at age 5 years greatly reduces the incidence of infections
as well 39. Other vaccines that can be given include hepatitis B vaccine.
Psychosocial care
Sickle cell disease is associated with psychosocial morbidity. Thus comprehensive
and affordable psychosocial care should be provided for children suffering from this

35
condition. This psychosocial care is part of holistic care and it has been demonstrated
that attentive holistic care can drastically reduce morbidity and mortality rates. A study
in Nigeria showed that mortality rate fell from 20.6% to 0.6% over 7 years (p<0.0001)
of holistic care. 40
Hydroxycarbamide (Hydroxyurea)
Hydroxyurea is a drug that may prevent attacks of sickle cell pain and the need for a
blood transfusion. A systematic review revealed that hydroxyurea reduced the number
of painful attacks in adults, and such adults were at less risk of acute chest syndrome
and of needing a blood transfusion 41. The drug has some side effects. In the study
mentioned above, almost 8 in 10 people taking hydroxyurea got a condition called
neutropenia; but no one in the study went on to get an infection. Some people in the
study got hair loss, a rash or an upset stomach, but it has not been proven whether
these problems were caused by hydroxyurea 42.
Nicosan (TM)
Nicosan (TM) formerly known as Niprisan is an anti-sickling, phyto-pharmaceutical
(Natural Herbal Drug) for the prophylactic management of Sickle Cell Disease (SCD).
It was developed by Nigerian scientists at the National Institute for Pharmaceutical
Research and Development (NIPRD) and approved on July 3, 2006.
While not a cure, the clinical trials have confirmed that the large majority of patients
taking Nicosan (TM) no longer experience sickle cell "crises" while on the medication,
and even among those whose crises are not eliminated, the number and severity of

36
the crises are substantially reduced. The drug is taken through one-a-day capsules
which, once started, must be taken daily by the patient.
Allogeneic bone marrow transplantation (Bmt)
The transplantation of stem cells derived from the bone marrow of compatible siblings
has been used to cure sickle cell anaemia. Although this is a landmark in the
treatment of sickle cell disorder, its rigorous pre-conditions and great expense make it,
for now, unattainable to all but the fortunate minority 43.
Concerns about problems such as graft versus host disease and interstitial
pneumonia, have limited the use of this modality in the United States though a
recently reported trial of bone marrow transplantation in children from centers in the
US reaffirmed that the procedure can cure sickle cell 44.
The results of a Sibling Donor Cord Blood (SDCB) Program at Oakland in U.S.A.
confirmed the feasibility and utility of remote-site sibling donor cord blood collection
and subsequent transplantation for hematological disorders, with a very high rate of
usage from a cord blood bank dedicated to performing these unique collections. It was
concluded that cord blood transplantation from sibling donors represents a suitable
alternative to bone marrow transplantation 45.
Gene replacement therapy and other future therapies
Sickle cell disease has been the model disease for comprehensive genetic study. A
cure through gene therapy is a promise on the horizon, but several more years of
intensive research are required before this therapy will be available. New therapies
being studied for treating sickle-cell disease and for managing acute sickle-cell crisis

37
include: inhaled nitric oxide,46 oral clotrimazole, rheothrx (flocor), erythropoietin and
butyrate and magnesium therapy, e.g. magnesium pitolate.
OTHER FORMS OF CONTROL OF SICKLE CELL DISEASE
Genetic screening
Genetic screening refers to a broad range of methods for gauging the presence,
absence or activity of genes in cells. Genetic diagnosis can help decrease the disease
burden in the future. However, it raises a number of ethical issues, which need to be
addressed. It is important to educate the population about potential benefits as well as
ethical dilemmas involved so that the general public is able to make the right decisions
for themselves and their families47. The optimal age for sickle cell screening has also
been disputed with different schools of thought – school age years, adolescence and
young adulthood and neonatal screening.
Population screening
Population screening for heterozygous carriers of common autosomal recessive
diseases is aimed at identifying carriers who are at risk of having an affected child if
the other parent is also a carrier.
Many people have argued that the ideal age for population screening for autosomal
recessive diseases is early in adulthood, before marriage, when young people can
make mature decisions about testing. Although screening of high-school students is
more realistic logistically than screening of young adults, it had been suggested on

38
ethical grounds that genetic tests without immediate medical benefits should never be
done in adolescents48 However, a Montreal team has demonstrated that screening of
students of Jewish and of Mediterranean origin who are more than 16 years old for the
carrier state of Tay–Sachs disease and -thalassemia trait has been successful over a
20-year period without apparent psychological or sociological harm. 49 ,50.
In genetic screening programs, participation of the target population is the key to
success. The National Sickle Cell Anemia Control Act, enacted in America in 1972
quickly developed public screening programs; however, much of the benefit that may
have been accomplished was overshadowed by the limits of hasty planning which did
not involve members of the target African American population, poor control, lack of
education and improper testing procedure. Mandatory population testing of the African
American population and inability to distinguish trait from disease led to the improper
labeling of people, as well as unnecessary fear and discrimination51. Eventually the
program was abandoned and other screening programs had to be developed.
Newborn screening
Neonatal identification of sickle cell disease can significantly reduce mortality and
morbidity during the first 5 years of life. Knowledge of the distribution of these inherited
diseases is useful in healthcare planning and appropriate allocation of resources,
while counseling targeted at appropriate couples enables informed parental choice
and may prevent disease 52.
The result of a review in CDC in 1999 showed that most clinical interventions for
people with sickle cell disease discussed in the medical literature can be classified as

39
tertiary prevention: for example, therapy to ameliorate anemia, reduce the frequency
of pain crises, or prevent stroke recurrences. Newborn screening, a form of
secondary prevention, has emerged as an important public health approach to
identifying affected children before they develop complications. Newborn screening is
the starting point for simple public health strategies such as parental education,
immunization, and penicillin prophylaxis. Identification of affected families by newborn
or community screening programs has also been an entry point for genetic counseling,
although utilization of prenatal testing has varied by factors such as geographic
location53 .
Antenatal screening
Antenatal screening allows women at risk to make informed decisions about
reproduction. It aims to detect carriers, provide genetic counseling and offer carrier
couples the choice of prenatal screening and selective abortion.
Prenatal screening
Prenatal screening is genetic testing of a fetus. The screening for genotype can now
be made prenatal by analyzing genomic DNA of fetal cells obtained by amniocentesis
which is usually performed between the 14th and 16th week of gestation. Ethical
considerations are of great importance in this procedure, because for the majority of
disorders, termination is the intended course of action.
Preimplantation genetic diagnosis

40
Preimplantation genetic diagnosis (PGD) is an alternative reproductive option for
couples at risk of having a child affected with a genetic disorder. Although prenatal
screening (PND) has been available for many years, it is not acceptable to many
owing to issues relating to termination of pregnancy. PGD involves assisted-
reproductive technology, even though most couples undertaking it are fertile. PGD is
only available at a small number of centers and for a limited number of genetic
conditions. It is a complex and time-consuming procedure. The success rate is around
20%; consequently, there is a relatively low chance of success. and this requires
careful consideration by couples who generally can become spontaneously pregnant
(i.e. without any form of assisted reproductive technology) 54.
Genetic counseling
This refers to giving and explaining the results of a genetic test. Information given
should be full, accurate, unbiased, timely, clear and understandable. Information
should be given in a sensitive manner within an acceptable environment, both pre and
post screening.
Genetic counseling involves genetic risk assessment and patient education about the
features, treatment and inheritance of a possible hereditary disease or birth defect.
Genetic counselors also help individuals and families with decision-making about
reproductive, testing or treatment options, guide and support them as they deal with
the impact of these conditions or with the genetic risk on their lives.
A common misconception is that genetic counseling means marriage counseling
aimed at directing carriers of the trait not to marry each other. In reality, this is not an
objective of genetic counseling. In fact, counseling should include informing carriers

41
that avoiding marriage to another carrier or just making sure that you marry an AA
genotype even though it saves your offerings from the disease also merely spreads
the carrier status more evenly around until perhaps a future saturation point.
Sub-Saharan Africa has the largest pool of the sickle cell gene in the world and any
facile talk of eradication must take this fact into account, and also the fact that the
magnitude of the sickle cell problem is better determined by the size of the population
carrying the trait than by the population living with sickle cell anaemia. The former
would have at least 160 million S genes, while those with sickle cell disease can
hardly boast of 2-4 million S genes. In the circumstances, eradication of sickle cell
disorder is, at best, overoptimistic and would require unthinkable genocide or
permanent banishment of all carriers to Alaska 55.
KNOWLEDGE OF SICKLE CELL DISEASE AND SCREENING
In a study conducted among the African American women, the result showed that
ninety-one percent of the participants believed that sickle cell disease was a
hereditary blood disorder, but only 9.3% understood the inheritance pattern. Most
women recognized pain (94%), infections (80%) and strokes (40%) as complications
of sickle cell disease56. Another study conducted among the African American women
of childbearing age revealed a high perception of severity of sickle cell disease 57. In a
study conducted in Oakland in USA, majority of community survey respondents

42
(86.2%) had correct general knowledge about the genetic basis and severity of sickle
cell disease.58
Qualitative analysis of a survey conducted among African-Americans has
demonstrated that participants fall into one of three knowledge categories: the
unaware, those with accurate but incomplete information, and those with
misinformation. Participants had an understanding of sickle cell disease course,
however, inheritance of sickle cell and the personal risk to have children or family
members with the condition was not well understood 59. They also had knowledge of
the methods and indications for prenatal testing and risks of prenatal testing were
identified as miscarriage as well as personal and family stress 59.
A pilot study to determine the level of sickle cell disease knowledge in a university in
southeastern Texas and a university in Enugu, Nigeria, West Africa found that there
was a need to improve retention of sickle cell disease factual information 60.
A study was conducted in Nigeria in 1987 to assess the knowledge of high school
students about sickle cell disease and determine their willingness to participate in a
genetic screening programme to enable them to plan their future marriage. In this
study, the baseline level of knowledge about sickle cell disease was found to be quite
low in view of the pre test score obtained by the students. It was concluded that
genetic health education in schools would be relevant in an effort to influence
preventive health care61. In spite of the recommendation above, another study on
knowledge of and attitude to sickle cell disease among new graduates of Nigerian
tertiary educational institutions in year 2000 revealed that there was severely deficient
knowledge on the transmission of sickle cell disease among the 20-32 year old

43
graduates 12. In another survey in University of Ibadan in 2006 however, a majority of
study respondents had a high knowledge level (63.6%) of sickle cell disease and knew
the benefits of genetic counseling62.
In a study conducted in Ile-Ife, the majority of the respondents (69.5%) appreciated
the role of both parents in the transmission of the disease. Only 45 (18%) of the
respondents heard of SCA for the first time through sickle cell counselors, 23%
through news media, 29% through friends and relations, 21% obtained the information
through health workers, while 5% had never heard of sickle cell disease before the
interview. As many as 192 (44%) of the respondents were aware that SCA could be
diagnosed in pregnancy63.
Another study at the University of Benin revealed that 85% of respondents were aware
of sickle cell disease, while 15% were not. Majority of them (35.4%) heard of sickle
cell disease from friends and relatives at home; only 28.3% heard of it from print or
electronic media. Majority (74%) of them know of the hereditary nature of sickle cell
disease. On the issue of treatment of SCD however, 25.4 % said it could be cured,
27.4% said it could not be cured, while 35.2% were not sure. 64.
Environmental factors may influence perception of chronic disorders such as sickle
cell disease. The result of a survey in Nigeria in year 2000 to assess the perception of
sickle cell anaemia by Nigerian rural and urban women showed that urban women had
better knowledge about sickle cell anaemia than rural women; probably because their
social environment afforded a wider scope for interaction with information exchange
among people. The study showed a serious lack of information about important
aspects of sickle cell anaemia among rural women65. Moreover for most respondents,

44
the educational institutions attended, the health institutions in the locality and the
electronic media were poor sources of information on sickle cell anaemia.
In a study among pre-clinical, clinical medical students and physicians in Cameroon,
the awareness of DNA diagnosis was poor: 0, 2.2, and 1.2%, respectively, for sickle
cell anemia. The data suggested a poor knowledge of genetic tests among them66.
ATTITUDE TO SICKLE CELL DISEASE
In the study among the African American women of childbearing age mentioned above
57, the women had a low perception of susceptibility to sickle cell disease, a high
perception of benefit to sickle cell trait testing and a low perception of barriers to
testing for sickle cell trait. A high level of knowledge of sickle cell disease is associated
with a high level of acceptance; however, the health belief model revealed that the
majority of the participants did not feel that they were personally at risk to have a child
with sickle cell disease, regardless of sickle cell disease knowledge 57. Another study
among the American women in 2007 still showed that they frequently do not appear to
believe that they are at risk of having a child with the disease 58. In the study
conducted in University of Ibadan in 2006, mentioned above, the students had a
positive attitude toward sickle cell disease and genetic counselling 62.
The Igbo of Nigeria believe that everyone is ogbanje (reincarnates) but malevolent
ogbanje differ from others in being revenge-driven, chronically ill and engaging in
repeated cycles of birth, death and reincarnation 67. The result of a study which
examined culturally defined symptoms of 100 children classified as malevolent
ogbanje; and investigated their family history and child mortality experience showed
concordance between cultural descriptions of malevolent ogbanje and symptoms as

45
manifested in sickle cell patients. Hemoglobin analysis showed that 70 of the 100
children had sickle cell disease (SCD); while 68 families had death-related names.
The symptoms associated with Igbo cases of reincarnation, high child mortality rates,
and the high prevalence of sickle cell disease among children classified as malevolent
ogbanje all support the conclusion that the symptomatology and early mortality
experience are related to sickle cell. Names with themes of death were prevalent in
families of children described as malevolent ogbanje. 67.
The result of a study conducted in Ibadan to assess the attitudes and beliefs of
relatives of SCD sufferers on aspects of the disease showed that natural/genetic
aetiologies were the most commonly proffered (>70%), compared to 19.2% for cancer.
Only 8.6% believed in re-incarnation theory for SCD. More than eighty three per cent
believed that caring had made family ties closer. Though 43.2% felt depressed about
patient's condition, 83.9% felt glad with care-giving roles, and there was no evidence
of stigma from the neighborhood. Only 4.9% had known about possibility of SCD
before marriage. Over twelve per cent believed that SCD induced inferiority feelings in
patient, and 33.3% that SCD caused lower intelligence. Beliefs and attitudes were not
significantly correlated with global rating of burden. It was concluded that the
caregivers evidenced emotional disposition for community psychosocial support roles
if they can be supported by social welfare and health education 68.
ATTITUDE TO SCREENING FOR SICKLE CELL DISEASE OR TRAIT
The acceptability of prenatal screening as a means of controlling sickle cell anaemia
(SCA) in Nigeria was examined in Ile-ife. It was discovered that only 45% would opt

46
for termination of the affected pregnancies. Avoidance of the problems associated with
managing SCA children was the most important reason for approving pregnancy
termination, whereas 73% of those rejecting pregnancy termination did so for religious
and moral reasons. Seventy-eight percent of those interviewed would want PND
started in Nigeria. 69.
Female health workers in a Teaching Hospital in Oshogbo, were studied to know how
their knowledge would affect their attitude to early termination of affected pregnancy
detected by prenatal screening. The mean score of the knowledge of the
complications of sickle cell disease in pregnancy for the unmarried respondents was
4.60 +/- 1.6, and for the married 4.03 +/- 2.0. The mean score for the doctors was 5.29
+/- 0.73, for the nurses 4.42 +/- 1.63, and for the other health workers 3.66 +/- 2.18.
Three (21.4%) of the doctors would accept early termination of affected pregnancy,
while 31 (32.0%) and 21 (32.3%) of the nurses and the other health workers,
respectively, would accept termination of affected pregnancy.70.
In a study conducted in Pakistan mentioned earlier, it was discovered that the
attitudes regarding genetic diagnosis are markedly different among various societal
groups. A large proportion (88.5%) agreed to the idea of genetic diagnostic screening,
Premarital carrier screening was favoured by 77% of the respondents, but only 24% of
the doctors favoured making genetic screening mandatory, whereas 63% of the
parents agreed to the idea 56 .
In the study among medical students and physicians in Cameroon mentioned above,
majority (all physicans) considered genetic counseling as indispensable and prenatal
screening as acceptable. The acceptance of medical abortion increased with the level

47
of medical education (62.6, 74.7 and 90.7% among the pre-clinical, clinical students
and physicians respectively). Sickle cell anemia was considered as a "serious
disease" by a greater majority of respondents than Down syndrome (P < 0.001). But,
in all three groups, the acceptance of termination of affected pregnancy "if the
respondent's own child was affected" was lower for sickle cell anemia than Down
syndrome (22.4 versus 40.2%, 10.8 versus 29.3% and 36.1 versus 70.4%) 66.
In Cuban, women at risk of having children with sickle cell anaemia or sickle cell-
haemoglobin C disease were interviewed 2-8 years after the index pregnancy (that in
which their risk was detected) in order to collect information on their attitude towards
prenatal screening in subsequent pregnancies. Nineteen per cent of the stable
couples at risk (52/268) had had at least one further child or pregnancy. Of these, 44
per cent (23/52) requested prenatal screening early and spontaneously, and a further
44 per cent (23/52) requested prenatal screening but after re-identification by
screening and re-counselling. Only 12 per cent (6/52) did not request prenatal
screening. Attitude towards prenatal screening was most positive among more
educated women 71
In a prenatal screening service established in Nigeria, a cost-recovery fee, charged
only to sustain the service predictably limited access to it. DNA analysis of chorionic
villus sampling indicated Hb AA in 23.4 per cent, AS in 54 per cent and SS in 18.5 per
cent of the respondents who were all carriers. Almost all (96%) of the women with SS
foetuses terminated the pregnancies72.
A qualitative study among African-American 59 showed that they value prenatal testing
for the opportunities for choice and awareness and newborn screening was believed

48
to be beneficial for preparation and treatment. Barriers to education and awareness of
sickle cell and newborn screening were classified as personal, familial, and societal 59.
A population specific confidential enquiries was conducted among the Surinamese
Hindustanis, Surinamese and Antillean Afro-Americans, and North Africans (mainly
Moroccans), living in Holland. On average, 68% of the Surinamese Hindustanis and
42% of the Surinamese Afro-Americans were in favour of selective abortion in case of
affected pregnancy. Remarkably, 77% of the last group wanted to be tested for carrier
diagnostics and 67% declared to have knowledge of the disease before they were
informed. Only 16% of the Moroccans were in favour of selective abortion in case of
an affected foetus, while 79% wanted to have blood analysis to establish their carrier
status. The apparently limited wish for selective abortion expressed by Moroccans is
in contrast with the high number of illegal abortions reported among married women in
Morocco (39%). The wish for selective abortion among informed members of the
patients' organization was more than 80%73.
A study was conducted in North Eastern Nigeria to determine the awareness and
acceptability of prenatal screening of sickle cell genotype among health professionals
and students in North Eastern Nigeria. Two hundred and fifty seven (72.8%) had
heard about prenatal screening for sickle cell genotype. One hundred and eighty
seven, (53%) of the respondents would not like to terminate pregnancy by abortion if
prenatal screening detected genotype to be HBSS in first trimester with significantly
more Christians saying no to abortion. Only 50 (14.2%) of the respondents knew
where facilities for prenatal screening are obtainable in Nigeria whereas 303 (85.8%)
49
did not. It was concluded that religion may be a major factor militating against
acceptability of prenatal screening of SCA in North Eastern part of Nigeria74.
A study conducted in 2008 to determine the acceptability of newborn screening for
SCD on mothers of newly delivered infants at St. Philomena's hospital, a catholic
hospital in Benin City revealed newborn screening for SCD was acceptable to 99.7%
of the mothers. Of the 644 babies whose results were analysed, 485 (75.3%) were
AA, 133 (20.6%) were AS, seven (1.1%) were AC, 18 (2.8%) were SS, and one
(0.2%) was SC. The prevalence of SCD in the newborn population was 3% (2.8% SS
and 0.2% SC)75.
In a study conducted in University of Benin 64, majority of the respondents (90.0%)
agreed that couples should go for premarital genetic screening; of these, 85.5% would
ask their partners to do genotype test before marriage, however only 39.7% of them
said they would not continue with marriage plans if they and their partners were
discovered to have Hb AS genotypes. Many of them (41.8%) were not sure what
decision they would take but 18.5% said they would continue with the marriage plans
irrespective of genotype.
Out of those who responded to whether they would have children regardless of risks
involved, 33.7% said they would, 44.2% said they would not while the remaining
22.2% were not sure. Concerning the decision to take if child had SCD, 44.2 % said
they would accept the situation and continue to have children, 22.5% will do prenatal
screening and abort affected fetus while 40% will stop bearing children. The
acceptability of prenatal screening was quite low, probably due in part to lack of
awareness of this mode of diagnosis in this part of the world 64.

50
AWARENESS OF INDIVIDUAL’S GENOTYPE In the study concerning health beliefs among African American women regarding
genetic testing and counseling for sickle cell disease, the result showed that eleven
percent of the women were unaware of their sickle cell trait status 56. Another study in
Oakland in USA revealed that only 16% (n=45) knew their own trait status. When
respondents had received information about sickle cell disease from friends and
acquaintances, they were three times more likely to know their sickle cell trait status,
compared with respondents who had not received information from a personal source
(p<0.01) 58.
In a survey conducted in Ibadan in 2006, a majority of study respondents (63.6%)
knew their genotype, 62. The study conducted in Ile-Ife 63, revealed similar results as
153 (35%) had no knowledge of their haemoglobin electrophoretic patterns
"genotypes", forty percent of the respondents had HbAA, 15% HbAS, 1.6% HbAC, 2%
HbSS, and 0.2% HbSC; 63. The study conducted in the University of Benin also
revealed that more than half (65%) of them had done their genotype test, 51.8% of
those who had done their genotype test did it out of personal choice and
inquisitiveness, 25.8% did it as part of pre- school entry, 18.6 indicated that test was
requested by a doctor/nurse due to illness, while 4.1 as requested from intending
spouse 64.
The study conducted to determine the acceptability of newborn screening for sickle
cell disease by mothers of newly delivered infants in Benin in 2008 76 however

51
revealed that majority of mothers (71%) in this study did not know their haemoglobin
phenotype.
EFFECT OF HEALTH EDUCATION ON KNOWLEDGE AND ATTITUDES TO
SICKLE CELL DISEASE AND SCREENING
A study was conducted in USA to assess the effect of prenatal education about
newborn sickle cell screening on parents' compliance with the follow-up for infants
with sickle cell trait. The results showed that parents whose prenatal education
included sickle cell hemoglobinopathy information retained significantly more of the
information given during the post-natal education and had better follow up rates than
did controls76. The study among African Americans in 2006 also showed that a brief
educational intervention regarding sickle cell disease in a prenatal setting is effective
in significantly increasing knowledge and acceptance of screening for sickle cell trait
(p-value < 0.001) 57.
CHAPTER 3
MATERIALS AND METHODS
DESCRIPTION OF STUDY AREA
The study was carried out in Lagos State. The state was created on May 27, 1967 and
took off as an administrative entity on April 11, 1968. It is located on latitude 6035`N
and longitude 30 45` E, a territorial land area of 3,475.1 km². It is the smallest of all
Nigerian states but it has the second highest population after Kano State according to
the 2006 census. The preliminary results of the 2006 census show that Lagos State

52
now has 9,013,534 inhabitants out of a national total of 140,003,54 77. The rate of
population growth is about 275,000 persons per annum with a population density of
2,594 persons per sq. kilometer. The state is divided into 5 Administrative Divisions,
which are further divided into 20 Local Government Areas.
The National Youth Service Corps (NYSC) was established in Nigeria on 22 May,
1973 as a one year compulsory national service for new graduates of universities and
other tertiary institutions. Graduates above 30 years who do not wish to participate in
the programme are usually exempted. Most of the “corps members” are usually
between the ages of 20 and 30 years, unmarried (about 90%) 12 and represent
different ethnic, socio-economic, cultural and religious groupings in Nigeria. There are
usually two batches of corps members (batch A & B) posted to all the states in the
country, every year.
These new graduates first assemble in the “NYSC” orientation camps in the states (for
three weeks’ orientation), from where they are posted to institutions in all local
government areas in the state. The Lagos State NYSC orientation camp is located at
Iyana Ipaja, while the State NYSC secretariat is located at Babs Animasaun in
Surulere. Wherever the corps members are deployed to work, they are expected to
report at the ‘NYSC’ field secretariat of the local government where the institution is
located. In most cases, all the corps members in each local government area are
considered as one field. (Exceptions are Ikeja and Eti-Osa local government area
which have two field secretariats because of the large number of corps members
usually posted there).

53
The corps members in each batch are usually divided into different “CD” groups. Each
group meets once a week on different days for community development (CD) work.
Apart from the weekly “CDs”, all the Corps members in each local government
area/field also meet on the last Thursday or Friday of every month for general “CD”
meetings which are compulsory. They are usually monitored by the Zonal or Field
Inspector appointed for that local government/field, who sign their attendance cards on
such days. Defaulters serve different punishments including extension of the “Youth
Service” beyond one year.
STUDY POPULATION: The study population included new graduates of different
higher institutions in Nigeria on National Youth Service Corps programme serving in
Lagos State during the period of the research (i.e. 2007/2008 batch b). The total
population was five thousand.
INCLUSION CRITERIA
Only unmarried corps members in batch b 2007/2008 serving in Lagos State during
the period of the research were eligible to participate in the study.
STUDY DESIGN: This was a quasi-experimental study to determine the effect of
health education on the knowledge and attitude to sickle cell disease and screening.
SAMPLE SIZE ESTIMATION
In determining the sample size, the formula for the comparison of proportions of two
independent groups would be needed for the baseline comparison of the intervention
and control groups while the formula for the comparison of proportions of related

54
groups/within groups would be needed for the comparison of before and after
intervention data.
The formula for the comparison of proportions of two independent groups is given by:
n = (u + v)2 (P1(100-P1) + P2 (100 – P2) 78 (P1 – P2)2
Where:
n = Minimum required sample size
P1 = Estimated proportion of corps members who had good level of knowledge of
sickle cell disease before intervention (63.6%) 62.
P2 = Estimated proportion of corps members who had good level of knowledge of
sickle cell disease after intervention. (80%)
u = the critical value corresponding to power of the study at 80%
= 0.84
v = Percentage of the normal distribution corresponding to the significance level (at
5% significance level, v = 1.96 for two sided significance and 1.65 for one sided
significance). The significance involved in the study was two sided at baseline to find
out the difference between the two groups therefore 1.96 was used.
Using proportion of corps members who have a good level of knowledge of
sickle cell disease.
P1= proportion of corps members who have good level of knowledge before
intervention estimated at 64 % 62 and
P2 = proportion of corps members who have good level of knowledge after
intervention estimated at 80%.

55
n = (1.96 + 0.84)2 (64 (100-64) + 80(100-80) (80 – 64)2 = 7.84 (2304 + 1600) 256 = 30607.36
256 = 119.56
The formula for comparing proportions within groups / between two related
groups meant for before and after intervention comparison is given by:
n= (Zα√ Πo (1- Πo) + Zβ√ Π1 (1- Π1) 2 79
(Π1- Π0)
Where:
Zα = Percentage of the normal distribution corresponding to the one sided significance
level (one sided because health education can only improve knowledge and attitude).
At 5% significance level Zα = 1.65.
Zβ = the critical value corresponding to power of the study at 80%
= 0.84
Πo = Proportion of corps members who had good level of knowledge before
intervention estimated at 64 % 62.
Π1 = Estimated proportion of corps members who had good level of knowledge of
sickle cell disease after intervention. (80%)
n= (1.65 √ 0.64 (1-0.64) + 0.84√0.8 (1-0.8) 2
(0.16)
n = (1.65 √ 0.64 (0.36) + 0.84√0.8 (0.2) 2

56
(0.16)
n = 1.65 √ 0.23 + 0.84√ 0.16 2
(0.16)
n = 0.79 + 0.34 2
(0.16)
n = 1.13 2
(0.16)
n = 49.9 =50
The former formula gave the larger sample size therefore the sample size obtained
using that formula was taken as the minimum sample size.
Therefore the minimum sample size = 120.
To compensate for non responses, misplaced or improperly completed questionnaires
and attrition, the calculated sample size was increased by 20%; it was calculated as
follows:
0.2 (120) =24
24+ 120 = 144
SAMPLING METHODOLOGY
A multistage sampling technique was used to determine the respondents for the
intervention and control groups.
Stage one: Two divisions were selected from the five administrative divisions in Lagos
State using simple random sampling method (balloting) and they were Lagos and
Ikeja divisions.

57
Stage two: One local government area was selected from each division using simple
random sampling and they were Lagos Island and Ikeja local government areas. Each
of the two local government areas was assigned to either intervention or control group
through the process of simple balloting. Lagos Island emerged as the intervention
group while Ikeja emerged as the control group. The two local government areas are
far apart enough to minimize contamination of the control group by the intervention
group.
Stage three: In Lagos Island Local Government Area, the corps members in batch b
2007/2008 were about two hundred and eighty (280), out of which two hundred and
thirty nine (239) were eligible; therefore all the eligible corps members in that batch
were recruited for the study.
In Ikeja local government area (the control group), there were two separate field
groups, who meet for general “CD” in different locations (field “NYSC” secretariats).
One field group was selected using simple random sampling which was field group 2,
known as Ikeja 2. The corps members in batch b 2007/2008 in this field group were
about two hundred and fifty (250) out of which two hundred and twelve (212) were
eligible, therefore all the eligible corps members there were recruited as controls.
DATA COLLECTION TOOLS AND TECHNIQUES
Data collection was through quantitative method using semi-structured self
administered anonymous questionnaire. The first section of the questionnaire elicited
information on socio-demographic characteristics; the second section was on
knowledge about acquisition, presentation, severity, treatment and screening while the
third section was on attitude to the disease and sickle cell trait status. The last section

58
was on attitude to screening, likelihood of benefits from and barriers to testing. This
section was also used to determine the proportion of corps members who know their
genotype. (See questionnaire attached in appendix IV).
Pre-testing of instruments:
Questionnaire was pre-tested by the researcher among twenty corps members in
Mushin local government area with a view to detecting deficiencies or ambiguities in
the questionnaires and making appropriate corrections.
Pre-intervention stage:
The questionnaires were given to the corps members in both intervention and control
groups with the assistance of the field/zonal inspectors (who helped in mobilizing the
corps members) on one general ‘CD’ day when they all assembled at the secretariat
for ‘community development’. The questionnaires were self-administered by the corps
members since they all have tertiary education. The exercise was supervised by the
researcher and two research assistants who were trained for the purpose to ensure
that the questionnaires were properly completed. It took about thirty minutes to fill
each questionnaire and they were retrieved on the same day.
Intervention stage
The questionnaires were cleaned, computerized and analyzed. It took four weeks to
complete the cleaning and analysis; after which the health education intervention was
given to the gathering of corps members in the intervention group. A health talk was
conducted for about thirty (30) minutes with audio visual aids and focused on: the
basic genetics, transmission, implications for the affected individuals and their

59
families, of sickle cell disease and carrier states; and importance of screening.
Emphasis was placed on areas of deficiencies in their knowledge and attitudes as
discovered from the analysis of the pre-intervention questionnaire. The talk was
followed by a session of questions and discussions.
The corps members were given “hand bills” as memory aids after the health talk and
discussions. This hand bill reiterated the severity, complications of sickle cell disease
and, importance of screening and making informed decision.
At the end of the intervention, genotype tests were made available free of charge at
the venue of the health education for all the participants who indicated willingness to
obtain the test. Blood samples were collected and transferred on a rack in icepacks to
the public health laboratory of the Community Health Department of Lagos University
Teaching Hospital. Tests were carried out by laboratory scientists who are well trained
and experienced in that field. For this purpose, haemoglobin electrophoresis was
performed on the subjects’ EDTA anti-coagulated venous blood samples using
cellulose acetate strips in Tri- EDTA-borate buffer at pH 8.4. A sickling test was done
prior to the haemoglobin electrophoresis to distinguish between haemoglobin S and D
which usually run together and therefore indistinguishable in alkaline pH haemoglobin
electrophoresis. Provision was made for genotype screening of thirty participants and
the cost including transportation of the technologist to and from the site was thirty
thousand. The results of the haemoglobin electrophoresis and sickling tests were
given to each participant in a confidential manner and those who had sickle cell trait
were counseled.
Post intervention stage:

60
Three (3) months after the intervention had taken place, the questionnaires were
administered again to the two groups.
For the control group, the health education intervention was given after the
administration of the post intervention questionnaire, following the same pattern as
with the intervention group. They also received the hand bills as a form of memory
aids.
ETHICAL CONSIDERATIONS
The study protocol was sent for approval from the Ethics and Research Committee of
the Lagos University Teaching Hospital; and approved before the commencement of
the study. (See ethical approval attached in appendix II)
Permission was obtained from the chairmen of the two local government areas, and
the field/zonal inspectors in charge of the two ‘NYSC’ fields used, after they have been
duly informed of the aims of the study.
For corps members to be interviewed, informed consent was obtained from each of
them. Participants were assured that information provided would be treated with strict
confidentiality. In view of this, names of those interviewed were not required. After the
evaluation, the control group also received the intervention.
DATA ANALYSIS
The Epi Info software (windows 2000) was used for data entry, validation, cleaning
and analysis. Programme for epidemiologists (PEPI) was used for analysis where the
values in some cells were less than five (5) making Chi-square not valid. Four stage
analyses were done. The comparison of the intervention and control population pre-

61
intervention to demonstrate equivalence at pre-intervention; the comparison of the
control group data before and after intervention to show no difference; and the within-
group comparison of the intervention group before and after, as well as the
comparison of the intervention and control groups post-intervention to show difference
in each pair.
In determining the level of knowledge of each respondent about sickle cell disease, a
sixteen (16) point scale developed by the researcher was used. Twelve questions
(Questions12 to 23) on knowledge of SCD in section B of the questionnaire were
scored. One question (Question 21) had five stems and therefore was scored five
points while others were scored one point each, making a total of sixteen points (16).
Those who scored six points or less (< or =6) were considered as having poor
knowledge; those who scored between six and nine points (7 -9) were considered as
having fair knowledge, while those who scored between ten and sixteen points (10-16)
were considered as having good knowledge.
In determining the level of knowledge of each respondent about genotype screening, a
six (6) point scale developed by the researcher was used. Six questions (Questions 24
to 29) on knowledge of screening for SCD and trait in section B of the questionnaire
were scored. Each question was scored one point each, making a total of six points
(6). Those who scored two points or less (< or =2) were considered as having poor
knowledge; those who scored either three or four points (3 -4) were considered as
having fair knowledge, while those who scored either five or six points (5-6) were
considered as having good knowledge.

62
In determining the level of knowledge of each respondent about sickle cell disease
and screening together, a twenty two (22) point scale developed by the researcher
was used. Eighteen questions (Questions12 to 29) on knowledge of SCD in section B
of the questionnaire were scored. One question (Question 21) had five stems and
therefore was scored five points while others were scored one point each, making a
total of twenty two points (22). Therefore the total points obtainable by a respondent,
was twenty two (22). Those who scored eight points or less (< or =8) were considered
as having poor knowledge; those who scored between nine and thirteen points (9 -13)
were considered as having fair knowledge, while those who scored between fourteen
and twenty two points (14-22) were considered as having good knowledge.
In determining the attitudes to sickle cell disease and screening, the Likert scale would
have been used for the assessment, but it was not adaptable to some of the
questions. The questions on attitudes were therefore analyzed separately and the
proportions of respondents who had positive attitudes were determined.
Appropriate statistical tests of significance (Chi square for comparison of proportions)
between the two groups and within each group pre-and post intervention data were
used. A p value ≤0.05 was considered statistically significant. Analyzed data was
presented in the form of frequency tables, cross tabulations and charts.
OUTCOME INDICATORS
Proportion of “corps members” who have a good level of knowledge about sickle cell
disease and screening.
Proportions of corps members who have positive attitudes to sickle cell disease.

63
Proportions of corps members who have positive attitudes towards screening for
sickle cell disease and sickle cell trait.
Proportion of corps members who know their genotype.
CHAPTER 4
RESULTS
Two hundred and thirty nine (239) corps members in intervention group and two
hundred and twelve (212) in control group were included in the baseline and follow up
questionnaire surveys. Two hundred and twenty (220) and one hundred and ninety
eight (198) valid questionnaires were collected at baseline yielding response rates of
92.1% and 93.4% from the intervention and control groups respectively. At the follow
up survey, two hundred and eighteen (218) and one hundred and ninety six (196) valid

64
questionnaires were collected yielding response rates of 91.2% and 92.5% from the
intervention and control groups respectively. The presentations in sections A to C are
the results of baseline data while section D is the result of post intervention data.
SOCIODEMOGRAPHIC CHARACTERISTICS OF RESPONDENTS
The respondents' ages ranged from 19 to 33 years. The mean age of the respondents
was 25.0 + 2.2 years in the intervention group and 25.1 + 2.4 years in the control
group. The modal age group was 24-29 in both the intervention and control groups.
There was no significant difference in the age distribution of both groups (p=0.76).
More than half of the respondents (53.6%) in the intervention group, and (55.6%) in
the control group were females (Table 1).
Most of the respondents (91.4% and 90.4% in intervention and control groups
respectively) had university education while only about 9% in each group had
polytechnic education. There was no other type of school mentioned. Social sciences
were the commonest courses studied by respondents in both groups followed by pure
and applied sciences. Law was the least common course in the intervention group
followed by health sciences while health sciences was the least common course in the
control group followed by arts. The observed difference in the courses studied was not
statistically significant (p=0.07) (Table 1).
Table 1: Socio-demographic characteristics of respondents
Variables Intervention Control χ2 P
Freq (%) Freq (%)
Age group 19 – 23 92 (41.8) 83 (41.9) 0.55 0.76 24 – 29 121 (55.0) 106 (53.5) df=2 30 – 34 7 (3.2) 9 (4.6) Total 220 (41.8) 198(100) Sex Female 118 (53.6) 110 (55.6) 0.15 0.694 Male 102 (46.4) 88 (44.4) df=2 Total 220 (100) 198 (100)

65
Education University 201 (91.4) 179 (90.4) 0.12 0.733 Polytechnic 19 (8.6) 19 (9.6) df=2 Total 220 (100) 198 (100) Course
Arts 28 (13.6) 16 (8.1) Health Sciences 14 (6.4) 129 (6.1) 10.33 0.066 Law 6 (1.8) 17 (8.6) df= 5 Pure and applied Science
55 (25.0) 46 (23.2)
Social Sciences 74 (33.6) 76 (38.4) Others 43 (19.5) 31 (15.7) Total 220 (100) 198 (100) Religion Christianity 202 (91.8) 181 (91.4) 0.33 0.846 Islam 16 (7.3) 16 (8.1) df= 2 Others 2 (0.9) 1 (0.5) Total 220 (100) 198 (100) Ethnic group Edo/Ibibio 7 (3.2) 5 (2.5) 9.891* 0. 078 Hausa/Idoma/Tiv 7 (1.4) 4 (2.0) df = 5 Igbo 58 (26.5) 47 (23.7) Urhobo 24 (11.0) 13 (6.6) Yoruba 100 (45.7) 117 (59.1) Others 24 (11.0) 12 (6.1) Total 220 (100) 198 (100)
Mean Age 25.0 25.1 Std Dev 2.2 2.4 Socio-demographic characteristics continued.
Majority (91.8 % of the intervention group and 91.4% of the control groups) were
Christians. About half (45.7% in intervention and 59.1% in control) were Yorubas
followed by Igbos. The frequencies of the other tribes varied among the two groups
but it was not statistically significant (p= 0.209) (Table 1).
The socio-demographic characteristics of both the intervention and control groups
were similar since there was no statistically significant difference between them in any
of the variables.
* Corrected Χ2 and p -value

66
PRE- INTERVENTION
SECTION A: KNOWLEDGE ABOUT SICKLE CELL DISEASE The presentations in this section (Tables 3 to 8, Figure 1) show the knowledge of the
respondents about different aspects of sickle cell disease before the intervention.
Almost all (intervention: 99.1% and control: 99.0%) the respondents were aware of
sickle cell disease. A lot of the respondents (about 44% in each group) obtained their
information about SCD from the school while about 36% and 39% got it from the
media in the intervention and control groups respectively. The clinic/hospital was a
source for only 29.4% and 23% in intervention and control groups respectively. There
was no significant difference between the proportions of respondents who were aware
of SCD and the proportions who obtained information from each source among the
two groups (Table 2).
Only 28.0% in intervention and 24.5% in control groups correctly knew that SCD
occurs more amongst black people. More than half (54.1% and 53.1%) of respondents
in the intervention and control groups respectively thought sickle cell disease occurs
equally all over the world. There was no statistically significant difference between the
two groups with respect to the knowledge of distribution of the disease (Table 3).
Table 2: Distribution of respondents by awareness and sources of information about sickle cell disease
Awareness Intervention Control Χ2 p
Freq (%) Freq (%)
Aware 218 (99.1) 196 (99.0) 0.16* 0.69 Not aware 2 (0.9) 2 (1.0) Total 220 (100) 198 (100)
Sources of information
n= 218 n=196
* Corrected Χ2 and p -value

67
Relatives 68 (31.2) 44 (22.4) 4.00 0.046 Friends 71 (32.6) 50 (25.5) 2.49 0.115 School 96 (44.0) 87 (44.4) 0.01 0.943 clinic/hospital 64 (29.4) 45 (23.0) 2.18 0.134 Media 79 (36.2) 78 (39.8) 0.55 0.456
Table 3: Respondents' knowledge about racial distribution of sickle cell disease
pre-intervention
Occurs (more Among)
Intervention Group
Control Group
Freq (%) Freq (%)
White people 5 (2.3) 1 (0.5) Black people 61 (28) 48 (24.5) Equally all over the world
118 (54.1) 104 (53.1)
Don't know 34 (15.6) 43 (21.9)
Total 218 (100) 196 (100)
χ2= 5.23* df = 3 P=0.155
Majority (88.10% in intervention and 91.3% in control group) correctly identified
'inheriting genes from parents' as the cause of SCD. There was no significant
difference between the two groups with regards to knowledge of cause of sickle cell
disease (Table 4).
Less than half of the respondents (45.4% in intervention group; and 48.5 % in control
group) knew that sickle cell disease occurs if both parents have at least one HbS and
have children. About 11.5% and 12.2% erroneously thought it occurs only if both
parents have SCD and have children. There was no statistically significant difference
between the two groups in terms of their knowledge about pattern of inheritance
(Table 5).

68
Majority (84.4% and 75.5%) knew that SCD is a serious disease in the intervention
and control groups respectively. Most of them (73.4% in the intervention group and
58.7% in the control group) also knew that SCD cannot be cured easily in Nigeria
today. The observed difference between the two groups with regards to knowledge of
treatment was significant (Table 6).
Only 11% of the respondents in intervention and 11.7% in control knew stroke to be
complications of SCD while 29.8% in intervention group and 34.2% in the control
group knew infections as complications. Most of them (62%) were able to identify
severe debilitating pain as a complication. There was no statistically significant
difference between the proportions who knew each complication among the two
groups (Table 7).
Only 41% of the respondents in intervention and 42% in control groups knew that
sickle cell disease is not manifested in carriers. Almost one quarter (21% in
intervention and 24.5 in control) thought it could manifest in carriers (Figure 1).
Table 4: Distribution of respondents by knowledge of cause of sickle cell
disease pre- intervention
Cause
Intervention group
Control group
Freq (%) Freq (%)
Dirty needles 3 (1.4) 0 A virus 5 (2.3) 1 (0.5) Inheriting genes from parents 192 (88.1) 179 (91.3) Contact with affected persons 1(0.5) 0 (0) Bad blood 4 (1.8) 5 (2.6) Don't know 13 (6) 11 (5.6)
Total 218 (100) 196 (100)

69
χ2= 8.020* df = 5 p=0. 155*
Table 5: Respondents' knowledge about pattern of inheritance of sickle cell
disease pre-intervention
Pattern of inheritance Intervention group
Control group
Freq (%) Freq (%)
If at least one parent has SCD and has children
26 (11.9) 27 (13.8)
Only if both parents have SCD and have children
25 (11.5) 24 (12.2)
If either of both parents has HbS and have children
25 (11.5) 27 (13.8)
If both parents have at least one Hb S and have children
99 (45.4) 95 (48.5)
Don't know 43 (19.7) 23 (11.7)
Total 218 (100) 196 (100)
χ2= 5.10 df =4 p=0.277
Table 6: Distribution of respondents by knowledge of severity and cure of sickle cell disease pre-intervention
Knowledge of severity
Intervention group
Control group
χ2 P
Freq (%) Freq (%)
A mild disease 5 (1.8) 7 (3.6) A moderate disease 11 (5) 11 (5.6) A serious disease 183 (84.4) 148 (75.5) 5.35 0.148 Don't know 19 (8.7) 30 (15.3) (df = 3)
* Corrected Χ2 and p -value

70
Knowledge of treatment
Not cured easily 160 (73.4) 115 (58.7) Cured easily 22 (10.1) 34 (17.3) 10.25 0.006 Don't know 36 (16.5) 47 (24) (df=2)
Total 218 (100) 196 (100)
Table 7: Distribution of respondents by knowledge of complications of sickle cell disease pre-intervention
Complications
Intervention group
Control group
χ2 P n=218
Freq (%) n=196
Freq (%)
Severe Pain 136 (62.4) 122 (62.2) 0.00 0.977 Stroke 24 (11) 23 (11.7) 0.05 0.816 Infections 65 (29.8) 67 (34.2) 0.91 0.342 Organ damage 69 (31.7) 61 (31.1) 0.01 0.908 Psychological disorders
59 (27.2) 65 (33.2) 1.83 0.176

71
21.10
40.8038.10
24.50
41.80
33.70
0.00
10.00
20.00
30.00
40.00
50.00
60.00
70.00
80.00
90.00
100.00
Yes No Don't know
Carriers manifest the disease
Pe
rce
nta
ge
s o
f re
sp
on
de
nts
Interv. grp control grp
Figure 1: Respondents' knowledge about manifestation of sickle cell disease in carriers.
The knowledge of respondents about sickle cell disease was scored and graded as
specified in the methodology. Only 27% of the respondents in intervention and 23.5%
in control groups had good level of knowledge about sickle cell disease while about
40% from both groups had poor level of knowledge (Table 8).
Table 8: Distribution of respondents by level of knowledge about sickle cell
disease pre-intervention
Level of knowledge about SCD
Intervention group
Control group
Freq % Freq (%)
Poor (0 to 6) 84 (38.6) 81 (41.4) Fair (7 to 9) 75 (34.4) 69 (35.1) Good (10 to 16) 59 (27.0) 46 (23.5)
Total (16) 218 (100) 196 (100)
χ2 = 0. 75 p= 0. 688

72
SECTION B: KNOWLEDGE ABOUT SCREENING FOR SICKLE CELL GENOTYPE This section (Tables 9 to11) describes the knowledge of the respondents about
screening for sickle cell disease and trait.
Only about half (51% in intervention; 52% in control) of the respondents knew that
prenatal screening is possible, while 56.4% in intervention and 52.6 % in control
groups knew that neonatal screening is possible. The two groups were similar in terms
of knowledge about prenatal screening and neonatal screening (Table 9).
A little above half of the respondents (51.8% in intervention and 58.2% in control
groups) knew that sickle cell haemoglobin can be detected by blood test. About one
quarter of them (26.6% in intervention and 21.6% in control) thought it is through
yellowness of the eyes. There was no statistically significant difference between the
two groups (Table 10).
The knowledge of respondents about screening was scored and graded as specified
in the methodology. Only 15.6% of the respondents in intervention and 18.4% in
control groups had good level of knowledge about screening for sickle cell disease
and trait while about 40% from both groups had poor level of knowledge about
screening. There was no statistically significant difference between the intervention
and control groups (Table 11).
The knowledge of respondents about sickle cell disease and screening was scored
and graded as specified in the methodology. Only 25.3% in intervention and 23.5% in
control had good level of knowledge about SCD and screening. About 38.5% and
34.2% had poor level of knowledge in intervention and control groups respectively.
There was no statistically significant difference between the proportions at different
levels of knowledge among the two groups (Table 12).

73
Table 9: Respondents' knowledge about possibility of prenatal screening and neonatal screening for sickle cell disease pre-intervention
Possibility of prenatal screening
Intervention group Control group Χ2 P
Freq (%) Freq (%)
Possible 112 (51.4) 102 (52.0) Not possible 26 (11.9) 30 (15.3) 1.37 0.505 Don't know 80 (36.7) 64 (32.7) Df =2 Total 218 (100) 196(100) Possibility of Neonatal screening Possible 123 (56.4) 103 (52.6) Not possible 16 (7.3) 26 (13.3) 3.98 0.137 Don't know 79 (36.2) 67 (34.2) df = 2
Total 218 (100) 196 (100)
Table 10: Respondents knowledge of how to detect the sickle cell gene in an
adult
How to detect sickle cell gene
Intervention group
Control group
Freq (%) Freq (%)
Yellowness of the eye With a blood test With a urine test There is no way to know Don’t know how Others
58 (26.6) 113 (51.8)
3 (1.4) 2 (0.9)
37 (17.0) 5 (2.3)
56 (28.6) 102 (52.0)
3 (1.5) 5 (2.6)
23 (11.7) 7 (3.6)
Total (16) 218 (100) 196 (100)
χ2 = 4.33 p = 0.503 Table 11: Distribution of respondents by level of knowledge about genotype screening pre-intervention
Level of knowledge about screening
Intervention group
Control group
Freq % Freq (%)
Poor (0 to 2) 87 (40.0) 72 (36.7) Fair (3 to 4) 97 (44.4) 88 (44.9) Good (5 to 6) 34 (15.6) 36 (18.4)
Total (6) 218 (100) 196 (100)
χ2 = 0.74 p = 0.69

74
Table 12: Distribution of respondents by level of knowledge about sickle cell disease and screening pre-intervention
Level of knowledge
Intervention group
Control group
Freq % Freq (%)
Poor (0 to 8) 84 (38.5) 67 (34.2) Fair (9 to 13) 79 (36.2) 83 (42.3) Good (14 to 22 55 (25.3) 46 (23.5)
Total (22) 218 (100) 196 (100)
χ2=1.65 p = 0.438 Mean score = 10.1 + 4.4 10.3 + 4.0
SECTION C: ATTITUDES TO SICKLE CELL DISEASE
The presentations in this section (Figure 2, and Tables 13 to 17) show the attitudes
of the respondents to sickle cell disease. The attitudes to the disease were positive in
most areas (at least 63% of the respondents had positive attitudes to most aspects
considered) except the belief about people with sickle cell disease being able to
achieve as much as their mates and the perception of risk of the disease.
Majority of the respondents (67.9% and 63.8%) considered sickle cell disease as a
major health problem in the intervention and control groups respectively. The attitudes
of respondents in the two groups were similar (Figure 2).
Many of the respondents (68.3% in intervention and 72.0% in control) believed that all
the people who have SCD are normal, except for the blood defect; while only 38.5% in
intervention and 35.2% in control believed that they can achieve as much as their
mates in life. Only about 7% in each group believed that they were reincarnates
known as abiku or ogbanje. The two groups were not different in terms of their
attitudes to people with sickle cell disease (Table 13)

75
67.9
22.9
9.2
63.8
27.6
8.7
0.0
10.0
20.0
30.0
40.0
50.0
60.0
70.0
80.0
90.0
100.0
Major health problem Minor health problem Undecided
Attitude to significance of SCD
Pe
rce
nta
ge
s o
f re
sp
on
de
nts
Interv. Grp Control Grp
Figure 2: Respondents' attitude to sickle cell disease being a major problem Table 13: Respondents' attitudes to people with sickle cell disease pre-intervention
Attitude to people with sickle cell disease
Intervention grp.
Control grp
χ2 P
n=218 Freq (%)
n=196 Freq (%)
Normal except for the blood defect.
149 (68.3) 141 (72.0) 0.87 0.351
Can ever achieve as much as their mates
84 (38.5) 69 (35.2) 0.49 0.484
Reincarnates known as abiku /ogbanje All die young before 15 yrs
15 (6.9)
30 (13.8)
14 (7.1)
20 (10.2)
0.47
1.23
0.495
0.237

76
Less than half (45% in intervention and 40% in control groups) believed that SCD
could exist in their families while 33.5% and 33.7% thought it was not possible in
intervention and control groups respectively. There was no difference between the two
groups with regards to attitudes to the possibility of existence of sickle cell disease in
their families (Table 14).
More than 60% of the respondents in both groups had stable proposed marriage
partners. Majority of the respondents who had proposed marriage partners (66.7% in
intervention and 73.9% in control groups) were aware of their partner’s genotype.
while about 33.4 % in intervention and 26.0% in control were not aware. There was no
significant difference between the proportions of respondents who had partners or
who were aware of their partners’ genotypes among the two groups (Table 15).
Only 11.1% and 3.2% of those whose partners had not done genotype believed that
their partners could be carriers of SCD while 88.9% and 70% believed it was not
possible in the intervention and control groups respectively. The observed difference
between the two groups was not statistically significant (Table 16).
Almost half of the respondents (44.4% in intervention and 48% in the control group)
would change marriage plans if they discover that they and their partners had SCT.
Only about 8% from each group would do prenatal screening with selective abortion,
while about 12% and 8% would freely accept if their children had sickle cell disease in
intervention and control groups respectively. There was no statistically significant
difference between the attitudes of respondents in the two groups (Table 17).

77
Table 14: Attitude of respondents to the possibility of existence of sickle cell disease in their families pre-intervention
Existence in their nuclear / Extended family
Intervention group __________
Control group __________
Freq (%) Freq (%)
Possible 98 (45.0) 79 (40.3) Not Possible 73 (33.5) 66 (33.7) Undecided 47 (21.6) 51 (26)
Total 218 (100) 196 (100)
χ2= 1.39 df = 2 p=0.499
Table 15: Distribution of respondents by having proposed marriage partners
and partners having done genotype test
Proposed marriage partner Intervention group _____________
Control group ___________
Χ2 P
Freq (%) Freq (%)
Have 135 (62.2) 119 (60.7) 0.06 0.800 Don’t have 83 (37.8) 77 (39.3) Total 218 (100) 196 (100)
Partner ever done Genotype
n=135
n=119
Yes 90 (66.7) 88 (73.9) No 24 (17.8) 16 (13.4) 1.62 0.445 Don't know 21 (15.6) 15 (12.6) df= 2
Total 135 (100) 119 (100)
Table 16: Attitude of respondents who were not aware of their partners’ genotypes to the possibility of partners being carriers pre-intervention
Partner being A carrier
Intervention group
Control group
n=45 Freq (%)
n=31 Freq (%)
Possible 5 (11.1) 1 (3.2) Not possible 40 (88.9) 21 (67.8) Undecided 0 (0.0) 9 (29.0)
Total 45 31
χ2= 18.81* df = 2 p=0. 000*

78
Table 17: Likely decisions of respondents if they and their partners were discovered to be carriers (pre-intervention)
Likely decision if both are carriers
Intervention grp ___________
Control grp. ________
χ2 p- value
N=218 Freq (%)
n=196 Freq (%)
Change marriage plan 88 (44.4) 94 (48) 0.94 0.333
Accept to be childless 8 (4.1) 1 (0.5) 3.47 0.039*
Use a sperm donor 9 (4.6) 3 (1.5) 1.64 0.201*
Do prenatal screening 17 (8.6) 15 (7.7) 0.00 0.956
Limit child bearing 27 (13.7) 26 (13.3) 0.07 0.789
Freely accept if child has SCD 24 (12.2) 15 (7.7) 1.36 0.240
Don't know 51 (25.9) 50 (25.9) 0.25 0.617
SECTION C: ATTITUDE OF RESPONDENTS TO SCREENING FOR SICKLE CELL DISEASE AND TRAIT
This section (Figures 3 to 6, tables 18 to 26) describes the attitudes of respondents
to screening for sickle cell disease and trait. The attitudes to screening were positive
in most areas (at least 79% had positive attitude to most areas considered) except
genetic counseling after screening. Most of them were aware of their genotypes.
Majority of the respondents (85.3% and 89.3%) believed that genotype screening is
useful to the society. There was no significant difference between the attitudes of
respondents in the two groups (Figure 3).
About 39.9 % in intervention and 35.7 % in the control groups strongly agreed/agreed
that prenatal screening and selective abortion is a good practice while 33.5% in
intervention and 39.7% in control groups strongly disagreed/disagreed. Majority of the
respondents (about 80% in each group) supported mandatory newborn screening.
There was no statistically significant difference in the attitudes of respondents in the
two groups towards prenatal screening and mandatory newborn screening (Table 18).
* Corrected Χ2 and p -value

79
85.3
3.7
11
89.3
1.5
9.2
0
10
20
30
40
50
60
70
80
90
100
Useful Harmful Undecided
Attitude to usefulness of screening for sickle cell disease
Per
cent
ages
of r
espo
nden
ts
Intervention grp Control grp
Figure 3: Respondents' attitude to usefulness of screening for sickle cell disease Table 18: Respondents' attitudes to prenatal screening with selective abortion and mandatory newborn screening pre-intervention
Prenatal screening and selective abortion
Intervention group _____________
Control group ___________
χ2
P Freq (%) Freq (%)
Strongly agree
44 (20.2)
36 (18.4)
1.80
0.773
Agree 43 (19.7) 34 (17.3) df = 4 Undecided 58 (26.6) 48 (24.5) Disagree 32 (14.7) 34 (17.3) Strongly disagree 41 (18.8) 44 (22.4) Mandatory new-born screening
Support 173 (79.4) 158 (80.6) Do not support 28 (12.8) 21 (10.7) 0.51 0.774 Undecided 17 (7.8) 17 (8.7) df= 2
Total 218 (100) 196 (100)
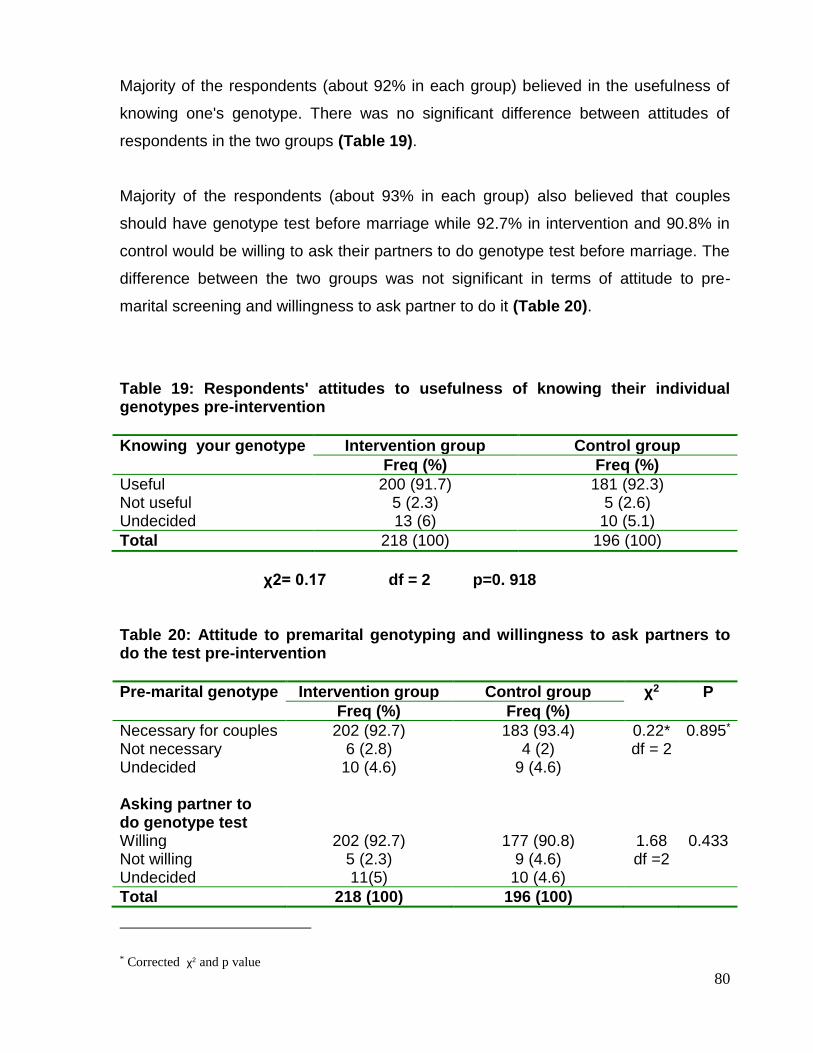
80
Majority of the respondents (about 92% in each group) believed in the usefulness of
knowing one's genotype. There was no significant difference between attitudes of
respondents in the two groups (Table 19).
Majority of the respondents (about 93% in each group) also believed that couples
should have genotype test before marriage while 92.7% in intervention and 90.8% in
control would be willing to ask their partners to do genotype test before marriage. The
difference between the two groups was not significant in terms of attitude to pre-
marital screening and willingness to ask partner to do it (Table 20).
Table 19: Respondents' attitudes to usefulness of knowing their individual genotypes pre-intervention
Knowing your genotype Intervention group Control group
Freq (%) Freq (%)
Useful 200 (91.7) 181 (92.3) Not useful 5 (2.3) 5 (2.6) Undecided 13 (6) 10 (5.1)
Total 218 (100) 196 (100)
χ2= 0.17 df = 2 p=0. 918
Table 20: Attitude to premarital genotyping and willingness to ask partners to do the test pre-intervention
Pre-marital genotype Intervention group Control group χ2 P
Freq (%) Freq (%)
Necessary for couples 202 (92.7) 183 (93.4) 0.22* 0.895* Not necessary 6 (2.8) 4 (2) df = 2 Undecided 10 (4.6) 9 (4.6) Asking partner to do genotype test Willing 202 (92.7) 177 (90.8) 1.68 0.433 Not willing 5 (2.3) 9 (4.6) df =2 Undecided 11(5) 10 (4.6)
Total 218 (100) 196 (100)
* Corrected χ2 and p value

81
Majority of respondents (60.6% in intervention; 62.8% in control) strongly
agreed/agreed that individuals should not pay for genotype test the government
should; but only 4.6% in intervention and 9.2% in control believed that genotype test is
painful. There was no statistically significant difference between the attitudes of
respondents in the two groups to the possible barriers to testing (Table 21).
Majority of the respondents (83% in intervention and 81% in control groups) knew their
genotypes while about 17.0% and 18.9% did not know it in intervention and control
groups respectively. There was no statistically significant difference in the awareness
of individual’s genotype between the two groups (Figure 4).
About one quarter of respondents (26.5% in intervention and 25% in control) who had
not done their genotype didn't do so because they didn't know about it while 23.5%
and 29% didn't do it because they didn't believe they were at risk of SCT. The
proportions who gave different reasons for not doing the test were similar among the
two groups (Table 22).
Only 22% in intervention group and 6% in control group of those who had not done
their genotype test believed that it is possible for their children to be at risk of SCD.
However 73% in intervention and 57% (in control groups) of them would like to be
tested for their genotypes. The observed differences between the two groups with
regards to attitude to risk and willingness to be tested were not statistically significant
(Table 23).

82
Table 21: Respondents' attitudes to possible barriers to testing pre-intervention
Individuals should not pay for test, govt. should
Intervention group ________________
Control group ____________
X2 p Value
Freq (%) Freq (%)
Strongly agree 60 (27.5) 69 (35.2) Agree 72 (33.1) 54 (27.6) 5.5 0.239 Undecided 39 (17.9) 29 (14.8) (df = 4) Disagree 21 (9.6) 26 (13.3) Strongly disagree 26 (11.9) 18 (9.2) Total 218 (100) 196 (100) Believe test is painful Yes 10 (4.6) 18 (9.2) No 187 (85.8) 161 (82.1) 3.49 0.175 Undecided 21 (9.6) 17 (8.7) (df = 2)
Total 218 (100) 196 (100)
83.00 81.00
17.00 18.90
0.00
10.00
20.00
30.00
40.00
50.00
60.00
70.00
80.00
90.00
100.00
Percentage of
respondents
Genotype known Genotype not known
Awareness of Genotype
Interv. Grp Control Grp
Figure 4: Distribution of respondents by awareness of their genotypes

83
Table 22: Respondents' reasons for having not done genotype pre-intervention
Reasons
Intervention group Control group
n=37 Freq (%)
n=37 Freq (%)
Didn't know about it 9 (26.5) 8 (25.0)
It's too costly 0 (0.0) 1 (3.1)
Don't believe I'm at risk of SCT 8 (23.5) 9 (29)
Afraid of the test being painful 1 (2.9) 1 (3.1)
No reason 14 (41.2) 14 (43.8)
No time 2 (6.0) 0 (0.0)
χ 2= 4.262* df = 5 p=0. 512* Table 23: Perception of risk of having children with sickle cell disease and willingness to be tested among respondents who had not done genotype test. (pre-intervention)
Risk of children having sickle cell disease
Intervention group Control group χ2 p n=37
Freq (%) n=37
Freq (%)
Not possible 24 (64.9) 26 (72.2) Possible 8 (21.6) 2 (5.6) 4.36* 0.113* Undecided 5 (13.5) 9 (22.2) df=2 Like to be tested
Yes 27 (73) 21 (56.8) No 8 (21.6) 6 (16.2) 5.48*. 0. 065* Undecided 2 (5.4) 10 (27) Total 37 (100) 37(100)
* Corrected Χ2 and p -value

84
Sixty nine percent (69%) of the respondents in intervention and 63% in control were
genotype AA while 12.8% in both groups were genotype AS. There was no statistically
significant difference between the distributions of genotypes in the two groups (Figure
5).
Only 30.4% in intervention group and 27.7% in control group of respondents who had
had genotype test did it out of personal choice. About 20.4% and 32.1% did it as a
request from a school on gaining admission while only 4.4% and 3.8 % did it based on
request from intending spouse in intervention and control groups respectively. The
proportions who gave different reasons were similar in the two groups (Figure 6).
Less than half (45.2% in intervention and 45.7% in control) of those who had SCD or
SCT had ever received genetic counseling. Among the rest who had not received,
only 35.3% in intervention group and 47.4% in the control group were willing to receive
it. There was no statistically significant difference between the two groups with regards
to uptake of genetic counseling and willingness to receive it (Table 24).
Majority of those who had SCT (73.3% and 90.3%) were willing to discuss their status
with their partners. The proportions that were willing to discuss their trait status with
their partners were similar in both groups (Table 25).
About 80.9% of the respondents in intervention and 78.8% in control groups were
willing to have more information about sickle cell disease while only 9.1% in
intervention group and 11% in control group were not willing. The observed difference
between the two groups was not statistically significant (Table 26).

85
68.8
12.8
0.9 0.0 0.5
17.0
63.3
12.8
1.5 3.1 0.5
18.9
0.0
10.0
20.0
30.0
40.0
50.0
60.0
70.0
80.0
90.0
100.0
1) AA 2) AS 3) AC 4) SS 5) SC 6) Don't know
Genotype
Percen
tag
es o
f resp
on
den
ts
Interv. Grp (n=218)
Control Grp(n=196)
Figure 5: Distribution of respondents by their individual genotypes
30.9
20.4
30.4
4.4
13.8
20.1
32.1
27.7
3.8
16.4
0.0 10.0 20.0 30.0 40.0 50.0 60.0 70.0 80.0 90.0 100.0
Done by parents as a
baby
Request from school for
admission
Out of personal choice
Request from intending
spouse
Requst from hosp/clinic
Re
as
on
s f
or
do
ing
ge
no
typ
e t
es
t
Percentage of respondents
Interv. Grp Control Grp
Figure 6: Distribution of respondents by reasons for doing genotype test

86
Table 24: Uptake of genetic counseling among respondents who have sickle cell disease or trait and willingness to receive it among those who have not received counseling (pre-intervention)
Had genetic counseling
Intervention grp. Control grp. χ2 P
n= 31 Freq (%)
n= 35 Freq (%)
Yes 14 (45.2) 16 (45.7) No 17 (54.8) 19 (54.3) 0.04 0.641 Like to receive N=17 N=19 genetic counseling Yes 6 (35.29) 9 (47.4) No 2 (11.76) 4 (21.1) 5.43* 0.143* Undecided 7 (41.18) 5 (26.3)
Table 25: Willingness of respondents who are carriers to discuss their trait
status with their partners pre-intervention
χ2= 1.15* df =2 p=0.562*
Table 26: Willingness of respondents to receive more information about sickle
cell disease pre-intervention
Like to receive more information
Intervention group Control group
Freq (%) Freq (%)
Yes 178 (80.9) 156 (78.8) No 20 (9.1) 22 (11.1) Undecided 22 (10) 20 (10.1)
Total 220 (100) 198 (100)
χ2= 0.48 df =2 p=0.785
* Corrected Χ2 and p -value
Like to discuss with partner
Intervention group Control group
n=30 Freq (%)
n=28 Freq (%)
Yes 22 (73.3) 22 (90.3) No 2 (6.7) 3 (9.7) Undecided 6 (20) 3 (0)
Total 30 (100) 28 (100)

87

88

89

90

91

92

93

94

95

96

97

98

99

100

101

102

103

104
CHAPTER FIVE
DISCUSSION
This study was conducted to evaluate the effect of health education on knowledge and
attitudes to SCD and screening among NYSC members in Lagos state. The results
showed that more than half of all the respondents were females; 45.7% in intervention
and 59.1% in the control groups were Yorubas, followed by Igbos. Majorities were
Christians, had university education and are within the age group 24-29 years. The
mean age of the respondents was 25.0 +2.2 years in the intervention group and 25.1
+ 2.4 years in the control group. This was expected since most people would not have
graduated from higher institution until they are about twenty years old and the age limit
for compulsory service in the NYSC is 30 years.
The NYSC members in the two local government areas were similar because there
was no statistically significant difference in their demographic characteristics at
baseline. It is therefore expected that any observed difference in the before and after
intervention assessments of the experimental group can be attributed to the health
education intervention.
In this study, almost all (intervention: 99.1% and control: 99.0%) the respondents were
aware of sickle cell disease before the intervention. A lot of the respondents (about
44% in each group) obtained their major information about SCD from the school while
about 36% and 39% got it from the media in the intervention and control groups
respectively. Friends were a commoner source of information than the health
institutions in the two groups. This is not good enough for a country that has the
highest burden of sickle cell disease worldwide because the information gotten from

105
friends may not be accurate. A study conducted in Ile-Ife had similar findings where
23% had heard of SCD through news media, 29% through friends and relations, 21%
obtained the information through health workers, while 5% had never heard of sickle
cell disease before the interview 63. Another study in Nigeria also revealed that the
health institutions in the locality and the electronic media were poor sources of
information on sickle cell anaemia 65..
Majority (88.1% in intervention and 91.3% in control group) correctly identified
'inheriting genes from parents' as the cause of SCD but less than half of the
respondents (45.4% in intervention group; and 48.5 % in control group) knew that
sickle cell disease occurs if both parents have at least one HbS and have children.
The knowledge of aetiology without understanding the pattern of inheritance is not
enough for an individual to take preventive actions. This finding was similar to some
studies conducted among the African American women, which showed that majority of
the participants (ninety-one percent in an instance) believed that sickle cell disease
was a hereditary blood disorder, but only a few (9.3% in the instance ) understood the
inheritance pattern 56,59. However, a contrast result was obtained in Ile-Ife where the
majority of the respondents (69.5%) appreciated the role of both parents in the
transmission of the disease 63. Other studies in Ibadan and Oakland USA have also
confirmed that natural/genetic aetiologies were the most (more than 70%) commonly
proffered by the respondents 68, 58
Majority knew that SCD is a serious disease (84.4% in intervention and 75.5% in
control) and cannot be cured easily in Nigeria of today (73.4% in the intervention
group and 58.7% in the control group). This agreed with other studies 66, 58 including

106
the one conducted among the African Americans where the women of childbearing
age had a high perception of severity of sickle cell disease 57. It was however different
from a study conducted in 2002 in Nigeria on the issue of treatment of SCD where
only 27.4% of the respondents said it could not be cured 6. These contrasting results
may be attributed to an increase in the awareness of SCD over the few years interval
between the two studies.
The proportion of the respondents who knew the complications was generally poor
except for severe debilitating pain which was identified by 62% of the respondents in
each group. Only 29.8% of respondents in intervention group and 34.2% in the control
group knew infections as complications while 11% of the respondents in intervention
and 11.7% in control knew stroke to be complications of SCD. The pattern of their
knowledge of the complications was similar to a study conducted among the African
Americans, where most women recognized pain (94%), infections (80%) and strokes
(40%) as complications of sickle cell disease 56 . However, the proportions who knew
each complication among the African Americans were higher than among these Youth
corps members in Nigeria where the disease is most prevalent.
This study revealed that only about half (51% in intervention and 52% in control) of the
respondents knew that prenatal screening is possible while 56.4% in intervention and
52.6 % in control groups knew the possibility of newborn screening. The proportion of
respondents who had knowledge of these types of screening is too low considering
the prevalence, severity and non-availability of definitive cure of the disease and
hence the need for these methods of prevention in this country. The findings agree

107
with the study in Ile-Ife, Nigeria where as many as 192 (44%) of the respondents were
aware that SCA could be diagnosed in pregnancy 63.
The knowledge of respondents was scored and graded as specified in the
methodology. Only 25.3% of respondents in intervention and 23.5% in control had
good level of knowledge about SCD and screening . The finding was similar to that of
Adewuyi in year 2000 which showed that there was severely deficient knowledge on
the transmission of sickle cell disease among the 20-32 year old graduates 12.
However, reports from Oakland in USA where the prevalence of SCD is much lower
revealed that majority of community survey respondents (86.2%) had correct general
knowledge about the genetic basis and severity of sickle cell disease 58. Good level of
knowledge usually aids taking preventive action and this was demonstrated in this
study as there was a significant positive relationship between level of knowledge and
awareness of individual’s genotype
This study did not demonstrate any apparent relationship between sex of respondents
and level of knowledge about SCD. A higher proportion of those who attended
University had good level of knowledge about SCD than those who attended
Polytechnic in both groups but the relationship between higher institution attended and
level of SCD knowledge was not statistically significant. This was not strange since it
has been shown in a study that for most respondents, the educational institutions
attended, were poor sources of information on sickle cell anaemia 65.
Majority of the respondents (67.9% in intervention and 63.8% in control) recognized
sickle cell disease as a major health problem but only 38.5% in intervention and

108
35.2% in control believed that they can ever achieve as much as their mates in life.
This finding confirms the misinformation, myths and stigmatization of people who have
the disease in our society 11. However, only about 7% in each group believed that
they are reincarnates known as abiku or ogbanje. The majority of the respondents
having positive attitude may be attributed to their level of education compared to many
other people in the traditional societies 67. A study conducted in Ibadan also revealed
that only 8.6% of the respondents believed in re-incarnation theory for SCD 68 while
another study among students in the University of Ibadan showed that majority had a
positive attitude toward sickle cell disease 62.
Almost half of the respondents (44.4% in intervention and 48% in the control group)
would change marriage plans if they discover that they and their partners had SCT.
Only about 8% from each group would do prenatal screening with selective abortion,
while about 12% and 8% would freely accept if their children had sickle cell disease in
intervention and control groups respectively. The acceptability of prenatal screening
and selective abortion as a likely decision was quite low probably due to low level of
awareness of this mode of control in Nigeria 63 and the termination of pregnancy
involved. Those who would freely accept to have children with sickle cell disease
might not have understood the complications and other consequences of the disease.
About 26% of respondents in each group did not know what they would do if faced
with the situation. This shows that many youths are not prepared to make informed
decision that could help in the control of the disease. Findings are similar to that of a
study in University of Benin where 37.7% of the respondents said they would not
continue with marriage plan if intending partner is a carrier just like them and many of
them (41.8%) were not sure what decision they would take 64.

109
The theoretical option (selective marriage) should not be based on coercion and
legislation. It has been noted that selective marriage could actually lead to an increase
in population traits and the prevalence of the trait will in turn determine the prevalence
of the disease at birth.
This study revealed that less than half (45% intervention and 40% in control) of all
respondents believed that SCD could exist in their families; only 11.1% and 3.2% of
those whose partners had not done genotype believed that their partners could be
carriers of SCD while only 22% in intervention group and 6% in control group of those
who had not done their genotype test believed that it is possible for their children to be
at risk of SCD. These attitudes could hinder the respondents from taking necessary
health actions even when they know some facts about the disease. The findings are in
agreement with a study among African American women who had a low perception of
susceptibility to sickle cell disease and majority of the participants did not feel that they
were personally at risk to have a child with sickle cell disease 57. Other studies among
American women has also demonstrated that the personal risk to have children or
family members with the condition is not well understood and they frequently do not
appear to believe that they are at risk of having a child with the disease 59,58.
It has been discovered that the attitudes regarding genetic diagnosis are markedly
different among various societal groups. In this study, majority of the respondents
believed that genotype screening is useful to the society (85% in intervention, 89% in
control), believed in the usefulness of knowing one's genotype (92% in each group),
supported mandatory newborn screening (79% in intervention, 81% in control),

110
supported premarital screening (93% in each group) and would be willing to ask their
partners to do premarital genotype test (92.7% in intervention and 90.8% in control).
This study did not demonstrate any apparent relationship between sex of respondents
and attitude to premarital genotype testing amongst both groups (p >0.05). This is in
consonance with a study in Pakistan where a large proportion (88.5%) agreed to the
idea of genetic diagnostic screening, premarital carrier screening was favoured by
77% of the respondents, 63% of the parents favoured making genetic screening
mandatory 56. Another study in Benin is in consonance with the high proportion
supporting premarital screening and newborn screening 64. Moreover, 85.45 % of
those who agreed with premarital screening in that study would ask their partners to
do genotype test before marriage 64. Reports among African American women also
revealed that they had a high perception of benefit to sickle cell trait testing 57.
Although prenatal screening has been available for many years, it is not acceptable to
many owing to issues relating to termination of pregnancy. In this study, about 39.9 %
in intervention and 35.7 % in the control groups strongly agreed/agreed that prenatal
screening and selective abortion is a good practice. This finding is similar to that of a
study in Ile–Ife where only 45% would opt for termination of affected pregnancy 69. In
that study, 73% of those rejecting pregnancy terminations did so for religious and
moral reasons69. It was also concluded in a study in North Eastern part of Nigeria that
religion may be a major factor militating against acceptability of prenatal screening of
SCA 74. This study however did not demonstrate any relationship between religion and
attitude to prenatal screening (P>0.05). This may be due to the diversity within

111
different faith groups and emphasizing the need to move away from stereotypical
views based on people's religion, and to consider the beliefs and preferences of
individuals.
Only 4.6% of respondents in intervention and 9.2% in the control groups believed that
genotype test is painful but 60.5% in intervention and 62.5% in control groups strongly
agreed/agreed that individuals should not pay for genotype test; the government
should. This could pose as a barrier to even those who have a right attitude to the
screening since they may be waiting for the government to make screening available
free of charge before taking any action. Reports among African American women did
not agree with this finding as they had a low perception of barriers to testing for sickle
cell trait 57.
A high proportion of the respondents (83% in intervention and 81% in control groups)
were aware of their genotypes. The finding is in consonance with the study conducted
in Benin where more than half (65%) of them had done their genotype test 64 and
another one among the African American women, where only eleven percent of the
women were unaware of their sickle cell trait status. The study is however in contrast
with another study in Oakland in USA which revealed that in a community survey only
16% (n=45) of respondents knew their own trait status 58. It was observed that higher
proportion of females knew their genotypes than males but the relationship was not
statistically significant (p=0.331). This study however revealed a significant
relationship between level of SCD knowledge and awareness of one’s genotype (p
<0.05).

112
About one quarter (23.5% in intervention and 29% in control) of those who had not
done their genotype didn't do it because they didn't believe they were at risk of SCT.
Another one quarter (26.5% in intervention and 25% in control) of them didn't do so
because they didn't know about it while more than 40% in each group didn't have any
reason at all for not doing it. Only 30.4% and 27.7% of respondents who had had
genotype test in intervention and control groups respectively did it out of personal
choice while 20.4% and 32.1% did it as a request from a school on gaining admission;
and13.8% and 16.4% did it based on request from hosp/clinic in intervention and
control groups respectively. Only 4.4% and 3.8% did it based on request from
intending spouse in intervention and control groups respectively. The proportion of
respondents with various reasons are similar to the findings in Benin where 51.8% of
those who had done their genotype test did it out of personal choice and
inquisitiveness, 25.8% did it as part of pre- school entry, 18.6 indicated that test was
requested by a Doctor/ Nurse due to illness, while 4.1 as requested from intending
spouse 64. The low proportion that did the test as a request from a spouse shows that
at the stage when people have fallen in love and have decided to marry, they do not
give much thought to genotype status.
Screening without counseling would result in individuals making decisions concerning
reproduction without full knowledge of their risk and the implications of the decisions.
In this study, out of those who had known their genotype to be any form of SCD or
SCT, less than half (45.2% in intervention and 45.7% in control) had had genetic
counseling while only 35% and 47% of those who had not received counseling would
be willing to receive it in intervention and control group respectively. This means that

113
more than half of those who had done their genotype test could still go ahead to have
children with sickle cell disease and not know what to do about it. It is not just enough
to know one’s SCT status, it is important to understand the implications, the different
preventive options available and be able to make informed decisions. This finding is
not compatible with a study in Ibadan where the students in the University of Ibadan
had a positive attitude towards genetic counseling 62. Majority of those who had SCT
(73.3% and 90.3%) however were willing to discuss it with their partners.
Post-intervention, the proportion who identified the cause of SCD correctly, knew the
correct pattern of inheritance, knew the racial distribution of the disease, knew that
carriers do not manifest the disease and that SCD cannot be cured easily increased
significantly (p<0.05) only in the intervention group but not in the control group.
Moreover, the proportions of respondents who identified severe debilitating pain,
stroke and infections as complications increased significantly by 29.3, 58 and 48%
respectively in the intervention group. The proportion of respondents who knew that
blood test is used for identifying those with SCT, that prenatal screening and newborn
screening are possible increased significantly in the intervention group but not in the
control group. The difference between the two groups was also significant.
Generally, there was a highly significant change (p= 0.000) in the level of knowledge
about sickle cell disease and screening in the intervention group. The proportion of
respondents who had a good level of knowledge increased by 64.1%. This shows that
the health education intervention was effective in increasing the knowledge of the
respondents. This is in agreement with a 2006 study among African Americans which
showed that a brief educational intervention regarding sickle cell disease in a prenatal
114
setting was effective in significantly increasing knowledge and acceptance of
screening for sickle cell trait (p-value < 0.001) 57
Post-intervention there was a significant increase (24.8%) in the proportion of
respondents who believed that people with SCD are normal except for the blood
defect and a significant decrease (4.6%) in the proportion who believed that they are
reincarnates known as abiku/ogbanje in the intervention group. However, the
proportion who believes that people with SCD all die young before 15 years did not
change significantly in any of the two groups. It is possible that this belief is so strong
that a single intervention was not sufficient to modify it.
Concerning the respondents’ likely decisions to be taken if they discover that they and
their proposed marriage partners are carriers, there was a significant decrease
(2.46%) in the proportion who would accept to be childless and those who would freely
accept if child has SCD (8.5%) only in the intervention group. The other possible
decisions did not change significantly. The findings may be due to the fact that having
gained more knowledge about the disease, some of those who would have accepted
to be childless or accepted to have children with SCD now saw hope in the different
options available. The change in the proportion who would do prenatal diagnosis or
limit childbearing was not statistically significant. This is likely to be because of the
termination of pregnancy involved in this mode of control.
There was a significant increase in the proportion of respondents who now identified
SCD as a major problem (increase: 18.2%) and believed that SCD can exist in their
nuclear or extended family (increase: 11.0%). Among those whose partners had
never done genotype, those who believed that their partners can be carriers increased

115
statistically significantly (p=0.000) in intervention group only. However, among
respondents who didn’t know their genotype, the increase in the proportion who
believed that it is possible to have children with SCD was not significant in both
groups. This finding agrees with the study among African American women where the
health belief model revealed that majority of the participants did not feel that they were
personally at risk to have a child with sickle cell disease, regardless of sickle cell
disease knowledge 57.
Post-intervention, the proportion who thought genotype test to be useful to the society,
and supported mandatory newborn screening increased significantly only in the
intervention group (p=0.001). However, the proportion of respondents who supported
prenatal screening and selective abortion did not increase significantly. This lack of
significant increase could be because the proportion of respondents who didn’t
support it had not changed their minds.
The percentage who believed in couples having genotype test before marriage
increased significantly only in the intervention group. However, the increase (3.6%) in
the proportion of respondents willing to ask their partners to do genotype was not
statistically significant amongst both the intervention and the control groups. This lack
of significant increase in the intervention group could have been due to the fact that
the proportion that supported the idea was very high before the intervention.
The proportion of the respondents who believed that individuals should not pay for
tests; government should also decreased significantly (p=0.008) in the intervention
group but not in the control group. This means that if people are enlightened, they
would not expect the government to do everything concerning their health but take
116
responsibility for areas they have control over and this will lead to better health status
for the nation as a whole.
Post intervention, the proportion who knew their genotypes increased significantly (by
11.9%) in the intervention group (p=0.000). This means that twenty four people had
genotype test done after the health education programme though only twenty two
people participated in the free genotype testing conducted at the venue. The
remaining two people could have done it elsewhere.

117
CONCLUSION
The awareness of sickle cell disease was high among the youth corps members but
the level of knowledge was poor; only 25.3% and 23.5% of them had good level of
knowledge about SCD in the intervention and control groups respectively.
At baseline, most of the respondents (at least 63%) had positive attitude towards
many aspects of sickle cell disease. Most of them (at least 79%) also had good
attitude to SCD screening generally except payment for tests. A high proportion of the
respondents (83% in intervention and 81% in control groups) were aware of their
genotypes.
The health education intervention caused a significant (p < 0.05) increase (64.1%) in
the level of knowledge in intervention group. The respondents’ attitudes to sickle cell
disease also improved significantly in most areas but the perception of risk of the
disease in children among those who didn’t know their genotypes did not improve
significantly. Generally the attitude of respondents to screening improved significantly
except concerning pre-natal screening. The proportion who knew their genotypes also
increased (by 11.9%) significantly in the intervention group (p <0.05).
Health education of youth corps members improved their level of knowledge about
sickle cell disease and screening significantly while it modified their attitudes to sickle
cell disease and screening in many aspects but their perception about risk of SCD in
children and attitude to prenatal screening were not significantly improved.

118
RECOMMENDATIONS
The following are recommended based on the findings in this study.
There is a need for sustained health education of undergraduates and new
graduates about sickle cell disease and screening with emphasis on the risk of
the disease in Nigeria. Continuous heath education through seminars on
campuses, the mass media, health institutions and NYSC orientation camps
would be effective in achieving this.
The ministries of education should include sickle cell disease education which
is made appropriate for the different age groups, in the school curricula at all
levels. This will enable children and youths to have better knowledge about
sickle cell disease early enough to modify their attitudes positively and increase
their uptake of genotype screening.
There should be a national policy about mandatory newborn screening which
should be implemented in both private and public hospitals to ensure early
appropriate care for the several children whose parents are not aware of this
method of screening.
Subsidization of costs of screening; both direct and indirect by governmental
and non-governmental organizations is necessary. Public hospitals and
laboratories should offer genotype screening at cheaper rates than private
laboratories to ensure that everyone who is willing gets the test done; since
majority of participants believed that government should pay for the test.

119
REFERENCES
1. World Health Organization, Sickle-Cell Anaemia, Report by the Secretariat,
Fifty-ninth world health assembly, A59/9 24 April 2006 Provisional agenda item
11.4.
2. Diallo D, Tchernia G. Sickle cell disease in Africa. Current Opinion in
Hematology, 2002; 9:111-116
3. Zemel BS, Kawchak DA, Ohene-Frempong K, Schall JI, Stallings VA. Effects of
delayed pubertal development, nutritional status, and disease severity on
longitudinal patterns of growth failure in children with sickle cell disease. Pediatr
Res., 2007; 61: 607-13.
4. Ocheni S, Onah HE, Ibegbulam OG, Eze MI. Pregnancy outcomes in patients
with sickle cell disease in Enugu, Nigeria Niger J Med., 2007; 16:252-5.
5. Wierenga KJJ, Hambleton IR, Lewis NA, Survival estimates for patients with
homozygous sickle-cell disease in Jamaica: a clinic-based population study.
Lancet 2001; 357: 680.
6. Serjeant G. Mortality from sickle cell disease in Africa. BMJ 2005; 330:432-433
7. Akinyanju O.O. Situation of Sickle Cell and Genetics services in Nigeria-
abstract for presentation at the 11th International Congress of Human Genetics.
120
8. Ohaeri JU, Shokunbi WA. Psychosocial burden of sickle cell disease on
caregivers in a Nigerian setting . J Natl Med Assoc. 2002; 94:1058-70
9. Patel A.B, Pathan H.G, Quality of life in children with sickle cell
hemoglobinopathy, Indian J Pediatr. 2005;72: 567-71.
10. Akinyanju O.O, Control of sickle cell disorder in Africa, Nigerian Journal of
Clinical & Biomedical Research 2006, vol 1: 24.
11. Diallo, Dapa; Tchernia, Gil, Sickle cell disease in Africa. Current Opinion in
Hematology, March 2002; 9:111.
12. Adewuyi J.O. Knowledge of and attitudes to sickle cell disease and sickle
carrier screening among new graduates of Nigerian tertiary educational
institutions Niger Post grad Med J, Sep 2000; 7:120
13. Sickle cell history; Sickle cell disease association of America 2002
http://sickle.bwh.harvard.edu/sickle cell disease_history.html
14. Fleming A.F. Sickle cell diseases: A handbook for the general clinician; 1982
ed; Churchill Livingstone.
15. Doris L Wethers, M. D.. Sickle cell disease in childhood: Part I. Laboratory
Diagnosis, Pathophysiology and Health Maintenance. American Family
Physician, 2000; 62:1013-1020.

121
16. Karnon, J., Zeuner, D., Ades, A. E., Efimba, W., Brown, J., & Yardumian, A.
The effects of neonatal screening for sickle cell disorders on lifetime treatment
costs and early deaths avoided: a modelling approach. J Public Health Med,
2000; 22: 500-511.
17. Christopher Haslett, Edwin R.Chivers, Nicholas A. Boon, Nicki R. Colledge;
Davidson’s Principle and Practice of Medicine. 50th anniversary edition; 825-
826.
18. Donalson A, Old J., Fisher C. Serjeant B.E, Sergeant G.R. Jamaican S B+
thalassaemia, mutations and haematology. Br. J. Haematol 2000;108:290-4
19. Ballas, S. K. Sickle Cell Anemia; progress in pathogenesis and treatment.
Drugs 2002: 62: 1143-1172.
20. Lonergan Lonergan, G. J., Cline, D. B., & Abbondanzo, S. L.. Sickle cell
anemia. Radiographics 2001; 21: 971-994.
21. Management of Sickle cell disease, an overview. Sickle cell disease
association of America.
http://sickle.bwh.harvard.edu/sickle cell disease_management.html
22. Errol L. Fields: Phenotypic variation in sickle cell disease-an analysis Harvard
University, 2000. www.sickle.bhw.harvard.edu/sickle cell diseasemanage.html
122
23. Konotey-Ahulu F.I.D. The sickle cell disease. Archives of material medicine;
1974; 133: 611-619.
24. Angastiniotis M, Modell B, Englezos P, Boulyjenkov V. Prevention and control
of haemoglobinopathies. WHO Bulletin, OMS. 1995; 73(3):375-386.
25. Fleming A.F. March. The presentation, management and prevention of crises
in sickle cell disease in Africa. Blood review 1979;3: 18-20.
26. Eichner E.R , Sickle cell trait. J Sport Rehabil. 2007; 16:197-203.
27. Statistics by country for Sickle cell anaemia- www.wrongdiagnosis.com
28. A.O Falase and O.O Akinkugbe, A Compendium of Clinical Medicine 2nd
edition 2002; Spectrum books;p.490-491
29. Anie K.A, Psychological complications in sickle cell disease. Br J Haematol.
2005 ; 129 :723-9.
30. Adelekan, M. L., Tunde-Ayinmode, M. F. Psychosocial impact of sickle cell
disease in children seen at University of Ilorin Teaching Hospital, Ilorin, Nigeria.
East African Medical Journal, 2005; Vol. 82: 73-78.
31. Anorlu RI, Dim SI, Oyekan TO. Pregnancy outcome in HbSS-sickle cell
disease in Lagos, Nigeria. West Afr J Med. 2002; 21:19-23.

123
32. Parveen Kumar and Micheal Clark. Clinical Medicine 5th edition p.430-431
33. Adams RJ, Brambilla DJ, Granger S. Stroke and conversion to high risk in
children screened with transcranial Doppler ultrasound during the STOP
study. Blood, 2004; 103:3689-3694
34. Serjeant GR, Serjeant BE. The epidemiology of sickle cell disorder: a
challenge for Africa. Archives of Ibadan Medicine, 2001; 2: 4-52.
35. Eke FU, Anochie I. Effects of pyrimethamine versus proguanil in malarial
chemoprophylaxis in children with sickle cell disease: a randomised, placebo-
controlled, open-label study. Current Therapeutic Research. 2003; 64: 616-625.
36. Modiano D, Luoni G, Sirima BS, Simporé J, Verra F, Konaté A, Rastrelli E,
Olivieri A, Calissano C, Paganotti GM, D'Urbano L, Sanou I, Sawadogo A,
Modiano G, Coluzzi M. 2001. Haemoglobin C protects against clinical
Plasmodium falciparum malaria. Nature 414:305-308.
37. Hirst C, Owusu-Ofori S. Prophylactic antibiotics for preventing pneumococcal
infection in children with sickle cell disease (Cochrane review). In: The
Cochrane Library, Issue 1, 2006. Wiley, Chichester, UK.
38. Falletta JM, Woods GM, Verter JI, Buchanan GR, Pegelow CH, Iyer RV, Miller
ST, Holbrook CT, Kinney TR, Vichinsky E. Discontinuing penicillin prophylaxis
in children with sickle cell anemia. Journal of Pediatrics. 1995;127: 685-690.

124
39. Overtuff GD. Pneumococcal vaccination in children. Seminars in Pediatric
Infectious Diseases. 2002; 13: 155-164.
40. Akinyanju OO, Otaigbe AI, Ibidapo MOO. “Outcome of holistic care in Nigerian
patients with sickle cell anaemia”, Clin. Lab. Haem. 2005; 25:195-199.
41. Davies S, Olujohungbe A. Hydroxyurea for sickle cell disease (Cochrane
review)
42. Davies S, Olujohungbe A. Hydroxyurea for sickle cell disease. Cochrane
review, The Cochrane Library, Issue 4, 2005.
43. U.S. National Library of Medicine. Medline Plus medical encyclopedia: sickle
cell anemia. Available at
http://www.nlm.nih.gov/medlineplus/ency/article/000527.htm.
44. Walters MC, Patience M, Leisenring W, Rogers ZR, Dinndorf P, Davies SC,
Roberts IA, Yeager A, Kurtzberg J, Bunin N, Scott JP, Wall DA, Wayne AS,
Wiley J, Darbyshire PJ, Mentzer WC, Smith FO, Sullivan KM. Collaborative
multicenter investigation of marrow transplantation for sickle cell disease:
current results and future directions. Biol Blood Marrow Transplant 1997;
3:310-315.
45. Walters MC, Quirolo L, Trachtenberg ET, Edwards S, Hale L, Lee J, Morton-
Wiley J, Sibling donor cord blood transplantation for thalassemia major:

125
Experience of the Sibling Donor Cord Blood Program. Ann N Y Acad Sci.
2005;1054:206-13
46. Head C.A, Brugnara C, Martinez-Ruiz R, Kacmarek RM, Bridges KR, Kuter D,
Bloch KD, Zapol WM. Low concentrations of nitric oxide increase oxygen
affinity of sickle erythrocytes in vitro and in vivo. J Clin Invest.1997; 00:1193-
1198.
47. Gilani AI, Jadoon AS, Qaiser R, Nasim S, Meraj R, Nasir N, Naqvi FF, Latif Z,
Memon MA, Menezes EV, Malik I, Memon MZ, Kazim SF, Ahmad U. Attitudes
towards Genetic Diagnosis in Pakistan: A Survey of Medical and Legal
Communities and Parents of Thalassemic Children, Community Genetics
2007;10:140-146.
48. Clayton EW, Steinberg KK, Khoury MJ, Thomson E, Andrews L, Kahn MJ,
Kopelman LM, Weiss JO. Informed consent for genetic research on stored
tissue samples. JAMA 1995; 274:1786-1792.
49. Mitchell JJ, Capua A, Clow C, Scriver CR. Twenty-year outcome analysis of
genetic screening programs for Tay-Sachs and -thalassemia disease carriers in
high schools. Am J Hum Genet 1996; 59:793-798.
50. McCabe L. Efficacy of a targeted genetic screening program for adolescents.
Am J Hum Genet 1996;59 :762-763.

126
51. Scott, R. B., & Castro, O. Screening for Sickle Cell Hemoglobinopathies.
Jounal of the American Medical Association 1979; 241: 1145-1147.
52. Almelda A.M, Helthorn J.S, Davies SC. Neonatal screening for
haemoglobinopathies: the results of a 10-year programme in an English Health
Region. Br J Haematol. 2001; 112:32-5.
53. Olney RS. Preventing morbidity and mortality from sickle cell disease. A public
health perspective. Am J Prev Med. 1999; 16:116-21.
54. Alison Lashwood, Preimplantation genetic diagnosis to prevent genetic
disorders in children . British Journal of Nursing. 2005; 14:64 – 70.
55. Olu Akinyanju, Control of sickle cell disorder in Africa, Nigerian Journal of
Clinical & Biomedical Research., 2006; 1:28.
56. Gustafson, Shanna L. MS 1,3; Gettig, Elizabeth A. MS, CGC 1; Watt-Morse,
Margaret MD 2; Krishnamurti, Lakshmanan MD 3, Health beliefs among African
American women regarding genetic testing and counseling for sickle cell
disease. Genetics in Medicine. 2007. 9:303-310.
57. Shanna Lea Gustafson , knowledge and health beliefs of sickle cell disease
and sickle cell trait: the influence on acceptance of genetic screening for sickle
cell trait. A thesis presented at University of Pittsburgh, 2006 pg 3-4.

127
58. Treadwell MJ, McClough L, Vichinsky E, Using qualitative and quantitative
strategies to evaluate knowledge and perceptions about sickle cell disease and
sickle cell trait. J Natl Med Assoc. 2006; 98:704-10.
59. Hoffman, Katie Anne, Assessing the attitudes and beliefs of African-Americans
toward newborn screening and sickle cell disease. Masters thesis, University of
Pittsburgh 2007. http://etd.library.pitt.edu/ETD/available/etd-04122007-193029.
60. Ogamdi SO, Onwe F., A pilot study comparing the level of sickle cell disease
knowledge in a university in southeastern Texas and a university in Enugu,
Nigeria, West Africa. Ethn Dis. 2000; 10:232-6.
61. Ebomoyi E.W. Awareness of sickle cell disease and compliance factors
among high school students in Ilorin, Nigeria. Journal of Tropical Paediatics;
1987; 33:59-60.
62. O. A. Moronkola A1 and R. A. Fadairo A1 University students in Nigeria:
Knowledge, attitude toward sickle cell disease, and genetic counseling before
marriage. International Quarterly of Community Health Education, 2006-
2007;26: 85 - 93.
63. Durosinmi MA, Odebiyi AI, Akinola NO, Adediran LA, Aken'Ova Y, Okunade
MA, Halim NK, Onwukeme KE, Olatunji PO, Adegoroye DE. Acceptability of
prenatal screening of sickle cell anaemia by a sample of the Nigerian
population. Afr J Med Med Sci., 1997; 26:55-8.

128
64. Egbochukwu E.O., Imogie E.A, A paper presented at the 9th Biennial meeting
of the society for research on Adolescents at New Orleans Louisianna 2002.
65. Adeodu O.O, Alimi T., Adekile A.D. A comparative study of perception of sickle
cell anaemia by married Nigeria rural and urban women. West Afr J. Med 2000;
19:1-5.
66. Wonkam, Ambroise MD; Njamnshi, Alfred K. MD; Angwafo, Fru F. III MD,.
Knowledge and attitudes concerning medical genetics amongst physicians and
medical students in Cameroon, Genetics in medicine, the American College of
Medical Genetics 2006; 8:331-338.
67. Nzewi E, Malevolent ogbanje: recurrent reincarnation or sickle cell disease?
Soc Sci Med. 2001;52 :1403-16.
68. Ohaeri J. U., Shokunbi W. A.; Attitudes and beliefs of relatives of patients with
sickle cell disease, East African medical journal, 2001; 78: 174-179
69. Durosinmi MA, Odebiyi AI, Akinola NO, Adediran LA, Aken'Ova Y, Okunade
MA, Halim NK, Onwukeme KE, Olatunji PO, Adegoroye DE. Acceptability of
prenatal screening of sickle cell anaemia by a sample of the Nigerian
population. Afr J Med Med Sci. 1997; 26 :55-8.

129
70. Adeyemi AS, Adekanle DA., Knowledge and attitude of female health workers
towards prenatal screening of sickle cell disease. Niger J Med., 2007; 6: 268-
70.
71. Aida Dorticós-Balea , Marcos Martin-Ruiz , Piedad Hechevarria-Fernández ,
Martha S. Robaina-Castellanos , Manuel Rodriguez-Blanco , Fidel Moras-
Bracero , Hilda Granda Ibarra. Reproductive behaviour of couples at risk for
sickle cell disease in Cuba: a follow-up study, Prenatal screening, 1999; 17:
737-742.
72. Akinyanju O.O, Disu R.F, Akinde J.A, Adewole T.A, Otaigbe A.I, Emuveyan
E.E Initiation of prenatal screening of sickle-cell disorders in Africa, Prenatal
Diagn 1999;19 :299-304.
73. Giordano PC, Dihal AA, Harteveld CL. Estimating the attitude of immigrants
toward primary prevention of the hemoglobinopathies. Prenat Diagn. , 2005;
25:885-93.
74. Kagu M.B, Abja U.A, Ahmed S.G, Awareness and acceptability of prenatal
screening of sickle cell anaemia among health professionals and students in
North Eastern Nigeria. Niger J Med., 2004; 13:48-51.
75. Odunvbun ME, Okolo AA, Rahimy CM, Newborn screening for sickle cell
disease in a Nigerian hospital, Public Health. 2008 [Epub ahead of print]

130
76. Yang, Yih ming, Andrews Susan; Peterson, Rose; Shah Arvind; Cepeda
Manuel prenatal sickle cell education effect on the follow up rates of infants with
sickle cell trait. Patient Education and Counseling. , 2000; 39:185-9.
77. Federal Republic of Nigeria, Official Gazette (15th May, 2007). Legal notice on
publication of the details of the breakdown of the national and state provisional
totals 2006 Census. Federal Government of Nigeria.
78. Varkevisser C. M., Pathmanathan I., and Brownlee A. Designing and
conducting health systems research projects. Health Systems research training
Series. 2003; 2: 216.
79. Taylor. The calculation of sample size and power in the planning of
experiments. Dept. of Clinical Epidemiology and Biostatistics, McMaster
University, Hamilton Ontario, Canada, May 198313.