Embed Size (px)
Citation preview
2085Yaskolka Meir A, et al. Gut 2021;70:2085–2095. doi:10.1136/gutjnl-2020-323106
Nutrition
Original research
Effect of green- Mediterranean diet on intrahepatic fat: the DIRECT PLUS randomised controlled trialAnat Yaskolka Meir,1 Ehud Rinott,1 Gal Tsaban,1,2 Hila Zelicha,1 Alon Kaplan,1 Philip Rosen,3 Ilan Shelef,3 Ilan Youngster,4 Aryeh Shalev,2 Matthias Blüher,5 Uta Ceglarek,6 Michael Stumvoll,5 Kieran Tuohy,7 Camilla Diotallevi ,7,8 Urska Vrhovsek,8 Frank Hu,9,10,11 Meir Stampfer,9,10,11 Iris Shai 1,9
To cite: Yaskolka Meir A, Rinott E, Tsaban G, et al. Gut 2021;70:2085–2095.
► Additional material is published online only. To view, please visit the journal online (http:// dx. doi. org/ 10. 1136/ gutjnl- 2020- 323106).
For numbered affiliations see end of article.
Correspondence toDr Iris Shai, Department of Public Health, Ben- Gurion University of the Negev, Beer- Sheva 84105, Southern, Israel; irish@ bgu. ac. il
AYM and ER contributed equally.
Received 16 September 2020Revised 23 November 2020Accepted 28 November 2020Published Online First 18 January 2021
© Author(s) (or their employer(s)) 2021. Re- use permitted under CC BY- NC. No commercial re- use. See rights and permissions. Published by BMJ.
ABSTRACTObjective To examine the effectiveness of green- Mediterranean (MED) diet, further restricted in red/processed meat, and enriched with green plants and polyphenols on non- alcoholic fatty liver disease (NAFLD), reflected by intrahepatic fat (IHF) loss.Design For the DIRECT- PLUS 18- month randomized clinical trial, we assigned 294 participants with abdominal obesity/dyslipidaemia into healthy dietary guidelines (HDG), MED and green- MED weight- loss diet groups, all accompanied by physical activity. Both isocaloric MED groups consumed 28 g/day walnuts (+440 mg/day polyphenols provided). The green- MED group further consumed green tea (3–4 cups/day) and Mankai (a Wolffia globosa aquatic plant strain; 100 g/day frozen cubes) green shake (+1240 mg/day total polyphenols provided). IHF% 18- month changes were quantified continuously by proton magnetic resonance spectroscopy (MRS).Results Participants (age=51 years; 88% men; body mass index=31.3 kg/m2; median IHF%=6.6%; mean=10.2%; 62% with NAFLD) had 89.8% 18- month retention- rate, and 78% had eligible follow- up MRS. Overall, NAFLD prevalence declined to: 54.8% (HDG), 47.9% (MED) and 31.5% (green- MED), p=0.012 between groups. Despite similar moderate weight- loss in both MED groups, green- MED group achieved almost double IHF% loss (−38.9% proportionally), as compared with MED (−19.6% proportionally; p=0.035 weight loss adjusted) and HDG (−12.2% proportionally; p<0.001). After 18 months, both MED groups had significantly higher total plasma polyphenol levels versus HDG, with higher detection of Naringenin and 2-5- dihydroxybenzoic- acid in green- MED. Greater IHF% loss was independently associated with increased Mankai and walnuts intake, decreased red/processed meat consumption, improved serum folate and adipokines/lipids biomarkers, changes in microbiome composition (beta- diversity) and specific bacteria (p<0.05 for all).Conclusion The new suggested strategy of green- Mediterranean diet, amplified with green plant- based proteins/polyphenols as Mankai, green tea, and walnuts, and restricted in red/processed meat can double IHF loss than other healthy nutritional strategies and reduce NAFLD in half.Trial registration number NCT03020186.
INTRODUCTIONIntrahepatic fat (IHF) accumulation, a result of intracellular triglyceride (TG) deposition in the liver, is promoted by bodily adipose tissue dysfunc-tion and insulin resistance.1 IHF that exceeds 5%, in the absence of alcohol abuse, defines non- alcoholic fatty liver disease (NAFLD).2 IHF accumulation is associated with elevated liver enzymes, insulin resistance, type 2 diabetes, cardiovascular risk and extrahepatic malignancies.2 3 In recent years, the gut microbiome was suggested to have a pivotal role in NAFLD pathogenesis. This association is presum-ably due to the modulation of hepatic carbohydrate and lipid metabolism, with dysbiosis, that is, aber-rant composition of the microbiome community, being a hallmark of the disease.4 5 NAFLD affects about a quarter of the world population6 and can progress to the development of steatohepatitis, liver- cirrhosis and hepatocellular carcinoma.2 7 The
Significance of this study
What is already known on this subject? ► Non- alcoholic fatty liver disease (NAFLD), a condition affecting 25% of the world population, is reflected by increased intrahepatic fat (IHF)% (>5%) and is associated with elevated liver enzymes, insulin resistance, type 2 diabetes and cardiovascular risk, as well as with decreased gut microbiome diversity and dysbiosis.
► Currently, an evidence- based treatment strategy consists of general weight- loss through lifestyle interventions.
What are the new findings? ► In this trial, we introduce a new concept of a green Mediterranean diet, further enriched with specific green polyphenols as Mankai, green tea, and walnuts, and restricted in red and processed meat that might lead to significantly double intrahepatic fat loss, as compared with other healthy nutritional strategies.
How might it impact on clinical practice in the foreseeable future?
► Results from this study may suggest an improved dietary protocol to reduce NAFLD.
on January 24, 2022 by guest. Protected by copyright.
http://gut.bmj.com
/G
ut: first published as 10.1136/gutjnl-2020-323106 on 18 January 2021. Dow
nloaded from
on January 24, 2022 by guest. Protected by copyright.
http://gut.bmj.com
/G
ut: first published as 10.1136/gutjnl-2020-323106 on 18 January 2021. Dow
nloaded from
on January 24, 2022 by guest. Protected by copyright.
http://gut.bmj.com
/G
ut: first published as 10.1136/gutjnl-2020-323106 on 18 January 2021. Dow
nloaded from
on January 24, 2022 by guest. Protected by copyright.
http://gut.bmj.com
/G
ut: first published as 10.1136/gutjnl-2020-323106 on 18 January 2021. Dow
nloaded from
on January 24, 2022 by guest. Protected by copyright.
http://gut.bmj.com
/G
ut: first published as 10.1136/gutjnl-2020-323106 on 18 January 2021. Dow
nloaded from
on January 24, 2022 by guest. Protected by copyright.
http://gut.bmj.com
/G
ut: first published as 10.1136/gutjnl-2020-323106 on 18 January 2021. Dow
nloaded from
on January 24, 2022 by guest. Protected by copyright.
http://gut.bmj.com
/G
ut: first published as 10.1136/gutjnl-2020-323106 on 18 January 2021. Dow
nloaded from
on January 24, 2022 by guest. Protected by copyright.
http://gut.bmj.com
/G
ut: first published as 10.1136/gutjnl-2020-323106 on 18 January 2021. Dow
nloaded from
on January 24, 2022 by guest. Protected by copyright.
http://gut.bmj.com
/G
ut: first published as 10.1136/gutjnl-2020-323106 on 18 January 2021. Dow
nloaded from
on January 24, 2022 by guest. Protected by copyright.
http://gut.bmj.com
/G
ut: first published as 10.1136/gutjnl-2020-323106 on 18 January 2021. Dow
nloaded from
on January 24, 2022 by guest. Protected by copyright.
http://gut.bmj.com
/G
ut: first published as 10.1136/gutjnl-2020-323106 on 18 January 2021. Dow
nloaded from
on January 24, 2022 by guest. Protected by copyright.
http://gut.bmj.com
/G
ut: first published as 10.1136/gutjnl-2020-323106 on 18 January 2021. Dow
nloaded from
on January 24, 2022 by guest. Protected by copyright.
http://gut.bmj.com
/G
ut: first published as 10.1136/gutjnl-2020-323106 on 18 January 2021. Dow
nloaded from
on January 24, 2022 by guest. Protected by copyright.
http://gut.bmj.com
/G
ut: first published as 10.1136/gutjnl-2020-323106 on 18 January 2021. Dow
nloaded from
on January 24, 2022 by guest. Protected by copyright.
http://gut.bmj.com
/G
ut: first published as 10.1136/gutjnl-2020-323106 on 18 January 2021. Dow
nloaded from
on January 24, 2022 by guest. Protected by copyright.
http://gut.bmj.com
/G
ut: first published as 10.1136/gutjnl-2020-323106 on 18 January 2021. Dow
nloaded from
on January 24, 2022 by guest. Protected by copyright.
http://gut.bmj.com
/G
ut: first published as 10.1136/gutjnl-2020-323106 on 18 January 2021. Dow
nloaded from
on January 24, 2022 by guest. Protected by copyright.
http://gut.bmj.com
/G
ut: first published as 10.1136/gutjnl-2020-323106 on 18 January 2021. Dow
nloaded from
on January 24, 2022 by guest. Protected by copyright.
http://gut.bmj.com
/G
ut: first published as 10.1136/gutjnl-2020-323106 on 18 January 2021. Dow
nloaded from
on January 24, 2022 by guest. Protected by copyright.
http://gut.bmj.com
/G
ut: first published as 10.1136/gutjnl-2020-323106 on 18 January 2021. Dow
nloaded from
on January 24, 2022 by guest. Protected by copyright.
http://gut.bmj.com
/G
ut: first published as 10.1136/gutjnl-2020-323106 on 18 January 2021. Dow
nloaded from
on January 24, 2022 by guest. Protected by copyright.
http://gut.bmj.com
/G
ut: first published as 10.1136/gutjnl-2020-323106 on 18 January 2021. Dow
nloaded from
on January 24, 2022 by guest. Protected by copyright.
http://gut.bmj.com
/G
ut: first published as 10.1136/gutjnl-2020-323106 on 18 January 2021. Dow
nloaded from
2086 Yaskolka Meir A, et al. Gut 2021;70:2085–2095. doi:10.1136/gutjnl-2020-323106
Nutrition
current evidence- based treatment strategy consists of weight- loss through lifestyle interventions,8 without specific dietary recom-mendations, although strong evidence points toward recom-mending the Mediterranean (MED) diet.9 MED diet, relatively rich in plant food sources, has been associated with reduced prevalence of NAFLD,10 improves cardiometabolic and cardio-vascular biomarkers, and reduces all- cause mortality.11–13
Polyphenols, secondary metabolites of plants with antioxi-dant properties, are involved in the defence against ultraviolet radiation and pathogenic insults in the plants and have been suggested, in humans, to be protective against several malignan-cies, cardiovascular diseases, diabetes, osteoporosis and neuro-degenerative diseases,14 as well as reducing hepatic steatosis.15 The main groups of polyphenols are classified by the number of phenol rings they contain and structural elements and include phenolic acids, flavonoids, stilbenes and lignans.14 The MED diet has a relatively high content of polyphenols. In the tradi-tional Spanish MED diet, the mean polyphenol intake was esti-mated to be between ~2500 and 3000 mg/day16 as compared with ~1000 mg/day in a western- style diet.17 We, and others, reported a greater decrease in NAFLD with MED diet, as compared with a low- fat diet.3 18 19 Adherence to vegetarian and plant- based diets was also associated with a lower incidence of NAFLD.20 21
In the current 18- month Dietary Intervention Randomized Controlled Trial Polyphenols Unprocessed (DIRECT PLUS), we aimed to examine the effect of MED diet, further enriched with polyphenols and lower in red and processed meat (‘green- MED’), on IHF changes, as measured by proton magnetic resonance spectroscopy (H- MRS). Our a priori hypothesis was that a green- MED diet may promote further effectiveness in treating NAFLD, beyond the expected beneficial effects of the MED diet.
METHODSStudy designThe 18- month DIRECT- PLUS trial was initiated in May 2017 and was conducted in an isolated workplace (Nuclear Research Center Negev, Dimona, Israel), where a monitored lunch was provided. Most of the clinical and medical measurements and lifestyle- intervention sessions, were performed at the work-place’s medical department. Of the 378 volunteers, 294 met the inclusion criteria of age >30 years with abdominal obesity (waist circumference (WC): men >102 cm, women >88 cm) or dyslip-idaemia (TG >150 mg/dL and high- density lipoprotein (HDL) cholesterol ≤40 mg/dL for men, ≤50 mg/dL for women). Exclu-sion criteria are detailed in online supplemental methods 1.
Randomisation and interventionAll eligible participants who signed consent to participate in the trial and completed the baseline measurements were randomised in a 1:1:1 ratio, stratified by gender and work site (to ensure equal workplace- related lifestyle features between groups), into one of the three intervention groups: healthy dietary guidelines (HDG), MED, green- MED, all combined with physical activity (PA) accommodation. The outline of lifestyle interventions is presented in online supplemental table 1.
The interventions were initiated simultaneously, and partic-ipants were aware of their assigned intervention (open- label protocol). All the participants received free gym member-ships and educational sessions to engage in moderate- intensity PA,18~80% of which included an aerobic component (online supplemental methods 2).
HDG groupIn addition to PA, participants received standard nutritional counselling to promote a healthy diet and to achieve a similar intervention intensity.
MED groupIn addition to PA, participants were instructed to adopt a calorie- restricted MED diet as described in our previous trials: DIRECT13 and CENTRAL.18 The MED diet assigned was rich in vegetables, with poultry and fish replacing beef and lamb. The diet also included 28 g/day of walnuts (containing 440 mg poly-phenols/day; gallic acid equivalents (GAE), according to United States Department of Agriculture (USDA) Phenol- Explorer: http:// phenol- explorer. eu/ food- processing/ foods, including, mostly, ellagitannins, ellagic acid and its derivatives.22
Green-MED groupIn addition to PA and the provision of 28 g/day walnuts, the green- MED diet was restricted in processed and red meat and was richer in plants and polyphenols. The participants were guided to further consume the following provided items: 3–4 cups/day of green tea and 100 g/day of frozen Wolffia globosa (Mankai strain23 24) plant frozen cubes, as a green shake replacing dinner. Both green tea and Mankai together provided additional daily intake of 800 mg polyphenols ((GAE), according to Phenol- Explorer and Eurofins lab analysis, including catechins (flava-nols)) beyond the polyphenol content in the prescribed MED diet. Both the MED and green- MED diets were equally calorie- restricted (1500–1800 kcal/day for men and 1200–1400 kcal/day for women). A detailed description of the provided polyphe-nols is available in online supplemental methods 3.
Details regarding the lifestyle interventions and motivation techniques are provided in online supplemental methods 4. All the above polyphenols food sources (Mankai, green tea and walnuts) were provided free of charge and monitored at the on- site clinic.
Outcome measuresIHF% was assessed at baseline and after 18 months using H- MRS.25 Localised, single- voxel proton spectra were acquired using a 3.0T magnetic resonance scanner (Philips Ingenia, Best, The Netherlands). The measurements were taken from the frontal part of the right lobe, with a location determined individ-ually for each subject using a surface, receive- only phased- array coil (full protocol is available in online supplemental methods 5). Data were analysed using Mnova software (Mestrelab Research, Santiago de Compostela, Spain) by an experienced physicist blinded to the intervention groups, who also performed visual quality control of fitted spectra. The total hepatic fat fraction in the image was determined as the ratio between the sum of the area under all fat divided by the sum of the area under all fat and water peaks.26 IHF colour images were produced using PRIDE software (by Philips).
Anthropometric parameters (ie, weight and WC) and blood biomarkers were taken at baseline, after 6 and 18 months of intervention. Assessment of nutritional intake and lifestyle habits was performed using self- reported food frequency ques-tionnaires administered through a computer at baseline, after 6 months, and at the end of the trial.27 28 Serum folate was measured by the ECLIA competitive approach and was used as a marker for green leaf consumption.29 We used plasma samples to assess polyphenol levels. All outcomes, including laboratory
on January 24, 2022 by guest. Protected by copyright.
http://gut.bmj.com
/G
ut: first published as 10.1136/gutjnl-2020-323106 on 18 January 2021. Dow
nloaded from

2087Yaskolka Meir A, et al. Gut 2021;70:2085–2095. doi:10.1136/gutjnl-2020-323106
Nutrition
methodology and microbiome analysis, are further detailed in online supplemental methods 6.
Statistical analysisThe primary outcomes of the DIRECT PLUS study were 18- month changes in IHF%, visceral adipose tissue (VAT), and adiposity (Flow chart of the study is presented in figure 1). Preliminary results indicate that 54% of the participants shared at baseline the top tertile of both—VAT and IHF levels and that after the 18- month intervention, 64% shared the top tertile of greater decline in both. A different report will be dedicated to complete VAT analysis. In the current study, we primarily aimed to assess the effect of the intervention on NAFLD, as evaluated by an 18- month change in IHF% (expressed as a percentage of total liver fat). Second, we evaluated the association of change in liver fat with the change in anthropometric parameters (weight, WC, blood pressure (BP)), blood biomarkers, cardio-vascular risk scores, and specific food intake components related to the green- MED diet. Continuous variables are presented as means±SD or as medians and 25th, 75th percentile. Nominal variables are expressed as numbers and/or percentages. The Kolmogorov- Smirnov test was used to determine whether variables were normally distributed. NAFLD cut- off was set to 5% IHF, an acceptable cut- off for NAFLD initial diagnosis with radiological imaging techniques.2 As a 5.56 cut- off is also appropriate for NAFLD diagnosis,30 we performed a sensitivity analysis with this cut- off, which yielded similar results. Differ-ences between time points were tested using the Paired sample t- test or Wilcoxon test. Differences between groups were tested using analysis of variance (ANOVA), Kruskal- Wallis test or χ2 test. Ln transformations were applied when necessary to achieve normal distribution. Correlations were tested using Spearman or Pearson correlation. Kendall Tau correlation was used to examine p- of- trend. Multiple comparisons were addressed using the Tukey post hoc test (for ANOVA) and Bonferroni correction (for Kruskal- Wallis). For adjustments and interaction models, we used general and generalised linear regression models (with the specific adjustments detailed in the results). Of 294 MRI scans
of the participants, 269 were eligible for IHF% analysis at base-line due to technical reasons. Intention to treat (ITT) analysis was carried according to our previous trials: 18- month analysis for the primary outcome of IHF% included all 269 participants was conducted by imputing the missing observations for 38 indi-viduals with missing data at 18 months by the multiple imputa-tion technique,31 wherein the following predictors were used in the imputation model: age, sex, baseline weight and WC at 18 months.18 For missing data of body weight and WC, we used the last observation carried forward for 294 participants.18 Sample size calculation and microbiome statistical analysis are available in online supplemental methods 7 and 8. Statistical analysis was performed using SPSS (V.25.0) and R (V.3.6.0). Statistical signif-icance was set at a two- sided alpha of 0.05.
RESULTSBaseline characteristicsThe mean age of the participants was 51 years. 88% were men, with a mean body mass index (BMI) of 31.3 kg/m2. Baseline char-acteristics are presented in table 1. IHF% (ranged from 0.1% to 44.6%, median=6.6%, mean=10.2%) and NAFLD (IHF>5%) prevalence (62%), did not significantly differ between the three intervention groups (p>0.05 for all). The participants who did not have valid MRI scans at baseline (n=25), did not differ significantly from participants with valid scans (n=269) in terms of gender distribution (p=0.99) age (p=0.75), baseline weight (p=0.65) and WC (p=0.44). The participants’ median alcohol intake was 0.26 servings/day for men and 0.15 servings/day for women (correspond to 3.64 g/day and 2.1 g/day, respectively32). Lifestyle patterns, including daily alcohol and medication usage, were similarly distributed across the groups (online supple-mental table 2).
Adherence to the interventionThe retention rate was 98.3% after 6 months and 89.8% after 18 months. 78% had eligible follow- up MRS scan. Dropout reasons were confined to a lack of motivation and medical reasons
Figure 1 Flow chart of the Dietary Intervention Randomized Controlled Trial Polyphenols Unprocessed study. HDG, healthy dietary guidelines; MED, Mediterranean.
on January 24, 2022 by guest. Protected by copyright.
http://gut.bmj.com
/G
ut: first published as 10.1136/gutjnl-2020-323106 on 18 January 2021. Dow
nloaded from
2088 Yaskolka Meir A, et al. Gut 2021;70:2085–2095. doi:10.1136/gutjnl-2020-323106
Nutrition
unrelated to the study. Overall, the 18- month dropout rate was not statistically different between the intervention groups (p=0.26). Baseline weight, WC and age of those 30 participants who withdrew during the trial did not differ significantly from the 264 completers (p=0.4 for gender distribution, p=0.38 for age, p=0.3 for baseline weight, p=0.63 for baseline WC). No significant difference in PA intensity level (median=28.8 MET/week) was observed between the intervention groups after 18 months of intervention (p=0.28). As previously reported21, the green- MED diet was distinguished in higher green tea and Mankai green shake intake, along with reduced red meat and poultry intake, as compared with the MED diet (p<0.05 for all comparisons between MED groups). Further information regarding adherence and macronutrient composition is reported
in online supplemental results 1 and online supplemental tables 3 and 4.
18-month changes in markers of adherence to intervention: serum folate and plasma polyphenolsSerum folate levels increased across the three intervention groups (p- of- trend=0.03). The green- MED group participants increased their serum folate level by 1.1 (−0.5, 2.6) ng/dL (p<0.001 vs baseline; median change (25th, 75th percentiles)), an increase that was significantly higher compared with the HDG group (0.4 (−1.0, 1.5) ng/dL, p=0.01 between groups).
Overall, at the end of the intervention, green- MED and MED groups demonstrated significantly higher levels of total
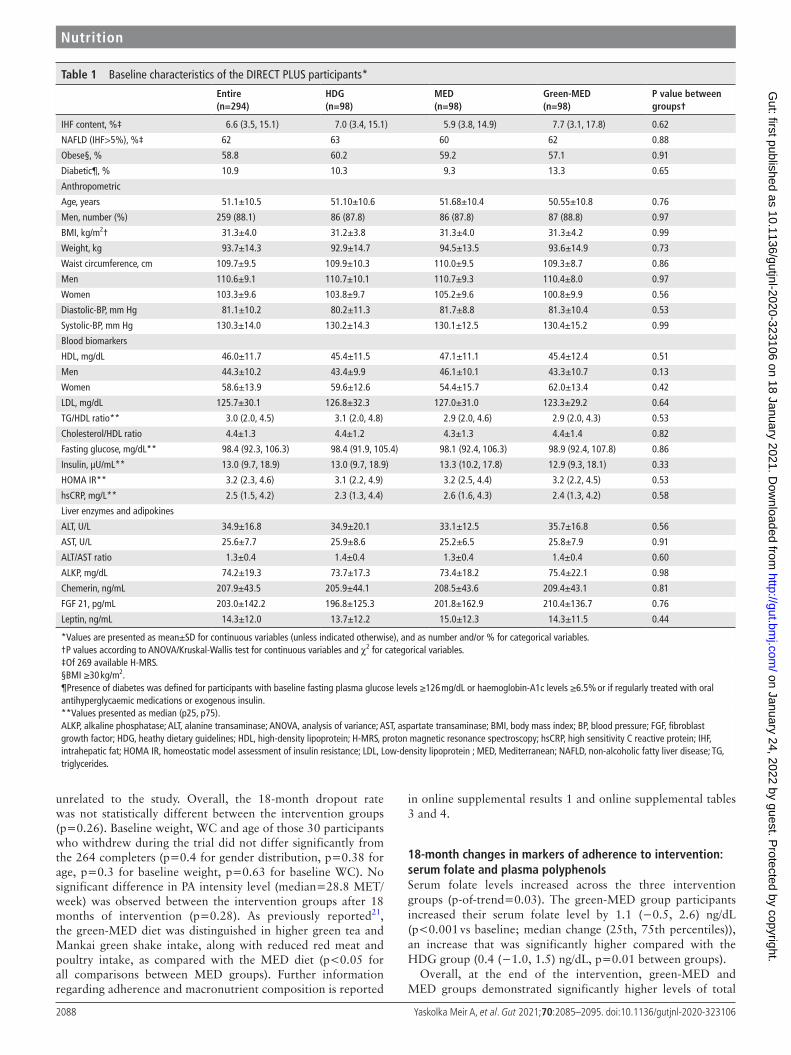
Table 1 Baseline characteristics of the DIRECT PLUS participants*
Entire(n=294)
HDG(n=98)
MED(n=98)
Green- MED(n=98)
P value between groups†
IHF content, %‡ 6.6 (3.5, 15.1) 7.0 (3.4, 15.1) 5.9 (3.8, 14.9) 7.7 (3.1, 17.8) 0.62
NAFLD (IHF>5%), %‡ 62 63 60 62 0.88
Obese§, % 58.8 60.2 59.2 57.1 0.91
Diabetic¶, % 10.9 10.3 9.3 13.3 0.65
Anthropometric
Age, years 51.1±10.5 51.10±10.6 51.68±10.4 50.55±10.8 0.76
Men, number (%) 259 (88.1) 86 (87.8) 86 (87.8) 87 (88.8) 0.97
BMI, kg/m2† 31.3±4.0 31.2±3.8 31.3±4.0 31.3±4.2 0.99
Weight, kg 93.7±14.3 92.9±14.7 94.5±13.5 93.6±14.9 0.73
Waist circumference, cm 109.7±9.5 109.9±10.3 110.0±9.5 109.3±8.7 0.86
Men 110.6±9.1 110.7±10.1 110.7±9.3 110.4±8.0 0.97
Women 103.3±9.6 103.8±9.7 105.2±9.6 100.8±9.9 0.56
Diastolic- BP, mm Hg 81.1±10.2 80.2±11.3 81.7±8.8 81.3±10.4 0.53
Systolic- BP, mm Hg 130.3±14.0 130.2±14.3 130.1±12.5 130.4±15.2 0.99
Blood biomarkers
HDL, mg/dL 46.0±11.7 45.4±11.5 47.1±11.1 45.4±12.4 0.51
Men 44.3±10.2 43.4±9.9 46.1±10.1 43.3±10.7 0.13
Women 58.6±13.9 59.6±12.6 54.4±15.7 62.0±13.4 0.42
LDL, mg/dL 125.7±30.1 126.8±32.3 127.0±31.0 123.3±29.2 0.64
TG/HDL ratio** 3.0 (2.0, 4.5) 3.1 (2.0, 4.8) 2.9 (2.0, 4.6) 2.9 (2.0, 4.3) 0.53
Cholesterol/HDL ratio 4.4±1.3 4.4±1.2 4.3±1.3 4.4±1.4 0.82
Fasting glucose, mg/dL** 98.4 (92.3, 106.3) 98.4 (91.9, 105.4) 98.1 (92.4, 106.3) 98.9 (92.4, 107.8) 0.86
Insulin, µU/mL** 13.0 (9.7, 18.9) 13.0 (9.7, 18.9) 13.3 (10.2, 17.8) 12.9 (9.3, 18.1) 0.33
HOMA IR** 3.2 (2.3, 4.6) 3.1 (2.2, 4.9) 3.2 (2.5, 4.4) 3.2 (2.2, 4.5) 0.53
hsCRP, mg/L** 2.5 (1.5, 4.2) 2.3 (1.3, 4.4) 2.6 (1.6, 4.3) 2.4 (1.3, 4.2) 0.58
Liver enzymes and adipokines
ALT, U/L 34.9±16.8 34.9±20.1 33.1±12.5 35.7±16.8 0.56
AST, U/L 25.6±7.7 25.9±8.6 25.2±6.5 25.8±7.9 0.91
ALT/AST ratio 1.3±0.4 1.4±0.4 1.3±0.4 1.4±0.4 0.60
ALKP, mg/dL 74.2±19.3 73.7±17.3 73.4±18.2 75.4±22.1 0.98
Chemerin, ng/mL 207.9±43.5 205.9±44.1 208.5±43.6 209.4±43.1 0.81
FGF 21, pg/mL 203.0±142.2 196.8±125.3 201.8±162.9 210.4±136.7 0.76
Leptin, ng/mL 14.3±12.0 13.7±12.2 15.0±12.3 14.3±11.5 0.44
*Values are presented as mean±SD for continuous variables (unless indicated otherwise), and as number and/or % for categorical variables.†P values according to ANOVA/Kruskal- Wallis test for continuous variables and χ2 for categorical variables.‡Of 269 available H- MRS.§BMI ≥30 kg/m2.¶Presence of diabetes was defined for participants with baseline fasting plasma glucose levels ≥126 mg/dL or haemoglobin- A1c levels ≥6.5% or if regularly treated with oral antihyperglycaemic medications or exogenous insulin.**Values presented as median (p25, p75).ALKP, alkaline phosphatase; ALT, alanine transaminase; ANOVA, analysis of variance; AST, aspartate transaminase; BMI, body mass index; BP, blood pressure; FGF, fibroblast growth factor; HDG, heathy dietary guidelines; HDL, high- density lipoprotein; H- MRS, proton magnetic resonance spectroscopy; hsCRP, high sensitivity C reactive protein; IHF, intrahepatic fat; HOMA IR, homeostatic model assessment of insulin resistance; LDL, Low- density lipoprotein ; MED, Mediterranean; NAFLD, non- alcoholic fatty liver disease; TG, triglycerides.
on January 24, 2022 by guest. Protected by copyright.
http://gut.bmj.com
/G
ut: first published as 10.1136/gutjnl-2020-323106 on 18 January 2021. Dow
nloaded from

2089Yaskolka Meir A, et al. Gut 2021;70:2085–2095. doi:10.1136/gutjnl-2020-323106
Nutrition
polyphenols (0.47±0.4 mg/L for both) as compared with the HDG group (0.35±0.4 mg/L; p<0.05 for both MED vs HDG). The following polyphenols were differentially detected between the groups at the end of the intervention: 2-5- dihydroxybenzoic acid (HDG: 11.9%, MED: 37.4%, green- MED: 50.7%; p<0.001) and Naringenin (HDG: 4.4%, MED: 30.4%, green- MED: 65.2%; p=0.001).
18-month changes in IHF, weight and WCAfter 18 months of lifestyle intervention, weight loss (figure 2A) and WC reduction in both green- MED (−3.7±6.3 kg, −6.1±6.2 cm; p<0.001 vs baseline for both) and MED (−2.7±5.6 kg, −5.3±5.7 cm; p<0.001 vs baseline for both) diets were similar, and were higher than the reductions achieved in the HDG group (−0.4±4.7 kg, p=0.35 vs baseline; −4.0±5.6 cm, p<0.001 vs baseline; p<0.05 between HDG and MED and green- MED groups for weight loss, with mean differences of −2.3 kg, 95% CI −4.2 to −0.4 and −3.2 kg, 95% CI −5.1 to −1.4, respectively; p=0.04 between HDG and green- MED for WC loss with a mean difference of −2.1 cm, 95% CI −4.0 to −0.1).
Participants in the green- MED group had a significantly higher reduction in IHF% (median change (25th, 75th change percentiles): −2.0% (−6.4, –0.2) absolute change, −38.9% change relative to baseline), as compared with the MED group (−1.1% (−4.7, 1.9) absolute change, −19.6% relative to base-line, p=0.023 between groups, adjusted for age, sex and baseline IHF) and HDG (−0.7% (−2.4, 1.3) absolute change, −12.2%, p<0.001 between groups, adjusted). When further adjusted for an 18- month weight loss, the difference remained significant between the two MED groups only (p=0.035). This signifi-cant difference between the two MED diets remained after we added PA and energy intake to the statistical model (p=0.047).
Adjustment for VAT change, instead of weight- loss, did not change the results observed (green- MED vs HDG: p=0.006; green- MED vs MED: p=0.029). Further subgroup analysis of IHF% change by the degree of weight loss/VAT reduction is presented in online supplemental figure 1. By the end of the trial, the prevalence of NAFLD reduced from 62% to the following distribution between intervention groups: 54.8% (HDG), 47.9% (MED) and 31.5% (green- MED; p=0.012 between groups). ITT analysis for the between- group differences (figure 2B) yielded similar results. Further adjustment for weight loss resulted in a significant difference between the two MED group (p=0.024). A comparison between the per- protocol changes and ITT tech-niques is presented in online supplemental figure 2. Illustra-tive MRI of the 18- month changes in the two MED diets are presented in figure 2C. Further analysis of 18- month IHF% changes by BMI, age, NAFLD, sex, type 2 diabetes or metabolic syndrome criteria subgroups is presented in online supplemental figure 3.
Since some participants were included in a substudy related and parallel to this trial,33 we also examined the IHF% change between the substudy intervention groups, with no significant difference observed.
‘Green component’ and IHF lossTo clarify why the green- MED diet was more successful than the MED diet in IHF reduction, we further examined specific food components. IHF% change was inversely correlated with serum folate change (r=−0.16, p=0.02). Greater reduction in IHF was observed in participants in the top serum folate change (increase) tertile versus lowest serum folate change, and among participants who reduced red and processed meat (p<0.05 for all, figure 3). An interaction was observed for red/processed meat
Figure 2 (A–C)18- month changes in weight and intrahepatic fat. (A) 18- month absolute change in weight between intervention groups (ITT analysis, n=294). (B)18- month changes in IHF% between intervention groups (ITT analysis, adjusted p values for age, sex and baseline IHF%; n=269). (C) Illustrative MRI: a comparison of two male participants, similar age (46 years) and similar baseline WC (105 cm). Participant A was randomly assigned to the MED groups; participant B was assigned to the green- MED group. Both participants lost about 12% of their initial weight after 18 months and reported consuming at least 5–6 time/week walnuts (reported on 28 g/time). Total plasma polyphenol levels at the end of the intervention were higher in the green- MED participant versus MED participant (0.67 mg/L vs 0.24 mg/L). *Significant within- group change versus baseline at 0.05 level. Colour liver images were generated using pride software (by Philips). HDG, healthy dietary guidelines; IHF, intrahepatic fat; ITT, intention to treat; MED, Mediterranean; WC, waist circumference.
on January 24, 2022 by guest. Protected by copyright.
http://gut.bmj.com
/G
ut: first published as 10.1136/gutjnl-2020-323106 on 18 January 2021. Dow
nloaded from

2090 Yaskolka Meir A, et al. Gut 2021;70:2085–2095. doi:10.1136/gutjnl-2020-323106
Nutrition
and serum folate with the green- MED diet, that remained signif-icant after further adjustments for age, sex, and either baseline IHF or weight. Further analysis of the reduction in IHF% and diet components is presented in online supplemental figure 4.
Increased intake of both Mankai and walnuts, as reported by the participants, was significantly associated with greater IHF% loss (p<0.05 for all; figure 3). Adjustment for either weight change or baseline IHF level did not materially attenuate the associations (p<0.05 between extreme tertiles). Of note, change in total plasma polyphenols was marginally correlated with IHF% change (r=−0.12, p=0.09).
Associations of IHF with cardiometabolic markersAt baseline, IHF% levels were correlated with anthropometric parameters, glycaemic, lipid and liver- related markers (p<0.05 for all; online supplemental figure 5). Further adjustment for age, sex and baseline weight did not affect most of the observed associations.
Eighteen- month weight and WC loss were significantly asso-ciated with IHF% loss (table 2). IHF% reduction was associ-ated with a decline in diastolic BP, TG/HDL ratio, cholesterol/HDL ratio, fibroblast growth factor 21 (FGF21) and chemerin (p<0.05 for all biomarkers, consistently in all three statistical models). Eighteenth- month differences in liver- related blood
biomarkers between groups are presented in online supple-mental figure 6.
Intrahepatic fat and the gut microbiomeWe next addressed the potential role of the gut microbiome in the observed association between lifestyle intervention and IHF% reduction.
At baseline, IHF% levels were significantly associated with taxonomic composition, as assessed by global structure Permu-tational analysis of variance((PERMANOVA), p=0.008), and by the first principal coordinate (PCo) across IHF% tertiles (figure 4A). Concordantly, 18- month change in IHF was found to be associated with the change in the global composi-tion, assessed by the log2 change of all operational taxonomic units (OTUs) (PERMANOVA, p=0.037). Aiming to determine whether the microbiome’s composition change had a mediatory role in the association between lifestyle intervention and IHF loss, we sought the PCo most highly correlated with IHF change (PC5; r=0.25, p=0.001; figure 4B, online supplemental figure 7), and evaluated to what extent was it affected by lifestyle inter-vention. PCo #5, being a surrogate for the compositional shift of the microbiome, differed across the intervention groups (p- of- trend=0.001), with a significant difference between the HDG group and the MED and green- MED groups (p=0.038 and
Figure 3 Changes in IHF across tertiles/categories of dietary components. Mankai shake and green tea tertiles are calculated from the weighted mean of consumption reported after 6 and 18 months of intervention. serum folate tertiles (of 18- month change in serum folate): T1≤−0.41; T2=−0.40 to 1.46; T3≥1.47; Mankai shake tertiles: T1≤1.67/week; T2=1.68 to 3.00/week; T3≥3.01/week; green tea tertiles: T1≤2/day; T2=2.01 to 3.67/day; T3≥3.68/day; walnut consumption categories: low: 0 to 1–3 times/month; medium: 1–2/week to 3–4/week; high: more than 5–6/week. Categories intervention group distribution for walnuts: low consumption: 60% MED, 40% green- MED; medium consumption: 45% MED, 55% green- MED; high consumption: 45% Med, 55% green- MED. Specific between tertiles/consumption group p values are corrected for multiple comparisons. # none of the participants reported on more processed meat. IHF, intrahepatic fat; MED, Mediterranean; T1, lowest tertile; T2, intermediate tertile; T3, highest tertile.
on January 24, 2022 by guest. Protected by copyright.
http://gut.bmj.com
/G
ut: first published as 10.1136/gutjnl-2020-323106 on 18 January 2021. Dow
nloaded from

2091Yaskolka Meir A, et al. Gut 2021;70:2085–2095. doi:10.1136/gutjnl-2020-323106
Nutrition
p=0.004, respectively) (figure 4B), and no significant difference between the MED groups (p=0.268). In a mediation analysis, the compositional shift of the microbiome was estimated to account for 22% of IHF change by the lifestyle interventions (figure 4C).
Evaluating the contribution of specific bacteria to this obser-vation, we identified nine genus- level bacteria that were signifi-cantly associated with IHF at baseline (5% of genus- level bacteria), including Fournierella, Anaerosporobacter, Lachnospir-aceae_UCG-003 and several genera from the Ruminococcaceae family. Among them, eight bacteria were also found to be asso-ciated with IHF 18- month change. Next, assessing the effect of lifestyle intervention on these bacteria, the interaction between time and lifestyle intervention group was evaluated. Two specific bacteria, Fournierella and Ruminococcaceae_UCG-014 were found to be significantly affected by lifestyle intervention. However, in a mediation analysis, both bacteria were not found as significant mediators between lifestyle intervention and IHF change (figure 4D, online supplemental table 5).
DISCUSSIONIn the current study, we demonstrated that the prevalence of NAFLD was reduced in half by the strategy of exercise and green- MED diet enriched with Mankai and walnuts and restricted in red and processed meat, as reflected by increased plasma polyphenols and serum folate. Also, we found an independent
association between 18- month IHF% reduction and beneficial changes in cardiometabolic, inflammatory parameters, specific gut bacteria and with global microbiota composition, which was also found to have a mediatory role in the association between lifestyle intervention and liver fat reduction. Following our previous trials suggesting that the MED diet is favourable to a low- fat diet in terms of cardiometabolic risk13 34 and IHF loss,18 this clinical trial may suggest an effective nutritional tool for the treatment of NAFLD beyond weight loss, a predicament that very little, if any effect, pharmacological treatment exists for.
Several limitations of this study should be considered. First, we had a high proportion of male participants, reflecting the profile of the workplace. This limits our ability to extrapo-late our results to women. In addition, NAFLD is almost as prevalent in women as compared with men, and thus gender aspects are not fulfilled by this trial. Also, this study’s results may not be extrapolated to a population that is not abdomi-nally obese and/or with dyslipidaemia, or a population with a lower prevalence of NAFLD than seen among our partici-pants. Yet, the high prevalence of liver steatosis is probably a reflection of a sedentary lifestyle and unhealthy eating pattern, as our participants did not report any alcohol abuse. Second, we assessed adherence to the intervention mainly by participants’ self- reports. However, serum folate analysis, reflecting green leaf consumption29 and correlate well with nutritional self- reports,28 enabled us to objectively estimate
Table 2 Associations between 18- month intrahepatic fat change and 18- month anthropometric parameters and blood biomarkers changes
Model 1 Model 2 Model 3
Beta coefficient P value Beta coefficient P value Beta coefficient P value
Anthropometric
∆Weight 0.64 5.3e-25 – –
∆Waist circumference 0.56 3.7e-19 – –
∆Systolic BP 0.17 0.01 0.10 0.05 0.07 0.15
∆Diastolic BP 0.28 1.9e-5 0.16 0.005 0.11 0.04
Glycaemic biomarkers
∆Glucose 0.22 0.001 0.11 0.06 0.08 0.15
∆HOMA IR 0.26 8.8e-5 0.13 0.02 0.04 0.49
∆Insulin 0.28 2.9e-5 0.14 0.02 0.03 0.54
Lipid biomarkers
∆Triglycerides 0.38 5.5e-9 0.22 8.1e-5 0.11 0.056
∆Cholesterol 0.08 0.30 0.08 0.16 0.04 0.41
∆HDL −0.38 7.9e-9 −0.20 0.001 −0.11 0.07
∆LDL 0.04 0.51 0.05 0.40 0.03 0.61
∆TG/HDL ratio 0.40 3.3E-10 0.25 2.0e-5 0.14 0.02
∆Cholesterol/HDL ratio 0.36 2.6e-8 0.24 1.4e-5 0.15 0.007
Liver enzymes and hepatokines
∆ALT 0.32 2.0e-6 0.2 0.001 0.1 0.089
∆AST 0.13 0.049 0.08 0.12 0.07 0.18
∆ALT/AST ratio 0.36 6.2e-8 0.23 9.8e-5 0.10 0.069
∆ALKP 0.03 0.69 −0.001 0.95 −0.008 0.88
∆FGF21 0.26 9.2e-5 0.15 0.01 0.12 0.03
Adipokines and inflammation
∆Chemerin 0.18 0.007 0.13 0.02 0.16 0.001
∆Leptin 0.15 0.03 0.06 0.36 −0.08 0.18
∆hsCRP 0.17 0.02 0.14 0.01 0.09 0.089
Model 1: adjusted for age, sex, baseline IHF% and intervention group.Model 2: adjusted for age, sex, baseline IHF% intervention group, and 18- month waist circumference change.Model 3: adjusted for age, sex, baseline IHF%, intervention group and 18- month weight change.ALKP, alkaline phosphatase; ALT, alanine transaminase; AST, aspartate transaminase; BP, blood pressure; FGF, fibroblast growth factor; HDL, high- density lipoprotein; HOMA IR, homeostatic model assessment of insulin resistance; hsCRP, high sensitivity C reactive protein; LDL, low- density lipoprotein; TG, triglycerides.
on January 24, 2022 by guest. Protected by copyright.
http://gut.bmj.com
/G
ut: first published as 10.1136/gutjnl-2020-323106 on 18 January 2021. Dow
nloaded from

2092 Yaskolka Meir A, et al. Gut 2021;70:2085–2095. doi:10.1136/gutjnl-2020-323106
Nutrition
Figure 4 (A–D) Intrahepatic fat and the gut microbiome. (A) Gut microbiome composition (beta diversity) and IHF% at baseline. Gut microbiome composition and IHF, shown by principal coordinate analysis (PCoA) of UniFrac distances between all baseline samples. Colours denotes 1st (grey) 2nd (yellow) and 3rd (brown) IHF% tertiles. 95% SE ellipses are shown for each tertile. Boxplots on the right describe PCo1 score by IHF% tertile. (B) Gut microbiome composition change and IHF% change. Correlation between principal component 5 (PCo5), the principal coordinate most highly correlated with IHF change (Y axis), and 18- month change in intrahepatic fat. Colours denotes lifestyle intervention group allocation. Boxplots on the right describe PCo5 score by IHF% lifestyle intervention group. (C) Mediation analysis: assessing the proportional mediatory effect of microbiome composition change (measured as PCo5) in the association between lifestyle intervention and IHF% change. (D) Stepwise identification of genus level bacteria associated with: IHF% at baseline (top, two selected bacteria), IHF% 18- month change (middle, heatmap) and with lifestyle intervention (bottom, bar plot, selected bacteria). IHF, intrahepatic fat.
on January 24, 2022 by guest. Protected by copyright.
http://gut.bmj.com
/G
ut: first published as 10.1136/gutjnl-2020-323106 on 18 January 2021. Dow
nloaded from

2093Yaskolka Meir A, et al. Gut 2021;70:2085–2095. doi:10.1136/gutjnl-2020-323106
Nutrition
green products’ intake. Although we measured plasma poly-phenols, these measurements are limited in reflecting poly-phenol intake, as only a few phenolic acids, derived from dietary polyphenol metabolism, will be present in overnight, fasted blood samples.35 The strengths of the study include the closed workplace environment, which enabled moni-toring of the provided lunch, the presence of an on- site clinic at the participants’ workplace; intense dietary guidance and group meetings with multidisciplinary guidance; access to free- of- charge provided polyphenols; relatively large sample size; high retention rate; and the use of an accurate imaging technique,30 as compared with other non- invasive methods36 with high reproducibility between measurements,37 to quan-tify IHF%.
According to current guidelines, obese or overweight indi-viduals are advised to undergo a moderate 5%–10% weight reduction by energy restriction.8 9 NAFLD patients are advised to change their diet (ie, reduce added sugar and reduce saturated fat) and engage in PA, both aerobic and resistance.8 In our study, participants who were instructed for HDG reduced both WC and IHF%, in accordance with a previous publication,38 whereas aerobic PA interventions in obese men and women, without weight loss, was found to be useful in the reduction of liver steatosis. The MED intervention in our study had greater efficacy in promoting adiposity (WC and weight) reduction, in addition to IHF% loss, similarly to data previously reported by us,3 18 where some fat depots, and more specifically IHF%, were effec-tively reduced by the MED/low carbohydrate diet than the low- fat diet, independently of VAT changes. The green- MED diet achieved the highest IHF loss, within similar weight loss as observed in the MED group, suggesting that diet compo-sition has an effect beyond weight loss. We now add to this knowledge by demonstrating an additional benefit from the green- MED regimen, differed from the MED diet by being rich in green polyphenols and restricted in red and processed meat.
Polyphenols might play a role in reducing liver steatosis by preventing hepatocellular damage through several possible mechanisms, including reducing de novo lipogenesis, increasing fatty acid oxidation and reducing oxidative stress.15 The MED eating pattern is based mainly on increasing plant- based foods, including olive oil, along with restricted meat consumption. In our trial, we further enriched the diet with provided polyphenols, in addition to the polyphenols natu-rally found in the MED diet. Participants in the green- MED group were instructed to consume 3–4 cups/day of green tea containing mostly EGCG, associated with reducing liver fat, as well as liver enzymes levels, fibrosis, and inflamma-tion39 and a daily Mankai green shake containing a mixture of flavonoids, shown to increase fatty acid oxidation in the liver, reduce inflammation by inhibition of nuclear factor kappa- light- chain- enhancer of activated B cells, to increase adiponectin, and to reduce BP.40 Both MED groups received 28 g/day of walnuts, rich in ellagic acid, shown to improve hepatic status due to antihepatotoxic properties.41 The participants of the green- MED group had a specific detec-tion of Naringenin (demonstrated to have a beneficial effect in liver diseases42) and 2-5- dihydroxybenzoic acid (a catabo-lite of the plant hormone salicylic acid43).
In addition to a greater reduction in IHF following a higher intake of polyphenols rich Mankai shake and walnuts, a decrease in red/processed meat and increased folate (prob-ably reflecting Mankai consumption) also led to greater IHF
reduction. Folate is an essential vitamin of the B vitamins family, with several important biological roles (eg, involve-ment in the DNA synthesis).44 Low folate levels were previ-ously recognised as an independent risk factor of NAFLD,45 probably by affecting the expression of genes that might contribute to the accumulation of lipids in the liver.44 These results suggest that a higher intake of specific polyphenol- serum folate- rich components, in addition to a decrease in red/processed meat, might mediate a reduction of liver fat. We observed known associations of IHF% at baseline with some cardiometabolic- related biomarkers in accordance with our previous report,3 and an association between IHF change and change in FGF21 (elevated in conditions of obesity and NAFLD46). Due to our study’s nature, we cannot determine whether the change observed in these markers resulted from the reduction in IHF% and improvement in liver status or is merely a reflection of overall cardiometabolic improvement.
Previous studies have established the role of the gut micro-biome in fat storage regulation in general,47 and NAFLD induction through hepatic fat storage specifically.5 We described an association between IHF% and microbiome composition at baseline, with a homogenous dysbiotic pattern among the two higher IHF% tertiles (>4.3% IHF) of our cohort. This observation is in accordance with prior evidence, associating NAFLD (>5% IHF) and gut dysbiosis.4 The family Ruminococcaceae has been consistently reported as less abundant in NAFLD,48 49 a finding we were able to reproduce at baseline in our cohort. Interestingly enough, during our trial IHF reduction was positively correlated with changes in specific Ruminococcaceae genera (Ruminococca-ceae_UCG-014, Ruminococcaceae_UCG-009) and negatively correlated with change of a specific genus (Ruminococca-ceae_UCG-008). This finding warrants further investigation as to the role of Ruminococcaceae in NAFLD pathogen-esis and resolution. We further report a novel observation, linking IHF% change with a compositional shift in the microbiome over 18 months. This shift, in turn, partially mediated the effect of lifestyle interventions on IHF%. This mediatory effect of gut microbiome composition on IHF reduction constitutes an advancement of the observations made by others, establishing the association between the gut microbiome composition and NAFLD susceptibility.50
In conclusion, a green- MED diet, enriched with specific polyphenols and decreased red and processed meat consumption, amplifies the beneficial effect of the MED diet on hepatic fat reduction, beyond weight loss. The results of this study may suggest an improved dietary protocol to treat NAFLD.
Author affiliations1Department of Public Health, Ben- Gurion University of the Negev, Beer- Sheva, Israel2Division of Cardiology, Soroka Medical Center, Beer Sheva, Israel3Division of Diagnostic and Interventional Imaging, Soroka University Medical Center, Beer Sheva, Israel4Pediatric Division and Center for Microbiome Research, Shamir Medical Center, Be’er Ya’akov, Israel5Medical Department III – Endocrinology, Nephrology, Rheumatology, Leipzig University, Leipzig, Germany6Institute for Laboratory Medicine, Leipzig University, Leipzig, Germany7Food Quality and Nutrition, Research and Innovation Centre, Fondazione Edmund Mach, San Michelle All’Adige, Italy8Faculty of Science and Technology, Free University of Bozen- Bolzano, Bolzano, Italy9Department of Nutrition, Harvard University T H Chan School of Public Health, Boston, Massachusetts, USA10Channing Division of Network Medicine, Brigham and Women’s Hospital, Boston, Massachusetts, USA
on January 24, 2022 by guest. Protected by copyright.
http://gut.bmj.com
/G
ut: first published as 10.1136/gutjnl-2020-323106 on 18 January 2021. Dow
nloaded from

2094 Yaskolka Meir A, et al. Gut 2021;70:2085–2095. doi:10.1136/gutjnl-2020-323106
Nutrition
11Department of Epidemiology, Harvard T.H. Chan School of Public Health, Boston, MA, USA
Acknowledgements We thank the DIRECT PLUS participants for their valuable contribution. We thank the California Walnut Commission, Wissotzky Tea Company, and Hinoman for kindly supplying food items for this study. We thank Dr Dov Brikner, Efrat Pupkin, Eyal Goshen, Avi Ben Shabat, Evyatar Cohen and Benjamin Sarusi from the Nuclear Research Center Negev; Liz Shabtai and Yulia Kovshan from Ben- Gurion University of the Negev; Andrea Angeli and Maria Ulaszewska of the Metabolomics Unit, Fondazione Edmund Mach for their valuable contributions to this study.
Contributors AYM, ER, GT, HZ, AK and IShai contributed to the data collection. AYM and ER made the statistical analysis, interpreted the data, reviewed the literature and drafted the manuscript. ER, GT, HZ, AK, PR, IShelef, IY, AS, MB, KT, CD, UV, UC, MStumvoll, FH, MStampfer and IShai contributed to the analysis and interpretation of data, and reviewed the language and intellectual content of this work. AYM and IShai revised the final draft of the study and approved the final version to be published.
Funding This work was funded by grants from the Deutsche Forschungsgemeinschaft (DFG, German Research Foundation)—Project number 209933838—Collaborative Research CenterCentre SFB1052 ’Obesity Mechanisms’, to I Shai (SFB-1052/B11); Israel Ministry of Health grant 87472511 (to I Shai); Israel Ministry of Science and Technology grant 3-13604 (to I Shai); California Walnuts Commission (to I Shai) and the Project ’Cabala_diet&health’ (http://www. cabalaproject. eu/) which received funding from the European Union’s Horizon2020 research and innovation grant agreement No 696295—ERA- Net Cofund ERA- HDHL ’Biomarkers for Nutrition and Health implementing the JPI HDHL objectives’ (https://www. heal thyd ietf orhe alth ylife. eu/) supported polyphenol analyses at FEM (to KT). AYM is a recipient of the Kreitman Doctoral Fellowship at Ben- Gurion University of the Negev. None of the funding providers were involved in any stage of the design, conduct or analysis of the study and they had no access to the study results before publication.
Competing interests IS advises to the Hinoman, Ltd. nutritional committee. Youngster is medical advisor for Mybiotix Ltd.
Patient consent for publication Not required.
Ethics approval The Soroka University Medical Centre Medical Ethics Board and Institutional Review Board approved the study protocol. All participants provided written informed consent and received no financial compensation.
Provenance and peer review Not commissioned; externally peer reviewed.
Data availability statement The majority of results corresponding to the current study are included in the article or uploaded as supplementary material. No further data are avialable.
Supplemental material This content has been supplied by the author(s). It has not been vetted by BMJ Publishing Group Limited (BMJ) and may not have been peer- reviewed. Any opinions or recommendations discussed are solely those of the author(s) and are not endorsed by BMJ. BMJ disclaims all liability and responsibility arising from any reliance placed on the content. Where the content includes any translated material, BMJ does not warrant the accuracy and reliability of the translations (including but not limited to local regulations, clinical guidelines, terminology, drug names and drug dosages), and is not responsible for any error and/or omissions arising from translation and adaptation or otherwise.
Open access This is an open access article distributed in accordance with the Creative Commons Attribution Non Commercial (CC BY- NC 4.0) license, which permits others to distribute, remix, adapt, build upon this work non- commercially, and license their derivative works on different terms, provided the original work is properly cited, appropriate credit is given, any changes made indicated, and the use is non- commercial. See: http:// creativecommons. org/ licenses/ by- nc/ 4. 0/.
ORCID iDsCamilla Diotallevi http:// orcid. org/ 0000- 0002- 2256- 5657Iris Shai http:// orcid. org/ 0000- 0001- 9050- 4605
REFERENCES 1 van Herpen NA, Schrauwen- Hinderling VB. Lipid accumulation in non- adipose tissue
and lipotoxicity. Physiol Behav 2008;94:231–41. 2 Byrne CD, Targher G. Nafld: a multisystem disease. J Hepatol 2015;62:S47–64. 3 Gepner Y, Shelef I, Komy O, et al. The beneficial effects of Mediterranean diet
over low- fat diet may be mediated by decreasing hepatic fat content. J Hepatol 2019;71:379–88.
4 Sharpton SR, Ajmera V, Loomba R. Emerging role of the gut microbiome in nonalcoholic fatty liver disease: from composition to function. Clin Gastroenterol Hepatol 2019;17:296–306.
5 Kolodziejczyk AA, Zheng D, Shibolet O, et al. The role of the microbiome in NAFLD and NASH. EMBO Mol Med 2019;11:e9302.
6 Younossi Z, Anstee QM, Marietti M, et al. Global burden of NAFLD and NASH: trends, predictions, risk factors and prevention. Nat Rev Gastroenterol Hepatol 2018;15:11–20.
7 Stefan N, Kantartzis K, Häring H- U. Causes and metabolic consequences of fatty liver. Endocr Rev 2008;29:939–60.
8 Zelber- Sagi S, Godos J, Salomone F. Lifestyle changes for the treatment of nonalcoholic fatty liver disease: a review of observational studies and intervention trials. Therap Adv Gastroenterol 2016;9:392–407.
9 Plauth M, Bernal W, Dasarathy S, et al. ESPEN guideline on clinical nutrition in liver disease. Clin Nutr 2019;38:485–521.
10 Zelber- Sagi S, Salomone F, Mlynarsky L. The Mediterranean dietary pattern as the diet of choice for non- alcoholic fatty liver disease: evidence and plausible mechanisms. Liver Int 2017;37:936–49.
11 Dinu M, Pagliai G, Casini A, et al. Mediterranean diet and multiple health outcomes: an umbrella review of meta- analyses of observational studies and randomised trials. Eur J Clin Nutr 2018;72:30–43.
12 Estruch R, Ros E, Salas- Salvadó J, et al. Primary prevention of cardiovascular disease with a Mediterranean diet supplemented with extra- virgin olive oil or nuts. N Engl J Med 2018;378:e34.
13 Shai I, Schwarzfuchs D, Henkin Y, et al. Weight loss with a low- carbohydrate, Mediterranean, or low- fat diet. N Engl J Med 2008;359:229–41.
14 Pandey KB, Rizvi SI. Plant polyphenols as dietary antioxidants in human health and disease. Oxid Med Cell Longev 2009;2:270–8.
15 Rodriguez- Ramiro I, Vauzour D, Minihane AM. Polyphenols and non- alcoholic fatty liver disease: impact and mechanisms. Proc Nutr Soc 2016;75:47–60.
16 Saura- Calixto F, Serrano J, Goñi I. Intake and bioaccessibility of total polyphenols in a whole diet. Food Chem 2007;101:492–501.
17 Chun OK, Chung SJ, Song WO. Estimated dietary flavonoid intake and major food sources of U.S. adults. J Nutr 2007;137:1244–52.
18 Gepner Y, Shelef I, Schwarzfuchs D, et al. Effect of distinct lifestyle interventions on mobilization of fat storage pools: central magnetic resonance imaging randomized controlled trial. Circulation 2018;137:1143–57.
19 Cueto- Galán R, Barón FJ, Valdivielso P, et al. Changes in fatty liver index after consuming a Mediterranean diet: 6- year follow- up of the PREDIMED- Malaga trial. Med Clin 2017;148:435–43.
20 Mazidi M, Kengne AP. Higher adherence to plant- based diets are associated with lower likelihood of fatty liver. Clin Nutr 2019;38:1672–7.
21 Chiu TH, Lin M- N, Pan W- H, et al. Vegetarian diet, food substitution, and nonalcoholic fatty liver. Tzu- Chi Med J 2018;30:102.
22 Regueiro J, Sánchez- González C, Vallverdú-Queralt A, et al. Comprehensive identification of walnut polyphenols by liquid chromatography coupled to linear ion trap- Orbitrap mass spectrometry. Food Chem 2014;152:340–8.
23 Yaskolka Meir A, Tsaban G, Zelicha H, et al. A Green- Mediterranean diet, supplemented with Mankai duckweed, preserves Iron- Homeostasis in humans and is efficient in reversal of anemia in rats. J Nutr 2019;149:1004–11.
24 Sela I, Yaskolka Meir A, Brandis A, et al. Wolffia globosa- Mankai Plant- Based Protein Contains Bioactive Vitamin B
12 and Is Well Absorbed in Humans. Nutrients 2020;12:3067.
25 Kukuk GM, Hittatiya K, Sprinkart AM, et al. Comparison between modified Dixon MRI techniques, MR spectroscopic relaxometry, and different histologic quantification methods in the assessment of hepatic steatosis. Eur Radiol 2015;25:2869–79.
26 Hu HH, Kim H- W, Nayak KS, et al. Comparison of fat- water MRI and single- voxel MRS in the assessment of hepatic and pancreatic fat fractions in humans. Obesity 2010;18:841–7.
27 Shai I, Shahar DR, Vardi H, et al. Selection of food items for inclusion in a newly developed food- frequency questionnaire. Public Health Nutr 2004;7:745–9.
28 Shai I, Rosner BA, Shahar DR, et al. Dietary evaluation and attenuation of relative risk: multiple comparisons between blood and urinary biomarkers, food frequency, and 24- hour recall questionnaires: the DEARR study. J Nutr 2005;135:573–9.
29 Moll R, Davis B, Iron DB. Iron, vitamin B 12 and folate. Medicine 2017;45:198–203. 30 Szczepaniak LS, Nurenberg P, Leonard D, et al. Magnetic resonance spectroscopy to
measure hepatic triglyceride content: prevalence of hepatic steatosis in the general population. Am J Physiol Endocrinol Metab 2005;288:E462–8.
31 Li P, Stuart EA, Allison DB. Multiple imputation: a flexible tool for handling missing data. JAMA 2015;314:1966–7.
32 Bowman SA, Clemens JC, Friday JE, et al. Food Patterns Equivalents Database 2011–12: Methodology and User Guide. Food Surveys Research Group, Beltsville Human Nutrition Research Center. Agric Res Serv US Dep Agric 2014.
33 Rinott E, Youngster I, Meir AY, et al. Effects of Diet- Modulated autologous fecal microbiota transplantation on weight regain. Gastroenterology 2020: j. gastro. 2020. 08. 041.
34 Schwarzfuchs D, Golan R, Shai I. Four- Year follow- up after two- year dietary interventions. N Engl J Med 2012;367:1373–4.
35 Spencer JPE, Abd El Mohsen MM, Minihane A- M, et al. Biomarkers of the intake of dietary polyphenols: strengths, limitations and application in nutrition research. Br J Nutr 2008;99:12–22.
on January 24, 2022 by guest. Protected by copyright.
http://gut.bmj.com
/G
ut: first published as 10.1136/gutjnl-2020-323106 on 18 January 2021. Dow
nloaded from

2095Yaskolka Meir A, et al. Gut 2021;70:2085–2095. doi:10.1136/gutjnl-2020-323106
Nutrition
36 Friedrich- Rust M, Müller C, Winckler A, et al. Assessment of liver fibrosis and steatosis in pBC with FibroScan, MRI, MR- spectroscopy, and serum markers. J Clin Gastroenterol 2010;44:58–65.
37 van Werven JR, Hoogduin JM, Nederveen AJ, et al. Reproducibility of 3.0 Tesla magnetic resonance spectroscopy for measuring hepatic fat content. J Magn Reson Imaging 2009;30:444–8.
38 Johnson NA, Sachinwalla T, Walton DW, et al. Aerobic exercise training reduces hepatic and visceral lipids in obese individuals without weight loss. Hepatology 2009;50:1105–12.
39 Chen C, Liu Q, Liu L, et al. Potential Biological Effects of (-)- Epigallocatechin-3- gallate on the Treatment of Nonalcoholic Fatty Liver Disease. Mol Nutr Food Res 2018;62:1700483.
40 Akhlaghi M. Non- Alcoholic fatty liver disease: beneficial effects of flavonoids. Phytother Res 2016;30:1559–71.
41 García- Niño WR, Zazueta C. Ellagic acid: pharmacological activities and molecular mechanisms involved in liver protection. Pharmacol Res 2015;97:84–103.
42 Hernández- Aquino E, Muriel P. Beneficial effects of naringenin in liver diseases: molecular mechanisms. World J Gastroenterol 2018;24:1679–707.
43 Dempsey D’Maris Amick, Vlot AC, Wildermuth MC, et al. Salicylic acid biosynthesis and metabolism. Arabidopsis Book 2011;9:e0156.
44 da Silva RP, Kelly KB, Al Rajabi A, et al. Novel insights on interactions between folate and lipid metabolism. Biofactors 2014;40:277–83.
45 Xia M- F, Bian H, Zhu X- P, et al. Serum folic acid levels are associated with the presence and severity of liver steatosis in Chinese adults. Clin Nutr 2018;37:1752–8.
46 Fisher FM, Maratos- Flier E. Understanding the physiology of FGF21. Annu Rev Physiol 2016;78:223–41.
47 Bäckhed F, Ding H, Wang T, et al. The gut microbiota as an environmental factor that regulates fat storage. Proc Natl Acad Sci U S A 2004;101:15718–23.
48 Da Silva HE, Teterina A, Comelli EM, et al. Nonalcoholic fatty liver disease is associated with dysbiosis independent of body mass index and insulin resistance. Sci Rep 2018;8:1466.
49 Jiang W, Wu N, Wang X, et al. Dysbiosis gut microbiota associated with inflammation and impaired mucosal immune function in intestine of humans with non- alcoholic fatty liver disease. Sci Rep 2015;5:8096.
50 Le Roy T, Llopis M, Lepage P, et al. Intestinal microbiota determines development of non- alcoholic fatty liver disease in mice. Gut 2013;62:1787–94.
on January 24, 2022 by guest. Protected by copyright.
http://gut.bmj.com
/G
ut: first published as 10.1136/gutjnl-2020-323106 on 18 January 2021. Dow
nloaded from

1
The effect of green Mediterranean diet on intrahepatic fat; The DIRECT PLUS
randomized controlled trial
Supplemental Material
Supplemental Methods: Exclusion criteria
Exclusion criteria were an inability to partake in physical activity (PA), a serum creatinine
level³2mg/dL, disturbed liver function, a major illness that might require hospitalization,
pregnancy or lactation for women, presence of active cancer or undergoing chemotherapy
either at present or in the prior three years, participation in another trial, chronic treatment
with warfarin (given its interaction with vitamin K), and being implanted with a pacemaker
or platinum implant (due to inability to undergo magnetic resonance imaging included in the
study design).
Supplemental Methods 2: Physical activity protocol
The aerobic effort increased gradually, starting with 20 minutes of aerobic training at 65%
maximum heart rate, and increased to 45-60 minutes of aerobic training at 80% of maximum
heart rate. The full workout program included 45-60 minutes of aerobic training 3-4
times/week; resistance training starting with one set of weights corresponding to 60% of the
maximum weight, eventually reached the use of two sets of weights corresponding to 80% of
the maximum weight. The resistance training included leg extensions, leg curls, squats,
lateral pull-downs, push-ups, shoulder presses, elbow flexions, triceps extensions, and bent
leg sit-ups.
Supplemental Methods 3: Provided polyphenol-rich products
Walnuts [groups Mediterranean (MED), green-MED]: The main polyphenols in walnuts are
ellagitannins, ellagic acid, and its derivatives [1]. Walnuts are considered to have a beneficial
effect on health maintenance and disease prevention [2]. In addition, Ellagitannin found in
nuts was reported to reduce waist circumference (WC), low-density lipoprotein cholesterol
(LDL-c), and triglycerides (TG) [3].
Green tea (group green-MED): an unfermented tea produced from the leaves of Camellia
sinensis, is prepared by drying and steaming the leaves and is a rich source of polyphenols
[4]. Most of the polyphenols found in green tea are Catechins (the monomer form of
flavanols), mainly epigallocatechin (EGC), epicatechin gallate (ECG), and epigallocatechin
gallate (EGCG) [5,6]. Short-term (weeks long) intervention studies and meta-analyses have
found an association between administrating green tea or its extracts and improvement in
cardiometabolic health [7,8], weight reduction [6], and improved cognitive function [9,10].
Wolffia globosa duckweed - Mankai (group green-MED): A specific strain of Wolffia
globosa, an aquatic plant, which can serve as a plant protein source. In Asian cuisines,
Wolffia globosa (Mankai cultivated strain) is considered a natural food source or "vegetable
meatball" [11]. Nutritionally, Mankai is characterized by high protein content (more than
45% of the dry matter) and the presence of 9 essential and 6 conditional amino acids [12]. In
addition, it is a good source of omega-3 fatty acids [13]. The Mankai plant is rich in non-
soluble fibers, iron, vitamins, minerals [14], and polyphenols, including catechins, caffeic
acid, apigenin, quercetin, naringenin, and kaempferol [15,16]. Mankai provides bioavailable
essential amino acids [12], iron [17], vitamin B12 [18], and has beneficial effects on
postprandial and fasting glycemic control [19]. We guided the participants to prepare a green
Mankai shake with additional ingredients, which also were part of the diet regimen (fruits,
BMJ Publishing Group Limited (BMJ) disclaims all liability and responsibility arising from any relianceSupplemental material placed on this supplemental material which has been supplied by the author(s) Gut
doi: 10.1136/gutjnl-2020-323106–11.:10 2021;Gut, et al. Yaskolka Meir A

2
walnuts, or vegetables) each evening. The green protein shake partially substituted for dinner,
replacing beef/poultry protein sources.
Supplemental Methods 4: Lifestyle sessions and motivation techniques
The lifestyle interventions included 90-minute nutritional and PA sessions in the workplace
with multidisciplinary guidance (physicians, clinical dietitians, and fitness instructors). These
sessions were held every week during the first month, once a month, over the following five
months, and every other month until the 18th month. All the lifestyle educational programs
were provided at the same intensity to all three groups. To keep the participants motivated,
text messages with relevant information for each assigned intervention group were sent on
fixed time intervals. In addition, a website listing all nutritional and PA information needed
by the participants to continue with the intervention was accessible to the participants
according to their intervention group.
Supplemental Methods 5: H-MRS by Magnetic Resonance scanner
In order to quantify and follow intrahepatic (IHF%) changes, we used H-MRS, a reliable tool
for liver fat quantification [20]. Localized, single-voxel proton spectra were acquired using a
3.0T magnetic resonance scanner (Philips Ingenia, Best, The Netherlands). The
measurements were taken from the right frontal lobe of the liver, with a location determined
individually for each subject using a surface, receive-only phased-array coil. Spectra with and
without water suppression were acquired using the single-voxel stimulated echo acquisition
mode (STEAM) with the following parameters: TR=4000msec, TE=9.0msec, and
TM=16.0msec. The receiver bandwidth was 2000Hz, and the number of data points was
1024. Second-order shimming was used. Four averages were taken in a single breath hold for
an acquisition time of 16 sec. The voxel size varied somewhat according to anatomy but was
approximately 50(AP) × 45(RL) × 54(FH) mm. Water suppression was achieved using the
MOIST (Multiple Optimizations Insensitive Suppression Train) sequence consisting of four
phase-modulated T1 and B1 insensitive pulses with a 50Hz window. Data analyzed using
Mnova software (Mestrelab Research, Santiago de Compostela, Spain) by an experienced
physicist blinded to the intervention groups, who also performed visual quality control of
fitted spectra. The total hepatic fat fraction in the image was determined as the ratio between
the sum of the area under all fat divided by the sum of the area under all fat and water
peaks[21]. Inter-class reliability was tested between two different technicians and resulted in
an average measure of r=0.99 (p<0.001). Intra-class reliability was tested among all baseline
scans and resulted in an average measure of r=0.96 (p<0.001). Liver fat color images were
produced using PRIDE software (by Philips).
Supplemental Methods 6: Further laboratory methodology, anthropometric measurements,
lifestyle, plasma polyphenol assessments, and risk scores calculations
Anthropometric parameters and laboratory methodology
Measurements were taken at baseline, after 6 and 18 months of intervention. Height was
measured to the nearest millimeter using a standard wall-mounted stadiometer. Bodyweight
was measured without shoes to the nearest 0.1kg. WC was measured halfway between the
last rib and the iliac crest to the nearest millimetre by standard procedures using an
anthropometric measuring tape. Two blood pressure (BP) measurements and resting pulse
were recorded after resting, using an automatic BP monitor (Accutorr-4, Datascope) and
calculated as the mean of the two measurements taken. Blood samples were obtained at 8:00
AM after a 12-hour fast. The samples were centrifuged and stored at -80°C. Serum total
cholesterol (TC; Coefficient-of-variation (CV), 1.3%), High-density lipoprotein cholesterol
(HDL-c), LDL-c, and TG (CV, 2.1%) were determined enzymatically with a Cobas-6000
BMJ Publishing Group Limited (BMJ) disclaims all liability and responsibility arising from any relianceSupplemental material placed on this supplemental material which has been supplied by the author(s) Gut
doi: 10.1136/gutjnl-2020-323106–11.:10 2021;Gut, et al. Yaskolka Meir A

3
automatic analyzer (Roche). Plasma levels of high-sensitivity C-reactive protein (hsCRP)
were measured by ELISA (DiaMed; CV, 1.9%). Plasma glucose levels were measured by
Roche GLUC3 (hexokinase method). Plasma insulin levels were measured with an enzyme
immunometric assay (Immulite automated analyzer, Diagnostic Products; CV, 2.5%). The
homeostatic model of insulin resistance (HOMA IR) was calculated as follows:
insulin(µIU/ml)×glucose(mg/dl)/405 [22]. All biochemical analyses were performed at the
University of Leipzig, Germany.
Assessment of nutritional intake and lifestyle habits
Self-reported food frequency questionnaires were administered through a computer at
baseline, after 6 months, and at the end of the trial [23,24], which included intake assessment
of provided items. We followed overall changes in the intake of specific food groups, as
described previously [25] and further used lifestyle and validated PA questionnaire [26]. PA
intensity levels were measured using metabolic equivalent (MET) units [27].
Plasma polyphenols metabolites:
The determination of polyphenol metabolites was performed according to the method of
Vrhovsek et al [28] with some modifications. Briefly, a previously developed targeted
metabolomic method was performed with an ultra-performance liquid chromatographic
system coupled to a tandem mass spectrometry system with electrospray ionization (UHPLC-
ESI-MS/MS). Before injection, samples were thawed at 4 °C. Sample preparation was
performed using an Ostro™ Pass-through 96-well plate to remove phospholipids and proteins
(Waters, Milford, MA, USA). An Ostro™ 96-well plate was fixed on top of a 96-well
collection plate. 50 μl of plasma were pipetted into the wells, followed by the addition of 1%
formic acid in acetonitrile (3:1 solvent/sample). The mixture was then quickly shaken for 5
minutes to promote protein precipitation. Vacuum (15 in. (∼381 mm) Hg) was then applied
to the Ostro plate through a vacuum manifold, filtering out the nonphospholipid plasma
components. This step was repeated twice to ensure protein precipitation. Then, samples were
dried under nitrogen and reconstituted in 100 μl of methanol: water (1:1, v/v), containing
hippuric acid D5 (1 μg/ml) as an external standard. Samples were finally transferred to LC
vials and injected (2 μL) into the UHPLC–MS/MS system. All solvents were kept at 4 °C
prior to their use, and all procedures were carried out in a cold room, assuming that a 4 °C
extraction temperature and the relatively short extraction time (10 min) may be favorable for
avoiding biological sample degradation and reducing the risk of metabolite precipitation.
Quality control (QC) samples were also prepared prior to analysis by pooling a small fraction
of all the individual analyzed samples. Data processing was performed using Waters
MassLynx 4.1 (Waters, Milford, CT, USA) and TargetLynx software (Waters, Milford, CT,
USA). Details of the liquid chromatography and mass spectrometry are described in
Vrhovsek et al[28] and Gasperotti et al [29]. The analysis was performed at the Department
of Food Quality and Nutrition, Research and Innovation Centre, Fondazione Edmund Mach,
Trento. Italy.
Fecal samples collection and 16s rRNA sequencing
Fecal samples were collected at baseline and 18 months at the study site, immediately frozen
to –20°C for 1-3 days, then transferred to –80°C pending DNA extraction. Following
extraction, samples were sequenced on a MiSeq platform following amplification of V3-V4
hypervariable region of the 16S rRNA gene using the primer set 341F/806R, and processed
by the DADA2 pipeline. Rare OTUs (< 3% prevalence of all samples) were filtered out.
Samples of participants prescribed antibiotic therapy 2 months prior to randomization and
samples with less than 103 reads were excluded from the analysis. Analysis was performed at
the Department of Food Quality and Nutrition, Research and Innovation Centre, Fondazione
Edmund Mach, Trento. Italy.
BMJ Publishing Group Limited (BMJ) disclaims all liability and responsibility arising from any relianceSupplemental material placed on this supplemental material which has been supplied by the author(s) Gut
doi: 10.1136/gutjnl-2020-323106–11.:10 2021;Gut, et al. Yaskolka Meir A
4
Supplemental Methods 7: Sample size calculations
We based the sample size calculation on the outcomes of a previous trial that resulted in a
significant reduction in liver fat [30]: 6.7±6.1% reduction in the intervention group
(increasing energy expenditure and reducing caloric intake) vs. 2.1±6.4% reduction in the
control group (encouraged to reduce carbohydrate and fat intake and to engage in physical
activity) with a 4.6 difference, pooled variance of 39.085. Calculation for the sample size
needed for this trial, with a 5% α and a 90% power, suggested 39 participants in each
intervention group. Considering a 14% expected dropout rate (based on our previous
CENTRAL trial [31]), in order to detect differences between intervention groups, we needed
a number of 45 participants in each group, and ultimately recruited a number of 98
participants per group (~90 in each group with a valid MRI scan). Sample size calculations
were performed using Winpepi software, version 11.6.
Supplemental Methods 8: Microbiome statistical analysis
Microbiome composition was assessed based on relative abundance. For composition change,
a change matrix was generated by calculating the log2 ratio between 18m and baseline, for
each taxa and each individual as follows: log2 (18m relative abundance/baseline relative
abundance). Dissimilarity between samples was measured by the UniFrac distance.
Associations between gut microbiome composition and IHF, and IHF% change was assessed
by permutational multivariate analysis of variance (PERMANOVA) with the adonis function
(R “vegan” package), and by comparing principle coordinate scores across IHF% tertiles.
The assess the association between microbiome composition, lifestyle intervention and
IHF%, the principle coordinate vector most highly correlated with IHF% was chosen. The
mediation analysis was performed by employing the meditation analysis suggested by Imai et
al. [32] by the ‘mediate’ package in R (https://cran.r-
project.org/web/packages/mediation/mediation.pdf). Lifestyle intervention was considered a
ranked variable, taking into account the gradual increase of polyphenols, and gradual
decrease in red and processed meat across the groups.
For per-taxa analysis, we first aggregated all fetures to the genus level, and performed quality
control filtering for taxonomic and functional features before including them in the
subsequent analyses. To be qualified for downstream analyses, a taxonomic feature needed to
be detected at a minimum relative abundance of 0.01% in at least 5% of samples. This
analysis yielded 180 microbial species that met the criteria. We employed the R package
MaAsLin 2 1.0.0 to perform per-feature tests taking into account the compositionality of the
data and multiple testing (https://huttenhower.sph.harvard.edu/maaslin2). At first, features
were selected by their association with ln transformed IHF at baseline. In the second phase
features were selected by a model taking into account time, IHF and time*IHF interaction as
fixed effects, with each individual as random effect. In the third phase, features were selected
by a model taking into account group, time and time*group interaction as fixed effects, with
each individual as random effect. All high-dimensional tests were corrected for multiple
hypothesis testing by controlling the false discovery rate (FDR) using the Benjamini-
Hochberg method with a target rate of 0.25 for q values estimated from the per-feature tests.
Supplemental Results 1: Further information regarding the adherence to the intervention
Among the green-MED group, the 18-month daily green tea consumption weighted average
(accounting for the reported consumption after 6 months and the reported consumption after
additional 12 months) was 2.8±1.6/day (median=2.7 cups/day, range 0-8.7) and the weekly
consumption weighted average of Mankai was 2.6±1.8/week (median=2.3 shakes/week,
range 0-7). Serum folate change was correlated with higher weekly Mankai intake (r=0.41,
p<0.001), but not with daily green tea intake (r=0.08, p=0.53). In addition, the green-MED
BMJ Publishing Group Limited (BMJ) disclaims all liability and responsibility arising from any relianceSupplemental material placed on this supplemental material which has been supplied by the author(s) Gut
doi: 10.1136/gutjnl-2020-323106–11.:10 2021;Gut, et al. Yaskolka Meir A

5
and MED groups also similarly reduced their carbohydrates consumption (-27.9%±34.0 and -
29.8%±31.3 respectively, over 18 months; p=0.72) as compared to the HDG group (p=0.03
vs. green-MED and p=0.01 vs. MED). Both MED groups also had similar daily walnuts
amount (p=0.36) and monthly frequency of consumption (p=0.52) and were higher as
compared with the HDG group (p≤0.001 HDG vs. the two MED groups).
BMJ Publishing Group Limited (BMJ) disclaims all liability and responsibility arising from any relianceSupplemental material placed on this supplemental material which has been supplied by the author(s) Gut
doi: 10.1136/gutjnl-2020-323106–11.:10 2021;Gut, et al. Yaskolka Meir A

6
Supplemental Figure 1: Subgroup analysis of IHF% change by the degree of weight
loss/VAT reduction
Date presented as medians, 25th and 75th percentiles of intrahepatic fat. No interactions
between the degree of either weight loss or visceral adipose tissue reduction with either MED
or green-MED diets were observed. Weight loss and visceral adipose tissue reductions
categories are presented as above/below sex-specific median value of 18-month change.
Models adjusted to age and baseline IHF. * p of interaction MED diet with weight/VAT
degree of change. ** p of interaction green-MED diet with weight/VAT degree of change.
BMJ Publishing Group Limited (BMJ) disclaims all liability and responsibility arising from any relianceSupplemental material placed on this supplemental material which has been supplied by the author(s) Gut
doi: 10.1136/gutjnl-2020-323106–11.:10 2021;Gut, et al. Yaskolka Meir A

7
Supplemental Figure 2: A comparison between the per-protocol changes and intention to
treat techniques for the changes in intrahepatic fat (IHF)
(a) Per-protocol analysis
(b) Multiple imputation (MI)
(c) Last observation carried forward (LOCF)
Date presented as medians, 25th and 75th percentiles of intrahepatic fat. Comparing the per-
protocol results to 2 intention to treat techniques (multiple imputation and last observation
carried forward) showed that while the significant differences between the intervention
groups remained, the effect size (measured as the 18-month change in intrahepatic fat) was
reduced, as compared to the per protocol-analysis. This is in accordance with previously
published regarding the conservative nature and potential bias of the last observation carried
forward technique [33].
BMJ Publishing Group Limited (BMJ) disclaims all liability and responsibility arising from any relianceSupplemental material placed on this supplemental material which has been supplied by the author(s) Gut
doi: 10.1136/gutjnl-2020-323106–11.:10 2021;Gut, et al. Yaskolka Meir A

8
Supplemental Figure 3: Subgroup analysis of differences in 18-month IHF% change
(completers).
Date presented as medians, 25th and 75th percentiles of 18-month change in IHF. Generalized
linear models adjusted for baseline IHF%, 18-month weight change, and intervention group
(BMI subgroup differences are adjusted for baseline IHF% and intervention group). The
presence of DM was defined for participants with baseline fasting plasma glucose
levels≥126mg/dL or hemoglobin-A1c levels≥6.5% or if regularly treated with oral
antihyperglycemic medications or exogenous insulin. MS criteria were assessed based on the
National Cholesterol Education Program Adult Treatment Panel III criteria. BMI, body mass
index; DM, diabetes mellitus; IHF, intrahepatic fat. MS, metabolic syndrome; NAFLD, non-
alcoholic fatty liver disease. * denotes significant difference within-group at p<0.05 level.
BMJ Publishing Group Limited (BMJ) disclaims all liability and responsibility arising from any relianceSupplemental material placed on this supplemental material which has been supplied by the author(s) Gut
doi: 10.1136/gutjnl-2020-323106–11.:10 2021;Gut, et al. Yaskolka Meir A

9
Supplemental Figure 4: (a) Red meat consumption change at T18 vs. 18-month total
polyphenol change (tertiles) vs. 18m IHF% change. (b) Red meat consumption change at T18
vs. 18-month serum folic acid change (tertiles) vs. 18m IHF% change.
Date presented as medians, 25th and 75th percentiles of 18-month change in IHF. (a)
Reductions in IHF% were significantly higher (-4.5±6.9% absolute units) in participants who
both reduced red meat consumption and had the greatest increase in plasma polyphenols, as
compared with participants who ate more red meat and had the least change in plasma
polyphenols (2.11±1.4% absolute units; p=0.028 between groups). No interactions between
tertiles of plasma polyphenol change and red meat change were observed. (b) IHF%
reduction was greater among participants who reduced red meat and increased serum folate (-
4.7±6.6%), as compared with participants who did not change red meat intake and had at
least a moderate change in serum folate level (-1.8±7.5%). No interactions between tertiles of
tertiles of serum folate change and red meat change. *significant within group, T0 vs. T18.
Between-group p values are corrected for multiple comparisons. IHF, intrahepatic fat.
BMJ Publishing Group Limited (BMJ) disclaims all liability and responsibility arising from any relianceSupplemental material placed on this supplemental material which has been supplied by the author(s) Gut
doi: 10.1136/gutjnl-2020-323106–11.:10 2021;Gut, et al. Yaskolka Meir A
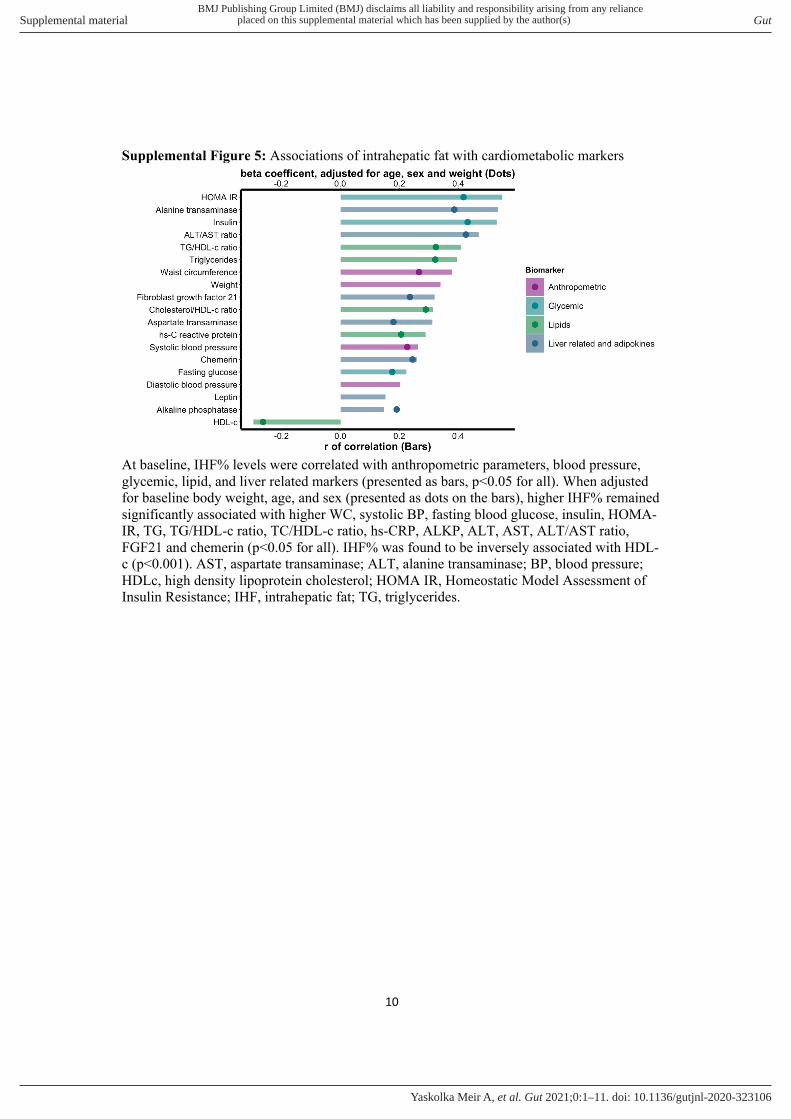
10
Supplemental Figure 5: Associations of intrahepatic fat with cardiometabolic markers
At baseline, IHF% levels were correlated with anthropometric parameters, blood pressure,
glycemic, lipid, and liver related markers (presented as bars, p<0.05 for all). When adjusted
for baseline body weight, age, and sex (presented as dots on the bars), higher IHF% remained
significantly associated with higher WC, systolic BP, fasting blood glucose, insulin, HOMA-
IR, TG, TG/HDL-c ratio, TC/HDL-c ratio, hs-CRP, ALKP, ALT, AST, ALT/AST ratio,
FGF21 and chemerin (p<0.05 for all). IHF% was found to be inversely associated with HDL-
c (p<0.001). AST, aspartate transaminase; ALT, alanine transaminase; BP, blood pressure;
HDLc, high density lipoprotein cholesterol; HOMA IR, Homeostatic Model Assessment of
Insulin Resistance; IHF, intrahepatic fat; TG, triglycerides.
BMJ Publishing Group Limited (BMJ) disclaims all liability and responsibility arising from any relianceSupplemental material placed on this supplemental material which has been supplied by the author(s) Gut
doi: 10.1136/gutjnl-2020-323106–11.:10 2021;Gut, et al. Yaskolka Meir A

11
Supplemental Figure 6: 18-month change in liver related blood biomarkers, across
intervention groups – for participants with valid MRI scans.
Between group p-values are adjusted for age, sex, and baseline level of the biomarker in
interest, using General Linear Model. * significant within group as compared with baseline
levels (p<0.05). AST, aspartate transaminase; ALT, alanine transaminase; ALKP, alkaline
phosphatase; HDG, healthy dietary guidance; MED, Mediterranean.
BMJ Publishing Group Limited (BMJ) disclaims all liability and responsibility arising from any relianceSupplemental material placed on this supplemental material which has been supplied by the author(s) Gut
doi: 10.1136/gutjnl-2020-323106–11.:10 2021;Gut, et al. Yaskolka Meir A

12
Supplemental Figure 7: Association between the top 10 principle coordinates (based on
UniFrac distance of the log2 change matrix) and IHF change (Ln transformed).
Spearman correlation between IHF change and top 10 principle coordinates (x axis). Top
panel shows the correlation coefficient (red line) and bottom panel shows p value (blue line).
Arrows point to the most highly correlated principal coordinate (#5; r=0.25,p=0.001).
BMJ Publishing Group Limited (BMJ) disclaims all liability and responsibility arising from any relianceSupplemental material placed on this supplemental material which has been supplied by the author(s) Gut
doi: 10.1136/gutjnl-2020-323106–11.:10 2021;Gut, et al. Yaskolka Meir A
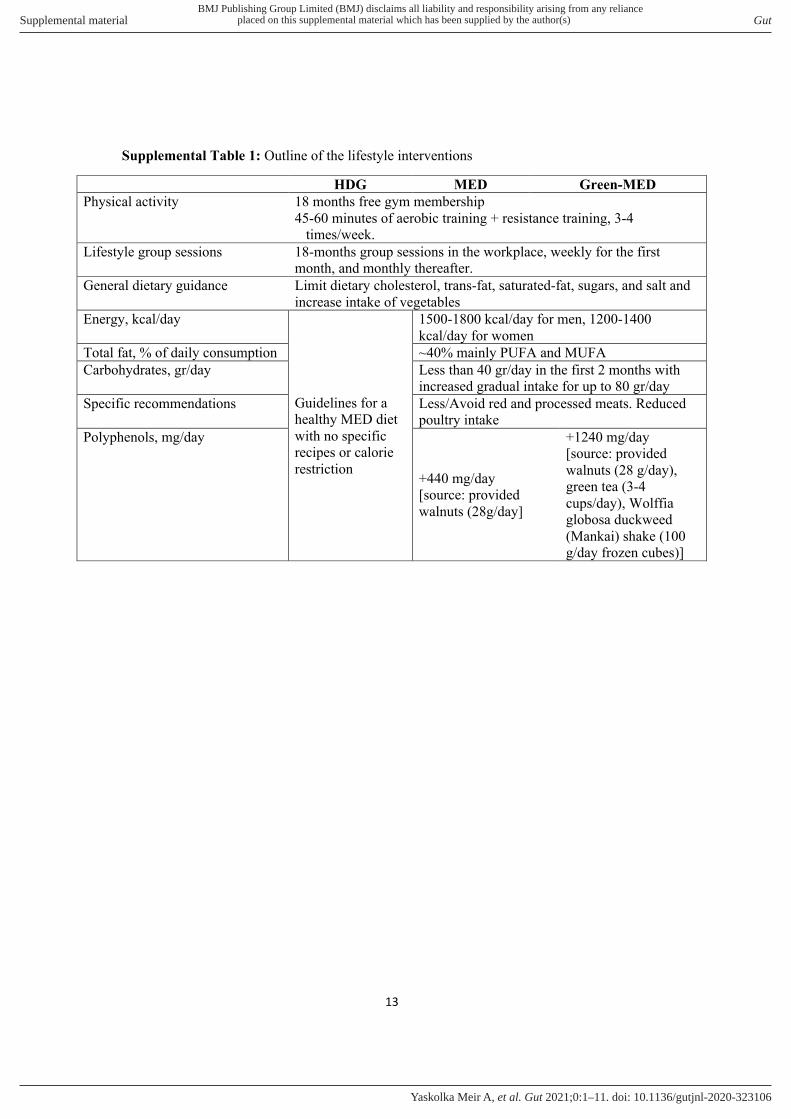
13
Supplemental Table 1: Outline of the lifestyle interventions
Green-MED MED HDG
18 months free gym membership
45-60 minutes of aerobic training + resistance training, 3-4
times/week.
Physical activity
18-months group sessions in the workplace, weekly for the first
month, and monthly thereafter.
Lifestyle group sessions
Limit dietary cholesterol, trans-fat, saturated-fat, sugars, and salt and
increase intake of vegetables
General dietary guidance
1500-1800 kcal/day for men, 1200-1400
kcal/day for women
Guidelines for a
healthy MED diet
with no specific
recipes or calorie
restriction
Energy, kcal/day
~40% mainly PUFA and MUFA Total fat, % of daily consumption
Less than 40 gr/day in the first 2 months with
increased gradual intake for up to 80 gr/day
Carbohydrates, gr/day
Less/Avoid red and processed meats. Reduced
poultry intake
Specific recommendations
+1240 mg/day
[source: provided
walnuts (28 g/day),
green tea (3-4
cups/day), Wolffia
globosa duckweed
(Mankai) shake (100
g/day frozen cubes)]
+440 mg/day
[source: provided
walnuts (28g/day]
Polyphenols, mg/day
BMJ Publishing Group Limited (BMJ) disclaims all liability and responsibility arising from any relianceSupplemental material placed on this supplemental material which has been supplied by the author(s) Gut
doi: 10.1136/gutjnl-2020-323106–11.:10 2021;Gut, et al. Yaskolka Meir A

14
Supplemental Table 2: Lifestyle habits and medications, DIRECT PLUS population,
baseline
HDG
(n=98)
MED
(n=98)
Green-MED
(n=98)
All
(n=294)
p
between
groups1
Smoking, % 19.4 13.3 16.3 16.3 0.51
Shift workers, % 22.4 23.4 23.4 23.1 0.98
PA intensity2,
METs/week
18.4
(11,41)
29.1
(16,50)
24.4
(13,38)
23.5
(12,42)
0.08
Alcohol2, servings/day 0.2
(0.05,0.03)
0.2
(0.05,0.3)
0.2
(0.05,0.3)
0.16
(0.05,0.3)
0.75
Chronic Pharmacotherapy
Anti-hypertensive, % 14.3 11.2 16.3 13.9 0.59
Cholesterol lowering, % 11.2 8.2 14.3 11.2 0.40
Anti-platelet, % 7.1 3.1 9.2 6.5 0.21
Exogenous insulin, % 1.0 1.0 3.1 1.7 0.27
Oral anti-hyperglycemic,
% 6.1 4.1 8.2 6.1 0.49
1 according to the chi-square test, except for MET and alcohol intake (assessed by Kruskal-
Wallis test). 2 Median (25th and 75th percentiles). HDG, healthy dietary guidelines; MED,
Mediterranean.
BMJ Publishing Group Limited (BMJ) disclaims all liability and responsibility arising from any relianceSupplemental material placed on this supplemental material which has been supplied by the author(s) Gut
doi: 10.1136/gutjnl-2020-323106–11.:10 2021;Gut, et al. Yaskolka Meir A

15
Supplemental Table 3: Baseline and 18-month changes in reported dietary intake across
intervention groups
HDG MED Green-MED p between
groups
Macronutrients
Energy
Energy at baseline (kcal/day) 2193±1180.7 2200.2±1119.3 2065.9±955.8 0.63
Energy change from baseline (kcal/day) -336±1046 -666±1021 -544±975 0.73
change from baseline, % -11.6±42.9 -23±27.6 -20±32.0 0.17
Total carbohydrates
% of energy at baseline 45.3±7.0 44.4±8.5 46.3±7.6 0.24
Change in g/d from baseline, % -14.0±36.4 -29.8±31.3 -27.9±34.0 0.003
Protein
% of energy at baseline 20.6±4.0 20.9±4.6 19.9±3.9 0.29
% change out of total energy intake -5.8±58.3 -12.8±38.4 -14.3±40.2 0.6
Total fat
% of energy at baseline 34.5±4.5 35.2±4.7 34.5±5.23 0.45
Change in g/d from baseline, % -7.1±58.5 -15.7±32.0 -10.9±38.4 0.84
Baseline intake of food items, g/day1
Red meat 37.8±31.5 41.8±31.3 40.6±38.7 0.58
Processed meat 13.2±16.6 12.7±12.4 12.3±11.6 0.99
Fish 24.0±22.2 26.6±35.8 19.8±12.7 0.65
Poultry 173.7±138.8 180.4±132.1 152.0±117.7 0.22
Eggs 33.2±28.0 32.0±25.3 33.9±25.9 0.88
Dairy 292.8±250.8 354.7±330.6 286.3±231.0 0.27
Tea (any type) 295.4±380.9 339.5±347.8 327.6±400.4 0.39
Nuts 7.8±9.3 8.6±12.9 8.1±8.6 0.6
Food change frequency2
Red meat
More 5.9 6.7 3.8 0.012 Same 52.9 46.7 28.2
Less 41.2 46.7 67.9
Processed meat
More 0 0 0
BMJ Publishing Group Limited (BMJ) disclaims all liability and responsibility arising from any relianceSupplemental material placed on this supplemental material which has been supplied by the author(s) Gut
doi: 10.1136/gutjnl-2020-323106–11.:10 2021;Gut, et al. Yaskolka Meir A

16
Data are means ± Standard deviations for continuous parameters and percentage for
categorical parameters. 1 Data extracted from reported food intake, not part of a recipe. 2 Self-
reported as compared with the last food change questionnaire.
Same 37.6 34.7 28.2 0.43
Less 62.4 65.3 71.8
Fish
More 63.5 69.3 74.4 0.55 Same 35.3 28.0 24.4
Less 1.2 2.7 1.3
Poultry
More 27.1 41.3 26.9 0.002 Same 61.2 52.0 46.2
Less 11.8 6.7 26.9
Eggs and dairy
More 15.3 36.0 35.9 0.02 Same 72.9 56.0 53.8
Less 11.8 8.0 10.3
Green Tea
More 31.8 37.3 82.1 <0.001 Same 58.8 53.3 15.4
Less 9.4 9.2 2.6
Nuts
More 32.9 60.0 56.4 <0.001 Same 61.2 30.7 28.2
Less 5.9 9.3 15.4
BMJ Publishing Group Limited (BMJ) disclaims all liability and responsibility arising from any relianceSupplemental material placed on this supplemental material which has been supplied by the author(s) Gut
doi: 10.1136/gutjnl-2020-323106–11.:10 2021;Gut, et al. Yaskolka Meir A

17
Supplemental Table 4: Weekly walnut consumption and frequency (reported, time 18):
HDG MED Green-MED p between
groups1
p between
MED
groups1
Amount of
consumption
<0.001 0.36 Few 53 16 11
28 g/day 23 46 56
Bunch 8 11 9
Frequency of
consumption
<0.001 0.52
less than once a
month or never 25 7 6
1-3 times/month 21 14 8
1-2 times/week 19 12 10
3-4 times/week 8 8 14
5-6 times/week 4 13 12
every day 3 12 19
2-3 times/day 4 6 7
4-5 times/day 0 1 0 1 Test by Chi-Square test. HDG, healthy dietary guidelines; MED, Mediterranean.
BMJ Publishing Group Limited (BMJ) disclaims all liability and responsibility arising from any relianceSupplemental material placed on this supplemental material which has been supplied by the author(s) Gut
doi: 10.1136/gutjnl-2020-323106–11.:10 2021;Gut, et al. Yaskolka Meir A

18
Supplemental Table 5: Genus level bacteria associated with IHF, IHF change and lifestyle
intervention.
Baseline
associations
Genus Level
bacteria Coefficient
Standard
error p value q value
IHF Fournierella -0.0003709 7.65E-05 2.33E-06 0.00041326
IHF Anaerosporobacter -0.0002198 6.36E-05 0.00064969 0.05041708
IHF Lachnospiraceae_U
CG-003 -0.0001376 4.07E-05 0.00085453 0.05041708
IHF Ruminococcaceae_
UCG-009 -5.34E-05 1.77E-05 0.00276759 0.12246594
IHF Ruminococcaceae_
UCG-014 -0.0043576 0.00155184 0.00542229 0.19194916
IHF Erysipelotrichaceae
_UCG-003 0.00154705 0.00059427 0.00984842 0.21805458
IHF Ruminococcaceae_
UCG-008 -0.0001195 4.59E-05 0.00985557 0.21805458
IHF Ruminococcaceae_
UCG-010 -0.0008363 0.0003195 0.00945633 0.21805458
IHF Ruminococcaceae_
UCG-002 -0.0040148 0.00158245 0.01185459 0.23314025
18-month
change
IHF Erysipelotrichaceae
_UCG-003 0.04734104 0.01450464 0.00119285 0.01610349
IHF Fournierella -0.0058954 0.00173597 0.00075311 0.01610349
IHF Anaerosporobacter -0.006328 0.00226281 0.00541248 0.04517776
Time*IHF
interaction Fournierella 0.00466757 0.00185459 0.01254249 0.05707647
Time*IHF
interaction
Ruminococcaceae_
UCG-008 -0.0090038 0.0038452 0.01982263 0.07645871
IHF Ruminococcaceae_
UCG-010 -0.0079535 0.00435396 0.06847972 0.16808659
IHF Lachnospiraceae_U
CG-003 -0.0033651 0.00179764 0.06193927 0.16808659
Time*IHF
interaction
Lachnospiraceae_U
CG-003 0.0043736 0.00223972 0.05182528 0.16808659
Time*IHF
interaction Anaerosporobacter 0.00495938 0.00278814 0.07676383 0.17271863
Time*IHF
interaction
Ruminococcaceae_
UCG-009 0.00576984 0.00336781 0.08760905 0.18195725
IHF Ruminococcaceae_
UCG-014 -0.0216027 0.01302554 0.09799635 0.18899296
Change by
Lifestyle
intervention time*Green-
MED
interaction
Fournierella -0.0298969 0.01024317 0.00389043 0.15561715
BMJ Publishing Group Limited (BMJ) disclaims all liability and responsibility arising from any relianceSupplemental material placed on this supplemental material which has been supplied by the author(s) Gut
doi: 10.1136/gutjnl-2020-323106–11.:10 2021;Gut, et al. Yaskolka Meir A

19
IHF, intrahepatic fat; MED, Mediterranean.
References
1 Regueiro J, Sánchez-González C, Vallverdú-Queralt A, et al. Comprehensive
identification of walnut polyphenols by liquid chromatography coupled to linear ion
trap–Orbitrap mass spectrometry. Food Chem 2014;152:340–8.
2 Sánchez-González C, Ciudad CJ, Noe V, et al. Health benefits of walnut polyphenols:
An exploration beyond their lipid profile. Crit Rev Food Sci Nutr 2017;57:3373–83.
3 García-Conesa M-T, Chambers K, Combet E, et al. Meta-Analysis of the Effects of
Foods and Derived Products Containing Ellagitannins and Anthocyanins on
Cardiometabolic Biomarkers: Analysis of Factors Influencing Variability of the
Individual Responses. Int J Mol Sci 2018;19:694.
4 Pérez-Jiménez J, Neveu V, Vos F, et al. Identification of the 100 richest dietary
sources of polyphenols: an application of the Phenol-Explorer database. Eur J Clin
Nutr 2010;64:S112–20.
5 Manach C, Scalbert A, Morand C, et al. Polyphenols: food sources and bioavailability.
Am J Clin Nutr 2004;79:727–47.
6 Huang J, Wang Y, Xie Z, et al. The anti-obesity effects of green tea in human
intervention and basic molecular studies. Eur J Clin Nutr 2014;68:1075–87.
doi:10.1038/ejcn.2014.143
7 Zheng XX, Xu YL, Li SH, et al. Green tea intake lowers fasting serum total and LDL
cholesterol in adults: a meta-analysis of 14 randomized controlled trials. Am J Clin
Nutr 2011;94:601–10. doi:10.3945/ajcn.110.010926 [doi]
8 Hooper L, Kroon PA, Rimm EB, et al. Flavonoids, flavonoid-rich foods, and
cardiovascular risk: a meta-analysis of randomized controlled trials. Am J Clin Nutr
2008;88:38–50. doi:88/1/38 [pii]
9 Park S-K, Jung I-C, Lee WK, et al. A combination of green tea extract and l-theanine
improves memory and attention in subjects with mild cognitive impairment: a double-
blind placebo-controlled study. J Med Food 2011;14:334–43.
10 Wightman EL, Haskell CF, Forster JS, et al. Epigallocatechin gallate, cerebral blood
time*MED
interaction
Ruminococcaceae_
UCG-014 0.10581789 0.04643635 0.02362381 0.18899047
time*Green-
MED
interaction
Ruminococcaceae_
UCG-014 0.09732996 0.04785686 0.04316678 0.21583388
BMJ Publishing Group Limited (BMJ) disclaims all liability and responsibility arising from any relianceSupplemental material placed on this supplemental material which has been supplied by the author(s) Gut
doi: 10.1136/gutjnl-2020-323106–11.:10 2021;Gut, et al. Yaskolka Meir A

20
flow parameters, cognitive performance and mood in healthy humans: a double‐blind,
placebo‐controlled, crossover investigation. Hum Psychopharmacol Clin Exp
2012;27:177–86.
11 Bhanthumnavin K, Mcgarry MG. Wolffia arrhiza as a possible source of inexpensive
protein. Nature 1971;232:495.
12 Kaplan A, Zelicha H, Tsaban G, et al. Protein bioavailability of Wolffia globosa
duckweed, a novel aquatic plant – A randomized controlled trial. Clin Nutr 2019;38.
doi:10.1016/j.clnu.2018.12.009
13 Yan Y, Candreva J, Shi H, et al. Survey of the total fatty acid and triacylglycerol
composition and content of 30 duckweed species and cloning of a Δ6-desaturase
responsible for the production of γ-linolenic and stearidonic acids in Lemna gibba.
BMC Plant Biol 2013;13:201.
14 Appenroth K-J, Sree KS, Böhm V, et al. Nutritional value of duckweeds (Lemnaceae)
as human food. Food Chem 2017;217:266–73. doi:10.1016/j.foodchem.2016.08.116
15 Daduang J, Daduang S, Hongsprabhas P, et al. High phenolics and antioxidants of
some tropical vegetables related to antibacterial and anticancer activities. African J
Pharm Pharmacol 2011;5:608–15.
16 Edelman M, Colt M. Nutrient value of leaf vs. seed. Front Chem 2016;4:32.
17 Meir AY, Tsaban G, Zelicha H, et al. A green-Mediterranean diet, supplemented with
Mankai duckweed, preserves iron-homeostasis in humans and is efficient in reversal of
anemia in rats. J Nutr 2019;149:1004–11.
18 Sela I, Yaskolka Meir A, Brandis A, et al. Wolffia globosa–Mankai Plant-Based
Protein Contains Bioactive Vitamin B12 and Is Well Absorbed in Humans. Nutrients
2020;12:3067.
19 Zelicha H, Kaplan A, Meir AY, et al. The Effect of Wolffia globosa Mankai, a Green
Aquatic Plant, on Postprandial Glycemic Response: A Randomized Crossover
Controlled Trial. Diabetes Care 2019;42:1162–9.
20 Kukuk GM, Hittatiya K, Sprinkart AM, et al. Comparison between modified Dixon
MRI techniques, MR spectroscopic relaxometry, and different histologic quantification
methods in the assessment of hepatic steatosis. Eur Radiol 2015;25:2869–79.
21 Hu HH, Kim H, Nayak KS, et al. Comparison of fat–water MRI and single‐voxel MRS
in the assessment of hepatic and pancreatic fat fractions in humans. Obesity
2010;18:841–7.
22 Matthews DR, Hosker JP, Rudenski AS, et al. Homeostasis model assessment: insulin
resistance and β-cell function from fasting plasma glucose and insulin concentrations
in man. Diabetologia 1985;28:412–9.
23 Shai I, Shahar DR, Vardi H, et al. Selection of food items for inclusion in a newly
developed food-frequency questionnaire. Public Health Nutr 2004;7:745–
9.http://www.ncbi.nlm.nih.gov/pubmed/15369612 (accessed 3 Jun 2019).
24 Shai I, Rosner BA, Shahar DR, et al. Dietary Evaluation and Attenuation of Relative
Risk: Multiple Comparisons between Blood and Urinary Biomarkers, Food Frequency,
and 24-Hour Recall Questionnaires: the DEARR Study. J Nutr 2005;135:573–9.
doi:10.1093/jn/135.3.573
25 Gepner Y, Golan R, Harman-Boehm I, et al. Effects of initiating moderate alcohol
intake on cardiometabolic risk in adults with type 2 diabetes: a 2-year randomized,
controlled trial. Ann Intern Med 2015;163:569–79.
26 Chasan-Taber S, Rimm EB, Stampfer MJ, et al. Reproducibility and validity of a self-
administered physical activity questionnaire for male health professionals.
Epidemiology 1996;:81–6.
27 Ainsworth BE, Haskell WL, Herrmann SD, et al. 2011 Compendium of Physical
BMJ Publishing Group Limited (BMJ) disclaims all liability and responsibility arising from any relianceSupplemental material placed on this supplemental material which has been supplied by the author(s) Gut
doi: 10.1136/gutjnl-2020-323106–11.:10 2021;Gut, et al. Yaskolka Meir A
21
Activities: a second update of codes and MET values. Med Sci Sports Exerc
2011;43:1575–81. doi:10.1249/MSS.0b013e31821ece12 [doi]
28 Vrhovsek U, Masuero D, Gasperotti M, et al. A versatile targeted metabolomics
method for the rapid quantification of multiple classes of phenolics in fruits and
beverages. J Agric Food Chem 2012;60:8831–40.
29 Gasperotti M, Masuero D, Guella G, et al. Development of a targeted method for
twenty-three metabolites related to polyphenol gut microbial metabolism in biological
samples, using SPE and UHPLC–ESI-MS/MS. Talanta 2014;128:221–30.
30 Wong VW-S, Chan RS-M, Wong GL-H, et al. Community-based lifestyle
modification programme for non-alcoholic fatty liver disease: a randomized controlled
trial. J Hepatol 2013;59:536–42.
31 Gepner Y, Shelef I, Schwarzfuchs D, et al. Effect of distinct lifestyle interventions on
mobilization of fat storage pools: CENTRAL magnetic resonance imaging randomized
controlled trial. Circulation 2018;137:1143–57.
32 Imai K, Tingley D, Yamamoto T. Experimental designs for identifying causal
mechanisms. J R Stat Soc Ser A Stat Soc 2013;176:5–51. doi:10.1111/j.1467-
985X.2012.01032.x
33 Schindler TM, Bridge H. The perils of the unknown: Missing data in clinical studies.
Med Writ 2018;27:56–9.
BMJ Publishing Group Limited (BMJ) disclaims all liability and responsibility arising from any relianceSupplemental material placed on this supplemental material which has been supplied by the author(s) Gut
doi: 10.1136/gutjnl-2020-323106–11.:10 2021;Gut, et al. Yaskolka Meir A