Embed Size (px)
Citation preview

EFFECT OF FABRIC STRUCTURE ON THE LIQUID TRANSPORT
CHARACTERISTICS OF NONWOVEN WOUND DRESSINGS
NINGTAO MAO
BSc., MSc.
Submitted in accordance with the requirements for the degree of Doctor of Philosophy
The University o f Leeds School of Textile Industries
Dec. 2000
The candidate confirms that the work submitted is his own and that appropriate credit has been given where reference has been made to the work o f others

I Acknowledgement
ACKNOWLEDGEMENTS
The author wishes to express his sincere gratitude and appreciation to Dr. Russell for his
supervision, consistent advice and invaluable assistance in every area throughout this
research.
Thanks are due to Mr. Philips for the assistance in constructing the instruments; and to
Dr. Bandara and Mr. Abadi for their assistance in constructing the electronic circuits and
commissioning the system; to Mr. Hampshaw, Mr. Rathod and Dr. Ahmed for the
assistance in production of fabric samples.
My thanks also are given to Professor Hoyle in Electrical and Electronic Engineering
Department for his helpful advice about the capacitance transducer.
The financial support of the ORS scholarship, Tetley and Lupton scholarship and the
Departmental Scholarship are gratefully acknowledged.
Special thanks are due to my dear wife, Jieqing, and my lovely son, Sida, for their great
support and consistent encouragement during the course of this work. Special thanks are
also given to my dear sister for her help. Thanks are also given to my parents, parents-
in-law and other family members and my friends for their great support.

i Abstract
ABSTRACT
Nonwoven materials are widely used in medical and hygiene applications, and may
demonstrate significant anisotropic characteristics in liquid transport. This study
investigates the anisotropic liquid transport in such structures, and establishes a
relationship between the structure and anisotropic properties of liquid transport.
A com prehensive literature review is concerned with previous work on liquid transport
in general with particular reference to its importance in the function o f wound dressings.
Preliminary experiments using commercial nonwoven wound dressing fabrics
demonstrated the anisotropic nature o f liquid absorption. After a review o f existing
steady state and dynamic methods of measuring the liquid transport in fabrics, a novel
com puter-integrated instrument is described that measures the in-plane liquid
transmission in up to eight different directions. N eedle-punched and hydroentangled
fabrics with different structural parameters (fibre type, fibre diameter, fabric porosity
and fibre orientation) were produced and characterised. The anisotropic liquid transport
properties of these fabrics were tested using the new instrument. Unique theoretical
models were established to predict the specific directional perm eability o f nonwoven
fabrics based on the main fabric structural parameters (fibre diameter, fabric porosity
and fibre orientation distribution).

i Table of Contents
T A B L E O F C O N T E N T S
ACKNOWLEDGEMENTS....................................................................................................I
ABSTRACT................................................................................................................................ I
TABLE OF CONTENTS........................................................................................................ I
LIST OF FIG URES................................................................................................................. I
LIST OF TA BLES................................................................................................................... I
SYMBOLS AND NOTATIONS............................................................................................ I
CHAPTER 1 INTRODUCTION AND REVIEW OF LITERATURE................... 1
1.1 IN TRO DUCTIO N.................................................................................................................1
1.2 REQUIREM ENTS OF AN OPTIMUM W OUND DRESSING AND THE
IM PORTANCE OF LIQUID TRA N SPO RT.................................................................3
1.2.1 Introduction to W ound H ealing................................................................................. 3
1.2.2 W ound Healing Under D ressings..............................................................................4
1.2.2.1 M echanism of W ound Healing and the Function o f W ound Dressings.. 4
1.2.2.2 Factors Influencing W ound H ealing .............................................................. 8
1.2.3. Types of W ound D ressing............................................................................................9
1.2.3.1 Occlusive D ressings.............................................................................................10
1.2.3.2 Absorbent D ressings.......................................................................................... 12
1.2.4 The Optimum Wound D ressing ................................................................................14
1.3 APPLICATION OF NONW OVENS IN W OUND D R E SSIN G S........................17
1.3.1 Nonwoven Wound Dressing M aterials................................................................... 17
1.3.2 Trends in W ound Dressing Technology.................................................................. 20
1.4 NONW OVEN FABRIC STRUCTURES AND LIQUID TRA N SPO RT............21
1.4.1 M echanically Bonded Nonwoven Structures.........................................................21
1.4.1.1 The Fibre Orientation Distribution (FO D )..................................................... 23
1.4.1.2 Porosity, Pore Size Distribution (PSD) and Porosim etry........................... 24
1.4.2 Liquid Transport Properties in Nonwovens Related to W ound Dressings .... 25

ii Table of Contents
1.4.2.1 Liquid Transport and Perm eability ..................................................................25
1.4.2.2 W ettability and W ickability ...............................................................................27
1.4.2.3 Liquid Absorption as Unsteady State Flow .................................................. 32
1.5 SUM M ARY AND THE OBJECTIVES OF THE PRESENT R E SE A R C H ......34
C H A P T E R 2 P R E L IM IN A R Y STU D IES: L IQ U ID T R A N SPO R T IN
N O N W O V EN W O U ND D R ESSIN G F A B R IC S 36
2.1 IN TRO DU CTION ..............................................................................................................36
2.2 THE VERTICAL AND HORIZONTAL STRIP T E S T .......................................... 37
2.3. MODELS OF LIQUID ABSORPTION IN NONW OVEN FABRICS DURING
THE STRIP TE ST.............................................................................................................. 38
2.3.1 Theoretical M odels of Liquid Absorption in Nonwoven F ab ric s ....................38
2.3.1.1 The Hydrodynamic M o d el.................................................................................39
2.3.1.2 D arcy’s L aw ...........................................................................................................43
2.3.2 The Empirical Model for the Vertical Strip T e s t ................................................. 44
2.4 DETERM INATION OF THE ANISOTROPY OF PERM EABILITY IN
NONW OVENS USING THE VERTICAL STRIP T E S T .......................................44
2.5. PRELIM INARY EX PERIM EN TS...............................................................................46
2.5.1. Structural Characteristics of Commercial W ound Dressing Fabrics..............46
2.5.2 Liquids Used During T esting .....................................................................................47
2.5.3. Description of the Experimental Strip Test Procedure.......................................48
2.5.3.1 The Vertical Strip Test Procedure.................................................................... 48
2.5.3.2. The Horizontal Strip Test Procedure.............................................................. 48
2.5.4 Porosity and Absorbency of Commercial Nonwoven Wound Dressing Fabrics
.......................................................................................................................................... 49
2.5.5 Anisotropy of Liquid Absorption in the Commercial D ressings..................... 51
2.5.5.1 Vertical Strip Test Results.................................................................................. 51
2.5.5.2 Horizontal Strip Test R esu lts ............................................................................ 55
2.6 SUMMARY OF PRELIM INARY STUDIES AND CO N SID ERA TIO N S.......57

iii Table of Contents
C H A P T E R 3 D E V E L O PM E N T O F AN IN ST R U M E N T TO M EA SU R E T H E
A N ISO T R O PY O F LIQ U ID T R A N SPO R T IN N O N W O V EN
D R ESSIN G F A B R IC S ................................................................................. 59
3.1 COM PARISON OF M EASUREM ENT M ETHODS FOR THE ASSESSM ENT
OF LIQUID TRANSPORT IN FA B R IC S...................................................................60
3.1.1 Definition of T erm s......................................................................................................60
3.1.1.1 Cross-Plane Liquid Flow and In-Plane Liquid F lo w .................................. 60
3.1.1.2 Liquid Absorption and Forced Flow in F ab rics ............................................60
3.1.1.3 Steady State and Dynamic M easurem ents.....................................................61
3.1.2 Steady-State M easurement M ethods.......................................................................62
3.1.2.1 The Longitudinal W icking "Strip" T e s t..........................................................62
3.1.2.2 Demand Absorbency Test ................................................................................. 64
3.1.2.3 Areal W icking "Spot" T est................................................................................. 66
3.1.2.4 Syphon T est............................................................................................................ 67
3.1.3 Dynamic M easurement M ethods..............................................................................68
3.1.3.1 M odified Laser-Doppler Anemometry (M L D A )......................................... 69
3.1.3.2 Electrical Capacitance Techniques................................................................... 70
3.1.3.3 Electronic M icro-balance M ethod.................................................................... 72
3.1.3.4 M easurement Using Image A nalysis............................................................... 75
3.1.4 Summary of the Requirements of a New M ethod for the M easurement of
Liquid Transport in Nonwoven F abrics .................................................................79
3.2 DESIGN OF THE SYSTEM ...........................................................................................80
3.2.1 Description of the Capacitance Transducers..........................................................80
3.2.2 A lignment of the Capacitance S egm ents................................................................83
3.2.3 Guard Ring Surrounding the Electrical F ield ........................................................ 83
3.2.4 M ethod o f Introducing Liquid to the Fabric...........................................................84
3.2.5 Fabric Support M esh ....................................................................................................85
3.3 ELECTRONIC COMPONENTS USED IN THE SY STEM .................................. 86
3.3.1 Signal Conditioning U n it ............................................................................................86
3.3.1.1 Signal Amplitude M odulation and the Resistance-Capacitance Bridge . 86
3.3.1.2 From Signals to Digital D ata............................................................................. 90

iv Table of Contents
3.4 SOFTW ARE FLOW C H A R T ........................................................................................91
3.5 OPERATING PRINCIPLES OF THE SY ST EM ...................................................... 93
3.5.1 Capacitance and Dielectric Constant of M aterials............................................... 93
3.5.2 Calculated Capacitance of the Transducer............................................................. 96
3.6 CALIBRATION OF THE SY STEM ............................................................................ 97
3.7 FACTORS AFFECTING THE MEASURED RESULTS AND SENSITIVITY
OF THE SY ST EM .............................................................................................................98
3.7.1 Fabric T hickness...........................................................................................................98
3.7.2 Uniformity of Fabric Thickness................................................................................99
3.7.3 Fabric Placement in the S ystem ............................................................................. 100
3.8 M EASUREM ENT OF THE ANISOTROPY OF LIQUID TRANSPORT IN
FABRICS USING THE SY ST E M ............................................................................. 101
3.8.1 Measurement Procedure........................................................................................... 101
3.8.2 Description of the M easured R esu lts .................................................................... 103
3.8.3 M easurement of the Anisotropy of Permeability and Liquid Absorption.... 105
3.9 ANALYSIS OF DATA PRODUCED BY THE NEW SY ST EM ...................... 106
3.9.1 Two-Dimensional Liquid Flow in Isotropic S tructu res................................... 106
3.9.1.1 Liquid Flow Under Constant P ressure..........................................................106
3.9.1.2 Liquid Flow at a Constant Volumetric Flow Rate at the Liquid Source
P o in t...................................................................................................................... 108
3.9.2 Two-Dimensional Liquid Flow in Anisotropic Structures...............................108
3.9.3 M easurement of the Anisotropy of the Liquid Flow in Anisotropic Fabric
Structures Using Data from the Capacitance Transducers..............................112
3.9.3.1 Liquid Flow in Anisotropic Structures Under Constant P ressure......... 113
3.9.3.2 Liquid Flow in Anisotropic Structures at a Constant Volumetric Flow
R ate.........................................................................................................................114
3.9.4 Anisotropy of Liquid Transport in Nonwoven Fabric Structures M easured
Using the New System .............................................................................................115
CHAPTER 4 THE PREPARATION OF NONWOVEN FABRIC SAMPLES
AND THE CHARACTERISATION OF THE FABRIC
STRUCTURE.......................................................................................... 117

V Table of Contents
4.1 PURPOSE OF THE EXPERIM ENTAL W O RK.....................................................117
4.2 THE EXPERIM ENTAL P L A N ................................................................................... 118
4.2 GENERAL CONSIDERATIONS IN THE DESIGN OF THE FABRIC
SA M PLES..........................................................................................................................121
4.3 FABRIC M ANUFACTURING PROCEDURE....................................................... 122
4.3.1 Experimental A pproach............................................................................................ 122
4.3.2 Machine Param eters.................................................................................................. 123
4.4 M EASUREM ENT OF FABRIC STRUCTURAL CH A RA CTERISTICS......124
4.4.1 Thickness M easurement ( d ) .................................................................................... 124
4.4.2 Mass Per Unit Area (W )............................................................................................125
4.4.3 Porosity ( Pf ) ............................................................................................................... 127
4.4.4 Measurement o f Fabric A bsorbency..................................................................... 128
4.4.5 Fabric Absorbency and Fabric Porosity................................................................129
4.4.6 Measurement o f the Fibre Orientation Distribution Using Image Analysis 129
4.4.6.1 Review of Techniques for Measuring Fibre Orientation Distribution ..131
4.4.6.2 Introduction of the Quantimet 570 S ystem ................................................. 132
4.4.6.3 Operating Principles of the Quantimet 570 ................................................. 133
4.4.6.4 Measurement of the Fibre Orientation Distribution in the Experimental
Nonwoven Fabrics..............................................................................................133
4.4.6.5 Fibre Orientation Distributions o f the Experimental Fabrics..................134
4.5 STRUCTURAL CHARACTERISTICS OF THE EXPERIM ENTAL
NONW OVEN FABRICS............................................................................................... 138
4.5.1 Characteristics of the Unbonded Web S tructures..............................................138
4.5.2 Characteristics of the Needlepunched Non woven S tructures.........................139
4.5.3 Characteristics of Hydroentangled Fabric Structures........................................ 142
CHAPTER 5 THE EFFECT OF FABRIC STRUCTURAL PARAMETERS ON
THE ANISOTROPY OF LIQUID TRANSPORT IN
NONWOVEN WOUND DRESSING FABRICS............................ 146
5.1 DEFINITION OF TER M S.............................................................................................146
5.1.1 Anisotropy of Perm eability......................................................................................146

vi Table of Contents
5.1.2 Anisotropy o f Liquid A bsorption........................................................................... 147
5.2 DETERM INATION OF THE ANISOTROPY OF PERM EABILITY AND
LIQUID ABSORPTION FROM THE EXPERIM ENTAL D A T A ....................148
5.2.1 Stage 1 ...........................................................................................................................148
5.2.2 Stage 2 ...........................................................................................................................148
5.2.3 Stage 3 ........................................................................................................................... 149
5.2.4 Stage 4 ........................................................................................................................... 149
5.2.5 Stage 5 ........................................................................................................................... 149
5.2.6 Stage 6 ........................................................................................................................... 149
5.3 STUDY OF THE ANISOTROPY OF PERM EABILITY AND LIQUID
ABSORPTION IN THE EXPERIM ENTAL F A B R IC S ....................................... 150
5.3.1 M easurement Conditions.......................................................................................... 150
5.3.1.1 Set-up of the Measuring S ystem .................................................................... 150
5.3.1.2 Fabrics Used for Evaluation............................................................................ 150
5.3.2 Experimental Results................................................................................................. 151
5.3.2.1 Measured Results of Anisotropy of Permeability: Forced Liquid Flow
Through the Fabrics at a Constant Flow R ate .............................................151
5.3.2.2 Measured Results of the Anisotropy of Liquid Absorption in the Fabrics
due to Capillary Pressure.................................................................................. 152
5.4 OBSERVATIONS ON THE INFLUENCE OF FABRIC STRUCTURAL
PARAMETERS ON THE ANISOTROPY OF LIQUID TR A N SPO R T......... 168
5.4.1 The Influence o f Nonwoven Fabric Structure on the Anisotropy of
Perm eability ................................................................................................................168
5.4.1.1 Effect of the Fibre Orientation D istribution................................................ 168
5.4.1.2 Effect of Bonding M ethod................................................................................ 170
5.4.1.3 Effect of Fibre Type and Fibre Fineness on the Anisotropy of
Perm eability ........................................................................................................ 172
5.4.1.4 Effect of Fabric Porosity on the Anisotropy o f Perm eability..................175
5.4.2 The Influence of Fabric Structural Parameters on the Anisotropy of Liquid
A bsorption................................................................................................................... 176

vii Table of Contents
5.4.2.1 The Anisotropy of Liquid Absorption and the Anisotropy o f Permeability
.................................................................................................................................177
5.4.2.2 The Effect o f Fibre Type and Fibre Fineness on the Anisotropy o f Liquid
A bsorption............................................................................................................178
5.4.2.3 The Effect o f Porosity on the Anisotropy of Liquid A bsorp tion ...........180
5.4.3 Comparison o f the Anisotropy o f Liquid Transport in the Experimental and
Commercial F ab rics................................................................................................. 181
CHAPTER 6 THEORETICAL ANALYSIS OF THE DIRECTIONAL
PERMEABILITY IN HOMOGENEOUS NONWOVEN
STRUCTURES........................................................................................185
6.1 RELATIONSHIP BETW EEN DIRECTIONAL PERM EABILITY AND FIBRE
O RIEN TA TIO N ............................................................................................................... 185
6.2 BACKGROUND CO NSID ERA TIO N S.................................................................... 186
6.3 THEORETICAL BA CK G RO U N D ............................................................................ 187
6.3.1 Drag Force Theory in Isotropic Fibrous M aterials.............................................188
6.3.2 Drag Force Theory in Unidirectional Fibrous M aterials.................................. 188
6.4 DIRECTIONAL PERM EABILITY IN HOM OGENEOUS ANISOTROPIC
FIBROUS M A T ER IA LS............................................................................................... 189
6.4.1 A ssum ptions.................................................................................................................189
6.4.2 Development of the Alternative Theory............................................................... 191
6.4.3 Directional Permeability in Structures with Variable Fibre A lignm ent.......195
6.4.4 Directional Permeability in Three-dimensional S tructures............................. 197
6.5 CONSIDERATION OF STRUCTURES WITH SPECIFIC FIBRE
ORIENTATION PR O FIL E S ........................................................................................ 198
6.5.1 Homogenous Isotropic Fibrous Structures...........................................................198
6.5.2. Structures with Unidirectional Fibre A lignm ent............................................... 200
6.5.3 Structures with Fibre Alignment in Two Orthogonal D irections...................201
6.5.4 Structures with Fibres Aligned in a Complex Statistical D istribution......... 204
6.5.5 Directional Permeability in Needlepunched and Hydroentangled Nonwoven
F ab rics .......................................................................................................................... 205

viii Table of Contents
6.6 COM PARISON OF EXISTING MODELS OF PERM EABILITY W ITH THE
NEW M O D EL...................................................................................................................207
6.6.1 Specific Permeability and the Permeability C oeffic ien t.................................. 207
6.6.2 Permeability in Isotropic Fibrous M edia.............................................................. 208
6.6.3 Permeability in Unidirectional S tructures............................................................212
6.7 PREDICTED AND MEASURED ANISOTROPY OF PERM EABILITY IN
EXPERIM ENTAL NONWOVEN STRU CTU RES............................................... 213
6.7.1 Predicted and Measured Anisotropy of Permeability in Unbonded Webs... 213
6.7.2. Anisotropy of Permeability in Non-homogeneous Nonwoven Structures.. 217
6.8 SUMMARY OF THE NEW M ODELS..................................................................... 220
CHAPTER 7 CONCLUSIONS AND SUGGESTIONS FOR FURTHER WORK
......................................................................................................................223
7.1 CONCLUSIONS.............................................................................................................. 223
7.2 SUGGESTIONS FOR FURTHER W O R K .............................................................. 226
APPENDIX I MODIFIED ROUTINE FOR MEASURING FIBRE
ORIENTATION DISTRIBUTIONS IN IMAGE ANALYSER.. 228
APPENDIX II ELECTRONIC CIRCUITS........................................................... 233
APPENDIX III DRAG FORCE ON A SINGLE FIBRE.....................................233
REFERENCES.....................................................................................................................234

I List of Figures
LIST OF FIGURES
Figure 2 .1 Liquid absorbency vs. porosity for commercial nonwoven wound
dressing fabrics 50
Figure 2. 2 Plots of rise height vs. time for commercial wound dressing fabrics 54
Figure 2. 3 Plots of rise height vs. time for commercial wound dressings 56
Figure 3 .1 Steady-state testing methods............................................................................ 63
Figure 3. 2 Instrument for measuring demand wettability.......................................... 65
Figure 3. 3 Block diagram of Modified Laser Doppler Anemomter (M LD A)........70
Figure 3. 4 Block diagram of electrical capacitance technique....................................71
Figure 3. 5 Electrical micro-balance method for measuring liquid absorption......73
Figure 3. 6 Block diagram of GATS technique................................................................74
Figure 3. 7 Demand wettability test................................................................................... 74
Figure 3. 8 Simple imaging method for liquid drop detection....................................75
Figure 3. 9 Apparatus for measuring the liquid front in radial in-plane flow ........77
Figure 3. 11 The capacitance measuring system for liquid transport in wound
dressings............................................................................................................................ 80
Figure 3 .1 2 A schematic diagram of the capacitance transducers...........................81
Figure 3 .13 Schematic diagram of a basic A.C. bridge................................................. 87
Figure 3 .14 Schematic of the A.C. bridge used in the system .....................................89
Figure 3 .15 Schematic of the electronic components used in the system ................90
Figure 3 .1 6 Software flow chart for the system.............................................................. 91
Figure 3 .17 Extreme placement of wetted fabric between capacitance plates......101
Figure 3 .1 8 Screen shot of the new measurement system.......................................... 102
Figure 3 .1 9 Example of the measured results from the dynamic testing system for
a commercial nonwoven wound dressing fabric................................................... 104
Figure 3. 20 In-plane radial liquid flow and the direction of principal
permeabilities in a thin nonwoven fabric................................................................109

II List of Figures
Figure 3. 21 Liquid flow in the fabric and the calculated dynamic liquid flow front
in eight transducer field sectors................................................................................ I l l
Figure 3. 22 Typical sector showing the development of the liquid flow advancing
front..................................................................................................................................I l l
Figure 4. 1 Nonwoven fabric production procedure................................................... 123
Figure 4. 2 Relationship between the absorbency and the fabric porosity for all the
experimental fabrics.....................................................................................................129
Figure 4. 3 Fibre orientation and the orientation angle...............................................130
Figure 4. 4 Fibre orientation distributions for the parallel-laid webs (polypropylene
fibre).................................................................................................................................134
Figure 4. 5 Fibre orientation distributions for the parallel-laid webs (viscose fibre)
............................................................................................................................................135
Figure 4. 6 Fibre orientation distribution for cross-laid webs (polypropylene fibre)
............................................................................................................................................135
Figure 4. 7 Fibre orientation distribution for cross-laid webs (viscose fibre).......135
Figure 4. 8 Fibre orientation distributions for the commercial nonwoven wound
dressing fabrics..............................................................................................................137
Figure 4. 9 The typical geometric arrangement of fibres in Cross-laid and
Parallel-laid web............................................................................................................ 139
Figure 4 .1 0 Structure of needlepunched fabrics.......................................................... 140
Figure 4 .11 Needled fabric structures and the influence of process conditions.. 142
Figure 4 .12 Jet marks in the surface of the experimental hydroentangled fabrics
............................................................................................................................................143
Figure 4 .13 Cross section of an experimental hydroentangled fabric composed of
polypropylene fibre...................................................................................................... 143
Figure 5 .1 Influence of fibre fineness on the anisotropy of permeability............ 169
Figure 5. 2 Influence of fibre linear density on the anisotropy of permeability
(unbonded webs)............................................................................................................173

Ill List of Figures
Figure 5. 3 Influence of web structure on the anisotropy of permeability
(needlepunched fabrics).............................................................................................. 173
Figure 5. 4 Influence of web structure on the anisotropy of permeability
(hydroentangled fabrics)............................................................................................. 174
Figure 5. 5 Influence of fabric compression on the anisotropy of permeability.... 176
Figure 5. 6 Comparison of the anisotropy of liquid absorption (capillary flow) and
the anisotropy of permeability (forced flow )......................................................... 178
Figure 5. 7 Influence of fibre fineness on the anisotropy of liquid absorption......179
Figure 5. 8 Influence of web structure on the anisotropy of liquid absorption.....179
Figure 5. 9 Influence of fabric compression on the anisotropy of liquid absorption
............................................................................................................................................180
Figure 5 .10 Comparison of the anisotropy of permeability in the experimental
fabrics and typical commercial nonwoven wound dressing fabrics................181
Figure 5.11 Comparison of the anisotropy of liquid absorption in the experimental
fabrics and typical commercial nonwoven wound dressing fabrics................183
Figure 5. 12 Anisotropy of permeability and the anisotropy of liquid absorption in
unbonded and needlepunched fabrics in typical commercial nonwoven wound
dressing fabrics.............................................................................................................. 184
Figure 6 .1 Representation of drag theory for fibrous materials in a polar co
ordinate system ..............................................................................................................192
Figure 6. 2 Various cross-sectional arrays of fibre arrangement’ ............................ 195
Figure 6. 3 Theoretical permeability in structures having unidirectional fibre
orientation.......................................................................................................................200
Figure 6. 4 Curves showing permeability of structures with fibres aligned in two
orthogonal directions................................................................................................... 202
Figure 6. 5 Comparison of the existing permeability models for homogenous
isotropic materials and the new model (M_R_ISO).............................................209
Figure 6. 6 Comparison of the existing permeability models and the new models
(M_R_30, M_R_45 and M_R_60) for unidirectional fibrous m aterials........211

IV List of Figures
Figure 6. 7 Predicted permeability of different web samples (polypropylene fibre)
............................................................................................................................................214
Figure 6. 8 Predicted permeability of different web samples (viscose fibre).......215
Figure 6. 9 Predicted and measured anisotropy of permeability of the experimental
unbonded w ebs..............................................................................................................216
Figure 6. 10 Predicted anisotropy of permeability of unidirectional nonwoven
structures.........................................................................................................................218
Figure 6 .11 Predicted and measured anisotropy of permeability in commercial
nonwoven wound dressing fabrics............................................................................220

i List of Tables
LIST OF TABLES
Table 1 .1 Example of absorbent non woven wound dressings.....................................18
Table 1. 2 Example of occlusive dressings......................................................................... 20
Table 2 .1 Thickness and porosity of commercial nonwoven wound dressing
fabrics.................................................................................................................................47
Table 2. 2 Porosity and absorbency of commercial non woven wound dressings ....49
Table 2. 3 Absorption rate and anisotropy of absorption in commercial dressings in
the Horizontal and vertical strip tests....................................................................... 52
Table 2. 4 Anisotropy of the liquid absorption rate in vertical strip tests...............55
Table 2. 5 Anisotropy of liquid absorption rate in the horizontal strip tests.......... 55
Table 3 .1 Calculated capacitance of the transducers in the system.........................97
Table 3. 2 Whatman© filter paper properties used in the calibration...................... 97
Table 3. 3 Capacitance value of transducers for fabrics of different thickness......98
Table 3. 4 The effect of uniformity of fabric thickness on the capacitance of the
transducers......................................................................................................................100
Table 4 .1 Symbols used in the experimental plan to designate sam ples...............118
Table 4. 2 Experimental p lan............................................................................................. 119
Table 4. 3 The specifications of fibres used in making fabrics...................................122
Table 4. 4 Settings of card, lapper, and needlepunching machine...........................123
Table 4. 5 Settings of the hydroentanglement machine...............................................124
Table 4. 6 General specifications of experimental fabrics......................................... 125
Table 4. 7 Liquid absorbency of experimental fab rics................................................ 126
Table 4. 8 Standard deviation and CV % of mean angles in the fibre orientation
distribution......................................................................................................................136
Table 4. 9 Specific flexural rigidity of polypropylene and viscose fibres............. 144

ii List of Tables
Table 5 .1 Distance between plates of capacitance transducers................................ 150
Table 5. 2 Measured flow rates (g/s) in forced flow through the fabrics in different
directions.........................................................................................................................153
Table 5. 3 Measured permeability of the fabrics in different directions................155
Table 5. 4 Ratio of permeability in the fabrics in different directions................... 157
Table 5. 5 Anisotropy of permeability in the fabrics.................................................. 159
Table 5. 6 Calculated ratio of permeability from kj, k2 and <j) in different
directions......................................................................................................................... 161
Table 5. 7 Measured liquid absorption rates (g/min) through the fabrics in
different directions....................................................................................................... 163
Table 5. 8 Measured liquid absorption (m2*P(T)) in the fabrics in different
directions......................................................................................................................... 164
Table 5. 9 Ratio of liquid absorption in the fabrics in different directions.......... 165
Table 5 .10 Anisotropy of liquid absorption in the fabrics........................................ 166
Table 5.11 Calculated ratio of liquid absorption from k i p i , k2P2 and (j) in
different directions....................................................................................................... 167
Table 6 .1 Principle permeabilities in various two-dimensional nonwoven
structures......................................................................................................................... 199
Table 6. 2 Existing permeability models for isotropic and unidirectional Fibrous
structures......................................................................................................................... 206
Table 6. 3 Predicted and measured anisotropy of permeability of the experimental
unbonded w ebs.............................................................................................................. 216
Table 6. 4 Predicted and measured anisotropy of permeability in commercial
nonwoven wound dressing fabrics............................................................................220

I Symbols
SYMBOLS AND NOTATIONS
a ---------------Fibre orientation direction (degrees)
a k ------------- the ratio of the directional permeability in the machine direction ( k MD) to
the machine direction ( k CD)
a h------------- the ratio of the maximum wicking height in the machine direction to the
cross direction
a v .................. the ratio of the initial wicking rate in the machine direction to the cross
direction
---------------the angle of angular segment area in the fabric plane (degrees)
8 ---------------fibre diameter ( jum )
£ ----------------volume fraction o f solid material in a porous material
£ ,, e j ---------dielectric constant of first or ith dielectric materials
£0 ---------------dielectric constant of a vacuum
£r ----------------relative dielectric constant of materials
p ---------------fluid density (kg/m3)
Pfabric---------- fabric density (kg/m3)
Pfibre----------- fibre density (kg/m3)
(j)----------------characteristic angle of two dimensional fluid flow in anisotropic
structures (degrees)
cp----------------contact angle (degrees)
y ----------------surface tension of liquid (N/m)
ri----------------viscosity o f liquid (N*s/m2)
n ----------------radius constant (=3.1415926)
0 ----------------direction o f fluid flow (degrees)
<j----------------- fluid surface tension (N/m)
Q ( a ) ----------- fibre orientation distribution function

II Symbols
co----------------- ratio of the measured permeability in two different directions.
(0k ----------------anisotropy o f permeability
coa ----------------anisotropy o f liquid absorption
C0{6) ----------- fibre orientation distribution density function
£ ----------------- fibre orientation factor.
y /----------------- capacitance coefficient of capacitance transducer
x ------------------ roughness factor
A, B, C----------constants (except in Chapter 3)
A, A u ----------- area of the capacitance plate (m2) (Chapter 3 only)
Ax----------------- area o f fabric holding fluids between capacitance plates (m2)
C, Co, Ci, C2, Cu ---------electrical capacitance (F)(Chapter 3 only)
a, b, bo, b i, b2, b3, b4------ fitted constants
D ---------------distance between two parallel capacitance plates (m)
D 1 D 2---------thickness of dielectric materials between parallel capacitance plates (m)
d i ------------- thickness of /th dielectric materials between parallel capacitance plates (m)
d, du, d ’, d ” ------ fabric thickness (m)
fu f 2 ---------signal frequency in the electronic circuit (Hz)
f p---------------drag force per unit length acting on a single fibre oriented parallel to the
fluid flow (N).
f v---------------drag force per unit length acting on a single fibre oriented perpendicular to
the fluid flow (N)
f ( 8 ) ---------drag force of fluid flow in the direction 6 acting on the fibre (N).
k 0------------- Kozeny constant
Gc------------- gain of electronic circuit.
g ---------------gravity constant (9.8 m/s2 )
hmax----------- m aximum wicking height in the vertical strip test (m)
^mfx----------maximum height the liquid reaches in the Cross D irection (m)
fyrax ---------maximum height the liquid reaches in the M achine Direction (m)

Ill Symbols
K ------------- permeability coefficient in D arcy’s law (m/s)
k---------------specific permeability (m )
k ------------- vector o f specific permeability in general D arcy’s law
V -............. -differential calculus• 2k], & 2---------two principle permeabilities in Ferrandon’s equations (m )
k ( 6 ) ---------specific directional permeability in the direction 6 in an anisotropic medium
(m2)
k \z ----------permeability in the Z direction (which is perpendicular to the fabric plane)
(m2)
• 1 1 1kox , k 0Y — two components in the eq u a tio n ------ = ------+ -----k(9) kox k0Y
L— ............fluid conduit length in D arcy’s law (m)
M(t)---------mass of the fluid absorbed by the fabric in the moment t (kg).
m ........ .......... relative dielectric constant of water (78-80)
mv----------- mass transmission of liquid absorbed in the strip test (kg).
n------------- number o f fibres per unit volume in the fabric
P, P(t), p — hydraulic pressure (N/m2)
Pj--------- •— fabric porosity (%)
P0 — .........hydraulic pressure at an initial source point in the fabric plane (N/m2)
AP ---------difference in hydraulic pressure (N/m )
Q------------ volumetric flow rate (m3/s*m 2).
R------------- radius of advancing fluid front in two-dimensional fluid transmission (m)
R2, R3------ electrical resistance (Q ) .
Rf ............. radius of the advancing fluid front in two-dimensional fluid transmission (m)
R f (t ) ------ radius of the advancing fluid front in two-dimensional fluid transmission in
time t (m)
R0----------- radius o f the fluid source point hole, or radius o f the initial advancing fluid
front in two-dimensional fluid transmission (m)
Re------------ Reynolds number
r0 ------------ radius o f the central capacitance segment of the capacitance transducer (m)

IV Symbols
r---------------- capillary radius (m)
S—............... - S = 21n £ - 4 £ + 3 + £2
s ---------------- fabric saturation ( % )
T, t----------- time (s)
1 — £ 2T -------------- T = In £ + ------- - (Chapter 6 only)
l + £
V, V(t)------ Voltage of electrical circuits (V).
v------------- volume o f liquid absorbed (m3)
Vo, Vs----------voltage of elements in the electrical circuit (V)
W ------------ fabric mass per unit area (g/m2)
X------------- percentage of fibres aligned in a specific direction (%).
x .......... ....... conduit distance (m)
x(t)----------- liquid transmission distance in time t (m)
x m d ( 0 ---------- wicking height the liquid reaches in time t in the M achine Direction (m)
x cd ( r ) -------------wicking height the liquid reaches in time t in the Cross Direction (m)
z---------------fraction of fibres aligned perpendicular to the fabric plane (%).
CD----------- Cross Direction
M D ----------M achine Direction
1 Chapter 1
CHAPTER 1 INTRODUCTION AND REVIEW OF LITERATURE
1.1 INTRODUCTION
Nonwoven fabrics are widely used in applications such as geotextiles, filtration,
medicine and hygiene. In many applications the liquid transport and handling
properties of nonwoven materials are very important. W ound dressings, for example, are
required to have the ability to absorb the body liquids of the patient and the exudate
from the wound to remove unnecessary substances. They are also required to maintain a
high humidity under the dressing to promote wound healing1.
Fabrics used in medicine and hygiene may be required to either distribute liquid
uniformly, or to deliver liquid faster in specific directions or to impair liquid
transm ission completely in specific directions. For example, the ideal coverstock,
• 2incontinence pad or diaper must meet the following performance requirements :
1). The rapid entry of liquid through the coverstock, i.e., a short strike-through time and
minimum run-off, so as to avoid pooling.
2). The rapid dispersal of liquid in the absorbent layer, i.e., a high wicking rate, or
alternatively provision for liquid to flow away from the point of entry.
3). The permeability of a coverstock to liquid would ideally be a maximum in one
direction and a minimum in the other direction.
While all the above requirements are related to the general liquid transport properties of
a nonwoven fabric, the third requirement implies that so-called anisotropic in-plane
liquid transport in fabrics is a desirable feature.
2 Chapter 1
In fact, many nonwoven fabrics demonstrate anisotropic characteristics in liquid
transport. It is well-known that liquid transmission in the fabric plane may be much
faster than in the transverse plane, and many experiments have dem onstrated that the
rate of liquid absorption in the machine direction differs greatly from the rate in the
cross direction3.
In order to obtain a systematic understanding of the requirements o f wound dressings
and the liquid transport in nonwoven structures, this literature review covers general
areas related to the liquid handling properties of nonwoven wound dressing fabrics and
aspects of liquid transport and absorption in such fabrics as follows:
1). The mechanism of wound healing and the corresponding optimum requirements of
an ideal wound dressing.
2). The requirements (identified in 1) above) related to liquid transport in fabrics.
3). The application of nonwovens in various wound dressings and their specific
requirements.
4). Previous studies of anisotropic liquid transport in fabrics.
Before studying the fundamental effects of fabric structure on liquid transport
properties, it was considered important to establish the property requirements o f wound
dressings, especially with respect to mechanically bonded wound dressing structures.

3 Chapter 1
1.2 REQUIREMENTS OF AN OPTIMUM WOUND DRESSING AND THE
IMPORTANCE OF LIQUID TRANSPORT
1.2.1 Introduction to Wound Healing
In clinical practice, wounds are divided into two types: acute and chronic, and wound
healing has two classes referred to as first and second intention. Some examples of
typical wounds are given as follow s1:
1) Donor sites, grazes and abrasions.
2) Incisions and puncture wounds.
3) Deep wounds, where there is extensive loss o f sub-epidermal tissue.
4) Burns, caused by scalding, electricity, fire, chemicals or irradiation.
5) Pressure sores.
Throughout history, wounds have been dressed to assist in the healing process. The lint
of the 1650s and the cotton and gauze tissue invented by Sampson Gamgee many years
ago are still used today. Until the 1960s there was relatively little research and
developm ent into wound management products. However, during the decade o f the
1960s, three key observations helped physicians think of dressings as pharmacological
agents. O dland4 first observed in 1958 that a blister healed faster if left unbroken. Then,
in 1962 a landmark article published by W inter5 showed that in superficial experimental
wounds in pigs, (whose skin properties are thought to be the nearest to human skin),
they healed more rapidly under an occlusive dressing composed of polyethylene film as
compared with those exposed to air. Finally, Himan and M aibach6 established the

4 Chapter 1
beneficial effects of occlusion on the resurfacing of experimental wounds in normal
volunteers in 1963. Since then, there has been extensive literature describing improved
healing when superficial skin wounds are not allowed to desiccate7. Epithelialization
has been particularly well studied8. Until this decade, cell migration, replication and
differentiation, and the synthesis of extra cellular matrix (ECM) are common to wound
healing, embryonic development and tumour growth. As a result o f developments in
cellular and molecular biology, the mechanisms of normal wound healing and ways in
which this can be manipulated are being elucidated9.
1.2.2 Wound Healing Under Dressings
1.2.2.1 Mechanism of Wound Healing and the Function of Wound Dressings
W hen a wound is exposed to air, drying of the wound surface results in the forming of a
hard scab, which makes regenerating epithelial cells burrow under or through the dead
tissues to a moist lower level before epidermal repair can take place. Since the drying of
the wound surface extends healing times, the mechanism o f moist wound healing and
the use of wound dressing are extensively studied.
5 7 6The ‘moist wound healing’ approach, advocated by W inter ’ and Himan using
occlusive or semi-permeable occlusive dressings, has resulted in a shortening of the
period of healing, and less pain and scarring if infection is well controlled. M oist wound
healing allows experimentally induced wounds to resurface up to 40% faster than
wounds exposed to air10.
A proposed explanation for “moist wound healing” has been that epidermal migration is
physically facilitated in moist conditions and in the absence of a crust5,6. The studies of

5 Chapter 1
Rovee11 stressed that greater epidermal cell movement, rather than mitosis, is
responsible for the increased rate of epithelialization o f occluded wounds. Numerous
other investigators have since confirmed the usefulness o f various types of occlusive
12 •dressings in human non-experimental acute wounds. Barnett et al concluded that split
thickness skin graft donor sites covered with a polyurethane film dressing (Op-Site or
Tegaderm) healed nearly twice as fast as those covered with a fine-mesh gauze dressing.
Similarly, a positive experience with a polyethylene oxide hydrogel dressing (Vigilon)
was reported by M andy13, in his studies of wounds made during the process of hair
transplantation and demarcation.
The rapid development in the methods o f wound healing is attributed to advancements
in biology. Recent studies (mainly in vitro), with the developm ent of growth factors9,
have shown that cytokines have a role in wound healing14, 15, 16, 17. An attractive
hypothesis to explain the faster epithelialization under occlusive dressings, (films,
hydrocolliods or hydrogel dressings), is that they keep wound fluid in contact with the
wound, and certain cytokines, (probably growth factors), present in the wound fluid
under the film dressing are thought to modulate connective tissue formation and
epidermal m igration18, 19, 20. Peptides such as interleukin 1, epidermal growth factor,
platelet-derived growth factor and transforming growth factor-beta are all likely to be
present at the wound site9. In fact, Buchan et al21 reported that the gross chemical and
immunoglobulin composition of fluid taken from acute wounds occluded with Op-Site
is quite similar to that of serum. Ono et al22 examined the fluids after five days under a
film dressing, and found that the fluids accumulated under the film contained growth
factors and cytokines that are thought to promote healing. They found the fluids were

6 Chapter 1
rich in TGF-alfa but contained no EGF or bFGF, which indicates that TGF-alfa plays a
major part in promoting local wound healing. Nemeth et al23 found wound fluid from
graft donor sites accelerated epidermal outgrowth from split-thickness swine skin.
Other research o f chronic wound healing has shown that the wound fluid present in
chronic wounds has, in vitro, either increased fibroblast proliferation24 or enhanced
connective tissue synthesis25. This may explain the mechanism o f occlusive dressings.
Thus, according to this hypothesis, the optimum wound dressing should not absorb the
exudate containing specific growth factors that are thought to help accelerate wound
healing. However, the presence of large amounts of fluid under occluded wounds raises
concerns about infection.
In fact, there appears to be no doubt that occluded wounds, (whether acute wounds or
chronic wounds25), accumulate a greater number of microbial organisms than do air-
exposed wounds. Katz27 found that, within six experimentally commercial occlusive
dressings, including Duoderm, none o f the dressings prevented clinical infection and all
the dressings provided microenvironments that were conducive to the growth of resident
and pathogenic bacteria. Also there was no difference in the rates of reepithelialization.
However, in acute wound healing, clinical results showed this increased bacterial
colonisation does not prevent occluded wounds from healing at the same rate as27 or
faster than10, 28 air-exposed wounds. Eaglstein29 has even proposed that bacteria and
their metabolites could conceivably stimulate epidermal migration and healing. Other
30 31workers did not find an increased frequency of celluliotis or any infection in
occlusive wounds. In chronic wounds, the records are more reassuring. Friedman and
Su32 did not report the development of clinical infection, with the possible exception of

7 Chapter 1
one in thirty one, in the treatment o f leg ulcers with a hydrocolloid (Duoderm). A lper et
'l'j
al found that clinical evidence of cellulitis developed in three patients when Op-Site
was used in 18 patients with various ulcers, although almost all of the patients had
obvious wound contamination with numerous bacterial species, including common
pathogens. Only one of twenty-seven patients with decubitus ulcers treated with
D uoderm was reported by Gores and M essner34 to have developed a clinical infection at
the wound site. Falanga25 also found occlusion to be safe even in those chronic wounds
with heavy bacterial colonisation.
Some reports showed in vitro the ability of a polyurethane film such as Op-Site to kill
bacterial pathogens and activate complement35. In fact, most manufacturers of
'l/: l/:commercial wound dressings (such as Duoderm and Sorbsan ) claim together with
some studies37, that certain dressings (e.g. Duoderm36), but not Op-Site36 and Vigil36,
may prevent bacterial entry into wounds. Therefore, in chronic wounds, it is claimed
iothat the greatest benefit of occlusive dressings is the painless debridement and that
hydro-active dressings facilitated wound management because o f the convenience and
time saving in dressing changes but did not accelerate healing compared with
conventional therapy39. Possibly, their effectiveness in debriding wounds is due to
proteolytic enzymes released by neotrophils, which have been shown to reach the ulcer
surface under occlusion25.
There are other possible explanations for the effectiveness of moist wound healing and
the function of occlusive dressings. One that is often downplayed for lack o f better
understanding is the role of occlusion in maintaining a normal voltage gradient lateral to
the wound. Human skin has measurable transcutaneous potential differences that are

8 Chapter 1
decreased by wounding, and there is evidence that the maintenance o f such electrical
fields may be important to epidermal cell migration40. It has been shown41 that in vitro
electrical stimulation leads to an increased expression of receptors for growth factors by
human dermal fibroblasts and to a subsequently greater synthesis o f collagen after the
ye
addition of the growth factor. Some researchers have suggested that a higher receptor
number for growth factors available in wound fluid, might be a favourable effect of
occlusion.
Eaglstein et al42, after having examined the effect on epithelialization of delayed
application and early removal of a polyurethane dressing (Tegaderm), indicated that
from first wounding to six hours later, the application of the dressing will increase the
rate of epithelialization. M oreover, keeping the dressing on the wound after the initial
twenty-four hours was not necessary to enhance epithelialization.
1.2.2.2 Factors Influencing Wound Healing
Factors such as the partial pressure o f oxygen (PO 2), the pH of the wound fluid, and the
functioning o f cells in the wound are thought to influence the rate of healing43. Among
these factors, the importance of the permeability to oxygen in wound healing and to
infection resistance is controversial44. Some research has concluded that high oxygen
pressure is one of the key parameters that promotes wound healing and prevents wound
infection45, 46, 47, others have reported that reduced PO 2 promotes in vitro growth of
fibroblasts and production of angiogenesis factors from tissue m acrophages48,49,50,51. In
addition, epidermal cell growth in vitro is inhibited at oxygen pressures that exceed that
o f am bient air . In contrast, Varghese et al suggested that a low rather than a high
PO 2 could enhance the healing process.

9 Chapter 1
In fact, experimental results53 have indicated that the oxygen pressure under both
oxygen-perm eable and oxygen-impermeable dressings were very low or zero. Wound
fluid was more acidic under the impermeable hydrocolloid dressings than under an
oxygen-perm eable polyurethane dressing, and bacterial growth was retarded at the more
acidic pH similar to that found under the hydrocolloid dressing. It was concluded that
all these dressings create hypoxic conditions in which wound healing occurs whether or
not they are oxygen-permeable. Traditionally, one o f the greatest advantages of
absorbent dressings is thought to be their permeability to air (oxygen). Viable and
functioning neutrophils have been found under both polyurethane and hydrocolloid
dressings with a greater percentage of viable cells under the oxygen-permeable
polyurethane film53.
M any other researchers have studied the effect of water vapour transmission in wound
healing54, 55, 56. Lame et al57 found that after thermal injury the evaporative water loss
58from the wound surface can be twenty times greater than normal skin. Queen et al
tested in vitro the permeability characteristics of a series o f com mercially available
dressings by using a modified international standard technique59 to assess the water
vapour transmittivity and predict the build-up o f wound exudate under film or the strike
through under foam. Also, the British Standard M ethod60 was used to assess oxygen and
61 62 63carbon dioxide transmission and by adopting a gas to liquid technique ’ ’ , the carbon
dioxide transm ission rate in hydrogel dressings was assessed.
1.2.3. Types of Wound Dressing
Different wounds have different characteristics, which dictate the design o f the dressing.
Over many years from studies of the healing pattern of partial thickness wounds,

10 Chapter 1
dressings can be separated into two main groups: (a) absorbent, physically porous
dressings which allow free passage of exudate from the surface and (b) non-absorbent,
water-proof dressings where the wound exudate is retained at the wound bed.
Commercially, available dressings which may be of composite construction are usually
classified as either occlusive or absorbent.
1.2.3.1 Occlusive Dressings
Falanga25 defined dressings that keep a wound moist and prevent crust formation as
occlusive or semi-occlusive dressings. There are four basic types of occlusive dressings
available in the commercial market25, 64:
(i). Films'. Are typically thin, transparent and adherent polyurethane materials that
stick only to dry or non-wounded skin when placed over the wound. Films are
not absorbent but allow passage of water vapour, oxygen, and carbon dioxide.
Once epithelialization begins, a potential problem with films is the stripping
away of newly grown skin on removal of the dressing.
(ii).Foams: Are generally made o f non-adherent polyurethane materials that are
taped in place over the wound. The amount of wound fluid absorbed by these
products is relatively small.
(iii). Hydrocolloids\ Are materials in which a water-impermeable polyurethane outer
covering is separated from the wound by a hydrocolloid material whose
composition varies with the particular dressing. They are opaque, gas
impermeable and absorbent. Eventually, the accum ulation o f wound fluid
causes a gradual separation o f the dressing from the wound. Hydrocolloids have

11 Chapter 1
proved to be unsuitable for use as a wound contact layer25. It is often difficult to
retain liquid, resulting in leakage o f odorous exudate and wound dressing gel.
(iv). H ydros els: Are made of polyethylene oxide membranes or other polymers.
They are always semi-transparent, non-adhesive and absorbent. Hydrogels are
difficult to maintain in position without the use of secondary dressings.
Each o f the basic dressing materials mentioned above has its own advantages, and
composites o f the basic dressing types are frequently found in commercial applications.
However, occlusive dressings still have limitations.
One major problem with occlusive dressings is that they may cause a rather alarming
accumulation of exudate from the wound. The problem of excess accumulation of
wound fluid may be dealt with in two ways. Firstly, the fluid may be absorbed, but as
previously mentioned, adherence of the dressing to the wound, infection and impaired
healing may result from this approach. Secondly, excess w ater from wound fluid may
be allowed to evaporate. A lper et al65 advocated aspirating the fluid from under the
dressing, thereby avoiding premature dressing removal. It has been clearly shown that
early removal of adherent occlusive dressings can lead to stripping of the newly
epithelialised surface66. However, dehydration leading to adherence and impaired
healing may result and controlled evaporation and the maintenance of a layer of fluid at
the wound surface is not easy to achieve. To overcome the build up of exudate under
conventional plastic film dressings on heavily exudating wounds, a nonwoven
com posite dressing in which the exudate is absorbed through a perforated film into a
nonwoven layer has been used .

12 Chapter 1
Dressings containing alginates (described as semi-occlusive wound dressings), have
been found to be suitable as a dressing/wound interface, and two layers of flat sheet
alginate have been used as a primary dressing which forms a gel providing a moist
healing environm ent and low adherence.
Vapour-permeable film dressings are usually used for securing a secondary dressing.
However, the weight o f the alginate and the absorbed exudate can pull the film away
from the skin surface loosening the sealed edges.
1.2.3.2 Absorbent Dressings67
Although moist wound healing requires the wound dressing to have the capability to
retain the wound surface at a high humidity level, the absorption o f excess fluid in the
form of exudate is also necessary. The removal o f exudate avoids tissue sloughing, and
the exotoxins or cell debris which may retard growth or extend the inflammatory phase
is also removed along with the excess exudates1. The balance of humidity and liquid
absorption is critical. Excessive wicking must be avoided to prevent drying of the
wound surface.
Basic absorbent dressings based on gauze and similar textile materials are designed to
dry out the wound surface. They are effective in removing blood and exudate from the
wound but they are all, to a lesser or greater extent, adherent to the wound surface and
may cause considerable pain on removal.
The need for absorbency in dressings is very important but it must be achieved while
maintaining non-adherence. Non-adherence may be achieved by:
(a) Preventing dehydration o f the exudate.

13 Chapter 1
(b) Reducing absorption o f fluids into the dressing.
(c) By treating the dressing surface to render it non-adherent.
Recently introduced dressings incorporate features in an attempt to meet one or more of
these requirements. An early attempt to produce a non-adherent dressing involved
impregnating gauze with paraffin cream, polyethylene glycol or aluminium stearate, but
this was not entirely successful. O ther commercially available dressings are composed
o f an absorbent pad covered with a perforated plastic film that is designed to lie in
contact with the wound surface. The plastic film is intended to reduce the amount of
absorbed exudate and thus to leave a moist gel at the wound surface. However, these
dressings can adhere to the wound surface due to columns of exudate drying in the pores
o f the film. Subsequently, damage is caused to the healing wound when the dressing is
removed68.
To overcome such problems (associated with traditional dry absorbent-dressings) and to
avoid the disadvantages o f occlusive dressings, com posite dressings have been
developed. A new composite dressing has been reported, consisting o f a net wound
contact layer that allows exudate to pass freely into the absorbent layer but separates the
absorbent layer from the wound surface69.
An absorbent dressing made from polyurethane foam has been developed using the
standard wound model70. The foam dressings, still widely used in wound care at the
present time, have been found to be non-adherent and produce an accelerated rate of
healing70. This dressing presents both an absorbent layer to the exudate and a smooth
surface from which particles will not be shed into the wound. The reduced rate of drying

14 Chapter 1
of the wound surface leads to the formation o f a gel of exudate at the wound surface.
M igrating epidermis cells were observed to pass through this gel and not through the
dermis, which is somewhat similar to the pattern of healing seen under occlusive
70dressings where no absorption of exudate occurs .
Nowadays, there is increasing interest in exploiting other natural biocompatible
materials in wound dressings because of the disadvantage of traditional gauze.
1.2.4 The Optimum Wound Dressing
The design features of an optimum wound dressing will vary with the particular wound
type but there are certain general performance requirements if the healing rate is to be
clinically acceptable. The functions of a wound dressing were first summarised by
71surgeon Abraham Rees in 1819. The requirements of a dressing were stated as :
1). To stop blood in fresh wounds.
2) To agglutinate and heal wounds
3) To dry wounds and forward the formation of a cicatrix.
4) To keep the tops o f wounds at a proper distance so that they do not hastily unite
before the bottom is well digested and healed.
5) To prevent the access o f air.
Thereafter, the optimum relationship between healing and the design of wound
management products has been sought.
In 1972, W inter7 defined the desirable properties of a wound dressing. Turner72 also
identified the performance characteristics of an ideal wound dressing in 1979 as "those

15 Chapter 1
factors which will produce a microenvironment associated with the wound that will
allow healing to proceed at the maximum possible rate com mensurate with the age and
1 73physiological condition o f the patient". In summary, Turner ’ proposed the optimum
dressing should:
1) Remove excess exudate and toxic components.
2) M aintain a high humidity at the wound/dressing interface.
3) Allow gaseous exchange.
4) Provide thermal insulation.
5) Be impermeable to micro-organisms.
6) Be free from particulate and toxic wound contaminants.
7) Be removable without causing trauma during dressing changes.
Other researchers have also stated similar general requirements for an optimum
dressing8' 67’74. In 1995, W hitby8 proposed a more systemic list of requirements based
on the biology o f wound healing as follows:
* To permit gaseous exchange. To maintain PO 2 and pH at appropriate levels.
* To maintain high humidity in the wound (epithelialization proceeds more rapidly in a
moist env ironm ent).
* To maintain wound temperature close to body core temperature, allowing mitosis and
phagocytosis to proceed at optimal levels.

16 Chapter 1
# To aid removal of dead tissue and bacterial, chemical and physical contaminants
(excess wound exudate containing cellular debris increases the risk of bacterial
infection, and the presence o f foreign material prolongs the inflamm atory phase).
# To be impermeable to bacteria.
# To be non-adherent, non-allergenic and free from contaminants (adherent dressings
that damage new epithelium when they are changed, and toxic and particulate
contaminants in the dressing, may prolong the inflammatory phase).
Among the requirements of an optimum wound dressing, the following requirements are
influenced by the liquid transport properties of the fabric:
# M aintenance o f a high humidity in the wound.
# Non-adherent, non-allergenic and free from contaminants.
# Aid removal o f dead tissue and bacteria, chemical and physical contaminants.
# Comfort.
# M aintenance o f wound temperature close to body core temperature.
According to the requirements o f optimum wound healing mentioned above, the
physical properties of nonwoven fabrics, such as thermal insulation, wettability, liquid
transfer and liquid retention, water vapour transfer, and absorption of serum album by
fabric and fibres, have a significant influence on wound healing, since these parameters
will either affect wound healing or the adherence of the fabric to the wound. Some of
the main performance requirements depend on the structure of the fabric and the
associated liquid transmission properties.

17 Chapter 1
A bsorption of exudate by the dressing is designed to aid the removal of dead tissue
bacteria, as well as chemical and physical contaminants so as to prevent wound
infection and to prevent the presence of foreign material prolonging the inflammatory
phase.
The structure o f the fabric will clearly influence the liquid uptake and transport
characteristics o f the fabric which will in turn have a significant influence on the
moisture in the wound and on exudate removal.
1.3 APPLICATION OF NONWOVENS IN WOUND DRESSINGS
1.3.1 Nonwoven Wound Dressing Materials
Nonwovens have specific advantages when used in wound dressing applications. The
structure of some nonwoven materials has been likened to the structure o f collagen,
nonwovens are claimed to have controllable exudate absorbing ability, free from
chemical detergents and have ideal thermal insulation3. Dressings comprising an
• • 36absorbent pad covered with nonwoven materials have been widely used . A large
number o f commercial wound dressing products and patents have appeared that
com bine nonwoven structures and incorporate materials such as chitin, chitosan,
75 76 77 78 79alginate, collagen fibre and superabsorbent fibres ’ ’ ’ ’ . Some articles have
80 •described wound dressings containing nonwovens that are designed for absorbing and
retaining wound fluids in which an absorbent material has a fluid transfer component.
Some examples o f developmental or commercial absorbent and occlusive wound
dressings are described in Tables 1.1 and 1.2 respectively. The lists are by no means
exhaustive.
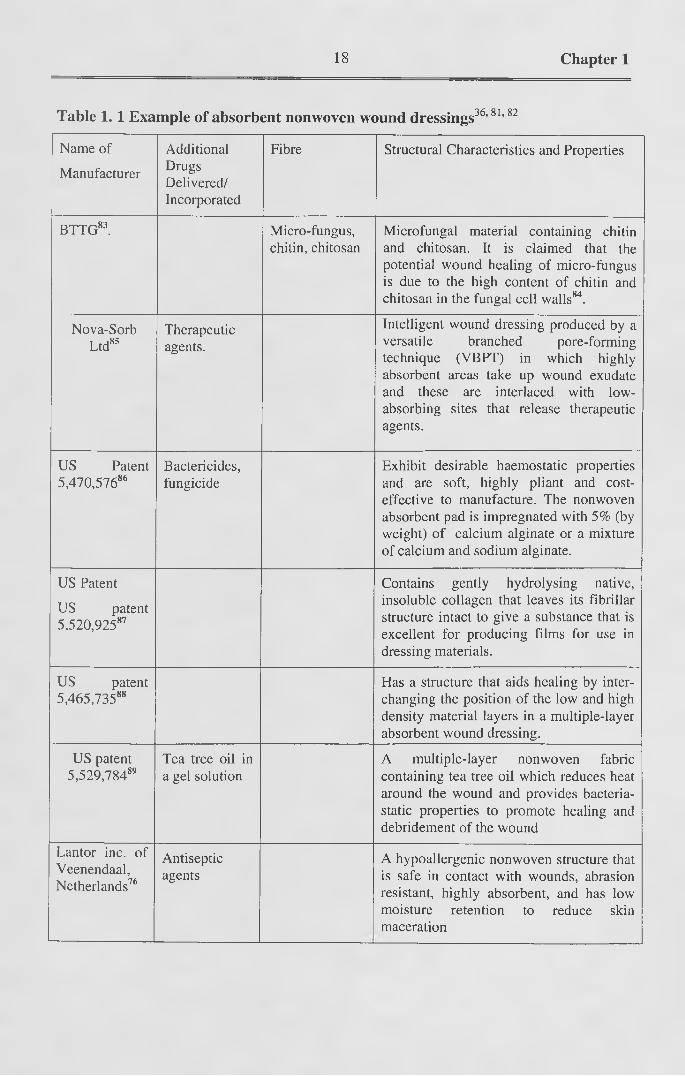
18 Chapter 1
Table 1 .1 Example of absorbent nonwoven wound dressings36,81,82
Name of
Manufacturer
AdditionalDrugsDelivered/Incorporated
Fibre Structural Characteristics and Properties
BTTG83. Micro-fungus, chitin, chitosan
Microfungal material containing chitin and chitosan. It is claimed that the potential wound healing of micro-fungus is due to the high content of chitin and chitosan in the fungal cell walls84.
Nova-SorbLtd85
Therapeuticagents.
Intelligent wound dressing produced by a versatile branched pore-forming technique (VBPT) in which highly absorbent areas take up wound exudate and these are interlaced with low- absorbing sites that release therapeutic agents.
US Patent 5,470,57686
Bactericides,fungicide
Exhibit desirable haemostatic properties and are soft, highly pliant and cost- effective to manufacture. The nonwoven absorbent pad is impregnated with 5% (by weight) of calcium alginate or a mixture of calcium and sodium alginate.
US Patent
US patent 5,520,92587
Contains gently hydrolysing native, insoluble collagen that leaves its fibrillar structure intact to give a substance that is excellent for producing films for use in dressing materials.
US patent 5,465,73588
Has a structure that aids healing by interchanging the position of the low and high density material layers in a multiple-layer absorbent wound dressing.
US patent 5,529,78489
Tea tree oil in a gel solution
A multiple-layer nonwoven fabric containing tea tree oil which reduces heat around the wound and provides bacteria- static properties to promote healing and debridement of the wound
Lantor inc. ofVeenendaal,Netherlands76
Antisepticagents
A hypoallergenic nonwoven structure that is safe in contact with wounds, abrasion resistant, highly absorbent, and has low moisture retention to reduce skin maceration
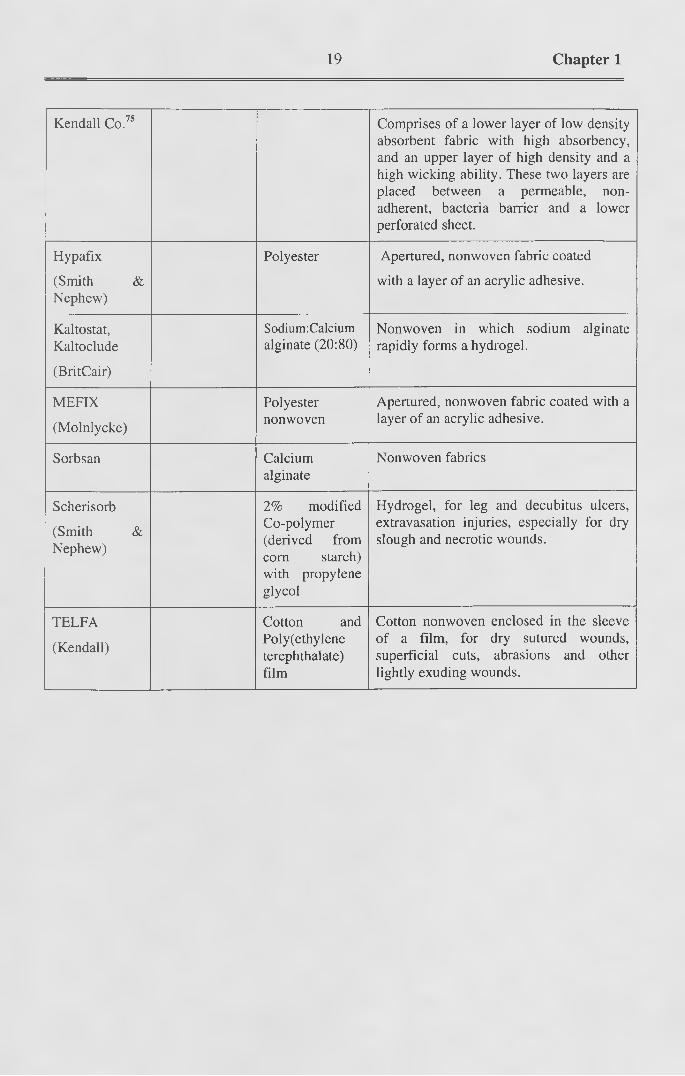
19 Chapter 1
Kendall Co.75 Comprises of a lower layer of low density absorbent fabric with high absorbency, and an upper layer of high density and a high wicking ability. These two layers are placed between a permeable, nonadherent, bacteria barrier and a lower perforated sheet.
Hypafix
(Smith & Nephew)
Polyester Apertured, nonwoven fabric coated
with a layer of an acrylic adhesive.
Kaltostat,Kaltoclude
(BritCair)
Sodium:Calcium alginate (20:80)
Nonwoven in which sodium alginate rapidly forms a hydrogel.
MEFIX
(Molnlycke)
Polyesternonwoven
Apertured, nonwoven fabric coated with a layer of an acrylic adhesive.
Sorbsan Calciumalginate
Nonwoven fabrics
Scherisorb
(Smith & Nephew)
2% modified Co-polymer (derived from corn starch) with propylene glycol
Hydrogel, for leg and decubitus ulcers, extravasation injuries, especially for dry slough and necrotic wounds.
TELFA
(Kendall)
Cotton and Poly(ethylene terephthalate) film
Cotton nonwoven enclosed in the sleeve of a film, for dry sutured wounds, superficial cuts, abrasions and other lightly exuding wounds.

20 Chapter 1
Table 1. 2 Example of occlusive dressings
Name of Manufacture
AdditionalDrugsDelivered/Incorporated
Fibre Structural Characteristics and Properties
BioFILM Gelatine,pectin
Polyester nonwoven layer with film
Pharma-Plast77 Polyurethanefilm
Within the Polyurethane film is a soluble, controlled-release polymer that contains silver compounds
SetonHealthcare76Lyofoam
Hydrophobicpolyurethanefoam
Gas permeable, but resistant to the penertration of wound exudates
Melolin Dressing perforated film absorbent. Film of Poly(ethyleneterephthalate) with cellulose nonwoven
Opsite Polyurethanemembrane
Tegaderm PolyurethaneMembrane
1.3.2 Trends in Wound Dressing Technology
With the rapid progress in the purification and cloning of numerous growth factors and
the expanding understanding of matrix proteins that promote epidermal migration and
growth, we have a better understanding of the pathophysiology of diseases and of
wound healing. New directions for the design of improved wound care and wound
dressing materials are now emerging.
Falanga25 has predicted the development o f the ’growth dressing’ that combines
occlusion with the timed or pulsed delivery of specific growth factors designed to help a
specific clinical problem. He proposed the use of occlusion with an angiogenic growth
factor to stimulate granulation tissue and then subsequently the use of an occlusive
dressing that will deliver various growth factors to speed up epithelialization

21 Chapter 1
The application o f growth factors in a gauze or beneath a watertight film or film
chamber has also been proposed9. Vehicles include the use o f cream such as silver
sulphadiazine that releases Growth Factor (GF) slowly for at least twelve hours when
applied to wounds9. Pluronic acid is a liquid at room temperature that becomes a gel at
body temperature, and is being evaluated together with collagen gels that dissolve over
time and release growth factors. Other techniques include lipid microencapsulation of
growth factors in hydrocolloid dressings such as Duoderm® or Comfeel®, and
incorporation o f growth factors in a polymer matrix9. So far, no vehicles have been
reported to be totally successful.
Products that incorporate well with Growth Factors and release Growth Factors slowly,
which do not jeopardise the microenvironment at the wound surface are expected to
become the wound dressings o f the future9.
1.4 NONWOVEN FABRIC STRUCTURES AND LIQUID TRANSPORT
1.4.1 Mechanically Bonded Non woven Structures
M echanically bonded nonwoven fabrics (e.g. needlepunched and hydroentangled) are
widely used in wound-care applications. It is well known that the properties of such
nonwoven fabrics depend on their structure. The structure is governed by the way in
which the fibres are arranged and the properties of these com ponent fibres90, 91, 92, 93.
Krcma94 identifies four major structural parameters dominating the structure of
nonwoven fabrics:
1) Constituent fibre properties (fibre dimensions, physical and chemical properties).
2) Geometrical fibre alignment (i.e., fibre orientation).

22 Chapter 1
3) Contact points between fibres in the fabric.
4) Porosity o f the fabric.
Therefore, from a fundamental standpoint, the liquid transport and uptake characteristics
o f nonwoven fabrics may be expected to rely on the above four parameters. The
importance o f fibre properties are well understood and have been described in many
authoritive sources95.
The basic geometrical arrangement of fibres in nonwoven fabrics is partly determined
by the structure of the original fibre web which may be considered as a three-
dimensional system. Fabric geometry is also influenced by the manufacturing process
and the main factors can be summarised as follows94:
1) The nature of the fibre material.
2) The method of assembling the web of fibre, i.e. web formation.
3) The method of bonding the web.
4) The chemical or mechanical finishing processes used (if any).
W ith respect to mechanically bonded fabrics, there are no chemical substances present
in the structure which may stimulate an allergenic reaction when used as a wound
dressing (assuming fibre finish is removed). One o f the geom etrical parameters of a
nonwoven fabric is the fibre orientation distribution.

23 Chapter 1
1.4.1.1 The Fibre Orientation Distribution (FOD)
The fibre orientation distribution defines the relative positions of individual fibres in the
structure o f a fibre web or fabric. The following general relationship is proposed for the
distribution o f fibre orientations in a web or fabric90:
71
2
^Q.(a)da = 1 (1.1)_nI
W here a is the fibre orientation angle, and Q (a ) is the fibre orientation distribution
function in the examined area. The numerical value of the orientation distribution
indicates the number of observations that fall in the direction a which is the angle
relative to the examined area92.
It has been shown by many researchers that the FOD influences the physical behaviour
of the fabric. Backer and Petterson92 pioneered a fibre network theory for estimating the
tensile properties o f a nonwoven fabric based on the fibre orientation, fibre tensile
properties and the assumption that fibre segments between bonds were straight. Hearle
and Stevenson90,91 expanded this theory by taking account o f the effects of fibre curl.
They indicated that the stress-strain properties of a nonwoven fabric were dictated by
the orientation distribution o f fibre segments. Later, Hearle and Ozsanlav96 developed a
further theoretical model to incorporate binder deformation into the model. The FOD is
an essential param eter in constructing these models. However, little research has been
reported on the im portance o f the FOD on the liquid transport o f nonwovens.
24 Chapter 1
1.4.1.2 Porosity, Pore Size Distribution (PSD) and Porosimetry
Both the liquid absorption and liquid transmission of fabrics has been found to be
influenced by fabric porosity and pore connectivity. A considerable body of work has
been conducted in the area o f porosimetry.
The structural variables obtained in porosimetry that define the pore structure of a
nonwoven fabric include the pore size, pore size distribution, pore connectivity and the
total pore volume. Porosity provides information on the overall pore volume o f a porous
material. Pore connectivity, which is the geometric pathway in which the pores are inter
related, cannot be easily quantified and described. If the total pore area responsible for
liquid transport across any distance along the direction o f liquid movement is known, its
magnitude and change in magnitude are believed to indicate the combined
characteristics of the pore structure and connectivity.
The pore spaces between packed fibres may be calculated. The calculations are based on
simplified models of the fabric structure and have been developed in an attempt to
explain capillary liquid transport in porous media. W rotnowski97 proposed a simple pore
size prediction model based on the assumption that the fibres are of circular cross-
sectional pattern. This assumption permits a geometric calculation that gives an equation
for the circular pore size.
Lam bard98 and F au r" applied Poissonian line network theory to establish a theoretical
model o f the "opening sizing" of nonwoven fabrics. In this model, the fabric thickness is
assumed to consist of randomly stacked elementary layers, each layer has a thickness Te
and is simulated by two dimensional straight lines, (a Poissonian line network).

25 Chapter 1
The mass transport data from the simultaneous wetting and wicking test method
reported earlier100 have been used to generate information about the pores in the fabric
responsible for liquid transport along direction o f wicking. H sieh101' 102' 103 conducted a
series of experiments to illustrate the use of liquid mass transfer data to quantify the
pore area responsible for actual liquid movement, and attempted to probe the
significance of fibre properties in determining the liquid wetting and transport properties
of fabrics. It is claimed that the pore area profiles generated from the mass transport data
provides valuable quantitative data on actual liquid transport at a specific distance from
the liquid source. It was found that the pore structure of fibrous materials depends on the
fibre type and methods of fabric assembly. Fibre width, length and shape, as well as
fibre alignment were believed to influence the quality o f the capillary channels. The
pore size and the pore size distributions will be determined by the manner in which
fibres are assembled into fabric during the manufacturing process.
1.4.2 Liquid Transport Properties in Nonwovens Related to Wound Dressings
1.4.2.1 Liquid Transport and Permeability
Liquid transport is particularly important in wound dressing fabrics. D arcy’s law 104
introduces the specific permeability, which depends only on the structure o f the porous
material, and characterises the liquid flow through the material.
Numerous theoretical models describing the laminar flow through porous media have
been proposed to predict the permeability. The two most com mon models that are
thought to be suitable for fibrous porous media are the capillary channel theory and the
drag force theory. In models based on the capillary channel theory, the hydraulic radius

26 Chapter 1
models based on the work of Kozeny105 and Carm an106 treat the flow through a porous
medium as a conduit flow. Other modified capillary channel models are also proposed
107, io8, 109 j n £)rag f o rc e theory, the particles (or fibres) in the porous structure are
treated as obstacles to the fluid flow108, and various permeability equations of this type
are demonstrated by Iberall110, H appel111 and others112,113,114.
M any methods of measuring the permeability of fabrics have been proposed. Nguyen
and D urse115 used the syphon test to determine the planar permeability of fibre webs.
Also the relationship between permeability and saturation was later determined using a
semi-empirical relationship, which Gillespie116 used to find the permeability function for
filter paper. After comparing the results of the capillary pressure head as a function of
saturation using the column test and the permeability as a function o f saturation using
• 117the syphon test, in both cotton and polypropylene woven fabrics, Ghali et al suggested
a new method using a transient measurement technique to determine the permeability
which works well for both samples.
Shen118 derived a model showing that the water permeability in needle punched
nonwoven fabrics is proportional to the square of the fibre diameter and is a function of
fabric porosity. After comparing the derived model and other models based on drag
force theory, cell theory and empirical equations, he found that the newly derived
equation and H appels’ model111 gave the closest agreement with experimental data.
To isolate the effect of assembly structure, the water transport behaviour of single fibres
and fibre bundles consisting of a few fibres was investigated by Hiruku and Yoichiro119.
They measured the water transport along textile fibres by an electrical capacitance
technique, which is claimed to have potentially high sensitivity120,121.

27 Chapter 1
Some workers have studied the in-plane permeability of fabrics122, 123, 124. Adams and
Rebenfeld124 developed a method to quantify the directional specific permeability of
anisotropic fabrics using an image analysis apparatus that allowed flow visualisation.
M ontgom ery125 studied the directional in-plane permeability of geotextiles and gave
methods of obtaining the maximum and minimum principal specific permeabilities and
the resulting degree of anisotropy in geotextiles. However, this method is very complex.
Sluys and Diericky126 indicated that all the theoretical models describing laminar flow
show little correspondence with experimental data obtained for nonwoven geotextiles.
They suggested that the water permeability characteristics of geotextiles should be
127expressed as a discharge rate at a certain hydraulic loss .
1.4.2.2 Wettability and Wickability
To distinguish the terms wettability and wickability, Harnett and M ehta128 defined
wettability as the initial behaviour o f the fabric, yarn, or fibre when brought into contact
with liquid. They also stated that both wetting and wicking could be described by a
single process, i.e., liquid flow in response to capillary pressure. Therefore, the liquid
transport related to these processes can be described mathematically by D arcy’s Law 104.
According to K issa129, the wettability of a fibre refers to its ability to be wetted by
liquid. W etting of a fibre involves the displacement of a solid-air (vapour) interface with
a solid-liquid interface. Thus, the wettability of fibres depends on the chemical nature of
the fibre surface and the fibre geom etry130, especially surface roughness131.
The wettability o f a fibre is determined by the fibre-liquid contact angles132, and it is
usually evaluated by wetting force measurement using the W ilhelmy technique133, 134

28 Chapter 1
1 If 11(T l'J'7 1-10
and other methods ’ W etting of fibrous assemblies is a com plex process,
involving various wetting mechanisms, such as spreading, immersion, adhesion, and
capillary penetration, which may operate simultaneously139. Since wetting is determined
by the fibre-liquid contact angles, previous research work has been undertaken to
measure fibre-liquid and fabric-liquid contact angles, but the difficulty is always to
obtain reliable m easurements140.
In 1974, Bruil and Van Aartsen141 attempted to develop a method o f measuring the
angle o f contact on porous media based on W ashburn’s Equation142. They measured the
time taken by benzene, n-hexane, toluene, n-heptane, chloroform, acetone, dimethyl
formamide, ethanol, methanol, w ater and aqueous sodium dodecyl, and sulphate
solutions to advance through powdered aluminium, graphite, polyethylene, terephthalate
and nylon 11. Many of the angles they obtained were zero and a criticism of their work
was that the experimental error was very large143.
Hsieh and Yu 100 concluded that the wettability o f any fabric containing a single fibre
type is the same as its constituent single fibres. Additionally, they found that the
intrinsic wettability of fabrics depends on the chemical com position o f the polymeric
materials and that liquid retention is governed by the pore structure as well as the
properties o f the substrate.
After measuring the advancing and receding angles o f contact between water and yarns
of polyethylene, nylon6.6, polyester, and the angles between w ater and the individual
fibres by using the vertical rod method, Hollies et al144 found that all the advancing
angles of contact were about the same (83°) while for the yarns the angles of contact
were different (varying between 25°~108°). However, they found that the contact angles

29 Chapter 1
with woollen yarns were lower than the corresponding angles of contact for single wool
fibres. As a result, they concluded that the movement of w ater through the yarn is
directly related to the contact angle o f water with the yarns and not the contact angle of
water with the fibres constituting the yarn.
W icking is a particular mechanism of liquid transport in fabrics and wickability is
defined as the ability to sustain capillary flow 128. W icking is the spontaneous flow of
liquid in a porous substrate driven by capillary forces which is governed by the Laplace
equation130. Fibre wettability is prerequisite for the occurrence of wicking.
Capillary penetration o f a liquid might occur from an infinite (unlimited) or limited
(finite) reservoir. W icking processes from an infinite reservoir include immersion
absorption, trans-planar wicking, and longitudinal wicking. W icking from a limited
reservoir is exemplified by a liquid drop placed onto the fabric surface. M cLaughlin et
al145 studied immersion absorption in textile processing. W icking processes can be
divided into four categories :
(i). Pure wicking of a liquid without diffusion into the fibre surface.
(ii). W icking accompanied by diffusion o f the liquid into the fibres or into a finish
on the fibre.
(iii). W icking accompanied by adsorption by fibres.
(iv). W icking involving adsorption and diffusion into fibres.
From a consideration of the laws o f hydrodynamic flow through capillary channels,
Poiseuille146 first deduced the relation between the volume flowing through a narrow
tube and the difference in pressure across its ends. Based on Poiseuille’s equation,

30 Chapter 1
Lucas147 and W ashburn142 calculated the distance along which turbulence occurs and, by
converting the volume-flow in Poiseuille’s Equation into linear-flow in uniform
cylindrical tubes, they developed the Lucas-W ashburn’s Equation142. M any authors141,
us, 149, iso ^a v e sj10w n f j o w Qf i iq Uid s through porous structures obeys the
Lucas-W ashburn Equation. This equation accurately characterises the w ater penetration
in paper m aterials151. Similar analyses have been successful in studies o f soil152 and
leather153. Lord 154 also considered the theoretical capillary flow in a fibrous assembly to
consist o f a number of parallel capillaries.
However in reality, the structure of porous media, such as textile fabrics and
nonwovens, markedly differ from the simplified model o f uniform cylindrical capillary
tubes. The Lucas-W ashburn equation may be criticised because, arguably it incorrectly
assumes a constant advancing contact angle dA for the moving m eniscus155' 15f’. Also,
the equation does not take into account the inertia o f the flow 157, and implies that at time
0 and 1=0, the flow rate is infinite. Despite these limitations, a variety of liquids have
158been shown to obey the Lucas-W ashburn wicking kinetics .
For absorbent fibres, it is believed that the spontaneous flow o f liquid within capillary
spaces is accompanied by a simultaneous diffusion of the liquid into the interior of the
fibre or a film on the fibre surface159. The sorption of the liquid into fibres can cause
fibre sw elling160, 161, 162, thereby reducing the capillary spaces between fibres, and
com plicating the kinetics .
When the liquid contains surfactants, diffusivity and adsorption of the surfactant on the
fibre surface will affect the wicking flow . It has been observed that the wicking rate is

31 Chapter 1
proportional to the effective surface tension at the liquid front, if the fibres are
completely wetted by the surfactant solution158.
After simultaneous measurement of the liquid wetting and retention characteristics in
woven fabrics, Hollies et al144 reported that the rate at which water is transported
through yam s by capillary forces is determined by the fibre crimp, fibre denier, yarn
size and blend uniformity. They found that w ater moved more rapidly through fabrics
com posed o f highly hydrophobic synthetic fibres than through all-wool fabrics even
though wool is very hydrophilic in nature. This observation was explained by the
differences in yarn structure rather than the chemical nature of the fibre surfaces. They
also reported148 that the speed of the water travels in the capillaries could be changed by
altering the nature of the fabric structure, and they showed that the transport of water
through the yarns obeys W ashburn’s equation.
M dler et al found changes in liquid/water uptake for fabrics treated with durable press
resin or with hydrophobic or hydrophilic polymer. M am iko163,164 reported that the water
absorbency of fabrics soiled with various substances, such as oil and proteins, varies
depending on the fibres and the composition and amount o f soil. M am iko165 also studied
the correlation between wettability and water absorbency in soiled cellulose and
polyester fabrics and found a good relationship between the am ount o f oil on the soiled
surface and the liquid water uptake of the fabrics. However, he did not consider the
differences between the real geometric structure of the fabric and the assumed plain
surfaces o f the fabric.
In 1934, Peek et a l151 studied the movement o f organic liquids along filter paper. They
converted Poiseuille’s equation into linear flow and, like W ashburn, inserted the

32 Chapter 1
capillary and gravitational terms to obtain a generalised equation for the fluid flow
through porous media. By observing the transport of various liquids along a strip of
filter paper, the results demonstrated that W ashburn’s equation did describe the flow of
the liquid through the paper. However, it seems likely that whatever the distribution of
the capillary channel sizes, the distribution itself will be reasonably constant for paper
from a single batch.
Choi et al166 studied the oil absorbency o f needled cotton nonwovens and found that the
oil sorption of cotton fibre was controlled by adsorption on the fibre surface and
capillary action through the lumen. In contrast, the main mechanism in polypropylene
was through capillary bridges formed between fibres. It was also found that the sorption
decreased as the needling density increased.
There have been few systematic studies reported in the literature that elucidate the
absorption mechanism of blood and other bodily fluids such as serum. Choksi and et al
167 compared the differences between water and blood absorption in spun-laced
nonwovens. The expected linearity o f the liquid volume absorbed versus time was
observed with water while some deviation from this linearity and a generally lower
absorption rate was observed when blood was used as the test fluid.
1.4.2.3 Liquid Absorption as Unsteady State Flow
Liquid absorption can be studied as a steady state fluid flow in porous media (as
mentioned above), although in many practical situations the liquid is in fact an unsteady
state flow where the porous medium is not uniformly and com pletely saturated. There is

33 Chapter 1
usually a saturation gradient in the medium along the direction of flow and this
saturation gradient changes with time as the absorption process continues.
M any quantitative observations of the saturation gradients have been made in studies of
130capdlary liquid transport in filter papers, soil physics and water resources . By
combining the law of conservation of mass and the differential form of Darcy’s law, a
one-dimensional general equation for the saturation rate has been derived168,169:
ds _ d dt dt
F(s) — ox
( 1.2)
In this equation the diffusivity factor F(s) is related to the specific permeability k via
F ( s ) = (k / rj)(dp I ds ) / (p130. W here s (%) is fabric saturation, t (seconds) is time, * (mm)
is the liquid conduit distance, p (N/m2) is the hydraulic pressure, and f] (N*s/m2) is the
viscosity o f the liquid.
Many researchers168,169,130 have studied the constant diffusivity coefficient in the one
dimensional strip test. Semi-infinite boundary and other boundary conditions for one-
170 171 172dimensional diffusivity are also discussed in the literature ’ ' . Provided sv is
saturation at the visually observed advancing front and x v is the visually observed
advancing distance, and t is time, Rudd168 pointed out that is a constant and is
related to sv. This agrees qualitatively with the W ashburn equation142 with respect to the
proportionality between the wicking distance and yft .
For two- and three dimensional radial transport, the radial advancem ent o f the liquid
front of saturation will vary in proportion to the square root o f the w icking tim e130, and

34 Chapter 1
CIV — 1 1 7 (|the volumetric absorption rate — will be proportional to t 1 . It is also known that in
d t
both two- and three- dimensional flows the rates of liquid absorption decrease with time
and reach a constant value130.
1.5 SUMMARY AND THE OBJECTIVES OF THE PRESENT RESEARCH
The main points from the literature review can be summarised as follows.
(i) The optimum conditions for wound healing are a “moist wound healing
environm ent ” which can be achieved by suitably designed wound dressings.
(ii) Further studies o f liquid transport in fabrics are required for the proper design of
wound dressings to control the liquid flow within the fabric structure.
(iii) The specific permeability of a fabric depends only on the porous structure and is
used to characterize the liquid flow through porous media such as nonwovens.
M odels o f permeability have been previously established, but none have been
introduced to model the specific permeability of nonwoven fabric structures.
(iv) W icking is a specific type of liquid transport which is driven by capillary
pressure. W ettability is a prerequisite for wicking to occur. It can be described
by D arcy’s law 104 and the W ashburn’s equation142.
(v) An understanding of the relationship between anisotropic liquid transport and the
fabric structure is essential to enable improved design o f nonwoven structures
for use as wound dressings. At present, there is a paucity of work in this area.
35 Chapter 1
Although previous studies have been reported on the liquid transport properties of
nonwoven fabrics, most of the results have not elucidated the dynamic absorption
behaviour and the anisotropy of liquid absorption, both of which are believed to be
directly linked with fabric structure.
In order to improve our understanding of the liquid transport in nonwovens, the
objectives of this study may be listed as follows (with particular reference to wound
dressings):
1) To identify the structural parameters that influence the liquid uptake in
nonwoven fabrics and in particular to establish the importance of fibre
orientation on the liquid transport behaviour.
2) To establish a suitable method of measuring the anisotropy of liquid transport in
nonwoven fabrics.
3) To establish the relationship between the anisotropy of liquid transport in
nonwovens and the structural parameters of the fabric.

36 Chapter 2
CHAPTER 2 PRELIMINARY STUDIES: LIQUID TRANSPORT IN
NONWOVEN WOUND DRESSING FABRICS
2.1 INTRODUCTION
As indicated in Chapter 1, section 1.4.2.2, liquid absorption in fibrous structures such as
130nonwovens is believed to be driven by capillary pressure . In general, the wicking
behaviour of a nonwoven fabric depends on the structural architecture of the material
which is defined in terms of the pore size, pore size distribution, the shape of the pore,
fabric porosity, the chemical constituents of the fabric surface and the surface
morphology of the fabric. Also important are the bulk properties of the liquid (e.g.,
viscosity, surface tension and the wetting angle).
In nonwovens, the absorbency in the fabric plane is widely recognised to be highly
directional. Anisotropic liquid absorption in the fabric plane is also frequently observed
in paper. The capillary penetration in the machine direction of paper is typically 5-15%
higher than in the cross-direction .
In this chapter, the basic liquid absorption characteristics of commercial nonwoven
wound dressing fabrics is investigated using the standard strip test. This method is
173frequently used by the commercial manufacturers of wound dressings . An evaluation
of the anisotropy of liquid absorption in such fabrics is also presented using Darcy’s
law.

37 Chapter 2
2.2 THE VERTICAL AND HORIZONTAL STRIP TEST
Numerous tests have been used to characterise the liquid absorbency properties of
fabrics. The strip test involves suspending a strip of fabric, vertically or horizontally,
with one end dipped in a reservoir of liquid. Either the time for the liquid to reach a
certain level or the height of the advancing liquid front as a function of time is
recorded174.
Most nonwoven fabrics used in wound care have high porosity and they also tend to
have a high initial absorption rate. Thus, the time for the liquid to reach a certain level
by visual judgement is a comparatively simple approach and was adopted here. In this
method, the distance that the liquid travels in the porous medium is recorded by visual
judgement at predetermined time intervals. It is believed to have a relatively high
degree of reproducibility and enables the characterisation of the wicking behaviour of
porous media. The Vertical Strip test is described by EDANA175 (method 10.0-72 part
C), BS3424 method 2 1176 (Determination of resistance to wicking) and the amended
Tappi RC-8 method177. The rate of absorption is determined by the height of the fluid
head rising in the fabric per unit time. There is no standard for the Horizontal Strip test.
Although distilled water is normally used in the strip test, some researchers178, 179 have
reported the addition of a low percentage (0.05-0.2%) of acid dye in order to permit a
clearer indication of the wicking distance from the source. However, Lichstein179
criticised this method because the dye may not necessarily transport at the same rate as
the actual advancing water front. Therefore, distilled water is used in all the experiments
of liquid transport in this chapter and thereafter.
CLOTHWORKERS LIBRARY UNIVERSITY OF LEEDS

38 Chapter 2
It should be noted that the strip test is based on the wicking behaviour of fabrics, but
wicking may not occur if the contact angle between the fibre and the liquid is more than
90 degrees130. In practice, the surface tension of fibres influences this contact angle and
is affected by the chemical composition of the fibre and the finish applied.
2.3. MODELS OF LIQUID ABSORPTION IN NONWOVEN FABRICS DURING
THE STRIP TEST
In the vertical strip test, the height of the fluid front in the strip will gradually reach an
equilibrium when the capillary pressure, which drives the liquid upwards, is balanced
by the mass of water absorbed in the sample. In the horizontal strip test, if the supply of
water is unlimited, the rate of liquid penetration into the fabric will gradually become
constant.
2.3.1 Theoretical Models of Liquid Absorption in Nonwoven Fabrics
Numerous attempts have been made to elucidate the intricate mechanism of liquid
absorption in porous media. Two major theories thought to be appropriate for modelling
the liquid absorption in the strip test are the classical hydrodynamic model (the capillary
flow model or the Washburn’s equation) and the steady state flow model (Darcy’s law).
The theory of unsteady state flow (the diffusion analogy) is also available for modelling
liquid transport in fabrics, however it depends on complex mathematical methods and
assumptions that are difficult to verify in real nonwoven fabrics. Although a method
based on the unsteady state flow theory of measuring the liquid density in fabrics has

39 Chapter 2
been previously used for woven fabrics, the apparent unevenness and non-uniformity of
nonwoven fabric density makes the method unsuitable for nonwoven materials.
2.3.1.1 The Hydrodynamic Model
This classical approach has long been applied to porous media such as powder141 and
textile materials148,149.
2.3.1.1.1 The horizontal strip test
In the hydrodynamic model, the liquid sorption mechanism of a fabric is interpreted as a
flow through a system of capillary channels. Poiseuille’s equation is concerned with the
rate of flow in a tube in laminar, non-turbulent flow conditions and is expressed as
follows149.
Q _ d v _ 7ir4 Apdt 877 x
Where Q = volumetric flow rate [m /s],
v = volume of liquid absorbed [m3],
t = wicking time [s],
r = capillary radius [ /u m],
77 = viscosity of liquid [Ns/m2],
* = wicking distance [m],
Ap = the driving force of the fluid flow.
(2 . 1)
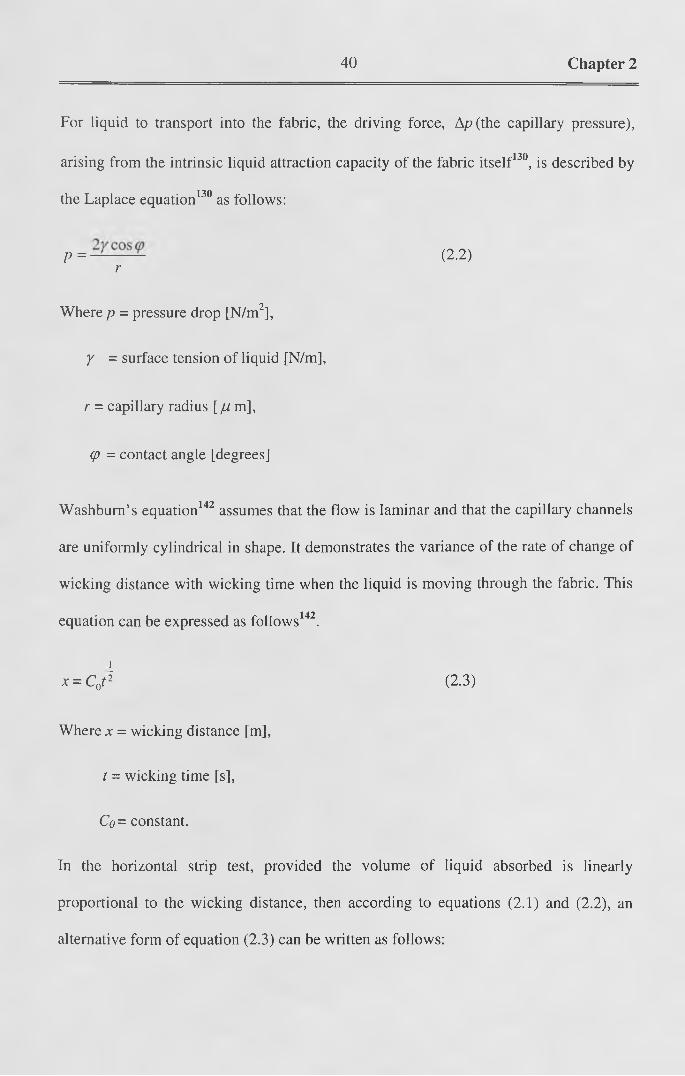
40 Chapter 2
For liquid to transport into the fabric, the driving force, Ap(the capillary pressure),
arising from the intrinsic liquid attraction capacity of the fabric itself130, is described by
the Laplace equation130 as follows:
p = (2 .2) r
Where p = pressure drop [N/m2],
y = surface tension of liquid [N/m],
r = capillary radius [ // m],
(p = contact angle [degrees]
Washburn’s equation142 assumes that the flow is laminar and that the capillary channels
are uniformly cylindrical in shape. It demonstrates the variance of the rate of change of
wicking distance with wicking time when the liquid is moving through the fabric. This
equation can be expressed as follows142.
]_x = C0t 2 (2.3)
Where x = wicking distance [m],
t = wicking time [s],
Co = constant.
In the horizontal strip test, provided the volume of liquid absorbed is linearly
proportional to the wicking distance, then according to equations (2 .1) and (2 .2), an
alternative form of equation (2.3) can be written as follows:

41 Chapter 2
ry cos (p
. 27 j
1 12t 2 (2.4)
2.3.1.1.2 The vertical strip test
Poiseuille’s equation for vertical linear flow through uniform cylindrical capillary
130channels has been given as :
dx _ ry cos (p r 2 pg ^ 5)dt Arjx 8 rj
Where p = the liquid density (g/cm3)
2g = gravity constant (9.8 m/s )
130When cos cp =1, equation (2.5) can be rewritten as follows :
o g i . m (2.6)r PS r P S { 2 r
• 180To obtain a simplified form of the relationship between t and x, Laughlin rewrote
equation (2.6) as follows:
p t = - h m l o g j l - - ^ (2.7)
Where hm = a/ h with a = r y c o s V. and b = ^ (2.8)m / b 4 n 8^
By using Taylor’s expansion181, when x « h m, the equation can be reduced to the form:

42 Chapter 2
The resulting equation (2.9) for the vertical strip test is the same form as equation (2.4),
which is the Washburn equation for horizontal absorption.
In other work, Law174 developed an equation for the mass transmission of water
absorbed during the vertical strip test as follows:
mvt - { 1-7 — ~ 7— \dt (2 -10)0 l*(0 m J
, pjir^y cos ̂ 7 , .where Bv = —------------— ( Kg ■ m s )Ar]
However, there are two persistent problems with the Washburn equations. The first is
the value of the time exponent which is 0.5 and the second is the quantitative definition
of the capillary radii, r.
The proportionality between the wicking distance and the time exponent 0.5 when the
wicking distance is plotted against 4 time has been a subject of controversy for many
years. In the paper industry, many researchers 182’ 183 have confirmed the proportionality
by experimentation; while others184' 185 have given evidence that the equation is
inadequate for describing the flow through porous media.
The difficulty in defining the capillary radii quantitatively was revealed by Chatterjee130
and Robinson186. According to them, the capillary channels in a real fabric:
1. Differ in size and shape. They are inter-connected as well as interdependent to form
a three dimensional network system.
2. They do not have circular cross-sections and are not uniform along their lengths.

43 Chapter 2
Any attempt to give an exact analysis of a fabric containing capillary channels on a
theoretical basis would be impracticable since in reality it is a much more complex
structure. However, most researchers have tended to adopt the average equivalent
radius174 to describe the capillary radius in porous media. The value of the average
equivalent radius is that of a cylindrical channel in which the rate of flow will be the
same as that in the porous media.
2.3.1.2 Darcy’s Law
Darcy’s law provides an alternative approach for investigating the wicking mechanism
in fabrics. It is an empirical formula that describes laminar and slow, steady-flow
through a porous medium in terms of the driving force gradient and the permeability of
the medium. This equation is written as follows170.
(2.11)77 Ajc
Where Q = volumetric flow rate [m3/s* m2],
AP = pressure difference [N/m2],
Ax = conduit distance [m],
k = specific permeability of sample [m2],
ri = viscosity of liquid [Ns/m ].

44 Chapter 2
If the term A Pin Darcy’s law is the capillary driving pressure as represented by the
Laplace equation130, then according to Poiseuille’s equation, the term — is numerically77
7TK̂and dimensionally equal t o ---- .
Srj
2.3.2 The Empirical Model for the Vertical Strip Test
Garner found that it is impossible to use the negative exponential function of time
x = b0( l - e ~ b'1) to describe the liquid flow in porous media (where bo = maximum
wicking height). Law174 found that the empirical equation (2.12) described much of the
experimental data of liquid absorption in woven fabrics. The equation is written as
follows:
x = b 2( l - ( l + b3t y b*) (2.12)
Where x= wicking height (m), Z?2 = maximum wicking height (m), bi, b3, b4 = fitted
constants, t = wicking time (s).
2.4 DETERMINATION OF THE ANISOTROPY OF PERMEABILITY IN
NONWOVENS USING THE VERTICAL STRIP TEST
Using the parameters measured in the vertical strip test, a model was established to
calculate the permeability of the fabric in the direction of liquid transport.
In the vertical strip test, the velocity and the liquid pressure gradient are not constant.
According to Darcy’s law104, the volumetric velocity of liquid transport in the strip of
fabric will be:

45 Chapter 2
, . dx k ( P - x { t ) p g )v(*,f) = — = - - ------- (2.13)
dt rj x(t)
When the liquid reaches its maximum height, hmm , the capillary force in the fabric will
be balanced by the weight of liquid absorbed and therefore the liquid will remain at a
constant height, /zmax. Therefore,
When x = hmM, v = 0 and P = hmmpg (2.14)
Also, the boundary condition for liquid absorption in a dry fabric at an initial time will
be:
When t=0, x(t = 0) = 0 (2.15)
Substituting equation (2.14) into equation (2.13), Darcy’s Law can be rewritten as
follows:
(2 . 16)dt rj x(t)
Substituting the boundary condition (2.15) into equation (2.16), we can obtain the
specific permeability of the fabric, k , as follows:
k = ^ - 1- pg t
A a x ) - 4 , )
- MO)(2.17)
Thus, in the vertical strip test, the ratio of the directional permeability the machine
direction ( kMD) to in the cross direction ( kCD) of the fabric, a k, can be written as
follows188.

46 Chapter 2
a k = ^ 2.= kCD
MD
C m ( 7 7 a ^ W O( m a x - ^ A fO w )
hCDft® ln( rn max------- ) - xCD(0
( h Z ~ x CD(t))
(2.18)
Where /t® is the maximum height the liquid reaches in the Cross Direction (CD) of
the fabric.
m̂ax is the maximum height the liquid reaches in the Machine Direction
(MD) of the fabric.
xMD(t)is the wicking height the liquid reaches in time t in the Machine
Direction (MD) of the fabric.
xCD (t ) is the wicking height the liquid reaches in time t in the Cross
Direction (CD) of the fabric.
This is a convenient means of expressing the anisotropy and was used in the
experimental work that follows.
2.5. PRELIMINARY EXPERIMENTS
2.5.1. Structural Characteristics of Commercial Wound Dressing Fabrics
Initially, four commercially available nonwoven wound dressing fabrics were
examined. The specifications of the fabrics are summarised in Table 2.1, in which the
fabric thickness, with and without compression, is measured according to the standard
189INDA method for high loft nonwoven fabrics . All the fabrics were single layer
nonwoven structures. Among the four commercial wound dressings, the Soffban
Synthetic and Lantor Sythetic products were made from synthetic, non-absorbent fibre.

47 Chapter 2
Soffban Natural is made from cellulosic fibre and Sorbsan is made from calcium
alginate fibre.
Table 2 .1(a) Thickness and porosity of commercial nonwoven wound dressing
fabrics (no compression)
FabricName
Fibre Type FibreDensity(g/cm3)
FabricThickness
(mm)
FabricDensity(g/cm3)
CalculatedFabric
Porosity
SoffbanSynthetic Polyester 1.39 2.00 0.046 0.967LantorSynthetic Polyester 1.39 3.00 0.025 0.982
SorbsanCalciumAlginate 1.75 0.80 0.273 0.844
SoffbanNatural Cellulose 1.49 2.50 0.048 0.968
Table 2 . 1(b) Thickness and porosity of commercial nonwoven wound dressing
2fabrics (with compression (105 N/m ))
FabricName
Fibre Type FibreDensity(g/cm3)
FabricThickness
(mm)
FabricDensity(g/cm3)
CalculatedFabric
Porosity
SoffbanSynthetic Polyester 1.39 0.479 0.192 0.862LantorSynthetic Polyester 1.39 0.450 0.169 0.878
SorbsanCalciumAlginate 1.75 0.415 0.528 0.695
SoffbanNatural Cellulose 1.49 0.535 0.224 0.849
2.5.2 Liquids Used During Testing
Distilled water was used as the test fluid in the strip tests and the experimental work
thereafter. Although it may be assumed that body fluids would be ideal for use as a test

48 Chapter 2
liquid in the experiments, there are some drawbacks. Firstly, real fluids are expensive
and secondly, no recipes have been reported which accurately reproduce the properties
of such body fluids. Also, there are no reports of an acceptable method for analysing
experimental results obtained for non-Newtonian liquids of this type. Distilled water is a
Newtonian fluid and has been widely used in previous strip test experiments. Also,
commercial manufacturers of wound dressings use distilled water to characterise the
performance of fabrics. For these reasons, distilled water was used as the test fluid
throughout.
2.5.3. Description of the Experimental Strip Test Procedure
2.5.3.1 The Vertical Strip Test Procedure190
Strip tests were carried out using a standard procedure190. Coloured lines with a
graduated scale of half centimetre intervals were drawn across the width of a strip of
fabric (dimensions 30 mm width x 100-120 mm length) by using a pen filled with
water-soluble ink. The dry strip of the fabric was suspended vertically in a frame, with
one end clamped onto the frame and the other end dipped in distilled water. When the
water reached the assigned interval, the wicking distance was recorded accordingly. A
ruler with millimetre divisions was placed parallel to the sample strip to enhance the
accuracy of the measurements. The wicking heights of water absorbed by the strip were
recorded at regular time intervals. Five sample strips were tested for each fabric.
2.5.3.2. The Horizontal Strip Test Procedure
The horizontal strip test is carried out with the strip held horizontally. The sample
preparation is the same as in vertical strip test and five sample strips were tested for

49 Chapter 2
each sample fabric. In order to prevent elongation of the nonwoven fabric during
testing, the two ends of the fabric were attached to the base of a framework, and then
suspended horizontally by several filaments of polyester filament. This approach
reduced the slackening effect that resulted when water was absorbed into the strip.
2.5.4 Porosity and Absorbency of Commercial Nonwoven Wound Dressing Fabrics
Liquid absorption in fabrics is driven by capillary pressure which largely relies on the
fabric porosity. The porosity of nonwovens will vary with fabric thickness which will
differ significantly depending on compression. When the fabric is saturated, voids in the
fabric will be filled with liquid. Thus, two porosity values can be obtained. One is the
calculated porosity obtained from the fabric thickness measured using the standard test
for highloft nonwovens189. The second is calculated from the dimensions of the
saturated fabric in the standard absorbency test190' 191. The porosities of the commercial
dressings under different test conditions are shown in Table 2.1. The associated liquid
absorptions of the fabrics are listed in Table 2.2.
Table 2. 2 Porosity and absorbency of commercial nonwoven wound dressings
FabricName
FibreType
Fibre Diameter { f jm )
Water Absorption ( i:'.u i i \ ___
FabricThickness(mm)
AreaDensity(g/m2)(g/g) (g/m2)
SoffbanSynthetic Polyester 13.6 23.8 2439.2 0.479 98.2LantorSynthetic Polyester 13.0 28.9 2277.8 0.450 78.9
SorbsanCalciumAlginate 12.4 7.1 1549.6 0.415 219.1
SoffbanNatural Cellulose 15.8 55.3 2118.0 0.535 38.3

50 Chapter 2
The relationship between the liquid absorbency and the fabric porosity for the four
commercial fabrics is plotted in Figure 2.1.
It is clear from Figure 2.1 that fabrics with the higher porosity, (irrespective of fibre
composition), have higher absorption capacities. The fabric containing gelling fibres
(Calcium alginate), had the lowest porosity and also has the lowest liquid absorption
capacity.
The porosity of a nonwoven fabric characterises the percentage void volume in the
fabric. The voids occupied by air will be filled with liquid when the fabric is saturated
during liquid absorption. However, if the fabric porosity is too high, it might be difficult
to retain the water in the fabric structure. Thus, the liquid absorption capacity of
nonwoven fabrics relies mainly on the structural architecture of the fabric. In this work,
the absorbency was found to be related to fabric porosity (see Figure 2.1), this is
believed to explain why Sorbsan has a unusual low liquid absorbency in Table 2.2.
Figure 2 .1 Liquid absorbency vs. porosity for commercial nonwoven wound
dressing fabrics

51 Chapter 2
2.5.5 Anisotropy of Liquid Absorption in the Commercial Dressings
Experiments showed that the dressings consisting of synthetic fibres did not wick at all.
This is believed to be due to their high water-fibre interface tension. Only the samples
composed of absorbent fibres (Cellulose and Calcium Alginate) supported wicking in
the strip test. The experimental results are shown in Table 2.3.
The anisotropy of liquid absorption in the fabrics can be expressed in one of the
following forms:
1. The ratio of the maximum rise height in the MD to the CD in the vertical strip test
(«*)•
2. The ratio of the initial wicking rate in the MD to the CD in both the vertical and
horizontal strip tests ( a v).
2.5.5.1 Vertical Strip Test Results
The maximum wicking heights in the MD and CD obtained in the vertical strip test for
each fabric are shown in Table 2.3. The plots of wicking height versus time in both the
CD and MD during the vertical strip test for each fabric are presented in Figures 2.2 and
2.3 respectively.

52 Chapter 2
2.5.5.1.1 Anisotropy of the Wicking Height
In Table 2.3, it may be noted that the liquid rise height in the vertical strip test, for both
the cellulosic fabric and the alginate fabric, is generally higher in the machine direction
(MD) than in the cross direction (CD).
It was indicated, in section 1.4.2.2 in Chapter 1, that the liquid absorption in nonwoven
fabrics is driven by capillary pressure between fibres, which is governed by both the
geometrical structure of the fabric and the water-fibre interface properties according to
the Laplace Equation. In idealised, homogeneous nonwoven structures, structural
parameters such as fibre type, fibre diameter, fibre length and fabric weight will be the
Table 2. 3 Absorption rate and anisotropy of absorption in commercial dressings in
the Horizontal and vertical strip tests
Fabric
Name
Fibre
Type
Vertical test Horizontal
test
Anisotropy of
absorption in
the vertical
Strip test
K™ (cm) x(t) (cm)
MD CD MD CD MD CD
hMDmax hCDmax XCD (0 w o
Sorbsan
Calcium
Alginate
5.8 4.8 T=90 Sec. T=35 Sec 1.47
4.0 3.0 6.0 5.0
T=500 Sec. T=65 Sec. 1.48
5.0 4.0 9.6 7.2
Soffban
Natural
Cellulose 3.9 2.4 T=150 Sec. T=80 Sec. 2.18
2.5 1.2 6.0 5.5
T=500 Sec. T=17C Sec. 2.14
3.0 1.6 9.0 8.5
same in all directions. However, this is not the case with respect to the fibre orientation
distribution and it may be suggested that the anisotropy of liquid absorption in the plane

53 Chapter 2
of a nonwoven fabric will be largely determined by the anisotropic structure of the
fabric. In other words, the anisotropy is thought to reflect differences in the fibre
orientation in the MD and CD of the fabric plane.
Referring to Table 2.3, it is apparent that the fabric composed of Calcium Alginate
(Sorbsan) has a higher rise height than the fabric consisting of Cellulose (Soffban
Natural) in both the MD and CD respectively. In order to compare the anisotropy of the
two fabrics, the ratio of the maximum rise heights in the CD and MD for each fabric has
been calculated. The anisotropy of the maximum wicking height in the Sorbsan dressing
6cm 3 8cmwas, a h = ------= 1.2, compared to CCh = —------ = 1.583 in the Soffban Natural
5cm 2.4 cm
dressing.
It is apparent from these results that the Soffban Natural dressing has a greater
anisotropy than Sorbsan. The reason for this can only be speculated since there are
many differences between the two fabrics with respect to their structure and fibre
compositions, e.g., porosity, fibre diameter and fibre orientation distribution.
Consequently, it is not clear whether the differences in the anisotropy of liquid
absorption in the two fabrics is due to differences in fibre type or due to structural
differences in the fabrics.
2.5.5.1.2 Anisotropy of the Wicking Rate
The wicking rate is defined as the time taken for a liquid to rise one inch in the fabric
during absorption190. Here, it is defined as the wicking height per unit time. As indicated
in Figure 2.2, the wicking rate decreased with increases in rise height for the
commercial fabrics. Besides differences in the maximum rise height in the machine and

54 Chapter 2
cross directions indicated in section 2.5.5.1.1, it was noted that the absorption rate
(shown in Figure 2.2) in the MD was generally higher than that in the CD for both
commercial fabrics. Again, this is believed to reflect structural differences in the two
fabrics.
Figure 2. 2 Plots of rise height vs. time for commercial wound dressing fabrics
(Vertical Strip Test, test fluid: Distilled Water)
a) Soffban Natural (Machine Direction)
E 60 E.£ 50 o>H 40
0 4__----------------------------T-----------------------------------T-----------------------------------I
0 5000 10000 15000
Tim e (Seconds)
b) Soffban Natural (Cross Direction)
c) Sorbsan (Machine Direction) d) Sorbsan (Cross Direction)
Similarly, the fabric composed of alginate (Sorbsan) exhibited a higher liquid
absorption rate than Soffban Natural (composed of cellulose fibres) in both the CD and
MD. The ratio of the average wicking rate in the MD to the CD (for the first 500
seconds of the test) for Sorbsan and Soffban Natural was measured as indicated in Table
2.4.

55 Chapter 2
Table 2. 4 Anisotropy of the liquid absorption rate in vertical strip tests
Sorbsan Soffban Natural
5.0cm ,a v = -------- = 1.25
4.0cma„ = 2-5cm = 1.56
1.6cm
In Table 2.4, it is apparent that Soffban Natural has a greater anisotropy of the average
absorption rate than Sorbsan. It is interesting to note that both the anisotropy of the
wicking height and the anisotropy of the average absorption rate for the two fabrics
follows a similar trend.
2.5.5.2 Horizontal Strip Test Results
In order to exclude the influence of gravity on the liquid absorbed by a fabric,
horizontal absorption strip tests may be used. Theoretically, the liquid displacement
during wicking is unlimited in the horizontal strip test if the length of the sample strip is
also unlimited. Thus, the maximum wicking distance cannot be used to calculate the
anisotropy. However, the anisotropy of the average wicking rate in the fabric in both the
CD and the MD can be obtained, the experimental results are shown in Figure 2.3.
Table 2. 5 Anisotropy of liquid absorption rate in the horizontal strip tests
Sorbsan Soffban Natural
200 1a v = -----= 1.14175
115a v = -----= 1.77
v 65
It is apparent in Figure 2.3 and Table 2.5 that the absorption rate during the horizontal
test is much higher than in the vertical test. For the fabric consisting of calcium alginate
fibre (Sorbsan), the anisotropy of the wicking rate in the horizontal strip test was
smaller than the anisotropy in the vertical strip test. In contrast, for Soffban Natural, the
anisotropy of the wicking rate in the horizontal strip test was obviously greater than in

56 Chapter 2
the vertical strip test. The reasons for this are not clear but it is reasonable to assume
that it may be due to differences in the internal structure of the two fabrics.
As in the vertical strip test, the horizontal test indicated that the liquid absorption rates
for the Sorbsan fabrics consisting of calcium alginate were markedly higher than for the
fabrics containing cellulose fibre (Soffban Natural) in both the MD and CD. It remains
unclear if this is due only to differences in fibre type, the fabric structure or to both fibre
and fabric structure.
Figure 2. 3 Plots of rise height vs. time for commercial wound dressings
(Horizontal Strip Test, test fluid: Distilled Water)
b) Soffban Natural (Cross Direction)
c) Sorbsan (Machine Direction) d) Sorbsan (Cross Direction)

57 Chapter 2
2.6 SUMMARY OF PRELIMINARY STUDIES AND CONSIDERATIONS
It has been established that there is significant anisotropy of liquid absorption in
commercial nonwoven wound dressing fabrics, and this is evident in both the vertical
and the horizontal strip tests. Generally, it is believed that anisotropy in both mechanical
and electrical properties are determined by anisotropy of the fabric structure90, 93.
Although differences in the anisotropy of liquid absorption have been found in fabrics
consisting of different fibres, it is not clear whether this difference is caused by the
fabric structure or by the liquid handling characteristics of the fibre itself.
Although it may be speculated that the anisotropy of liquid absorption is due to the fibre
orientation distribution in the fabric, there is no direct evidence to prove this and there
have been few studies demonstrating the relationship between the fibre orientation
distribution and the anisotropy of liquid absorption. Furthermore, there is little research
available that shows how fabric structural parameters, such as fabric porosity and fibre
diameter, influence the anisotropy of liquid absorption. Thus, in order to improve
understanding in this area, it is necessary to find an effective way to measure the fibre
orientation distribution in nonwoven fabrics and moreover, to establish relationships
between fabric structural parameters and the liquid transmission rate.
In the strip test experiments, it was also found that there are limitations in the measuring
methods used to assess liquid absorption in nonwovens. Since the wicking height of the
liquid in the fabric under test is judged visually and recorded manually, and because the
wicking rate in many nonwovens is very high (especially in the initial stages), it is
difficult to obtain accurate measurements. Moreover, in the horizontal strip test,
measuring error becomes so large that it is impossible to record the correct initial

58 Chapter 2
wicking displacement with time because of the rapid spreading of the liquid in the
horizontal plane of the fabric.
As the liquid is absorbed, it spreads in the fabric plane and not necessarily at the same
rate in different directions. Furthermore, strip tests only provide a measure of the liquid
absorption in one direction at a time during each test and thus are of limited use in any
comprehensive study of anisotropic liquid absorption. Therefore, it is necessary to use a
method that allows measurement of the anisotropy of in-plane liquid absorption in
multiple-directions simultaneously, this is discussed in Chapter 3.
From the preliminary experimental results, it is apparent that the overall absorbent
capacities of commercial nonwoven wound dressing fabrics depends mainly on the
porosity of the fabric, which in turn depends on other fabric parameters which will
influence the variation of fabric porosity.

59 Chapter 3
CHAPTER 3 DEVELOPMENT OF AN INSTRUMENT TO
MEASURE THE ANISOTROPY OF LIQUID
TRANSPORT IN NONWOVEN DRESSING
FABRICS
In Chapter 2, it was demonstrated that anisotropic liquid transport is observed in
commercial nonwoven wound dressing fabrics composed of different types of fibre, and
it was suggested that this anisotropy is influenced by anisotropy in the structure of the
nonwoven fabric itself. Thus, one important focus of this study is to establish the
relationship between anisotropic liquid transport and nonwoven fabric structure, and to
achieve this it was necessary to find a suitable measurement method for the
determination of liquid transport in multiple directions in the fabric plane. Such a
method should be capable of measuring liquid transport dynamically. This Chapter is
concerned with a comparison of existing methods for the measurement of liquid
transport using either steady-state or dynamic measuring approaches. Subsequently, a
new computer-integrated apparatus for the real-time measurement of the volumetric
flow rate in nonwoven fabrics is described.

60 Chapter 3
3.1 COMPARISON OF MEASUREMENT METHODS FOR THE ASSESSMENT
OF LIQUID TRANSPORT IN FABRICS
3.1.1 Definition of Terms
3.1.1.1 Cross-Plane Liquid Flow and In-Plane Liquid Flow
Liquid transport in fabrics may take place in the fabric plane or perpendicular to the
fabric plane. The magnitude of liquid transport in fabrics perpendicular to the fabric
plane cannot be used to explain the transport characteristics in the fabric plane.
Consequently, separate test methods are required to evaluate the two properties.
3.1.1.2 Liquid Absorption and Forced Flow in Fabrics
There are two main types of liquid transport in fabrics130. One is referred to as liquid
absorption which is assumed to be driven by capillary pressure in the fabric. Here, liquid
is taken up by a fabric through a zero or negative hydrostatic pressure gradient. The
other type of liquid transport is referred to as forced flow, where liquid is driven through
the fabric by an external pressure gradient.
The liquid absorption that takes place when one edge of a fabric is dipped in a liquid so
that the liquid is absorbed primarily in the plane of the fabric is called wicking. When
the liquid front enters through the face of the fabric, reference is made to demand
178absorbency or spontaneous uptake. Cary and Sporles compared such test methods in
connection with the liquid absorption of paper towels. The measurement methods
evaluated included point source and plate source demand wettability tests, wicking
measurements (the Cobb192 and Klemm test177 and gravimetric absorbency tests193,194).
The Cobb test measures the rate of liquid absorption in terms of the amount absorbed,

61 Chapter 3
whereas the Klemm test measures the linear rate of advance of liquid in the paper
sample. In practice, they found only a few of these test methods provide useful
results178.
Forced flow through the plane of a fabric can be performed in one of two ways:
(1) The liquid is forced through at a constant velocity and the resistance to passage is
measured in some manner, or
(2) The liquid is forced through at a fixed pressure gradient and the resultant flow rate is
monitored.
There are also two alternatives for the second case. Either the driving pressure remains
constant or alternatively it is systematically increased with time. The latter arrangement
is convenient for establishing the critical breakthrough pressure of a fabric barrier.
Experimental study of forced flow through fabrics in some cases may also be used to
study spontaneous uptake195.
3.1.1.3 Steady State and Dynamic Measurements
Measurement methods for liquid transport in fabrics can be classified as either ‘steady
state’ or ‘dynamic’. In steady state methods the liquid absorption characteristics of a
fabric are measured momentarily when the reading is constant, and in dynamic methods,
the liquid absorption is continuously measured in real time. Although numerous
methods of measuring the liquid transport in fabrics have been proposed, only those
methods that are also capable of revealing the anisotropic characteristics of the liquid
transport rate in fabrics and which also have the potential to be used for nonwoven
fabrics are reviewed in this Chapter.

62 Chapter 3
3.1.2 Steady-State Measurement Methods
Some steady-state methods only allow qualitative assessment of liquid absorption
characteristics, and those that give quantitative results are of variable accuracy. The
wicking rate, expressed in terms of either wicking displacement or liquid mass, is
usually the main parameter measured in steady-state methods to represent the liquid
absorption capability of fabrics. Usually, most of these methods provide limited
information on the liquid movement in the fabric structure during absorption.
3.1.2.1 The Longitudinal Wicking "Strip" Test
The most widely used method is the vertical strip test of which there are two types. The
rate of liquid absorption may be measured in terms of the amount of liquid absorbed, or
in terms of the linear rate of advance of the liquid in the sample. The main standard test
methods are:
1. BS3424-18, method 21(1988)176: Methods for determination of the resistance to
wicking and lateral leakage.
2. ED ANA method 10.2-96 part C (1996)175: Liquid wicking time.
3. INDA, IST10.1 (1995)190! Standard test method for absorbency time, absorbency
capacity, and wicking rate.
There are some differences in these test procedures. The BS3424-18 (Method 21),
specifies a very long test period (24h) and is intended for coated fabrics with very slow
wicking rates. In contrast, EDANA 10.2-96 specifies a much shorter test time
(maximum 5 min) and applies to fabrics that exhibit rapid wicking. A diagram of this

63 Chapter 3
method is shown in Figure 3.1(a). In this test, the fabric is first conditioned at 20°C,
65% relative humidity for 24 hours. A strip of the test fabric is suspended vertically with
its lower end immersed in a reservoir of distilled water. After a fixed time has elapsed,
the height reached by the water in the fabric above the water level in the reservoir is
measured. The height is taken as a direct indication of the wickability of the test fabric.
198Figure 3.1 Steady-state testing methods
pf---------- t e s t f a b r i c
(a) Strip test (b) Demand absorbency test
TRESERVOIR
t e s t FABRIC --------- *
COLLECTING ------ *BEAKER —
(c) Drop test (d) Syphon test
This strip test method is useful for determining the rate of advance of the liquid front,
and it can be used either in fabrics that exhibit rapid or slow wicking. Samples for
testing can be taken in different directions in the fabric and therefore it can be used to
WEIGHT RESERVOIRWICK
L y

64 Chapter 3
determine differences in the liquid absorption rate in different directions in the fabric
plane. Also, the method can be modified to measure horizontal wicking by measuring
148the rate of advance of the liquid front .
However, strip test methods involve measuring the position of the advancing front and
comparing the heights of the rise in different fabrics. They do not allow a comparison of
the mass transfer rates unless the fabrics are of a similar structure and thickness.
Another disadvantage of the method is that there is no provision for measuring the mass
of liquid that is wicked in a given time.
3.1.2.2 Demand Absorbency T est196
The Demand Absorbency Test is sometimes referred to as the demand wettability test,
or the transverse wicking "plate" test (see Figure 3.1(b)). In demand tests, the liquid will
only enter into the fabric when the sample demands it. These tests involve contacting the
dry sample with a liquid in such a way that absorption occurs under a zero or slightly
negative hydrostatic head. The method has been used by Buras et al196 on cotton fabrics
and Korner et al197 on porous acrylic fabrics (or fabrics produced from other fibre
types). No test standards for this method are currently available.
If the liquid is introduced from a point source in the fabric, it becomes a dynamic
measurement method known as the Point Source Demand Wettability Test179. This
method is effectively a two-dimensional radial wicking test and may be more useful in
measuring the rate of fluid uptake than the strip test.
A classic example of this type of tester196 is shown in Fig. 3.2. The device consists of a
filter funnel fitted with a glass plate that is connected to flexible tubing and to a

65 Chapter 3
horizontal length of capillary glass tube. The horizontal sintered glass plate is fed from
below with water from a horizontal capillary tube, the level of which can be set so that
the upper surface of the plate is filled with an uninterrupted column of test liquid and
kept damp. This is often used to simulate a sweating skin surface. A disk of the test
fabric is placed on the plate and held in contact with it under a defined pressure applied
by placing weights on top of it. The position of the meniscus along the capillary tube is
recorded at various time intervals as water is wicked along the fabric layer. Given the
diameter of the capillary tube, the recorded data can be used to calculate the mass
transfer rate of water into the fabric.
Figure 3. 2 Instrument for measuring demand wettability196
The strength of the porous plate technique lies in its ability to provide fundamental
information on the absorbency and structure-property relationships of absorbent systems
as well as its high degree of sensitivity. The limitations of this method are its inability to
measure the liquid absorbency in the fabric plane and there is a tendency for the porous

66 Chapter 3
plate to clog, creating a reproducibility problem. A further problem with this method is
that the mass transfer rate is strongly dependent on the applied pressure, particularly for
bulky fabrics. The structure of bulky fabrics may change considerably under greater
compression, and low compression may not give uniform perforated plate—fabric
contact. Another criticism of the method is that the resistance to flow imposed by the
capillary tube decreases during the course of the test, as water is withdrawn from the
tube, although this can be improved by replacing the capillary tube by an air bleed
system179. A further limitation is that the hydrostatic head in the system, which is set a
low level at the start of the experiment, decreases during the test as water wicks up
through the fabric sample. This could be a particular problem with thick fabrics.
Although the method is complex, if the device is properly maintained, and the
limitations of the method are recognized, it has potential as a research tool for the study
of liquid absorption.
3.1.2.3 Areal Wicking "Spot" Test
This method is based on modification of the following standard test methods:
(i). BS3554 (1970): Determination of wettability of textile fabrics.
(ii). AATCC method (39-1977): Evaluation of wettability, the "Spot" test attempt
to measure the in-plane wickability, or the capability of a liquid drop to
spread over the fabric.
As shown in Figure 3.1(c), a drop of liquid (either distilled water, or, for highly wettable
fabrics, a 50% sugar solution) is delivered from a height of approximately 6 mm onto a
horizontal specimen of the test fabric ( preconditioned at 20°C, 65%RH). The region of

67 Chapter 3
the fabric on to which the drop falls is illuminated by a beam of light to create bright
reflection from the liquid surface, and the elapsed time between the drop reaching the
fabric surface and the disappearance of the reflection from the liquid surface is
measured. The disappearance of the reflection is assumed to indicate that the liquid has
spread over and wetted the fabric surface. The elapsed time is taken as a direct measure
of the fabric wettability. The shorter the time, the more wettable the fabric.
There are two ways to express the results. One is to measure the area of the wetted
region of the fabric at the moment reflection ceases, or to record the mass of the liquid
absorbed as a percentage of the dry weight of an area of fabric equal to the area of the
wetted region198. The other approach is to replace the drop by a continuous supply of
liquid (delivered by a capillary tube or a saturated fabric ‘wick’ in contact with the test
specimen) and to measure the rate of increase in diameter of the wetted region199.
However, the results of this method are relatively inaccurate because only indirect
readings are possible. For the single drop test, the results are dependent on the local
fabric structure, and therefore the measurements are subject to marked variation even
within the same fabric.
3.1.2.4 Syphon Test
The Syphon test (as shown in Figure 3.1(d)) measures the rate of drainage rather than
the wicking rate. No standard for this test exists. The method has been reported by
Lennox-Kerr199 on acrylic and porous acrylic polymers, by Tanner200 (on cotton,
polyester/cotton, and polyester/acrylic blends), and by Hardman128 on polypropylene,
wool, polyvinyl-chloride, and blends.

68 Chapter 3
A rectangular strip of the test fabric is used as a syphon, by immersing one end in a
reservoir of water or saline solution and allowing the liquid to drain from the other end
which is placed at a lower lever, into a collecting beaker. The amount of liquid
transmission at successive time intervals can be determined by weighing the collecting
beaker199.
This method measures the rate of liquid transport under external pressure not the volume
of liquid absorption. Because the fabric has been saturated, it has a lower resistance to
flow than dry fabric and therefore the test results do not indicate the true wicking rate.
Also, a comparison of the results provided by this method have shown that the method
128is not appropriate for measuring wicking properties .
In all the steady state measurements methods discussed above, the spot test (continuous
supply) or strip test are suitable for measuring liquid absorption in the fabric plane,
while the transverse plate test is suitable for measuring liquid absorption perpendicular
to the fabric plane.
3.1.3 Dynamic Measurement Methods
Dynamic liquid transport measurements are obtained either from volumetric flow rate
data or from qualitative observations of the advancing fluid front in fabrics149, 201. The
latter case does not yield accurate results, since the position of the advancing front is not
obvious in all cases, especially for nonwoven structures of high porosity because of the
so-called finger-effect202. Local variations in fabric density and therefore pore size may
cause substantial deviations from the average velocity value obtained from the
volumetric flow rate data. Other dynamic techniques yield only overall values and do

69 Chapter 3
not provide detailed directional quantitative information about the actual dynamic
transport process occurring in the fibrous assembly121,203,204,20s. Thus, it is apparent that
only some dynamic techniques can provide detailed directional quantitative information
about the actual dynamic liquid transmission process in fibrous assemblies.
The major test methods used in industry for dynamic measurement of the liquid
transport properties of fabrics are now summarised.
3.1.3.1 Modified Laser-Doppler Anemometry (MLDA)
MLDA is based on the Doppler principle203. One example of the method is shown in
Figure 3.3. When a laser beam is passed through a flowing liquid, light is scattered by
the particles suspended in the liquid. The scattered light is subject to a frequency shift
and contains information about the velocity of the particles which can then be examined
by electro-optical techniques. This measurement therefore requires that the flow
medium be partly transparent and contain particles that scatter light. Howald and
Yoganathan203 used this method to obtain the local velocity of liquid flow in a
nonwoven fabric. MLDA has the following advantages:
(i). No probes need to be inserted into the flow field of interest.
(ii). No calibration is required.
(iii). It has a high signal-to-noise ratio and can therefore be used with good
accuracy to measure velocities in highly disturbed flow fields.
(iv). Good accuracy is achieved in measuring velocities close to surfaces.
(v). It has a high-frequency response (at least 105Hz).

70 Chapter 3
(vi). It can distinguish between forward and reverse flow directions.
One problem with MLDA is that it requires the flow medium to be transparent and to
contain particles that can scatter light. These requirements limit its uses. Furthermore,
the equipment needed is very complex and expensive.
Figure 3. 3 Block diagram of Modified Laser Doppler Anemomter (MLDA)203
3.1.3.2 Electrical Capacitance Techniques
An electrical capacitance technique was adopted by Ito and Yoichiro119 to investigate
the effect of fibre properties on liquid transport behaviour in unidirectional fibre
bundles. Tagaya et al121 also developed a similar apparatus to measure relatively large
volumes of water transport through fabrics, as shown in Figure 3.4.
The principle of the method is based on the fact that the dielectric constant of water is
about fifteen to forty times higher than that of normal fibres and fabrics, and therefore

71 Chapter 3
the capacitance of a transducer in a measuring system will be very sensitive to the
amount of liquid absorbed by a fabric. The measuring technique can be used in both
vertical wicking and horizontal wicking tests and it is easy to use. Furthermore, the
measurement data can be imported into a computer for processing. The method can
provide both local and dynamic (real time) measurements of the wicking rate in terms of
the volume of liquid absorbed.
Problems in testing nonwovens may arise because in saturated fabrics significant
geometric deformations may influence the capacitance values. Also, different types of
fibrous material may have different dielectric constants, which can lead to difficulties
when comparing different materials.
• 121Figure 3. 4 Block diagram of electrical capacitance technique
©
Key,
(I) Square wave generator, (II) I/V converter, (III) Full wave rectifier, (IV) Binary
A/D converter, (V) Binary BCD converter, (VI) Digital display, (VII) RAM, (VIII)
Timing control circuit. (IX) Monitoring oscilloscope, (X) D/A converter, (XI)

72 Chapter 3
Recorder, (A) Photosensor (Led and Phototransistor), (B) Capacitance electrode, (C)
Stepping motor and linear head, (D) Driver and controller circuit for stepping motor,
(E) Vessel, (F) Sample.
3.1.3.3 Electronic Micro-balance Method
There are two types of micro-balance method in use. One method is an extension of the
vertical strip test and measures the mass of liquid absorbed in the fabric plane204. The
206other method originated from the demand wettability transverse plate method and
measures the liquid absorbed perpendicular to the fabric plane.
An electronic micro-balance is used in the vertical strip test to measure the liquid
wetting, transmission and retention properties in vertically suspended woven fabrics (see
Figure 3.5). The device204 is perhaps the most convenient to use among all the dynamic
test methods. The test values are not influenced by environmental conditions, but it can
only be used in vertical wicking tests.
The results from this method have been criticized because it is very difficult to maintain
the fabric ends in an accurate position to obtain the correct critical contacts with the
liquid reservoir.
One dynamic method modified from the transverse porous plate method and combined
with the electronic balance method is called the Gravimetric Absorbency Testing
System (GATS) (see Figure 3.6) developed by TRI194. The GATS system is based on
the principles of a Swedish standard method where the amount of liquid absorbed is
determined gravimetrically. This method is a more sophisticated instrument than the
plate demand wettability method as shown in Figure 3.6. Instead of horizontal tubing or

73 Chapter 3
a burette with an air bleed, the liquid source is a relatively large vessel resting on top of
an electronic balance via a coil spring. The coil spring has a predetermined Hooke
constant207 and is capable of compensating the weight loss (due to absorption of liquid
by the fabric) or weight gain (due to exsorption) of liquid in the vessel such that the
liquid level can be maintained constant.
Figure 3. 5 Electrical micro-balance method for measuring liquid absorption204
The amount of liquid absorbed is measured continuously by the electronic balance. The
amount absorbed as a function of time can be recorded continuously via a strip chart
recorder (or digitally via a computer). The advantage of this design, other than its ability
to record infinite signal changes, is its flexibility in removing or returning the liquid and
the application of a large amount of liquid for test. A wide variety of test cells allowing
different modes of contacting the absorbent sample and the liquid, (including the porous
plate and a point source), can be used with this equipment. Also, the system may
incorporate a sample thickness measuring device which allows continuous monitoring
of the change in bulk volume under a constant load. The load can be programmed to
allow cyclic loading tests.

74 Chapter 3
Figure 3. 6 Block diagram of GATS technique194
Figure 3. 7 Demand wettability test206
However, the method does not allow measurement of the anisotropy of liquid uptake by
fabrics.

75 Chapter 3
Figure 3.7 illustrates another instrument that uses an electronic balance and a computer
to record and process the measurement data206. It indicates the dynamic variance of the
liquid uptake process vs. time.
3.1.3.4 Measurement Using Image Analysis
Image analysis can be used to track the advancing fluid front. Two types of image
analysis method have been reported. One is used in conjunction with the vertical strip
test, the other is used for determining the in-plane radial liquid transport in the fabric
plane. It has been used to measure the anisotropy of liquid transport in the fabric
plane124.
Figure 3. 8 Simple imaging method for liquid drop detectionJ15
Kawase et al205 used a simple image analyzer to determine the capillary spreading of
liquids in the fabric plane (see Figure 3.8). The apparatus used in his studies comprised
a desiccator with a 200 mm diameter. The cover had an orifice for inserting a
micropipette. The liquid used was n-decane which was placed at the bottom of the
desicator to minimize volatilization of the liquid spreading in the fabrics. To aid

76 Chapter 3
observation of the liquid spreading in test fabrics, the n-decane was dyed with a 0.1%
solution of Sudan IV or acid blue 9. The fabric was mounted on a 12.0 cm wooden ring
(embroidery hoop) and placed into the desicator along with a stopwatch. The cell was
covered and the fabric was left for at least 2 hours. A measured amount (0.05 to
0.20ml) of liquid was introduced onto the fabric by a micropipette. The area of the
spreading liquid and the reading on the stopwatch were recorded simultaneously using a
video camera (see Figure 3.8). The temperature of the apparatus was maintained at
25°C during the experiment.
The spreading area was copied on to film, cut out, and weighed. A calibration curve
was determined by recording areas of several known sizes and weighing the copied film
in every experiment in order to determine the actual spreading area. The correlation
coefficients of the calibration curves were reported to be higher than 0.999.
Image analysis allows capillary spreading in the fabric to be represented as a distribution
of brightness levels. The profile of the distribution of the liquid concentration in the
fabric could be obtained by calibrating the brightness or intensity values with liquid
concentration levels in a fabric.
Image analysis is a convenient method and the results partially reflect the anisotropy of
liquid transport through fabrics. However, it cannot be used to detect the liquid
movement inside the fabric and its results do not indicate the weight of absorbed liquid
either locally or over the total area of a fabric.
Other image analysis measuring methods involve in-plane radial flow measurement 124
(see Figure 3.9). The in-plane radial flow apparatus and the method of quantifying the

77 Chapter 3
directional in-plane specific permeabilities of fabrics were introduced by Adams et al124
and other researchers125. It is essentially a modified demand wettability method, where
the porous plate method of introducing liquid has been changed to a point source supply.
Arguably, it is the only existing method capable of measuring the dynamic anisotropy of
liquid flow in fabric structures.
Figure 3. 9 Apparatus for measuring the liquid front in radial in-plane flow1"4
P r e s s u r e a i r
Figure 3.10 Anticipated liquid front in radial in-plane flow measurement1 4

78 Chapter 3
In the test, viscous liquid is forced by gas pressure to flow within a fabric sample. A
mirror is positioned just below the apparatus so that the shape and the position of the
radially advancing liquid front can be measured using an image analysis system (see
Figure 3.10). In this way, the local and dynamic anisotropy of liquid transport through a
fabric can be evaluated and the specific permeabilities can be calculated.
However, the method is unable to measure the liquid absorption since the results do not
indicate the absolute fabric absorbency in terms of liquid weight or volume. The need to
use high viscosity liquids rather than water and other low viscosity liquid is one
shortcoming of this method. Adams et al123’ 124 did not establish if there is a difference
between water and more viscous fluids when obtaining the specific permeability,
although it was claimed that the directional permeabilities are independent of driving
pressure, fluid viscosity and the number of fabric layers.
A further limitation of the method is that not all the liquid moving inside the fabric can
be recorded by the method. This is particularly problematic for thick or uneven fabrics
such as many nonwovens. Furthermore, the contact surfaces between the supporting
plates and the fabric risks the formation of a long, wide capillary gap, along which
liquid can move more rapidly than the liquid inside the fabric. This may lead to a false
impression of the position of the advancing fluid front and its geometric shape with
time.

79 Chapter 3
3.1.4 Summary of the Requirements of a New Method for the Measurement of
Liquid Transport in Nonwoven Fabrics
The dynamic measuring methods outlined in section 3.1.3 allow measurement of the
variation in the liquid up-take by fabrics with time elapsed and they generally give more
information about liquid transport through fabrics than steady-state measurements.
However, none allow the determination of the anisotropy of liquid transmission in
multiple directions simultaneously in terms of the uptake of fluid volume. This is
required if comprehensive understanding of the liquid transport in nonwoven wound
dressings is to be obtained. A device for the measurement of the anisotropy of liquid
transport in this work should meet the following requirements:
1. Liquid transport in the fabric plane should be detected.
2. Real time measurement should be facilitated, i.e., dynamic monitoring of the liquid
transport.
3. The measurements should be based on assessment of the variation in the volume of
liquid transport (i.e., direct measurement).
4. Measurements of the liquid transport should be possible in multiple directions in the
fabric simultaneously.
5. The system should be computer integrated.
In this work, a new computer-integrated apparatus for the real-time measurement of the
volumetric flow rate in nonwoven fabrics was developed that meets these requirements
and will now be described.

80 Chapter 3
3.2 DESIGN OF THE SYSTEM
3.2.1 Description of the Capacitance Transducers
A photograph of the new system is shown in Figure 3.11 and a schematic diagram of the
apparatus is shown in Figure 3.12.
Figure 3. 11 The capacitance measuring system for liquid transport in wound dressings
(a) Capacitance transducer system (b) The electronic circuit unit
(mounted in the tube) for signal conditioning
(c) An overview of the entire measuring system

81 Chapter 3
The operation of the system is based on the principle that as liquid absorption by a
fabric proceeds between two capacitance transducer plates there will be an increase in
the capacitance of the transducer. The capacitance between each pair of capacitance
transducer plates will be largely dependent on the dielectric constants of the materials
between the two plates.
Essentially, an electrical capacitance field is created between two capacitance plates UP
and LP (upper and lower plates) as shown in Figure 3.12(a).
Figure 3.12 A schematic diagram of the capacitance transducers
Reference capacitance plate guard ring
To A.C. Bridges >■ and Computer
system
Upper plate is lowered for testing
Sample fabric U q i d t m k
(height adjustable)
Overflow fluid
Pump(optional)
(a). Schematic diagram of the measuring instrument

82 Chapter 3
9Reference capacitance plate
Transducer Segment
Guard ring
(b) Alignment of transducer segments in the upper plate of the capacitance system
The upper plate (UP) is made of stainless steel and is segmented. It consists of eight
separate, equidistantly spaced transducers as shown in Figure 3.12(b). The lower plate
(LP) is not segmented and also consists of thin stainless steel coated with
Polytetrafluroethylene (PTFE). There are therefore eight points of measurement from
the capacitance transducers in the system. Additionally, a circular plate is placed at the
centre of the upper plate which is surrounded by the eight segments (see Figure
3.12(b)). Variations in the dielectric between the upper and lower plates (resulting from
the absorption of water by the fabric) changes the capacitance value of the plates.
A plastic mesh is placed in a plastic dish located at the centre of the lower plate. A
circular sample of fabric the same size as the dish is placed on the top of this mesh. In
the centre of the dish is the liquid feed point. This consists of a fine metal tube on top of
which is fitted a tiny perforated cap which is designed to allow uniform distribution of

83 Chapter 3
the incoming liquid in all directions. Once the liquid is gradiually introduced into the
fabric, it will spread radially from the point of liquid contact into the fabric.
In addition to water, the capacitance value is sensitive to external effects (e.g., air
humidity). This is discussed and considered in section 3.7. In order to ensure stability of
the capacitance value, the entire measuring system was mounted in a tube to eliminate
the fugitive effects of external airflows. All testing was performed in a standard
environment (20°C, 65%RH).
3.2.2 Alignment of the Capacitance Segments
In the system, eight segments are arranged around a central point in eight different
directions in the upper plate (see Figure 3.12(b)). Each segment comprises a thin
stainless steel plate coated with a continuous layer of PTFE. The central circular
transducer in the upper plate provides a reference signal during testing.
When the liquid transport in the fabric structure varies with the direction of the flow, the
dielectrics of the fabric between the capacitance transducer aligned in that direction will
be determined by the increase in the amount of the liquid retained in the same direction
by the fabric. Accordingly, the capacitance of the transducer changes and this can be
recorded.
3.2.3 Guard Ring Surrounding the Electrical Field
Guard rings were used to regulate the electrical field of the transducer segments so that
the field flux was perpendicular to the lower plate at the extreme edges of the segments.
To ensure that the electrical field between the two capacitance plates is perpendicular to

84 Chapter 3
the surface of the plate at the edge of the plates, it was necessary to use a guard ring to
transfer the fringing field of the capacitance plate to the edges of the guard ring208.
The guard ring used in the system was made of a metallic ring of the same thickness as
that of the capacitance segments, and was designed to surround the outside ends of the
eight capacitance segments. The guard ring used was the same diameter as the bottom
plate. The central segment (see Figure 3.12(b)) functions as another guard ring for the
inner ends of the eight segments and diminishes fringing effects at the edge of the
capacitance segments.
The guard ring had a similar potential voltage as the capacitance segments which it
surrounded208, 209. The width of the outside guard ring was also found to be very
important and it is believed that the outside dimensions of the guard ring should be
around three times the radius of the working segments for operating efficiently210,211.
The straight sides of each adjacent segment were parallel and each segment was
separated by a narrow and uniform air gap. The air gaps between each segment had to
be as small as possible to eliminate the capacitance due to the thickness of the plates.
The influence of the gap between two capacitance plates on the overall capacitance
213value has been explained by Maxwell and Kirchhoff .
3.2.4 Method of Introducing Liquid to the Fabric
The system can be used to measure two types of dynamic liquid transport in fabrics in
up to eight different directions:
1. Liquid absorption (demand wettability).
2. Forced liquid transport under low hydraulic pressure.

85 Chapter 3
There are four types of measurement that can be performed using the new system:
1. Real time liquid volumetric flow rate in eight different directions.
2. Anisotropy of the flow rate in forced flow (at a constant flow rate) in eight
directions
3. Anisotropy of the specific permeability.
4. In-plane permeability in eight different directions in fabrics if the initial
hydraulic pressure is known.
The liquid is introduced from a reservoir tank (which maintains a constant liquid head)
into the fabric through a capillary tube. As shown in Figure 3.12 in the reservoir, there
is an overflow section in which two cylindrical tanks are fitted concentrically on a
vertical post. The use of two tanks allows the liquid pressure (fed to the fabric) to
remain constant as the reservoir level decreases. These tanks can be set to the required
level in order to maintain a constant liquid pressure. The amount of liquid absorbed by
the fabric is then measured continuously by the capacitance transducers in eight
directions simultaneously.
The rate at which liquid is introduced can be varied by changing the vertical position of
the reservoir tank or alternatively, by the use of a peristaltic pump. The measuring
system can be operated with flow rates in the range of 4 ml/min to 40 ml/min. The
pump also allows the continuity of the flow to be varied as required.
3.2.5 Fabric Support Mesh
In order to eliminate the capillary gap that can exist between a wetted fabric and the
face of the tray that supports it, a low surface-tension plain woven mesh fabric made of

86 Chapter 3
hydrophobic continuous filament was placed between the test sample and the tray to
isolate it from the tray.
3.3 ELECTRONIC COMPONENTS USED IN THE SYSTEM
3.3.1 Signal Conditioning Unit
Signal conditioning is concerned with converting the output from a sensor into a
suitable form for signal processing so that it can be displayed or handled by the system.
212Some of its functionality may be summarised as follows :
1. Transformation of the signal from the sensor into a suitable form for
processing.
2. Adjustment of the signal amplitude and frequency.
3. Elimination or reduction of noise.
Several signal conditioning circuits were used and each had a different function. An
A.C. bridge was used to convert the capacitance value coming from the capacitance
transducer into voltage signals. Several analogue circuits were then adopted to decrease
the noise and enhance the ratio of signal to noise, or to convert the A. C. signal to an
analogue D. C. signal. The analogue signal was then converted to a digital signal
suitable for computer processing.
3.3.1.1 Signal Amplitude Modulation and the Resistance-Capacitance A. C. Bridge
In the process of amplitude modulation, the signal from a transducer is multiplied by a
carrier signal of constant frequency and amplitude. It offers several advantages in data
transmission (stability, low power and noise suppression) compared to frequency

87 Chapter 3
modulation. The carrier signal can have any periodic form, such as a sinusoid, square
wave, saw-tooth or triangle. The only requirements for mixing the carrier and
transducer signals is that the frequency 0)c of the carrier signal must be much higher
than the frequency coi of the transducer signal. The transmission at high frequency
permits the use of high-pass filters to eliminate noise signals that usually occur at much
lower frequencies.
An A.C. bridge was adopted and proved to be an excellent signal deflection method
with amplitude modulation to pick up the resulting voltage signal from the change in
capacitance. The variation of the transducer capacitance due to changes in the amount
of liquid absorbed by the fabric was initially a weak low frequency signal while the
background noise was strong and had low frequency. It was necessary for the amplitude
of the signal to be larger so that it could be distinguished from the noise. A high voltage
carrier signal of high frequency was needed to carry the weak signal to the next stage.
The basic bridge used (shown in Figure 3.13) was a resistor-capacitance AC bridge
consisting of two resistors and two capacitors. The output of the bridge varied with
changes in the measured capacitance, and the frequency of the output was a
combination of the carrier signal and the frequency of the change in the capacitance
itself. Since there were nine individual signal channels to be transmitted, the bridges in
the system were constructed as indicated in Figure 3.14.

88 Chapter 3
Figure 3. 13 Schematic diagram of a basic A.C. bridge
Analysis of the circuit to find the relationship between the output voltage of the bridge,
Vo, and the capacitance value of the transducer, Cu, is greatly simplified if it is assumed
that the current Im is very small. The output voltage of the bridge, V0 in the capacitance
bridge will be213:
V0 = Vs (3.3.1)
Where, Ci, R2 and R3 are the values of the known standard capacitances and resistances
in the bridge, Vs and Vo are the voltage of signal generator and the output voltage of the
bridge respectively. Im is the current as shown in Figure 3.13.
In Figure 3.14, two standard resistors and two standard capacitors were used to form an
A.C. bridge, and the capacitance transducers were then each paralleled with standard 10
pF capacitors. A signal generator was used to provide an input signal to the bridge of 10
kHz, through which the output signal from the capacitance transducers was conditioned
and converted into a voltage signal. Since the capacitance values of the transducers
varied with the amount of liquid retained in the fabric and the output voltage of the

89 Chapter 3
bridges was approximately linearly proportional to the capacitance value of the
transducers, the outputs of the bridges were linearly proportional to the liquid
absorption.
Figure 3 .14 Schematic of the A.C. bridge used in the system
Because the carrier frequencies of 10 to 100 times the signal frequencies were required
in demodulation to eliminate the carrier signal, the frequency of the carrier signal,
(which is from the signal generator), was set as high as 10 kHz, while the frequency of
the variance of the capacitance value due to liquid absorption by the fabric was lower
than 10 Hz. Another reason for using high frequency for the bridge was the necessity to
generate a sufficiently large signal voltage while the value of the capacitance
transducer is small (about 10 pF).

90 Chapter 3
3.3.1.2 From Signals to Digital Data212 213
The signal from the transducer may be combined with noise or other parasitic signals,
and these unwanted signals need to be eliminated with an appropriate fdter. At the same
time it is important to transmit the transducer signal without significant attenuation or
distortion. Then the amplified analogue data is obtained after output signals from each
bridge being amplified, demodulated and the noise associated with it being filtered in
signal conditioning. The electronic set-up is shown in Figure 3.15 and Appendix II.
Figure 3.15 Schematic of the electronic components used in the system
The analogue data of the results from the nine channels in the system was then
converted into digital data and collected by a computer via a data acquisition board,
PC30F/G214. The data acquisition board specification for the analogue inputs
included214:
1. A maximum sampling rate for analogue inputs of 100 kHz.

91 Chapter 3
2. Multiple data channels and multiplexing to perform simultaneous sampling from 1
to 16 input.
3. Resolution is often specified as the number of bits that the analogue to digital
converter uses to represent the analogue signal or the fraction of the analogue signal
that represents a change of 1 bit. The resolution of the board was specified as 12
bits, or 1 in 4096.
4. The voltage range in this board were software selectable from ± 5 V , l lO ^ a n d
0 ~ 10V .
5. The gain available from the amplifier on the board was also selectable and this
determined the smallest detectable change in the input analogue voltage. If the gain
is 10 and the range is 0 to 10 V for the 12 bit board, the smallest detectable input
voltage would be 10/(10*212)=23.4 juV .
3.4 SOFTWARE FLOW CHART
The F/G series boards can be programmed in most DOS and Windows programming
languages, and they can also be controlled using high-level function calls215. The
software flow chart for the system is given in Figure 3.18.
The major modules of the system are: Board Initialisation, Data Acquisition, Data
Processing, Display, and Human/Machine Interfacing.

92 Chapter 3
Figure 3.16 Software flow chart for the system
Begin
System Sett ings (frequency, range, ga in , t ime) and Board Initialising
C alib ra tion o f the System
Has the liq uid beg un to be in troduced into the fabric ?
Data A cqu is it ion and D ig ita l Filtering
Plotting o f Data and G raphics
D oes A ny M easu red Data Reach the Range of the I/O Board ?
_______________▼ Yes____________
No
Has E nough Data B een O bta ined ? No
Stop Data A cqu is it ion
Data P rocess ing and Save the Data to File

93 Chapter 3
3.5 OPERATING PRINCIPLES OF THE SYSTEM216
3.5.1 Capacitance and Dielectric Constant of Materials
It is well known that there is a large difference between the dielectric constants of air
(er= l), commonly used textile polymers (er=2-6) and water (er=70-80). The electrical
capacitance of a system is dependent on the dielectric constant of the material. The
present system consists of two parallel capacitance plates spaced equidistantly along
their length. When the space between the two parallel capacitance plates contains
208nonwoven material, the value of the capacitance, C, will be :
C = £0£rA / D (3.5.1)
Where,
£0 = 8.854 *10"12 (F/m) = the dielectric constant of a vacuum.
£r = relative dielectric constant of the dielectric material.
A = area of the capacitance plate.
D = distance between the two capacitance plates.
If, in addition to fibre and air, there are other materials in the field between the two
208capacitance plates, the capacitance value of the system, C, will be

94 Chapter 3
where, d7 d2, and dn are the thicknesses of the first, second, third, and n,h dielectric
materials respectively. The terms £,, e2, £3 and en are the relative dielectric constants of
these dielectric materials respectively.
If a nonwoven fabric is placed between the two capacitance plates, assuming its area, A, is
equal to the area of the capacitance plate, the resulting capacitance, Co, of the transducer,
will be208:
A Fc0 = -------- ^ ------- (3.5.3)
I M
D = d + d 0 + d̂
Where,
D = distance between the two capacitance plates.
d = thickness of the fabric.
do = thickness of the air layer.
di = thickness of any other materials in the field between the two plates.
£r = dielectric constant of the fabric.
£x = dielectric constant of any other material in the field between the two plates.
If water is gradually introduced into the fabric (assuming the area of the fabric holding
water is Ax), because of the effect of polarization of water on the fibre, the dielectric
constant of the completely saturated fabric (which is a mixture of wetted fibre and water)
may be taken to be nearly the same as the dielectric constant of water, m 9 . The liquid

95 Chapter 3
transport in the z-direction of the fabric is ignored because the fabric is thin. Thus, the
capacitance value of the transducer (containing wet fabric), Cx, will be as follows:-
C v = A-X £0 ( A - A x )£0
X / 1 1 N ' f D - d ( l -----) -< /,( 1----- )
mD - d ( l - — ) - d , (1 - — )
£. £,
- C 0 + A x (3.5.4)
Where a and b are constants depending on the particular fabric sample.
a =
Vm £
(3.5.5)
/
v £r £,
(3.5.6)
Therefore, the change in the capacitance value, AC x , due to the introduction of water may
be given as follows:-
A C x - C x C0 — AAX^ i _ rVa b J
(3.5.7)
If yr = f \__ O b j
Equation (3.5.7) can be rewritten as:
ACX = A4X *y/ (3.5.8)
From equation (3.5.8), it is clear that the capacitance value varies only with wetting and
it is linearly related to the wetted area of the fabric. Changes in the capacitance value
can therefore be used as a basis to study the liquid transmission in fabrics. This is a

96 Chapter 3
simple approach that avoids the difficulty of selecting an appropriate model for a
specific fabric in order to determine the dielectric constant95. In this approach, the
relative changes in capacitance are used to study the liquid transport. Using the new
system, it is possible to do this in different in-plane directions simultaneously.
3.5.2 Calculated Capacitance of the Transducer
Substituting the particular structural parameters of the transducers in the new system
into equation (3.5.4), the capacitance of the transducer (as liquid is introduced) can be
calculated as follows:-
C = (8 .8 5 4 * 10 ~12 ) n ( X * 1 )/ J \(D - d ) + —
+n { R ) - X 2 )
m( D
, , d d ) + — e r
(3.5.9)
This assumes that the system contains only air and the test fabric. Where D is the
distance between the two capacitance plates, d is the thickness of the fabric, X is the
radius of the circle of the liquid advancing front, Ro and Rf are the liquid source point
radius and the fluid advancing front radius respectively. The dielectric of water is
denoted as m, and the terms e0 and£r are the dielectric constants of the air layer and the
fabric respectively.
In the new measuring system, if d= 2mm, £0 = 1, m = 80, £fibre = 5 , £r = 1.5, R/=
35mm and Ro = 5.5mm, then the corresponding capacitance values of the transducers
are shown in Table 3.1.

97 Chapter 3
Table 3.1 Calculated capacitance of the transducers in the system
C (pF) X (mm)
5.5 11 21 31
D (mm) 10 0.445 0.450 0.470 0.5031
5 0.958 0.990 1.105 1.290
3 1.779 1.960 2.596 3.628
3.6 CALIBRATION OF THE SYSTEM
In the process of calibrating the signal from the segmented transducers, the differences
in the signals were first determined. To achieve this, the liquid transport in an isotropic
(or nearly isotropic) structure was measured using the system. The data from each
transducer was then used to obtain the ratio of gain of each transducer channel to the
first transducer channel.
Glass filter paper is a comparatively uniform fibrous porous structure. The maximum
differences of radius in the radius of the advancing liquid front circle in such fabrics in
each direction is reported to be less than 10%, and this may be taken to be nearly
isotropic structure201. The specification of the paper used for calibrating the system is
given in Table 3.2.
• • • 217Table 3. 2 Whatman® filter paper properties used in the calibration
Type Grade Number Filter Speed Thickness (mm) Weight (g/m2)
Qualitative
Paper
1 Medium Fast 0.18 87
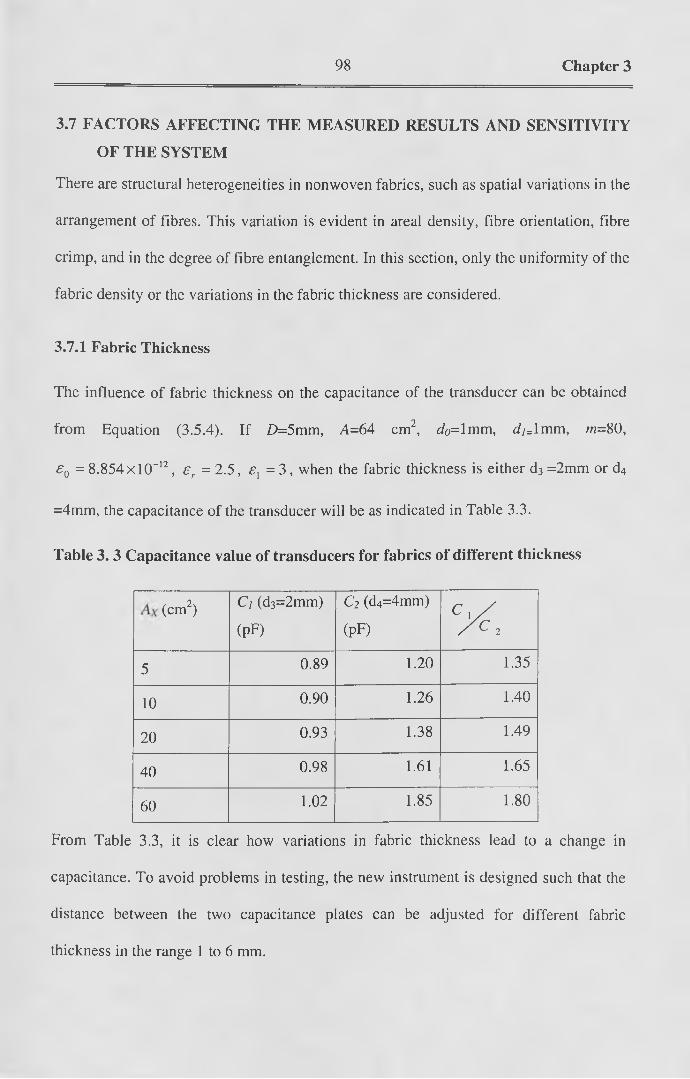
98 Chapter 3
3.7 FACTORS AFFECTING THE MEASURED RESULTS AND SENSITIVITY
OF THE SYSTEM
There are structural heterogeneities in nonwoven fabrics, such as spatial variations in the
arrangement of fibres. This variation is evident in areal density, fibre orientation, fibre
crimp, and in the degree of fibre entanglement. In this section, only the uniformity of the
fabric density or the variations in the fabric thickness are considered.
3.7.1 Fabric Thickness
The influence of fabric thickness on the capacitance of the transducer can be obtained
from Equation (3.5.4). If D=5mm, A=64 cm2, do= 1mm, Jy=lmm, m=80,
e 0 = 8.854xlCT12, e r = 2 . 5 , e l = 3 , when the fabric thickness is either d3 =2mm or d4
=4mm, the capacitance of the transducer will be as indicated in Table 3.3.
Table 3 .3 Capacitance value of transducers for fabrics of different thickness
(cm2) Ci (d3=2mm)
(pF)
C2 (d4=4mm)
(pF)C x/ / C 2
5 0.89 1.20 1.35
10 0.90 1.26 1.40
20 0.93 1.38 1.49
40 0.98 1.61 1.65
60 1.02 1.85 1.80
From Table 3.3, it is clear how variations in fabric thickness lead to a change in
capacitance. To avoid problems in testing, the new instrument is designed such that the
distance between the two capacitance plates can be adjusted for different fabric
thickness in the range 1 to 6 mm.

99 Chapter 3
3.7.2 Uniformity of Fabric Thickness
If the nonwoven fabric varies in weight uniformity, the resulting change in the
capacitance of the transducer can be calculated from Equation (3.5.3). If the thickness
of a small area Au is du and the thickness of the other area in the fabric plane is d
( d * d u), (where the whole area of the fabric is assumed to be saturated), the change in
capacitance resulting from this change in fabric area and fabric thickness, Cu, can be
deduced from Equation (3.5.3) as follows:-
C„ =-1 ^
D - d u (1---- )m
(3.7.1)
v
Where m is the dielectric constant of the wetted fabric.
The total capacity of the transducer, C, can also be deduced from Equation (3.5.3):-
C =D — d u( l ---- )
m
A - A,.
D - d ( l ---- )m
(3.7.2)
Thus,
£u_c
l
! + (— !)------ %------T T -A“ (1- ^ ) + A l
D D m
(3.7.3)
Examples of the effect of fabric thickness uniformity on the capacitance values are
shown in Table 3.4. Usually in practice, the ratio between the maximum thickness and
i 3 the average thickness of the fabric —- does not exceed —, and therefore, in order to
d 2

100 Chapter 3
limit the error resulting from unevenness in fabric thickness, it is very important to
ensure the ratio remains within this limit.
Table 3. 4 The effect of uniformity of fabric thickness on the capacitance of the
transducers
Distance
D (mm)
Fabric thickness
variation
du (mm)
Small area
in fabric
Au
Dielectric
constant of
Water
Capacitance
variation
C
d = ~ D 2
du = - D “ 3
Au = \ 0 % A
m=80
13.3%
d = —D 3
du ~ D 75.0%
du = — D “ 2
6.9%
3.7.3 Fabric Placement in the System
A further source of potential error in capacitance measurements arises if there is an
uneven distribution of the sample in the field of the condenser. This has been considered
by Moorhouse218. Figure 3.17 represents an extreme condition in which one end of a
damp material lies close to the upper plate, and the other end of the fabric lies close to
the lower plate. In practice, such an arrangement would behave like two capacitances,
Ci and C2 in series. The section of material, x-y, would have high resistance with R
joining the two capacitances. The capacitance, Ci, is formed by half the material and the
upper plate, and the capacitance, C2, by the rest of the material and the lower plate
(assuming that the material is sufficiently damp to act as a conductor of low resistance).

101 Chapter 3
In this case, the capacitance value can be many times (>10) higher than that obtained
when the fabric is arranged totally flat218.
Figure 3.17 Extreme placement of wetted fabric between capacitance plates
Upper plate
Lower plate
3.8 MEASUREMENT OF THE ANISOTROPY OF LIQUID TRANSPORT IN
FABRICS USING THE SYSTEM
3.8.1 Measurement Procedure
The system is first pre-warmed for about thirty minutes before testing begins. The
preconditioned sample fabric is then placed on the plastic mesh between the
transducers. The liquid pressure is then set to the required level by fixing the height of
the water tank.
After completing the calibration and pre-setting the test parameters in the system (data
acquisition frequency, testing duration, sample specifications and liquid properties), the
capacitance of the dry fabric is automatically measured. Firstly, the system monitors the
variation of the capacitance value of the central capacitance transducer before the liquid

102 Chapter 3
is introduced into the fabric. As liquid is introduced into the fabric from the central
point, the capacitance value of the central capacitance transducer increases (which is
Figure 3 .18 Screen shot of the new measurement systemMeasuring System of Liquid Absorption
Capacitance Measuring System for Liquid Absorption of Wound Dressings
Author. fe©raa,MaQ,1D ep artm en t o f Textileh(jqdt)«|u©s University o f Leeds
8/16/99 Absorption Rale Figure 2:30:07UutoSTART
Segment I (90 C| Segment 3 [135 C)Segment! (45 C|Segment (1(0 C)
Continuing
setu p
Time-837msSAVE ; SAVE AS
i D R A W i f
I I 'i l lN ! W ifi |Segment 7 (315 CjS egm ent (270 C)SegmenH (180 C) legment 5 (225 C)
PttlNI FIG
PHINVABG
ABOUT
detected by the computer), and the data acquisition process begins. The data in each
data channel (representing the variation of each capacitance transducer) is sequentially
collected, and the amount of liquid transport in different directions in the fabric plane
can then be monitored in real time and is shown on the monitor. When the preset testing
time is reached, the data acquisition process is automatically stopped and the
introduction of liquid is stopped manually. If needed, the wetted fabric and the dry
fabric are weighed using an electronic balance and the weight of the liquid retained by
the fabric is obtained. All the measured results of liquid transport in different directions

103 Chapter 3
in the fabric are saved in a file and the results are displayed graphically (see Figure
3.18).
3.8.2 Description of the Measured Results
Using the new system it is possible to measure the change in volume of liquid retained
by fabrics in different planar directions and therefore it is possible to characterise the
anisotropy of liquid transport. Extensive testing has been carried out to validate the
method and typical results are shown in Figure 3.19(a) which illustrate the detailed
information that may be obtained. In this particular example, the results refer to a
current commercially available wound dressing fabric composed of 100% viscose rayon
in a monolithic needle punched structure. In Figure 3.19(b) the absolute liquid
absorption and the rate of change in the liquid absorption versus time have been
obtained in each direction in the fabric. Also, the rate of change in the liquid transport
under external hydraulic pressure versus time in each direction in the fabric can be
measured (see Figure 3.19(c)). In Figure 3.19, it should be noted that the rate of
absorption in each direction is not identical. The plot (labelled number 9) is the
measured change in absorption with time for the reference transducer located
immediately above the fabric at the introduction point of the liquid. With reference to
Figure 3.19(a), it is apparent that there are two phases in the central area of the fabric.
Initially, when the liquid is introduced into the fabric from the source point, the central
area of the fabric is not saturated and the absorbency of the fabric continuously
increases with time. After a certain period of time, when the fabric in this central area is
saturated, the volume of liquid in the fabric in the central area remains constant as a

104 Chapter 3
Figure 3. 1 Example of the measured results from the dynamic testing system for
a commercial nonwoven wound dressing fabric
(Sample fabric: 100% viscose rayon, needlepunched, fabric weight =120g/m2)
(a) Dynamic liquid absorption in a polar system
Absolute absorbency (X 0.1 g)
1 qq Direction angle (degrees)
(b) Dynamic liquid absorption in a Cartesian system
Segment Direction angle Absolute absorbency (X 0.1 g) number (Degrees)
Time (seconds)

105 Chapter 3
(c) Dynamic results of forced liquid flow in a Cartesian system
Segment Direction angle
Time (seconds)
function of time. In combination with an electronic balance, the measured results
from the new system can be used to obtain the true fabric absorbency, the fabric
absorption rate, the anisotropy of the fabric absorption rate, and the saturation time. In
forced liquid flow conditions, the permeability and anisotropy of permeability of the
fabric can also be obtained.
3.8.3 Measurement of the Anisotropy of Permeability and Liquid Absorption
The anisotropy of permeability can be determined using data from the new system
when liquid is forced by external pressure through the fabrics. The anisotropy of
liquid absorption can be determined when the liquid is absorbed on-demand and
spreads through the fabric by means of capillary pressure. All measurements were
conducted using standard conditions (temperature = 20° C ± 2°C , humidity
= 65% ± 2% ).

106 Chapter 3
When measuring the anisotropy of permeability, the forced flow through the fabric was
maintained at a constant volumetric feeding rate. The liquid feed rate (ml/min) should
be several times higher than the absorption rate of the fabric in order to maintain an
external hydraulic pressure high enough to eliminate the effect of capillary pressure124.
The liquid feed rate in the experiments ranged from 15 to 30 ml/min.
When measuring the anisotropy of liquid absorption, the external hydraulic pressure
produced by differences in the height between the water level and the fabric plane was
reduced to zero or to slightly negative by adjusting the height of the water tank in the
system.
3.9 ANALYSIS OF DATA PRODUCED BY THE NEW SYSTEM
3.9.1 Two-Dimensional Liquid Flow in Isotropic Structures
The in-plane permeabilities of a two-dimensional isotropic porous medium are identical
in all directions. A general analysis of two-dimensional liquid flow in isotropic porous
structures under constant pressure and constant volumetric flow rate has been given by
many researchers124' 170’219' 220' 221.
3.9.1.1 Liquid Flow Under Constant Pressure
The boundary conditions for liquid flow under constant pressure (Po) are as follows:
P = P0at R = R0 and P = Oat R = R f (3.9.1.1)
Where Po is the constant inlet pressure, R is the advancing liquid front radius, R0 is the
inlet hole radius, and Rf is the flow front radius. The solutions for the pressure gradient
and pressure fields are170:

107 Chapter 3
R In
Inor — = 1 —
A ^Rn
In
(3.9.1.2)
(3.9.1.3)
and Pf ~ P 0 = — Qjl—\n f 2 ndk
(3.9.1.4)
Where 2 is the volumetric flow rate, d is the fabric thickness, k is the specific
permeability, and 77 is the fluid viscosity.
The relationship between time, t, and the position of the liquid front, Rf, can be obtained
from the following mass balance equation221:-
1j Q ( t ) d t = (1 - £ ) 7 T ( R j - R l ) d (3.9.1.5)
Q
where t is time and Q(t) is the volumetric flow rate (g/s*m ) at the moment t.
The superficial velocity of the advancing liquid front with the boundary conditions
shown in (3.9.1.1) is given by Adams124, Scheidegger170, Collins219, Muskat220 and
Chan et al221 as follows:-
dR,
dt (1 - e)rjRf In
Rj
R„
(3.9.1.6)
Where P = P0 at R = R0 and P = 0 at R = Rf

108 Chapter 3
3.9.1.2 Liquid Flow at a Constant Volumetric Flow Rate at the Liquid Source Point
The boundary conditions at a constant volumetric flow rate are as follows
r dP^. dR JRv /«<
QrjInRrsdk
at R = Rn and
P = 0 at R = Rf (3.9.1.7)
Where Q is the inlet volumetric flow rate and d is the fabric thickness. The pressure
r d P Agradient,
Kd R ,, and the pressure fields, (Pf - P0) , for liquid flow at a constant
volumetric flow rate are221:-
QV n Qrt ,------ -— or P In2 TcRdk 2mlk
and P - P = -^ -L \n f 0 iTuik
(3.9.1.8)
(3.9.1.9)
The relationship between time, t, and the position of the liquid flow front, Rf, obtained
from the mass balance analysis is:-
t =(1 - e ) 7 T ( R 2f - R l ) d
Q(3.9.1.10)
3.9.2 Two-Dimensional Liquid Flow in Anisotropic Structures
Compared to isotropic structures, two-dimensional liquid flow in anisotropic structures
is more complex. A general description of liquid flow through a thin anisotropic
nonwoven fabric (shown in Figure 3.22) can be envisaged as a laminar, pseudo-steady

109 Chapter 3
state process in which liquid radially spreads through a homogenous fibrous medium.
Initially, liquid enters the fabric from a small point source. In anisotropic structures, the
shape of the advancing front of the liquid will be elliptical in shape202. This shape is
governed by the principle permeabilities of the fabric and the characteristic angle $ .
The liquid flow is assumed to be steady-state and the distribution of the liquid driving
pressure is independent of time.
Such laminar, incompressible liquid flows through porous materials can also be
170described by two-dimensional Darcy’s law and the general equation of continuity .
The general form of Darcy’s law and the equation of continuity are shown as follows:-
v = ---- V/?T)
Vv = V(&Vp) = 0
(3.9.2.1)
(3.9.2.2)
Figure 3. 20 In-plane radial liquid flow and the direction of principal
permeabilities in a thin nonwoven fabric

110 Chapter 3
Where, Ro, Rf are the inlet hole radius and liquid flow front radius respectively; (j) is
the characteristic angle, and x’, y ’ are the directions of two principle
permeabilities respectively.
There are two existing methods of measuring the anisotropic permeability of porous
fabrics. One is to obtain the analytical solution from a combination of the equations
(3.9.2.1) and (3.9.2.2)124’125 to obtain the directional permeabilities. The second method
is to use the existing analytical solution of liquid flow in isotropic structures presented
in this thesis to obtain the directional permeabilities202. In the second method, the
anisotropic structure is treated as several angular sections divided by radial lines
emanating from the entrance hole (as shown in Figure 3.23), and each section is treated
as an isotropic medium. The first method is very complicated and requires additional
data (i.e., the pressure gradient in the liquid flow). In contrast, the second method is
relatively simple and is convenient to use. The second method has therefore been
adopted in this approach.
In this approach, the capacitance unit is divided into eight angular sections by radial
lines emanating from the liquid entrance point, and each segment allows measurement
of the volumetric flow rate in each direction (see Figure 3.23). Within each section, the
liquid passing through the angular sections can be viewed as two-dimensional liquid
flow in an isotropic material. Each radial line serves as the centreline of a sector. Figure
3.24 shows a typical sector used by the capacitance transducer system.
In calculations of the anisotropic permeabilities of a fabric, eight temporal radial data
sets are used, and each sector spans 45°. Each section is analysed to obtain the
permeability based on the centreline temporal radial data. From the experimental data,

I l l Chapter 3
Figure 3. 21 Liquid flow in the fabric and the calculated dynamic liquid flow front
in eight transducer field sectors
Figure 3.22 Typical sector showing the development of the liquid flow advancing
front

112 Chapter 3
the calculated radial extent along the centreline at time tj, defined as r(U), can be
calculated from the measured voltage values from the capacitance transducer. Equations
(3.9.1.7-10) are used to calculate the anisotropy of permeability for all sectors using all
sets of the radial extent data.
3.9.3 Measurement of the Anisotropy of the Liquid Flow in Anisotropic Fabric
Structures Using Data from the Capacitance Transducers
As shown in section 3.5, if the liquid enters a dry dielectric material placed in an
electrical field, variation of the capacitance value will be linearly proportional to
changes in the area of the wetted fabric.
Initially, if an angular area with an angle /? (as shown in Figure 3.24), and diameter ro
is the radius of the central capacitance segment, from equation (3.5.8) we know that the
linearly proportional ratio of the voltage value to the wetted fabric area is y / . Thus, in
time, t, the relationship between the measured voltage in the system, V(t), and the
wetted fabric area can also be defined as follows:-
If it is assumed that all the liquid is held in the wetted area of the fabric, the mass of the
liquid held by the fabric at time t, M(t), will be:-
2(3.9.3.1)
M( t ) = ~ ( R f (t) - R l ) p d (3.9.3.2)
Therefore, R 2A t) =7 P v
(3.9.3.3)

113 Chapter 3
Where :- ¥ = ■V(t)
M ( t ) - ^ ( r 02 - R 20 )pd(3.9.3.4)
Rewriting equation (3.9.1.9) for an angular area and substituting Equation (3.9.3.2) into
equation (3.9.1.9), we obtain:-
k = — ^ /3dP0(t)
r Rf (.t)^
Rov 0 y, or (3.9.3.5)
k = _ ^ I _ i n (3dP0{t)
(3.9.3.6)
3.9.3.1 Liquid Flow in Anisotropic Structures Under Constant Pressure
At constant pressure conditions P0(0 = PQ, equation (3.9.3.6) will be as follows:
t - S B L mPdpa
2 V m | r02 ^
v P K R l(3.9.3.7)
From the mass balance equation (3.9.1.10), the volumetric flow rate, Q(t), can be
written as follows
PQ ( t )
A t A/,( l - e ) d p
2A t(3.9.3.8)
Substituting equation (3.9.3.3) into Equation (3.9.3.8), we have:-
P<2(0
(1 - £ ) d p
i=tj 2A t(3.9.3.9)
Substituting equation (3.9.3.9) into (3.9.3.7), we have:-
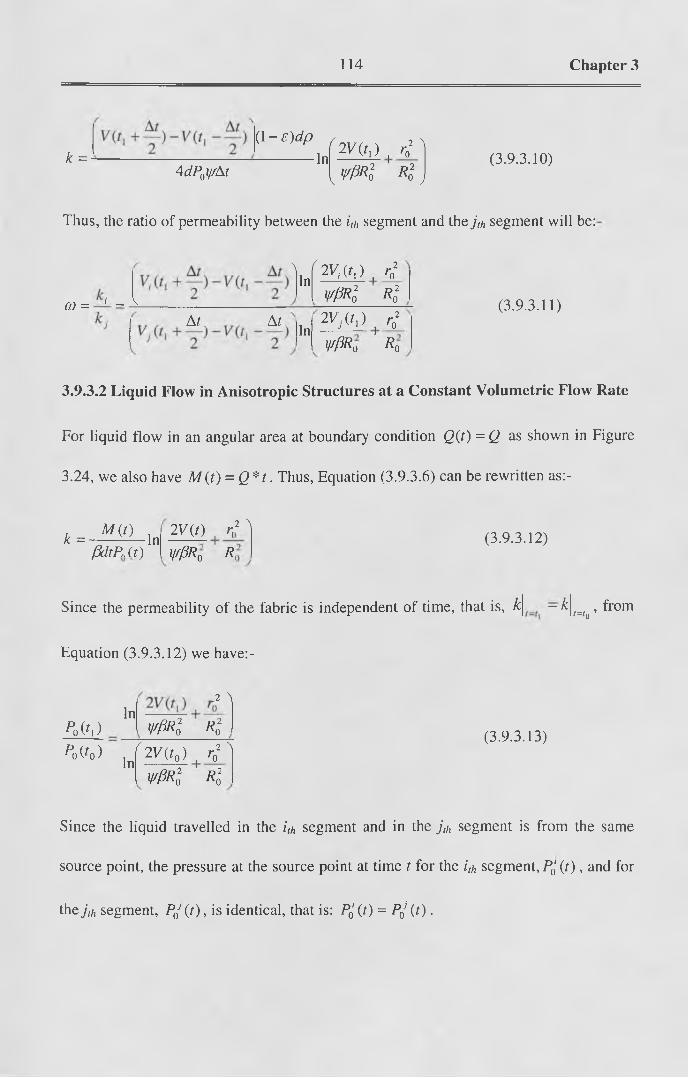
114 Chapter 3
k =(l-£ )d /9
4dP0i//At-In" 21/(0 , To2 '
2 r> 2V m l R l
(3.9.3.10)y
Thus, the ratio of permeability between the /,/, segment and the j,h segment will be:
co = i _ v
\ ( In 2 V M | r0-
m l K
2
A/, Ar In2v>cr,) | r02
^ 0 *o
(3.9.3.11)
3.9.3.2 Liquid Flow in Anisotropic Structures at a Constant Volumetric Flow Rate
For liquid flow in an angular area at boundary condition Q (t) = Q as shown in Figure
3.24, we also have M( t ) = Q * t . Thus, Equation (3.9.3.6) can be rewritten as:-
* = - ^ l n PdtPM )
2V(t) | rc
WfiR o R~
2 A(3.9.3.12)
Since the permeability of the fabric is independent of time, that is, k\ _ ^L=,0 > from
Equation (3.9.3.12) we have:-
M A p0 (*o )
In.2 \
In
m l K" 2V(t0) | r02 ^
m l K
(3.9.3.13)
Since the liquid travelled in the i,h segment and in the jo, segment is from the same
source point, the pressure at the source point at time t for the ith segment, P0' (t ) , and for
the j th segment, P0J (t) , is identical, that is: P0' (/) = P0j (t) .

115 Chapter 3
Thus, the ratio of permeability between the ith segment and the j,h segment can be
obtained from equations (3.9.3.12) and (3.9.3.13) as follows:-
G, InK:
a > = — = -----------
k:1 Q , In
, r02 ' XffpRl R 70
2VjW , rf m l Ro
(3.9.3.14)
/
where <2, and Qj are the volumetric flow rates in the fabric along the direction of
segment ith and segment j,h respectively; Vt(t) and Vj(t) are the voltage data measured
in the ith segment a n d s e g m e n t transducers respectively.
3.9.4 Anisotropy of Liquid Transport in Non woven Fabric Structures Measured
Using the New System
The directional permeability in a porous material, k(6) , can be obtained from
Ferrandon’s equation170 as follows:-
1 cos2 9 sin2 0 n , n + -------- (3.9.4.1)k{9) k{ k2
Where kx and k2 are the principle permeabilities in the fabric plane in a Cartesian
coordinate system x, and x2 respectively.
For flow through anisotropic structures as shown in Figure 3.23, Ferrandon’s Equation
can be rewritten as equation (3.9.4.2):-
1 _ cos2{9 — (ft) | sin2( 0 - 0 ) (3 9 4 2)k{9) k{ k 2

116 Chapter 3
TCWhere the principle permeabilities are in the direction (p and (0 + —) respectively and
the angle (p is the characteristic angle. Therefore, Equation (3.9.4.2) can be used to
calculate the principle permeabilities and its characteristic angle (p.
In order to calculate the principle permeabilities and its characteristic angle (ft, the
measured data and the corresponding flow directions for each of the eight individual
capacitance transducers in the system (respectively) can be substituted into equation
(3.9.4.2) to obtain a set of non-linear equations as follows:-
1 _ c o s a(g,-(») + sin2( g , - j g (i= 1 ,2,3,....8) (3.9.4.3)k(0i ) k2
• 222The equations are solved using the Least Square Residual algorithm " , to obtain the
principle permeabilities, and k2, and the characteristic angle, (p. The anisotropy of
the fabric permeability, (Ok , is defined as the ratio of the two principle permeabilities as
follows:-
k t
(Ok = ^ - (3.9.4.4)k
According to equations (3.9.4.3) and (3.9.4.4), the anisotropy of permeability can be
obtained, and the application of this method in the experimental results will be
presented in Chapter 5.

117 Chapter 4
CHAPTER 4 THE PREPARATION OF NONWOVEN FABRIC
SAMPLES AND THE CHARACTERISATION OF
THE FABRIC STRUCTURE
In order to investigate the influences of individual fabric structural parameters on the
anisotropy of liquid transport in nonwoven wound dressing fabrics, unbonded webs,
needle-punched and hydroentangled nonwoven fabrics with different structural
parameters with respect to fibre type, fibre diameter, fibre orientation distribution and
fabric porosity were produced under controlled conditions.
The liquid absorbency and porosity of these materials were obtained using standard
measurement methods and the fibre orientation distribution was examined using image
analysis. The structural properties of the commercial nonwoven wound dressings
reported in Chapter 2, composed of cellulose and calcium alginate fibres, were also
measured.
4.1 PURPOSE OF THE EXPERIMENTAL WORK
It is known that the structural characteristics of nonwoven fabric are key to
understanding the anisotropy of mechanical properties of nonwoven structures90.
Previous research on the liquid absorption demonstrates that the liquid transport
properties of fibrous materials depends both on the properties of the constituent fibres
and on the spatial arrangement of the fibres in the assembly. However, there has been
little systematic work on how the structure of nonwovens influences the anisotropy of
liquid transport in the fabric. Accordingly, the purpose of the experimental work was to

118 Chapter 4
systematically investigate the influence of fabric structural parameters on the anisotropy
of liquid transport in experimental nonwoven wound dressing fabrics.
4.2 THE EXPERIMENTAL PLAN
In the experimental work, five parameters were considered as follows:-
(i) Fibre type (polypropylene, viscose).
(ii) Fibre fineness (1.7dtex, 3.3 dtex).
(iii) Fibre orientation distribution (parallel-laid, cross-laid).
(iv) Fabric porosity (high porosity and low porosity).
(v) Fabric bonding methods (unbonded web, needled and hydroentangled fabrics).
In total, forty-three different fabrics were produced with different combinations of
structural characteristics. The experimental plan is presented in Tables 4.2. The
symbols used to denote the fabrics in the experimental plan are shown in Table 4.1.
Table 4. 1 Symbols used in the experimental plan to designate samples
Symbol Sequences Meaning Symbol
1st Symbol Fibre type. V = Viscose fibre
p = Polypropylene
2nd Symbol Fibre fineness. A = 1.7 dtex
B = 3.3 dtex
3rd Symbol Fibre orientation in web. 1 = Parallel laid
2 = Cross laid
4"' Symbol Bonding method. pp, VV = Hydroentangled
N = Needlepunched
WEB = Unbonded web
5lh Symbol and after Fabric porosity.Different porosity from different
fabric density or fabric
thickness.

119 Chapter 4
Table 4. 2(a) Experimental plan (polypropylene fibre)
SampleNO.
Fibre Type FibreFineness(lineardensity)
Type of FibreOrientationDistribution
BondingMethod
PorosityChange
PAIPPPAIVVIPA1VV2
Polypropylene 1.7 dtex Parallel Laid (Single peak)
Hydroentangled Original
PAIN 1 PAIN 2
Needlepunched OriginalCompressed
PA2H Cross Laid (Bi-modal)
Hydroentangled OriginalPA2N1PA2N2
Needlepunched OriginalCompressed
PBIPPPBIVVIPB1VV2
3.3 dtex Parallel Laid (Single peak)
Hydroentangled Original
PB1N 1 PB1N2
Needlepunched OriginalCompressed
PB2H Cross Laid (Bi-modal)
Hydroentangled OriginalPB2N1_1PB2N1_1PB2N2__1PB2N2_2PB2N3
Needlepunched OriginalCompressedOriginalCompressedOriginal
Those samples designated PP (fourth symbol) indicate fabrics in which the parallel-laid
web was fed to the hydroentanglement machine with fibres aligned in the direction of
processing. The samples designated (VV) indicate fabrics in which the parallel-laid web
was turned ninety degrees before feeding to the hydroentanglement machine, i.e.,
Web
J[ 11 ifii * HydroT r v v

120 Chapter 4
Table 4. 2(b) Experimental plan (viscose fibre)
SampleNO.
FibreType
FibreFineness(lineardensity)
Type of FibreOrientationDistribution
BondingMethod
PorosityChange
VA1PPVA1VV
Viscose 1.7 dtex Parallel Laid (Single peak)
Hydroentangled Original
VAIN 1 VAIN 2
Needlepunched OriginalCompressed
VA2H Cross Laid Hydroentangled OriginalVA2N1VA2N2
(Bi-modal) Needlepunched OriginalCompressed
VB1PPVB1VV
3.3 dtex Parallel Laid (Single peak)
Hydroentangled Original
VB1N 1 VB1N2
Needlepunched OriginalCompressed
VB2H Cross Laid Hydroentangled Original
VB2N1_1VB2N1_2VB2N2VB2N3
(Bi-modal) Needlepunched OriginalCompressedOriginalOriginal
Table 4.2(c) Experimental plan (unbonded webs)
SampleNO.
Fibre Type FibreFineness(lineardensity)
Fibre Orientation(Type of Fibre OrientationDistribution)
VA1WEB Viscose 1.7 dtex Parallel Laid (Single peak)
VA2WEB Cross Laid (Bi-modal)
VB1WEB 3.3 dtex Parallel Laid (Single peak)
VB2WEB Cross Laid (Bi-modal)PA 1 WEB Polypropylene 1.7 dtex Parallel Laid (Single peak)PA2WEB Cross Laid (Bi-modal)
PB1WEB 3.3 dtex Parallel Laid (Single peak)PB2WEB Cross Laid (Bi-modal)

121 Chapter 4
4.2 GENERAL CONSIDERATIONS IN THE DESIGN OF THE FABRIC
SAMPLES
The structural parameters of the fabrics investigated in this work were chosen to reflect
the construction of commercial nonwoven wound dressing structures.
Mechanically bonded nonwoven fabrics used as absorbent layers in dressings are
frequently of low density and around 100 g/m2. Accordingly, the experimental fabrics
produced were 100g/m2. To determine the effect of fabric compression on the liquid
transport in the fabric, the base fabrics were compressed to achieve a range of fabric
thicknesses and thus a range of fabric porosities.
For each type of bonding process, all the bonding parameters were kept identical for all
the fabrics.
Fibres may be classified as hydrophilic and hydrophobic, or absorbent and non
absorbent130. Commercially, non-absorbent, absorbent and gelling fibres, are used in
wound dressings to meet different requirements. In this Chapter, both non-absorbent and
absorbent fibres were selected (i.e., Polypropylene and Viscose rayon).
170Fibre diameter is believed to influence the permeability of fibrous materials .
Typically, the linear density of most staple fibres used in nonwoven wound dressings
ranges from 1.0 dtex to 5.0 dtex. Thus, two fibre finenesses (1.7 dtex and 3.3 dtex), were
selected for each type of fibre. The fibre lengths were similar so as to clearly determine
the effect of the fibre fineness. The fibre diameter was also measured with the use of an
optical microscope. The specifications of the two fibres are shown in Table 4.3.

122 Chapter 4
Table 4 .3 The specifications of fibres used in making fabrics
Polypropylene Viscose
Fibre type and Supplier FM100M (Asota) Fibro O (Acordis)
Fibre fineness (dtex) 1.7 3.3 1.7 3.3
Fibre diameter ( jum) 15.3 30.6 12.5 25.0
Fibre length (mm) 60 51
Fibre crimp (Approx.
crimps/cm)
6.5 6.5 6.0 6.0
Fibre density (g/cm3) 0.90 1.38
PH of fibre surface 7-8 5-7
Fibre finish Fatty-acid-glucose-
ether
Mixture of sodium
oleate and oleic acid
It should be noted that the polypropylene fibres obtained from the fibre manufacturer
were coated with a fibre finish that had a low fibre-water interface tension making the
fibre surface hydrophilic. The application level of the finishes was 0.18-0.25% OWF.
4.3 FABRIC MANUFACTURING PROCEDURE
4.3.1 Experimental Approach
The fabric production procedures used to prepare the experimental fabrics are illustrated
in Figure 4.1.

123 Chapter 4
Figure 4 .1 Nonwoven fabric production procedure
4.3.2 Machine Parameters
In the manufacture of each type of fabric, the operating settings of the processes were
identical. The details of the main operating settings of the card, lapper, needlepunching
machine and hydroentanglement machine are presented in Tables 4.4 and 4.5.
Table 4. 4 Settings of card, lapper, and needlepunching machine
Parameter Machine Setting
Set Weight (g) Carding Machine 126 (varied)
Feed Roller (rpm) 169
Feed Speed (m/min) 0.6
Card Speed (rpm) 75
Lapper (rpm) Lapper 0.629
Top Sheet (rpm) 11.3
Bottom Lattice (rpm) 5.3
Loom (rpm) Needle Loom 56.3
Loom Sheet (rpm) 16.7
Loom rod-up (rpm) 1.7
Penetration (mm) 12
Needle density
(p/cm2)
60

124 Chapter 4
Table 4. 5 Settings of the hydroentanglement machine
Parameter Machine Setting
Number of jets (jets/m) Hydroentanglement 1300
Jet outlet diameter (mm) 0.14
Conveyer velocity (m/min) 8
Water pressure (Bar) 40 (one pass)
Total Specific Energy (MJ/Kg) 0.0957
4.4 MEASUREMENT OF FABRIC STRUCTURAL CHARACTERISTICS
After preparing the experimental samples, it was necessary to characterise the structure
of the fabrics before further testing. The most important structural parameters of a
nonwoven fabric are the thickness, mass per unit area, porosity (porosity = 1 - packing
density) and the fibre orientation distribution, the measurement of these parameters is
summarised below. The fabric porosity and fabric absorbency are shown in Table 4.6.
The measured characteristics of the experimental fabric structures and corresponding
fibre orientation distributions are presented in Figures 4 .4 -4 .8.
4.4.1 Thickness Measurement (d)
The thickness of a nonwoven fabric, d (mm), can be defined as the distance between the
face and back of the material measured as the distance between a reference plate on
which the nonwoven rests and a parallel pressure - foot that applies a pressure to the
fabric223. The thickness of the fabric was measured using the Shirley thickness tester in
accordance with the standard INDA-IST120.2 (i.e. ASTM D5736-95)189. The results for
all the samples are shown in Table 4.6.

125 Chapter 4
4.4.2 Mass Per Unit Area (W)
The mass per unit area, W (g/m2), of the samples was measured in accordance with the
standard INDA IST130.1 (i.e. ASTM D3776-85) 191. The mass per unit area of all the
samples is shown in Table 4.6. The mass per unit area of most of the samples was
around 100 g/m2, which is in accordance with many commercially available fabrics.
Table 4. 6(a) General specifications of experimental fabrics
(needlepunched and hydroentangled fabrics)
SampleNo
Fabricweight(g/m2)
Fabricthickness(mm)
Porosity Sample No Fabricweight(g/m2)
Fabricthickness(mm)
Porosity
VA1PP 133.2 1.5 0.935 PA1PP1 74.1 7.0 0.988
VA1VV 128.4 1.5 0.938 PA1VV3 125.8 3.5 0.961
VA1N1 95.3 3.0 0.977 PA1VV4 84.4 2.0 0.954
VA1N2 2.5 0.972 PA1N1 126.6 3.9 0.964
VA2H1 101.9 1.2 0.939 PA1N2 3.2 0.957
VA2N1 98.3 3.5 0.980 PA2H3 120.5 4.7 0.972
VA2N2 2.9 0.975 PA2N1 130.3 4.0 0.964
VB1N1 100.1 3.6 0.980 PA2N2 3.0 0.952
VB1N2 3.2 0.977 PB1VV1 141.0 5.0 0.969
VB1PP1 128.8 1.4 0.933 PB1VV1’ 105.9 4.9 0.976
VB1VV1 127.8 1.6 0.942 PB1PP1 100.1 4.2 0.974
VB2N1_1 100.9 4.7 0.984 PB1PP2 153.9 6.5 0.974
VB2N1_2 3.8 0.981 PB1N1 123.2 4.2 0.968
VB2N2 80.0 4.2 0.986 PB1N2 3.5 0.961
VB2N3 60.0 3.6 0.988 PB2H2 98.6 3.2 0.966
VB2H2 117.9 1.3 0.934 PB2N1 99.8 3.9 0.972
N/A N/A N/A N/A PB2N2 99.8 3.0 0.963

126 Chapter 4
Table 4.6(b) General specifications of experimental fabrics
(unbonded webs)
Sample No FabricWeight(g /m 2± 5% )
Fabricthickness(mm)
Porosity
VA1WEB 100.0 4.2 0.974
VA2WEB 100.0 4.5 0.976
VB1WEB 100.0 5.3 0.979
VB2WEB 100.0 5.4 0.980
PA 1 WEB 100.0 5.5 0.980
PA2WEB 100.0 6.0 0.982
PB1WEB 100.0 4.2 0.974
PB2WEB 100.0 4.4 0.975
Table 4. 7(a) Liquid absorbency of experimental fabrics
(unbonded webs)
Sample No Absorbency
(g/g) (g /m 2 )
VA1WEB 17.5 1746.2
VA2WEB 19.2 1918.5
VB1WEB 19.1 1914.2
VB2WEB 21.1 2108.5
PA1WEB 24.2 2422.4
PA2WEB 24.7 2468.0
PB1WEB 21.6 2156.8
PB2WEB 21.8 2180.4

127 Chapter 4
Table 4. 7(b) Liquid absorbency of experimental fabrics
(needlepunched and hydroentangled fabrics)
Sample No Absorbency Sample No Absorbency
(g/m2 ) (g/g) (g/m )VA1PP 8.5 1137.4 PA1PP1 22.4 1658.9
VA1VY 9.1 1165.3 PA1VY3 20.2 2535.0
YA1N1 18.7 1779.4 PA1VY4 17.8 1502.3
VA1N2 N/A PA1N1 21.9 2766.3
VA2H1 8.7 884.2 PA1N2 N/A
VA2N1 19.4 1909.1 PA2H3 21.0 2530.0
VA2N2 N/A PA2N1 20.5 2676.6
VB1N1 20.8 2084.8 PA2N2 N/A
VB1N2 N/A PBIVVI 20.1 2835.5
VB1PP1 7.8 1003.8 PBIVVI’ 22.1 2344.7
VB1VV1 7.8 991.7 PB1PP1 22.5 2256.9
VB2N1_1 20.1 2026.0 PB1PP2 N/A
VB2N1_2 N/A PB1N1 21.0 2591.6
VB2N2 22.6 1803.1 PB1N2 N/A
VB2N3 20.4 1223.1 PB2H2 21.6 2132.1
VB2H2 7.9 929.9 PB2N1 20.8 2078.3
4.4.3 Porosity ( Pf )
Porosity Pf is defined as the ratio of void volume to the total volume of the fibrous
structure and can be expressed as follows224:

128 Chapter 4
P f =
{ \Y P fabric
P fibre
> ' N (41)\ w 1
d p fibre 1000V /
Where, Pf is the fabric porosity, p fahric is the fabric density (kg/m3), p fibre is the fibre
density (kg/m3), W is the fabric mass per unit area (g/m2), and d is the fabric thickness
(m). The measured porosities of the experimental fabrics are shown in Table 4.6. It is
apparent that the overall porosity of the fabrics was mainly in the range 0.93 to 0.99.
4.4.4 Measurement of Fabric Absorbency
Two types of liquid were used as test fluids in the experimental work as follows:
1. Distilled water
2. Liquid A (reduced surface tension)
Liquid A was a 0.25% solution of a non-ionic surface detergent SandoClean PC©
Liquid225 (Polyglycol ether) in distilled water. This is an excellent wetting and
penetrating agent in distilled water and was only used for measurements on the
hydroentangled polypropylene fabrics because of the high surface tension of the fibre.
The absorbency of the hydroentangled polypropylene fabrics was also measured using
Liquid A. All the other nonwoven fabrics were measured using distilled water.
The absorptive capacity (i.e., absorbency) of the fabrics was measured using the
standard method INDA-IST10.1 (95)190. Each specimen was weighed in the dry state
and then lowered into distilled water using a wire container. The total weight of the wet
specimen was measured and the weight of the supporting screen and dry specimen

129 Chapter 4
subtracted. The ratio of the dry weight and the weight of water absorbed is defined as
the absorptive capacity (g/g). The results are shown in Table 4.7.
4.4.5 Fabric Absorbency and Fabric Porosity
It was found that the overall absorbency was largely dependent on fabric porosity. As
liquid is absorbed into the fabric, it replaces the void space in the fabric. A linear
regression relationship between the absorbency of all the experimental fabrics and their
porosities is shown in Figure 4.2.
Figure 4. 2 Relationship between the absorbency and the fabric porosity for all the experimental fabrics
4.4.6 Measurement of the Fibre Orientation Distribution Using Image Analysis
The orientation of a fibre can be described using an orientation angle. The orientation
angle can be defined as the angle formed between the fibre axes and a central line
(machine direction) of the web as shown in Figure 4.3. The orientation angles of
individual fibres can be determined by evaluating fabric photomicrographs or using
microscopy and image analysis.

130 Chapter 4
The overall orientation of fibres can be described using a frequency distribution function
or a probability density function. Frequency distributions can be obtained by
determining the fraction of the total number of fibres falling within a predetermined
range of orientation angles. Discrete frequency distributions can be used to estimate
continuous probability density functions.
Figure 4 .3 Fibre orientation and the orientation angle
MD
In modelling the properties of nonwoven fabrics, it is important to obtain an accurate
measure of the Fibre Orientation Distribution and particularly in any quantitative
analysis of the anisotropic properties of nonwoven fabrics.
Image analysis is a computer-based means of converting the visual qualitative features
of a particular image into quantitative data. The measurement of the fibre orientation
distribution in nonwoven fabrics using image analysis is based on the assumption that in
thin materials a two dimensional structure can be assumed, although it is known that the
fibres in a nonwoven are generally arranged in three dimensions. However, there is
currently no generally accepted way of characterising the fabric structure in terms of
three-dimensional geometry. The fabric geometry is reduced to two dimensions by
evaluation of the planar projections of the fibres within the fabric. The assumption of a
two-dimensional fabric structure is adequate to describe thin fabrics.

131 Chapter 4
4.4.6.1 Review of Techniques for Measuring Fibre Orientation Distribution
A number of techniques for measuring Fibre Orientation Distribution have been
reported in the literature. A direct visual experimental method for manually measuring
fibre orientation was first described by Petterson92. This method produces the most
accurate measurements, but it is tedious and time-consuming. After comparing with
other methods, Hearle and co-workers90, 226 found that visual methods are the most
reliable way to evaluate the fibre orientation and they used a projection microscope
method to measure both fibre orientation and curl. They manually measured fibre
segment angles relative to a given direction and determined the lengths of segment
curves within a given range. However, the application of this method is still limited by
the time-consuming work required in visual examinations.
In order to obtain a faster and still accurate way to measure the fibre orientation
227distribution, various indirect-measuring techniques have been investigated. Kallmes
and others228 introduced the zero span tensile testing method for predicting the fibre
orientation distribution in a fibre web. Short span tensile analysis was also used by
Cowan and Cowdrey229. Chuleigh230 developed an optical processing method in which
an opaque mask was used in a light microscope to highlight fibre segments that are
oriented in a known direction. Stenemur231 devised a computer system to monitor fibre
orientation or running webs based on the light differentiation phenomenon. Other
93 232 • • 233methods include the microwave method , ultrasound , light diffraction methods ,
light reflection and light refraction234, electrical measurements235, 23r>, and liquid-
migration-pattern analysis237,238. Methods that employ X-ray-diffraction analysis239 and
X-ray differentiation patterns of fibre webs have also been tried240.

132 Chapter 4
More recently, image analysis has been employed to identify fibres and their
orientation241' 242,243,244, and computer simulation techniques have come into use for the
creation of computer models of various nonwoven fabrics245, 246’ 247, 248. Huang and
Bressee241 developed a random sampling algorithm and software to analyse fibre
orientation in thin webs. In this method, fibres are randomly selected and traced to
estimate the orientation angles, and test results showed excellent agreement with results
from visual measurements. Xu and Ting248also used image techniques to measure
structural characteristics of fibre or fibre bundle segments in a thin nonwoven fabric.
The structural characteristics measured included length, thickness, curl and the
orientation of fibre segments. Recently, Pourdeyhimi et al249, 250’ 2S1, 252 completed a
series of studies on the fibre orientation of nonwovens by using an image analyzer to
analyse the fibre orientation in which image processing techniques such as computer
simulation, fibre tracking, Fourier transforms and flow field techniques were employed.
In contrast to many two-dimensional imaging techniques used for thin nonwoven
fabrics, (based on the orientation distribution function (ODF) of a fibrous structure of
the Hilliard-Komori-Makishima theory253), Gilmore et al254 tried to visualise and to
quantify the three dimensional structures of thick nonwovens via X-ray tomographic
techniques.
4.4.6.2 Introduction of the Quantimet 570 System
In this work, the fibre orientation distribution was measured using a Quantimet 570
image analysis system255. The Quantimet 570 is based on a computer system operating
with an integrated menu-driven image analysis software package (Quic) in which
numerous functions can be performed, such as image capture, grey image edit, binary

133 Chapter 4
image threshold and detect, binary image edit and transforms, and feature measurement
functions. A video camera and lighting system are used in the main imaging system but
live connection to an SEM and other digital sources is also possible.
Images taken from the camera are stored, processed and then measured. Two lenses
were available, which could be fitted to the black and white COHU CCD camera to give
magnifications in the range X 1.5-X8 (first lens) and X 25 magnification (second lens).
A direct link from a Cambridge 360 Scanning Electron Microscope to the Q570 was
also employed for part of the work255.
4.4.6.3 Operating Principles of the Quantimet 570
255The main stages of image analysis using the Q570 have been previously outlined . A
series of several sequential operations is required to perform image analysis, and the
following general procedures are usually carried out256:
1. Production of a grey image of the sample fabric.
2. Processing the grey image.
3. Detection of the grey image and conversion into binary form.
4. Storage and processing of the binary image.
5. Measurement of the fibre orientation and output of results.
4.4.6.4 Measurement of the Fibre Orientation Distribution in the Experimental
Nonwoven Fabrics
A test procedure using the Q570 for the measurement of fibre orientation in woollen
slubbings has been given by Russell256. In the present work, the existing program was
modified to allow measurement of the fibre orientation distribution in nonwoven fabrics.
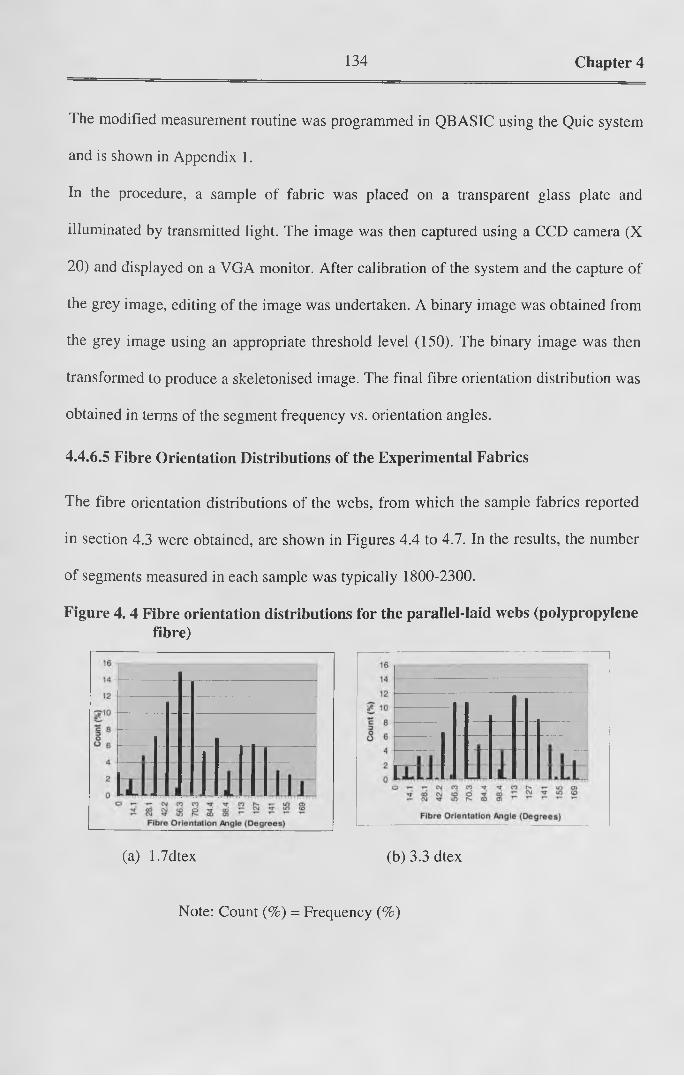
134 Chapter 4
The modified measurement routine was programmed in QBASIC using the Quic system
and is shown in Appendix 1.
In the procedure, a sample of fabric was placed on a transparent glass plate and
illuminated by transmitted light. The image was then captured using a CCD camera (X
20) and displayed on a VGA monitor. After calibration of the system and the capture of
the grey image, editing of the image was undertaken. A binary image was obtained from
the grey image using an appropriate threshold level (150). The binary image was then
transformed to produce a skeletonised image. The final fibre orientation distribution was
obtained in terms of the segment frequency vs. orientation angles.
4.4.6.5 Fibre Orientation Distributions of the Experimental Fabrics
The fibre orientation distributions of the webs, from which the sample fabrics reported
in section 4.3 were obtained, are shown in Figures 4.4 to 4.7. In the results, the number
of segments measured in each sample was typically 1800-2300.
Figure 4. 4 Fibre orientation distributions for the parallel-laid webs (polypropylene fibre)
(a) 1.7dtex (b) 3.3 dtex
Note: Count (%) = Frequency (%)

135 Chapter 4
Figure 4. 5 Fibre orientation distributions for the parallel-laid webs (viscose fibre)
O r - i - c v i c o c O ' j ^ n N ' - i f l r ot ' c d c N i t d d T f a i ! ; ^ ^ ^ ®,r - c \ j - ^ r m r ^ o o a >Fibre Orientation Angie (D egrees)
Fibre Orientation Angle (Degrees)
(a) 1.7 dtex (b) 3.3 dtex
Figure 4. 6 Fibre orientation distribution for cross-laid webs (polypropylene fibre)
Fibre Orientation Angle (Degrees)
(a) 1.7 dtex (b) 3.3 dtex
Figure 4. 7 Fibre orientation distribution for cross-laid webs (viscose fibre)
Fibre orientation Angle (Degrees)
(a) 1.7 dtex
Count (%) = Frequency (%)
(b) 3.3 dtex

136 Chapter 4
In this work, only the fibre orientation distributions for the unbonded webs were
measured. The fibre orientation distributions in the needlepunched and hydroentangled
fabrics were not measured because the fibre orientation distributions in these fabrics
were different in adjacent regions. Additionally, the fibre orientation distributions in the
bonded areas (i.e., the jet or needle marked areas) could not be determined because the
areas containing these marks (produced by hydroentanglement and needlepunching
respectively) were too small to be measured.
Fibre type and the fibre fineness are believed to influence the fibre orientation in carded
webs since it is known that the fibre type and fibre fineness influence the occurrence of
fibre hooks257,258,259,260. Thus, it may be expected that both fibre type and fibre fineness
will also affect the anisotropy of liquid transport in the nonwoven fabric.
Statistically, the CV% of the fibre orientation distributions characterises the variation of
the data. The CV% of fibre orientation can be used to describe the anisotropy of the
non woven structure. The overall CV% of fibre orientation obtained for each of the webs
is shown in Table 4.8.
Table 4. 8 Standard deviation and CV% of mean angles in the fibre orientation
distribution
Parameters P.P Webs Viscose Webs
Parallel laid Cross Laid Parallel laid Cross Laid
Fibre Fineness (dtex) 1.7 3.3 1.7 3.3 1.7 3.3 1.7 3.3
Mean Angle (Degrees) 75.5° 91.1° 93.7° 89.1°
Oor—
H 99.3° 84.7° 96.0°
STD. DEV (Degrees) 40.8° 41.7° 43.7° 47.1° 47.6° 42.7° 52.4° 51.5°
CV (%) 54.1 45.4 47.7 52.9 45.6 43.0 61.9 54.6

137 Chapter 4
As shown in Table 4.8 and Figures 4.4 to 4.7, it was established that the structural
anisotropy of carded webs (and parallel-laid webs) composed of different fibre
diameters differed as indicated below:-
polypropylene (1.7dtex)>polypropylene (3.3 dtex);
Viscose (3.3 dtex) >Viscose (1.7 dtex)
The cross-laid webs differed from the parallel-laid webs in the following two aspects:-
1) The anisotropy of fibre orientation in the cross-laid webs was smaller than that of the
parallel-laid webs.
2) The maximum fibre orientation in the cross-laid webs was around 45°~90° degrees
different from the maximum fibre orientation in the parallel-laid webs.
Examples of the fibre orientation distributions obtained for two commercial nonwoven
wound dressings, (Sorbsan and Soffban Natural, reported in Chapter 2), are shown in
Figures 4.8(a) and 4.8(b) respectively. Sorbsan is a parallel-laid unbonded web
composed of calcium alginate fibre and Soffban Natural is a needled fabric composed of
cellulosic fibre.
Figure 4. 8 Fibre orientation distributions for the commercial nonwoven wound
dressing fabrics
Fibre Orientation Angle (Degrees)
O O) CO CD lO r CO U O C V J O )co co o 0 T_ co in coCO lO CO CO r ' T~ y - T - y-
Fibre O rientation Angle (D egrees)
(a) Sorbsan (b) Soffban Natural

138 Chapter 4
It is apparent that the distributions are similar to those obtained for the experimental
fabrics.
4.5 STRUCTURAL CHARACTERISTICS OF THE EXPERIMENTAL
NONWOVEN FABRICS
Important elements of non woven fabric structure are fibre orientation90, fibre curl253,
and the freedom of movement of fibres between the bond points94. Many researchers
have reported that the anisotropy of mechanical properties in nonwoven fabrics can be
explained by anisotropy in the fabric structure, particularly, the fibre orientation
distribution91.
Anisotropy of the fabric structure arises from the methods of nonwoven fabric
manufacture. For nonwoven fabrics made from carded webs such as those produced in
the present work, the methods of web formation and subsequent web bonding are
particularly important.
4.5.1 Characteristics of the Unbonded Web Structures
In this work, two main classes of carded structure are considered, i.e., cross-laid and
parallel-laid. A schematic of the general geometric arrangement of fibres in such webs is
shown in Figure 4.9 (a) and (b).
The term parallel-laid is generally used to describe webs with fibres preferentially
arranged in one direction (see Figure 4.9(a)).

139 Chapter 4
Cross-laid webs are usually made by folding or cross lapping of carded webs. Cross-laid
webs can be balanced, with approximately the same number of fibres in both directions,
or unbalanced, with more fibres oriented in one direction than the other. Figure 4.9(b)
shows a schematic representation of a cross-laid web.
Figure 4. 9 The typical geometric arrangement of fibres in Cross-laid and
Parallel-laid web.
(a) Parallel-laid web (b) Cross-laid web
The frequency distribution and probability density function of a typical cross-laid web is
bimodal (showing two local maximum over a 180-degree range of orientation angles).
Cartesian plots of these functions have a characteristic ‘W ’ shape for cross-laid webs. In
some cases, the two predominant directions may be offset by around 45°~90° as shown
in Figures 4.6 and 4.7 and the offset is controlled by the cross-lapping process.
4.5.2 Characteristics of the Needlepunched Nonwoven Structures
Needle-punched nonwoven fabrics have a characteristic structural architecture resulting
from their method of manufacture. The reorientation of fibres and the migration of
fibres from the surface to the interior of the web262 are shown in Figure 4.10. Needle

140 Chapter 4
marking may also occur (see Figure 4.10), which is visible as a series of punch holes
joined by reoriented fibres in the fabric plane running in the machine direction. The
shape and number of the holes depends mainly on the number of needles in the needle
board, the size of the needles, the fibre type and the punch density.
Figure 4.10 Structure of needlepunched fabrics
(a) Pillar structure in the cross section262 (b) Appearance of needle marks in the fabric
surface of experimental fabric
(c) Cross section of a needle mark262, (d). Appearance of needle marking in the surface
of experimental needled fabric.

141 Chapter 4
The depth of needle penetration, the number of barbs that pass through a web and the
distance each barb and its attached fibres travel are important variables in the punching
process. Previously, the effects of changes in penetration depth and the number of
barbs94,261'262 on the fabric structure have been investigated. These experiments showed
that fabric strength is influenced by alterations in barb position within the web.
Maximum fabric tenacity from a given web can be obtained by using only three barbs if
the depth of penetration is adjusted accordingly. In needlepunched fabrics, many fibres
are aligned in the transverse direction94 and have greater porosity and a larger number of
curved inter-connected pore channels than woven fabrics.
Previous studies have also been completed on needle-punched fabrics to study the
relationship between the anisotropic structure and the anisotropy of fabric tensile
properties. Backer and Petterson92 developed a fibre network theory for estimating the
tensile properties of nonwoven fabrics based on measurements of fibre orientation in
needle felts. Hearle and Stevenson90, 91 also found that the stress-strain properties of
nonwoven fabrics were dictated by the orientation distribution of fibre segments. Hearle
et al262 reported the effect of needle penetration on the appearance of needlefelts (see
Figure 4 .11). He found that the punched loops do not protrude from the bottom surface
of the fabric when the needle penetration is small, the resulting fabric appearance and
needle marks are illustrated in Figure 4.11(a). He found that a pseudo-knitted
appearance resulting from the linked loops of fibre tufts punched by the needle barbs
could be detected on the fabric surface262 when the needle penetration is large, as
illustrated in Figure 4.11(b). However, no research on the influence of these structural
characteristics on fabric anisotropy has been reported.

142 Chapter 4
Figure 4.11 Needled fabric structures and the influence of process conditions262
(a) low level of needling density and
low needle penetration
(b) high level of needling density and
high needle penetration
It is apparent from the present work that the structure of needlepunched fabrics is not
homogeneous. Needle marks (see Figure 4.10) were present and the fabrics essentially
comprised of two different areas. The first area (between the needle marks), is not
disturbed by the needlepunching process and retains the same structure as the original
unbonded web. The second needle-marked areas contain fibres oriented approximately
perpendicular to the fabric plane. Other fibres are realigned in the machine direction.
This reorientation of fibres appears to increase the structural anisotropy as compared
with the unbonded webs.
4.5.3 Characteristics of Hydroentangled Fabric Structure
In common with needlepunching, hydroentanglement changes the structure of the
unbonded web. Fibres are reoriented both in the machine direction and in the vertical
direction (perpendicular to the fabric surface). Since fabrics are consolidated mainly in
the areas where the water jets impact, jet marks (see Figure 4.12) are formed on the

143 Chapter 4
fabric surface, which appear as visible ‘lines’ on the jet-side of the fabric running in the
machine direction (see Figure 4.12).
Figure 4.12 Jet marks in the surface of the experimental hydroentangled fabrics
MD
Figure 4.13 Cross section of an experimental hydroentangled fabric composed of polypropylene fibre
Qiao263 studied the structural characteristics of hydroentangled fabric using different
processing parameters. There is no one type of hydroentangled fabric structure. At lower
water jet pressure, only a small portion of fibres in the surface of the web are entangled
and reoriented into the vertical direction (see Figure 4.13). At a high water jet pressure,

144 Chapter 4
some fibres may be reoriented to the reverse side of the web and some of these fibres
can project on the reverse side.
As in needling, jet marks are formed in the fabric surface which become more
pronounced as the specific energy introduced to the web rises. Furthermore, these marks
are aligned in the machine direction. Even if the carded web is an isotropic structure, the
preferential orientation of the fibres in the machine direction resulting from
hydroentanglement produces an anisotropic structure. This structural feature is believed
to have markedly influenced the liquid transport characteristics of the experimental
fabrics.
It was noted that the structure of the polypropylene hydroentangled fabric was different
to the fabric made from viscose rayon fibre (see Fig. 4.13). It is noted that the specific
flexural rigidity of polypropylene fibre is much higher than the viscose (see Table 4.9),
and it is also known that polypropylene has higher compression recovery, bending
recovery and tensile recovery264, (compared to viscose rayonJ5). It would appear that the
fibre rigidity and the bending recovery influence the ability of the jet to produce fibre
entanglement during hydroentanglement. For the hydroentangled fabric composed of
polypropylene, only the fibres in the surface of the resulting fabric were effectively
bonded, and the fibres inside the fabric were poorly entangled. The fabric surface was
therefore more compact than the fabric core (see Fig. 4.13).
Table 4. 9 Specific flexural rigidity of polypropylene and viscose fibres
Specific Flexural Rigidity
(mN.mm/tex2)
Viscose Polypropylene
0.35 0.51

145 Chapter 4
Also, it is interesting to note that the hydroentangled fabrics made from the parallel-laid
polypropylene webs had higher packing density when the fabric was produced from
webs with fibres aligned across the width of machine (fabric PA IV V I compared to
fabric PA1PP1). That is, fabric PAIVVI was more compact than fabric PV1PP1 and
had a higher degree of fibre entanglement.
The fabrics composed of viscose rayon were visually more compact than the
polypropylene fabrics.

146 Chapter 5
CHAPTER 5 THE EFFECT OF FABRIC STRUCTURAL
PARAMETERS ON THE ANISOTROPY OF
LIQUID TRANSPORT IN NONWOVEN WOUND
DRESSING FABRICS
In Chapter 1, it was indicated that wound dressings require particular liquid handling
properties depending on the specific application. To construct wound dressings so that
they meet the specific requirements of the product application, the structural architecture
of the material needs to be engineered so that ‘predictable’ or ‘controlled’ fluid handling
properties can be obtained. Thus, in addition to the fibre composition, the structural
characteristics of the nonwoven fabric are key to understanding and optimising the
performance of wound dressing applications and it is necessary to understand how the
fabric structure influences liquid transport in such fabrics. The aim of this chapter is to
elucidate the influence of nonwoven fabric structure on the anisotropy of liquid
transport using the newly constructed measuring system described in Chapter 3 and the
fabrics produced in Chapter 4.
5.1 DEFINITION OF TERMS
5.1.1 Anisotropy of Permeability
As indicated before, the directional permeability of a porous fabric obeys Ferrandon’s
equation170. The anisotropy of fabric permeability, 0)k, was defined in section 3.9.4 as
the ratio of the two principle permeabilities as follows:

147 Chapter 5
Where k{ and k2 are the principle permeabilities in the two orthogonal directions (p
71and (0 + —) in the fabric plane using a Cartesian coordinate system x,and
x2 respectively. The angle (p is called the characteristic angle. The terms , k2 and (p
are defined in Ferrandon’s equation (see equation 3.9.4.2).
5.1.2 Anisotropy of Liquid Absorption
The anisotropy of liquid absorption in a fabric is defined as the ratio of the volumetric
flow rate in the two principle directions.
The liquid absorption rate can also be described using Darcy’s Law104, where the driven
pressure in the direction of liquid absorption 6 is the capillary pressure, p ( 6 ).
According to Darcy’s law, the ratio of flow rate in liquid absorption, coa , can be
rewritten as follows:-
oj = Jh Z l. (5.1.2)klP i
Where p\ and p 2, are the capillary pressures in the same directions as the principle
permeabilities, k{ and k2, respectively.
Although the directional capillary pressure p { 6 ) is determined by the properties of the
liquid and the fabric structure (especially the fibre orientation distribution)265, the
differences in directional capillary pressure in different directions of the fabric are
dominated by the anisotropy of the fabric structure. That is, the anisotropy of liquid
absorption in a homogeneous structure is dominated by the instrinsic anisotropy of the
fabric structure.

148 Chapter 5
5.2 DETERMINATION OF THE ANISOTROPY OF PERMEABILITY AND
LIQUID ABSORPTION FROM THE EXPERIMENTAL DATA
According to the definitions of the anisotropy of permeability and liquid absorption
given in sections (3.10.4) and (5.1), the stages involved in calculating these parameters
from the measured results of the new capacitance system (see Chapter 3) are now
described.
5.2.1 Stage 1
The ratio of the mass of liquid in the fabric per unit voltage of the signal is defined in
equations (3.10.3.1) and (3.10.3.2), which can be written as follows:-
y = - M ( T ) (g/volt), (<= 1 ,2 ,. . .9 ) (5.3.1)Y , V i(T)1 = 1
Where Vt(T) is the measured voltage in the i,h segment at the moment T, and M(T) is the
mass of the liquid that has been retained by the fabric during testing at the moment T.
5.2.2 Stage 2
The volumetric (or mass) rate of liquid transmission per minute of the ith segment, <y; , in
each segment (i.e. in all eight directions in the measuring system) is therefore given by
the following equation:-
V.(T)03i = ~ ~ V (g/s) (5-3.2)

149 Chapter 5
5.2.3 Stage 3
The permeability of the test fabric in the ith segment can be calculated by substituting
C0t , the fabric thickness d, and time T into the equation (3.10.3.12).
5.2.4 Stage 4
The ratio of the permeability of the fabric in the direction of each segment to the
permeability of the fabric in the machine direction (i.e., in the direction of the l st
segment (at 0 degrees)) is calculated.
5.2.5 Stage 5
Since directional permeability obeys Ferrandon’s equation170 as shown in equation
(5.1.4), all the ratios of permeability in each segment (direction) were substituted into
equation (5.1.4) and the Least Square Residual Algorithm222 was used to obtain the
principle specific permeabilities kj, £2 and the principle angle if/ .
5.2.6 Stage 6
The ratio, k2/ki, is obtained as the anisotropy of permeability from forced flow
experiments where the hydraulic pressures from the liquid source point in each direction
were identical. In liquid absorption, this calculated ratio is actually the anisotropy of
absorption where the capillary pressures in each direction are not the same.

150 Chapter 5
5.3 STUDY OF THE ANISOTROPY OF PERMEABILITY AND LIQUID
ABSORPTION IN THE EXPERIMENTAL FABRICS
The new measuring device described in Chapter 3 was used to determine the liquid
transport properties of a wide range of nonwoven fabrics designed for use as dressings
(described in Chapter 4). The testing procedures are described in section (3.9).
5.3.1 Measurement Conditions
5.3.1.1 Set-up of the Measuring System
The distance between the upper plate and lower plates was decided according to the
thickness of the sample. The settings used are shown in Table 5.1.
Table 5 .1 Distance between plates of capacitance transducers
Hydroentangled polypropylene and unbonded webs 9 mm
Needlepunched fabrics and hydroentangled viscose
rayon fabrics
5 mm
Two types of liquid were used as test fluid in the experimental work, distilled water and
Liquid A (reduced surface tension, see section 4.4.4). Liquid A was only used for
measurements on the hydroentangled polypropylene fabrics due to its high liquid-fibre
interface tension, and the other nonwoven fabrics were measured using distilled water.
5.3.1.2 Fabrics Used for Evaluation
The specification of the fabrics used for testing were described earlier (see Tables 4.2
and 4.6 in Chapter 4). The test samples may be summarised as follows:
1. Unbonded webs.
2. Needlepunched fabrics made from the unbonded webs.

151 Chapter 5
3. Hydroentangled fabrics made from the unbonded webs.
All three types of structure were used in the measurement of the anisotropy of
permeability; but only the needlepunched fabrics and the hydroentangled viscose fabric
were used to measure the anisotropy of absorption. This is because the surface tension
of the hydroentangled polypropylene fabrics was much lower than that of the distilled
water and so the water could not penetrate into the fabric at a small external hydraulic
pressure.
5.3.2 Experimental Results
5.3.2.1 Measured Results of Anisotropy of Permeability: Forced Liquid Flow
Through the Fabrics at a Constant Flow Rate
Table 5.2 shows the measured results of the volumetric ratio of liquid flow through the
fabric in eight directions. Generally R2 values of around 0.9 were obtained.
Table 5.3 shows the measured results of permeabilities in eight directions at a time (7)
in the fabric samples.
Table 5.4 shows the relative ratio of permeabilities in each direction to the
permeabilities in the machine direction in each of the fabric samples.
Table 5.5 shows the empirical anisotropy of permeability for each fabric sample and its
characteristic angle.
Table 5.6 shows the calculated permeability from the obtained principle permeabilities
and its characteristic angles in terms of the hydraulic pressure, Po(T), in eight directions
for each of the fabric samples.

152 Chapter 5
5.3.2.2 Measured Results of the Anisotropy of Liquid Absorption in the Fabrics
due to Capillary Pressure
Table 5.7 shows the measured results of the absorption ratio as the liquid spreads in
eight directions in the fabric samples. Generally R2 values of around 0.9 were obtained.
Table 5.8 shows the measured results of the product of permeability and the capillary
pressure in eight directions ( kAp ) at a time (7) in the sample fabrics.
Table 5.9 shows the ratio of liquid absorption in each separate direction to the
corresponding liquid absorption in the machine direction in all the fabrics (i.e., the
relative ratio of the product of permeability and its corresponding capillary pressure in
each direction to that in the machine direction for each of the fabric samples).
Table 5.10 shows the empirical anisotropy of liquid absorption in each fabric and its
principle angle.
Table 5.11 shows the calculated product of permeability and its corresponding capillary
pressure ( kAp ) in all eight directions in the fabrics.
In Tables 5.1-5.11, 0 and 90 degrees represent the machine direction (MD) and the
cross direction (CD) respectively. All the symbols used in these tables to denote
different fabrics have been reproduced from Tables (4.1) and (4.2) in section 4.1 of
Chapter 4.
For the purpose of comparison, test results for three commercial wound dressing fabrics
have also been included (Sorbsan, Soffban Natural and Lantor).

153 Chapter 5
Table 5. 2(a) Measured flow rates (g/s) in forced flow through the fabrics in different directions
Angles(Degrees)
0°(MD)
45° 90° 135° OO o o 225° 270° 315° Sum
PA 1 WEB 0.098 0.064 0.038 0.047 0.063 0.059 0.030 0.065 0.472
PA2WEB 0.036 0.027 0.046 0.027 0.028 0.024 0.052 0.058 0.303
PB1WEB 0.048 0.034 0.029 0.030 0.047 0.028 0.023 0.024 0.268
PB2WEB 0.046 0.038 0.040 0.018 0.013 0.043 0.048 0.046 0.280
VA2WEB 0.056 0.052 0.039 0.047 0.052 0.046 0.031 0.044 0.377
VA1WEB 0.044 0.054 0.059 0.051 0.013 0.048 0.088 0.079 0.447
VB1WEB 0.104 0.077 0.054 0.053 0.047 0.040 0.013 0.063 0.462
VB2WEB 0.053 0.062 0.065 0.060 0.020 0.054 0.090 0.084 0.500
PA2N1 0.031 0.031 0.017 0.030 0.035 0.030 0.029 0.026 0.240
PA2N2 0.029 0.042 0.021 0.022 0.043 0.046 0.032 0.018 0.262
PA1N1 0.024 0.029 0.013 0.015 0.035 0.031 0.017 0.012 0.182
PA1N2 0.017 0.022 0.008 0.015 0.023 0.023 0.007 0.006 0.126
PB1N1 0.043 0.042 0.035 0.044 0.046 0.040 0.035 0.030 0.328
PB1N2 0.043 0.030 0.028 0.030 0.036 0.034 0.025 0.037 0.273
PB2N1 0.053 0.051 0.025 0.037 0.057 0.071 0.065 0.057 0.427
PB2N2 0.044 0.031 0.023 0.031 0.032 0.034 0.029 0.028 0.261
VA1N1 0.021 0.023 0.009 0.025 0.034 0.033 0.028 0.019 0.199
VA1N2 0.040 0.045 0.017 0.031 0.036 0.035 0.036 0.033 0.284
VA2N1 0.028 0.030 0.017 0.028 0.033 0.034 0.034 0.029 0.243
VA2N2 0.037 0.035 0.017 0.036 0.037 0.039 0.037 0.041 0.291
VB1N1 0.025 0.041 0.021 0.035 0.042 0.049 0.030 0.017 0.272
VB1N2 0.045 0.047 0.021 0.042 0.049 0.047 0.042 0.038 0.343
VB2N1_1 0.045 0.038 0.040 0.040 0.034 0.030 0.041 0.040 0.317
VB2N1_2 0.057 0.084 0.029 0.051 0.056 0.067 0.071 0.050 0.485

154 Chapter 5
Table 5. 2(b) Measured flow rates (g/s) in forced flow through the fabrics in
different directions
Angles(Degrees)
0°(MD)
45° 90° 135° OO O o 225° 270° 315° Sum
VB2N3 0.070 0.071 0.027 0.057 0.065 0.066 0.061 0.054 0.493
PA1PP1 0.080 0.013 0.054 0.101 0.080 0.042 0.037 0.137 0.559
PA1VV3 0.019 0.014 0.018 0.019 0.023 0.017 0.015 0.014 0.143
PA1VV4 0.029 0.019 0.015 0.023 0.033 0.023 0.025 0.025 0.195
PA2H3 0.035 0.035 0.029 0.022 0.052 0.048 0.030 0.022 0.278
PB1PP2 0.044 0.042 0.031 0.034 0.085 0.080 0.052 0.039 0.418
PB1 VV1_1 0.045 0.032 0.029 0.046 0.062 0.048 0.041 0.045 0.355
PB1VV1_2 0.042 0.041 0.044 0.029 0.060 0.041 0.046 0.033 0.342
PB2H2 0.044 0.037 0.034 0.024 0.061 0.019 0.026 0.030 0.282
VA1PP 0.021 0.003 0.004 0.024 0.041 0.006 0.004 0.005 0.113
VA1VV 0.259 0.029 0.022 0.008 0.397 0.102 0.039 0.005 0.889
VA2H1 0.077 0.007 0.009 0.076 0.047 0.019 0.018 0.026 0.293
VB1VV1 0.063 0.004 0.000 0.002 0.002 0.010 0.005 0.009 0.115
VB2H2 0.037 0.017 0.028 0.107 0.134 0.013 0.008 0.007 0.394
SORBSAN 0.027 0.022 0.028 0.028 0.026 0.021 0.018 0.025 0.208
SOFFBAN
NATURAL
0.093 0.039 0.032 0.096 0.054 0.073 0.092 0.109 0.591
LANTOR 0.416 0.320 0.252 0.435 0.442 0.111 0.106 0.214 0.654

155 Chapter 5
Table 5. 3(a) Measured permeability of the fabrics in different directions
Angle(Degrees)
0°(MD)
45° o o 135° 00 o o 225° 270° 315°
PA 1 WEB 1.26E-07 7.88E-08 4.46E-08 5.56E-08 7.73E-08 7 .17E-08 3.38E-08 8.09E-08
PA2WEB 3.81E-08 2.78E-08 4.98E-08 2.76E-08 2.86E-08 2.42E-08 5.73E-08 6.41E-08
PB1WEB 8.02E-08 5.54E-08 4.62E-08 4.77E-08 7.88E-08 4.53E-08 3.52E-08 3.83E-08
PB2WEB 7.02E-08 5.77E-08 5.98E-08 2.47E-08 1.8E-08 6.58E-08 7.58E-08 6.94E-08
VA2WEB 6.08E-08 7.37E-08 8.40E-08 7.26E-08 4.75E-08 6.97E-08 9.02E-08 8.33E-08
VA1WEB 8.85E-08 7.58E-08 1.67E-08 7.00E-08 1.37E-07 1.21E-07 6.34E-08 7.96E-08
VB1WEB 1.34E-07 9.66E-08 6.51E-08 6.47E-08 5.66E-08 4.77E-08 1.39E-08 7.75E-08
VB2WEB 6.49E-08 7.69E-08 8.04E-08 7.35E-08 2.14E-08 6.51E-08 1.15E-07 1.07E-07
PA2N1 5.45E-08 5.44E-08 2.73E-08 5.17E-08 6.17E-08 5.17E-08 5.06E-08 4.41E-08
PA2N2 6.16E-08 9.49E-08 4.45E-08 4.6E-08 9.75E-08 1.04E-07 6.9E-08 3.62E-08
PA1N1 3.89E-08 4.8E-08 2.09E-08 2.37E-08 5.91E-08 5.33E-08 2.79E-08 1.91E-08
PA1N2 3.43E-08 4.69E-08 1.59E-08 3.13E-08 4.8E-08 4.88E-08 1.32E-08 1.17E-08
PB1N1 7.17E-08 6.92E-08 5.63E-08 7.36E-08 7.6E-08 6.61E-08 5.71E-08 4.76E-08
PB1N2 8.66E-08 5.8E-08 5.54E-08 5.77E-08 7.15E-08 6.83E-08 4.89E-08 7.36E-08
PB2N1 8.6E-08 8.33E-08 3.68E-08 5.74E-08 9.29E-08 1.19E-07 1.08E-07 9.26E-08
PB2N2 1.03E-07 7.02E-08 4.96E-08 6.95E-08 7.34E-08 7.75E-08 6.44E-08 6.23E-08
VA1N1 4.54E-08 4.83E-08 1.68E-08 5.27E-08 7.62E-08 7.43E-08 6.17E-08 3.97E-08
VA1N2 1.12E-07 1.27E-07 4.44E-08 8.38E-08 9.88E-08 9.64E-08 9.86E-08 9.03E-08
VA2N1 5.28E-08 5.6E-08 2.98E-08 5.28E-08 6 .15E-08 6.51E-08 6.52E-08 5.36E-08
VA2N2 8.82E-08 8.38E-08 3.86E-08 8.46E-08 8.88E-08 9.39E-08 8.77E-08 9.85E-08
VB1N1 4.29E-08 7.47E-08 3.63E-08 6.36E-08 7.74E-08 9.1E-08 5.39E-08 2.74E-08
VB1N2 9.49E-08 1.01E-07 4.07E-08 8.83E-08 1.06E-07 1.01E-07 8.99E-08 8.01E-08

156 Chapter 5
Table 5.3(b) Measured permeability in the fabrics in different directions
Angle(Degrees)
0°(MD)
45° 90° 135° 00 o o 225° 270° 315°
VB2N1_1 6.11E-08 5.1E-08 5.4E-08 5.39E-08 4.54E-08 3.89E-08 5.54E-08 5.39E-08
VB2N1_2 9.03E-08 1.37E-07 4.19E-08 7.95E-08 8.8E-08 1.06E-07 1.13E-07 7.72E-08
VB2N3 1.31E-07 1.33E-07 4.62E-08 1.04E-07 1.19E-07 1.22E-07 1.12E-07 9.82E-08
PA1PP1 8.01E-08 1.04E-08 5.21E-08 1.03E-07 7.98E-08 3.92E-08 3.38E-08 1.43E-07
PA1VV3 3.68E-08 2.78E-08 3.61E-08 3.78E-08 4.7E-08 3.34E-08 2.89E-08 2.71E-08
PA1VV4 9.98E-08 6.21E-08 4.95E-08 7.94E-08 1.17E-07 7.95E-08 8.56E-08 8.61E-08
PA2H3 4.82E-08 4.87E-08 3.99E-08 2.99E-08 7.55E-08 6.82E-08 3.07E-08 2.9E-08
PB1PP2 4.27E-08 4.08E-08 2.92E-08 3.25E-08 8.83E-08 8.21E-08 5.16E-08 3.79E-08
PB1VV1_1
5.95E-08 4.12E-08 3.68E-08 6.12E-08 8.5E-08 6.44E-08 5.39E-08 5.94E-08
PB1VV1_9.
5.61E-08 5.48E-08 5.83E-08 3.68E-08 8.15E-08 5.37E-08 6.07E-08 4.24E-08
PB2H2 6.43E-08 5.36E-08 4.88E-08 3.29E-08 9.21E-08 2.55E-08 3.58E-08 4.3E-08
VA1PP 1.01E-07 1.22E-08 1.82E-08 1.19E-07 2.06E-07 2.58E-08 1.66E-08 1.99E-08
VA1VV 1.43E-06 1.35E-07 9.61E-08 3.12E-08 2.28E-06 5.23E-07 1.83E-07 2E-08
VA2H1 4.66E-07 3.38E-08 4.64E-08 4.6E-07 2.71E-07 1.03E-07 9.5E-08 1.4E-07
VB1VV1 2.87E-07 1.27E-08 7.95E-10 5.35E-09 3.02E-10 3.83E-08 1.79E-08 3.53E-08
VB2H2 1.83E-07 7.88E-08 1.34E-07 5.85E-07 7.46E-07 5.66E-08 3.27E-08 2.89E-08
SORBSAN 2.49E-07 1.97E-07 2.55E-07 2.61E-07 2.38E-07 1.99E-07 1.59E-07 2.37E-07
SOFFBAN NATIIR AT.
2.82E-07 1.1 IE-07 8.79E-08 2.92E-07 1.55E-07 2.15E-07 2.79E-07 3.37E-07
LANTOR 1.21E-06 9.14E-07 7.07E-07 1.27E-06 1.29E-06 2.92E-07 2.78E-07 5.91E-07

157 Chapter 5
Table 5. 4(a) Ratio of permeability in the fabrics in different directions
Angle(Degrees)
0°(MD)
45° VO o o 135° 00 o o 225° 270° 315° 360°
PA 1 WEB 0.632 0.362 0.447 0.629 0.557 0.265 0.616 1
PA2WEB 0.689 1.208 0.844 0.794 0.684 1.416 1.595 1
PB1WEB 0.67 0.57 0.59 0.956 0.568 0.467 0.532 1
PB2WEB 0.791 0.907 0.358 0.344 0.889 1.255 0.654 1
VA2WEB 1.213 1.382 1.194 0.782 1.147 1.484 1.371 1
VA1WEB 0.857 0.189 0.792 1.548 1.369 0.716 0.9 1
VB1WEB 0.721 0.486 0.483 0.423 0.356 0.104 0.578 1
VB2WEB 1.185 1.239 1.132 0.329 1.004 1.771 1.646 1
PA2N1 0.998 0.5 0.948 1.131 0.948 0.927 0.809 1
PA2N2 1.54 0.722 0.747 1.582 1.683 1.121 0.587 1
PA1N1 1.233 0.536 0.609 1.519 1.37 0.716 0.492 1
PA1N2 1.366 0.463 0.911 1.397 1.42 0.384 0.34 1
PB IN I 0.965 0.785 1.026 1.06 0.921 0.796 0.663 1
PB1N2 0.669 0.639 0.667 0.825 0.788 0.565 0.85 1
PB2N1 0.969 0.428 0.668 1.081 1.385 1.252 1.078 1
PB2N2 0.685 0.484 0.677 0.716 0.756 0.628 0.608 1
VA1N1 1.065 0.371 1.163 1.679 1.638 1.361 0.876 1
VA1N2 1.131 0.396 0.748 0.881 0.86 0.879 0.805 1
VA2N1 1.061 0.564 1.001 1.166 1.233 1.236 1.015 1
VA2N2 0.949 0.438 0.959 1.006 1.064 0.993 1.116 1
VB1N1 1.743 0.845 1.482 1.805 2.122 1.256 0.639 1
VB1N2 1.068 0.429 0.93 1.112 1.063 0.947 0.843 1
VB2N1_1 0.834 0.883 0.882 0.743 0.636 0.907 0.881 1
VB2N1_2 1.514 0.463 0.88 0.974 1.176 1.255 0.855 1

158 Chapter 5
Table 5. 4(b) Ratio of permeability in the fabrics in different directions
Angle
(Degrees)
0°
(MD)
45° 90° 135° 180° 225° 270° 315° 360°
YB2N3 1.018 0.354 0.798 0.914 0.937 0.857 0.752 1
PA1PP1 0.13 0.651 1.291 0.997 0.489 0.422 1.791 1
PA1VV3 0.756 0.982 1.028 1.276 0.909 0.786 0.737 1
PA1VV4 0.622 0.496 0.795 1.173 0.796 0.858 0.863 1
PA2H3 1.01 0.828 0.621 1.567 1.416 0.845 0.602 1
PB1PP2 0.954 0.684 0.761 2.066 1.921 1.206 0.887 1
PB1VV1_1 0.692 0.618 1.029 1.43 1.083 0.906 0.999 1
PB 1V V 12 0.977 1.039 0.657 1.453 0.959 1.083 0.756 1
PB2H2 0.833 0.759 0.512 1.433 0.396 0.557 0.669 1
VA1PP 0.121 0.18 1.18 2.042 0.256 0.165 0.197 1
VA1VV 0.094 0.067 0.022 1.587 0.364 0.128 0.014 1
VA2H1 0.072 0.099 0.988 0.581 0.221 0.204 0.301 1
VB1VV1 0.044 0.003 0.019 0.001 0.134 0.063 0.123 1
VB2H2 0.432 0.732 3.199 4.083 0.31 0.179 0.158 1
SORBSAN 0.791 1.023 1.048 0.952 0.796 0.637 0.950 1
SOFFBAN
NATURAL
0.393 0.312 1.034 0.551 0.762 0.991 1.196 1
LANTOR 1 0.756 0.585 1.048 1.067 0.242 0.230 0.489 1

159 Chapter 5
Table 5. 5(a) Anisotropy of permeability in the fabrics
K, k 2 0 RSM k/k2 k2/k/
PA 1 WEB 0.374 0.897 -4.192° 0.173 0.419 2.425PA2WEB 1.437 0.768 -25.713° 0.483 1.875 0.539
PB1WEB 0.453 0.991 -2.7490 0.052 0.459 2.213
PB2WEB 1.058 0.633 20.853° 0.788 1.670 0.606
VA2WEB 1.478 0.974 -14.181° 0.077 1.517 0.659
VA1WEB 0.607 1.332 -6.627° 0.601 0.456 2.194
VB1WEB 0.361 0.816 -0.651° 0.380 0.442 2.263
VB2WEB 1.642 0.850 -14.392° 0.663 1.931 0.518
PA2N1 0.756 1.073 -9.736° 0.124 0.704 1.420
PA2N2 0.715 1.698 -34.523° 0.341 0.421 2.375
PA1N1 0.530 1.604 -25.379° 0.214 0.331 3.025
PA1N2 0.458 1.800 -26.097° 0.332 0.254 3.932
PB1N1 0.783 1.034 1 00
'Oo 0.069 0.757 1.321
PB1N2 0.607 0.944 2.652° 0.047 0.643 1.555
PB2N1 0.808 1.180 -31.538° 0.526 0.685 1.461
PB2N2 0.547 0.911 -6.502° 0.069 0.600 1.667
VA1N1 0.890 1.388 -25.314° 1.042 0.641 1.560
VA1N2 0.670 1.053 -20.787° 0.185 0.636 1.571
VA2N1 0.928 1.129 -25.362° 0.280 0.822 1.217
VA2N2 0.830 1.053 5.065° 0.242 0.789 1.268
VB1N1 0.901 1.917 -39.477° 1.020 0.470 2.127
VB1N2 0.751 1.117 -17.908° 0.183 0.673 1.487
VB2N1_1 0.795 0.932 36.003° 0.086 0.853 1.172
VB2N1_2 0.770 1.321 -39.280° 0.403..
0.583 1.715

160 Chapter 5
Table 5.5(b) Anisotropy of permeability in the fabrics
k, k 2 0 RSM kj/k2 k2/ki
VB2N3 0.653 1.055 -18.369° 0.160 0.620 1.614
PA1PP1 0.377 2.039 29.417° 0.242 0.185 5.402
PA1VV3 0.805 1.065 5.019° 0.153 0.756 1.323
PA1VV4 0.631 1.062 8.057° 0.110 0.594 1.683
PA2H3 0.672 1.396 -25.477° 0.339 0.481 2.078
PB1PP2 0.822 1.592 -26.320° 1.377 0.516 1.937
PB 1V V 11 0.775 1.167 10.050° 0.244 0.664 1.507
PB1VV1_2 0.853 1.129 -23.876° 0.309 0.756 1.323
PB2H2 0.495 1.124 -1.044° 0.337 0.440 2.271
VA1PP 0.154 7.094 17.999° 1.216 0.022 46.025
VA1VV 0.064 14.821 - 12.866° 0.280 0.004 232.593
VA2H1 0.128 4.186 20.424° 0.369 0.031 32.757
VB1VV1 0.040 0.736 -3.638° 0.677 0.054 18.515
VB2H2 0.354 6.632 20.968° 11.134 0.053 18.748
SORBSAN 0.782 1.041 25.814° 0.081 0.751 1.332
SOFFBAN
NATURAL0.552 1.151 34.450° 0.447 0.480 2.085
LANTOR 0.405 1.130 13.893° 0.355 0.359 2.789

161 Chapter 5
Table 5. 6(a) Calculated ratio of permeability from kl5 k2 and </> in different directions
Angle
(Degrees)
0°
(MD)
45° 90° 135°
oO00r-H 225° 270° 315° 360°
PA 1 WEB 0.885 0.563 0.376 0.496 0.885 0.563 0.376 0.496 0.885
PA2WEB 0.841 0.821 1.255 1.276 0.841 0.821 1.255 1.276 0.841
PB1WEB 0.976 0.650 0.455 0.598 0.976 0.650 0.455 0.598 0.976
PB2WEB 0.665 0.936 0.983 0.683 0.665 0.936 0.983 0.683 0.665
VA2WEB 0.979 1.121 1.468 1.234 0.979 1.121 1.468 1.234 0.979
VA1WEB 1.216 1.046 0.635 0.693 1.216 1.046 0.635 0.693 1.216
VB1WEB 0.816 0.505 0.361 0.496 0.816 0.505 0.361 0.496 0.816
VB2WEB 0.877 0.972 1.553 1.323 0.877 0.972 1.553 1.323 0.877
PA2N1 1.060 0.941 0.762 0.838 1.060 0.941 0.762 0.838 1.060
PA2N2 1.178 1.624 0.878 0.729 1.178 1.624 0.878 0.729 1.178
PA1N1 1.169 1.306 0.605 0.574 1.169 1.306 0.605 0.574 1.169
PA1N2 1.148 1.376 0.535 0.497 1.148 1.376 0.535 0.497 1.148
PB1N1 1.020 0.943 0.791 0.844 1.020 0.943 0.791 0.844 1.020
PB1N2 0.943 0.725 0.608 0.754 0.943 0.725 0.608 0.754 0.943
PB2N1 1.048 1.151 0.884 0.822 1.048 1.151 0.884 0.822 1.048
PB2N2 0.904 0.724 0.550 0.647 0.904 0.724 0.550 0.647 0.904
VA1N1 1.259 1.305 0.953 0.928 1.259 1.305 0.953 0.928 1.259
VA1N2 0.982 0.961 0.702 0.714 0.982 0.961 0.702 0.714 0.982
VA2N1 1.086 1.102 0.959 0.947 1.086 1.102 0.959 0.947 1.086
VA2N2 1.051 0.909 0.832 0.948 1.051 0.909 0.832 0.948 1.051
VB1N1 1.317 1.897 1.147 0.906 1.317 1.897 1.147 0.906 1.317
VB1N2 1.068 1.015 0.775 0.806 1.068 1.015 0.775 0.806 1.068
V B 2N 11 0.880 0.798 0.838 0.928 0.880 0.798 0.838 0.928 0.880
V B 2N 12 1.027 1.312 0.925 0.773 1.027 1.312 0.925 0.773 1.027

162 Chapter 5
Table 5.6(b) Calculated ratio of permeability from ki, k.2 and (/) in different ____ directionsAngle
(Degrees)
0°
(MD)
45° 90° 135° OO O o 225° 270° 315° 360°
VB2N3 0.994 0.939 0.679 0.707 0.994 0.939 0.679 0.707 0.994
PA1PP1 0.989 0.401 0.470 1.547 0.989 0.401 0.470 1.547 0.989
PA1VV3 1.062 0.895 0.806 0.940 1.062 0.895 0.806 0.940 1.062
PA1VV4 1.048 0.739 0.636 0.852 1.048 0.739 0.636 0.852 1.048
PA2H3 1.164 1.246 0.743 0.713 1.164 1.246 0.743 0.713 1.164
PB1PP2 1.344 1.452 0.908 0.865 1.344 1.452 0.908 0.865 1.344
PB1 V V l l 1.150 0.871 0.783 1.001 1.150 0.871 0.783 1.001 1.150
PB1VV1_2 1.072 1.084 0.889 0.881 1.072 1.084 0.889 0.881 1.072
PB2H2 1.123 0.697 0.495 0.678 1.123 0.697 0.495 0.678 1.123
VA1PP 1.346 0.193 0.170 0.687 1.346 0.193 0.170 0.687 1.346
VA1VV 1.193 0.222 0.067 0.089 1.193 0.222 0.067 0.089 1.193
VA2H1 0.860 0.154 0.145 0.644 0.860 0.154 0.145 0.644 0.860
VB1VV1 0.667 0.087 0.040 0.066 0.667 0.087 0.040 0.066 0.667
VB2H2 2.026 0.420 0.403 1.682 2.026 0.420 0.403 1.682 2.026
SORBSAN 0.980 0.803 0.821 1.005 0.980 0.803 0.821 1.005 0.980
SOFFBAN
n a t u r a l
0.855 0.562 0.663 1.111 0.855 0.562 0.663 1.111 0.855
LANTOR 0.488 0.421 0.764 1.024 0.488 0.421 0.764 1.024 0.488

163 Chapter 5
Table 5. 7 Measured liquid absorption rates (g/min) through the fabrics in different directions
Angle(Degrees)
0°(MD)
45° 90° 135° 180° 225° 270° 315° Sum(g/min)
PA2N1 3.93E-03 3.29E-03 5.15E-03 6.20E-03 4.14E-03 3.19E-03 2.19E-03 5.23E-03 3.46E-02
PA2N2 6.03E-03 5.52E-03 3.67E-03 5.83E-03 7.94E-03 7.07E-03 5.18E-03 6.08E-03 4.31E-02
PA1N1 5.01E-03 5.54E-04 2.31E-04 4.48E-03 1.20E-02 6.59E-03 1.78E-03 5.66E-03 3.75E-02
PA1N2 1.68E-02 2.23E-02 8.36E-03 1.55E-02 2.28E-02 2.31E-02 7.07E-03 6.34E-03 1.26E-01
PB1N1 9.01E-03 474E-03 6.99E-03 8.20E-03 4.55E-03 2.91E-03 3.42E-03 1.89E-02 6.14E-02
PB1N2 1.63E-02 1.29E-02 8.32E-03 5.85E-03 5.85E-03 1.24E-02 1.06E-02 1.37E-02 8.92E-02
PB2N1 1.65E-02 1.82E-02 1.18E-02 1.80E-02 1.98E-02 1.62E-02 1.81E-02 1.45E-02 1.39E-01
VA1N1 5.05E-03 7.27E-03 3.14E-03 4.56E-03 6.21E-03 7.09E-03 4.62E-03 3.91E-03 4.35E-02
VA1N2 1.22E-02 9.17E-03 9.41E-03 9.72E-03 4.65E-03 6.52E-03 9.04E-03 1.33E-02 7.70E-02
VA2N1 1.32E-02 7.98E-03 1.04E-02 1.17E-02 4.01E-03 9.22E-03 8.04E-03 1.28E-02 8.02E-02
VA2N2 1.22E-02 1.42E-02 6.03E-03 1.26E-02 1.41E-02 1.20E-02 1.33E-02 1.25E-02 1.00E-01
VB INI 1.52E-02 1.63E-02 4.30E-03 4.42E-03 4.62E-03 9.02E-03 7.76E-03 6.47E-03 7.05E-02
VB1N2 9.12E-03 4.52E-03 1.05E-03 2.50E-03 3.31E-03 6.17E-03 5.37E-03 6.00E-03 3.95E-02
VB2N1_ 1.83E-02 9.17E-03 1.87E-02 1.73E-02 1.30E-02 1.41E-02 1.32E-02 1.33E-02 1.22E-01
VB2N1_ 3.38E-03 2.65E-03 2.38E-03 3.41E-03 4.98E-03 3.87E-03 3.19E-03 3.06E-03 2.80E-02
VB2N2 2.22E-02 8.93E-03 6.48E-03 1.09E-02 2.83E-02 1.67E-02 1.09E-02 1.77E-02 1.26E-01
VB2N3 1.29E-02 1.69E-02 5.45E-03 9.58E-03 9.61E-03 7.37E-03 1.16E-02 1.06E-02 8.78E-02
VA1VV 1.40E-02 2.37E-03 9.50E-04 2.76E-03 1.30E-02 4.36E-03 3.06E-04 9.17E-04 4.72E-02
VA2H1 5.18E-02 1.07E-02 9.60E-03 3.32E-02 5.32E-02 1.76E-02 1.39E-02 1.75E-02 2.21E-01
VB1VV1 2.05E-02 2.01E-03 1.12E-03 4.85E-03 2.21E-02 4.53E-03 2.66E-03 3.91E-03 6.54E-02
VB2H2 5.74E-03 2.71E-03 1.32E-03 5.09E-03 1.88E-02 3.36E-03 7.07E-04 9.14E-04 4.17E-02SORBSAN 8.66E-03 1.10E-02 6.71E-03 7.52E-03 1.68E-02 1.70E-03 1.08E-02 8.57E-03 8.96E-02
SOFFBANNATURAL
9.93E-02 2.37E-02 7.67E-02 5.38E-02 7.19E-02 1.90E-02 1.42E-02 4.57E-02 4.1 IE-01

164 Chapter 5
Table 5. 8 Measured liquid absorption (m2*P(T)) in the fabrics in different directions
Angle(Degrees)
0 °
(MD)45° O
o 135°
OO00 225° 270° 315°
PA2N1 6.05E-09 4.96E-09 8.14E-09 9.99E-09 6.41E-09 4.80E-09 3.16E-09 8.28E-09
PA2N2 1.27E-08 1.16E-08 7.35E-09 1.23E-08 1.72E-08 1.52E-08 1.08E-08 1.29E-08
PA1N1 9.01E-09 7.49E-10 2.72E-10 7.96E-09 2.37E-08 1.22E-08 2.84E-09 1.03E-08
PA1N2 3.43E-08 4.69E-08 1.59E-08 3.13E-08 4.80E-08 4.88E-08 1.32E-08 1.17E-08
PB1N1 1.41E-08 6.95E-09 1.07E-08 1.27E-08 6.64E-09 4.04E-09 4.84E-09 3.17E-08
PB1N2 2.95E-08 2.28E-08 1.41E-08 9.59E-09 9.60E-09 2.19E-08 1.84E-08 2.44E-08
PB2N1 3.83E-08 4.29E-08 2.66E-08 4.22E-08 4.68E-08 3.78E-08 4.26E-08 3.33E-08
VA1N1 1.06E-08 1.59E-08 6.27E-09 9.50E-09 1.33E-08 1.54E-08 9.63E-09 8.02E-09
VA1N2 3.27E-08 2.40E-08 2.47E-08 2.56E-08 1.14E-08 1.65E-08 2.36E-08 3.60E-08
VA2N1 2.47E-08 1.42E-08 1.91E-08 2.16E-08 6.65E-09 1.67E-08 1.44E-08 2.39E-08
VA2N2 2.66E-08 3.15E-08 1.22E-08 2.75E-08 3.11E-08 2.61E-08 2.91E-08 2.72E-08
VB1N1 2.81E-08 3.02E-08 6.96E-09 7.17E-09 7.52E-09 1.58E-08 1.34E-08 1.09E-08
VB1N2 1.91E-08 8.83E-09 1.74E-09 4.60E-09 6.27E-09 1.24E-08 1.07E-08 1.21E-08
VB2N1_1 2.47E-08 1.14E-08 2.51E-08 2.31E-08 1.68E-08 1.85E-08 1.72E-08 1.73E-08
VB2N1_2 5.42E-09 4.14E-09 3.67E-09 5.47E-09 8.30E-09 6.30E-09 5.08E-09 4.85E-09
VB2N2 3.28E-08 1.20E-08 8.35E-09 1.49E-08 4.29E-08 2.39E-08 1.49E-08 2.55E-08
VB2N3 2.29E-08 3.07E-08 8.80E-09 1.64E-08 1.65E-08 1.23E-08 2.03E-08 1.83E-08
VA1VV 6.44E-08 9.08E-09 3.27E-09 1.07E-08 5.92E-08 1.79E-08 9.05E-10 3.14E-09
VA2H1 3.13E-07 5.58E-08 4.92E-08 1.93E-07 3.22E-07 9.59E-08 7.39E-08 9.54E-08
VB1VV1 9.02E-08 6.96E-09 3.62E-09 1.85E-08 9.79E-08 1.72E-08 9.54E-09 1.46E-08
VB2H2 2.95E-08 1.29E-08 5.79E-09 2.58E-08 1.08E-07 1.63E-08 2.89E-09 3.85E-09
SORBSAN 7.55E-08 9.85E-08 570E-08 6.47E-08 1.55E-07 1.58E-07 9.68E-08 7.46E-08
SOFFBANNATURAL
3.34E-07 7.09E-08 2.53E-07 1.73E-07 2.36E-07 5.60E-08 4.08E-08 1.45E-07
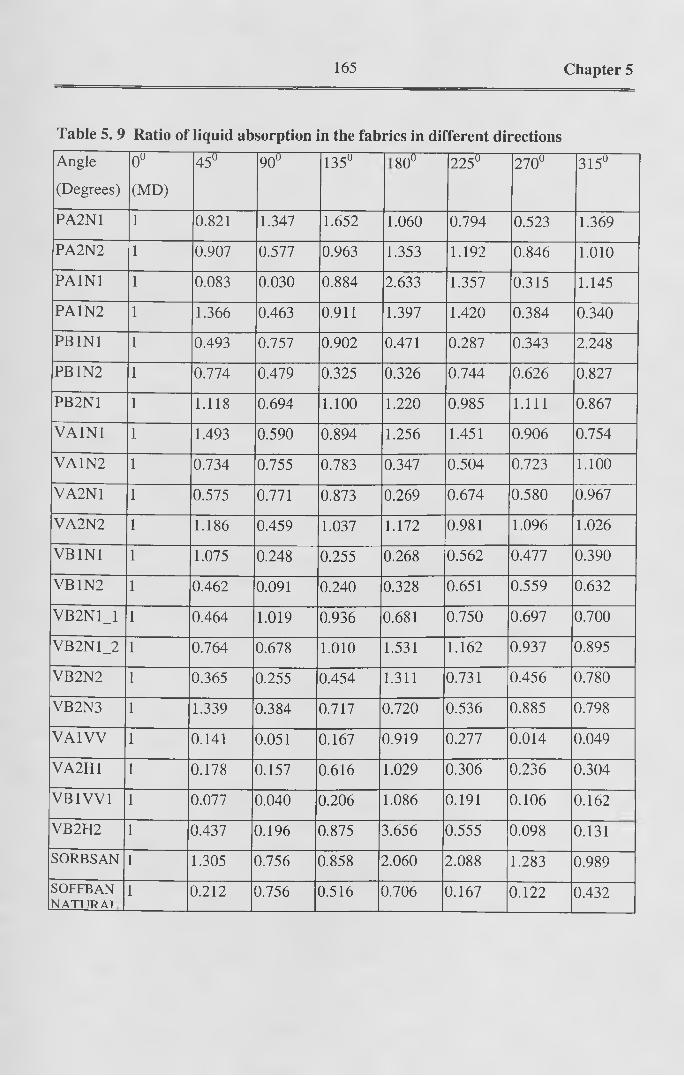
165 Chapter 5
Table 5. 9 Ratio of liquid absorption in the fabrics in different directions
Angle
(Degrees)
0°
(MD)
45° 90° 135° OO O O 225° 270° 315°
PA2N1 0.821 1.347 1.652 1.060 0.794 0.523 1.369
PA2N2 0.907 0.577 0.963 1.353 1.192 0.846 1.010
PA1N1 0.083 0.030 0.884 2.633 1.357 0.315 1.145
PA1N2 1.366 0.463 0.911 1.397 1.420 0.384 0.340
PB1N1 0.493 0.757 0.902 0.471 0.287 0.343 2.248
PB1N2 0.774 0.479 0.325 0.326 0.744 0.626 0.827
PB2N1 1.118 0.694 1.100 1.220 0.985 1.111 0.867
VA1N1 1.493 0.590 0.894 1.256 1.451 0.906 0.754
VA1N2 0.734 0.755 0.783 0.347 0.504 0.723 1.100
VA2N1 0.575 0.771 0.873 0.269 0.674 0.580 0.967
VA2N2 1.186 0.459 1.037 1.172 0.981 1.096 1.026
VB1N1 1.075 0.248 0.255 0.268 0.562 0.477 0.390
VB1N2 0.462 0.091 0.240 0.328 0.651 0.559 0.632
VB2N1_1 0.464 1.019 0.936 0.681 0.750 0.697 0.700
VB2N1_2 0.764 0.678 1.010 1.531 1.162 0.937 0.895
VB2N2 0.365 0.255 0.454 1.311 0.731 0.456 0.780
VB2N3 1.339 0.384 0.717 0.720 0.536 0.885 0.798
VA1VV 0.141 0.051 0.167 0.919 0.277 0.014 0.049
VA2H1 0.178 0.157 0.616 1.029 0.306 0.236 0.304
VB1VV1 0.077 0.040 0.206 1.086 0.191 0.106 0.162
VB2H2 0.437 0.196 0.875 3.656 0.555 0.098 0.131
SORBSAN 1.305 0.756 0.858 2.060 2.088 1.283 0.989
SOFFBAN NAT! IRAT
1 0.212 0.756 0.516 0.706 0.167 0.122 0.432
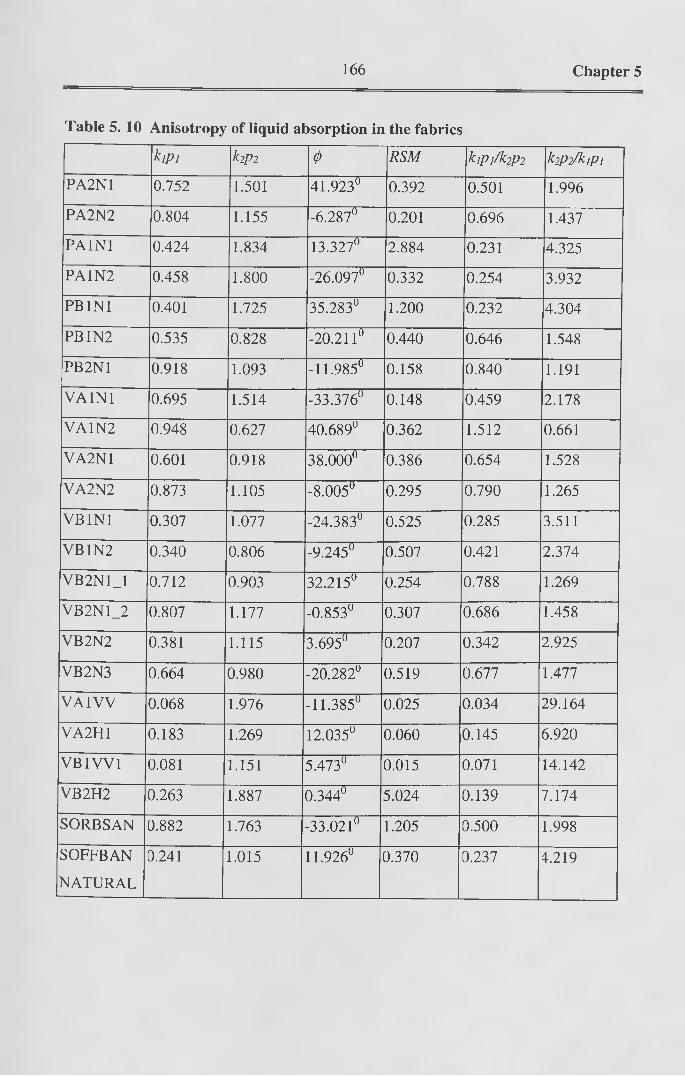
166 Chapter 5
Table 5. 10 Anisotropy of liquid absorption in the fabrics
k,pi k2p 2 0 RSM k,pi/k2p 2 k2p 2/kIpi
PA2N1 0.752 1.501 41.923° 0.392 0.501 1.996
PA2N2 0.804 1.155 -6.287° 0.201 0.696 1.437
PA1N1 0.424 1.834 13.327° 2.884 0.231 4.325
PA1N2 0.458 1.800 -26.097° 0.332 0.254 3.932
PB1N1 0.401 1.725 35.283° 1.200 0.232 4.304
PB1N2 0.535 0.828 -20.211° 0.440 0.646 1.548
PB2N1 0.918 1.093 -11.985° 0.158 0.840 1.191
VA1N1 0.695 1.514 -33.376° 0.148 0.459 2.178
VA1N2 0.948 0.627 40.689° 0.362 1.512 0.661
VA2N1 0.601 0.918 38.000° 0.386 0.654 1.528
VA2N2 0.873 1.105 -8.005° 0.295 0.790 1.265
VB1N1 0.307 1.077 -24.383° 0.525 0.285 3.511
VB1N2 0.340 0.806 -9.245° 0.507 0.421 2.374
VB2N1_1 0.712 0.903 32.215° 0.254 0.788 1.269
VB2N1_2 0.807 1.177 -0.853° 0.307 0.686 1.458
VB2N2 0.381 1.115 3.695° 0.207 0.342 2.925
VB2N3 0.664 0.980 -20.282° 0.519 0.677 1.477
VA1VV 0.068 1.976 -11.385° 0.025 0.034 29.164
VA2H1 0.183 1.269 12.035° 0.060 0.145 6.920
VB1VV1 0.081 1.151 5.473° 0.015 0.071 14.142
VB2H2 0.263 1.887 0.344° 5.024 0.139 7.174
SORBSAN 0.882 1.763 -33.021° 1.205 0.500 1.998
SOFFBAN
NATURAL
0.241 1.015 11.926° 0.370 0.237 4.219

167 Chapter 5
Table 5.11 Calculated ratio of liquid absorption from k ip i, k2p2 and (p in different directions
Angle
(Degrees)
¥ ~
(MD)
45° 90° 135° 180° 225° 270° 315°
PA2N1 1.039 0.753 0.968 1.497 1.039 0.753 0.968 1.497
PA2N2 1.149 0.986 0.807 0.912 1.149 0.986 0.807 0.912
PA1N1 1.559 0.538 0.442 0.957 1.559 0.538 0.442 0.957
PA1N2 1.148 1.376 0.535 0.497 1.148 1.376 0.535 0.497
PB1N1 0.820 0.410 0.539 1.576 0.820 0.410 0.539 1.576
PB1N2 0.777 0.755 0.559 0.570 0.777 0.755 0.559 0.570
PB2N1 1.084 1.034 0.924 0.964 1.084 1.034 0.924 0.964
VA1N1 1.116 1.445 0.831 0.711 1.116 1.445 0.831 0.711
VA1N2 0.778 0.628 0.732 0.945 0.778 0.628 0.732 0.945
VA2N1 0.765 0.604 0.691 0.911 0.765 0.604 0.691 0.911
VA2N2 1.100 1.008 0.877 0.945 1.100 1.008 0.877 0.945
VB1N1 0.754 0.821 0.349 0.337 0.754 0.821 0.349 0.337
VB1N2 0.778 0.549 0.345 0.423 0.778 0.549 0.345 0.423
VB2N1_1 0.839 0.719 0.757 0.891 0.839 0.719 0.757 0.891
VB2N1_2 1.177 0.963 0.807 0.952 1.177 0.963 0.807 0.952
VB2N2 1.106 0.534 0.382 0.606 1.106 0.534 0.382 0.606
VB2N3 0.927 0.905 0.691 0.704 0.927 0.905 0.691 0.704
VA1VV 0.971 0.202 0.070 0.097 0.971 0.202 0.070 0.097
VA2H1 1.010 0.246 0.191 0.461 1.010 0.246 0.191 0.461
VB1VV1 1.029 0.131 0.082 0.182 1.029 0.131 0.082 0.182
VB2H2 1.887 0.458 0.263 0.466 1.887 0.458 0.263 0.466
SORBSAN 1.360 1.690 1.036 0.902 1.360 1.690 1.036 0.902
SOFFBANNATTJRAT.
0.892 0.311 0.249 0.518 0.892 0.311 0.249 0.518

168 Chapter 5
5.4 OBSERVATIONS ON THE INFLUENCE OF FABRIC STRUCTURAL
PARAMETERS ON THE ANISOTROPY OF LIQUID TRANSPORT
The anisotropy of liquid transport here refers to the anisotropy of permeability and the
anisotropy of liquid absorption. The fabric structural parameters discussed are the fibre
orientation distribution, fibre diameter and the fabric porosity.
5.4.1 The Influence of Nonwoven Fabric Structure on the Anisotropy of
Permeability
5.4.1.1 Effect of the Fibre Orientation Distribution
The fibre orientation distribution will influence the anisotropy of the nonwoven fabric
structure90, and thus it may be expected to influence the anisotropy of permeability. It
was shown in Chapter 4 that parallel-laid and cross-laid webs have different fibre
orientation distributions, and parallel-laid webs have a predominant fibre orientation in
the machine direction. From Figures 4.4 to 4.7, it is apparent that the structural
anisotropy of the fabrics made from parallel-laid webs was higher than the fabrics made
from cross-laid webs.
Additionally, it is apparent from Figure 5.1 that the anisotropy of permeability in
structures (unbonded webs, needlepunched and hydroentangled structures) made from
such parallel-laid webs is generally higher than in fabrics made from cross-laid webs.
It is also evident in Table 5.2 that the direction of the maximum liquid flow rate in a
cross-laid webs differs by around 90 degrees from that in a parallel-laid web. This may
be expected because of the respective fibre orientation distributions (see Figures
4.4-4.7).

169 Chapter 5
Figure 5. 1 Influence of fibre fineness on the anisotropy of permeability
Parallel-laid Cross-laid
Web type
aoi—
■5i/>c<
54.5
43.5 +
32.5
21.5
10.5
0
O PP, Df=1.7dtex □ PP. Df=3.3dtex
------
Parallel-laid Cross-laid
W eb type
(a) Unbonded webs
■ Viscose, Df=t7dtex
Parallel-laid Cross-laid
Web type
a.oo<n'c<
54.5
43.5
32.5
21.5
10.5
0
■ PP,Df=17dtex □ PP,Of=3.3dtex
Parallel-laid Cross-laid
Web type
(b) Hydroentangled fabrics
5
4.5
43.5
3 H
O Viscose. Df=t7dtx ■ Viscose, Df=3.3dtex
o 2 .5 --------------------------------------
1 — b ' J
°,5 —0 - — — 1 —.HHBBL—... ,, ..... J
Parallel-laid Cross-laidWeb type
Parallel-laid Cross-laidW eb type
(c) Needlepunched fabrics

170 Chapter 5
5.4.1.2 Effect of Bonding Method
The bonding method influences the local variations in the fabric structure, and for this
reason it is considered in this section.
5.4.1.2.1 Unbonded Webs
For the unbonded webs, it is evident from Figure 5.1(a) that the anisotropy of
permeability of the parallel-laid webs was greater than the anisotropy of permeability in
the cross-laid webs. It was also noted that the direction of the maximum permeability in
the parallel-laid webs differed by about 45~90 degrees from the direction of maximum
permeability in the cross-laid structures.
5.4.1.2.2 Needlepunched Nonwovens
All the needlepunched fabrics were made from the webs referred to section (4.3). From
Figure 5.1, it is apparent that the anisotropy of permeability in the needlepunched
fabrics was greater than the anisotropy of permeability of their original webs.
It is interesting to note that the maximum permeability in all the needlepunched fabrics
was in the machine direction, irrespective of the original method of web formation
(cross-laid or parallel-laid).
This is thought to be due to the presence of the needle marks in the machine direction of
the fabric which appear to act as conduits for liquid transport. Further, it is known that
many fibres in the pillars are aligned perpendicular to the fabric plane, and that fibres
aligned in the cross direction are also reoriented in the machine direction during the
process. Thus, needle marks may interrupt liquid flow in the cross direction when liquid
is transporting through the fabric.

171 Chapter 5
5.4.1.2.3 Hydroentangled Nonwovens
Similar to the needlepunched fabrics, it is apparent from Figure 5.1 that the anisotropy
of permeability in the hydroentangled fabrics was up to ten times greater than the
anisotropy of permeability in the original webs. In this study, the highest anisotropy of
permeability was found in the hydroentangled fabrics.
It is also noteworthy that the maximum permeability in the hydroentangled fabrics,
(similar to needlepunched nonwovens), was always in the machine direction, even for
fabrics made from cross-laid webs. This is believed to be due to changes in local fabric
structure induced by the process, particularly the formation of jet marks, which are
believed to conduits for liquid to travel.
It is apparent that the anisotropy of permeability in the hydroentangled fabrics made
from polypropylene fibre were not as high as the corresponding needlepunched fabrics.
It will be recalled from section 4.5.3 in Chapter 4 that the fibres inside the
polypropylene hydroentangled fabric were poorly entangled and only fibres in the
surface of the fabric were effectively bonded (see Figure 4.13). Therefore, the
magnitude of the anisotropy of permeability in the hydroentangled polypropylene fabric
is similar to that of its original web.
Also, for hydroentangled fabrics made from identical parallel-laid webs of
polypropylene fibres but bonded with fibres oriented predominantly in the machine
direction (MD) and cross direction (CD) respectively, it is interesting to note that the
anisotropy of permeability in the fabric bonded in the direction perpendicular to the
fibre orientation (fabric PA1PP1) is much greater than that in the fabric bonded in the

172 Chapter 5
direction parallel to the fibre orientation (fabric PA1VV1). This corresponds to their
structural characteristics (see section 4.5.3).
For hydroentangled fabrics of viscose fibres, it is evident that the maximum
permeability was in the machine direction and that the anisotropy of permeability of this
group of fabrics was up to ten times greater than that of the original webs.
5.4.1.3 Effect of Fibre Type and Fibre Fineness on the Anisotropy of Permeability
The effect of fibre fineness together with the fibre type (polypropylene and viscose
fibre) on the anisotropy of permeability is shown in Figures 5.2-5.3.
It is known that permeability is not directly related to the fibre type and fibre surface
170properties , and that theoretically, fibre diameter can only determine the permeability
and not affect the anisotropy of permeability266. However, it is evident that there is a
difference in the fibre orientation distribution (FOD) of the fabrics made from different
fibre types and different fibre finenesses (see section 4.4.6 .5). The reason for this is
unclear, but fibre surface properties and physical properties (such as fibre diameter) may
be expected to markedly influence web formation and bonding in the process of
nonwoven manufacture258. This may influence fabric structure, (e.g., the effect of
polypropylene in hydroentangled fabrics, see section 4.5.3). In particular, fibre type and
fibre fineness will influence the ratio of hooked fibres and the fibre orientation
distribution in a carded web258 (see section 4.5), subsequently this will influence the
fibre orientation distribution in the unbonded webs and thus influence the anisotropy of
liquid transmission in the corresponding nonwoven fabrics.
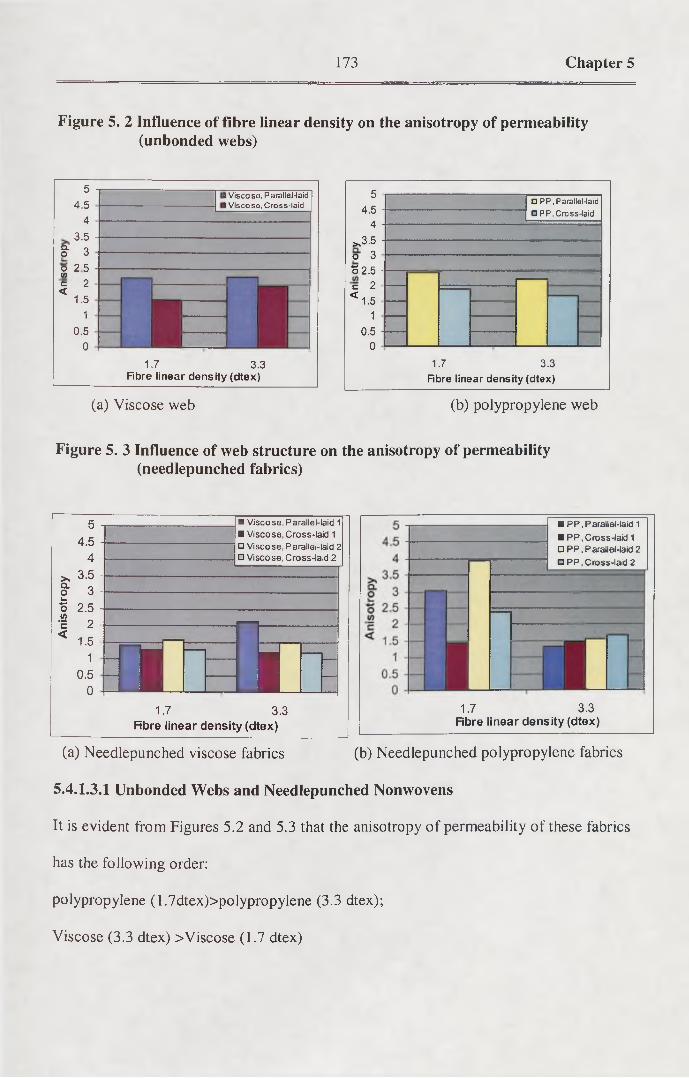
173 Chapter 5
Figure 5. 2 Influence of fibre linear density on the anisotropy of permeability (unbonded webs)
54.5
43.5
a.0 30 ? 5l/>r. ?<
1.61
0.50
3 Viscose, Parallel-laid I Viscose, Cross-laid
1.7 3.3Fibre linear density (dtex)
(a) Viscose web
54.5
4>.3.5 o 3 3 2.5 • c 2 < 1 .5
10.5 -I
0
-----
□ PP, Parallel-laid□ PP, Cross-laid
------
-----------------
———-—
1.7 3.3Fibre linear density (dtex)
(b) polypropylene web
Figure 5. 3 Influence of web structure on the anisotropy of permeability (needlepunched fabrics)
>,aoL*-•ow'E<
54.5
4 -3.5 -
3 -2.5
21.5
10.5
0
H Viscose, Parallel-laid 1 ■ Viscose, Cross-laid 1□ Viscose, Parallel-laid 2□ Viscose, Cross-laid 2
mm1.7 3.3
Fibre linear density (dtex)
■ PP, Parallel-laid 1■ PP,Cross-laid 1□ PP. Parallel-laid 2□ PP, Cross-laid 2
1.7 3.3Fibre linear density (dtex)
(a) Needlepunched viscose fabrics (b) Needlepunched polypropylene fabrics
5.4.1.3.1 Unbonded Webs and Needlepunched Nonwovens
It is evident from Figures 5.2 and 5.3 that the anisotropy of permeability of these fabrics
has the following order:
polypropylene (1.7dtex)>polypropylene (3.3 dtex);
Viscose (3.3 dtex) >Viscose (1.7 dtex)

174 Chapter 5
It should be noted that the direction of the maximum permeability in both the parallel-
laid and cross-laid unbonded webs corresponds to the maximum fibre orientation in the
webs respectively. However, due to needle marking in the machine direction, the
maximum permeability in needlepunched fabrics, (unlike that of their original webs),
are all in the machine direction, even for fabrics made from cross-laid webs.
5.4.1.3.2 Hydroentangled Nonwovens
The anisotropy of permeabilities of the hydroentangled nonwovens composed of either
polypropylene or viscose fibre followed the same order as for the needlepunched fabrics
irrespective of the method of web formation (see Figure 5.4):-
polypropylene (1.7dtex)>polypropylene (3.3 dtex);
Viscose (3.3 dtex) >Viscose (1.7 dtex)
Figure 5. 4 Influence of web structure on the anisotropy of permeability
(hydroentangled fabrics)
■ Viscose, Parallel-laid (PP) O Viscose, Parallel-laid (VV) O Visco se, Cro ss-laid
1.7 3.3Rbre linear density (dtex)
(a) Hydroentangled viscose fabrics (b) Hydroentangled polypropylene fabrics
Also, the maximum permeability in the hydroentangled fabrics was in the machine
direction. This is believed to be due to jet marking on the surface of the fabric running in
the machine direction.

175 Chapter 5
5.4.1.4 Effect of Fabric Porosity on the Anisotropy of Permeability
It is acknowledged by many researchers106, 111 that the fabric porosity influences the
permeability of porous media. Although it has been shown that the porosity of
unidirectional fibrous structures influences the permeability in the direction of fibre
orientation and the permeability perpendicular to the fibre orientation in two different
ways, there are no existing studies on how porosity influences the anisotropy of
permeability in nonwoven structures.
Figure 5.5 shows that the anisotropy of permeability in most non woven structures
increases with increases in the fabric porosity. There are two possible reasons for this.
Firstly, we know that the overall permeability of the fabric decreases with a decrease in
the fabric porosity. With a decrease in fabric porosity, the decrease in one principle
permeability may be larger than the decrease of the other principle permeability.
Secondly, since in this study the decrease in the fabric porosity was achieved by
compression of the fabric, some realignment of fibres in the fabric can not be ruled out.
Since the porosity of all the fabrics used in this study was over 96%, it is not clear
whether this conclusion will hold for lower fabric porosities.

176 Chapter 5
Figure 5. 5 Influence of fabric compression on the anisotropy of permeability
>.Q.O*->o(AC<
54.5
43.5
32.5
21.5
10.5
0
HPP,Df=17dtex ■ PP, Df=3.3dtex
1
Original fabrics Com pressed fabrics
(a) Hydroentangled polypropylene fabrics
Original fabrics Com pressed fabrics Original fabrics Compressed fabrics
(b) Needlepunched viscose fabrics (c) Needlepunched polypropylene fabrics
5.4.2 The Influence of Fabric Structural Parameters on the Anisotropy of Liquid
Absorption
The results for the anisotropy of liquid absorption are shown in Tables 5.6 to 5.10. From
the definition of the anisotropy of liquid absorption, it is apparent that it has two
components, that is, the anisotropy of permeability and the anisotropy of capillary

177 Chapter 5
pressure. Therefore, the factors influencing the anisotropy of permeability in a fabric
will at the same time influence the anisotropy of liquid absorption.
From the experimental results shown in Figures 5.6 to 5.9, it is clear that there are
differences in the anisotropy of liquid absorption between fabrics with different
structural parameters (such as fibre fineness and fabric porosity). Theoretically, the
effect of changing the bonding method and the fibre fineness on the anisotropy of
absorption and the anisotropy of the permeability is similar.
However, there are differences between the anisotropy of permeability and the
anisotropy of absorption.
5.4.2.1 The Anisotropy of Liquid Absorption and the Anisotropy of Permeability
Comparisons of the anisotropy of liquid absorption and the anisotropy of permeability
are shown in Figure 5.6.
It is apparent in Figure 5.6 that the anisotropy of liquid absorption is always greater than
the anisotropy of permeability for all the fabric samples. This is because the anisotropy
of liquid absorption is the product of the anisotropy of permeability and the anisotropy
of capillary pressure (see equation 5.1.2), and the anisotropy of capillary pressure is also
determined by the fibre orientation and other fabric structural parameters265.

178 Chapter 5
Figure 5. 6 Comparison of the anisotropy of liquid absorption (capillary flow) and the anisotropy of permeability (forced flow)
Forced flow Capillaryabsorption Row type
Df=17dtex, Parallel-laid Df=17dtex, Cross-laid Df=3.3dtex, Parallel-laid
-3.3dtex. (
Forced flow Capillaryabsorption
Row type
(a) Hydroentangled viscose fabrics (b) Needlepunched viscose fabrics
Q.Ou.■*->O</>c<
! P P )Df=1.7dtex,Parallel-laid 0 PP,Df=1.7dtex,Cross-laid□ PP, D f=3.3dt ex, Parallel-laid |□ PP,Df=3.3dtex, Cross-laid
Forced flow Capillaryabsorption
Row type
(c) Needlepunched polypropylene fabrics
5A.2.2 The Effect of Fibre Type and Fibre Fineness on the Anisotropy of Liquid
Absorption
As the effect of fibre type and fibre fineness on the anisotropy of permeability (shown in
section 5.3.1.3), it is evident in Figures 5 .7 -5 .8 that the anisotropy of liquid absorption
also varies with fibre type and fibre fineness.

179 Chapter 5
Figure 5. 7 Influence of fibre fineness on the anisotropy of liquid absorption
50 45 -| 40 35 -I
5 25I 20
I Viscose, Df=1.7dtex I Viscose, Df=3.3 dtex
Parallel-laid Cross-laidW eb type
H PP,Df=t7dtex ■ PP, Df=3.3dtex□ Viscose, Df=17 dtex□ Viscose, Df=3.3dtex
Parallel-laid Cross-laidW eb type
(a) Hydroentangled viscose fabrics (b) Needlepunched fabrics
Figure 5. 8 Influence of web structure on the anisotropy of liquid absorption
l Viscose,Parallel-laid I Viscose, Cross-laid
1.7 3.3Fibre linea r d e n s ity (d tex)
H PP,Parallel-laid ■ PP, Cross-laid□ Visco se, P arallel-laid□ Viscose, Cross-laid
1.7 3.3Fibre linear density (dtex)
(a) Hydroentangled viscose fabrics (b). Needlepunched fabrics
The liquid absorption is known to be dominated by capillary pressure in porous
materials, and according to the Laplace equations129. The capillary pressure is
determined by the capillary tube diameter, the surface tension of the liquid and the

180 Chapter 5
contact angle between the interfaces. Therefore, the fibre type and fibre finish will
influence the absorption rate of the fabric. However, the anisotropy of liquid absorption
in the fabric plane should not be influenced by the fibre finish on the fibre surface and
the fibre fineness as long as the fabric is homogeneous and the surface finish on all the
fibres in the fabric is the same.
5.4.2.3 The Effect of Porosity on the Anisotropy of Liquid Absorption
In contrast to the effect of porosity on the anisotropy of permeability, it is evident from
Figure 5.9 that the lower the porosity, the higher the anisotropy of liquid absorption.
The reason for this finding is not clear, but it seems that the anisotropy of the capillary
pressure in nonwoven fabrics increases with a decrease in the fabric porosity265.
Figure 5. 9 Influence of fabric compression on the anisotropy of liquid absorption
□ P P , Df=17dtex, Parallel-laid . □ PP,Df=3.3, Cross-laid ■ Viscose, Df=17dtex, Cross-laid
■ □ Viscose, Df=3.3dtex, Cross-laid
■ PP , Df=1.7dtex, Cross-laid□ Viscose, Df=17dtex, Parallel-laid□ Viscose, Df=3.3dtex, Parallel-laid
Original fabrics Compressed fabricsPorosity

181 Chapter 5
5.4.3 Comparison of the Anisotropy of Liquid Transport in the Experimental and
Commercial Fabrics
Results for the anisotropy of permeability and the anisotropy of liquid absorption in the
experimental and commercial wound dressing fabrics are shown in Figures 5.10 and
5.11 respectively. Of the commercial wound dressing fabrics, Sorbsan is a compressed
but unbonded fibrous structure composed of a calcium alginate fibre, whereas Soffban
Natural is composed of cellulosic fibre and the Lantor dressing is composed of polyester
fibre. Both are believed to be needlepunched fabrics.
From Figures 5.10 and 5.11, it is apparent that either the anisotropy of permeability or
the anisotropy of liquid absorption in the experimental and commercial fabrics are in a
similar range.
Figure 5.10 Comparison of the anisotropy of permeability in the experimental fabrics and typical commercial nonwoven wound dressing fabrics
5
4-* 4.5
5(0
4
a>E
3.6
8L3
o 2.5>.Q.O
2L.o</>c
1.5
1< 0.5
0PA 1 WEB PB1WEB VA1WEB VB1WEB SORBSAN
Unbonded fabrics
(a) Unbonded fabrics
CLOTHWORKERS LIBRARY UNIVERSITY OF LEEDS

182
c;
4 .5A4̂
nCOQ)E
3 .5S _0
Q.»♦—O o>*a
1.5 1 -
n ^
o.S2c<
0PA1N1 PA2N1 PB1N1 PB2N1 LANTOR
N eedled fabrics
(b) Needlepunched fabrics composed of synthetic fibres
—i
VA1N1 VA2N1 VB1N1 VB2N1 SOFFBANNATURAL
Needled fabrics
4.5 >. 4 •=w 3.5 0)E 3 S.•5 2.5 >& 2o 1 5'c < 1
0.5n
Chapter 5
(c) Needlepunched fabrics composed of viscose fibres

183 Chapter 5
Figure 5.11 Comparison of the anisotropy of liquid absorption in the experimental fabrics and typical commercial nonwoven wound dressing fabrics
R .......... -
4.5
4co% 3.5o</>■8 3■gct 2.5
H—
° 2CLobo 1 5wE< 1
0.5
0PA1N1 PA2N1 PB1N1 PB2N1 VA1N1 VA2N1 VB1N1 VB2N1 SOFFBAN SORBSAN
NATURALFabrics
The anisotropy of permeability and the anisotropy of liquid absorption in the unbonded
web and needlepunched commercial fabrics are shown in Figure 5.12. It is clear that the
needlepunched fabrics (i.e., Soffban Natural and Lantor) have a higher anisotropy of
both permeability and liquid absorption compaered to the unbonded dressing (i.e.
Sorbsan). This finding is in agreement with the conclusions obtained for the
experimental fabrics.

184 Chapter 5
Figure 5. 12 Anisotropy of permeability and the anisotropy of liquid absorption in unbonded and needlepunched fabrics in typical commercial nonwoven wound dressing fabrics
5
n4.5
TOCD
4
Ei-
3.5
& 3**—o 2.5> .cl
2oi— 1.5o0) 1c 0.5< 0
SORBSAN SOFFBAN NATURAL
Commercial fabrics
LANTOR
2'dO-= c OO >* 2-e l.n o ro </>'c<
54.5
43.5
32.5
21.5
10.5
0SORBSAN SOFFBAN
NATURAL Commercial fabrics
(a) Anisotropy of permeability (b) Anisotropy of liquid absorption

185 Chapter 6
CHAPTER 6 THEORETICAL ANALYSIS OF THE DIRECTIONAL
PERMEABILITY IN HOMOGENEOUS
NONWOVEN STRUCTURES
In order to understand the effect of fabric structural parameters on the anisotropy of
liquid transport in the fabric, it is now possible to establish a theoretical model of the
anisotropic permeability in nonwoven fabric structures based on the findings in Chapter
5.
This chapter aims to establish the relationship between fibre orientation and the
directional permeability of homogeneous nonwoven fabrics using a modified drag force
theory. In this approach, fabric structural parameters, such as fibre diameter, the fibre
orientation distribution and porosity are all considered and new models of permeability
for two- and three-dimensional structures are presented. A basic model of permeability in
fibrous structures is presented based on drag force theory, and the application of this
model to structures having different fibre arrangements is also investigated.
6.1 RELATIONSHIP BETWEEN DIRECTIONAL PERMEABILITY AND FIBRE
ORIENTATION
It has been shown that the permeability of isotropic, homogeneous, porous fibrous
structures is dependent on fabric structural parameters, such as fibre diameter and fabric
porosity106, m . It has also been pointed out that unidirectional fibrous materials have
different permeabilities in two principle directions and this is influenced by fabric
structure107,109, n1,114. The directional permeability of porous materials is dependent on
the anisotropy of the intrinsic structure170, which is influenced by the fibre orientation

186 Chapter 6
distribution266. However, no analysis has been previously presented that shows the
relationship between the directional permeability of nonwoven fabrics and the structure
of such fabrics.
In this chapter, a new general model of the directional permeability in homogenous,
anisotropic nonwoven structures is presented based on drag force theory and Darcy’s
Law266, 267. Structural parameters in the fabric are considered, including fibre diameter,
porosity and the fibre orientation distribution. The governing equations of the local
permeability in two- and three-dimensional structures are derived, which allow the
permeability in any direction in the fabric to be calculated.
In this chapter, the permeability in idealised structures is also discussed and the
application of a newly derived model of directional permeability is described for a range
of specific fibre orientation profiles.
6.2 BACKGROUND CONSIDERATIONS
Directional permeability in fabrics is believed to be important in determining the
performance of many nonwoven structures used in medicine and hygiene. The
established theory of laminar fluid flow through homogeneous porous materials such as
nonwovens is based on Darcy’s Law104, which can be written as follows:

187 Chapter 6
Where Q is the volumetric flow rate of the fluid flow, 77 is the viscosity of the fluid, Ap is
the pressure drop along the conduit length of the fluid flow L, and k is the specific
permeability of the porous material.
In Darcy’s Law, the permeability is governed by the effects of certain structural features
on the liquid flow. For isotropic materials, the permeability will be the same throughout
the entire structure but in an anisotropic one, it will vary from region to region. The
268permeability in fibrous structures is believed to be closely related to fibre orientation
which is believed to influence the structural anisotropy of nonwoven fabrics.
6.3 TH EO RETIC A L BACKGROUND
Many theoretical and empirical models of the permeability in fibrous materials have been
published. The existing theoretical models of permeability can be grouped into two main
categories based on:
(i) Capillary channel theory, e.g., Kozeny105, Carman106, Davies112, Piekaar and
Clarenburg269, Dent270 and Shen118 and
(ii) Drag force theory, e.g., Emersleben107, Brinkman108, Iberall110, Happel111,
Kuwabara113, Cox271, and Sangani and Acrivos272.
Most of the permeability models established for textile fabrics are based on capillary
theory. However, it has been argued that models based on capillary theory are unsuitable
for highly porous media where the porosity is greater than 0.8 (see for example,
Carman106).

188 Chapter 6
Thus, drag force theory is believed to be more applicable to highly porous materials
containing fibres, such as nonwoven fabrics, where the single fibres can be regarded as
elements within the fluid that can not be displaced (see Scheidegger170).
In drag force theory, the walls of the pores in the structure are treated as obstacles to an
otherwise straight flow of the fluid. The drag of the fluid acting on each portion of the
wall is estimated from the Navier-Stokes equations, and the sum of all the ‘drags’ is
assumed to be equal to the total resistance to flow in the porous material, (i.e. equal to
r j lk , according to Darcy’s law in equation 6.2.1). However, none of the existing theories
has been developed specifically to model directional permeability in nonwoven fabrics.
6.3.1 Drag Force Theory in Isotropic Fibrous Materials
Iberall110 adopted the drag force models obtained by Emersleben107 and Lamb114 and
established a model of permeability for a material having a random distribution of
cylindrical fibres of circular cross section and identical fibre diameter. The model
accounted for the permeability on the basis of the drag forces acting on individual
elements in the structure. It was assumed that the flow resistivity of all random
distributions of fibres per unit volume does not differ. The resistivity was obtained by
assuming the fabric has an isotropic structure in which the number of fibres in each axis
is equal and one of the axes is along the direction of macroscopic flow.
6.3.2 Drag Force Theory in Unidirectional Fibrous Materials
Happel111, Kuwabara113, Sparrow and Loeffler273 and Drummond and Tahir274 have given
detailed analyses of the permeability in unidirectional fibrous materials. They obtained
the permeability using a so-called ‘unit cell’ theory, or ‘free surface’ theory, in which the

189 Chapter 6
fibres are assumed to be arranged in a periodic pattern such as a square or triangular
array. For each array it is possible to define a ‘unit cell’, i.e. a polygon with a rod at the
centre, such that the flow in the cell is the same as in the array. The permeability of
unidirectional fibrous materials can then be solved using the Navier-Stokes equation in
the unit cell with appropriate boundary conditions. Happel111 also compared his
theoretical results with some experimental data produced by other researchers and
showed their agreement was good when the fabric porosity is greater than 0.5. Sullivan
and Davies112 have also completed a considerable body of experimental work in this area.
Unlike capillary flow theory, drag force theory and unit cell theory demonstrate the
relationship between permeability and the internal structural architecture of the material.
However, previous approaches can not be applied to normal anisotropic materials, such
as nonwoven fabrics, because the existing models of drag force theory are based on the
assumption that fibres are oriented either in homogenous-isotropic or in specific
unidirectional alignments. In contrast, the approach presented here is designed to
demonstrate a more generally applicable relationship between directional permeability
and the structure of the fabric.
6.4 DIRECTIONAL PERMEABILITY IN HOMOGENEOUS ANISOTROPIC
FIBROUS MATERIALS
6.4.1 Assumptions
The approach described here is specifically focused on the permeability of nonwovens
which usually have high porosity and anisotropic properties. Initially, in order to simplify
the problem, the fibres in the Z-direction are not considered in the model. Of course, in

190 Chapter 6
practice many nonwoven fabrics have fibres aligned in the Z-direction and later in this
chapter a directional permeability model for three-dimensional non woven fabric
structures is obtained by expansion of the two-dimensional model. In the new theory, the
following assumptions are made:
(i) The fibres constituting the fabric are of the same diameter and are distributed
horizontally in-plane and in two-dimensions. No fibres are aligned in the Z-direction.
(ii) The flow resistivity of the fibres per unit volume in the entire structure of the
fabric is equal, i.e. the fabric is homogeneous.
(iii) The number of fibres oriented in each direction is not the same, but obeys the
function of the fibre orientation d is tr ib u tio n ,^ ^ ), where a is the fibre orientation
angle. The drag forces acting in two orthogonal directions (one of which is along the
direction of macroscopic flow) are not the same.
(iv) The distance between fibres and the length of individual fibres is much larger than
the fibre diameter, i.e. the structure has high porosity. The disturbance of the flow due to
adjacent fibres is assumed to be negligible.
(v) The inertial forces of the fluid are negligible, i.e. the fluid has a low local
Reynolds number Re, and the pressure drop between planes perpendicular to the direction
of the macroscopic flow is equal to the drag force on all elements between the planes.
(vi) The pressure drop necessary to overcome the viscous drag is linearly additive for
the various fibres, whether they are arranged parallel, perpendicular or in any other
direction relative to the flow.

191 Chapter 6
6.4.2 Development of the Alternative Theory
In the new theory, the drag forces in each flow direction are obtained using Happel’s
equations for unidirectional fibre bundles (see Happel111). Happel’s first equation is the
permeability in the flow direction parallel to the fibre length and the second is the
permeability in the flow direction perpendicular to the fibre length. From these two
equations, the drag force per unit length acting on a single fibre surrounded by similar
fibres and all oriented along the direction of flow, f p , can be deduced:
f - %nrlQ (6.4.1)Jp s
where S = [2\x\e - A e + 3 + e 2] and e is the volume fraction of the solid material.
The drag force per unit length acting on a single fibre oriented perpendicular to the fluid
flow, f v, can be deduced from Happel’s equations as follows (Happel111):
f = 8^ Q (6.4.2)
Where 7- = [ln, + i=4]l + £
f p or J v are the pressure differences per unit length for the flow parallel to and
perpendicular to the fibre length respectively. The subscripts p and v represents the flow
parallel and perpendicular to the fibres respectively; r] is the internal viscosity of the
fluid, and Q is the superficial flow velocity of the fluid stream in the porous material.
Further, if Pf is the porosity, then the volume fraction of the solid material £ is given by

192 Chapter 6
It is then assumed that there are n fibres of a unit length in a unit volume of the fabric and
that the dimensionless distribution probability function of the fibre orientation Q(CX) has
the following form (see Mandel276 and Krcma94):
71
I nQ.(a)da = n (6.4.3)0
where n is a constant for homogenous materials.
Figure 6.1 Representation of drag theory for fibrous materials in a polar coordinate system
The drag force arising from the fluid flow acting on a single fibre aligned in any
orientation in the fabric can be obtained by consideration of Figure 6.1. A fibre of a
particular unit length is aligned in the direction a and the fluid flow over the fibre is in
the direction Q . Thus, the drag force of the fluid flow acting on the fibre can be deduced
according to equation (6.4.1) and equation (6.4.2). The drag force acting on the fibre in
the direction 6 which is the direction of the flow, / ( # ) , can be derived as given in
equation (6.4.4) as follows (also see Appendix II):
^ m

193 Chapter 6
f t e \ _ ^ V Q c o ^ { 6 - a ) | %nrjQs in 2 ( f l - o r ) (6 4 4 )S T
It is also suggested that when the ratio of fibre length to fibre diameter is sufficiently
large, the total drag force (of a directional flow) on the material (composed of n fibres) is
equal to the sum of the individual drag forces acting on each fibre (see Happel111).
Therefore, for a flow in a particular direction 6 , the drag force acting on all the fibres
(due to a unit volume of the fabric consisting of n fibres), / (9 ) will be:
71
f'(Jd) = n j Q ( a ) f ( 0 ) d a (6.4.5)o
The pressure gradient in the flow direction due to the drag force in a unit volume of the
fabric, , is equal to the pressure drop per unit length of flow resulting from the drag L
force in this direction. Therefore:
^ - = f \ 0 ) = n ] a ( a ) f ( 0 ) d a 0
= £2(apf cos2 \da(6.4.6)
cos 1( Q - a ) sin l ( 0 - a )
The number of fibres per unit volume, n, is equal to the total fibre length per unit volume,
4 oand therefore may be substituted by n = ——̂ 6 in equation (6.4.6), where O is the fibre
no
diameter and £ is the volume fraction of the solid material (defined as £ = — , wherePf
Pp is the density of a fibrous pack in a vacuum and P f is the fibre density). Thus, by

194 Chapter 6
substituting equation (6.4.6) into Darcy’s law in equation (6.2.1), the directional
permeability k(@) can be obtained as follows:
W ) = ~ — 32 £
ST
J Q .(a)\r cos2 {0 - a ) + S sin2 (0 - a ) \ l a(6.4.7)
Further, if Q id) can be expressed as a finite series, equation (6.4.7) can be rewritten as
follows:
k(0) = —32 £
ST
^ Q ( a ) [ r c o s 2(6 - a ) + S sin2(6 -a ) \^ .aa=0
(6.4.8)
Furthermore, equation 6.3.7 can be rewritten as follows:
1 1 1k (d ) kox kQY
(6.4.9)
where the two components kox and k0Y can be obtained from equation (6.4.7) as
follows:
Kx=-1
32 e n\Qia)zoi{0~a)da0
Ky=-1 S2
32 e njQ(a)sirr (d-a)da0
(6.4.10)
Therefore, a new relationship between directional permeability and the fibre orientation
distribution is now established in equation (6.4.7) and (6.4.8). Both equations may be
considered as special versions of Ferrandon’s equation relating specifically to fibrous

195 Chapter 6
structures. One possible limitation of these equations should be noted. Both equations
(6.4.7) and (6.4.8) are based on equations (6.4.1) and (6.4.2) which are derived from
Happel’s equations (see Happel111). It is important to note that Happel’s equations are
based on the assumption that fibres in unidirectional fibre bundles are aligned in square
arrays (see Figure 6.2(b)), and of course this may not always be representative of the true
structure of a nonwoven fabric. Consequently, the directional permeability equations may
in practice, be of limited application when the fibre alignment differs from a square array
and for this reason, the present model requires further modification. These refinements to
the model are now discussed.
272 274Figure 6. 2 Various cross-sectional arrays of fibre arrangement^ ’
o o no„o oo(a) (c)
OO o ooo o o(b) (d)
(a) Triangular (b) Square (c) hexagonal and (d) a two-by-one rectangular array
6.4.3 Directional Permeability in Structures with Variable Fibre Alignment
Kuwabara109, Sparrow and Loeffler273, Sangani and Acrivos272 and Drummond and
Tahir274 studied the permeability of fibrous materials having different fibre arrays
allowing more widely applicable permeability equations to be obtained for unidirectional

196 Chapter 6
fibre bundles. From their work, more general equations of drag force for flow parallel to
the fibre length of a single fibre, / , can be derived as follows:
f „ = ~87rr]Q
[ 4 e - e 2 - 2 A - 2 \ n e ](6.4.11)
Additionally, a more general equation of the drag force for flow perpendicular to the fibre
length of the fibre, f v, can be obtained as follows:
f y = ~S7TTJQ
[2e - C e 2 - B - I n f ](6.4.12)
Where A, B and C are constants which depend on the particular geometry of the fibre
array. Some values of A have been given by Drummond and Tahir274 for various
polygons where: A= 1.498 (for a triangular array), 1.478 (for a square array), 1.354 (for a
hexagonal array) and 1.130 (for a two-by-one rectangular array) respectively (see Figure
6.2). Elsewhere, Sangani and Acrivos272 and Drummond and Tahir274 have suggested
other values where B =1.490 (for a triangular array), 1.476 (for a square array), C=1.000
(for a triangular array) and 1.774 (for a square array).
Using the same assumptions listed in section 6.4.1, and substituting equations (6.4.11)
and (6.4.12) into equations (6.4.3) to (6.4.5), a more general model of the directional
permeability in an anisotropic fibre distribution can be obtained as follows:
7/z* 1 k( 0 ) = ~ — 32 e
[21n£-4£+2A+£2] [\v£-2£+B+Q?]
\Q{c^\x€-2E+B+C£L]co&(d-afy+[2\n£-4£+2A+£L]?,\xt(0-c?)fla(6.4.13)

197 Chapter 6
Where A, B and C are constants relating to particular fibre arrangements in the structure.
When the material has a high porosity, the term f2 can be neglected. Assuming that the
permeability perpendicular to the fibre length is half the permeability parallel to the fibre
length (Jackson and James277), the new equation (6.4.13) can be simplified as follows:
k{G) = ~ — 32 e
[ 2 \ n £ - 4 £ + 2A + £ 2]
/ £2(a)[cos2 (8 - a ) + 2 sin2 {6 - a ) \ l a(6.4.14)
6.4.4 Directional Permeability in Three-dimensional Structures
Equation (6.4.11) and (6.4.12) can be expanded to model permeability in three-
dimensional fabrics. Here, £ is the volume fraction of the solid material in the fabric,
Q(/i) is the fibre orientation distribution in th e /, direction, f is the vector of fluid flow
in any direction in the fabric, and Oi is the angle between the fluid flow in direction
f and the fibre orientation f . . Thus, the directional permeability of the fabric in direction
f , k(f), can be expanded from equation (6.4.13) to yield equation (6.4.15).
k(f) = -32£
[ l n e - 2 e + B + C £ 2] [2 \ n£-A£Jr A + £ ]
J Q ( 7 : )[[ln £ - 2£ + B + C£2 ] cos2 Ot• + [2 In £ - 4e + A + £ 2 ] sin2 6, ]fl=0 (6.4.15)

198 Chapter 6
6.5 CONSIDERATION OF STRUCTURES WITH SPECIFIC FIBRE
ORIENTATION PROFILES
Equations (6.4.7) and (6.4.8) establish the theoretical relationship between the fibre
orientation distribution function and the directional permeability in fibrous media such as
nonwovens. In order to demonstrate the practical importance of the equations, the
permeabilities of some typical anisotropic materials are predicted (see Table 6.1). In all
the figures presented in this chapter, the fibre diameter in the fabric is taken arbitrarily as
10(Mn, and the fluid is assumed to be water where r/ is taken to be 1.
6.5.1 Homogenous Isotropic Fibrous Structures
Homogenous isotropic materials may be viewed as a ‘special’ class of anisotropic media.
When liquid flows through a two-dimensional, homogenous isotropic fabric, the
directional permeability in each direction will be the same, (i.e., for isotropic materials,
k(0) and Q^a) are independent of the fibre orientation). If there are n fibres aligned
isotropically, the fibre orientation distribution function will be constant and will be the
same in each direction, the orientation distribution function, Q .(a) , can therefore be
represented as: Q(a) = l / 7r. Thus, the permeability of the homogenous fibrous medium k,
is written as (see Table 6.1):
(6.5.1)

199 Chapter 6
Table 6.1 Principle permeabilities in various two-dimensional nonwoven structures
FibrousStructures
Fibre Orientation Distribution Function
Directional Permeability k {6 )
1. Generalised Equation
Q ( a ) 1 1 11 5 2 s
k (9 ) kqx ^0 Y "ox ~ 32 e n| Q.(a) cos ( 0 - a ) d a0
1 S 2 TK r = ----- -—----------------------------32 e n
jQ (a)sin (d - a ) d a0
2. Isotropic Nonwovens (M_R_ISO)
Constantk - __ —— s k - __ —— r
ox 16 £ ’ or 16 £
3. Structure with
Unidirectional Fibre
Arrangement
Q(a) =1; when a = —
2
n0; when oc^ — 2
1 Sox ~ 32 £ s in 2 6 ’
1 S 2 T
0Y ~ 32 e c o s2 6
3. Structure with Fibres Aligned in TwoOrthogonalDirections
Q(«)=■X; when a=0
- X\ when a = — 2
k = - ± - 8-°* 32 £
k = - ± - 8- m 32 £
5X cos2 # + ( l - X ) s in 2 6
TX sin2 0 + ( l- X ) c o s 2 6
5. Needle- Punched
and Hydroentangled Nonwovens
£2(a)I S 2 S
ox ~ 32 £ n(1 - z) \ Q{a) cos2{ d - a ) d a
01 8 2 T
0Y ~~ 32 £ nz +(1 ■- z) J &(«) sin (9 -a)da
0
k \ ~ - x 5 1 \ ST \ 32 e { ( l - z ) S + j r J
Where (1).S = [21nf-4£- + 3 + f 2] and t = [\n e + -— — ] ■1 + e 2
(2) z is the fraction of fibres aligned in the Z direction which is perpendicular to the fabric plane, and k \z is the permeability in the Z direction.
(3). kox and k0Y are the two components in the equation —\— = ------ 1-_L_ respectively.k(0) kox k0y

200 Chapter 6
6.5.2. Structures with Unidirectional Fibre Alignment
In a unidirectional structure, the fibres are aligned in only one direction. This is roughly
analogous to a parallel-laid web. The fibres in an idealised structure of this kind may be
assumed to be composed of straight cylindrical rods aligned parallel to each other. The
fibre orientation distribution function of such a structure and the corresponding
directional permeability are shown in Table 6.1 along with a range of expressions given
by previous workers. Figure 6.3 shows a plot of the predicted directional permeability in
unidirectional fibre bundles obtained from the new equation. It would appear that the
permeability varies significantly in the direction of flow, although the magnitude of the
permeability in the structure is mainly determined by the porosity.
Figure 6. 3 Theoretical permeability in structures having unidirectional fibre orientation
Directional angles (Degrees)

201 Chapter 6
Typical governing equations for the directional permeabilities in such structures in the
directions parallel to and perpendicular to the fibre orientation (respectively) may be
given as follows (see Table 6.1):
From equation (6.5.2) and (6.5.3) for unidirectionally oriented materials, it is clear that
the maximum permeability will be in the same direction as the fibres are oriented and the
minimum permeability is perpendicular to the direction of fibre orientation. This would
also be predicted by capillary channel theory.
It may be noted that equations (6.5.2) and (6.5.3) are essentially the same as those given
by Happel111 and Happel and Brenner278. Moreover, if the direction of fluid flow through
the fabric is in the Z-direction, which is perpendicular to the fabric plane, the
permeability in this direction may be the same as the flow perpendicular to the
longitudinal axis of the fibre, and therefore the permeability will be effectively the same
as in equation (6.5.3).
6.5.3 Structures with Fibre Alignment in Two Orthogonal Directions
Structures in which fibres are aligned in two orthogonal directions include certain
nonwoven composites and some woven fabrics. Here, fibres are assumed to be aligned in
two orthogonal directions in the horizontal plane, where X percentage of the fibres are
71aligned in the direction OC = 0 and (1-X) are aligned in the direction cc = — . The
When 0 = * , k2 MAX --------- s
32 e(6.5.2)
(6.5.3)
2

202 Chapter 6
Figure 6. 4 Curves showing permeability of structures with fibres aligned in two orthogonal directions
D ire c t io n a l a n g le ( D e g r e e s )
(a) Cartesian directional permeability diagram
Percentage of fibres
CM<
LQ
LLJO
_Q03CDEv_<D
CL15coo0
Directional angle (Degrees)
(b) Square root of directional permeability in Polar system
Note: The porosity is taken as 0.8

203 Chapter 6
function of the fibre orientation distribution and the resulting directional permeability for
such structures are shown in Table 6.1. The predicted permeabilities using the alternative
model are plotted in Figure 6.4 where X -0.2, 0.5 and 0.8 respectively.
It is interesting to note that the maximum permeability occurs in the direction along
which most of the fibres are oriented, and the minimum permeability occurs in the
orthogonal direction. The direction in which the maximum and minimum permeabilities
are obtained and the magnitude of the maximum and minimum permeabilities varies with
the ratio of X, fibre diameter and the porosity of the fabric.
Additionally, in Figure 6.4, it is interesting to note that plotting the square root of the
permeability in a Polar co-ordinate system does yield an ellipsoid. This clearly
corresponds with the results of Ferrandon’s equations and the work of others, notably see
the book by Scheidegger170.
Assuming an idealised structure in which fibres are aligned only in two orthogonal
directions with an equal number of fibres in both directions, X = l/2 , we have:
Since the permeability obtained in each direction of this structure is the same (according
to equation (6.5.4)), an important finding of this work is that this model supports the
(6.5.4)
assumption that such structures are isotropic (see Adams and Rebenfeld124).

204 Chapter 6
6.5.4 Structures with Fibres Aligned in a Complex Statistical Distribution
If the alignment of fibres in the Z-direction is negligible, the fabric may be viewed as a
two-dimensional structure. In many nonwoven fabrics, the fibre orientation distribution
in the fabric plane has a complex statistical distribution function (such as skewed,
bimodal and multiple-modal distributions) and this has been demonstrated by image
analysis244, 279, 280. Parallel-laid structures may exhibit a single peak in a distribution
histogram of fibre alignment (see Figure 4.4(a)). A compound distribution function is
obtained when two or more distribution functions are combined so that the resulting
distribution has two or more principle peaks (see Figure 4.4(b)). In practice, fibres in
carded and cross-laid structures may be considered to have a compound distribution
function.
The statistical distribution functions and their compound distribution function have
significant practical importance because the fibre orientation distribution can be obtained
experimentally using image analysis or related techniques as shown in section 4.4.4 in
Chapter 4.
The general equations of directional permeability (see Table 6.1) can be readily used to
predict the permeability if the actual fibre orientation distribution function is obtained.
Some examples of the predicted permeability in unbonded nonwoven webs are presented
in section 6.7 (see Figures 6.7 and 6.8). These predictions are based on the measured
fibre orientation distributions of the webs.

205 Chapter 6
6.5.5 Directional Permeability in Needlepunched and Hydroentangled Nonwoven
Although this analysis has focused on the permeability of two-dimensional structures, in
reality, fibres in many nonwoven fabrics are aligned in three-dimensional form. For
example, in needlepunched and hydroentangled nonwovens, many fibres are aligned
perpendicular to the fabric plane and the fibre distribution in the Z-direction can not be
neglected.
In order to simplify the calculation of permeability, fibres aligned in the Z-direction in
such structures can be simplified and assumed to be aligned in the direction of the fabric
thickness and perpendicular to the fabric plane. It is assumed that the fibre distribution in
the Z-axis is homogeneous and uniform, and that the number of fibres perpendicular to
the fabric plane represents a fraction z of the total number of fibres. Assuming the fluid
flow is laminar and in-plane (i.e., the flow along the Z-axis is ignored), the radial
directional permeability in the fabric plane ^-(^, which is a function of the flow direction
0 , can be derived from equation (6.4.8) as follows:
a=0 J
where z is the fraction of fibres aligned perpendicular to the fabric plane.
If the flow is only in the Z-direction, the permeability perpendicular to the fabric plane,
k \z , can be written as:
Fabrics
ST (6.5.5)

206 Chapter 6
Table 6. 2 Existing permeability models for isotropic and unidirectional fibrous structures
NAME OF THEORIES PERMEABILITY (m2) NOTES
D irectional Permeability of U nidirectional Fabrics in the Theory k(d)(M R UNI) (New)
1 6 21 0 ) = -----
32 e
ST[rs in 2 0 + S c o i 6)
Directional Perm eability of Unidirectional F ibrous Bundles
TheoreticalM odels
Ferrandon’s theory kn (Scheidegger (1974))
-V = — c o s 2 0 + — s i n 2 6 kn k{ k2
E m ersleben’s Equation (Em ersleben (1925))
C £
C = 16
H appel’s Model (Happel (1959))
c =22." s
ca . - H 1 T
K uw abara’s Model (K uw abara (1959)) 1 sPerm eability o f Isotropic Fabrics in the new theory k (M _R_ISO)(New)
C = - l 6 ---- \I ST j
Permeability o f Isotropic Structures
Iberall’s Model (Iberall (1950))
l6(4-lnRe) l ” 3 (2-lnReXl-f)
Kozeny-C arm an’stheory
R ushton’s Equation for woven fabrics (Rushton (1968))
, l ( l - 0 3 *2 * " c ,2 *
C = 1 6 ^ 0
Sullivan’s Equation k (Sullivan & Hertel (1940))
£
Permeability of Anisotropic Structures
Shen’s model (Shen (1996))
C = 128 Permeability o f Isotropic Structures
EmpiricalModels
D avies’ M odel (Davies (1952))
1 £ 2 k - 3 " 8
64 e 2 [l + 56 £3 ]Where (1). T —Roughness factor, k0—the Kozeny constant, £ the orientation factor.
(2). k\ and k2 are two principle permeabilities respectively.
(3). S = [2 In 0 - \<t> + 3 + 0 2] and y = [in ^ + 1 — j1 + <j) 2
(4). C„ and C ± are the coefficient for permeability in the direction parallel and perpendicular to
the fibre orientation respectively in Happel’s equation.

206 Chapter 6
Table 6. 2 Existing permeability models for isotropic and unidirectional fibrous structures
NAME OF THEORIES PERMEABILITY (m2) NOTES
Directional Permeability of Unidirectional Fabrics in the Theory k(8)(M_R_UNI) (New)
m - 1 5 2 S T
32 e [Tsir? 6 + S c o i d j
Directional Permeability of Unidirectional Fibrous Bundles
TheoreticalModels
Ferrandon’s theory kn (Scheidegger (1974)) -V = — cos2 6 + — sin 2 6
kn kx k2Emersleben’s Equation (Emersleben (1925))
C £
C = 16
Happel’s Model (Happel (1959)) " s
c ± =-— 1 T
Kuwabara’s Model (Kuwabara (1959)) 1 sPermeability of Isotropic Fabrics in the new theory k (M_R_ISO)(New)
C = -16 I ST JPermeability of Isotropic Structures
Iberall’s Model (Iberall (1950))
16(4-1 nRe) 1
~ 3 (2-lnReXl-f)Kozeny-Carman’stheory
Rushton’s Equation for woven fabrics (Rushton (1968))
C
C = \6rk0
Sullivan’s Equation k (Sullivan & Hertel (1940))
c - f
Permeability of Anisotropic Structures
Shen’s model (Shen (1996))
C = 128 Permeability of Isotropic Structures
EmpiricalModels
Davies’ Model (Davies (1952)) k - 3 8
64 e 2 [l + 56 e 3 ]W here (1). 7 —Roughness factor, k 0 —the Kozeny constant, £ the orientation factor.
(2). k\ and k2 are two principle permeabilities respectively.
(3). S = [2 In 0 - 4 0 + 3 + 0 2] and j = [in 0 + 1 ~ * -.1 ]1 + 0
(4). Cn and C , are the coefficient for permeability in the direction parallel and perpendicular tothe fibre orientation respectively in Happel’s equation.
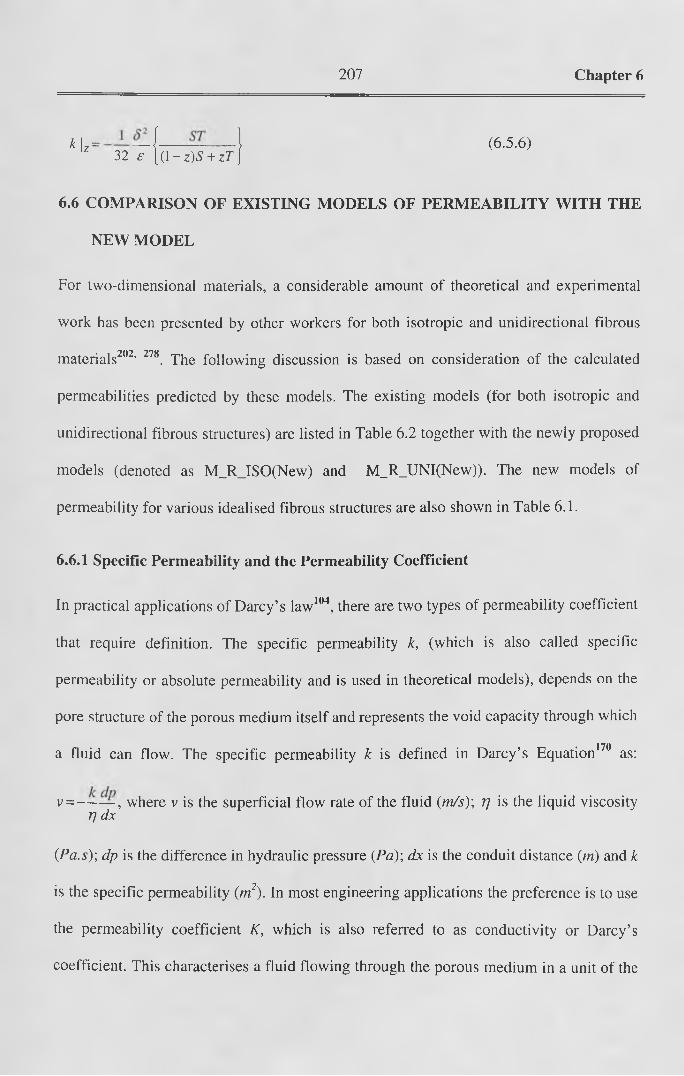
207 Chapter 6
k |z = — f------— ----- } (6.5.6)32 e [ ( l - z ) S + zr J
6.6 COMPARISON OF EXISTING MODELS OF PERMEABILITY WITH THE
NEW MODEL
For two-dimensional materials, a considerable amount of theoretical and experimental
work has been presented by other workers for both isotropic and unidirectional fibrous
materials202, 278. The following discussion is based on consideration of the calculated
permeabilities predicted by these models. The existing models (for both isotropic and
unidirectional fibrous structures) are listed in Table 6.2 together with the newly proposed
models (denoted as M_R_ISO(New) and M_R_UNI(New)). The new models of
permeability for various idealised fibrous structures are also shown in Table 6.1.
6.6.1 Specific Permeability and the Permeability Coefficient
In practical applications of Darcy’s law104, there are two types of permeability coefficient
that require definition. The specific permeability k, (which is also called specific
permeability or absolute permeability and is used in theoretical models), depends on the
pore structure of the porous medium itself and represents the void capacity through which
• 170a fluid can flow. The specific permeability k is defined in Darcy’s Equation as:
v = ——— , where v is the superficial flow rate of the fluid (m/s); ij is the liquid viscosity rj dx
(Pa.s); dp is the difference in hydraulic pressure (Pa); dx is the conduit distance (m) and k
is the specific permeability (w2). In most engineering applications the preference is to use
the permeability coefficient K, which is also referred to as conductivity or Darcy’s
coefficient. This characterises a fluid flowing through the porous medium in a unit of the

208 Chapter 6
superficial flow rate. The permeability coefficient K is defined in the following
expression of Darcy’s law :v = K * i . Where v is the superficial flow rate of the fluid
(m/s); i is the hydraulic gradient, (i.e., the differential hydraulic head per conduit distance
(m/m)); and K is the permeability coefficient (m/s).
The relationship between k and K is given as: k = K ? j / ( n i ) , w h erep is the liquid
density ( k g /n ? ) and g is the gravity accelerator constant (m /s2). When the liquid is
water at a temperature of 2(j)C, the constant becomes, k(m2)=l.042xl(T7K (m /s).
The following comparison of the existing models of permeability is concerned with the
specific permeability k. All the comparative results are summarised in Figure 6.5 and 6.6
and Table 6.2.
6.6.2 Permeability in Isotropic Fibrous Media
Many theoretical models of permeability110, 281 and empirical equations112' I13' 118 in
fibrous structures are based on the assumption that the structure in question is
homogenous and isotropic. The new theory can also give an equation for isotropic fibrous
structures (see equation (6.5.1)).
As mentioned in section 6.3, the Kozeny equation105 and its derivations281,112,118 is based
on capillary channel theory and agrees with experimental data very well so long as the
porosity is low (<0.8), (see Figure 6.5(a)). However, it is shown in Figure 6.5(b) that this
type of equation is not applicable for fluid flow in high porosity media (where porosity
>0.8). In Figure 6.5(a) and 6.5(b), Rushton’s equation is based on a consideration of

209 Chapter 6
Figure 6. 5 Comparison of the existing permeability models for homogenous isotropic materials and the new model (M_R_ISO)
P o ro s i ty P ( * 1 0 0 % )
(a) (P=0.30-0.90)
--------- I B E R A L L
-------- R U S H T O N
............SH E N
--------- M _ R _ IS O
---------D A V IE S
P o r o s i t y P ( * 1 0 0 % )
(b) (P=0.90-1.0)
Note: In Rushton’s equation, the product o f the roughness fac to r and Kozeny constant
(pk0 is taken as 0.5

210 Chapter 6
woven structures and is an example of Kozeny’s theory applied to fabrics281. It is clear
from Figure 6.5 that there is a large difference between the results of Rushton’s
281equation and empirical equations at high fabric porosities, but this difference is
relatively small at low fabric porosities.
Iberall’s equation110 for isotropic fibrous material is based on drag force theory and aims
to avoid the problems that exist with permeability models based on capillary channel
theory. However, from Figure 6.5(a) it is apparent that in low porosity fabrics (where
/^O.S), Iberall’s equation gives predicted permeability results that are much higher than
those obtained from empirical models but agrees with the current theory when P —> 1 as
shown in Figure 6.5(b).
118Several empirical models are also shown in Figure 6.5. Shen’s experimental results are
based on both the cross-plane permeability and the in-plane permeability of
needlepunched nonwoven fabrics. His empirical equation is claimed to be valid for
porosities ranging from 0.3 to 0.8. Davies’ equation112 is obtained from experimental
results of air permeability in glass fabrics having a porosity of 0.70-0.99. Shen’s
equation agrees with Rushton’s equation for relatively low porosities of between 0.3-0.8.
Davies’ equation appears to provide reasonable predictions for structures having higher
porosities of 0.70-0.99.
The permeability of homogenous fibrous structures deduced from the new theory,
equation (6.5.1), is denoted as M_R_ISO in Figure 6.5, and is in good agreement with
capillary theory at low porosity and is also in reasonable agreement with the results of
empirical models (see Figure 6.5). Predicted results from the new model are in close

211 Chapter 6
Figure 6. 6 Comparison of the existing permeability models and the new models
(M_R_30, M_R_45 and M_R_60) for unidirectional fibrous materials
XOLUo
-Q
0Q.
P o ro s i t y P ( *10 0 % )
(a) (P=0.30-0.9)
Poros i ty P ( *1 0 0 % )
(b) (P=0.90-1.00)

212 Chapter 6
Note: M_R_30, M_R_45 and M_R_60 are referred to as the directional permeabilities of
respectively.
agreement with the empirical data from both Shen’s equation at low porosity (P=0.3-0.8)
and with Davies’ equation at higher porosity (P -0 .85-0.99). It would appear that the new
model is applicable for both low and high porosity fibrous structures.
6.6.3 Permeability in Unidirectional Structures
In addition to isotropic structures, a number of theoretical studies have been presented for
unidirectional fibrous structures107, m ’ 109, 272, 273, 282. Several theoretical models for
unidirectional fibrous structures are illustrated in Figure 6.6. For a wide range of
porosities, many researchers (Happel and Brenner278, Sangani and Acrivos272, Drummond
and Tahir274) have found that Happel’s equation for unidirectional permeability (which is
also included in the new model) is in close agreement with experimental data.
Three other newly derived equations are also included in Figure 6.6 where the direction
of flow, with respect to the direction of fibre orientation, is taken to be 30°, 45° and 60°.
It is interesting to note that the new equations do not predict the minimum permeability at
a flow direction perpendicular to the predominant direction of fibre orientation. It is also
notable that the differences between the predicted permeabilities at 30°, 45° and 60° are
very small especially when the porosity is quite high.
when0 = - , - 0 = -
6 4 ancj 3

213 Chapter 6
6.7 PREDICTED AND MEASURED ANISOTROPY OF PERMEABILITY IN
EXPERIMENTAL NONWOVEN STRUCTURES
In Chapter 5, the structural parameters of eight webs and the corresponding nonwoven
fabric structures made from them were presented. According to the new model, the
permeabilities and the anisotropy of the permeabilities of these fabrics can be predicted
using equation 6.4.7.
The measured anisotropy of permeability of the fabrics was also given in Table 5.5 in
Chapter 5. Therefore, comparisons of the predicted and measured anisotropies of
permeability are now considered.
6.7.1 Predicted and Measured Anisotropy of Permeability in Unbonded Webs
The predicted permeabilities of the unbonded webs reported in Chapter 5 are shown in
Figures 6.7 and 6.8. A comparison between the predicted and measured anisotropies ol
permeability of these fabrics is summarised in Table 6.3 and Figure 6.9.
It is evident in Figure 6.9 that the predicted and the measured anisotropies of permeability
are linearly related. Thus, the newly constructed model of permeability may be a very
useful tool in predicting the actual permeability of fibrous webs. However, there are
differences between the predicted and the measured characteristic angles ol permeability
(see Table 6.3).

214 Chapter 6
Figure 6. 7 Predicted permeability of different web samples (polypropylene fibre)
(90° is the Machine Direction)
8 .20E-010 8 .00E-010 7.80E-010 7.60E-010 7.40E-010 7.20E-010 7 .00E-010 6 .80E-010 6 .60E-010 6 .60E-010 6 .80E-010 7 .00E-010 7 .20E-010 7.40E-010 7 .60E-010 7 .80E-010 8 .00E-010 - 8 .20E-010 -
3.90E-009
3.80E-009
3.70E-009
3.60E-009
3.50E-009
3.40E-009
3.50E-009
3.60E-009
3.70E-009
3.80E-009
3.90E-009
(a) Sample PA1 (b) Sample PB1
1.60E-009 -
1.55E-009 -
1.50E-009 -
1.45E-009 -
1.40E-009 -
1.35E-009 -
1.40E-009 -
1.45E-009 -
1.50E-009 -
1.55E-009 -
1.60E-009 -
4.05E-009
4.00E-009
3.95E-009
3.90E-009
3.85E-009
3.80E-009
3.75E-009
3.70E-009
3.75E-009
3.80E-009
3.85E-009
3.90E-009
3.95E-009
4.00E-009
4.05E-009
(c) Sample PA2 (d) Sample PB2

215 Chapter 6
Figure 6. 8 Predicted permeability of different web samples (viscose fibre)
(90° is the Machine Direction)
6.40E-010 -
6 .20E-010 -
6 .00E-010 -
5 .80E-010 -
5 .60E-010 -
5 .80E-010 -
6 .00E-010 -
6 .20E-010 -
6 .40E-010 -
3 .70E-009
3.60E-009
3.50E-009
3.40E-009
3.30E-009
3.20E-009
3.10E-009
3.00E-009
3.10E-009
3.20E-009
3.30E-009
3.40E-009
3.50E-009
3.60E-009
3.70E-009
(a) Sample VA1 (b) Sample VB1
6 .90E -010
6.85E-010
6 .80E -010
6.75E-010
6 .70E -010
6 .65E -010
6 .60E -010
6.65E-010
6 .70E -010
6 .75E -010
6 .80E -010
6.85E-010
6 .90E-010
3.60E-009
3.50E-009
3.40E-009
3.30E-009
3.20E-009
3.10E-009
3.00E-009
3.10E-009
3.20E-009
3.30E-009
3.40E-009
3.50E-009
3.60E-009
(c) Sample VA2 (d) Sample VB2

216 Chapter 6
Table 6. 3 Predicted and measured anisotropy of permeability of the experimental unbonded webs
Anisotropy of Permeability Minimum Principle Angle of
Permeability
Measured Predicted Measured Predicted
PA1 2.425 1.181 -3.19° 25.31°
PB1 2.213 1.106 -2.75° 13.06°
PA2 1.875 1.151 -25.71° 5.63°
PB2 1.670 1.064 20.85° 8.44°
VA1 2.194 1.105 -6.63° 2.81°
VB1 2.226 1.161 -0.65° 8.44°
VA2 1.517 1.028 -13.18° 13.06°
VB2 1.931 1.094 -13.39° 59.06°
Figure 6. 9 Predicted and measured anisotropy of permeability of the experimental unbonded webs

217 Chapter 6
6.7.2. Anisotropy of Permeability in Non-homogeneous Nonwoven Structures
The measured anisotropies of permeability of the experimental needlepunched and
hydroentangled nonwoven fabrics produced in Chapter 4 are shown in Table 5.5 (see
Chapter 5). The predicted anisotropies of permeability in these fabrics are very similar to
those in Figures 6.7 and 6.8.
In Chapter 4, it was reported that needlepunched and hydroentangled nonwoven fabrics
were not homogeneous. Therefore, the permeabilities of needled and hydroentangled
fabrics cannot be accurately predicted using the new models because they are valid only
for homogeneous nonwoven structures (such as the experimental unbonded webs and
commercial fabrics such as Sorbsan). This heterogeneity also explains why the measured
anisotropy of permeability in the bonded fabrics was greater than the predicted anisotropy
of permeability.
It is apparent that there are large differences in the anisotropy of permeability between
homogeneous and non-homogeneous nonwoven fabrics. For homogeneous fabrics, there
are two features of the anisotropy of permeability. First, the largest anisotropy ol
permeability in homogeneous nonwoven fabric will be theoretically obtained in
unidirectional structures, and the anisotropy ol permeability in such structures is identical
to the ratio of the principle permeabilitites determined by the two Happel’s equations111.
The ratio varies with the fabric porosity as shown in Figure 6.10.
277 • •According to Figure 6.10 and other researchers , it is apparent that the maximum
anisotropy of permeability for a homogeneous nonwoven structure should not be greater
than 2. As the porosities of the experimental fabrics ranged from 0.93 to 0.99, the

218 Chapter 6
maximum anisotropy of permeability in homogeneous unidirectional nonwoven
structures should range from 1.55-1.73 (according to Happel’s equations).
Figure 6.10 Predicted anisotropy of permeability of unidirectional nonwoven structures
Porosity
Secondly, the direction of the predicted principle permeability in homogeneous
nonwoven structures varies markedly with the fibre orientation distribution.
In contrast to homogeneous nonwoven structures, the following two features of the
anisotropy of permeability for needlepunched and hydroentangled fabrics (as shown in
Table 5.5) should be noted:
(1). Most of the measured anisotropies of permeability are near to or higher than the
maximum predicted anisotropy of permeability (1.55-1.73) for a homogeneous structure
in the corresponding porosity range (0.93-0.99). In thirty-eight separate results, the
maximum measured anisotropy of permeability was 232. The measured anisotropies of
permeability can be grouped as follows:-
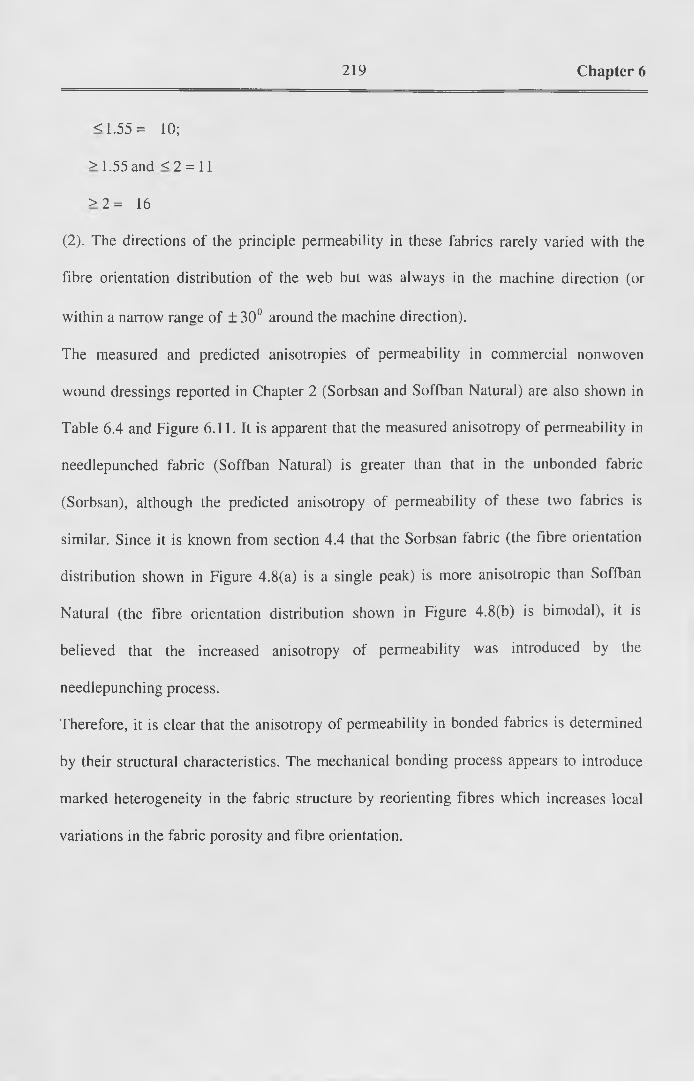
219 Chapter 6
< 1.55= 10;
>1.55 and < 2 = 11
> 2 = 16
(2). The directions of the principle permeability in these fabrics rarely varied with the
fibre orientation distribution of the web but was always in the machine direction (or
within a narrow range of ± 30° around the machine direction).
The measured and predicted anisotropies of permeability in commercial nonwoven
wound dressings reported in Chapter 2 (Sorbsan and Soffban Natural) are also shown in
Table 6.4 and Figure 6.11. It is apparent that the measured anisotropy of permeability in
needlepunched fabric (Soffban Natural) is greater than that in the unbonded fabric
(Sorbsan), although the predicted anisotropy of permeability of these two fabrics is
similar. Since it is known from section 4.4 that the Sorbsan fabric (the fibre orientation
distribution shown in Figure 4.8(a) is a single peak) is more anisotropic than Soffban
Natural (the fibre orientation distribution shown in Figure 4.8(b) is bimodal), it is
believed that the increased anisotropy of permeability was introduced by the
needlepunching process.
Therefore, it is clear that the anisotropy of permeability in bonded fabrics is determined
by their structural characteristics. The mechanical bonding process appears to introduce
marked heterogeneity in the fabric structure by reorienting fibres which increases local
variations in the fabric porosity and fibre orientation.

220 Chapter 6
Table 6. 4 Predicted and measured anisotropy of permeability in commercial nonwoven wound dressing fabrics
Anisotropy of Permeability Minimum Principle Angle of Permeability
Measured Predicted Measured Predicted
SORBSAN 1.332 1.123 25.81° -16.88°
SOFFBANNATURAL
2.085 1.126 34.45° -50.63°
Figure 6.11 Predicted and measured anisotropy of permeability in commercial nonwoven wound dressing fabrics
nCU0)Ei_0CL
oCLok_o</>'c<
54.5
43.5
32.5
21.5
10.5
0
o M eaired j n Predcted
------- -
-------- 1
I zL JSorbsan Soffban Natural
Commercial fabrics
6.8 SUMMARY OF THE NEW MODELS
Equations have been derived to model the directional permeability in two- and three-
dimensional fibrous materials from previous drag force equations. Equations (6.4.7) and
(6.4.8) highlight a very important aspect of the unit cell theory of permeability because in
this work it has been demonstrated for the first time that the permeability of a fibrous
structure is not a constant but varies with the fibre orientation (see equation (6.4.7)).
Happel’s equations111 are constrained to materials having unidirectional fibre orientation,
and this limits their practical application. In contrast, the alternative model presented in

221 Chapter 6
equations (6.4.7) and (6.4.8) allows the permeability in all directions to be calculated.
When equation (6.4.7) or (6.4.8) is applied to unidirectional materials and
6 = 0 o r (—) ; the two equations can be reduced to a form that is essentially the same as
Happel’s equations.
The new equations for directional permeability appear to be generally applicable and in
close agreement with existing empirical models for both low and high porosity
homogeneous structures. The main conclusions of the theoretical approach may be
summarised as follows:
1. The planar directional permeability in fibrous materials such as nonwovens can be
deduced by drag theory, and for two-dimensional structures can be expressed as in
equation (6.4.7), or more generally as in equation (6.4.13).
2. The directional permeability equations (6.4.7) and (6.4.13) can be expanded for
application to three-dimensional fibrous structures, but at present this may be of limited
practical application because of the practical difficulties that exist in measuring fibre
orientation in three dimensions. In the future, it is likely that techniques will be
developed to allow such measurements to be made.
3. In contrast to existing permeability models which are either applicable to isotropic
materials or to unidirectional fibre bundles, the new equations (6.4.7) and (6.4.8)
presented in this work allow calculation of the anisotropy of permeability in a range of
structures, including isotropic fibrous materials, unidirectional fibre bundles and
structures with two orthogonal fibre alignments.

222 Chapter 6
4. Existing empirical and theoretical models for isotropic fibrous structures (such as
nonwovens) tend to be valid only for a narrow range of porosities. The results from the
new equation for isotropic fibrous structures (equation (6.5.1)) are in close agreement
with previously obtained empirical data for both low and high porosity structures.
5. The new equations of permeability for unidirectional fibre bundles expand the
application of Happel’s equations which have been shown to be in agreement with
experimental results over a wide range of porosities.
6. The planar directional permeability and permeability in the Z-direction of idealised
nonwoven structures can be expressed as in equations (6.5.5) and (6.5.6) respectively.
These equations are expected to be of practical use for many nonwoven fabrics.
7. The bonding process appears to introduce heterogeneity in the fabric structure. Two
features of the anisotropy in heterogeneous nonwoven structures (such as needlepunched
and hydroentangled fabrics) were found. The first is that the anisotropy of permeability in
such fabrics is usually near to or higher than the predicted anisotropy of permeability
(1.55-1.73) in a homogeneous structure for a corresponding porosity range (0.93-0.99).
The other is that the directions of the principle permeability in these bonded fabrics rarely
varied with the fibre orientation distribution. The principle permeability was always in
the machine direction or within a narrow range ( + 30°) of the machine direction.

223 Chapter 7
CHAPTER 7 CONCLUSIONS AND SUGGESTIONS FOR
FURTHER WORK
It has been demonstrated that the liquid transport properties of nonwoven fabrics used in
wound care depends both on the properties of the constituent fibres and on the spatial
arrangement of the fibres in the assembly. Additionally, this research has highlighted the
influence of the geometrical structure on the anisotropy of liquid transport in nonwoven
structures of the type used in wound dressing applications.
7.1 CONCLUSIONS
The primary focus of this work was to investigate the influences of the structural
characteristics of nonwoven fabrics on the liquid transport characteristics of nonwoven
fabrics.
By performing preliminary strip tests on commercial nonwoven wound dressings, it was
established that there is significant anisotropy of liquid absorption in such fabrics no
matter what the fibre composition of the fabric. It was evident that the anisotropy in
liquid absorption is influenced by anisotropy in the fabric structure, which may be
influenced by the fibre orientation distribution. It was also apparent that there were no
previous studies of the relationship between the fibre orientation distribution and the
anisotropy of liquid transport in nonwoven fabrics.
After comparison of various measurement methods, a novel computer integrated
capacitance system for measuring multiple-directional liquid transport in nonwoven
wound dressing structures was constructed to simulate practical liquid absorption

224 Chapter 7
conditions. Using this dynamic measuring instrument, tests of liquid absorption and
liquid transport in up to eight directions in the fabric plane were undertaken for both
commercial nonwoven wound dressings and numerous experimental nonwoven sample
fabrics.
A method was introduced to obtain the anisotropy of permeability and the anisotropy of
liquid absorption in fabrics using the new measurement system.
It was concluded that unbonded nonwoven webs can be modelled as homogeneous
anisotropic structures, but such webs are not homogeneous after needlepunching or
hydroentanglement. Thus, such bonding processes appear to make nonwoven structures
more anisotropic and heterogeneous.
Experimental studies established that the fibre orientation distribution and the fabric
porosity in homogeneous anisotropic nonwovens dominated the anisotropy of the liquid
flow in such structures. However, the liquid flow through needled and hydroentangled
fabrics was more complex and is influenced by a combination of local differences in the
libre orientation distribution and fabric porosity.
It would appear that modifying the fibre orientation distribution of nonwoven fabric is a
very effective method for obtaining desirable anisotropic or isotropic fabric structures.
The marked increases in anisotropy resulting from different types of mechanical
bonding are also noteworthy when considering the design of fabrics with particular
liquid handling characteristics.

225 Chapter 7
A unique model for predicting the directional permeability of homogeneous anisotropic
nonwoven fabrics has been developed based on Happel’s equations.
In contrast to existing permeability models which are either applicable to isotropic
materials or to unidirectional fibre bundles, the directional permeabilities of several
idealised nonwoven structures (isotropic fibrous materials, unidirectional fibre bundles,
structures with two orthogonal fibre alignments and structures with certain fibre
orientation distributions) were studied based on the new model, and it was established
that the specific permeability in nonwoven fabrics depends on the fibre diameter, fabric
porosity and the fibre orientation distribution. All these parameters can be readily
measured.
Existing empirical and theoretical models for isotropic nonwoven structures tend to be
valid only for a narrow range of porosities. The results from the new model for isotropic
fibrous structures (equation 6.5.1) are in close agreement with previously obtained
empirical data for both low and high porosity structures.
The new models for predicting the anisotropy of specific permeability in nonwovens
were examined by comparing them with experimental results, and it was found that the
models are suitable for use with homogeneous nonwoven structures (e.g. unbonded
webs) but not suitable for heterogeneous nonwoven structures such as needlepunched
and hydroentangled nonwoven fabrics.
Other main findings from this work may be summarised as follows:
• The liquid absorbency of nonwoven fabrics is related to fabric porosity.

226 Chapter 7
• Fibre type and fibre linear density appear to affect fibre alignment in web
formation and thus influence the fibre orientation distribution in nonwoven
fabrics.
• The fibre entanglement during hydroentanglement and the structure of
hydroentangled fabric may also be affected by the specific flexural rigidity,
compression recovery, and bending recovery of the fibre.
• The bonding process appears to introduce heterogeneity in the fabric structure.
Both needlepunched and hydroentangled fabrics have been found to be a non-
homogeneous fibrous structures due to needling marks and jet marks
respectively.
7.2 SUGGESTIONS FOR FURTHER WORK
It is possible to modify the new measurement system to enhance the transducer
sensitivity and to measure liquid flow in up to 16 or more directions in the fabric plane.
Although the liquid transport in homogeneous nonwoven structures has been studied
and a new model has been proposed, the mechanism of liquid transport in non-
homogeneous structures requires further investigation. There are structural
heterogeneities in nonwoven fabrics, such as spatial variations in the arrangement of
fibres. This variation is evident in areal density, fibre orientation, fibre crimp, and in the
degree of fibre entanglement. Such structural heterogeneities result in local variations
in permeability that will produce deviations from the smooth-ellipse-like flow fronts

227 Chapter 7
when liquid is absorbed by fabrics. Since the variations are local, the shapes of the flow
fronts for heterogeneous structures are not reproducible202.
The transport of non-Newtonian fluids such as blood and body fluid was beyond the
scope of the research, but future work is still required to determine the effect of body
fluid transport in anisotropic nonwoven structures. This assumes substitute fluids can be
made that behave in the same way as real body fluids.
Further work is also required to establish the effect of liquid transport using different
pressures.
The research presented in this thesis has revealed the mechanisms of liquid transport and
liquid absorption, and has demonstrated the effect of important fabric structural
parameters on these liquid handling characteristics. In future studies, the effect of other
structural parameters such as fibre length and fibre cross sections on the liquid transport
need to be elucidated. Also, the simultaneous liquid transport in all three-dimensions ol
the fabric structures is an important area for further research.

228 Appendix
APPENDIX I Modified Routine for Measuring Fibre
Orientation Distributions in Image Analyser.
10 rem FIBRE ORIENTATION CHARACTERISATION OF NONWOVENS
20 dim a(5000),b(5000), c(5000)
30 rem machine direction vertical (black fibres)
40 rem black source(15.6/17 mag-25*latter)
50 clearimages
55 display 0 12 1
60 pausetext 1,"MACHINE DIRECTION VERTICAL"
70 qmenu "image_setup"
80 pausetext 1," "
90 qmenu "calibrate"
100 riasettings "cal_value",cal
110 pausetext 1,"ACQUIRE IN 0"
120 qmenu "acquire"
130 average 0 5 1 0 7 0
140 grey sub 0 1 2
150 greyset 140 3
160 greyadd 2 3 4
170 btoph 4 8 255 2:sub84 8 5
180 wtoph 4 8 255 2:add8 5 8 8
190 setgamma 161,-27
200 anamorph 8 9 6 10
210 grey move 9 0
220 rem Black sharpen Source Prelim contrast increase
230 anamorph 0 16 8
240 btoph 1 0 256 1 : sub8 1 0 0
250 greyinvert 0 1
260 greyfill 1 23 1 1
270 greymove 23 1

229 Appendix
370 mframe 0 0 512 480
380 pausetext 1,"ADJUST FRAMES INTO BODY OF FABRIC"
390 qmenu "frames"
400 riasettings "mframex",xl
410 riasettings "mframey",yl
420 riasettings "mframew",wl
430 riasettings "mframeh",hl
440 wgline 1 x 1 0 x 1 5 1 1 0
450 wgline 1 0 yl 511 yl 0
460 wgline 1 x l+ w l 0 x l+ w l 5110
470 wgline 1 0 y l+ h l 511 y l+ h l 0
480 pausetext 1,"DETECT WHITE IN 1"
490 qmenu "detect"
500 pausetext 1,"EDIT 1 TO 8"
510 qmenu "bin_edit"
520 binmove 8 1
530 binwskel 1 2
540 chrpoint 2 3 1
550 bindilate 3 4 256 1.5
560 binx 14 5 10 1
570 edgefeat 5 11
580 binmove 11 5
590 display 0 I 3 32
600 els
610 setftrpar "8,35,32,11,1,2,3,63"
620 ftrgrey 0 : measfeat 5 1 10 3000000 : clraccept
630 acceptfeat 1 12 812813
640 acceptxfer 5 6
650 histoclear 1
652 pausetext 1, "Dist Number should be 1, Orientation range should be 0-180"
653 pausetext 2, "To get histogram, click CLEAR, then click HISTOGRAM"

230 Appendix
654 pausetext 3, "To save data to disk, click PRINT"
655 qmenu "histogram"
680 rhistostats 1 stats(l) 0
690 mm=stats(2)
720 rhistostats 1 stats(l) 0
730 nn=stats(l)
740 histoclear 1
770 RFEATNUM NUM (l)
780 FOR 1= 1 TO NUM(2)
790 RFEATRES 1-1 32 FEATS(2)
795 c(i)=FEATS(2)
800 test FEATS(2)>90 then 810 else 825
810 a(I)=180-FEATS(2)
820 goto 828
825 a(I)=FEATS(2)
828 next I
864 sum=0
866 fo rx = l to NUM(2)
870 b(x)=sin(a(x)*3.1416/180)
890 sum=sum+b(x)
900 next x
930 qmenu "bin_edit"
940 measfield 10
950 rfieldres field(l)
960 measfield 1
970 rfieldres fieldarray(l)
980 p rin t" "
990 print "DO YOU WISH TO PRINT DATA Y/N ?"
1000 input m$
1010 test m$="y" then 1020 else 1160
1020 open #1 "prn"

231 Appendix
1030 print #1:" "
1040 print #1:"PERFECT ALIGNMENT FACTOR (w.r.t.vertical axis)=100"
1050 print #1:"PERFECT ALIGNMENT FACTOR (w.r.t.horizontal axis)=0"
1060 print #1:"ACTUAL ALIGNMENT FACTOR = 100*sum/NUM(2)
=" 100*sum/NUM(2)
1070 print #1:"STANDARD DEVIATION OF ORIENTATION =",mm,"degrees"
1080 print #1:"ANISOTROPY (h/v.intercepts) = ",fieldarray(3)/fieldarray(4)
1090 print #1:"AREA EXAMINED ='',wl*hl*cal*cal,"sq.mm"
1100 print #1:"AREA FRACTION = ”,fieldarray(l)/(w l*hl)
1110 print #1:"NUMBER OF FIBRE SEGMENTS =",NUM(2)
1120 print #1:"FIBRE SEGMENT DENSITY =",NUM (2)/(wl*hl*cal*cal),"per
sq.mm"
1130 print #1: "AVERAGE SEGMENT LENGTH =",nn,"mm"
1140 print #1:"NUMBER OF CROSSOVERS =",field(5)
1150 close #1
1160 binput 6 1
1170 display 0 3 2 2
1180 END

Appendix II
Electronic C
ircuits

233 Appendix
APPENDIX III Drag Force on A Single Fibre
When a fluid flows in the direction 0 over a fibre which is aligned in the direction a
(as shown in Figure 6.1), the velocity vector of the fluid flow, V , can be separated into
two orthogonal components, Vp and Vv ,
Vp = V | cos(0 - a ) |
Vv = V | sin(0 - a ) |
Where Vp is the velocity vector parallel to the fibre length and Vv is the velocity vector
perpendicular to the fibre length. Thus, according to equations (6.4.1) and (6.4.2), the
drag force acting on the fibre, / and f v , will be as follows,
~ r _ Snriq \ c o s ( 9 - a ) \ _ 8 7 t r i q \ c o s ( d - a ) \
p ~ [40 -<j)2 - 3 - 2 \ n < p ] ~ S ~
— _ 8 nri q | sin( 6 - a ) | 8 rnj q \ sin( 6 - a ) |• v " l - “ y ~
[In (p +1 + </>2
Consequently, the total drag force in the direction d , which is the direction of fluid
170flow, will be / ( # ) ( see Ferrandon’ equation in Scheidegger’s book ),
f ( 6 ) = f p | cos ( 6 - a ) \ + f v | sin(<9 - a )
Smiq cos2 (0 - a ) Znriq sin2 (0 - a )T

234 References
REFERENCES
\ Turner TD, Which Dressing and Why? in Wound Care (Eds.) Westaby S., Heinemann
Medical Books, p59—67, London, 1985
. Cusick GE. and Hopkins, T., Absorbent incontinence products, Textile Progress,
20(3), p21, 1990.
3. Lindsay JD, The anisotropic permeability of paper, TAPPI, May, p223, 1990.
4. Odland G., The fine structure of the interrelationship of cells in the human epidermis,
J. Biophys. Biochem. Cytol., 4, p529—535, 1958.
5. Winter GD, Formation of scab and the rate of epihteliazation of superficial wounds in
the skin of the young domestic pig, Nature, 193, p293—294, 1962.
6. Hinman CD and Maibach H, Effect of air exposure and occlusion on experimental
human skin wounds, Nature, 200, p377—378, 1963.
1. Winter GD, Epidermal regeneration studies in the domestic pig, in Maibach HL and
Rovee DT, (Eds), Epidermal Wound Healing, Chicago, Year Book Medical
Publishers Inc., p l5 9 —181,1972.
8. Whitby DJ, The biology of wound healing, Surgery, 1, p25-26, 1995.
9 Steenfos HH, Growth factors and wound healing, Scand. Plast. Reconstr. Hand.
Surg., 28, pp95—105, 1993.
10. Eaglstein WH and Mertz PM, New Method for assessing epidermal wound healing:
The effects of tramcinolone acetonide and polyethylene film occlusion. J. Invest.
Dermatol., 71, p382—384, 1978.
n . Rovee DT, Effect of local wound environment on epidermal healing, in Maibach
HL, Rovee DT., (Eds), Epidermal Wound Healing, Chicago, Year Book Medical
Publishers Inc., p l5 9 —181,1972.
12. Barett A., et al, Comparison of synthetic adhesive moisture vapour permeable and
fine mesh gauze dressings for split-thickness skin graft donor sites, Am. J. Surge.,
145, p379—381, 1983.
13. Mandy SH., A new primary wound dressing made of polyethylene oxide gel, J.
Dermal Surge. 9, 153—155, 1983.
235 References
14. Grotendorst GR, Chemo attractants and growth factors, In Cohen IK, et al, (Eds.)
Wound Healing. Philadelphia, WB Saunders, p237—246, 1992.
15. Robson MC and Heggers JP., Eicosinoid, cytokines, and free radicals, In Cohen IK,
et al, (Eds.) Wound Healing, Philadelphia: WB Saunders, p292—304, 1992.
16. McGrath MH, Peptide growth factors and wound healing, Clin. Plast. Surg., 17,
p421—432, 1990.17. Mckay IA and Leigh IM, Epidermal cytokines and their roles in cutaneous wound
healing, Br. J. Dermaltol., 124, p513—518, 1991.
18. Breuing K, et al, EGF-like growth factor present in porcine wound fluid, Surg.
Frum, 42, p623-625,1991.
19. Grotendorst GR., et al, Production of growth factors (PDGF & TGF-beta) at the site
of tissue repair, In Hunt TK, et al, (Eds.) Biological and Clinical Aspects o f Tissue
Repair, Alen R Liss, New York, p47—54, 1988.
20. Katz MH., et al, Human wound fluid from acute wounds stimulates fibroblast and
endothelial cell growth, J. Am. Acad. D erm atol., 25, ppl054—1058, 1991.
21. Buchan IA., et al, Laboratory investigation of the composition and properties of
pigskin wound exudate under Op-Site, Burns, 8, p39—46, 1981.
22. Ichiro Ono, et al, Evaluation of cytokines in donor site wound, Scand. Plast.
Reconstr. Hand. Surg. , 28, p269-273, 1993.
23. Nemeth AJ., et al, Stimulatory effect of human wound fluid on epidermal out growth
from porcine skin explant cultures, abstracted. J. Invest. Dermatol., 86, pp497, 1986.
24. Alper JC, et al, The in vitro response of fibroblasts to the fluid that accumulates
under a vapour- permeable membrane, J. Invest. Dermatol., 84, p513—515,1985.
25 Falanga V., Occlusive wound dressings, Arch. Drematol., 124(6), pp872-877,1988.
26. Mertz PM and Eaglstein WH, The effect of a semi-occlusive dressing on the
microbial population in superficial wounds, Arch. Surge., 119, pp287-289,1983.
27. Stuart Kartz, et al, Semipermeable occlusive dressings: Effects on growth of
pathogenic bacteria and reepithelialization of superficial wounds, Arch. Dermatol.,
122(1), p58—62,1986.

236 References
28. Alvarez OM, et al, The effect of occlusive dressings on collagen synthesis and re-
epithelislization in superficial wounds, J. Surg. Res. 35, p l4 2 —148, 1983.
29 . Eaglstein WH., Experiences with biosynthetic dressings, J. Am. Acad. Dermatol., 12,
p434-440, 1985.in
. May SR, Physiology, immunology, and clinical efficacy of an adherent polyurethane
wound dressing: Op-Site, in Wise DL (Eds): Burn Wound Coverings, Boca Raton,
Fla, CRC Press, p53-78,1983.
31. Eatton AC, A controlled trial to evaluate and compare a sutureless skin closure
technique (Op-Site skin closure) with conventional skin suturing and clipping in
abdominal surgery, Br. J. Surg. 67, p857—860, 1980.
32. Friedman SJ and Su WPD, Management of leg ulcers with hydrocolloid occlusive
dressing, Arch., Dermatol.,120, pl329, 1983.
33 . Alper JC, et al, Moist wound healing under a vapour permeable membrane, J. Am.
Acad. Dermatol., 8, p347—353,1983.
34. Gores GJ and Messner RL, Improved pressure sore healing with hydrocolloid
dressings, Arch. Dermattol., 123, p766—771, 1987
35. Holland KTT, et al, A comparison of the in vitro antibacterial and complement
activating effect of Op— Site and TeGaderm dressing, J. Hosp. Infect., 5, p323—
328, 1983.
36. Thomas S., Wound Management and Dressings, The pharmaceutical press, London,
1990
37 . Merttz PM, et al, Occlusive wound dressings to prevent bacterial invasion and
infection, J. Am. Acad. Dermatol., 12, p662-668, 1985.
38. Eaglstein WH, et al, Occlusive dressings, Am. Fam. Physician. 35, pp211—216, 1987.
39. Phillips TJ, Kapoor V., Provan A. and Ellerin T., A randomised prospective study of
a hydro-active dressing vs. conventional treatment after shave biopsy excision, Arch.
Dermatol. 129, p859—860, 1993.
40. Jaffe LF and Vanable JW, Electric fields and wound healing, in Eaglstein WH
(Eds.): Clinics in Dermatology: Wound Healing, Philadelphia, JB Lippincott,
p34—44, 1983.

237 References
41. Falanga V., et al, Electrical stimulation increases the expression of fibroblast
receptors for transforming growth factor-beta, abstracted, J. Invest Dermatol. 8,
p488,1987.
42. Eaglstein WH., et a l , Optimal use of an occlusive dressing to enhance healing: Effect
of delayed application and early removal on wound healing, Arch. Dermatol. 124,
p392-395, 1988.
43. Fisher LB and Maibbach HI, The effect of occlusive and semipermeable dressings on
the cell kinetics of normal and wounded human epidermis, in Maibach HI, Rovee
DT (Eds.): Epidermal Wound Healing. Chicago, Year Book Medical Publishers Inc,
ppl 13-122. 1972.
44. Winter GD, Oxygen and epidermal wound healing: (3) Oxygen transport to tissues ,
in Silver IA, et al (Eds.),: Advance in experimental Medicine and Biology. New
York, Plenum Publishing Co., p673-678, 1972.
45. Silver IA, Oxygen lesions and epithelialization, in Maibach HI, Rovee DT (Eds.):
Epidermal Wound Healing. Chicago, Year Book Medical Publishers Inc, p291—305,
1972.
46. Osment LS, The skin in wound healing, in Menaker L.(Eds.), Biologic Basis o f
Wound Healing, p274-290, 1980.
47. Buchan IA, et al, The effect of local infections upon wound healing: An experimental
study, Br. J. Surg., 67, p851—855, 1980.
48. Balin AK, et al, Oxygen modulates the growth of human cells at physiologic partial
pressures, J. Exp. Med. 160, p i52—166, 1983.
49. Banda MJ, et al, Isolation of a nonmutagenic angiogenesis factor from wound fluid,
Proc. Natl. Acad. Sci. USA, 79, p7773-7777,1982.
so. Knighton DR, et al, Oxygen regulates the angiogenesis factors by macrophages,
Science, 221, p i 283—1285, 1983.
51. Knighton DR, et al, Regulation of wound healing angiogenesis: Effect of oxygen
gradients and inspired oxygen concentrations, Surgery, 90, p262—270,1981.

238 References
52. Horikoshi T., et al, Modulation of proliferation in human epidermal keratinocyte and
melanocyte cultures by dissolved oxygen, abstracted, J. Invest. Dermatol., 82, p411,
198453 . Varghese MV, et al, Local environment of chronic wounds under synthetic dressings,
Arch. Dermatol., 122, Jan, p52—57, 1986.
54. Park GB, Courtney JM, McNair A. and Gaylor JDS, The design and evaluation of a
burn wound covering, Engineering o f Medicine, 7, p i 1 — 15, 1978.
55. Rahmn MM, In vitro assessment of polymeric burn wound coverings, M.Sc. Thesis,
University of Strathclyde, Glasgow, 1982.
56. Wong P., Physical evaluation of a hydrogel as a burn wound dressing, M. Sc. Thesis,
University of Strathclyde, Glasgow, 1980.
57. Lamke LO, Nilsson GE and Reithner HL, The evaporative water loss from burns and
the water vapour permeability of grafts and artificial membranes used in the
treatment of burns, Burns, 3, p l5 9 -1 6 5 , 1977
58. Queen D, Galor JDS, Evans JH, Gaylor JDS, Courtney JM and Reid WH, The in
vitro gaseous transmission of wound dressings, Scan. J. Reconstr. Surg. 21, p287—
289, 1987.
59. Standard methods of test for water vapour transmission of materials in sheet form,
ASTM M ethod E96-66, 1990.
60. British Standard method of measuring the gas permeability of package materials, B.S.
Method 2782, 1990.
61. Queen D, Evans JH, Gaylor JDS, Courtney JM and Reid WH, Preclinical assessment
of burn wound dressings, Burns, 12, pl61 —166, 1986.
62. Shultis KL, Determinaton of the oxygen permeability of artificial membranes by gas
to liquid transfer methods, M.Sc. Thesis, University of Minnesota, USA, 1980.
63. Wong P., Carbon dioxide transfer in membrane oxygenators and associated
membrane, Ph.D. Thesis, University of Strathclyde, Glasgow, 1983.
64. Eagle ME, Community nurses prospective of wound management products in
problematic wounds, Procs. o f Med. Text. Int. Conf. 96, Bolton, UK, 1996.

239 References
65. Alper JC, WelshE A. and Magire P., Use of the vapour permeable membrane for
cutaneous ulcers: Details of application and side effects, J. Am. Acad. Dermatol. 11,
p858—866, 1983.
66. Zitell JA, Delayed wound healing with adhesive wound dressing, J. Dermatol. Surg.
Oncol., 10, p709—710, 1983.
67. Varley SJ, Barnett SE and Scales JT, Wound healing and the effects of dressing,
Conference on M edical Applications o f Textiles, University of Leeds, 1981.
68 Winter TD, A note on wound healing under dressing with special reference to
perforated-film dressings, J. Invest. Derm., 45(4), p299, 1965.
69 Thomas S, Foam Dressings: A guide to the properties and uses of the main foam
dressings available in the UK., J.Wound Care, 2(3), p i53, 1993
70 Winter TD, Epidermal wound healing under a new polyurethane foam dressing
(Lyofoam). Plast. Recon. Surg., 56 (5), p531, 1975
71. Bishop WI, The early history o f surgery, Robert Hale, London, pl63, 1980
72. Turner TD, Pharm. J., 22, p421, 1979
73. Turner TD, The functional development of wound management products, Conference
on Medical Applications o f Textiles, University of Leeds, 1981.
74. Burrow TR and March BS, The development of fibres for use in wound dressings,
textiles in health care, The 2nd Leeds Medical Applications o f Textiles Conference,
University of Leeds, Sept., 1985.
75. Anon. Medical Textile, Nov.,pp7, 1996.
76. Anon. Medical Textile, Mar., pp8, 1996.
77. Anon. Medical Textile, Jan., pp4, 1996
78 Anon. Medical Textile, Sept.,pp6, 1996
79. US patent 5,531,670, 1996
80. Anon. Nonwoven Ind. 22(3), p80-81, 1991.
81. Anon. http://www.smtl.co.uk/WMPRC/DataCardsl 82 . Anon. http://www.smith-nephew.com/UK/83 . Anon. Int. nonwovens Bull. , 2(3), p56, 1991.84 . Anon. Int. nonwovens B u ll., 2(3), p56, 1991.

240 References
8S. Anon. Medical Textile, Jan., p l2 , 1996
86 US patent 5,470,576, 1995
87. US patent 5,520,925, 1996
88 US patent 5,465,735, 1995
89 US patent 5,529,783, 1996
90. Hearle JWS and Stevenson PJ, Nonwoven fabric studies, part 3: The anisotropy of
nonwoven fabrics, T.R.J., 33, pp877-888, 1963
91. Hearle JWS and Stevenson PJ, Nonwoven fabric studies, part 4: Prediction of tensile
properties, T. R. J., 34, ppl81—191, 1963.
92. Backer S. and Petterson DR, Some principles of non woven fabrics, T. R. J., 30,
pp704-711, 1960.
93. Osaki S., Dielectric anisotropy of nonwoven fabrics by using the microwave method,
TAPPI, 72, p 171, 1989.
94. Krcma R., Manual o f Nonwoven Textiles, Textile Trade Press, Manchester, 1972.
95. Morton WE and Hearle JWS, Physical Properties o f Textile Fibres, The Textile
Institute, London, 1993.
96. Hearle JWS and Ozsanlav V., Nonwoven fabric studies, part 1: A theoretical model
of tensile response incorporating binder deformation, J. T. I., 70, pp 19-28, 1979.
97. Wrotnowski AC, Felt filter media, Filtration and Separation, Sept./Oct., p426-431,
1968.
98. Lambard G., et al, Theoretical and Experimental opening size of heat-bonded
geotextiles, T.R.J., April, p208-217, 1988.
" . Faur Y., et al., Theoretical and Experimental determination of the fdtration opening
size of geotextiles, 3rd International Conference on Geotextiles, Vienna, Austria,
pl275-1280, 1989.
100 . Hsieh YL and Yu B., Wetting and retention properties of fibrous materials, part 1:
Water wetting properties of woven fabrics and their constituent single fibres, T. R.
J., 62, p677—685, 1992.

241 References
101. Hsieh YL and Wu ML, Wetting characteristics of poly(p-phenylene-terephhtalamide)
single fibres and their adhesion to epoxy, J. Colloid. Interf. Sci., 144(1), p l27-144 ,
1991.102 • •. Hsieh YL, Wetting contact angle derivations of cotton assemblies with varying
perimeters, T. R. J., 64, pp553—554, 1993.103. Hsieh YL, Miller A. and Thompson J., Wetting pore structure, and liquid retention
of hydrolyzed polyester fabrics, T. R. J., 66(1), p i -10, 1996
104. Darcy H., Les fontaines publiques de la ville de Dijon, Dalmont, Paris, 1856.
105 . Kozeny J., Royal Academy o f Science, Vienna, Proc. Class 1, 136, p271, 1927.
106 . Carman PC, Flow o f Gases through Porous Media, Academic Press, New York,
1956.
107 Emersleben VO, Das darcysche filtergesetz, Phsikalische Zeitschrift, 26, p601, 1925.
108 . Brinkman HC, On the permeability of media consisting of closely packed porous
particles, Applied Scientific Research, A l, p81, 1948.
109 . Kuwabara SJ, 1959. The forces experienced by randomly distributed parallel
circular cylinder or spheres in a viscous flow at small Reynolds numbers, J. Phys.
Soc. Japan, 14, p527.
110 Iberall AS, 1950. Permeability of glass wool and other highly porous media, J. Res.
Nat. Bur Stand., 45, p398.
111. Happel J., 1959. Viscous flow relative to arrays of cylinders, J. Amer. Inst. Chem.
Eng., 5, pl73.
112. Davies CN, 1952, “The separation of airborne dust and particles”, Proc. Inst. Mech.
Eng., London, B l, p i 85-213.
113. Subramaniam V., Madhnsoothanan M. and Debnath LR, 1988, Air permeability of
blended non woven fabrics, 58, T. R. J., p677.
114. Lamb H., 1932. Hydrodynamics. (6th ed.), Cambridge University Press, London.
115. Nguyen HV and Durso DF, Absorption of water by fibre webs: An illustration of
the diffusion-type transport, TAPPI, Proceedings o f the International Dissolving
and Speciality Pulps Conference, Boston, pp l37—141, 1983

242 References
116
117
118
119
120
121
122
123
124
125
126
127
128
129
130
, Gillespie T., The capillary rise of a liquid in a vertical strip of filter paper, J. Colloid.
ScL, 14, p l2 3 —130, 1959.
Ghali K., et al, Experimental techniques for measuring parameters describing
wetting and wicking in fabrics, T.R.J., 64, p 106—111, 1993.
Shen X., An application of needle punched nonwovens in the wet press casting of
concrete, Ph.D. Thesis, University of Leeds, Leeds, UK, 1996
Ito H. and Yoichiro M., Water transport along textile fibres as measured by an
electrical capacitance technique, T.R.J., July, pp414—420, 1993.
Stay A., Die platte-kondensator methode zur measung der enlanfgeshwindigbeit,
Melliand Textilber, 46, p l427—1431, 1968.
Tagaya H., et al, Measurement of capillary rise in fabrics by electric capacitance
method, Sen-i. Gakkaishhi, 47, p422—430, 1987
Zantam RV, Geotextile and geomembrance in civil engineering, John Wiley, New
York, p i 81-192, 1986.
Adams KL, et al, Radial penetration of a viscous liquid into a planar anisotropic
porous medium, Int. J. o f Multiphase Flow, 14(2), p203—215, 1988
Adams KL, et al, In plane flow of fluids in fabrics structure, Flow Characterization,
T. R. J., 57, p647—654, 1987
Montagomery SM., Directional in-plane permeabilities of geotextile, Geotextile and
Geomembrance, 7, p275—292, 1988.
L.Van der Sluys and Diericky W., The applicability of Darcy’s Law in determining
the water permeability of geotextiles, Geotextiles and Geomembranes, 5, p283—
299, 1987.
Ogink HJM, Investigations on the hydraulic characteristics of synthetic fabrics,
Publications No. 146, Delfts Hydraulic Laboratory, 1975
Harnett PR. and Mehta PN, A survey and comparison of laboratory test methods for
measuring wicking, T. R. J., 54, p471—478, 1984.
Kissa E., Wetting and Wicking, T.R.J. 66, p660, 1996.
Chatterjee, PK, Absorbency, Elsevier, NY, 1985.

243 References
131
132
133
134
135
136
137
138
139
140
141
142
143
Johnson RE and Dettre RH, in Contact Angle, Wettability and Adhesion, Advances
in Chemistry Series, Gould RF (Eds.), 43, American Chemistry Society,
Washington, DC, 1964, p i 12.
Miller B. and Tymokin I., Spontaneous Transplanar uptake of liquids by fabrics,
T.R.J, 54, p706-p712,1983.
Miller B., Surface Characterization of Fibres and Textiles, Part II, Eds. by Schick,
MJ, Marcel Dekker, NY, 1977, p47.
Tagawa M., Gotoh K., Yasukawa A. and Ikuta M., Estimation of surface free from
energies & Hawaker constants for fibrous solids by wetting force measurements,
Colloid Polymer Science, 268, p689, 1990.
Bateup BO, Cook JR, Feldman HD and Fleischfresser BE, Wettability of wool
fibres, T. R. J., 46, 720, 1976.
Dyba RV and Miller B., Dynamic measurements of the wetting of single filaments,
T.R.J., 40, p884, 1970.
Dyba RV and Miller B., Dynamic wetting of filaments in solutions, T.R.J., 41, p978,
1971
Kamath YK, Dansizer CJ., Hornby S. and Weigmann HD, Surface wettability
scanning of long filaments by a liquid emmbrane method, T.R.J., 57, p205, 1987.
Kissa E., Detergency, Theory and Technology, Surfactant Science Ser., 20, Cutler
and Kissa E, (Eds.), Marcel Dekker, NY, 1987, p i93.
Newman AW and Good RJ, Techniques of measuring contact angles, Surface and
Colloid Science, 11, Good RJ and Stromberg PR (Eds.) Plenum Press, New York,
pp31, 1977
Bruil HG and Van Aartsen JJ, The determination of contact angles of aqueous
surfacant solutions on powders, J. Colloid and Polymer Sci., p32, 252, 1979.
Washburn EW, Phys. Rev., 17, p273, 1921.
Sarraf AH, The wetttability and wetting of textile fibres, M.Sc. Dissertation,
University of Leeds, Leeds, UK., 1985.

244 References
144
145
146
147
148
149
150
151
152
153
154
155
156
157
158
159
Hollies NRS, Kaessinger MM, Watson S. and Bogaty H., Water transport
mechanisms in textile materials, Part 1: the role of yarn roughness in capillary-type
penetration, T. R. J., 26, p829, 1956
McLaughlin JR, Trounson ME, Stewart RG and Mckinnon AJ, Surfactant solution
transport in wool yam. III. Immersion absorption, T. R. J., 58, p501, 1988.
Poiseuille JL, C.R. Acad. Sci., Paris, 11, p961, p 1041, 1840; 12, p i 12, 1841.
Lucas R., Kolloid Z , 23, p 15, 1918.
Hollies NRS, Kaessinger MM, Watson S. and Bogaty H., Water transport
mechanisms in textile materials, Part 2: capillary type penetration in yarns and
fabrics. T. R. J., 27, pp8—13, 1957.
Minor FW, Schwartz AM, Buckles LC and Wulkow EA, The migration of liquids in
textile assemblies, T. R. J., 29, p931, 1959.
Minor FW, Schwartz AM, Buckles LC and Wulkow EA, Amer. Dyestujf. Rep., 49,
p419, 1960
Peek RL and McLean DA, Ind. Eng. Chem. Anal., Ed. 6, p85,1934
Bayer LD, Soil Physics, Wiley and Sons, New York, p222, 1948.
Robinson C., Topp NE and Breakbane ME, Discussions Faraday Soc., P273, 1948.
Lord PR, A comparison of the performance of open-end and ring spun yarns in
Terry towelling, T. R. J., 44, pp516, 1973.
Fisher LR and Lark PD, An experimental study of the Washburn equation for liquid
flow in a very fine capillary, J. Colloid Interface Sci., 69, p486, 1979.
Joos P., Van Remoortere P. and Bracke M, J. Colloid Interface Sci., 136, p i89,
1990.
Jeje AA, Rates of spontaneous movement of water in capillary tubes, J. Colloid
Interface Sci., 69, p420,1979.
Hodgson KT and Berg JC, The effect of surfactants on wicking flow in fibre
networks, J. Colloid Interface Sci., 121, p22, 1988.
De Boer JJ, The wettability of scoured and dried cotton fabrics, T.R.J., 50, p624,
1980.

245 References
160
161
162
163
164
165
166
167
168
169
170
171
172
173
174
175
176
Rowland SP, Stanonis DJ and King WD, Penetration-sorption of cotton fibres
measured by immersed weight, J. Appl. Polym Sci, 25, p2229, 1980.
Rowland SP and Bertoniere NR, Some interactions of water-soluble solutes with
cellulose and Sephadex, T. R. J., 46, p770, 1976.
Stanonis DJ and Rowland SP, Interactions of Carbamates and their N-Methylol
derivatives with cotton and Sephadex, measured by gel filtration, T. R. J., 49, p72,
1979.
Yatagai M. and Komaki M., Changes of water absorbency of fabrics due to soiling
with oil, Japan Research Association o f Textile End-uses, 33, pp684—688, 1992.
Yatagai M., The influence of soiling on the water transfer characteristics of clothing
materials, Descente Sports Science, 14, pp209—216, 1993
Yatagai M., Correlation between wettability and water absorbency of soiled fabric,
T. R. J., 64, pp461—465, 1993.
Choi H., et al, Cotton nonwovens as oil spill clean-up sorbets, T. R. J., 63, pp211-
218,1993
Choksi PV, Spaeth EE and Shiff JA, INDA Technical Symposium, p29, 1977.
Rudd DF, J. Phys. Chem., 64, p i254, 1960
Bird RB, Stewart WE, and Lightfoot EN, Transport Phenomena, J. Wiley, NY,
1960
Scheidegger AE, The Physics o f Flow Through Porous Media, University ol
Toronto Press, Toronto, 1972,
Carslaw HS and Jaeger JC, Conduction o f Heat in Solids, 2nd Edition, Clarendo
Press, Oxford, 1959.
Crank J., Mathematics o f Diffusion, Clarendon Press, London, 1956, pl48.
http://www.stml.co.uk
Law WM, Water transport in Fabric, PhD Thesis, Department of Textiles,
University of Leeds, 1988
EDANA, Liquid wicking time, EDANA method 10.2-96 part C, EDANA
Recommended Test Methods, 1996.
Methods for determination of resistance to wicking and lateral leakage, BS3424-18
method 21, 1988.

246 References
177
178
179
180
181
182
183
184
185
186
187
188
189
190
191
TAPPI Routine Control Method, RC-8, TAPPI Testing method, 1950.
Cary RT, and Sproles GB, Absorbency of Terry towels: A comparative evaluation of
test methods, Text. Res. J., 1979, 49, p691-698.
Lichstein BM, Demand wettability, a new method for measuring absorbency
characteristics of fabrics, Proceedings o f 2nd Technical Symposium, Nonwoven
Product Technology, March, 1974, INDA, pl29
Laughlin RD and Davies JE, Some aspects of capillary absorption in fibrous textile
wicking, T. R. J., 31, p904, 1961.
. Bahder TB, Mathematica fo r scientists and engineers, Reading, Addison-Wesley
Pub. Co., 1995.
Aberson GM, TAPPI, 32, 1970.
Napier JD, Paper Technology, 5, p275, 1963.
Wink WA and Van den Akker J. A., TAPPI, 40, p528, 1957.
Arfledter AF, TAPPI, 1957, 40, p513.
Robinson GD, A study of the voids within the interlock structure and their influence
on thermal properties of fabric, PhD Thesis, Department of Textile Industries,
University of Leeds, 1982.
Garner W., The capillary phenomena exhibited by dye solutions and sols, J. Soc.
Dyers and Col., 49, p346, 1933.
Russell SJ and Mao N., Anisotropic fluid transmission in nonwoven wound dressing
structures, Proceedings o f 2nd Medical Textiles Int. Confer. Bolton, UK, Anand, S.
(Eds.), Bolton, 1999
IST120.2 (ASTM D5736-95), Standard Test Method for thickness of Highloft
Nonwoven Fabrics, INDA Standard Test Methods, INDA, Association of the
Nonwoven Fabrics Industry, North Carolina 27513, USA, 1998.
IST10.1 (95), Standard Test Method for Absorbency Time, Absorbency Capacity,
and Wicking Rate, INDA Standard Test Methods, INDA, Association of the
Nonwoven Fabrics Industry, North Carolina 27513, USA, 1998
Standard Test Method for Absorbency Time, Absorbency Capacity, and Wicking
Rate, ASTM , North Carolina 27513, USA, 1998.

247 References
192
193
194
195
196
197
198
199
200
201
202
203
204
205
206
. Cobb RM and Lowe DV, Tech. Assoc. Pap., 17, p213, 1933.
. Swedish Textile Research Institute, Svensk Standard, SZS 251228, 1971.
. McConnell WJ, U.S. Pat. #4,357,827 {Nov. 9, 1982)
. Miller B., Experimental Aspects of Fibre Wetting and Liquid Movement Between
Fibres, Absorbency, (Eds.), Chatterjee, PK, Elsevier, NY, 1985.
. Buras EM, et al, Measurement and theory of absorbency of cotton fabrics, T. R. J.,
20, p239—248, 1950.
. Komer W., New Results on the Water comfort of the Absorbent Synthetic Fibre
Dunoua, Chemiefasern/Textilind, 31, p i 12-116, 1981.
DeBoer JJ, The wettability of scoured and dried cotton fabrics, T. R. J., 50, p624—
631, 1980.
Lennox-Kerr PL, Super-absorbent Acrylic from Italy, Textile Inst. Ind., 19, p83-84,
1981
Tanner D., Development of textile yarns based on customer performance,
Symposium on Yarns and Yarn Manufacturing, University o f Manchester, 1979.
Gillespie T. and Johnson T., The penetration of aqueous surfactant solutions and
non-Newtonian polymer solutions into paper by capillary action, J. Colloid. Interf.
Sci., 36, p282— 255,1971.
Montgomery SM, Miller B. and Rebenfeld L., Spatial distribution of local
permeability in fibrous networks, T. R. J., 62, p 151-161, 1992.
Howaldt M. and Yoganathan AP, Laser-Doppler anemometry to study fluid
transport in fibrous assemblies, T. R. J, 53, p544-551, 1983.
Hsieh YL, Liquid transport in fabric structures, T. R. J., 65(5), p299-307, 1995.
Kawase T., Sekoguchi S., Fuju T. and Minagawa M., Spreading of liquids in textile
assemblies, Part 3: application of an image analyser system to capillary spreading of
liquids, T. R. J., 58, p306, 1988.
Harrison S., et al, An apparatus to measure the water absorption properties of fabrics
and fibre assemblies, Proceedings o f M edical Textiles Int. Confer. Bolton, UK, Ed.
Anand S., p l34— 140, 1996.

248 References
207
208
209
210
211
212
213
214
215
216
217
218
219
220
221
222
Oden JT and Tinsley J., Mechanics o f elastic structures, McGraw-Hill, London,
1967.
Golding EW and Widdis FC, (5th ed.), Electrical measurements and measuring
instruments, Sir Issac Pitman & Sons Ltd, London, 1963.
Clive NK and Slater K., Simulation of the electric field in evenness-testing
capacitors, J. T. I., 65(8), p397-401, 1974.
. Pelton WR and Slater K., Fringe effects in capacitance-type evenness testers, J. T.
/., 63(5), p295-298, 1972.
Heerens WC, Appication of capacitance techniques in sensor design, in Current
Advances in Sensors, Jones BE. (Eds.), IOP Publishing Ltd, Bristol, 1987.
Morris AS, The essence o f measurement, Prentice Hall, London, 1996.
Morris AS, Principles o f measurement and instrumentation, Prentice Hall, London,
1993.
PC30F/G handbook, (see http://www.easle.co.za/pc30fs.html)
EDR Software Development Kit (see http://www.easle.co.za/edr.html)
Russell SJ and Mao N., Apparatus and method for the assessment of in-plane
anisotropic liquid absorption in nonwoven fabrics, will be published in AUTEX
Journal, (2), 2000 (http://www.autex.org)
General Properties of Whatman Filter Paper (see http://www.whatman.com/support/
arch 4 2.html)
Moorhouse HD, Factors affecting the electrical determination of moisture content,
MSc thesis, Department of Textile Industries, University of Leeds, 1953.
Collins RE, Flow o f Fluids through Porous M aterials, Reinhold Publishing
Corporation, New York, 1961.
Muskat M., The flow o f homogenous fluids through porous media, McGraw-Hill, ,
London, 1937
Chan AW, Larive DE and Morgan RJ, Anisotropic permeability of fibre preforms:
Constant Flow Rate Measurement, J. Composite Materials, 27(10), p996, 1993.
Cuthbert D., Wood FS and Gorman JW, Fitting Equations to Data: Computer
Analysis o f Multifactor Data, Wiley, New York, 1980

249 References
223. Textiles - Test Methods for Nonwovens - Part 2: Determination of Thickness” —
ISO 9073-2:1989(E).
224. Miao L., The gas filtration properties of needlefelts, PhD Thesis, Department of
Textile Industries, University of Leeds, 1989.
225 SandoClean PC, (see http://ppp.clariant. coni/cheni/pre-set.htm)
226. Hearle JWS and Ozsanlav V., Nonwoven fabric studies, part 5: Studies of adhesive-
bonded nonwoven fabrics part 3: The determination of fibre orientation and curl, J.
T. I., 70, p487—497, 1979.
227. Kallmes OJ, Techniques for determining the fibre orientation distribution throughout
the thickness of a sheet, TAPPI, No. 52, p482—485, 1969.
228. Votava A., Practical method— measuring paper asymmetry regarding fibre
orientation, TAPPI, 65, p67, 1982.
229. Cowan WF and Cowdrey EJK, Evaluation of paper strength components by short
span tensile analysis, TAPPI, 57(2), p90, 1973.
23°. Chuleigh PW, Image formation by fibres and fibre assemblies, T.R.J., 54, pp813,
1983.
231 . Stenemur B., Method and device for monitoring fibre orientation distributions
based on light diffraction phenomenon, INDA J. Nonw. Res., 4, p42—45, 1992
232. Lee S., Effect of fibre orientation on thermal radiation in fibrous media, J. Heat
Mass Transfer, 32(2), p311, 1989.
233 . McGee SH and McCullough RL, Characterization of fibre orientation in short-fibre
composites, J. Appl. Phys., 55(1), pl394, 1983.
234. Orchard GA, The measurement of fibre orientation in card webs, J.T.I., 44, T380,
1953.
235. Tsai PP and Bresse RR, Fibre orientation distribution from electrical measurements.
Parti, theory, INDA J. Nonw. Res., 3(3), p36, 1991.
236. Tsai PP and Bresse RR, Fibre orientation distribution from electrical measurements.
Part2, instrument and experimental measurements, INDA J. Nonw. Res., 3(4), p32,
1991.
237. Chaudhray MM, MSc Dissertation, University of Manchester, 1972.

250 References
238
239
240
241
242
243
244
245
246
247
248
249
250
251
Judge SM, MSc Dissertation, University of Manchester, 1973.
. Prud’homme B., et al, determination of fibre orientation of cellulosic samples by X-
ray diffraction, J. Polym. Sci., 19, p2609, 1975.
Comparative degree of preferred orientation in nineteen wood pulps as evaluated
from X-ray diffraction patterns, TAPPI, 33, p384, 1950.
Huang XC and Bressee RR, Characteristizing nonwoven web structure using image
analysing techniques, part 2: Fibre orientation analysis in thin webs, INDA J.
Nonw. Res., No.2, pl4-21, 1993.
Pourdeyhimi B. and Nayernouri A., Assessing fibre orientation in nonwoven fabrics,
INDA J. Nonw. Res., 5, p29-36, 1993.
Pouredyhimi B. and Xu B., Charaterizing pore size in nonwoven fabrics: Shape
considerations, Int. Nonwoven J., 6(1), p26-30, 1993.
Gong RH and Newton A., Image analysis techniques Part II: The measurement of
fibre orientation in nonwoven fabrics, T. R. J., 87, p371, 1996.
Britton PN, Sampson AJ, Jr. Elliot CF, Grabben HW and Gettys WE, Computer
simulation of the technical properties of nonwoven fabrics, part 1: The method, T.
R. J., 53, p363—368, 1983.
Grindstaff TH and Hansen SM, Computer model for predicting point-bonded
nonwoven fabric strength, Part 1: T. R. J., 56, p383—388,1986.
Jirsak O., Lukas D. and Charrat R., A two-dimensional model of mechanical
properties of textiles, J. T. I., 84, p i—14, 1993.
Xu B. and Ting Y., Measuring structural characteristics of fibre segments in
nonwoven fabrics, T. R. J., 65, p41-48, 1995.
Pourdeyhimi B., Dent R. and Davis H., Measuring fibre orientation in nonwovens.
Part 3: Fourier transform, T. R. J., 67, p 143—151, 1997.
Pourdeyhimi B., Ramanathan R. and Dent R., Measuring fibre orientation in
nonwovens. Part 2: Direct tracking, T. R. J., 66, p747—753, 1996.
Pourdeyhimi B., Ramanathan R. and Dent R., Measuring fibre orientation in
nonwovens. Part 1: Simulation, T. R. J., 66, pp713—722, 1996.

251 References
252
253
254
255
256
257
258
259
260
261
262
263
264
265
Pourdeyhimi B., Dent R., Measuring fibre orientation in nonwovens. Part 4: Flow
field analysis, T. R. J., 67, p l81—187, 1997.
Komori T, Makishima K., Number of fibre-to-fibre contacts in general fibre
assemblies, T. R. J., 47, p i3 -17 , 1977.
Gilmore T., et al, Tomographic approaches to nonwovens structure definition,
National Textile Centre Annual R eport, USA, Sept., 1993.
Manual of Quantimet 570, Leica Microsystems Imaging Solutions, Cambridge, UK,
1993.
Russell SJ, The effect of rubbing on the properties of woollen slubbings, PhD
Thesis, Department of Textile Industries, University of Leeds, 1993
Simpson J. and Fiori LA, Some relationships of cotton micronaire reading and
carding parameters to card loading, sliver quality and processing performance, T. R.
J., p691, 1971.
Townend PP, Nep formation in Carding, Wira, 1982.
Simpson J., Relation between ‘minority’ hooks and neps in the card web, T. R. J.,
42, p590, 1972.
Simpson J., Sliver direction, hooked ends have significant effect on the
parallelization of cotton fibre, Textile Bulletin, 87, p39, 1974.
Hearle JWS and Sultan MAJ, A study of needled fabrics. Part 1: Experimental
methods and properties. J. T. /., 58, pp251-265, 1967.
. Hearle JWS and Sultan MAJ, A study of needled fabrics. Part 2: Effect of needling
process. J. T. /., 59, p i03-116, 1968
Qiao Q., The structure and mechanical properties of hydroentangled nonwoven
fabrics, PhD Thesis, Department of Textile Industries, University of Leeds, 1999.
Smolen A., Polypropylene, BSc Dissertation, Department of Textile Industries,
University of Leeds, 1967.
Mao N. and Russell SJ, Anisotropic characteristics of liquid absorption in nonwoven
structures, Proceedings o f 80,,i, World Conference o f the Textile Institute:
Manchester 2000, April, 2000.

252 References
266 Mao N. and Russell SJ, Directional permeability in homogeneous nonwoven
structures, Part 1: relationship between directional permeability and fibre
orientation, accepted for publication by J.T.I in 8lh March, 2000 and will published
in 91, 7. r . / . , Part 1,2000.267 •. Mao N. and Russell SJ, Directional permeability in homogeneous nonwoven
structures, Part 2: permeability in idealised structures, accepted for publication by
J.T.I in 8th March, 2000 and will published in 91, J.T.I, Part 1, 2000.
268 Sullivan RR and Hertel KL, Flow of air through porous media, J. App. Phys., 11,
p761, 1940.
269 Piekaar HW and Clarenburg LA, Aerosol filters: Pore size distribution in fibrous
filters, Chem. Eng. Sci., 22, p i 399, 1967.
270. Dent RW, The air permeability of nonwoven fabrics, J. Text. Inst., 67, p220-223,
1976.
271. Cox RG, The motion of long slender bodies in a viscous fluid, Part 1, J. Fluid
Mechanics, 44, p791-810, 1970.
272. Sangani AS and Acrivos A., Slow flow past periodic arrays of cylinders with
applications to heat transfer, Int. J. Multiphase Flow, 8, p i93-206, 1982.
273. Sparrow EM, and Loeffler AL Jr., Longitudinal laminar flow between cylinders
arranged in regular array, AIChEJ. 5, p325-330, 1959.
274. Drummond JE and Tahir MI, Laminar viscous flow through regular arrays of
parallel solid cylinders, Int. J. Multiphase Flow, 10, p515-540, 1983.
275. Sullivan RR, Specific surface measurements on compact bundles of parallel fibres,
J. App. Phys, 13, p725-730, 1942.
276. Mandel J., The Statistical Analysis o f Experimental Data, Interscience Publishers,
New York, 1963.
277Jackson GW and James DF, The Permeability of Fibrous Media, Canadian Journal
o f Chemical Engineering, 64, p363, 1986.
278. Happel J. and Brenner H., Low Reynolds Number Hydrodynamics, Noordhoft
International Publishing, Leyden, The Netherlands, 1973.

253 References
279. Wu DH, Application of image analysis in textiles, J. China Text. Inst., 3(6), p23,
1993
280. Wan TR, Image analysis techniques for the study of structural characteristics of fibre
assemblies in top manufacture. PhD Thesis, Department of Textile Industries,
University of Leeds, U.K, 1995.
281. Rushton A., The analysis of textile filter media, Separation and Filtration,
Nov./Dec., p516, 1968.
282. Nogai T. and Ihara M., Study on air permeability of fibre assemblies oriented
unidirectionary, J. Text. Mach. Soc. Japan, 26, plO, 1980.