Embed Size (px)
Citation preview

Fracture Mechanics of Concrete and Concrete Structures -Assessment, Durability, Monitoring and Retrofitting of Concrete Structures- B. H. Oh, et al. (eds)
ⓒ 2010 Korea Concrete Institute, Seoul, ISBN 978-89-5708-181-5
Effect of crack control in hybrid fiber reinforced concrete composites on corrosion rate of steel reinforcing bars
C.P. Ostertag & J. Blunt University of California, Berkeley, USA ABSTRACT: Corrosion can reduce the service life of conventionally reinforced concrete structures. This paper describes how crack control in a hybrid fiber reinforced concrete (HyFRC) which exhibits deflection hardening behavior can influence the corrosion rate of steel reinforcing bars in concrete. Plain concrete and HyFRC beams with embedded steel reinforcing bars were cycled in flexure prior to exposure to a corrosive environment. After cyclic loading, corrosion was initiated by ponding salt water on the tensile surface of the beams. Corrosion rates were determined from periodic polarization resistance and galvanic current flow measurements. The steel reinforcing bars were extracted in order to examine their surface for corrosion and calibrate potentiodynamic mass loss estimates against direct gravimetric measurements. Delay in corrosion initiation and lower active corrosion rates were observed in the HyFRC beam specimens when compared to the reinforced specimens containing plain concrete matrices cycled at same flexural load level.
1 INTRODUCTION
Unforeseen corrosion can reduce the service life of a conventionally reinforced concrete structure. The fundamental question is whether or not crack control is a viable method to influence the corrosion behavior of reinforced concrete elements. One possible solution for an enhanced degree of crack control is through fiber reinforcements. It is well documented that the inclusion of relatively small discontinuous fibers in a concrete matrix can significantly enhance the material’s crack resistance. Bond failure modes associated with corrosion are marked by the brittle cracking or spalling of the concrete matrix due to the internal expansion of the corrosion products. From an intuitive perspective, it would appear that inclusion of fiber reinforcement may be able to counterbalance the negative aspects of rebar corrosion through crack control. This paper discusses the use of a hybrid fiber reinforced concrete composites (total fiber volume fraction of 0.15) and its crack resistance on corrosion rates of embedded steel rebars. Deflection hardening was used as a performance goal in the design of the HyFRC composite (Blunt & Ostertag 2009a) because it is a typical demand associated with slab and wall elements whose large surface area of exposure can make them particularly susceptible to corosion damage. The HyFRC material used in this study was designed to meet flexural demand parameters based on constitutive assumptions that promoted a more desirable cracking mechanisms. Various researchers have explored the cracking
characteristics of fiber reinforced composites with embedded steel rebars but the effect of crack control on corrosion rate of the steel rebars have not been investigated and is the subject of this paper.
2 EXPERIMENTS
Plain and HyFRC beam specimens were used for the corrosion experiments because they provided a convenient configuration to examine the impacts of flexural load induced cracking on corrosion behavior. The HyFRC utilizes steel macrofibers and PVA microfibers. The fiber properties and mix design of the HyFRC are described in reference (Blunt & Ostertag 2009b). The specimens were wet cured for 7 days followed by 21 days of dry curing. The beams specimens (150mm x 150mm x 600mm) shown in Figure 1 were subjected to flexural loading to induce surface cracking prior to exposure to a corrosive environment.
Figure 1. Beam specimen rebar layout and orientation during casting and testing [in (mm)].

Cyclic flexural loading was carried out under deflection control; however a maximum load was specified. The load level was chosen in order to maximize cracked displacement, while not exceeding the yield strength of the rebar. A load level of 42.3 kN was chosen based on the performance of the reinforced plain concrete specimens. This load remained constant between the plain concrete and HyFRC specimens in order to approximate conditions where load based demands control their behavior. Five complete cycles of loading from 0 to the 42.3 kN load level and back were performed on 3 samples of each type of material. The results of the cyclic load tests are provided in Figure 2. The “C” designation represents the plain concrete specimens while the “H” designation represents that of the HyFRC. It is noted that per the conventions of this study, plain concrete and HyFRC refer to the matrix compositions. Due to the fact that we are exploring the corrosion behavior of rebar in these different matrices any reference to the different matrix types implies that rebar is also present in the specimens.
a)
b)
Figure 2. Cyclic flexure behavior for a) reinforced plain concrete and b) reinforced HyFRC subjected to same load level.
After cyclic loading corrosion of the rebar was induced by ponding a salt water solution in the configuration shown in Figure 3. The proposed test method is very similar to that specified in ASTM G109 with the major exceptions being that the beam element dimensions have been modified and a potentiodynamic method was used for corrosion monitoring. The ponding dams were constructed out of 3.2 mm thick PVC and where adhered to the concrete surface with a Neoprene™ super flash cement caulk. All beam surfaces not designated as an “exposed surface” (see Fig. 3) were coated with a polymeric based sealant. The intent behind the sealing method was to increase the driving force behind the solution’s intrusion into the beam matrix. The exposed bottom surface provided the only evaporation sink, which would effectively pull the solution through the matrix and create a vertical moisture gradient.
Figure 3.Beam specimen configuration for salt water ponding [in. (mm)].
The rebar surface was prepared by sandblasting
in order to remove the millscale. One end of the rebar was drilled and tapped in order to provide electrical connection through a screw and ring terminal. Both ends of the rebar were painted with a layer of moisture sealant and then wrapped with electrical tape and covered with a polyolefin heat shrink tube. The ends of the polyolefin tube were pinched closed and covered with the moisture sealant in order to prevent the ingress of moisture.
For corrosion monitoring, the electrochemical cell was created by placing a saturated calomel electrode (SCE) directly into the ponding dam (Fig. 4). The SCE was used as the reference electrode. The top most #3 (9M) rebar was used as the working electrode (WE) and the two #4 (12M) bottom bars were connected and used jointly as a counter electrode (CE). The beam elements were stored in a hot chamber at 50oC at 50% RH in between
Proceedings of FraMCoS-7, May 23-28, 2010
hThD ∇−= ),(J (1)
The proportionality coefficient D(h,T) is called moisture permeability and it is a nonlinear function of the relative humidity h and temperature T (Bažant & Najjar 1972). The moisture mass balance requires that the variation in time of the water mass per unit volume of concrete (water content w) be equal to the divergence of the moisture flux J
J•∇=∂
∂−
t
w (2)
The water content w can be expressed as the sum
of the evaporable water we (capillary water, water vapor, and adsorbed water) and the non-evaporable (chemically bound) water wn (Mills 1966, Pantazopoulo & Mills 1995). It is reasonable to assume that the evaporable water is a function of relative humidity, h, degree of hydration, αc, and degree of silica fume reaction, αs, i.e. we=we(h,αc,αs) = age-dependent sorption/desorption isotherm (Norling Mjonell 1997). Under this assumption and by substituting Equation 1 into Equation 2 one obtains
nscw
s
ew
c
ew
hh
Dt
h
h
ew
&&& ++∂
∂
∂
∂
=∇•∇+∂
∂
∂
∂
− αα
αα
)(
(3)
where ∂we/∂h is the slope of the sorption/desorption isotherm (also called moisture capacity). The governing equation (Equation 3) must be completed by appropriate boundary and initial conditions.
The relation between the amount of evaporable water and relative humidity is called ‘‘adsorption isotherm” if measured with increasing relativity humidity and ‘‘desorption isotherm” in the opposite case. Neglecting their difference (Xi et al. 1994), in the following, ‘‘sorption isotherm” will be used with reference to both sorption and desorption conditions. By the way, if the hysteresis of the moisture isotherm would be taken into account, two different relation, evaporable water vs relative humidity, must be used according to the sign of the variation of the relativity humidity. The shape of the sorption isotherm for HPC is influenced by many parameters, especially those that influence extent and rate of the chemical reactions and, in turn, determine pore structure and pore size distribution (water-to-cement ratio, cement chemical composition, SF content, curing time and method, temperature, mix additives, etc.). In the literature various formulations can be found to describe the sorption isotherm of normal concrete (Xi et al. 1994). However, in the present paper the semi-empirical expression proposed by Norling Mjornell (1997) is adopted because it
explicitly accounts for the evolution of hydration reaction and SF content. This sorption isotherm reads
( ) ( )( )
( ) ( )⎥⎥
⎦
⎤
⎢⎢
⎣
⎡
⎥⎥⎥
⎦
⎤
⎢⎢⎢
⎣
⎡
−
−∞
+
−∞
−=
1110
,1
110
11,
1,,
hcc
ge
scK
hcc
ge
scG
sch
ew
αα
αα
αα
αααα
(4)
where the first term (gel isotherm) represents the physically bound (adsorbed) water and the second term (capillary isotherm) represents the capillary water. This expression is valid only for low content of SF. The coefficient G1 represents the amount of water per unit volume held in the gel pores at 100% relative humidity, and it can be expressed (Norling Mjornell 1997) as
( ) ss
s
vgkc
c
c
vgk
scG αααα +=,1
(5)
where k
cvg and k
svg are material parameters. From the
maximum amount of water per unit volume that can fill all pores (both capillary pores and gel pores), one can calculate K1 as one obtains
( )1
110
110
11
22.0188.00
,1
−⎟⎠
⎞⎜⎝
⎛−∞
⎥⎥⎥
⎦
⎤
⎢⎢⎢
⎣
⎡⎟⎠
⎞⎜⎝
⎛−∞
−−+−
=
hcc
ge
hcc
geGs
ssc
w
scK
αα
αα
αα
αα
(6)
The material parameters k
cvg and k
svg and g1 can
be calibrated by fitting experimental data relevant to free (evaporable) water content in concrete at various ages (Di Luzio & Cusatis 2009b).
2.2 Temperature evolution
Note that, at early age, since the chemical reactions associated with cement hydration and SF reaction are exothermic, the temperature field is not uniform for non-adiabatic systems even if the environmental temperature is constant. Heat conduction can be described in concrete, at least for temperature not exceeding 100°C (Bažant & Kaplan 1996), by Fourier’s law, which reads
T∇−= λq (7)
where q is the heat flux, T is the absolute temperature, and λ is the heat conductivity; in this

corrosion monitoring periods. Evaporation of the ponded solution was mitigated by covering the ponding dams with an acrylic sheet; however it was necessary to replace the solution on a weekly basis. The old solution was completely removed by vacuuming the exposed surface and a new sodium chloride solution with the specified concentration was added.
Figure 4. Embedded cell for corrosion monitoring experiments.
Corrosion monitoring was carried out through a
series a direct current (DC), potentiodynamic measurements. Polarization resistance (PR) measurements were performed in a similar manner to that specified in ASTM G59-97. Upon removal from the hot chamber, specimens were immediately clipped in to the potentiostat and the corrosion potential (a.k.a. open circuit potential) Eoc was recorded at equilibrium. The corrosion potential Eoc and the estimated corrosion current density icorr based on the polarization resistance Rp measurements were measured periodically through an 80 week monitoring period.
3 RESULTS
3.1 Cracked corrosion beam specimens Immediately following the cyclic load tests, the tension surfaces of the beam specimens were examined in order to characterize the state of cracking. Schematics of the tensile surface cracking are shown in Figure 5.
The reinforced plain concrete specimens showed localized, transverse surface cracks ranging from 300 – 400 µm in width. Fine, longitudinal cracks (parallel to the direction of the rebar) propagated from the transverse cracks directly over the rebar and ranged in width from 70 – 100 µm. Two transverse cracks formed in the C1 specimen while one formed in both the C2 and C3 beams. This can account for the significantly greater residual displacement in the C1 specimen after load cycling.
Surface cracking was not detectable in the HyFRC specimens.
Figure 5. Beam tensile surfaces after cyclic flexure tests (dashed line represents position of the tensile rebar).
3.2 Electrochemical measurements Electrochemical data are plotted as discrete points for each specimen representing the discrete nature of the proposed monitoring technique. The continuous line represents an idealized average behavior through the discrete data points. The values for the corrosion potential Eoc and the total corrosion current density itot are given in Figures 6 and 7. The values for itot are normalized against the entire exposed surface area of the WE.
-600
-500
-400
-300
-200
-100
0
0 10 20 30 40 50∆ t [weeks]
E oc [m
V v
s. SC
E]
C1 C2 C3 Cavg
H1 H2 H3 Havg
Figure 6. Corrosion potential Eoc measurements.
0.01
0.1
1
10
100
0 10 20 30 40 50∆ t [weeks]
i tot =
B/R
p [ µ
A/c
m2 ]
C1 C2 C3 Cavg
H1 H2 H3 Havg
Figure 7. Estimated cracked beam specimen corrosion current densities.
Proceedings of FraMCoS-7, May 23-28, 2010
hThD ∇−= ),(J (1)
The proportionality coefficient D(h,T) is called moisture permeability and it is a nonlinear function of the relative humidity h and temperature T (Bažant & Najjar 1972). The moisture mass balance requires that the variation in time of the water mass per unit volume of concrete (water content w) be equal to the divergence of the moisture flux J
J•∇=∂
∂−
t
w (2)
The water content w can be expressed as the sum
of the evaporable water we (capillary water, water vapor, and adsorbed water) and the non-evaporable (chemically bound) water wn (Mills 1966, Pantazopoulo & Mills 1995). It is reasonable to assume that the evaporable water is a function of relative humidity, h, degree of hydration, αc, and degree of silica fume reaction, αs, i.e. we=we(h,αc,αs) = age-dependent sorption/desorption isotherm (Norling Mjonell 1997). Under this assumption and by substituting Equation 1 into Equation 2 one obtains
nscw
s
ew
c
ew
hh
Dt
h
h
ew
&&& ++∂
∂
∂
∂
=∇•∇+∂
∂
∂
∂
− αα
αα
)(
(3)
where ∂we/∂h is the slope of the sorption/desorption isotherm (also called moisture capacity). The governing equation (Equation 3) must be completed by appropriate boundary and initial conditions.
The relation between the amount of evaporable water and relative humidity is called ‘‘adsorption isotherm” if measured with increasing relativity humidity and ‘‘desorption isotherm” in the opposite case. Neglecting their difference (Xi et al. 1994), in the following, ‘‘sorption isotherm” will be used with reference to both sorption and desorption conditions. By the way, if the hysteresis of the moisture isotherm would be taken into account, two different relation, evaporable water vs relative humidity, must be used according to the sign of the variation of the relativity humidity. The shape of the sorption isotherm for HPC is influenced by many parameters, especially those that influence extent and rate of the chemical reactions and, in turn, determine pore structure and pore size distribution (water-to-cement ratio, cement chemical composition, SF content, curing time and method, temperature, mix additives, etc.). In the literature various formulations can be found to describe the sorption isotherm of normal concrete (Xi et al. 1994). However, in the present paper the semi-empirical expression proposed by Norling Mjornell (1997) is adopted because it
explicitly accounts for the evolution of hydration reaction and SF content. This sorption isotherm reads
( ) ( )( )
( ) ( )⎥⎥
⎦
⎤
⎢⎢
⎣
⎡
⎥⎥⎥
⎦
⎤
⎢⎢⎢
⎣
⎡
−
−∞
+
−∞
−=
1110
,1
110
11,
1,,
hcc
ge
scK
hcc
ge
scG
sch
ew
αα
αα
αα
αααα
(4)
where the first term (gel isotherm) represents the physically bound (adsorbed) water and the second term (capillary isotherm) represents the capillary water. This expression is valid only for low content of SF. The coefficient G1 represents the amount of water per unit volume held in the gel pores at 100% relative humidity, and it can be expressed (Norling Mjornell 1997) as
( ) ss
s
vgkc
c
c
vgk
scG αααα +=,1
(5)
where k
cvg and k
svg are material parameters. From the
maximum amount of water per unit volume that can fill all pores (both capillary pores and gel pores), one can calculate K1 as one obtains
( )1
110
110
11
22.0188.00
,1
−⎟⎠
⎞⎜⎝
⎛−∞
⎥⎥⎥
⎦
⎤
⎢⎢⎢
⎣
⎡⎟⎠
⎞⎜⎝
⎛−∞
−−+−
=
hcc
ge
hcc
geGs
ssc
w
scK
αα
αα
αα
αα
(6)
The material parameters k
cvg and k
svg and g1 can
be calibrated by fitting experimental data relevant to free (evaporable) water content in concrete at various ages (Di Luzio & Cusatis 2009b).
2.2 Temperature evolution
Note that, at early age, since the chemical reactions associated with cement hydration and SF reaction are exothermic, the temperature field is not uniform for non-adiabatic systems even if the environmental temperature is constant. Heat conduction can be described in concrete, at least for temperature not exceeding 100°C (Bažant & Kaplan 1996), by Fourier’s law, which reads
T∇−= λq (7)
where q is the heat flux, T is the absolute temperature, and λ is the heat conductivity; in this

Comparison between the different electrochemical monitoring techniques reveals consistency among the measurements. Specimens with more negative Eoc’s (the “C” type specimens) showed higher itot. The average difference ranges between a factor of 8-10 along the corrosion monitoring interval. Corrosion in the reinforced plain concrete specimens was significant enough such that corrosion products were visible at the crack surface. This is shown in Figure 8.
Figure 8. Reinforced plain concrete surface condition following salt water ponding (the black rectangular shape at the periphery of each specimen is the residue from the mastic caulk used to adhere the ponding dams to the concrete surface).
3.3 Mechanical performance after corrosion A series of destructive tests were conducted to characterize the material post corrosion behavior after 9 months of Cl- induced corrosion from salt water ponding. Monotonic, 4 point flexure tests were performed on 2 of the 3 samples for each material type and these results are presented in Figure 9.
Note that cyclic flexural tests (described in section 2) up to a load level of 42.3 kN (9.5 kips) were conducted on these specimens prior to salt solution ponding and that the load level was chosen so as to maximize the reinforced plain concrete cracked displacement while not exceeding the yield strength of the rebar. In Figure 10 the yield point of the rebar is highlighted as engineering design parameters (EDP) for both the reinforced plain concrete and reinforced HyFRC specimens. For both of the reinforced plain concrete specimens, the yield point of the rebar fell below the 42.3 kN (9.5 kip) mark, suggesting that significant section loss from corrosion had occurred where the rebar bridged the crack. In specimen C2, the post-yield flexural
stiffness began to flatten near a displacement demand of 3 mm so flexural testing was continued until rebar fracture occurred at an ultimate displacement of 3.1 mm.
Figure 9. Monotonic flexure tests following 9 months of salt solution ponding.
3.4 Destructive post analysis Following the flexure tests, the beam specimens underwent a series of procedures designed to determine the Cl- concentration through the depth of the specimen and to extract the corroded rebar for visual and gravimetric assessment. In order to conduct the Cl- concentration measurements 31.8φ x 76.2 mm cores were taken through the top surface of beam element adjacent to the WE. One core was taken from the central region of the beam, however for the case where visible surface cracks were present during corrosion monitoring (plain concrete specimens) two cores were taken; one adjacent to the crack and another relatively far (76.2-101.6mm) from the crack (Fig. 10). Core samples were dry cut in to 25.4 mm long segments to characterize the Cl- concentration with depth. They were then prepared and tested per ASTM C1152 for acid soluble chloride content. These results are provided in Figure 11.
Figure 10. Schematic of core extraction location in beam specimens in [mm].
Proceedings of FraMCoS-7, May 23-28, 2010
hThD ∇−= ),(J (1)
The proportionality coefficient D(h,T) is called moisture permeability and it is a nonlinear function of the relative humidity h and temperature T (Bažant & Najjar 1972). The moisture mass balance requires that the variation in time of the water mass per unit volume of concrete (water content w) be equal to the divergence of the moisture flux J
J•∇=∂
∂−
t
w (2)
The water content w can be expressed as the sum
of the evaporable water we (capillary water, water vapor, and adsorbed water) and the non-evaporable (chemically bound) water wn (Mills 1966, Pantazopoulo & Mills 1995). It is reasonable to assume that the evaporable water is a function of relative humidity, h, degree of hydration, αc, and degree of silica fume reaction, αs, i.e. we=we(h,αc,αs) = age-dependent sorption/desorption isotherm (Norling Mjonell 1997). Under this assumption and by substituting Equation 1 into Equation 2 one obtains
nscw
s
ew
c
ew
hh
Dt
h
h
ew
&&& ++∂
∂
∂
∂
=∇•∇+∂
∂
∂
∂
− αα
αα
)(
(3)
where ∂we/∂h is the slope of the sorption/desorption isotherm (also called moisture capacity). The governing equation (Equation 3) must be completed by appropriate boundary and initial conditions.
The relation between the amount of evaporable water and relative humidity is called ‘‘adsorption isotherm” if measured with increasing relativity humidity and ‘‘desorption isotherm” in the opposite case. Neglecting their difference (Xi et al. 1994), in the following, ‘‘sorption isotherm” will be used with reference to both sorption and desorption conditions. By the way, if the hysteresis of the moisture isotherm would be taken into account, two different relation, evaporable water vs relative humidity, must be used according to the sign of the variation of the relativity humidity. The shape of the sorption isotherm for HPC is influenced by many parameters, especially those that influence extent and rate of the chemical reactions and, in turn, determine pore structure and pore size distribution (water-to-cement ratio, cement chemical composition, SF content, curing time and method, temperature, mix additives, etc.). In the literature various formulations can be found to describe the sorption isotherm of normal concrete (Xi et al. 1994). However, in the present paper the semi-empirical expression proposed by Norling Mjornell (1997) is adopted because it
explicitly accounts for the evolution of hydration reaction and SF content. This sorption isotherm reads
( ) ( )( )
( ) ( )⎥⎥
⎦
⎤
⎢⎢
⎣
⎡
⎥⎥⎥
⎦
⎤
⎢⎢⎢
⎣
⎡
−
−∞
+
−∞
−=
1110
,1
110
11,
1,,
hcc
ge
scK
hcc
ge
scG
sch
ew
αα
αα
αα
αααα
(4)
where the first term (gel isotherm) represents the physically bound (adsorbed) water and the second term (capillary isotherm) represents the capillary water. This expression is valid only for low content of SF. The coefficient G1 represents the amount of water per unit volume held in the gel pores at 100% relative humidity, and it can be expressed (Norling Mjornell 1997) as
( ) ss
s
vgkc
c
c
vgk
scG αααα +=,1
(5)
where k
cvg and k
svg are material parameters. From the
maximum amount of water per unit volume that can fill all pores (both capillary pores and gel pores), one can calculate K1 as one obtains
( )1
110
110
11
22.0188.00
,1
−⎟⎠
⎞⎜⎝
⎛−∞
⎥⎥⎥
⎦
⎤
⎢⎢⎢
⎣
⎡⎟⎠
⎞⎜⎝
⎛−∞
−−+−
=
hcc
ge
hcc
geGs
ssc
w
scK
αα
αα
αα
αα
(6)
The material parameters k
cvg and k
svg and g1 can
be calibrated by fitting experimental data relevant to free (evaporable) water content in concrete at various ages (Di Luzio & Cusatis 2009b).
2.2 Temperature evolution
Note that, at early age, since the chemical reactions associated with cement hydration and SF reaction are exothermic, the temperature field is not uniform for non-adiabatic systems even if the environmental temperature is constant. Heat conduction can be described in concrete, at least for temperature not exceeding 100°C (Bažant & Kaplan 1996), by Fourier’s law, which reads
T∇−= λq (7)
where q is the heat flux, T is the absolute temperature, and λ is the heat conductivity; in this
0
0.5
1
1.5
2
2.5
3
0 1 2 3
Penetration Depth [in.]
Chl
orid
e C
onte
nt [%
wt.
of c
emen
t]C1O C2O COavg
C1X C2X CXavg
H1 H2 Havg
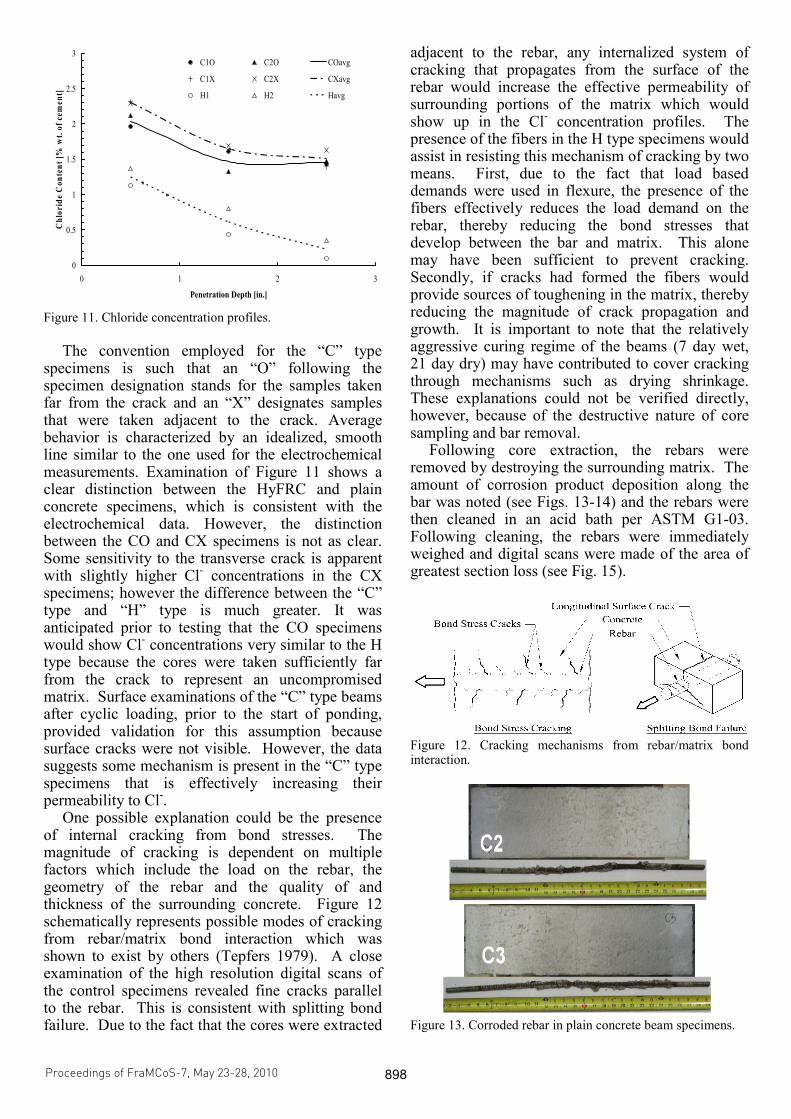
Figure 11. Chloride concentration profiles.
The convention employed for the “C” type
specimens is such that an “O” following the specimen designation stands for the samples taken far from the crack and an “X” designates samples that were taken adjacent to the crack. Average behavior is characterized by an idealized, smooth line similar to the one used for the electrochemical measurements. Examination of Figure 11 shows a clear distinction between the HyFRC and plain concrete specimens, which is consistent with the electrochemical data. However, the distinction between the CO and CX specimens is not as clear. Some sensitivity to the transverse crack is apparent with slightly higher Cl- concentrations in the CX specimens; however the difference between the “C” type and “H” type is much greater. It was anticipated prior to testing that the CO specimens would show Cl- concentrations very similar to the H type because the cores were taken sufficiently far from the crack to represent an uncompromised matrix. Surface examinations of the “C” type beams after cyclic loading, prior to the start of ponding, provided validation for this assumption because surface cracks were not visible. However, the data suggests some mechanism is present in the “C” type specimens that is effectively increasing their permeability to Cl-.
One possible explanation could be the presence of internal cracking from bond stresses. The magnitude of cracking is dependent on multiple factors which include the load on the rebar, the geometry of the rebar and the quality of and thickness of the surrounding concrete. Figure 12 schematically represents possible modes of cracking from rebar/matrix bond interaction which was shown to exist by others (Tepfers 1979). A close examination of the high resolution digital scans of the control specimens revealed fine cracks parallel to the rebar. This is consistent with splitting bond failure. Due to the fact that the cores were extracted
adjacent to the rebar, any internalized system of cracking that propagates from the surface of the rebar would increase the effective permeability of surrounding portions of the matrix which would show up in the Cl- concentration profiles. The presence of the fibers in the H type specimens would assist in resisting this mechanism of cracking by two means. First, due to the fact that load based demands were used in flexure, the presence of the fibers effectively reduces the load demand on the rebar, thereby reducing the bond stresses that develop between the bar and matrix. This alone may have been sufficient to prevent cracking. Secondly, if cracks had formed the fibers would provide sources of toughening in the matrix, thereby reducing the magnitude of crack propagation and growth. It is important to note that the relatively aggressive curing regime of the beams (7 day wet, 21 day dry) may have contributed to cover cracking through mechanisms such as drying shrinkage. These explanations could not be verified directly, however, because of the destructive nature of core sampling and bar removal.
Following core extraction, the rebars were removed by destroying the surrounding matrix. The amount of corrosion product deposition along the bar was noted (see Figs. 13-14) and the rebars were then cleaned in an acid bath per ASTM G1-03. Following cleaning, the rebars were immediately weighed and digital scans were made of the area of greatest section loss (see Fig. 15).
Figure 12. Cracking mechanisms from rebar/matrix bond interaction.
Figure 13. Corroded rebar in plain concrete beam specimens.
Proceedings of FraMCoS-7, May 23-28, 2010
hThD ∇−= ),(J (1)
The proportionality coefficient D(h,T) is called moisture permeability and it is a nonlinear function of the relative humidity h and temperature T (Bažant & Najjar 1972). The moisture mass balance requires that the variation in time of the water mass per unit volume of concrete (water content w) be equal to the divergence of the moisture flux J
J•∇=∂
∂−
t
w (2)
The water content w can be expressed as the sum
of the evaporable water we (capillary water, water vapor, and adsorbed water) and the non-evaporable (chemically bound) water wn (Mills 1966, Pantazopoulo & Mills 1995). It is reasonable to assume that the evaporable water is a function of relative humidity, h, degree of hydration, αc, and degree of silica fume reaction, αs, i.e. we=we(h,αc,αs) = age-dependent sorption/desorption isotherm (Norling Mjonell 1997). Under this assumption and by substituting Equation 1 into Equation 2 one obtains
nscw
s
ew
c
ew
hh
Dt
h
h
ew
&&& ++∂
∂
∂
∂
=∇•∇+∂
∂
∂
∂
− αα
αα
)(
(3)
where ∂we/∂h is the slope of the sorption/desorption isotherm (also called moisture capacity). The governing equation (Equation 3) must be completed by appropriate boundary and initial conditions.
The relation between the amount of evaporable water and relative humidity is called ‘‘adsorption isotherm” if measured with increasing relativity humidity and ‘‘desorption isotherm” in the opposite case. Neglecting their difference (Xi et al. 1994), in the following, ‘‘sorption isotherm” will be used with reference to both sorption and desorption conditions. By the way, if the hysteresis of the moisture isotherm would be taken into account, two different relation, evaporable water vs relative humidity, must be used according to the sign of the variation of the relativity humidity. The shape of the sorption isotherm for HPC is influenced by many parameters, especially those that influence extent and rate of the chemical reactions and, in turn, determine pore structure and pore size distribution (water-to-cement ratio, cement chemical composition, SF content, curing time and method, temperature, mix additives, etc.). In the literature various formulations can be found to describe the sorption isotherm of normal concrete (Xi et al. 1994). However, in the present paper the semi-empirical expression proposed by Norling Mjornell (1997) is adopted because it
explicitly accounts for the evolution of hydration reaction and SF content. This sorption isotherm reads
( ) ( )( )
( ) ( )⎥⎥
⎦
⎤
⎢⎢
⎣
⎡
⎥⎥⎥
⎦
⎤
⎢⎢⎢
⎣
⎡
−
−∞
+
−∞
−=
1110
,1
110
11,
1,,
hcc
ge
scK
hcc
ge
scG
sch
ew
αα
αα
αα
αααα
(4)
where the first term (gel isotherm) represents the physically bound (adsorbed) water and the second term (capillary isotherm) represents the capillary water. This expression is valid only for low content of SF. The coefficient G1 represents the amount of water per unit volume held in the gel pores at 100% relative humidity, and it can be expressed (Norling Mjornell 1997) as
( ) ss
s
vgkc
c
c
vgk
scG αααα +=,1
(5)
where k
cvg and k
svg are material parameters. From the
maximum amount of water per unit volume that can fill all pores (both capillary pores and gel pores), one can calculate K1 as one obtains
( )1
110
110
11
22.0188.00
,1
−⎟⎠
⎞⎜⎝
⎛−∞
⎥⎥⎥
⎦
⎤
⎢⎢⎢
⎣
⎡⎟⎠
⎞⎜⎝
⎛−∞
−−+−
=
hcc
ge
hcc
geGs
ssc
w
scK
αα
αα
αα
αα
(6)
The material parameters k
cvg and k
svg and g1 can
be calibrated by fitting experimental data relevant to free (evaporable) water content in concrete at various ages (Di Luzio & Cusatis 2009b).
2.2 Temperature evolution
Note that, at early age, since the chemical reactions associated with cement hydration and SF reaction are exothermic, the temperature field is not uniform for non-adiabatic systems even if the environmental temperature is constant. Heat conduction can be described in concrete, at least for temperature not exceeding 100°C (Bažant & Kaplan 1996), by Fourier’s law, which reads
T∇−= λq (7)
where q is the heat flux, T is the absolute temperature, and λ is the heat conductivity; in this
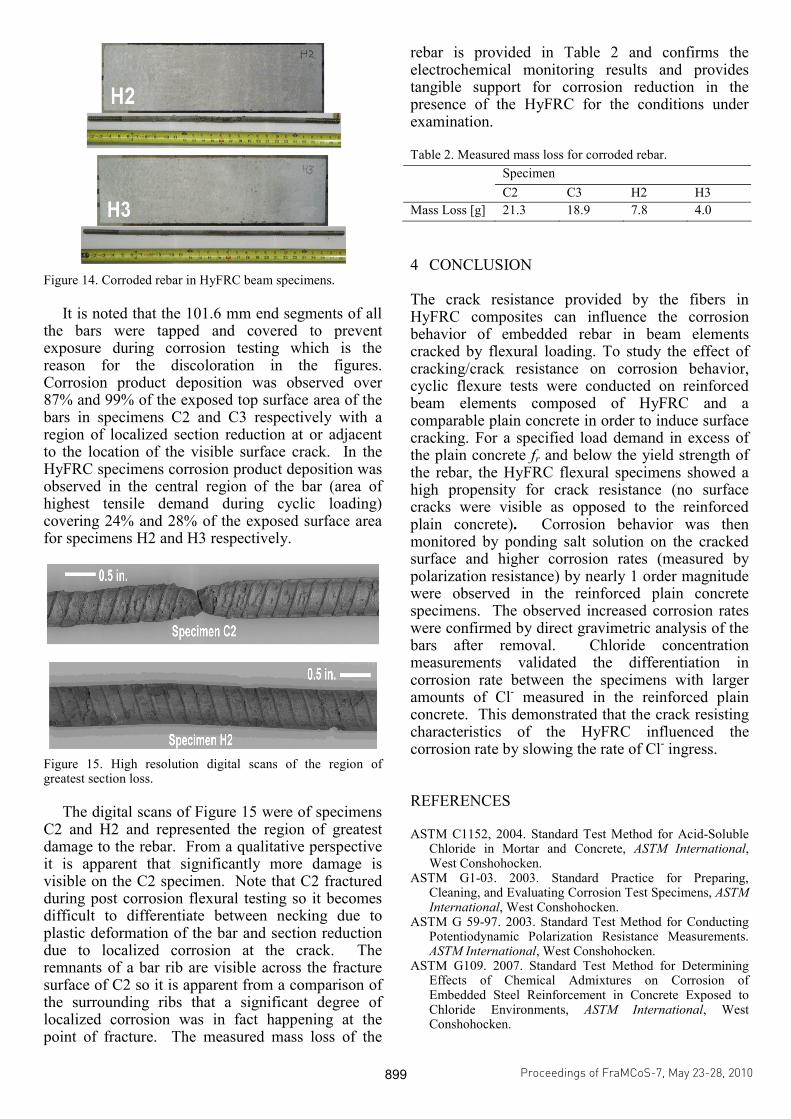
Figure 14. Corroded rebar in HyFRC beam specimens.
It is noted that the 101.6 mm end segments of all
the bars were tapped and covered to prevent exposure during corrosion testing which is the reason for the discoloration in the figures. Corrosion product deposition was observed over 87% and 99% of the exposed top surface area of the bars in specimens C2 and C3 respectively with a region of localized section reduction at or adjacent to the location of the visible surface crack. In the HyFRC specimens corrosion product deposition was observed in the central region of the bar (area of highest tensile demand during cyclic loading) covering 24% and 28% of the exposed surface area for specimens H2 and H3 respectively.
Figure 15. High resolution digital scans of the region of greatest section loss.
The digital scans of Figure 15 were of specimens
C2 and H2 and represented the region of greatest damage to the rebar. From a qualitative perspective it is apparent that significantly more damage is visible on the C2 specimen. Note that C2 fractured during post corrosion flexural testing so it becomes difficult to differentiate between necking due to plastic deformation of the bar and section reduction due to localized corrosion at the crack. The remnants of a bar rib are visible across the fracture surface of C2 so it is apparent from a comparison of the surrounding ribs that a significant degree of localized corrosion was in fact happening at the point of fracture. The measured mass loss of the
rebar is provided in Table 2 and confirms the electrochemical monitoring results and provides tangible support for corrosion reduction in the presence of the HyFRC for the conditions under examination.
Table 2. Measured mass loss for corroded rebar. Specimen C2 C3 H2 H3 Mass Loss [g] 21.3 18.9 7.8 4.0
4 CONCLUSION
The crack resistance provided by the fibers in HyFRC composites can influence the corrosion behavior of embedded rebar in beam elements cracked by flexural loading. To study the effect of cracking/crack resistance on corrosion behavior, cyclic flexure tests were conducted on reinforced beam elements composed of HyFRC and a comparable plain concrete in order to induce surface cracking. For a specified load demand in excess of the plain concrete fr and below the yield strength of the rebar, the HyFRC flexural specimens showed a high propensity for crack resistance (no surface cracks were visible as opposed to the reinforced plain concrete). Corrosion behavior was then monitored by ponding salt solution on the cracked surface and higher corrosion rates (measured by polarization resistance) by nearly 1 order magnitude were observed in the reinforced plain concrete specimens. The observed increased corrosion rates were confirmed by direct gravimetric analysis of the bars after removal. Chloride concentration measurements validated the differentiation in corrosion rate between the specimens with larger amounts of Cl- measured in the reinforced plain concrete. This demonstrated that the crack resisting characteristics of the HyFRC influenced the corrosion rate by slowing the rate of Cl- ingress.
REFERENCES
ASTM C1152, 2004. Standard Test Method for Acid-Soluble Chloride in Mortar and Concrete, ASTM International, West Conshohocken.
ASTM G1-03. 2003. Standard Practice for Preparing, Cleaning, and Evaluating Corrosion Test Specimens, ASTM International, West Conshohocken.
ASTM G 59-97. 2003. Standard Test Method for Conducting Potentiodynamic Polarization Resistance Measurements. ASTM International, West Conshohocken.
ASTM G109. 2007. Standard Test Method for Determining Effects of Chemical Admixtures on Corrosion of Embedded Steel Reinforcement in Concrete Exposed to Chloride Environments, ASTM International, West Conshohocken.
Proceedings of FraMCoS-7, May 23-28, 2010
hThD ∇−= ),(J (1)
The proportionality coefficient D(h,T) is called moisture permeability and it is a nonlinear function of the relative humidity h and temperature T (Bažant & Najjar 1972). The moisture mass balance requires that the variation in time of the water mass per unit volume of concrete (water content w) be equal to the divergence of the moisture flux J
J•∇=∂
∂−
t
w (2)
The water content w can be expressed as the sum
of the evaporable water we (capillary water, water vapor, and adsorbed water) and the non-evaporable (chemically bound) water wn (Mills 1966, Pantazopoulo & Mills 1995). It is reasonable to assume that the evaporable water is a function of relative humidity, h, degree of hydration, αc, and degree of silica fume reaction, αs, i.e. we=we(h,αc,αs) = age-dependent sorption/desorption isotherm (Norling Mjonell 1997). Under this assumption and by substituting Equation 1 into Equation 2 one obtains
nscw
s
ew
c
ew
hh
Dt
h
h
ew
&&& ++∂
∂
∂
∂
=∇•∇+∂
∂
∂
∂
− αα
αα
)(
(3)
where ∂we/∂h is the slope of the sorption/desorption isotherm (also called moisture capacity). The governing equation (Equation 3) must be completed by appropriate boundary and initial conditions.
The relation between the amount of evaporable water and relative humidity is called ‘‘adsorption isotherm” if measured with increasing relativity humidity and ‘‘desorption isotherm” in the opposite case. Neglecting their difference (Xi et al. 1994), in the following, ‘‘sorption isotherm” will be used with reference to both sorption and desorption conditions. By the way, if the hysteresis of the moisture isotherm would be taken into account, two different relation, evaporable water vs relative humidity, must be used according to the sign of the variation of the relativity humidity. The shape of the sorption isotherm for HPC is influenced by many parameters, especially those that influence extent and rate of the chemical reactions and, in turn, determine pore structure and pore size distribution (water-to-cement ratio, cement chemical composition, SF content, curing time and method, temperature, mix additives, etc.). In the literature various formulations can be found to describe the sorption isotherm of normal concrete (Xi et al. 1994). However, in the present paper the semi-empirical expression proposed by Norling Mjornell (1997) is adopted because it
explicitly accounts for the evolution of hydration reaction and SF content. This sorption isotherm reads
( ) ( )( )
( ) ( )⎥⎥
⎦
⎤
⎢⎢
⎣
⎡
⎥⎥⎥
⎦
⎤
⎢⎢⎢
⎣
⎡
−
−∞
+
−∞
−=
1110
,1
110
11,
1,,
hcc
ge
scK
hcc
ge
scG
sch
ew
αα
αα
αα
αααα
(4)
where the first term (gel isotherm) represents the physically bound (adsorbed) water and the second term (capillary isotherm) represents the capillary water. This expression is valid only for low content of SF. The coefficient G1 represents the amount of water per unit volume held in the gel pores at 100% relative humidity, and it can be expressed (Norling Mjornell 1997) as
( ) ss
s
vgkc
c
c
vgk
scG αααα +=,1
(5)
where k
cvg and k
svg are material parameters. From the
maximum amount of water per unit volume that can fill all pores (both capillary pores and gel pores), one can calculate K1 as one obtains
( )1
110
110
11
22.0188.00
,1
−⎟⎠
⎞⎜⎝
⎛−∞
⎥⎥⎥
⎦
⎤
⎢⎢⎢
⎣
⎡⎟⎠
⎞⎜⎝
⎛−∞
−−+−
=
hcc
ge
hcc
geGs
ssc
w
scK
αα
αα
αα
αα
(6)
The material parameters k
cvg and k
svg and g1 can
be calibrated by fitting experimental data relevant to free (evaporable) water content in concrete at various ages (Di Luzio & Cusatis 2009b).
2.2 Temperature evolution
Note that, at early age, since the chemical reactions associated with cement hydration and SF reaction are exothermic, the temperature field is not uniform for non-adiabatic systems even if the environmental temperature is constant. Heat conduction can be described in concrete, at least for temperature not exceeding 100°C (Bažant & Kaplan 1996), by Fourier’s law, which reads
T∇−= λq (7)
where q is the heat flux, T is the absolute temperature, and λ is the heat conductivity; in this

Blunt, J. & Ostertag, C.P. 2009a. A Performance Based Approach for the Design of a Deflection Hardened Hybrid Fiber Reinforced Concrete, ASCE Journal of Engineering Mechanics, Vol 135, pp. 978-986.
Blunt, J. & Ostertag, C.P. 2009b. Deflection Hardening and Workability of Hybrid Fiber Composites, ACI Materials Journal, Vol 106, pp. 265-272.
Tepfers, R. 1979. Cracking of Concrete Cover along Anchored Deformed Reinforcing Bars, Magazine of Concrete Research, Vol 31, pp. 3-12.
Proceedings of FraMCoS-7, May 23-28, 2010
hThD ∇−= ),(J (1)
The proportionality coefficient D(h,T) is called moisture permeability and it is a nonlinear function of the relative humidity h and temperature T (Bažant & Najjar 1972). The moisture mass balance requires that the variation in time of the water mass per unit volume of concrete (water content w) be equal to the divergence of the moisture flux J
J•∇=∂
∂−
t
w (2)
The water content w can be expressed as the sum
of the evaporable water we (capillary water, water vapor, and adsorbed water) and the non-evaporable (chemically bound) water wn (Mills 1966, Pantazopoulo & Mills 1995). It is reasonable to assume that the evaporable water is a function of relative humidity, h, degree of hydration, αc, and degree of silica fume reaction, αs, i.e. we=we(h,αc,αs) = age-dependent sorption/desorption isotherm (Norling Mjonell 1997). Under this assumption and by substituting Equation 1 into Equation 2 one obtains
nscw
s
ew
c
ew
hh
Dt
h
h
ew
&&& ++∂
∂
∂
∂
=∇•∇+∂
∂
∂
∂
− αα
αα
)(
(3)
where ∂we/∂h is the slope of the sorption/desorption isotherm (also called moisture capacity). The governing equation (Equation 3) must be completed by appropriate boundary and initial conditions.
The relation between the amount of evaporable water and relative humidity is called ‘‘adsorption isotherm” if measured with increasing relativity humidity and ‘‘desorption isotherm” in the opposite case. Neglecting their difference (Xi et al. 1994), in the following, ‘‘sorption isotherm” will be used with reference to both sorption and desorption conditions. By the way, if the hysteresis of the moisture isotherm would be taken into account, two different relation, evaporable water vs relative humidity, must be used according to the sign of the variation of the relativity humidity. The shape of the sorption isotherm for HPC is influenced by many parameters, especially those that influence extent and rate of the chemical reactions and, in turn, determine pore structure and pore size distribution (water-to-cement ratio, cement chemical composition, SF content, curing time and method, temperature, mix additives, etc.). In the literature various formulations can be found to describe the sorption isotherm of normal concrete (Xi et al. 1994). However, in the present paper the semi-empirical expression proposed by Norling Mjornell (1997) is adopted because it
explicitly accounts for the evolution of hydration reaction and SF content. This sorption isotherm reads
( ) ( )( )
( ) ( )⎥⎥
⎦
⎤
⎢⎢
⎣
⎡
⎥⎥⎥
⎦
⎤
⎢⎢⎢
⎣
⎡
−
−∞
+
−∞
−=
1110
,1
110
11,
1,,
hcc
ge
scK
hcc
ge
scG
sch
ew
αα
αα
αα
αααα
(4)
where the first term (gel isotherm) represents the physically bound (adsorbed) water and the second term (capillary isotherm) represents the capillary water. This expression is valid only for low content of SF. The coefficient G1 represents the amount of water per unit volume held in the gel pores at 100% relative humidity, and it can be expressed (Norling Mjornell 1997) as
( ) ss
s
vgkc
c
c
vgk
scG αααα +=,1
(5)
where k
cvg and k
svg are material parameters. From the
maximum amount of water per unit volume that can fill all pores (both capillary pores and gel pores), one can calculate K1 as one obtains
( )1
110
110
11
22.0188.00
,1
−⎟⎠
⎞⎜⎝
⎛−∞
⎥⎥⎥
⎦
⎤
⎢⎢⎢
⎣
⎡⎟⎠
⎞⎜⎝
⎛−∞
−−+−
=
hcc
ge
hcc
geGs
ssc
w
scK
αα
αα
αα
αα
(6)
The material parameters k
cvg and k
svg and g1 can
be calibrated by fitting experimental data relevant to free (evaporable) water content in concrete at various ages (Di Luzio & Cusatis 2009b).
2.2 Temperature evolution
Note that, at early age, since the chemical reactions associated with cement hydration and SF reaction are exothermic, the temperature field is not uniform for non-adiabatic systems even if the environmental temperature is constant. Heat conduction can be described in concrete, at least for temperature not exceeding 100°C (Bažant & Kaplan 1996), by Fourier’s law, which reads
T∇−= λq (7)
where q is the heat flux, T is the absolute temperature, and λ is the heat conductivity; in this