Embed Size (px)
Citation preview

0
Effect of Composition and Build Direction on Additively Manufactured
Hastelloy X Alloys
A Senior Project
presented to
the Faculty of the Materials Engineering Department
California Polytechnic State University, San Luis Obispo
In Partial Fulfillment
of the Requirements for the Degree
Bachelor of Science
by
Jeffrey Schloetter, Justin Spitzer, Sarah Zerga
© 2017 Schloetter, Spitzer, Zerga
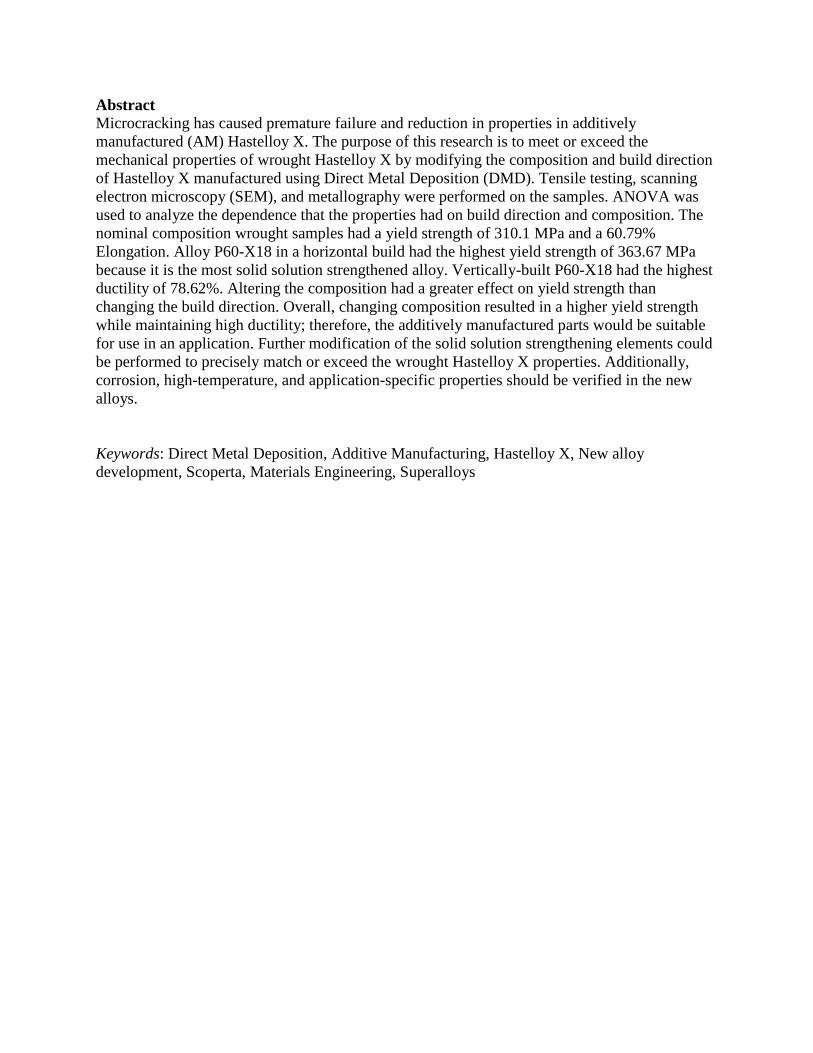
Abstract Microcracking has caused premature failure and reduction in properties in additively
manufactured (AM) Hastelloy X. The purpose of this research is to meet or exceed the
mechanical properties of wrought Hastelloy X by modifying the composition and build direction
of Hastelloy X manufactured using Direct Metal Deposition (DMD). Tensile testing, scanning
electron microscopy (SEM), and metallography were performed on the samples. ANOVA was
used to analyze the dependence that the properties had on build direction and composition. The
nominal composition wrought samples had a yield strength of 310.1 MPa and a 60.79%
Elongation. Alloy P60-X18 in a horizontal build had the highest yield strength of 363.67 MPa
because it is the most solid solution strengthened alloy. Vertically-built P60-X18 had the highest
ductility of 78.62%. Altering the composition had a greater effect on yield strength than
changing the build direction. Overall, changing composition resulted in a higher yield strength
while maintaining high ductility; therefore, the additively manufactured parts would be suitable
for use in an application. Further modification of the solid solution strengthening elements could
be performed to precisely match or exceed the wrought Hastelloy X properties. Additionally,
corrosion, high-temperature, and application-specific properties should be verified in the new
alloys.
Keywords: Direct Metal Deposition, Additive Manufacturing, Hastelloy X, New alloy
development, Scoperta, Materials Engineering, Superalloys

Acknowledgements
The authors would like to extend a special thanks to Jonathon Bracci and the rest of Scoperta for
sponsoring this project, Professor Blair London of the Cal Poly Materials Engineering
Department for his knowledge and support he provided while advising this project, Carl
Anderson of Protoquick for his assistance with machining, Professor Jeffrey Sklar of the Cal
Poly Statistics Department for his statistics help, and all those who made this project possible.
Thank you.

1 TABLE OF CONTENTS
1.0 INTRODUCTION .............................................................................................................. 1
1.1 Problem Statement ........................................................................................................... 1
1.2 Company Background ...................................................................................................... 1
1.3 Additive Manufacturing Technology ............................................................................... 2
1.3.1 Direct Metal Deposition ............................................................................................ 2
1.3.2 Selective Laser Melting ............................................................................................ 7
1.4 Hastelloy X Research ..................................................................................................... 11
1.5 Microcrack Prevention ................................................................................................... 14
1.5.1 Maximize solid solution strengthening elements .................................................... 15
1.5.2 Addition of carbides ................................................................................................ 16
1.6 Post-Processing .............................................................................................................. 17
1.6.1 Heat Treatment........................................................................................................ 17
1.6.2 Hot Isostatic Pressing (HIP).................................................................................... 19
1.7 Build Direction Effects................................................................................................... 21
2.0 EXPERIMENTAL PROCEDURE .................................................................................... 22
2.1 Composition ................................................................................................................... 22
2.2 Processing....................................................................................................................... 23
2.3 Testing ............................................................................................................................ 23
2.4 Scanning Electron Microscopy (SEM) .......................................................................... 24
2.5 Optical Microscopy ........................................................................................................ 25
3.0 RESULTS .......................................................................................................................... 25
3.1 Tensile Testing ............................................................................................................... 25
3.2 Scanning Electron Microscopy (SEM) .......................................................................... 27
3.3 Microstructural ............................................................................................................... 29
4.0 DISCUSSION .................................................................................................................... 32
4.1 Statistics ......................................................................................................................... 32
4.1.1 Yield Strength ......................................................................................................... 32
4.1.2 Ductility .................................................................................................................. 34
4.2 Composition ................................................................................................................... 35
4.3 Build Direction.................................................................................................................... 36
5.0 CONCLUSIONS................................................................................................................ 37
6.0 REFERENCES .................................................................................................................. 38

1
List of Figures
Figure 1. The laser beam, powder feed delivery system, and shielding gas are all placed in different
channels in the same nozzle assembly1.
Figure 2. The DMD nozzle is often situated on a 5-axis CNC for maximum build versatility4. .................. 4
Figure 3. The molten metal exiting the nozzle can be seen being deposited with some overlap to ensure
uniform microstructural development5. ........................................................................................................ 4
Figure 4. A large casting from a stamping press that developed cracks was repaired using DMD. The right
bottom area shows the cracked area that was machined back after DMD deposited steel was added to the
crack site6. ..................................................................................................................................................... 5
Figure 5. (a) Cross-section of the laser clad layer of Ni-Mo-Cr-Si with a thickness of ~1 mm that was
metallurgically bonded to the stainless steel 316L substrate. (b) The clad surface microstructure consisted
of primary dendrites of Mo-rich phase dispersed in softer Ni-based gamma solid solution7. ...................... 6
Figure 6. The laser clad layer displayed a far lower wear volume loss from the wear tester compared to
the SS-316L substrate7. ................................................................................................................................. 6
Figure 7. A typical selective laser melting machine cross-section consists of two hydraulic platforms, the
laser, a recoater arm, and the supplied powder8. ........................................................................................... 7
Figure 8. An example schematic for a Yb:YAG fiber laser. LD is the laser diode, L1 and L2 are the
lenses, DM is dichroic mirror, M is a concave mirror, and OC is output coupler12
. ..................................... 8
Figure 9. Normalized laser speed for two different compositions of Hastelloy X has a significant effect on
the porosity percentage of an AM component14
............................................................................................ 9
Figure 10. The balling phenomenon can occur with only a few layers of melted powder15
. ...................... 10
Figure 11. A gas atomization chamber similar to this one typically produces powder sizes within the
range of 20-150 μm16
. ................................................................................................................................. 11
Figure 12. Gas turbine combustors utilize Hastelloy X components18
. ...................................................... 12
Figure 13. A transmission electron micrograph displays the cuboidal γ’ precipitates within a γ matrix20
. 13
Figure 14. The yield strength of the nickel-based superalloy containing 20% γ’ is initially insensitive to
the temperature increase21
. .......................................................................................................................... 14
Figure 15. Scanning electron microscope images of SLM Hastelloy X25
showing: a) Fine, elongated
grains in build direction; b) Cross-section of axial grains. The images together show highly axial grains.
.................................................................................................................................................................... 17
Figure 16. The phase diagram of Hastelloy X is used to analyze equilibrium phases. The red vertical line
illustrates the nominal amount of Mo in Hastelloy X29
. ............................................................................. 18
Figure 17. Micrograph of heat treated sample indicating the dissolution of dendrites30
………………….18
Figure 18. The laves phase usually has a hexagonal crystal structure and can impair room temperature
ductility31
. .................................................................................................................................................... 19
Figure 19. TTT diagram of Hastelloy X produced based on experimental results and literature
observations. The TCP phase formation can be seen at longer time intervals32
. ........................................ 19
Figure 20. The log-log plot of stress vs. rupture life for Astroloy at 815 °C shows a reduction in strength
with the presence of σ phase . Hastelloy X would be affected similarly by the σ phase21
. ......................... 19
Figure 21. HIP has a significant effect on the densification of Hastelloy X30
. ........................................... 20
Figure 22. The fatigue stress of SLM Hastelloy X is comparable to components that have been hot
isostatic pressed25
. ....................................................................................................................................... 21
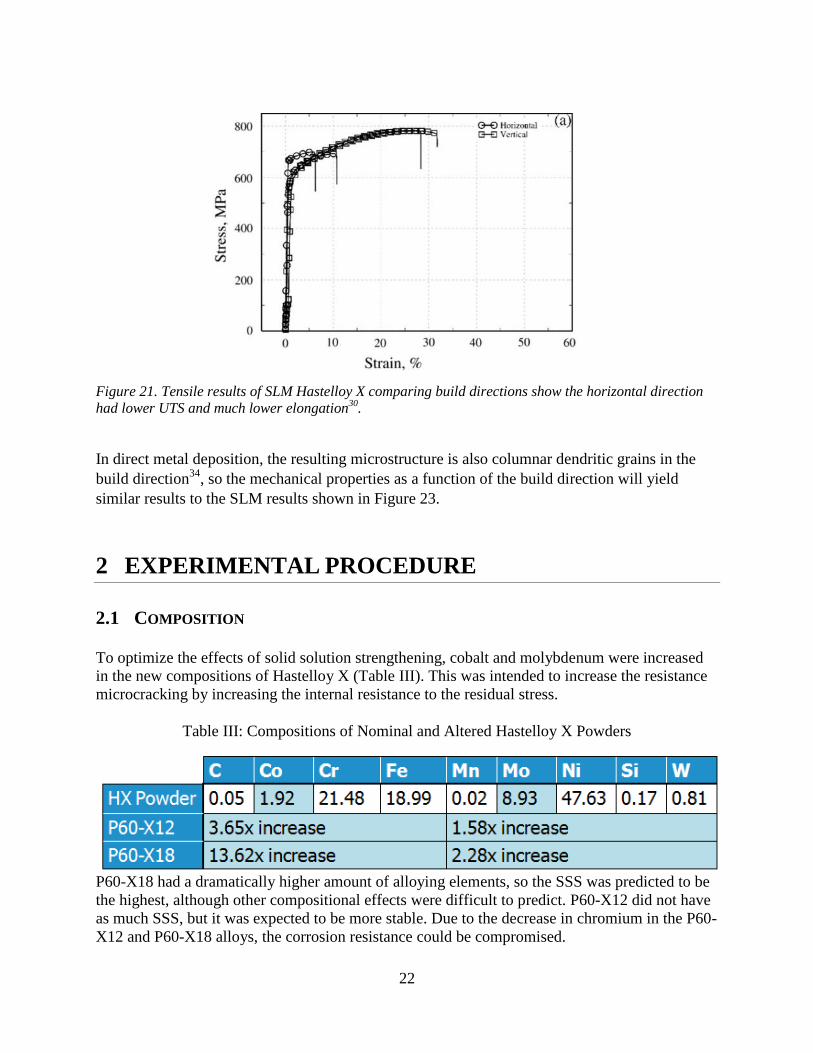
Figure 23. Tensile results of SLM Hastelloy X comparing build directions show the horizontal direction
had lower UTS and much lower elongation30
. ............................................................................................ 22
Figure 24. (a) Hastelloy X samples still attached to build plate after DMD process. (b) Finished tensile
test bars after heat treatment, surface grinding, and EDM. ......................................................................... 23

Figure 25. Test matrix of tensile tested specimens. .................................................................................... 24
Figure 26. (a) Horizontal build direction tensile testing. (b) Vertical build direction tensile testing. ........ 24
Figure 27. Stress-strain plot from tensile testing the additively manufactured and wrought samples. Each
curve shows the average of the three replications per specimen parameter. ............................................... 26
Figure 28. (a) Comparison of yield strength between all builds. (b) Comparison of ductility between all
builds. .......................................................................................................................................................... 26
Figure 29. (a) SEM image of surface of nominal composition, horizontally-built sample 2mm away from
the fracture surface. Horizontal striations exhibit processing lines and small cracks can be seen towards
the bottom of the image. (b) Fracture surface of the horizontally-built nominal sample at low
magnification. ............................................................................................................................................. 27
Figure 30. Fracture surface of the P60-X12 horizontally-built sample showing interfaces between
deposited layers indicated by the red parallel lines. .................................................................................... 28
Figure 31. Fracture surface of the P60-X12 horizontally-built sample showing (a) characteristic ductile
rupture and sigma phase precipitates and (b) porosity on the fracture surface indicated in red. ................ 28
Figure 32. (a) Vertically-built X18 sample showing large precipitates and characteristic ductile rupture.
(b) Horizontally-built X18 sample exhibiting a large crater on the fracture surface. ................................. 29
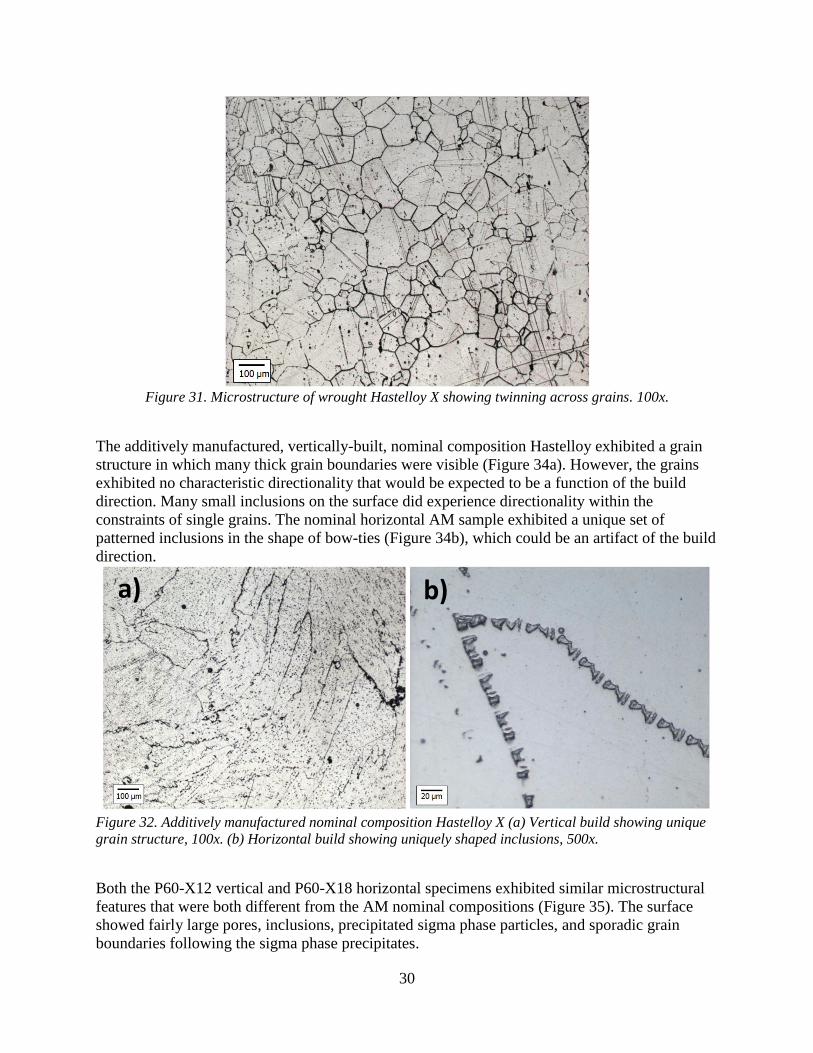
Figure 33. Microstructure of wrought Hastelloy X showing twinning across grains. 100x. ...................... 30
Figure 34. Additively manufactured nominal composition Hastelloy X (a) Vertical build showing erratic
grain structure, 100x. (b) Horizontal build showing uniquely shaped inclusions, 500x. ............................ 30
Figure 35. (a) X12 vertical build sample and (b) X18 horizontal sample showing gas porosity (circled),
sigma phase precipitates, and infrequent grain boundaries following the surface inclusions and sigma
phase zones. Grain boundaries of interest are identified by arrows. 200x and 500x, respectively. ............ 31
Figure 36. Directionality of surface inclusions in the P60-X18 horizontal sample. 200x. ......................... 31
Figure 37. General linear model results for the yield strength response variable. Both composition and
build direction were statistically significant, but the interaction between the two was not. ....................... 32
Figure 38. Main effects plot for yield strength. Composition had a greater effect on the mean yield
strength than build direction did. ................................................................................................................ 33
Figure 39. The interaction plot for yield strength shows graphically that there was no interaction effect
between the composition and build direction for yield strength since none of the lines intersect. ............. 33
Figure 40. General linear model for ductility response variable. Only the build direction was determined
to be statistically significant. ....................................................................................................................... 34
Figure 41. Main effects plot for ductility showing the great effect that build direction had on the ductility
of the Hastelloy X specimens...................................................................................................................... 34
Figure 42. Interaction plot for the ductility response variable. Even though there was an interaction effect,
it was not statistically significant. ............................................................................................................... 35
List of Tables
Table I: Hastelloy X Composition19
............................................................................................. 12
Table II: Modified Hastelloy X Alloy Compositions (wt%) ........................................................ 16
Table III: Compositions of Nominal and Altered Hastelloy X Powders ...................................... 22

1
1.0 INTRODUCTION
1.1 PROBLEM STATEMENT
Additive manufacturing (AM), specifically direct metal deposition (DMD), is an important
process for innovation in many different industries. Hastelloy X, a high strength nickel-based
superalloy used in many high-temperature aerospace and petrochemical applications, has been
researched as a suitable alloy for additive manufacturing processes. However, microcracks
present after the AM build of Hastelloy X parts have limited the performance of these parts and
caused early failure upon tensile loading. Researchers have been successful in reducing
microcracks in additively manufactured Hastelloy X by slightly altering the composition, but
there is plenty of potential to further improve AM part performance. The goal of this research is
to meet or exceed the mechanical properties such as tensile strength, yield strength, and
elongation of wrought Hastelloy X using modified compositions and alternative build directions
of the DMD Hastelloy alloy. To reach this goal, alloys with significantly altered composition,
which may increase solid solution strength (SSS), will be manufactured. This increased SSS
should contribute to a reduction in the density and severity of microcracks after the build
process. The testing and analysis will include tensile testing, scanning electron microscopy
(SEM), and metallography of the samples. This will allow for the comparison of the mechanical
properties and microstructure of AM and wrought samples.
1.2 COMPANY BACKGROUND
This project is sponsored by Scoperta (San Diego, CA), has developed advanced computational
software to design specialized alloys. This software is used to predict microstructures and
properties in new alloys in order to meet demanding material requirements. Scoperta is able to
design new alloys in months rather than years because of their cutting edge software.
Scoperta’s solutions serve the oil and gas, mining, agricultural, and power industries. The
company develops materials used in various processes, including wire welding, laser cladding,
plasma spraying, and powder metallurgy. This project is a significant step forward in the latter
process: powder metallurgy. By experimenting with AM advanced alloys, Scoperta is moving
towards an exciting and rapidly growing industry. This project examines bulk machining,
something that Scoperta has not traditionally worked in. DMD can, however, be used to produce
coatings which is an application that more closely aligns with Scoperta’s background. Most of
Scoperta’s solutions are in hardfacing cladding alloys.

2
1.3 ADDITIVE MANUFACTURING TECHNOLOGY
1.3.1 Direct Metal Deposition
Direct Metal Deposition is an additive manufacturing method that greatly differs from powder
bed manufacturing methods such as selective laser melting (SLM). DMD fits under the general
additive manufacturing category of Laser Metal Deposition (LMD), which also includes Direct
Light Fabrication (DLF) and Laser Engineered Net Shaping (LENS). Unlike SLM, where the
melting/sintering laser and the powder are in separate portions of the machine, the DMD powder
delivery and laser system are located in the same coaxial nozzle (Figure 1) at the top of the
machine. Besides powder delivery and the laser beam, a shielding gas is also distributed to the
melt pool from the nozzle. The shielding gas is often a mixture of argon and helium, and
prevents the contamination and oxidation of the molten weld pool. The shielding gas delivered
from the nozzle is also an inexpensive alternative to sealing and filling the build chamber with
inert gas, the method used for powder bed AM processes.
Figure 1. The laser beam, powder feed delivery system, and shielding gas are all placed in different
channels in the same nozzle assembly1.
3
Separate from the shielding gas, another gas flow called the “carrier gas” is also supplied to the
nozzle through the powder feel channels, which assists the flow of the powder to the nozzle
head. The carrier gas is often comprised of argon and helium. The shielding and carrier gas
component of the DMD process provides a unique challenge in which there is a delicate balance
between supplying sufficient gas pressure to drive away ambient air and not disrupting the
molten pool2. DMD can be considered as a combination of five methodologies: Laser, computer
aided design (CAD), computer aided manufacturing (CAM), sensors, and powder metallurgy.
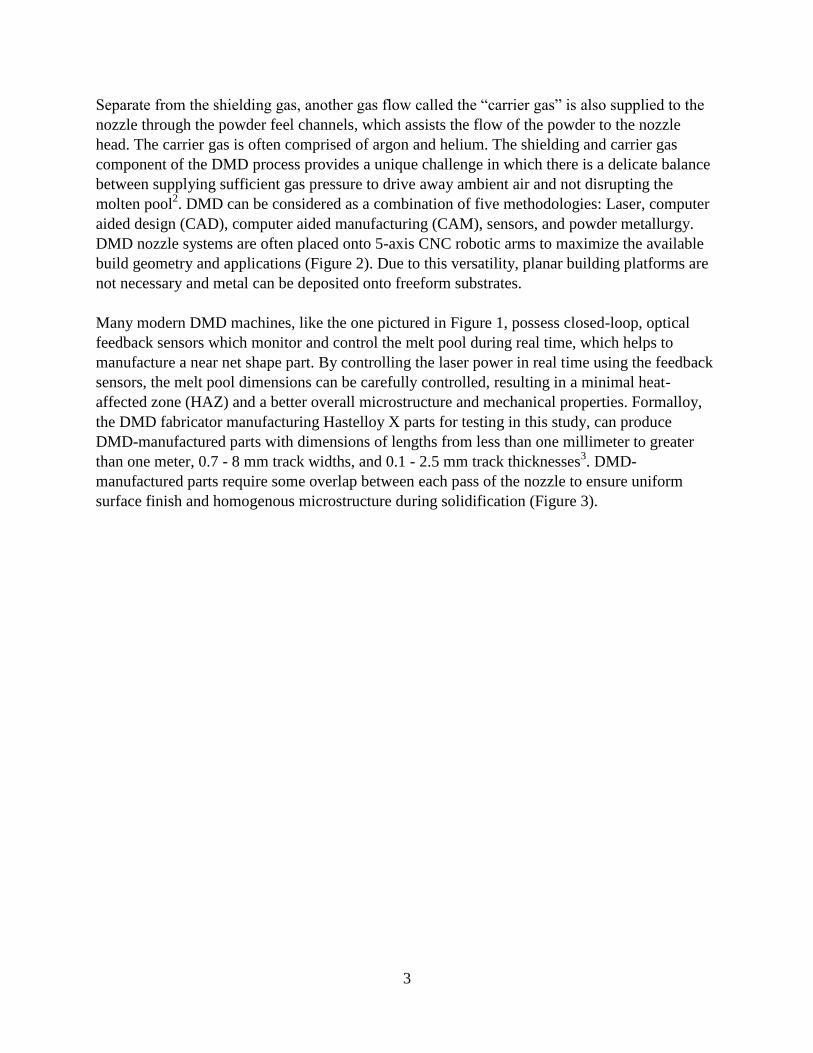
DMD nozzle systems are often placed onto 5-axis CNC robotic arms to maximize the available
build geometry and applications (Figure 2). Due to this versatility, planar building platforms are
not necessary and metal can be deposited onto freeform substrates.
Many modern DMD machines, like the one pictured in Figure 1, possess closed-loop, optical
feedback sensors which monitor and control the melt pool during real time, which helps to
manufacture a near net shape part. By controlling the laser power in real time using the feedback
sensors, the melt pool dimensions can be carefully controlled, resulting in a minimal heat-
affected zone (HAZ) and a better overall microstructure and mechanical properties. Formalloy,
the DMD fabricator manufacturing Hastelloy X parts for testing in this study, can produce
DMD-manufactured parts with dimensions of lengths from less than one millimeter to greater
than one meter, 0.7 - 8 mm track widths, and 0.1 - 2.5 mm track thicknesses3. DMD-
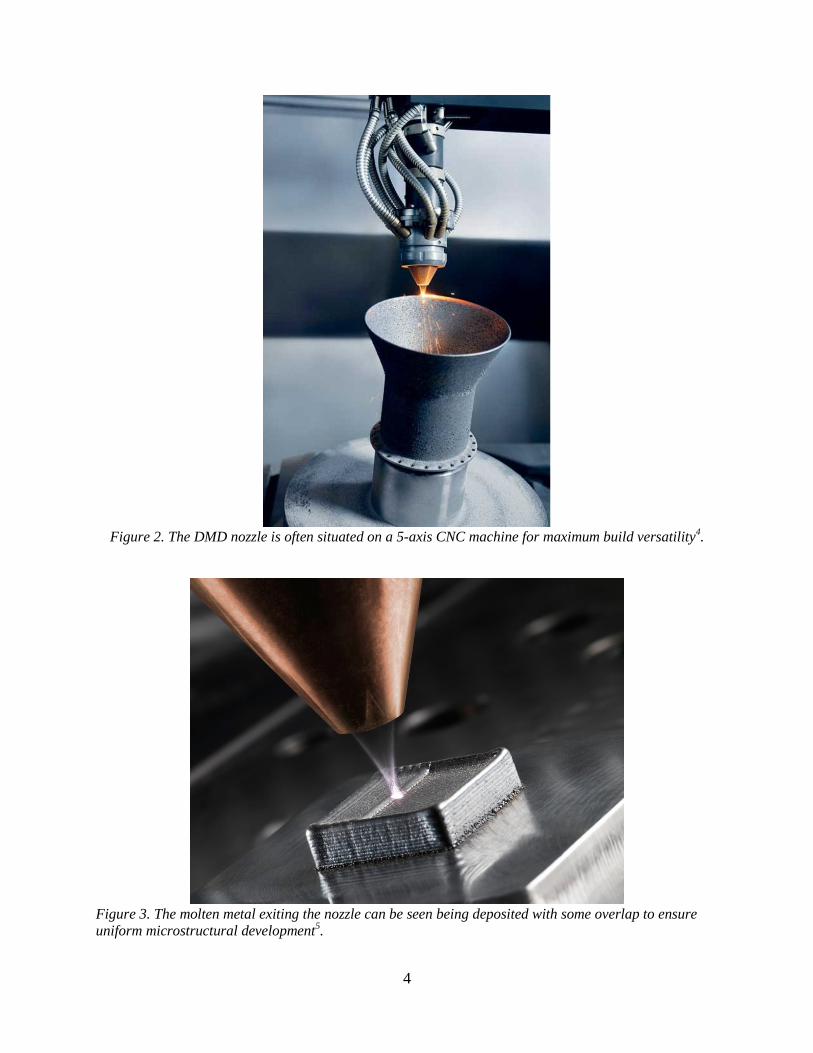
manufactured parts require some overlap between each pass of the nozzle to ensure uniform
surface finish and homogenous microstructure during solidification (Figure 3).
4
Figure 2. The DMD nozzle is often situated on a 5-axis CNC machine for maximum build versatility
4.
Figure 3. The molten metal exiting the nozzle can be seen being deposited with some overlap to ensure
uniform microstructural development5.

5
Much of the current DMD technology, such as the patented optical feedback system, was
developed by Jyotirmoy Mazumder and his engineering group as part of the Materials Science
and Engineering department at the University of Michigan2.
Besides near net fabrication of parts from the ground up similar to other additive manufacturing
technologies, the DMD process can be utilized for other applications. For worn out or damaged
components, DMD can be used to remanufacture sections of components and repair cracks by
depositing similar metal to the damaged parts. This is an especially useful application for crucial
components that are expensive to repair or have long lead times to replace, such as gas turbine
blades, bearings, seals, and large castings (Figure 4). The closed loop feedback system provides
excellent process control to ensure a fully dense microstructure in the repaired part with minimal
heat affected zone.
Figure 4. A large casting from a stamping press that developed cracks was repaired using DMD. The
right bottom area shows the cracked area that was machined back after DMD deposited steel was added
to the crack site6.
In addition to repair and remanufacture of high value components, DMD is also used in industry
for hardfacing coatings, which provide wear and/or corrosion resistance for susceptible alloys. In
many cases, DMD is used to laser clad a layer of Tribaloy, cobalt and nickel-based intermetallic
alloys with excellent wear and corrosion resistance, to the surface of cheaper bulk materials such
as stainless steel. In one such study, a nickel-based Tribaloy alloy consisting of mainly Ni, Mo,
Cr, and Si was laser clad using DMD onto the surface of a 316L substrate (Figure 5).

6
Figure 5. (a) Cross-section of the laser clad layer of Ni-Mo-Cr-Si with a thickness of ~1 mm that was
metallurgically bonded to the stainless steel 316L substrate. (b) The clad surface microstructure
consisted of primary dendrites of Mo-rich phase dispersed in softer Ni-based gamma solid solution7.
The wear resistance of the clad layer was tested and compared to the wear resistance of the SS-
316L substrate layer. The dry sliding wear resistance was evaluated using an AISI 52100
chromium steel ball with nominal hardness of approximately 850 VHN and a ball on plate
reciprocating wear tester (Figure 6).
Figure 6. The laser clad layer displayed a far lower wear volume loss from the wear tester compared to
the SS-316L substrate7.
Both the clad layer and the substrate showed a linear increase in wear volume loss with
increasing load, and the clad layer displayed lower volume loss due to less wear debris being
deposited from the clad layer compared to the greater quantity of wear particles from the SS-
316L7.

7
1.3.2 Selective Laser Melting
Much of the existing research in AM Hastelloy X has been with the selective laser melting
(SLM) process. While SLM is different than DMD, many of the same mechanisms occur in both
processes, so research into Hastelloy X manufactured with SLM will be utilized. SLM is an
additive manufacturing process that uses a high intensity laser to melt together selective regions
of metallic powder, layer by layer, to produce metal components from computer aided design
(CAD) input (Figure 7).
Figure 7. A typical selective laser melting machine cross-section consists of two hydraulic platforms, the
laser, a recoater arm, and the supplied powder8.
The selective laser melting method of additive manufacturing was first developed by Dr. M.
Fockele and Dr. D. Schwarze at the Fraunhofer Institute of Laser Technology (ILT) in 19959.
The partnership established the German company F & S Stereolithographietechnik Gmbh and
continued to work with other ILT members on developing the commercial SLM technology10
.
The patent for the technology was published in 1998. In 2001, a patent was filed for the similar
technology of direct selective laser sintering (SLS). The difference between SLS and SLM is that
sintering does not fully melt the powder, but provides just enough energy to heat up the layer of
powder to the point where the particles can fuse together. SLM, however, completely melts the
powder together into a homogenous part.
The SLM process consists of several steps, beginning with the stereolithography (STL) files. The
files must be first processed by software to provide support structures for certain features as well
as generate slice data for the particular laser scanning of individual layers for the build. The

8
building process starts with spreading a layer of powder approximately 20-50 μm thick on a
substrate plate, usually constructed of the same material as the powder, in a build chamber11
.
Once the layer of powder is laid, a high energy density laser melts selected areas according to the
processed CAD data. Laser technology has greatly increased since the conception of SLM. The
laser systems most commonly used for SLM processes have progressed from CO2 lasers first
used in SLM to solid state fiber lasers such as the Nd:YAG and Yb:YAG lasers (Figure 8). The
best laser currently used is the Yb:YAG laser because metallic powders used in SLM are more
effective at absorbing the radiation from these lasers at the wavelengths in the infrared region
given off by the Yb:YAG lasers. In addition, the Yb:YAG crystal has a lower thermal loading at
the same pump power, and is therefore more energy efficient than other laser technologies.
Figure 8. An example schematic for a Yb:YAG fiber laser. LD is the laser diode, L1 and L2 are the lenses,
DM is dichroic mirror, M is a concave mirror, and OC is output coupler12
.
Once the laser completes scanning an individual layer, the building platform is lowered and the
recoater arm lays a new layer of powder over the substrate plate and already-fused material. This
process is repeated until all scans required for the complete part are finished. The build chamber
is then opened and the part is removed from the substrate plate and cleaned of any loose powder.
The build chamber for the process is usually pumped with nitrogen or argon gas to provide an
inert atmosphere to prevent oxidation of the metal parts during the laser scanning. In addition,
some SLM machines provide a pre-heating of the substrate plate, the build chamber, and/or the
metallic powder itself to add energy to assist the fusing of the powder into a more homogenous
part.
Independent of the material used in SLM, laser and build parameters also affect the
microstructure and properties of the finished build. The average powder size, powder size
distribution, thickness of the powder, laser scanning speed, laser power, and laser hatch spacing
all affect the properties of the resulting additively manufactured parts. Research done by
Spierings et al. on AM of 316 stainless steel proved that powder distribution was found to play
an important role in the part density13
. Finer particles are easier to melt, which not only increases
the density of the final part but also process productivity (density in relation to scan speed), and
scan surface quality. As a result, higher mechanical strength can be expected.

9
In general, a lower scanning speed results in a greater densification of the part, and requires less
post-processing work such as hot isostatic pressing (HIP) (Figure 9).
Figure 9. Normalized laser speed for two different compositions of Hastelloy X has a significant effect on
the porosity percentage of an AM component14
.
It was found that smaller particle diameter sizes for 316L stainless steel powders required a
lower energy density to achieve 99% density13
. It was also documented that a lower powder layer
density, or more coarse powders, reduces the amount of energy that reaches the underlying
surface. The reduced thermal penetration prevents a fast re-melting of the layers beneath, which
does not allow thorough fusing of the layers. The inhomogeneous regions caused by the lack of
re-melting can lead to cracks, incomplete fusion, or other problems with part integrity.
Another common problem with selective laser melting of alloys is an occurrence called
“balling.” Balling is a phenomenon where the lasered molten metal “balls” up into spheres to
shrink and decrease the surface area (Figure 10). Two types of balling exist: ellipsoidal balls
500µm, and spherical balls of 10µm . The larger ellipsoidal balls have significant detrimental
effects on SLM quality. Spherical balls have little impact. Balling disrupts the formation of even,
homogeneous layers. In addition, the large metallic beading can jam up the recoater arm or cause
the recoater arm to drag the beads across the surface of the component being fabricated.

10
Figure 10. The balling phenomenon can occur with only a few layers of melted powder
15.
Since the powder used in an SLM build can have such a large effect on the resulting geometrical
and material properties of the finished part, it is crucial to utilize a controlled fabrication process
of the powder. The most common method of powder production is gas atomization. In gas
atomization, an ingot is melted in an inert atmosphere or under vacuum. The molten alloy is then
forced through a nozzle and is met with a high velocity stream of nitrogen, helium, or argon
which simultaneously breaks up the stream and solidifies the melt into fine particles (Figure 11).

11
Figure 11. A gas atomization chamber similar to this one typically produces powder sizes within the
range of 20-150 μm16
.
Powder produced from gas atomization is mostly spherical with some asymmetrical particles.
The collected powder from the process is then passed through fine mesh sieves to obtain a
desired powder uniformity and size distribution. Other commonly used powder production
methods for SLM include centrifugal atomization, plasma atomization, and water atomization16
.
1.4 HASTELLOY X RESEARCH
Hastelloy X is a nickel-based superalloy commonly used to resist corrosion in petrochemical
applications and gas turbine engines (Figure 12). While Hastelloy X does not have the highest
strength compared to other nickel-based superalloys, it is well known for its combination of
strength, corrosion resistance (due to high chromium content), and performance at high
temperatures. The composition of Hastelloy X used in this study is in Table I. Hastelloy B, the
first commercial Hastelloy, was patented in 1921 and the name was derived from the company
name, Haynes Stellite Alloys. In 1952, Hastelloy X was first used commercially in the new Pratt
& Whitney JT-3 engine to power the first Boeing 70717
.

12
Figure 12. Gas turbine combustors utilize Hastelloy X components
18.
Table I: Hastelloy X Composition19
Element Al B C Co Cr Fe Mn Mo Nb Ni Si Ti W
% 0.5 0.008 0.1 1.5 22 18 1 9 0.5 47 1 0.15 0.6
Wrought Hastelloy X exhibits a high tensile strength of 800 MPa and a percent elongation of
approximately 50% at room temperature19
. The alloy has a single phase face-centered-cubic
(FCC) nickel-based austenitic structure, called gamma (γ), that is strengthened by the addition of
alloying elements20
. Solid solution strengthening (SSS) alloying elements such as Cr, Mo, Fe,
Co, and W are gamma formers, meaning they lead to a gamma crystal structure. Within the
gamma microstructure, the lattice sites are equivalent and the SSS elements are distributed
randomly. Al, Ti, Nb, and Ta are gamma prime (γ׳) formers that are commonly used to
precipitation strengthen other nickel-based superalloys by forming the gamma prime crystal
structure. The γ׳ structure is also FCC, but the nickel is only on the faces and aluminum is on the
corners21
. Hastelloy X does not have many gamma prime formers and contains little to no γ׳,
therefore it is not the strongest nickel-based superalloy. The relatively lower strength is offset by
the high chromium content which leads it to being among the most corrosion resistant
superalloys22
.
In addition, had there been γ׳ formers, the γ׳ phase would precipitate in a cube-cube orientation
with γ, meaning the cell edges are exactly parallel. The lattice parameters are similar for γ and γ׳,
so the γ׳ will form coherent precipitates within the γ matrix (Figure 13). Dislocations have
difficulty penetrating γ׳ which leads to a significant strengthening of the alloy. Nickel-based
superalloys like Waspaloy and Astroloy have higher levels of titanium and aluminum (γ׳
formers) so they have higher strength than Hastelloy X23
.

13
Figure 13. A transmission electron micrograph displays the cuboidal γ’ precipitates within a γ matrix
20.
While the addition of molybdenum and iron increases the strength, Hastelloy X is primarily used
for its high corrosion resistance, which is due to the chromium content24
. Chromium improves
the oxidation resistance because it forms a protective Cr2O3 oxide layer on the surface. This
oxide layer is specifically known for its hot corrosion resistance. In addition, the nickel base of
the alloy allows for the retention of protective layer, especially during cyclic exposures at high
temperature such as in a turbine engine. The nickel base also ensures overall phase stability.
Boron is often added to form borides for tramp-element control and to promote grain-boundary
effects other than carbide or precipitate formation. Tramp-elements are harmful contaminants
from processing, such as silicon, phosphorous, sulfur, lead, and bismuth.
As application temperatures increase closer to 1000 °F, ordinary steels or titanium-based alloys
will lose much of their strength. Hastelloy X is the material of choice for these applications
because it maintains its strength at high temperatures. The addition of refractory elements with
high melting points, such as Cr, Mo, Nb, and W, increases the melting point of the alloy. In
addition, slip in γ and γ׳ generally occurs on the {111} <110>. If slip only occurs on that plane,
then the strength would decrease with temperature. However, γ׳ dislocations have a tendency to
cross-slip on the {100} planes that have a lower anti-phase domain boundary energy because the
energy decreases with temperature. Anti-phase domain boundary energy is the boundary energy
between the normal crystal lattice and the region where the crystals are configured in the
opposite form. It is possible for an extended dislocation to be partially on the close-packed plane
and partially on the cube plane, leading the dislocation to become locked and actually strengthen
the alloy. While Hastelloy X does not have a particularly high amount of γ׳, the presence can still
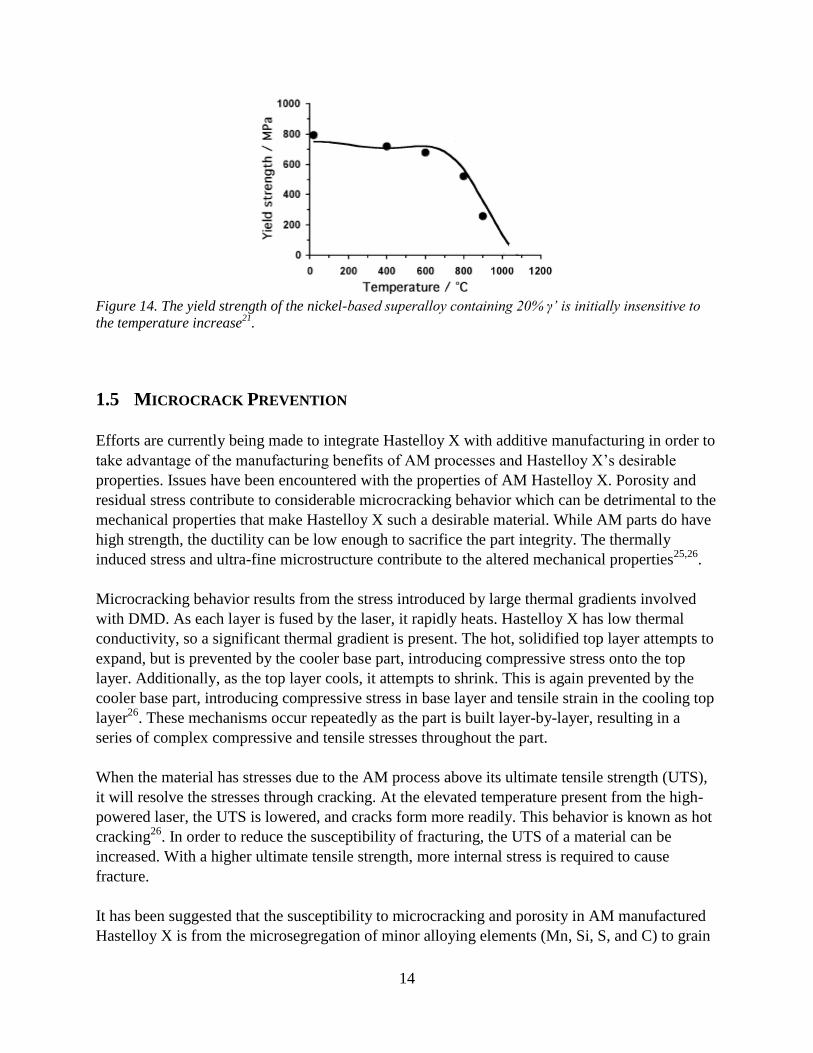
lead to strengthening at higher temperatures (Figure 14).
14
Figure 14. The yield strength of the nickel-based superalloy containing 20% γ’ is initially insensitive to
the temperature increase21
.
1.5 MICROCRACK PREVENTION
Efforts are currently being made to integrate Hastelloy X with additive manufacturing in order to
take advantage of the manufacturing benefits of AM processes and Hastelloy X’s desirable
properties. Issues have been encountered with the properties of AM Hastelloy X. Porosity and
residual stress contribute to considerable microcracking behavior which can be detrimental to the
mechanical properties that make Hastelloy X such a desirable material. While AM parts do have
high strength, the ductility can be low enough to sacrifice the part integrity. The thermally
induced stress and ultra-fine microstructure contribute to the altered mechanical properties25,26
.
Microcracking behavior results from the stress introduced by large thermal gradients involved
with DMD. As each layer is fused by the laser, it rapidly heats. Hastelloy X has low thermal
conductivity, so a significant thermal gradient is present. The hot, solidified top layer attempts to
expand, but is prevented by the cooler base part, introducing compressive stress onto the top
layer. Additionally, as the top layer cools, it attempts to shrink. This is again prevented by the
cooler base part, introducing compressive stress in base layer and tensile strain in the cooling top
layer26
. These mechanisms occur repeatedly as the part is built layer-by-layer, resulting in a
series of complex compressive and tensile stresses throughout the part.
When the material has stresses due to the AM process above its ultimate tensile strength (UTS),
it will resolve the stresses through cracking. At the elevated temperature present from the high-
powered laser, the UTS is lowered, and cracks form more readily. This behavior is known as hot
cracking26
. In order to reduce the susceptibility of fracturing, the UTS of a material can be
increased. With a higher ultimate tensile strength, more internal stress is required to cause
fracture.
It has been suggested that the susceptibility to microcracking and porosity in AM manufactured
Hastelloy X is from the microsegregation of minor alloying elements (Mn, Si, S, and C) to grain

15
boundaries when they are present in high concentrations14
. These findings were not confirmed by
Harrison et al. when the researchers performed energy dispersive spectroscopy (EDS) line scans
across microcracks in SLM Hastelloy X. The scans showed no evidence of changing alloying
element concentration across microcracks14
. Given contradicting findings about
microsegregation of alloying elements, another approach to improving part performance will be
considered.
Harrison et al. proposed a performance indicator, crack susceptibility (χ) to be indicative of the
processability of a material. χ is dependent upon the ratio of σUTS and σT (Eq. 1) where σUTS is
the UTS and σT is the thermal stress, a function of temperature, the material’s specific heat
capacity, and its coefficient of thermal expansion.
(Eq. 1)
A material is less crack susceptible as the value of χ increases and it can withstand cracking if
χ>1. The goal of this study is to improve the mechanical properties of AM Hastelloy X parts, and
being that microcracking is the behavior that detrimentally affects the properties of AM parts,
improving the crack susceptibility performance indicator, χ, is the major focus of this study’s
efforts. Given that a higher value of χ is indicative of a less crack susceptible material, and σT is
not readily changed, increasing σUTS is therefore the means by which the goal will be reached.
Additionally, the microstructure of AM Hastelloy X parts is dissimilar to wrought Hastelloy X.
These microstructural differences also contribute to performance issues, so attempts will be
made to control the microstructure and produce a DMD part microstructure similar to the
wrought microstructure of Hastelloy X. This study will be testing Hastelloy X samples that have
been compositionally modified in an attempt to address microcracking and to improve DMD part
performance. This will be done by increasing the solid solution strengthening.
1.5.1 Maximize solid solution strengthening elements
Previous studies have had success in significantly reducing crack density through improvement
of the solid solution strength (SSS) of Hastelloy X by optimizing the chemical composition
within Hastelloy X composition parameters (Table II)26
. A further decrease in crack density and
a marked improvement of mechanical properties may be possible with further alterations of the
composition. Molybdenum27
and cobalt21
are alloying elements that contribute to solid solution
strengthening. To attempt to increase the SSS and reduce microcrack susceptibility, two alloys
with increased volume fractions of cobalt and molybdenum, denoted as P60-X12 and P60-X18,
will be built with SLM and mechanically tested. P60-X18 has a much higher amount of cobalt
and molybdenum, so the SSS should be the highest. Due to the decrease in chromium in the P60-
X12 and P60-X18 alloys, there might not be as much carbide formation and the corrosion
resistance could be compromised. The compositions of alloys P60-X12, P60-X18, and the plain
Hastelloy X powder are presented in Table II.
16
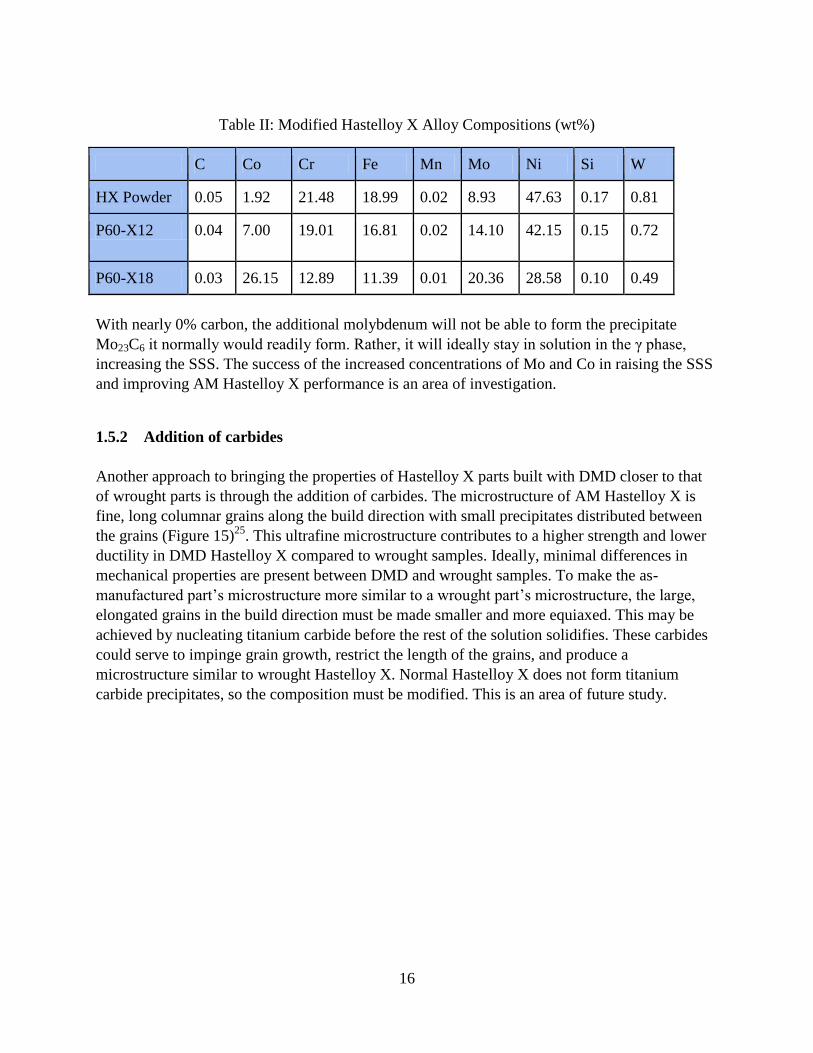
Table II: Modified Hastelloy X Alloy Compositions (wt%)
C Co Cr Fe Mn Mo Ni Si W
HX Powder 0.05 1.92 21.48 18.99 0.02 8.93 47.63 0.17 0.81
P60-X12 0.04 7.00 19.01 16.81 0.02 14.10 42.15 0.15 0.72
P60-X18 0.03 26.15 12.89 11.39 0.01 20.36 28.58 0.10 0.49
With nearly 0% carbon, the additional molybdenum will not be able to form the precipitate
Mo23C6 it normally would readily form. Rather, it will ideally stay in solution in the γ phase,
increasing the SSS. The success of the increased concentrations of Mo and Co in raising the SSS
and improving AM Hastelloy X performance is an area of investigation.
1.5.2 Addition of carbides
Another approach to bringing the properties of Hastelloy X parts built with DMD closer to that
of wrought parts is through the addition of carbides. The microstructure of AM Hastelloy X is
fine, long columnar grains along the build direction with small precipitates distributed between
the grains (Figure 15)25
. This ultrafine microstructure contributes to a higher strength and lower
ductility in DMD Hastelloy X compared to wrought samples. Ideally, minimal differences in
mechanical properties are present between DMD and wrought samples. To make the as-
manufactured part’s microstructure more similar to a wrought part’s microstructure, the large,
elongated grains in the build direction must be made smaller and more equiaxed. This may be
achieved by nucleating titanium carbide before the rest of the solution solidifies. These carbides
could serve to impinge grain growth, restrict the length of the grains, and produce a
microstructure similar to wrought Hastelloy X. Normal Hastelloy X does not form titanium
carbide precipitates, so the composition must be modified. This is an area of future study.

17
Figure 15. Scanning electron microscope images of SLM Hastelloy X25
showing: (a) Fine, elongated
grains in build direction; (b) Cross-section of axial grains. The images together show highly axial grains.
1.6 POST-PROCESSING
1.6.1 Heat Treatment
The typical heat treatment of Hastelloy X is annealing at 1175 °C in air for two hours, followed
by air cooling. It is important to rapidly heat the sample to avoid carbide precipitation. Wrought
samples are crack sensitive, so they must be heat treated to reduce forming and welding stresses.
Heat treated samples are quenched to obtain a solid-solution strengthened matrix at room
temperature28
. Heat treatment is conducted on AM samples in an effort to increase the elongation
to failure percentage. During heat treatment, the grains initially grow slowly, but increase rapidly
as the solvus temperature is approached (Figure 16).
After heat treatment, the microstructure is homogenized with dissolved dendrites (Figure 17).
Initially, refractory elements such as Ti combine with carbon to form carbides. However, during
heat treatment, the carbides decompose and form lower carbides such as M23C 6 and M6C on
grain boundaries. M represents an alloying element such as Cr, Mo, or W. These carbides also
have a FCC structure and are generally found to increase rupture strength at high temperature,
but have little effect on room temperature properties21
. These carbides will not be a prevalent
focus of this study.

18
In addition, brittle phases called topologically close-packed (TCP) phases can form during heat
treatment and the likelihood of their formation increases as the solute segregation increases.
These phases are usually platelike or needlelike phases, known as σ, μ, or Laves phase, and can
have negative effects on the mechanical properties (Figure 18). TCP is intrinsically brittle and it
can deplete the matrix from the valuable elements necessary for other properties20
. σ is the most
undesirable TCP phase and has a structure similar to the M23C6 carbides21
. Research has
documented Hastelloy X forming TCP phases above 800 °C, but this often also requires a long
heat treatment time (Figure 19). Figure 20 represents the loss of strength at high temperatures
due to the σ phase in a common nickel-based superalloy, Astroloy.
In this study, M6C carbides are expected to be present in the as-manufactured samples, and
M23C6 carbides are anticipated upon annealing. No TCP structures would appear in nominal
composition Hastelloy X under the planned heat treatments, but with changed composition, these
unexpected phases may be present.
Figure 166. The phase diagram of Hastelloy X is used
to analyze equilibrium phases. The red vertical line
illustrates the nominal amount of Mo in Hastelloy X29
.
Figure 17. Micrograph of heat treated
sample indicating the dissolution of
dendrites30
.

19
Figure 18. The log-log plot of stress vs. rupture life for Astroloy at 815 °C shows a reduction in strength
with the presence of σ phase. Hastelloy X would be affected similarly by the σ phase21
.
1.6.2 Hot Isostatic Pressing (HIP)
Hot Isostatic Pressing, or HIP, is a process commonly coupled with a heat treatment after a
component has been additively manufactured. In HIP, components are subjected to a
combination of heat and high pressure. Since the application of the high pressure is with an inert
gas, the pressure is uniform in all directions, or isostatic33
. The HIP process begins with loading
the part into the chamber. Air is evacuated from the chamber, and the pressure and temperature
begin to rise. Once the inside of the chamber has reached the target temperature and pressure, the
components are “soaked” at those conditions for approximately one to two hours. After soaking,
Figure 17. The laves phase usually has a
hexagonal crystal structure and can impair
room temperature ductility31
.
Figure 19. TTT diagram of Hastelloy X produced based on
experimental results and literature observations. The TCP
phase formation can be seen at longer time intervals32
.

20
the temperature and pressure are ramped down to normal atmospheric temperature and pressure
before the components are removed. In general, the temperature used in the HIP chamber is 80%
of the melting point of the treated alloy, and the pressure applied is approximately 150-200 MPa.
Normally, the top priority for the application of HIP is for densification of the AM component,
since a high porosity will have detrimental effects on the mechanical properties of the
components. D. Tomus et al. found that hot isostatic pressing of Hastelloy X resulted in an
improvement in densification. The as-fabricated samples had a large standard deviation range
from 99.2% to 99.8%, but HIP increased the density to more than 99.9.% (Figure 21).
Figure 19. HIP has a significant effect on the densification of Hastelloy X
30.
Additionally, after post-processing by HIP, the dislocation microstructure changes significantly.
The dislocations rearrange themselves into low angle subgrain boundaries, which leads to a
considerable drop in yield strength and rise in elongation compared to the as-fabricated state of a
component. In addition, alloying carbides segregate to the grain boundaries after HIP treatment.
HIP has a minor effect on the fatigue crack initiation life, as samples with and without HIP
treatment have comparable fatigue stress limits and cycle times (Figure 22). Generally, cracks
are less likely to initiate as a response to mechanical fatigue loading after internal defects from
porosity and microcracks are removed through densification of the component after HIP.

21
Figure 20. The S-N curve of SLM Hastelloy X is comparable to components that have been hot isostatic
pressed25
.
1.7 BUILD DIRECTION EFFECTS
Without additional processing, the as-deposited state of additive manufactured superalloys,
including Hastelloy X, will always lead to a supersaturated solid solution of columnar grains in
the build direction. As the build of a component progresses, the dendrites advance through
epitaxial growth as each new layer fuses with the partly melted layer below it, resulting in
dendrites which transcend multiple layers. The direction of the dendrites is maintained by the
build plate which acts as a large heatsink present that then forms a strong heat flux parallel and
negative to the build direction. These conditions lead to high aspect ratio columnar grains
oriented in the build direction26
. These large columnar grains do not have any visible solute
segregation at the grain boundaries.
These starkly anisotropic microstructural features lead to differences between horizontally and
vertically built tensile properties of samples. The yield strength of as-manufactured samples in
both build directions was found to be roughly the same at 600 MPa, but the elongation of
horizontally built samples were considerably lower than vertically built samples at 9% and 30%,
respectively (Figure 23)30
. These mechanical properties are significantly lower than wrought
Hastelloy X samples.
Columnar grains in vertically built SLM tensile samples lead to a lower number of grain
boundaries along the loading direction when compared to horizontally built samples. The high
amount of grain boundaries along the building direction in horizontal samples contribute to their
low ductility.
22
Figure 21. Tensile results of SLM Hastelloy X comparing build directions show the horizontal direction
had lower UTS and much lower elongation30
.
In direct metal deposition, the resulting microstructure is also columnar dendritic grains in the
build direction34
, so the mechanical properties as a function of the build direction will yield
similar results to the SLM results shown in Figure 23.
2 EXPERIMENTAL PROCEDURE
2.1 COMPOSITION
To optimize the effects of solid solution strengthening, cobalt and molybdenum were increased
in the new compositions of Hastelloy X (Table III). This was intended to increase the resistance
microcracking by increasing the internal resistance to the residual stress.
Table III: Compositions of Nominal and Altered Hastelloy X Powders
P60-X18 had a dramatically higher amount of alloying elements, so the SSS was predicted to be
the highest, although other compositional effects were difficult to predict. P60-X12 did not have
as much SSS, but it was expected to be more stable. Due to the decrease in chromium in the P60-
X12 and P60-X18 alloys, the corrosion resistance could be compromised.

23
2.2 PROCESSING
The Hastelloy X samples were additively manufactured and built horizontally and vertically on a
nominal composition Hastelloy build plate (Figure 24a). The DMD process was performed with
a deposition rate of 14.9 kg/min, laser power of 1600 W, and overlap of 50%. The powder size of
the particles was 45-125 μm and the spot size used for deposition was 2.6 mm. The samples were
first cut off of the build plate and then heat treated at 1175° C for two hours, followed by a water
quench. This heat treatment was done to resolve residual stresses, reduce anisotropic behavior,
and bring AM properties closer to those of wrought Hastelloy X. They were then surface ground
to obtain a uniform surface finish and thickness before being electrical discharge machined into
subsize tensile bars according to ASTM E8 (Figure 24b). The wrought samples also received an
optimizing heat treatment, in order to compare the samples’ best properties.
Figure 22. (a) Hastelloy X samples still attached to build plate after DMD process. (b) Finished tensile
test specimens after heat treatment, surface grinding, and EDM.
2.3 TESTING
The tensile samples were tensile tested according to ASTM E8 for subsize specimens. Specimens
were tensile tested according to the following test matrix (Figure 25).
a) b)
Vertical
Build
Vertical
Build
Horizontal Build
24
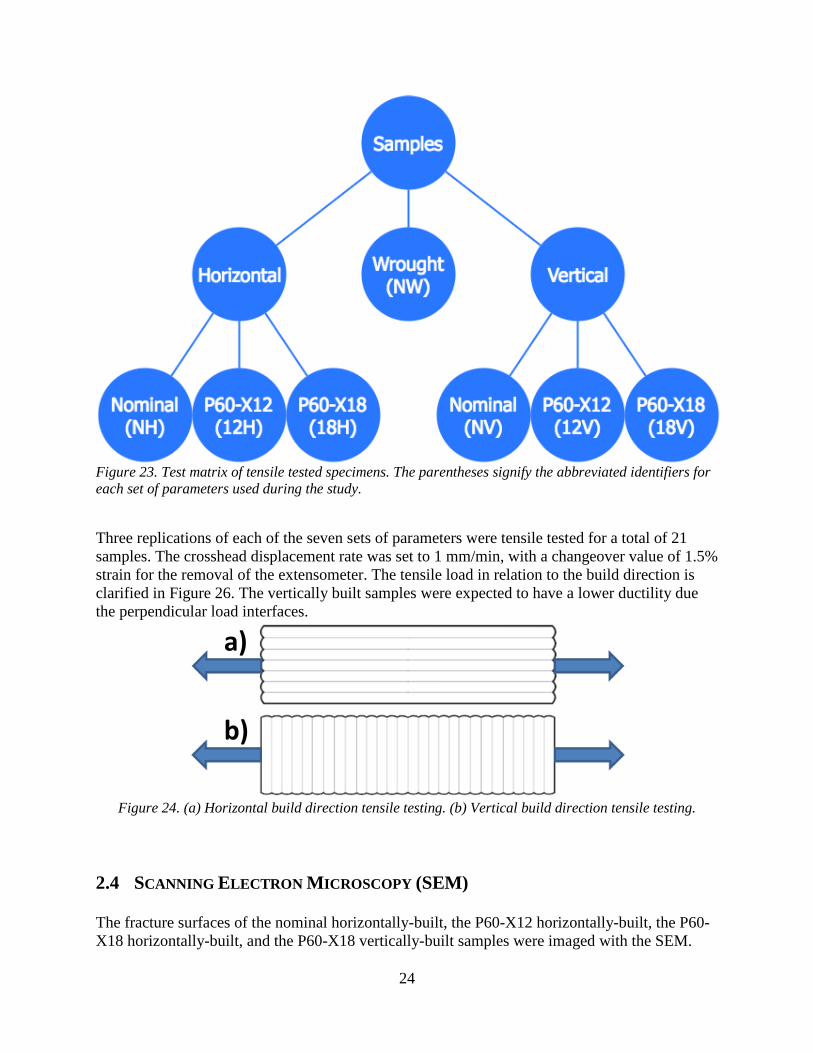
Figure 23. Test matrix of tensile tested specimens. The parentheses signify the abbreviated identifiers for
each set of parameters used during the study.
Three replications of each of the seven sets of parameters were tensile tested for a total of 21
samples. The crosshead displacement rate was set to 1 mm/min, with a changeover value of 1.5%
strain for the removal of the extensometer. The tensile load in relation to the build direction is
clarified in Figure 26. The vertically built samples were expected to have a lower ductility due
the perpendicular load interfaces.
Figure 24. (a) Horizontal build direction tensile testing. (b) Vertical build direction tensile testing.
2.4 SCANNING ELECTRON MICROSCOPY (SEM)
The fracture surfaces of the nominal horizontally-built, the P60-X12 horizontally-built, the P60-
X18 horizontally-built, and the P60-X18 vertically-built samples were imaged with the SEM.
a)
b)
25
Samples were imaged on an FEI Quanta 200. The parameters of the SEM used to image the
specimens included a 20 kV accelerating voltage in high vacuum mode and a spot size of 5. To
ensure the fractured surface of the samples would fit in the SEM chamber, a fractured half of
each imaged tensile bar was first cut into a smaller section using an abrasive cut-off saw, making
sure to keep the fracture surfaces intact.
2.5 OPTICAL MICROSCOPY
The nominal wrought, nominal horizontal, nominal vertical, P60-X12 vertical, and P60-X18
horizontal samples were used for microstructural analysis. After tensile testing, a section of the
tensile specimens was cut under the abrasive cut-off saw, into sections about 15 mm long. Each
cut segment was mounted in Bakelite, rough ground to 600 grit, and fine polished to 1 μm using
a diamond suspension. The surfaces were immersion etched using a solution of hydrochloric
acid, nitric acid, and glacial acetic acid for approximately five minutes. The specimens were
viewed under bright field optical microscopes in varying magnifications.
3 RESULTS
3.1 TENSILE TESTING
From the tensile testing data, it is evident that the increase in solid solution strengthening
elements, particularly Co and Mo, led to an increase in yield strength. The maximum yield
strength observed in the horizontally-built P60-X18 sample (Figure 27). For both of the new
compositions of Hastelloy X, P60-X12 and P60-X18, there was a higher strength in the
horizontally-built samples. However, this trend did not appear in the nominal composition AM
samples, as the vertically-built nominal sample exhibited a higher yield strength compared to its
horizontally-built counterpart. The highest yield strength average was 363.67 MPa, observed in
the P60-X18 horizontally-built sample.

26
Figure 25. Stress-strain curves from tensile testing the additively manufactured and wrought samples.
Each curve shows the average of the three replications per specimen parameter.
There was a unique trend exhibited in the data for the ductility. The higher strength, horizontally-
built P60-X12 and P60-X18 samples exhibited a much lower ductility than the vertically-built
samples. In addition, the ductility of P60-X12 and P60-X18 were nearly the same within each
build direction, meaning ductility was more dependent on build direction. The ductility of the
nominal composition had a similar ductility as the samples with altered compositions. The
greatest average ductility was 78.62% elongation exhibited by the P60-X18 vertically-built
sample. Figure 28 shows that the yield strength results depend more on composition, while the
build directions of each group of samples have a greater effect on ductility results.
Figure 26. (a) Comparison of yield strength between all builds. (b) Comparison of ductility between all
builds.
N V
H
a) b)

27
3.2 SCANNING ELECTRON MICROSCOPY (SEM)
The first SEM images obtained were of the nominal composition AM specimens (Figure 29).
These samples did not exhibit visible precipitates, and the fracture surface was characteristic of a
ductile rupture. The surface of the specimen about 2 mm away from the fracture surface shows
the horizontal propagation of cracks along parallel lines which appear to be from the surface
grinding that followed heat treatment.
Figure 27. Fracture surface of the horizontally-built nominal sample at low magnification.
The next specimen imaged was the fracture surface of the P60-X12 horizontal build. Many
features were present on the surface of this image. The images of the tensile sample fractured
surfaces confirmed the mechanism of failure to be ductile rupture. The dimples at the surface
indicate the microvoids that formed to initiate the crack that caused failure. This was the only
sample in which a clear indication of build layers was present (Figure 30). The interface between
deposited layers can be seen as a bright vertical line on the image. These interfaces are
approximately 20 μm apart, which equates to the build parameter for deposition layer thickness.
Another feature includes precipitates in the ductile cups (Figure 31a), which are likely sigma
phase precipitates. In addition, large pores can be seen on the surface that are approximately 10
μm in diameter and are likely due to the shielding gas present during the build process (Figure
31b).

28
Figure 28. Fracture surface of the P60-X12 horizontally-built sample showing interfaces between
deposited layers indicated by the red parallel lines.
Figure 29. Fracture surface of the P60-X12 horizontally-built sample showing (a) characteristic ductile
rupture and sigma phase precipitates and (b) porosity on the fracture surface indicated in red.
The P60-X18 horizontally-built and vertically-built samples exhibit similar fracture surfaces to
the X12 samples. They show a characteristic ductile rupture with fairly large precipitates seen in
the ruptured ductile cups (Figure 32a). A particularly large example of porosity was observed on
the surface of the P60-X18 horizontally-built sample (Figure 32b).
a) b)

29
Figure 30. (a) Vertically-built X18 sample showing large precipitates and characteristic ductile rupture.
(b) Horizontally-built X18 sample exhibiting a large pore on the fracture surface.
Of the fracture surfaces viewed under the SEM, horizontally-built P60-X12 was the only sample
with visible interface lines between deposited layers, although it was not expected to see these
lines in the vertically-built samples due to the orientation of the fractured surface.
3.3 MICROSTRUCTURAL
Definite contrasts were observed between the wrought Hastelloy X microstructure and the
additively manufactured samples. The microstructure of the wrought sample (Figure 33) has
fairly large equiaxed grains, approximately 100 μm across, and twinning can be observed in
many of the grains. The microstructural features of the AM samples were greatly diminished.
After etching, grains were not clearly visible, indicating the possibility of extremely small grains.
However, uniquely shaped precipitates, potentially sigma phase, were visible. Each mounted
sample prepared for metallography was viewed perpendicular to the build direction in an attempt
to view the microstructural features between two deposited layers. However, the layers were not
observable in any of the prepared AM samples.
a) b)
30
Figure 31. Microstructure of wrought Hastelloy X showing twinning across grains. 100x.
The additively manufactured, vertically-built, nominal composition Hastelloy exhibited a grain
structure in which many thick grain boundaries were visible (Figure 34a). However, the grains
exhibited no characteristic directionality that would be expected to be a function of the build
direction. Many small inclusions on the surface did experience directionality within the
constraints of single grains. The nominal horizontal AM sample exhibited a unique set of
patterned inclusions in the shape of bow-ties (Figure 34b), which could be an artifact of the build
direction.
Figure 32. Additively manufactured nominal composition Hastelloy X (a) Vertical build showing unique
grain structure, 100x. (b) Horizontal build showing uniquely shaped inclusions, 500x.
Both the P60-X12 vertical and P60-X18 horizontal specimens exhibited similar microstructural
features that were both different from the AM nominal compositions (Figure 35). The surface
showed fairly large pores, inclusions, precipitated sigma phase particles, and sporadic grain
boundaries following the sigma phase precipitates.
a) b)
31
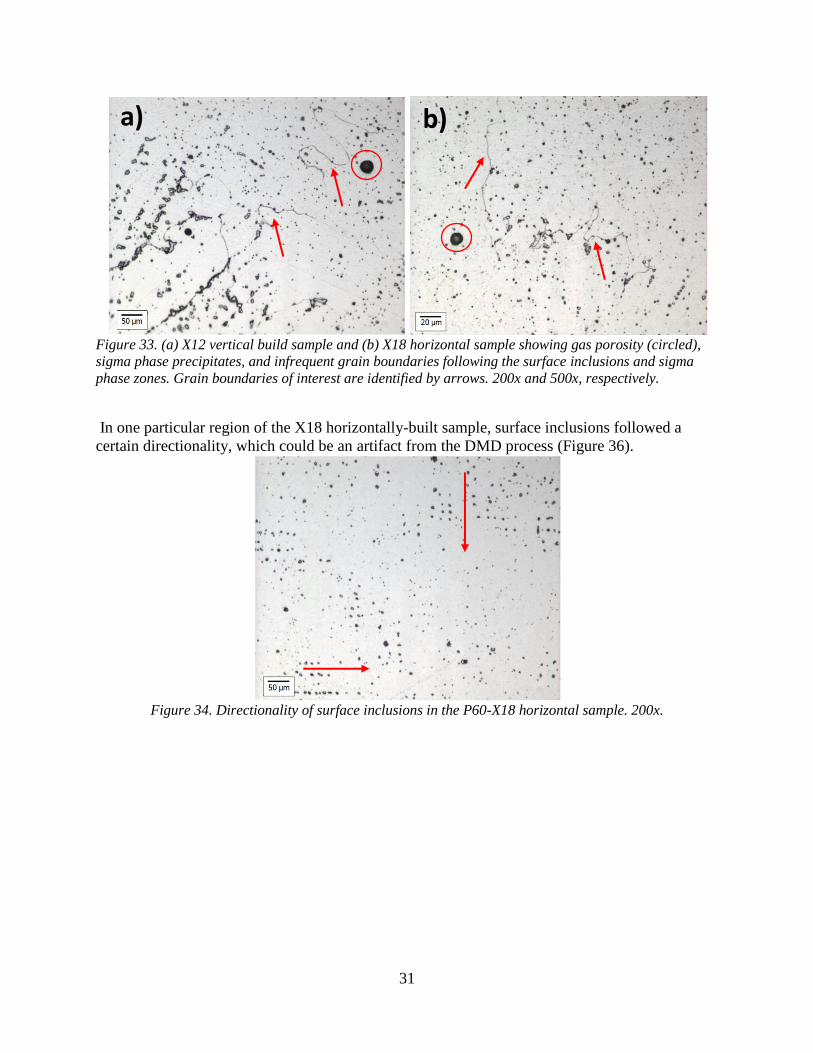
Figure 33. (a) X12 vertical build sample and (b) X18 horizontal sample showing gas porosity (circled),
sigma phase precipitates, and infrequent grain boundaries following the surface inclusions and sigma
phase zones. Grain boundaries of interest are identified by arrows. 200x and 500x, respectively.
In one particular region of the X18 horizontally-built sample, surface inclusions followed a
certain directionality, which could be an artifact from the DMD process (Figure 36).
Figure 34. Directionality of surface inclusions in the P60-X18 horizontal sample. 200x.
a) b)
32
4 DISCUSSION
4.1 STATISTICS
4.1.1 Yield Strength
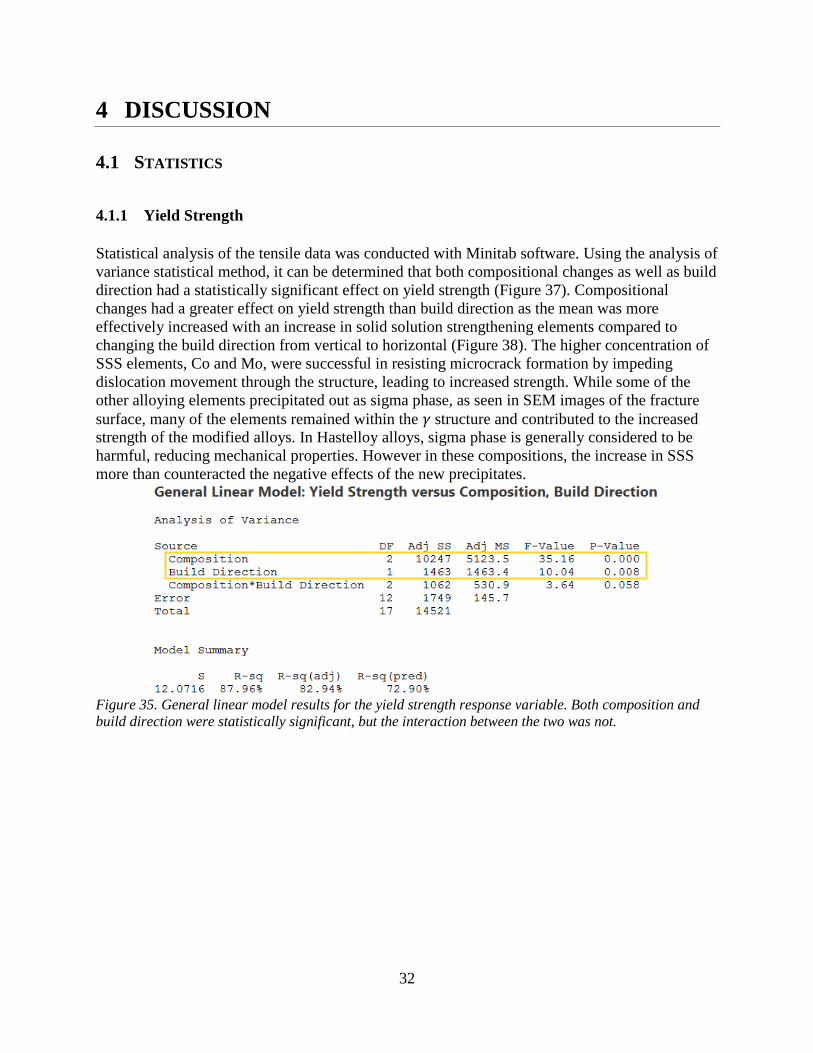
Statistical analysis of the tensile data was conducted with Minitab software. Using the analysis of
variance statistical method, it can be determined that both compositional changes as well as build
direction had a statistically significant effect on yield strength (Figure 37). Compositional
changes had a greater effect on yield strength than build direction as the mean was more
effectively increased with an increase in solid solution strengthening elements compared to
changing the build direction from vertical to horizontal (Figure 38). The higher concentration of
SSS elements, Co and Mo, were successful in resisting microcrack formation by impeding
dislocation movement through the structure, leading to increased strength. While some of the
other alloying elements precipitated out as sigma phase, as seen in SEM images of the fracture
surface, many of the elements remained within the structure and contributed to the increased
strength of the modified alloys. In Hastelloy alloys, sigma phase is generally considered to be
harmful, reducing mechanical properties. However in these compositions, the increase in SSS
more than counteracted the negative effects of the new precipitates.
Figure 35. General linear model results for the yield strength response variable. Both composition and
build direction were statistically significant, but the interaction between the two was not.

33
Figure 36. Main effects plot for yield strength. Composition had a greater effect on the mean yield
strength than build direction did.
There was not a statistically significant interaction effect between the composition and build
direction for the yield strength values (Figure 39). The utilized α level was 0.05, and the obtained
p-value for the interaction effect was 0.058. However, each variable had an individually
significant effect as the means of each variable were significantly different. The interaction plot
shows that the composition had a far greater effect on the difference in means for yield strength.
Therefore, the yield strength can be increased more effectively by changing the composition
rather than altering build direction. The DMD process combined with effective heat treatment
was successful in obtaining a fairly featureless microstructure with limited directionality or
defects at the deposition interfaces. However, the build direction effects were not entirely
eliminated by the heat treatment, as evidenced by the ductility results.
Figure 37. The interaction plot for yield strength shows graphically that there was no interaction effect
between the composition and build direction for yield strength since none of the lines intersect.

34
4.1.2 Ductility
The main effects plot for the ductility response exhibited a nearly reciprocal effect compared to
the yield strength response. However, for the elongation response variable, only the build
direction had a statistically significant effect (Figures 40, 41, 42), and compositional changes did
not significantly factor into the outcome of ductility. Generally, vertically-built samples
exhibited higher ductility than horizontally-built samples. A greater ductility was expected in the
horizontally-built samples, where the tensile load is parallel to the build layers. The actual result
may be due to how well the layers fused in the DMD process and the following heat treatment.
Additionally, large columnar grains that grow through several build layers, seen in previous
research25
may have formed. These fine, but axial grains would allow elongation to occur when
the tensile force was applied perpendicular to build direction.
Figure 38. General linear model for ductility response variable. Only the build direction was determined
to be statistically significant.
Figure 39. Main effects plot for ductility showing the great effect that build direction had on the ductility
of the Hastelloy X specimens.

35
Figure 40. Interaction plot for the ductility response variable. Even though there was an interaction
effect, it was not statistically significant.
Similar to the yield effect response, build direction and composition did not have a significant
interaction response for the ductility, although it was close. The utilized alpha value was 0.05,
and the obtained p-value was 0.051. However, build direction and composition influenced
properties independently like in the yield strength response analysis. In future tests, it would be
useful to tensile test samples directly after additive manufacturing and neglect the heat treatment
to observe if the statistical significance of the build direction changes. It would then be expected
that the microstructural interface between deposited layers would have a greater effect on the
ductility.
4.2 COMPOSITION
The effect of increasing solid solution strengthening elements is evident in the increasing yield
strength. Increasing the SSS elements was successful in increasing the matrix strength and
impedance of dislocations, which then increased the resistance to microcracking. Overall, the
addition of cobalt and molybdenum significantly raised the yield strength of the modified
Hastelloy X alloys. The nominal AM samples had a lower strength than the nominal wrought
samples, as expected, due to the problems with microcracking behavior. However, the
superiority of the DMD process was evident as the nominal AM properties were better than those
seen in literature, where SLM was used. In addition, while sigma phase was formed in the P60-
X12 and P60-X18 alloys, the increase in strength due to the SSS elements far surpassed the
negative effects of the sigma phases. The sigma phase was not present in the nominal samples, as
the heat treatment was not long enough for formation (Figure 18). The significantly altered
compositions of P60-X12 and P60-X18 likely shifted the TTT curves to allow for new phase
formation at shorter times than standard Hastelloy X. This allowed the modified alloys to form
sigma phase when nominal AM samples did not, even when all the AM samples were subjected
to an identical deposition environment and heat treatment.

36
Compositional changes had little impact on ductility behavior and ANOVA shows that these
changes were not statistically significant. This shows that any precipitate formation had little or
no impact on the ductility behavior, although SEM fractography showed that rupture initiated
with precipitates in the ductile cups. Even higher ductility may be possible if the precipitates
were eliminated. Additionally, this shows that no trade-off existed between strength and
ductility: the strength can be increased without sacrificing ductility. This is likely because the
increased strength served to counteract residual stresses and microcrack formation due to the
rapid cooling rates during the deposition of each layer of Hastelloy X. Decreased microcrack
formation meant that stress concentrators were reduced, and the part did not suffer from
premature fracture. This microcrack reduction counteracted any ductility losses due to increases
in strength.
4.3 BUILD DIRECTION
The build direction of the specimens had a surprising impact on ductility. It was predicted that
horizontally-built samples would be more ductile because during tensile testing because the load
was applied parallel to the build layers. It was hypothesized that this would have ductility similar
to wrought Hastelloy X, as no build layer interactions would occur. This was not the case.
Vertically built samples had significantly higher ductility. This may be due to large columnar
grains seen in previous research that form through the build layers as each layer is deposited.
These grains would ensure excellent layer-to-layer adhesion and contribute to the exceedingly
high ductility seen in the vertical samples. These axial grains would serve to connect build layers
with a single, ductile grain, then completely eliminating any build layer adhesion issues.
However, microstructural analysis showed that there was no noticeable difference between the
horizontally and vertically-built samples for the altered compositions of Hastelloy X. They both
exhibited a similar structure of infrequent grain boundaries, which do not match the large
columnar grains witnessed in previous literature using SLM processes. However, this could be
due to insufficient etching of the additively manufactured alloys. In addition, the grains could
have been too small to see with the optical microscopy methods used in this research. The SEM
fractography did show more promising build direction features, as the P60-X12 horizontally-
built specimen showed the interfacial zone between two deposited layers. It would be useful to
characterize this interfacial zone and test its hardness and fracture mode. It could be true that a
more ductile interface gave the vertically-built samples their increased ductility because the
tensile test was pulling directly on these fused interfaces. If the deposition process of DMD
caused solid solution strengthening elements to diffuse away from the interface, the interfacial
zone would have a composition closer to nickel, resulting in a greater ductility at these areas.
Build direction did not have a significant impact on yield strength. The nickel matrix deformed
before cracks, precipitates, voids, or build layer interfaces led to fracture. These alloys were not
brittle materials, so yield strength was determined by the stress at which the nickel matrix would
yield. Unlike compositional changes, build direction has no effect on matrix strength.

37
5 CONCLUSIONS
1. Mechanical properties in AM parts that match or exceed those of wrought Hastelloy X can be
achieved by modifying the composition. X18-H had a 17% increase in yield strength from
nominal wrought Hastelloy X and X18-V had a 29% increase in % elongation.
2. Increasing the amount of solid solution strengthening elements in Hastelloy X prevented
microcracking, raising yield strength from 290 MPa to 367 MPa without sacrificing ductility.
3. Build direction has a greater effect on ductility than compositional changes.
4. Changing the composition has a greater effect on yield strength than altering build direction.

38
6 REFERENCES
1. Dutta, B., S. Palaniswamy, J. Choi, L. J. Song, and J. Mazumder. "Additive
Manufacturing by Direct Metal Deposition." Advanced Materials and Processes (2011):
n. pag. ASM International. Web. 9 Feb. 2017.
2. Gu, Dongdong. "Laser Additive Manufacturing (AM): Classification, Processing
Philosophy, and Metallurgical Mechanisms." Laser Additive Manufacturing of High-
Performance Materials (2015): n. pag. Web.
3. "Technology." Formalloy. N.p., n.d. Web. 09 Feb. 2017.
<http://www.formalloy.com/applications>.
4. "Additive Manufacturing." Manufacturing News. N.p., n.d. Web. 9 Feb. 2017.
<http://www.mfgnewsweb.com/archives/additive_manufacturing/mar14/pics/DMG-
MORI-LASERTEC-65-AdditiveManufacturing-2.jpg>.
5. Geyer, Frank. "Additive Manufacturing: Making Sense of Laser Metal Deposition and
3D Printing." Fabricating and Metalworking. N.p., 27 Oct. 2016. Web. 09 Feb. 2017.
6. Dutta, Bhaskar, Shiva Palaniswami, Joohyun Choi, and Jyoti Mazumder. "Rapid
Manufacturing and Remanufacturing of DoD Components Using Direct Metal
Deposition."The AMMTIAC Quarterly 6.2 (n.d.): n. pag. Web. 9 Feb. 2017.
7. Awasthi, Reena, P. K. Limaye, Santosh Kumar, Ram P. Kushwaha, C. S. Viswanadham,
Dinesh Srivastava, N. L. Soni, R. J. Patel, and G. K. Dey. "Wear Characteristics of Ni-
Based Hardfacing Alloy Deposited on Stainless Steel Substrate by Laser Cladding." The
Minerals, Metals & Materials Society and ASM International 46A (2015): n. pag. Web. 9
Feb. 2017.
8. “Laser Melting (LM).” Additively, www.additively.com/en/learn-about/laser-melting.
9. Evans, John. “DMLS: A Bumpy Road in History.” Design & Motion, 10 Nov. 2014,
designandmotion.net/design-2/manufacturing-design/dmls-a-little-history/.
10. Yap, C. Y. et al. “Review of Selective Laser Melting: Materials and Applications.” Appl.
Phys. Rev., vol. 2, no. 4, 2015, p. 041101. doi:10.1063/1.4935926.
11. Shi, Xuezhi et al. “Performance of High Layer Thickness in Selective Laser Melting of
Ti6Al4V.” Materials, vol. 9, no. 12, Jan. 2016, p. 975. doi:10.3390/ma9120975.
12. Nakamura, Shinki. “High-Power and High Efficiency Yb:YAG Ceramic Laser at Room
Temperature.” Frontiers in Guided Wave Optics and Optoelectronics, 1 Feb. 2010,
doi:10.5772/39540.
13. Spierings, A.b. et al. “Influence of the Particle Size Distribution on Surface Quality and
Mechanical Properties in AM Steel Parts.” Rapid Prototyping J, vol. 17, no. 3, 2011, pp.
195–202. Emerald Insight, doi:10.1108/13552541111124770.
14. Tomus, D. et al. “Controlling the Microstructure of Hastelloy-X Components
Manufactured by Selective Laser Melting.” Phys Procedia, vol. 41, 2013, pp. 823–827.
ScienceDirect, doi:10.1016/j.phpro.2013.03.154.
15. Li, Ruidi et al. “Balling Behavior of Stainless Steel and Nickel Powder during Selective
Laser Melting Process.” Int J Adv Manuf Technol, vol. 59, no. 9-12, 2011, pp. 1025–
1035. Academic Search Premier, doi:10.1007/s00170-011-3566-1.
16. “Powder Production.” LPW, LPW Technology, www.lpwtechnology.com/technical-
library/powder-production/.
39
17. “Our Milestones.” Haynes International, 2015, www.haynesintl.com/company-
information/our-heritage/our-milestones.
18. “Hastelloy X.” MegaMex, 2010, megamex.com/hastelloy_x.htm.
19. “Hastelloy X.” Haynes International, 2015, http://www.haynesintl.com/alloys/alloy-
portfolio_/High-temperature-Alloys/HASTELLOY-X-alloy.aspx
20. Bhadeshia, H. K. D. H. “Nickel Based Superalloys.” University of Cambridge,
www.msm.cam.ac.uk/phase-trans/2003/Superalloys/superalloys.html.
21. Bowman, Randy. “Superalloys: A Primer and History.” TMS,
www.tms.org/meetings/specialty/superalloys2000/superalloyshistory.html.
22. Donachie, Matthew J., and Steven J. Donachie. Superalloys: a Technical Guide. 2nd ed.,
Materials Park, OH, ASM International, 2002.
23. Davis, J. R. ASM Specialty Handbook: Nickel, Cobalt, and Their Alloys. Materials Park,
OH, ASM International, 2000.
24. Ascione, Adam. “What Is the Difference Between Hastelloy® and Incoloy®?”
Continental Steel & Tube Company, 17 Sept. 2015,
metalspecialist.continentalsteel.com/blog/ what-is-the-difference-between-hastelloy-and-
incoloy.
25. Wang, Fude. “Mechanical Property Study on Rapid Additive Layer Manufacture
Hastelloy X Alloy by Selective Laser Melting Technology.” Int J Adv Manuf Technol,
vol. 58, no. 5-8, 12 June 2011, pp. 545–551. Academic Search Premier,
doi:10.1007/s00170-011-3423-2.
26. Harrison, Neil J. et al. “Reduction of Micro-Cracking in Nickel Superalloys Processed by
Selective Laser Melting: A Fundamental Alloy Design Approach.” Acta Materialia, vol.
94, 16 May 2015, pp. 59–68. Science Direct, doi:10.1016/j.actamat.2015.04.035.
27. Abbaschian, Reza et al. Physical Metallurgy Principles. 4th ed., Stamford, CT, Cengage
Learning, 2009.
28. Chandler, Harry. Heat Treater's Guide: Practices and Procedures for Nonferrous Alloys.
Materials Park, OH: ASM International, 1996.
29. Böllinghaus, Thomas et al. Hot Cracking Phenomena in Welds II. Berlin, Springer,
2008.
30. Tomus, Dacian et al. “Influence of Post Heat Treatments on Anisotropy of Mechanical
Behaviour and Microstructure of Hastelloy-X Parts Produced by Selective Laser
Melting.” Mat Sci Eng A, vol. 667, 28 Apr. 2016, pp. 42–53. ScienceDirect,
doi:10.1016/j.msea.2016.04.086.
31. “Laves Phase.” Wikipedia, https://en.wikipedia.org/wiki/Laves_phase.
32. Zhao, J.-C et al. “Phase Precipitation and Time-€ “Temperature-Transformation Diagram
of Hastelloy X.” Mat Sci Eng A, vol. 293, no. 1-2, 30 Nov. 2000, pp. 112–119.
ScienceDirect, doi:10.1016/s0921-5093(00)01049-2.
33. “Post-Processing of AM Metal Components: HIPing.” Inside Metal Additive
Manufacturing, 12 Sept. 2014, www.insidemetaladditivemanufacturing.com/blog/post-
processing-of-am-metal-components-hiping.
34. Dinda, G. P., A. K. Dasgupta, and J. Mazumder. "Laser Aided Direct Metal
Deposition of Inconel 625 Superalloy: Microstructural Evolution and Thermal Stability."
Elsevier Ltd.509.1-2 (2009): n. pag. Science. 6 Jan. 2009. Web. 10 Feb. 2017.