Embed Size (px)
Citation preview

Walden UniversityScholarWorks
Walden Dissertations and Doctoral Studies Walden Dissertations and Doctoral StudiesCollection
2016
Effect of Class Size on Student Achievement inSecondary SchoolChristopher Eric UhrainWalden University
Follow this and additional works at: https://scholarworks.waldenu.edu/dissertations
Part of the Education Policy Commons, and the Social and Philosophical Foundations ofEducation Commons
This Dissertation is brought to you for free and open access by the Walden Dissertations and Doctoral Studies Collection at ScholarWorks. It has beenaccepted for inclusion in Walden Dissertations and Doctoral Studies by an authorized administrator of ScholarWorks. For more information, pleasecontact [email protected].

Walden University
COLLEGE OF EDUCATION
This is to certify that the doctoral study by
Christopher Uhrain
has been found to be complete and satisfactory in all respects,
and that any and all revisions required by
the review committee have been made.
Review Committee
Dr. David A. Hernandez, Committee Chairperson, Education Faculty
Dr. Jerita Whaley, Committee Member, Education Faculty
Dr. Beate Baltes, University Reviewer, Education Faculty
Chief Academic Officer
Eric Riedel, Ph.D.
Walden University
2016

Abstract
Effect of Class Size on Student Achievement in Secondary School
by
Christopher Uhrain
MA, Virginia Commonwealth University, 2006
BS, Virginia Commonwealth University, 2000
Doctoral Study Submitted in Partial Fulfillment
of the Requirements for the Degree of
Doctor of Education
Walden University
April 2016

Abstract
The school board of a school district in South Carolina has proposed to increase class size
in all schools due to mandatory budgetary reductions. However, at the secondary school
level, the literature on the effect of larger class size on student achievement is conflicting.
The theoretical framework by Lazear suggested that the minimization of negative
externalities (i.e., problematic behavioral and academic characteristics of students)
achieved through the mechanism of smaller class size impacts student learning. Reducing
the number of students in a classroom alters the entire classroom environment, creating a
more positive learning environment in which students are able to forge better
relationships with classmates and teachers. The research question for this study examined
whether class size in secondary school predicted student achievement as measured by
teacher-issued end-of-course numerical student grades (TIECNSG). The study used a
correlational design with a sample of 17,582 TIECNSG from 5 secondary schools in the
district. The effect of smaller class sizes on TIECNSG was determined through the use of
a linear regression model. For 9 course offerings, an increase in class size resulted in a
decrease in TIECNSG, whereas for 8 course offerings, an increase in class size resulted
in an increase in TIECNSG. The results of this study, therefore, were inconclusive,
suggesting that other unaccounted confounding variables may have affected student
achievement. This study can be used to promote positive social change by creating a
dialogue between parents and school administrators who often have opposing points of
view in terms of the effects of class size. In addition, it is recommended that a district’s
school board should authorize additional studies prior to taking any course of action that
would affect class size at the secondary school level.

Effect of Class Size on Student Achievement in Secondary School
by
Christopher Uhrain
MA, Virginia Commonwealth University, 2006
BS, Virginia Commonwealth University, 2000
Proposal Submitted in Partial Fulfillment
of the Requirements for the Degree of
Doctor of Education
Walden University
April 2016

Dedication
I would like to dedicate this to Shana, Karissa, Ryan, and Victoria. Without their
love and support, none of this could ever be possible.

i
Table of Contents
List of Tables ................................................................................................................... viii
List of Figures .................................................................................................................... ix
Section 1: Introduction to the Study ....................................................................................1
Introduction ....................................................................................................................1
Problem Statement .........................................................................................................2
Nature of the Study ........................................................................................................2
Research Question and Hypothesis ................................................................................3
Purpose of the Study ......................................................................................................3
Theoretical Framework ..................................................................................................4
Definitions......................................................................................................................6
Assumptions ...................................................................................................................6
Limitations .....................................................................................................................7
Scope ..............................................................................................................................8
Delimitations ..................................................................................................................8
Significance of the Study ...............................................................................................8
Summary ......................................................................................................................10
Section 2: Review of the Literature ...................................................................................11
Introduction ..................................................................................................................11
Class Size Reduction in Elementary Education ...........................................................12
Project STAR ........................................................................................................ 12
California Class Size Reduction ........................................................................... 17

ii
Canada Primary Class Size Reduction .................................................................. 20
Other Studies in Elementary Education ................................................................ 21
Conclusion for Elementary Education .................................................................. 24
Class Size Reduction in Middle Grades.......................................................................25
Florida Class Size Reduction Initiative................................................................. 25
Other Middle Grade Studies ................................................................................. 25
Conclusion for Middle Grades .............................................................................. 28
Class Size Reduction in Secondary Education ............................................................28
Positive Effects of Class Size Reduction .............................................................. 28
No Effects of Class Size Reduction ...................................................................... 31
Conclusion for Secondary Education .................................................................... 33
Other Potential Benefits of Class Reduction ...............................................................34
Class Size Manipulation ..............................................................................................38
Confounding Variables Impacting Student Acheivement ...........................................40
Implications..................................................................................................................44
Summary ......................................................................................................................45
Section 3: The Methodology ..............................................................................................47
Introduction ..................................................................................................................47
Research Design and Approach ...................................................................................47
Setting and Sample ......................................................................................................48
Instrumentation and Materials .....................................................................................52
Data Collection and Analysis.......................................................................................52

iii
Role of the Researcher .................................................................................................53
Conclusion ...................................................................................................................54
Section 4: Results ...............................................................................................................56
Introduction ..................................................................................................................56
English .........................................................................................................................56
Mathematics .................................................................................................................58
Science .........................................................................................................................60
Social Studies ...............................................................................................................63
Conclusion ...................................................................................................................65
Section 5: Discussion, Conclusion, and Recommendations ..............................................66
Overview ......................................................................................................................66
Interpretation of Findings ............................................................................................66
Implications for Social Change ....................................................................................68
Recommendations for Action ......................................................................................68
Recommendations for Further Study ...........................................................................69
Conclusion ...................................................................................................................70
References ..........................................................................................................................71

iv
List of Tables
Table 1. Comparison of Number of Teachers Employed to Number of Students in
Attendance ............................................................................................................9
Table 2. Results of the STAR Study in Math and Reading at the First Grade Level ........13
Table 3. Results of Linear Regression Analysis Predicting Impact of Class Size on
Teacher-Issued Numerical Grades (English) ......................................................57
Table 4. Results of Linear Regression Analysis Predicting Impact of Class Size on
Teacher-Issued Numerical Grades (Mathematics) .............................................59
Table 5. Results of Linear Regression Analysis Predicting Impact of Class Size on
Teacher-Issued Numerical Grades (Science) ......................................................62
Table 6. Results of Linear Regression Analysis Predicting Impact of Class Size on
Teacher-Issued Numerical Grades (Social Studies) ...........................................64
v
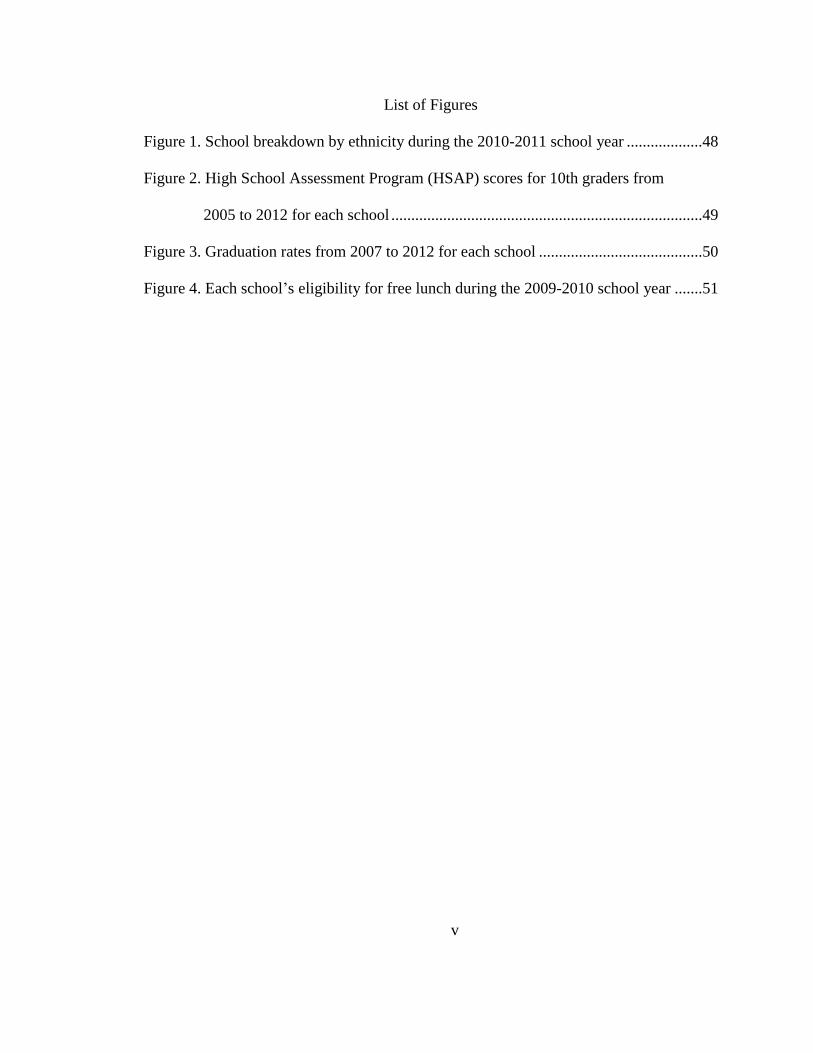
List of Figures
Figure 1. School breakdown by ethnicity during the 2010-2011 school year ...................48
Figure 2. High School Assessment Program (HSAP) scores for 10th graders from
2005 to 2012 for each school ..............................................................................49
Figure 3. Graduation rates from 2007 to 2012 for each school .........................................50
Figure 4. Each school’s eligibility for free lunch during the 2009-2010 school year .......51

1
Section 1: Introduction to the Study
Introduction
Historically, school administrators have reduced class size with the expectation
that smaller class size will increase student achievement. In 1996, the California
legislature passed a law reducing all K–2 classrooms to a maximum of 20 students
(California Education Code, 1996). In 1998, the South Carolina legislature limited
disadvantaged K–3 schools to a maximum of 15 students per classroom (Act number 400,
1998). In 2002, the Florida legislature passed a constitutional amendment limiting the
size of kindergarten through third grade classes to 18 students, fourth through eighth
grade classes to 22 students, and ninth through 12th grade classes to 25 students
(Editorial Projects in Education, 2010). Notwithstanding, administrators of the school
district in South Carolina where this study was conducted have proposed increases in
average class size at all grade levels; however, it is unclear if and how these changes will
impact student achievement.
There is no clear consensus in the educational research literature whether
increasing average class size will have an effect on student achievement. Some
researchers have suggested that changing class size can have an impact on student
standardized achievement scores. The Tennessee student-teacher achievement ratio
(STAR) study showed a significant increase in student achievement when class sizes
were reduced in Grades K–3 (Word et al., 1990). Atta, Jamil, Ayaz, Shah, and Shah
(2011) found that secondary class sizes under 20 students have a significant impact on
student achievement, and Brühwiler and Blatchford (2011) concluded that a one student

2
reduction in class size resulted in a half point increase in student grade point average at
both the primary and secondary level. However, other studies have shown that reduction
in class size had little to no impact on student achievement. Corak and Lauzon (2009)
analyzed scores of Canadian 15 year olds in the Program for International Student
Assessment. They found that class size made no consistent impact on student
achievement. Owoeye and Yara (2011), as well as Wyss, Tai, and Sadler (2007), found
no statistical differences in student achievement between large and small classes at the
secondary level. The research on the impact of class size on student achievement is
conflicting and inconclusive.
Problem Statement
In the district where this study was conducted, one of the recommendations for
the 2012-2013 school budget was to increase class sizes in fifth through 12th grades by
one student (Grooms, 2011). The purpose of this recommendation was to reduce the total
number of teachers hired by the district which would in turn reduce the total operational
costs. I hypothesized that increasing class size would negatively affect student academic
achievement as measured by teacher-issued end-of-course numerical student grades
(TIECNSG).
Nature of the Study
This study used a correlational design and was modeled using linear regression.
Green and Salkind (2011) recommended the use of a linear regression test to assess how
well an independent (predictor) variable can predict a dependent (criterion) variable. The

3
predictor variable in this study was class size and the criterion variable was TIENCNSG
(ranging from 0-100).
The academic subjects analyzed in this study were the core high school subjects
of English language arts, math, science, and social studies. Teachers have some discretion
in the makeup of course assignments and how much each assignment counted toward the
end-of-course grades (ECG); however, similar courses taught at the same school were
required to have aligned grading standards. Moreover, across the district, curriculum
coordinators made sure that all schools align grading standards for similar courses. Other
electives were excluded from the study because there could be less consistency in the
grading methodology from teacher to teacher than there were with the core subjects.
Research Question and Hypothesis
I investigated the effect of increasing class size through the following research
question (RQ) and hypotheses:
RQ: Does class size in secondary school predict student achievement as measured
by TIECNSG?
H0: Class size in secondary school can predict student achievement as measured
by TIECNSG.
H1: Class size in secondary school cannot predict student achievement as
measured by TIECNSG.
Purpose of the Study
Based on the increases in class size being considered in the district under study, it
was important to determine the potential impact these changes could have on student

4
academic achievement as measured by TIECNSG. The purpose of this study was to
determine the effect of changing class sizes on TIECNSG. This knowledge can be used
by administrators when making decisions about class size.
Theoretical Framework
The theoretical framework for this study is the minimization of negative
externalities (i.e., problematic behavioral and academic characteristics of students)
achieved through the mechanism of smaller class size (Ready, 2008), which impacts
student learning. The effectiveness of class size reduction (CSR) is based on the idea that
reducing the number of students in a classroom alters the entire classroom environment,
creating a more positive learning environment. Pritchard (1999) stated that the student-
teacher dynamic, student-student dynamic, and teacher-parent dynamic are all improved
in smaller classrooms. In addition, teachers have more time, resources, and incentive to
create improved lesson plans with greater levels of differentiation.
Pritchard (1999) stated that after being assigned into smaller classes, teachers
reported that students received more individualized attention. Teachers got to know
individual students better and kept track of individual student progress. In turn, students
became more engaged because of this increased, personalized learning environment.
Additionally, teachers spent less time on classroom management, which offered
additional instructional time for all students in the classroom. Din (1999) confirmed that
in smaller classes, students received more individualized help from teachers. Blatchford,
Bassett, and Brown (2011) conducted a study at both the primary and secondary school
level and found that in larger classes, student interaction with teachers decreased, which

5
resulted in a lower level of student engagement confirming Pritchard’s theory. Englehart
(2007) and Fan (2012) confirmed that in smaller classes, time spent on classroom
management was decreased which led to improvement in academic achievement.
Pritchard (1999) theorized that smaller classes resulted in a more positive
environment due to students developing better relationships with each other. Higher
achieving students encouraged and assisted their peers, resulting in a higher performing
classroom. Gottfredson and Dipetro (2011) confirmed this theory as they found that
student-student classroom dynamics improved in smaller classrooms, which in turn led to
a more effective teaching environment. In addition, O’Brennan, Bradshaw, and Furlong
(2014) found that student perceptions were improved in smaller classrooms.
Pritchard (1999) posited that another main reason for increased student
achievement in smaller classrooms was that parents and teachers developed stronger
relationships. Having fewer students allowed teachers more time to contact and develop
positive relationships with parents. Graue, Raushcer, and Sherfinski (2009) confirmed
that smaller classes did give teachers more opportunities to reach out to parents and
include them in the educational process. Rodriguez and Elbaum (2014) found that the
strongest predictor of parental participation into the educational process was class size.
The final rationale for improved student achievement in smaller classrooms as
theorized by Pritchard (1999) was that teachers had more time, resources, and incentive
to create improved lesson plans with greater levels of differentiation. Teachers spent less
time grading, which allowed more time for lesson planning. In addition, teachers had
more opportunities for collaboration with other teachers and had more room available to

6
transition classes into a larger variety of teaching formats. DiBiaise and McDonald
(2015) confirmed that smaller classes did increase teacher curriculum development.
Definitions
Academic achievement: The level of knowledge acquisition that occurs in a given
course as defined by end-of-course grade point average (South Carolina Department of
Education, 2007).
Class size reduction (CSR): Reducing the student-teacher ratio in a particular
classroom (Funkhouser, 2009).
Teacher-issued end-of-course numerical student grade (TIECNSG): The
numerical grade given to a student at the completion of a course based on his or her work
and knowledge acquisition throughout the course. This numerical grade is a weighted
average of all assignments completed in the course, and values range from 0 to 100
(South Carolina Department of Education, 2007).
Assumptions
The primary assumption in this study was that TIECNSG effectively measured
student achievement in the course. While studies typically use standardized test results to
measure student achievement, TIECNSG could be more indicative of student
achievement for the content actually taught in class. Unlike standardized tests, Geiser and
Santelices (2007) stated that TIECNSG consist of multiple forms of assessment to
measure student achievement. Process understanding, high level integration of content
knowledge, and classroom participation are included in TIECNSG. Therefore,
TIENCNSG could reflect a more inclusive and comprehensive method of measuring

7
student achievement than standardized test scores, which only test one particular skill.
While TIECNSG are not standardized and grading practices can vary from teacher to
teacher, I assumed that TIECNSG are objectively determined and that grades from
different teachers of like subjects are approximately equivalent.
Limitations
Due to the research design, this study faced several limitations. Random
assignment was impossible because the data analyzed were archival in nature. Without
random assignment, Lodico, Spaulding, and Voetgle (2010) stated that the internal
validity threat of differential selection can occur. While this threat could not be
completely controlled, differences in group dynamics were minimized by using the entire
population of students in five different schools within the district.
Another major limitation in this study was the internal validity threat of
instrumentation. Because TIECNSG were not standardized, variation from teacher to
teacher in terms of grading procedure can occur. This threat could not be completely
controlled; however, it was minimized by the use of data from the entire population of
five secondary schools, which included multiple classes from each teacher as well as
multiple teachers. Also, the district had adopted a uniform grading structure for all
teachers of the same subjects. This uniform structure should have resulted in TIECNSG
that are approximately equivalent across the same subject.
The last major limitation in this study was generalizability. This study was
designed to look specifically at the effect of class size on TIECNSG in five secondary
schools in a specific school district. Because of the ex post facto design, I cannot claim

8
generalizability to all high school students. It is up the to the reader to decide whether the
results may be transferable to other schools with similar demographics as the high
schools used in this study; however, schools with different demographic makeups may
present confounding variables that were not addressed in this study.
Scope
The scope of this study was limited to one school district in South Carolina with
data used from five of the nine secondary schools in the district. I only analyzed the
effect of TIECNSG in the core subjects of English language arts, math, science, and
social studies. A total of 17,582 TIECNSG were used in this study.
Delimitations
This study had several delimitations. I chose to use only TIECNSG in lieu of
other measurements of achievement such as standardized test scores. I chose to use
TIECNSG because they may reflect a more inclusive and comprehensive method of
measuring student achievement than standardized test scores, which only test one
particular skill set (Geiser & Santelices, 2007). I also chose to focus on five of the nine
secondary schools in my school district due to their demographic similarities. Finally, I
chose to include only grades in core subject areas due to the lack of consistency of
grading in elective courses.
Significance of the Study
In the district where this study was conducted, one of the recommendations for
the 2012-2013 school budget was to increase the size of classes in fifth through 12th
grades by one student (Grooms, 2011). While district administrators have not

9
implemented an official policy increasing class size for the last 3 budget years, the
number of teachers has decreased while the number of students has remained nearly
constant, resulting in an increase in average class size. During the same 3-year period, the
pass rate of the High School Assessment Program (HSAP) test, which all 10th grade
students are required to take, has dropped by 2.2%. This trend can be seen in Table 1.
Table 1
Comparison of Number of Teachers to Number of Students and HSAP Pass Rate
Fiscal Year Teachers Students Average P HSAPa
2008-09 2,655 37,636 14.1 83.5%
2009-10 2,577 37,407 14.5 81.3%
2010-11 2,514 37,520 14.9 81.3%
Note. Adapted from Official Budget 2010-2011 Fiscal Year, by County Schools, 2010, p. 272. aAdapted from "SC Annual School Report Card," by South Carolina Department of Education, 2008-2012,
http://ed.sc.gov/data/report-cards.
Before district administrators decide to implement the recommended increase in
class size, the effects on student achievement should be studied. It is important that
district administrators be made aware of the potential effects of changing class size on
student achievement. With this information, they can make an informed decision on any
proposal that would officially change class size.
Schools have an implicit responsibility to provide the best possible learning
conditions for all students. If increasing class size were to have a negative outcome on
student achievement and student learning, then studying the impact of class size on
student achievement is important. Students could be at a disadvantage relative to students
in other districts because they might not acquire as much knowledge and skills in larger
classes than their peers in smaller classes. This disadvantage could impact a student’s

10
ability to gain access to a college or university, and ultimately impact his or her future
earning potential. Moreover, if increasing class size were to have little to no effect on
student achievement, then money could be saved by increasing class size and using the
money on programs that could increase student achievement.
Word et al. (1990) suggested that in the Project STAR study, CSR had a major
impact on student achievement. However, states such as California that have
implemented statewide class size reduction initiatives in elementary schools have not
seen changes in student achievement (Jespen & Rivkin, 2009). As a result, this current
study was needed to determine the effect of class size on student achievement.
Summary
In this section, I described my study designed to test the effects of class size
student achievement as measured by TIECNSG. This study was based on the theory that
reducing class size alters the entire classroom environment, creating a more positive
learning environment. In Section 2, I review the relevant literature, analyzing past studies
conducted to examine the effects of class size on academic achievement. In Section 3, I
discuss the methodology of this study. This includes descriptions of the overall design,
setting, population, and data collection and analysis procedures. In Section 4, I discuss
the results from this study, and in Section 5, I discuss the ramifications of these results,
offer follow up recommendations, and suggest the potential impact of the finding on
social change.

11
Section 2: Review of the Literature
Introduction
In the following review of the literature, I examined studies analyzing the effects
of class size on student achievement conducted at all levels of K–12 public education:
elementary schools (Grades K–5), middle schools (Grades 6–8), and secondary schools
(Grades 9–12). Several studies which I discuss in this literature review have shown a
significant effect of class size on student achievement, while others have shown little to
no effect. For example, the seminal study on this subject, the Project STAR study,
conducted at the early elementary level, showed a significant improvement in student
achievement; however, in later analyses of the STAR data, I review studies in which
researchers have questioned the results of the Project STAR study.
In addition, other studies have shown that class size manipulation by principals
can affect the results of any CSR analysis on student achievement. However, there is
strong evidence that students benefit from CSR at all levels of education in other aspects
of the learning process. Additionally, studies have shown that in smaller classes better
teacher-student relationships are developed, students have greater access to resources,
more individualized student learning occurs, and students have greater success after
leaving school.
I reviewed literature from a wide range of sources, such as information found on
websites using the Google search engine and peer-reviewed journal articles retrieved
through GoogleScholar and the e-databases of Walden University Library, primarily
using EBSCO, ERIC, and ProQuest. I used the following key words to find websites and

12
journal articles: class size, class size reduction, student achievement, linear regression,
disadvantages of using standardized tests, effect of achievement on class size, and student
achievement.
Class Size Reduction in Elementary Education
In this section, I examined studies conducted at the elementary level (Grades K–
5). This level of education has been the most studied in terms of the effect of class size on
student achievement. Several studies have shown that student achievement is positively
affected by a reduction in class size, while other studies have shown the effects to be
minimal to none and call into question the validity of studies showing significant
improvements.
Project STAR
In 1984, researchers conducted a study in the state of Tennessee to determine the
effects of class size on student achievement known as the student-teacher achievement
ratio (STAR; Word et al., 1990). The researchers conducted a 4-year longitudinal study
with a randomized control and experimental sample. It involved 79 elementary schools
from all parts of Tennessee and included 330 K–3 classrooms separated into three groups.
These groups consisted of small classes (13–17 students), regular classes (22–25
students), and regular classes with a teaching aide (22–25 students). To avoid school
effects (i.e., significant differences due to the school attended), a within-school design
was used where both experimental and control groups were present in all of the schools
in the study. The results of the study showed that when compared to students in regular

13
size classes, first graders in classes under 17 had a percentile ranking increase of 11
points in reading and 11 points in math. The results can be seen in Table 2.
Table 2
Results of the STAR Study in Math and Reading at the First Grade Level
Class Size Percentile Ranking in Reading Percentile Ranking in Math
Small (13–17) 64th 59th
Regular (22–25) 53rd 48th
Regular With Aid 58th 51th
Note. Adapted from “The Tennessee Study of Class Size in the Early School Grades,” by F. Mosteller,
1995, The Future of Children, 5, p. 122.
The researchers found increases in other grade levels as well, although none were
as pronounced as in first grade (Word et al., 1990). In addition, the researchers
concluded that increases in student achievement were equal for trained and untrained
teachers, that staff development opportunities conducted during the research had little
effect on student achievement compared to class size, and that African American students
tended to benefit more than Caucasian students when class size was reduced. Based on
these results, the official recommendation adopted by the Tennessee legislature was to
implement class size reduction in phases, starting in kindergarten and first grade where
the results were most prominent, and limit class size to no more than 15 students.
Additional studies using Project STAR data. Shin and Raudenbush (2011) used
the Project STAR data to determine if reduced class size increased achievement in
reading, mathematics, listening, and word recognition skills and whether these effects
differed from school to school. Using an extended Rubin’s causal model, they found that
reducing class size increased student achievement in grades K–3; although in second

14
grade, only a minimal improvement was found. In addition, Shin and Raudenbush found
that these effects did not differ from school to school. Konstantopoulos (2008) also used
the Project STAR data to investigate whether decreasing class sizes could close the
achievement gap between high and low level achievers. Konstantopoulos’s findings did
not show that the achievement gap was closed. However, the reason for this outcome was
not that CSR did not help low achieving students, but that it helped high achieving
students even more. McKee, Sims, and Rivkin (2015) investigated patterns of
heterogeneity in the effects of class size on student achievement in the Project STAR
classes that showed improvement. They found that students in higher poverty schools and
academically gifted students both benefitted from smaller class size. The researchers
conjectured that in higher poverty classrooms, there are a larger number of interruptions
and classroom management issues that can be minimized with smaller class sizes. In
academically gifted classrooms, smaller classes can result in more individualized and
challenging instruction. Shin (2012) used the Project STAR data to determine if African
American students benefited more from smaller classes than Caucasian students. Shin
found that at the kindergarten level, both Caucasian and African American students
benefited equally from smaller classes while in first through third grade, African
American students benefitted more from smaller classes.
Ding and Lehrer (2010) also found that smaller class sizes had a positive effect on
student achievement in their analysis of the Project STAR data that statistically accounted
for student attrition and transitions of students between test and control groups from
Grades K–3. The researchers found that small class size had a statistically significant

15
effect on student achievement in Grades K–1, although there was no statistically
significant improvement from students being in a small class in both kindergarten and
Grade 1 over being in a small class in just kindergarten. They suggested that this was the
result of individual student needs being identified in the initial small classroom so that
subsequent experiences in small classes would have little to no additional impact on
student achievement. Konstantopoulos and Li (2012) also used the Project STAR data to
determine if being in smaller classes for longer than 1 year could have a greater influence
on student achievement. They analyzed data from students who had participated in the
Project STAR study from grades K–3. The researchers found that there was no
statistically significant increase in student achievement from being in a smaller class
more than one1 year. However, they also found that the original increase in student
achievement from being in a smaller class is not permanent and if a child is subsequently
placed in a larger class, any increases in student achievement resulting from the smaller
class would be reversed.
After 4 years, the Project STAR study was ended and the Lasting Benefits Study
was undertaken. This study followed the participants of the Project STAR study through
Grades 4–8 to see if the gains in student achievement from K–3 remained
(Konstantopoulos & Chung, 2009). Konstantopoulos and Chung (2009) used these data
to determine the long-term effects of small classes in early grades. They used quantile
regression to compare student test scores in mathematics, reading, and science in third
grade to scores in subsequent grades. The researchers found that at a .10 confidence level,
throughout Grades 4–8, all student sample groups in small class sizes in previous grades

16
had a significant improvement in test scores when compared to students in regular size
classes in previous grades. At a .05 confidence level, over half of the sample groups
showed a statistically significant improvement.
Studies questioning the results of Project STAR. Sohn (2010, 2015) argued
that the Project STAR study was flawed and conjectured that the researchers were biased
from the outset toward showing that class reduction had an impact on student
achievement. The majority of the improvements reported in the STAR study were found
at a very small number of schools, and more schools showed negative effects than
positive effects. Sohn (2010, 2015) found that three times as many schools showed no
effect (ineffective schools) than positive effects (effective schools). Sohn (2010, 2015)
contended that the Project STAR study’s student assignments were not randomized, but
in fact were intentionally distributed to achieve a desired result. To support this claim,
Sohn pointed out that there were a statistically higher number of children receiving free
lunch in regular size classes compared to the number receiving free lunch in small
classes. Furthermore, in the small classes where improvements were shown, there was a
much higher percentage of teachers with advanced degrees than in the small classes that
did not show improvement. Additionally, when analyzing only ineffective schools, there
were not any improvements in academic achievement resulting from CSR.
Konstantopoulos (2011) confirmed that possibly the Project STAR data appeared not to
have used random assignment of students and could have been manipulated to obtain
certain results. Konstantopoulos found that in some of the small classes there was a great
deal of improvement; however, in other small classes there was little to no improvement.

17
Mueller (2013) found contradictory results to the Word et al. (1990) findings, specifically
that teacher experience had little to no effect on improvement to student achievement.
Mueller found that in classes with rookie teachers, little to no improvement was obtained
by reducing class size. However, in classes with experienced teachers, student
achievement improved greatly. Mueller conjectured that this was a result of experienced
teachers having the ability to implement differing learning strategies in smaller classes
while rookie teachers might not have the skill set to implement these strategies. In
addition, Bedard and Kuhn (2008) contended that the inability to conduct follow-up,
large-scale, experimental designs, such as the Tennessee Project STAR study, has
resulted in no generalizable results on the effect that class size has on student
achievement at any level of education from elementary to postsecondary education.
California Class Size Reduction
Based on the results of the Project STAR study, states across the country began to
implement CSR programs, adopting laws limiting class size. California adopted the CSR
program in 1996, which reduced all K–3 classrooms in the state to a maximum class size
of 20 (California Education Code, 1996). In 1998, the South Carolina Legislature passed
a law that required a maximum class size of 15 in disadvantaged kindergarten through
third grade schools (Act number 400, 1998). The Florida legislature passed a
constitutional amendment in 2002 limiting class sizes to 18 for kindergarten through first
grade, 22 for fourth through eighth grade, and 25 for ninth through 12th grade (“District,”
2010).

18
While the results of the Project STAR study showed that reduction in class size
resulted in increases in student achievement as evidenced by a 11 percentile improvement
in reading scores and math scores (Word et al., 1990), the results of these CSR programs
in other states did not always produce the desired effects of improvement in student
achievement. As a result of the California CSR program, all K–3 classrooms were
reduced from 30 to 20 students, which cost the state over 1 billion dollars per year to
implement (Jespen & Rivkin, 2009). However, after implementation of CSR, the state’s
standardized test scores showed no appreciable change.
Studies examining the results of the California CSR program. Jespen and
Rivkin (2009) determined that the reduction in class size based on the California CSR
program did have an impact on student achievement; however, this impact was negated
by the negative effect of the hiring of untrained teachers. They found that a CSR of 10
students resulted in an average increase in standardized test scores of 0.10 standard
deviations in math and 0.06 standard deviations in reading when teacher experience was
not taken into account. However, in classes taught by teachers without at least 2 years of
teaching experience, they found a reduction of test scores of 0.10 standard deviations in
math and 0.07 standard deviations in reading. Because the California CSR program
resulted in 25,000 new teaching positions, a number of inexperienced teachers without
proper credentials were placed in classrooms, eliminating any positive results gained by
the reduction of class size in experienced teachers’ classrooms. Bressoux, Kramarz, and
Prost (2009) confirmed this conjecture in a quasi-experimental study of CSR in
relationship to untrained teachers. They surmised that having a trained teacher versus an

19
untrained teacher had the same impact on student achievement as a reduction of 10
students in the classroom.
Sims (2008, 2009) studied two additional factors that could have explained the
lack of positive results in the California CSR program. Sims (2008) stated that the lack of
qualified teachers in California could not have explained the patterns shown in
standardized test scores. Using the California Standardized Testing and Reporting
(CSTAR) data for 1998-2000, Sims (2009) found that a reduction of an average of 9.5
students in first and second grade classes resulted in an increase in class size in fourth and
fifth grade classes. Sims found that this increase led to a -0.07 standard deviation effect in
student scores in mathematics at the fourth grade level and a -0.03 standard deviation
effect in student scores at the fifth grade level. Using the same CSTAR data as well as
classroom observations, Sims (2008) found that many elementary schools created
combination classes (classes with more than one grade level present) to meet budgetary
demands. Sims found that combination classes lowered second grade test scores by 0.04
to 0.05 standard deviations when measured as an effect size and third grade test score
effect sizes by 0.09 to 0.10 standard deviations when measured as an effect size.
Funkhouser (2009) argued that the CSR program did not show positive results
because class size had very little effect on student achievement. Funkhouser compared
kindergarten student achievement immediately before program implementation and
immediately after. Funkhouser found a slight improvement in reading equivalent to a
0.10 standard deviation improvement and a statistically insignificant 0.05 standard
deviation improvement in mathematics.

20
Canada Primary Class Size Reduction
In the 2007-2008 school year, Ontario, a province in Canada, implemented the
Primary Class Size Reduction (PCSR) initiative in all its primary (elementary) schools
(Mascall & Leung, 2012). This law required all classes to be reduced to a maximum
class size of 20 students. Much like the California CSR, the implementation of this law
did not produce the anticipated results as found in the Project STAR study. Bascia and
Faubert (2012) examined how this law was implemented to determine if implementation
affected the results of the initiative. Their study encompassed 24 schools in all eight
school districts in the province of Ontario. They found many positive outcomes from
implementation in the elementary grades including improved student-teacher
relationships, more individual support for “at risk” students, more resources devoted to
all levels of elementary classes, additional teacher training, and increased personal space
which allowed for more diverse learning strategies to be introduced. However, they also
found that while the elementary grades benefitted from this initiative, the upper grade
levels received fewer resources. For upper grades, the PCSR initiative resulted in larger
class sizes, less individual support for “at risk” students, and a reduction in personal
space and teacher training. Based on Konstantopoulos and Li’s (2012) findings that gains
resulting from CSR are not permanent, this could explain the lack of substantial
improvement in the PCSR initiative. In their study of the school districts in Ontario,
Mascall and Leung (2012) found that different school districts had drastically different

21
results in terms of increases in student achievement. They found that school districts
which used available funds effectively and had a plan in place that maximized all
available resources for implementation had positive results from the PCSR initiative
while districts that did not have such a plan in place saw little to no improvement in
student achievement.
Other Studies in Elementary Education
Other studies showed similar results to the STAR study to varying degrees. Cho,
Glewwe, and Whitler (2012) analyzed the Minnesota Comprehensive Assessment test of
all third and fifth grade students in Minnesota. They found that reducing class size had a
positive impact on student performance in reading and mathematics. However, the
researchers’ analysis of the data showed only a minimal increase with a 10-student
decrease in class size, resulting in a 0.04 to 0.05 standard deviation increase in the
distribution of student standardized test scores.
Breton (2014) used scores from the Trends in International Mathematics and
Science Study (TIMSS), a standardized test given to fourth and eighth grade students in
41 different countries. Briton chose to analyze the mathematics data for fourth grade
students in Columbia exclusively. In Columbia, fourth grade class sizes ranged from six
to 80 students. Briton found that increasing class size resulted in a statistically significant
drop in test scores. A one student increase in class size resulted in a 0.03 standard
deviation decrease in test scores. In addition, Briton conjectured that reducing all classes
to 20 students or less would result in a 12% increase in student achievement. Breton
concluded that CSR was six times more effective than the results obtained by Cho et al.

22
(2012). Briton pointed out, however, that the results from Columbia were significantly
higher than other countries that participated in TIMSS, possibly due to the large variance
in class sizes found in that country.
Kassile (2014) conducted a study to look at the effects of various resources on
student achievement. Kassile analyzed the effect of student-teacher ratio on pass rates on
the Primary School Leaving Examination in Mainland Tanzania. Kassile found that
student-teacher ratio had a statistically negative effect on student achievement with a
Pearson correlation coefficient of 0.74176 and p = .0001.
Vaag, Iversen, and Bonesrønning (2013) conducted a study of all Norwegian
fourth grade students to determine if smaller size classes helped disadvantaged students
in elementary school. They analyzed data from standardized tests in math and reading
administered to 55,322 participants. There were two types of disadvantaged students
analyzed in this study. The first type was students who had neither parent finish
secondary school. The second type was students who came from divorced households. In
both cases, the researchers’ analysis detected a small but significant improvement in
student achievement from reducing class size. An eight student decrease in class size
resulted in a 0.04 standard deviation improvement in achievement of students with
neither parent finishing secondary school and a 0.06 standard deviation improvement in
achievement of students from divorced households.
Between 2000 and 2003, researchers at the Institute of Education conducted a
study of English primary schools to determine the effects of a 2001 law limiting class
sizes to 30 in all infant classes which is the English equivalent of the United States preK–

23
2 (Department for Education, 2011). This was a longitudinal study that grouped classes
into large (30 students and over), large medium (26–29 students), small medium (20–25
students), and small (under 20 students). Students were randomly selected from all
English schools. Literacy and mathematics achievement were examined to determine the
impact of CSR. The researchers found that class size had a positive impact on student
achievement in early grades and that smaller classes had more teacher-student
interactions, while larger classes had more student-student interactions. However, the
positive impact of smaller classes was somewhat small and diminished over time.
Galton and Pell (2012) conducted a 4-year longitudinal study of 36 primary
schools in Hong Kong that showed similar results to the British Department for
Education (2011) study. Galton and Pell separated class sizes into normal classes
(approximately 38 students) and small classes (25 students and under). They measured
student achievement in English, Chinese, and mathematics by a test constructed
specifically for this study by the Hong Kong Education Department. Using multi-level
regression, they found no long-term statistically significant effect on student achievement
for class size. There was some academic improvement in students in small classes;
however, this improvement disappeared upon students’ inclusion in larger classes.
Milesi and Gamoran (2006) conducted a study of kindergarteners and found
classroom size had no effect on student achievement. They analyzed data gathered in the
Early Childhood Longitudinal Study of Kindergarten Class 1998-1999. The data
consisted of pretest and posttest scores in reading and math of kindergarten students
across the United States. A total of 21,600 students were included from 1,000

24
kindergarten classrooms. Using hierarchical linear models, Milesi and Gamoran found
that class size had no statistically significant effects on student achievement.
Konstantopoulos and Traynor (2014) found similar results in their study of fourth grade
reading test scores on the Progress in International Reading Literacy Study (PIRLS) in
Greece. They found a small association between CSR and student achievement; however,
the association was not statistically significant.
Conclusion for Elementary Grades
Research at the elementary level has shown that effects of class size on student
achievement are largely inconclusive. The researchers involved in the STAR study found
that CSR led to significant improvements in student achievement, while other researchers
did not find this result. In terms of subject taught, the majority of studies used
standardized data that only investigated effects of class size on math and reading skills. A
number of confounding variables, such as subject taught (Galton & Pell, 2012),
differences in schools (Sohn, 2010), differences in teacher skill (Jespen & Rivkin, 2009;
Mueller, 2013), and even CSR implementation methodology (Bascia & Faubert, 2012;
Mascall & Leung, 2012) were present in most studies at the elementary level. In addition,
the STAR study showed varying levels of student improvement at different grades, with
first grade having the most pronounced change (Word et al., 1990). However, the results
of elementary level studies cannot be generalized to other grade levels. Accordingly, it is
necessary to examine studies on the impact of CSR on student achievement at the middle
(6–9) and secondary (10–12) grade levels.

25
Class Size Reduction in Middle Grades
Next, I focused on studies conducted at the middle grade level (Grades 6–9). CSR
in middle school has not been studied nearly as extensively as at the elementary level,
and results of student achievement are largely inconclusive.
Florida Class Size Reduction Initiative
In response to the results of Project STAR, the Florida legislature passed a
constitutional amendment reducing class size in middle school to 22 students in 2002
(“Districts,” 2010). Chingos (2012) examined student scores on the Florida
Comprehensive Assessment Tests (FCAT), a standardized test taken by all Florida
students. Chingos evaluated the student population at both the district and school-wide
levels by separating districts and schools into two groups: (a) those that were not reduced
or were only marginally reduced in class size by the statewide mandate (an average
reduction of 1.4 students at the district level and 1.1 students at the school level) and (b)
those that had a large reduction in class size (an average reduction of 3.0 students at the
district level and 3.4 students at the school level). The researcher, using multiple
regression, found only a minimal improvement in student scores at both the school and
district levels that could be directly attributed to CSR. This initiative seemed to show the
same lack of increase in student achievement as the California CSR.
Other Middle Grade Studies
Analysis of other middle school data confirmed the results of the Florida study.
Leuven, Oosterbeek, and Ronning (2008) conducted a quasi-experimental study in

26
Norway in Grades 7–9. They measured student achievement via scores on the centralized
exit exams all ninth graders are required to take. In Norway, Grades 7-9 were limited to a
maximum size of 30 students so the effects of larger class sizes were not taken into
account. Using a regression discontinuity design at a 95% confidence level, they found
that class size had no statistically significant effect on student achievement.
Altinok and Kingdon (2012) used TIMSS test data for eighth grade students and
found that out of 41 countries, decreasing class size only had a statistically significant
effect on 20. In seven of the 41 countries, increasing class size actually had a positive
effect on student achievement. Overall, they found that a one standard deviation
reduction in class size would increase student achievement by only 0.03 standard
deviations.
In addition, Akabayashi and Nakamura (2014) examined sixth grade Japanese
standardized language arts tests scores by comparing tests given at the beginning and the
end of the school year. Using a value-added model to estimate causal effects and to
control for unobserved fixed effects, they found class size to have little to no effect on
student achievement. A one student reduction in class size increased test scores by only
0.0112 standard deviations. In addition, they found no evidence that a universal class size
reduction policy would have any effect on closing the achievement gap between poor and
wealthy students.
Other researchers, however, found that smaller class size did have a positive
effect on student achievement. Tienken and Achilles (2009) examined the effect of class
size on writing skills. They conducted a non–experimental, explanatory, longitudinal

27
study of 123 middle school children in New Jersey to determine if reducing class sizes
from large classes (23–26 students) to small classes (12–18 students) would have an
effect on students’ abilities to learn writing skills. Tienken and Achilles used a control
group design and only included students in the study who attended the same school. The
researchers analyzed pre/posttest data from student writing assessments using one-way
analysis of variance (ANOVA). They found that after 3 years of smaller class sizes,
students performed significantly better on standardized writing exams. In addition,
students who spent sixth grade in small classes followed by seventh and eighth grade in
large classes still performed better than students who spent all 3 years in large classes,
although this increase was not as large. One difference in this study compared to other
studies that showed no improvement was that this study investigated writing skills
exclusively.
Dee and West (2011) also found that decreasing class size had a positive effect on
student achievement; however, instead of looking at test scores, student achievement was
defined as a retention of noncognitive skills, which referred to work habits such as effort
and self-control as well as behavioral traits such as confidence and emotional stability
that are not measured by standardized tests but are crucial for long-term educational
success. The researchers examined 24,599 eighth grade students from over 1,000 schools
in the United States. Dee and West used data collected from the National Education
Longitudinal Study of 1988. They found that CSR resulted in statistically significant
improvements in retention of noncognitive skills. Nationwide, students in small classes
had an increased rate of retention of 4.6% higher than in large classes. In urban schools,

28
the increased level of retention was 7.9%. Dee and West found that while CSR may not
always show immediate results in student achievement, improvements in skills that are
essential for long-term success were improved.
Conclusion for Middle Grades
Studies performed in the middle grades on the effect that class size had on student
achievement offered inconclusive evidence about the actual effects on student
achievement. Researchers that examined standardized test scores such as Chingo (2012),
Leuven et al. (2008), and Altinok and Kingdon (2012) tended to find little to no
improvement in student achievement as a result of CSR. However, Tienken and Achilles
(2009), examined a specific subject and showed an improvement in test scores, and Dee
and West (2011) found that CSR improved retention of important noncognitive skills.
Class Size Reduction in Secondary Education
There have been very few studies conducted at the secondary level (Grades 10–
12). The results of those studies have varied greatly. Similar to studies conducted in
elementary and middle schools, some have shown that CSR resulted in a positive effect
on student achievement, while other studies have shown CSR had no effect on student
achievement.
Positive Effects of Class Size Reduction
Atta et al. (2011) studied the attitudes of 400 male 10th graders from four rural
and four urban high schools in District Dera Ismail Khan, Pakistan. The researchers used
a questionnaire as an instrument to gain the opinions of students in regard to the effect
that class size had on student achievement. They analyzed the questionnaires using a chi-

29
square distribution, and the confidence level for this experiment was .05. Any chi-square
value greater than 3.841 was deemed to show that class size was believed to have a
significant impact on student achievement. The researchers found that students opined
that small class sizes (fewer than 20 students) had a significant impact on student
achievement. The researchers calculated a chi-square value of 94.46 which was indicative
of a very significant relationship between small class size and the belief that this would
lead to higher student achievement. Nonetheless, actual achievement was not verified, so
the findings must be interpreted cautiously.
Brühwiler and Blatchford (2011) found similar results to Atta et al. (2011) in a
combined study of 26 primary and 23 secondary Swiss schools. They used data
consisting of teacher questionnaires to determine class size and pretest/posttest design to
determine student achievement. They found that, on average, a one student reduction in
class size resulted in a half point increase in student test scores. The researchers noted
that Swiss schools on average already had small class sizes, with the average class size
being 19 or fewer students, which implied that even with small classes, class reduction
could still be effective in increasing academic achievement.
Heinesen (2010) studied all Danish ninth graders who took French classes and
found that smaller class size had a statistically significant impact on end-of-course
examination scores. In addition, in class sizes ranging from six to 20 students, Heinesen
found that the effects of class size on exam grades tended to be linear in nature. This
study is unique in that it did not use data from standardized tests and it focused on the
specific subject of French. The statistically significant impact of class reduction in this

30
study suggests that subjects requiring high interactivity, such as learning a foreign
language, could have affected the results of class size reduction on student achievement.
Krassel and Heinesen (2014) examined the effects of class size in Danish
secondary schools. They used administrative registry data to determine class size and 10th
grade exit exams in Danish, math, and English to measure student achievement. The total
sample size was 46,267 students and in Denmark, 10th grade is an optional year designed
for at risk students. They found that reducing class size offered a statistically significant
but small effect on student achievement.
Celik and Koc (2015) examined the correlation of class size and student
achievement in Turkey. They used student scores on the Transition to Higher Education
test, an exit exam taken at the end of high school, from 81 different cities to determine
student achievement. Celik and Koc determined class size by taking the number of
students attending each high school and dividing it by the number of classrooms. They
used a Spearman’s correlation to determine the level of relationship between class size
and student achievement. At a .001 significance level, they calculated a Spearman’s rho
correlation of -.366. This indicated a relatively moderate inverse correlation between
class size and student achievement.
Harfitt (2012b, 2013, 2014) conducted three studies in Hong Kong secondary
schools. In Harfitt’s first study, Harfitt (2012b) examined student perspective on class
size. Harfitt (2012b) interviewed a total of 191 students about their experiences in their
English classes. Even after controlling statistically for the confounding variable of
teacher teaching ability, Harfitt (2012b) found that students reported smaller classes had

31
better classroom management, more time on task, and better teacher-student
relationships. Students felt a higher level of closeness and community, and felt more
comfortable asking the teacher for assistance. Harfitt (2012b) conducted classroom
observations after the interviews, and the data supported the perception that students in
small classes had a higher level of participation. In the second study, Harfitt (2013)
focused on teacher perceptions instead of student perceptions and came to the same
conclusions. Harfitt (2013) conducted a case study of four English teachers, which
included multiple interviews and classroom observations. The research team observed
that teachers changed pedagogical practices in smaller classrooms and that their
relationship with students was much closer. Teachers reported and observers confirmed
that in smaller classes, teachers had a better understanding of their students and could
customize lessons to individual needs much more than in larger classes. In the third
study, Harfitt (2014) focused on the pedagogical changes made in reduced-size secondary
classrooms. These changes were based on recommendations of 43 10th grade students as
brokered by the researcher. Students suggested that teachers adopt more group work to
take advantage of the smaller classroom and to engage more students by varying types of
coursework. Observations showed that these changes created a greater sense of unity and
belonging in the classroom that could directly relate to increases in student achievement.
No Effects of Class Size Reduction
Similar to elementary and middle school levels, some studies at the secondary
level showed that CSR had little to no effect on student achievement as measured by
standardized tests. Shin and Chung (2009) conducted a meta-analysis of 17 studies in

32
four separate states in the United States. They found a great inconsistency in results with
overall student achievement increasing slightly, but with 10th grade students, smaller
class size actually had a negative effect on achievement.
Corak and Lauzon (2009) used PISA data of 15-year-old students in Canada to
determine the effects of class size and time-in-term on student achievement as measured
by scores on the PISA test. They only examined scores from the reading portion of the
test, and differences from other subject matter were not investigated. The total student
population of this study was 30,000, and a random sample of students within a targeted
school sample was used. When analyzing the different provinces in Canada, results were
inconclusive. The researchers found that students in some provinces exhibited
improvement of test scores from CSR while others showed little to no change.
Wyss, Tai, and Sadler (2007) conducted a study of approximately 7,000 students
in 31 different U.S. states to determine if class size in high school science classes had a
lasting impact on student achievement. They analyzed student grades in freshman-level
college science classes. The researchers found little to no change until class sizes fell
below 11 students. This study, unlike the one at the middle school level in which student
achievement was also studied in a specific subject area not using a standardized test,
showed no change in student achievement.
Owoeye and Yara (2011) conducted a study of 50 secondary schools in Nigeria to
determine if class size had an effect on student achievement at the secondary level. The
researchers used a t test to analyze student scores on the West African School
Certification Examination from 1990 to 1997. At a .05 confidence level, they found that

33
class size had no statistically significant effect on student achievement, and there was no
significant difference in achievement between small classes and large classes in both
urban and rural communities.
Jakobsson, Persson, and Svensson (2013) focused on mental health problems in
lieu of student. In a study of 2,755 ninth grade Swedish students, they found that class
size had no effect on mental health problems. While this may seem to contradict the
improvements in classroom dynamics seen in other studies, it should be noted that
researchers of this study used a voluntary questionnaire to collect data and the issue of
self-reporting could have had an impact on the validity of the results.
Conclusion for Secondary Education
Similar to results seen in elementary and middle school studies, the effect of class
size on student achievement for secondary school students were inconclusive. Atta et al.
(2011), Brühwiler and Blatchford (2011), Heinesen (2010), and Krassel and Heinesen
(2014) showed statistically significant improvements while Shin and Chung (2009),
Corak and Lauzon (2009), Wyss et al. (2007), Owoeye and Yara (2011), and Jakobsson
et al. (2013) showed little to no improvement. Of the studies at the secondary level
showing that class size had little to no effect on student achievement, the only one that
did not use standardized test scores was the Wyss et al. study. This study was unique in
that the researchers focused on sustained improvement after high school as opposed to
improvement while students were in the actual smaller classes. Shin and Chung, Corak
and Lauzon, as well as Owoeye and Yara, used standardized test results to measure
student achievement. By way of comparison, Atta et al. used teacher and student surveys

34
to determine changes in academic achievement, and using this type of self-report
instrument may have impacted the result of the study. While studies have shown
conflicting evidence about the effect of class size on student achievement, other studies
have shown that reducing class size can have other potential positive effects.
Other Potential Benefits of Class Reduction
Gottfredson and DiPietro (2011) pointed out that CSR could have other benefits
beyond just student achievement like class grades or standardized test scores. Their study
included 253 public secondary schools from across the United States and used data from
teacher and student surveys as well as from the National Study of Delinquency
Prevention in Schools. Using a hierarchical linear modeling approach to analyze the data,
the researchers found that students who attended schools with smaller student-teacher
ratios reported lower levels of student victimization than students who attended schools
with larger classes. They found that classroom dynamics in smaller classrooms led to a
much more effective teaching environment.
O’Brennan, Bradshaw, and Furlong (2014) examined the effect of teacher and
student perceptions on school climate. They used data from 1,881 fifth grade students and
90 teachers from 37 Maryland elementary schools. The researchers found that student
perceptions had a major influence on school climate and that one of the main contributing
factors to student achievement was student-teacher ratio.
Englehart (2007) conducted a qualitative study to gain a greater understanding
about why a reduction in class size could have a significant effect on student
achievement. Englehart’study took place in an Ohio middle school and consisted of

35
observations completed in two different subject classrooms, one small (15 students) and
one large (23 students). The two classrooms were different subjects and eight students
were members of both classes. Englehart interviewed the eight students in addition to
completing the observations. Englehart found that students were able to transition from
one task to another quicker in the small class and spent a greater amount of time engaged
in the material presented. In addition, the students interviewed stated that in the small
class, the atmosphere was much more conversational and familial. This helped facilitate
their learning by opening lines of communication between teachers and students.
Handal, Watson, and Maher (2015) reported similar results in a study of
secondary school math teachers’ perspectives on class size in New South Wales,
Australia. They found that the preferred class size of nearly half of the respondents was
16–20 students. In addition, all of the 12 teachers interviewed for the study believed that
smaller class size was beneficial to student achievement. They believed that smaller class
sizes led to a decrease in classroom management issues which would be particularly
beneficial to lower achieving students. Harfitt (2012a) conducted a qualitative study of
three secondary school English teachers in Hong Kong who also reported they held the
same beliefs as the teachers in the Handal et al. study. He found that teachers reported
they were able to foster more intrapersonal relationships with students, could spend more
time for review of material if needed, and had fewer discipline problems in smaller
classes.
Blatchford, Bassett, and Brown (2011) found that student engagement increased
in smaller classrooms. They used observations to determine the amount of classroom

36
engagement and student-teacher interactions at both the secondary and primary level. The
study was conducted in England at 49 different schools with eight students observed in
each class. At the primary level, the average class size was 23, and at the secondary level,
the average class size was 18. Blatchford et al. found that in larger classes, student
interaction with teachers decreased at all grade levels, and additionally, at the secondary
level, lower achievers were off-task much more.
Din (1999) conducted a study of 55 Chinese rural teachers from 132 schools with
a population of 41,200 students. The average class size in the study was 48 students. Din
found that students in smaller classes tended to help the teacher with classroom
management, had more positive student-teacher interactions, and received more
individualized help from teachers. Fan (2012) obtained similar results in a meta-analysis
of CSR studies. The researcher found that smaller classes gave students more access to
computers and additional space, and teachers were able to spend less time on classroom
management, which in turn led to greater student achievement. Konstantopoulos and Sun
(2014) analyzed data from the Project STAR study and found that teacher effects
(teaching skills and practices) had a larger impact on student achievement in smaller
classrooms than regular size classrooms.
Smaller class sizes were also shown to give teachers an opportunity to increase
parental involvement and improve teacher curriculum planning and development.
DiBiase and McDonald (2015) surveyed 275 middle and secondary school science
teachers from four North Carolina school districts about their attitudes towards inquiry
based learning and obstacles that they might face in implementing inquiry based learning

37
curriculums. While over 90% of respondents stated that inquiry based learning was a
highly effective learning tool, 68% also stated that large class size greatly hindered their
ability to implement inquiry based learning into their curriculums. Graue Hatch, Rao, and
Oen (2009) and Graue, Rauscher, and Sherfinski (2009) performed analyses of the
Student Achievement Guarantee in Education (SAGE) program which lowered class
sizes in K–3 in Wisconsin. The researchers found that smaller classes gave teachers more
opportunities to reach out to parents and include them in the educational process. They
looked at three specific schools in the SAGE program that were chosen due to their
unusually large increases in student achievement after SAGE implementation. The
researchers conducted seven half-day observations in classrooms, and interviews were
conducted with the school staff at the three schools. They found that teachers who used
smaller classes to differentiate and individualize their curriculums showed significant
gains in student achievement. Rodriguez and Elbaum (2014) analyzed the role of student-
teacher ratio in parental perceptions in Florida schools ranging from elementary to
secondary education. They determined student-teacher ratios by taking the total number
of students and dividing it by the total number of teachers. Rodriguez and Elbaum
collected parental perceptions from a state-wide database of parental interactions. The
researchers found that student-teacher ratio was the strongest predictor of parental
engagement when compared to school size, grade level, and social economic status. They
surmised that teachers with smaller class sizes had more time to interact with parents and
to develop more personal bonds.

38
Fredriksson, Öckert, and Oosterbeek (2013) analyzed the long-term effects of
class size on teenagers’ (ages 13–16) cognitive and noncognitive achievement, and their
wages and earnings as adults (ages 27–42). The researchers analyzed fourth through sixth
grade classrooms in Sweden. They found that smaller class sizes had a statistically
significant impact on earnings and abilities. A one student reduction in class size resulted
in a 0.8% increase in the chance of earning a college degree and a 1.2% increase in
earnings relative to the average. In addition, at age 13, students who were in small classes
in Grades 4 through 6 had an increase in cognitive abilities of 0.23 standard deviations,
and a one student decrease in class size increased noncognitive ability by 0.026 standard
deviations. By age 16, a one student decrease in class size when in Grades 4 through 6
yielded an increase in student achievement of 0.023 standard deviations. These findings
indicate that an increase in the cost of education from CSR for the state would result in an
increase in future wage earnings for its constituents.
Class Size Manipulation
Barrett and Toma (2013) examined whether principals adjust class size based on
teacher effectiveness by either increasing or decreasing the number of students in a class.
They used class size data from 10 Kentucky school districts for the years 2000 through
2008. Math courses from elementary level to high school level were included in the
study. The researchers used teacher-student observations as well as standardized test
scores to determine teacher effectiveness. Effective teachers had larger class sizes than
less effective teachers. In a study of all high school seniors in Israel for the 2003 school
year, Cohen-Zada, Gradstein, and Reuven (2013) found similar principal manipulation of

39
class size occurring. Using a regression discontinuity analysis of 64,429 students, Cohen-
Zada et al. found that principals not only allocated students based on student strength, but
even tried to manipulate maximum class size rules to give disadvantaged students smaller
classes.
Principal manipulation of class size could have a significant impact on any studies
in which researchers are attempting to determine the impact of class size on student
achievement. Petrilli and Northern (2014) conducted a study to determine if students
could achieve more in larger classes with high performing teachers than in small classes
with lower performing teachers. Using fifth and eighth grade test score data in North
Carolina, they found that over a 4 year period, when 12 additional students were assigned
to effective teachers, it would be the equivalent of adding two and a half weeks to the
school year. Giving lower performing teachers smaller classes also showed an
improvement in student grades, indicative that class size does have an effect on student
achievement although not as significant as teacher ability.
Bosworth (2014) conducted a study to determine not only whether class size
manipulation was occurring, but also whether this manipulation on class size would have
an impact on student achievement. He used end-of-grade test results in math and reading
from fourth and fifth grade students in North Carolina and demographic data taken from
the North Carolina Education Research Center. Bosworth found that classrooms
exhibited significant evidence of non-random assignment based on income, learning
level, parental education, and student ability. In addition, he found that African
American, free and reduced-price lunch, and learning disabled students were assigned to

40
smaller classes. This means that students who traditionally struggle in school were
assigned to smaller classes at a much higher rate than students who performed well in
school. When classroom composition was not taken into account, smaller class size
showed no effect on student achievement. However, when class composition was taken
into account, Bosworth found a small but statistically significant effect. A one student
decrease in class size resulted in a 0.0052 standard deviation increase in student
achievement.
Confounding Variables Impacting Student Achievement
Studies undertaken by researchers at all levels of education investigating the
effect that class size had on student achievement has offered inconclusive evidence about
the actual effects on student achievement. As a result, other confounding variables not
accounted for in these studies may have had an effect on student achievement. Parenting,
teaching strategies, school principals, school size, and the emotional state of the students
themselves all may have had an effect on student achievement.
Chen (2015), Arefi, Naghibzadeh, and Boloki (2014), and Bong Joo, Hyun Suk,
Se Hee (2014) studied the effect of parenting on student achievement. Chen examined the
effects of two types of parenting styles in China, authoritative (rational, democratic, and
flexible) and authoritarian, on students’ GPA, an outcome measure of student
achievement. Chen found that students with authoritative parents had statistically
significant higher GPAs than students with authoritarian parents. With a sample of 270
participants, ages 13–19, in Urmia Iran, Arefi et al. studied the effect of parental
emotional attachments on student achievement. The researchers used questionnaires to

41
determine emotional attachment and academic achievement and then used Pearson
correlation to test their research questions. They found a positive, statistically significant
correlation between parental emotional attachment and student achievement. Bong Joo et
al. studied the effects of parenting behaviors on low and high income households. They
conducted the study in Korea using the Korean Welfare Panel Study, a nationwide,
longitudinal survey. A total of 609 participants were included, ages 14–16. The
researchers found that for both low and high income earners, parenting behaviors had a
statistically significant effect on student achievement.
Ercan (2014) studied the effect of teacher use of multimedia in the classroom on
student achievement. He used a pretest/posttest model with 62 fifth grade Turkish student
participants. Ercan found that teacher utilization of multimedia had a statistically
significant positive impact on student achievement. Rashidi and Moghadam (2014)
studied the effect of teacher self-efficacy on student achievement. They conducted the
study in Shiraz, Iran, with 16 instructors and 225 middle school student participants.
Using multiple regression, Rashidi and Moghadam found that teachers with a high level
of self-efficacy had students with a high level of academic achievement and student
satisfaction. Ngware, Oketch, and Mutisya (2014) studied the effects of teaching style on
student achievement. They conducted the study in the six lowest achieving Kenyan
primary schools. The researchers used the Kenya Certificate of Primary Education to
measure student achievement and a combination of questionnaires and observations to
determine teaching style. Ngware et al. found that teaching experience greatly increased
student achievement and that the effect was far greater than that of class size reduction.

42
Ekembe (2014) studied the effect of teaching methodology on foreign language
classrooms. He focused his investigation on two teaching styles, direction instruction and
teacher-led interaction, and used a pretest, posttest, and delayed posttest experimental
design. Ekembe found a higher level of student achievement from the students who had
direct-instruction while the students in the teacher-led interaction group had a higher
level of long-term retention as measured in the delayed posttest.
Tatlah, Iqbal, Amin, and Quraishi (2014) studied the effect of principal behaviors
on the academic achievement of tenth grade students in Punjab, Pakistan. Sixty-four
principals and 1,920 students participated in the study. They measured academic
achievement using annual examination results. Using multiple regression analysis, Tatlah
et. al found that different principal leadership behaviors had a statistically significant
impact on student achievement. Walker, Lee, and Bryant (2014) studied the effect of
specific principal leadership styles on academic achievement in secondary schools in
Hong Kong. One hundred seventy-nine staff members and 2,037 students from 42
different schools took part in the study. They used surveys to determine leadership style
and standardized tests to determine academic achievement. The researchers studied three
different leadership styles: utilization of communication structures, quality assurance and
accountability, and resource management. Walker et. al found that utilization of
communication structures leadership style had a statistically significant positive impact
on student achievement while both the quality assurance and accountability and resource
management leadership styles had a negative impact on student achievement.

43
Gershenson and Langbeing (2015) studied the effect of school size on student
achievement of fourth and fifth grade students in North Carolina. They used end-of-grade
tests to determine student achievement. Overall, they found that school size had no
statistically significant effect on student achievement. However, Gershenson and
Langbeing did find that in terms of students with learning disabilities and low income,
school size did have a statistically significant effect on student achievement. When
separating school size into individual grades, they found that a 10 student increase in
grade size decreased reading and math scores by 0.015 standard deviations.
Costa and Faria (2015), Tulbure (2014), and Wang et al. (2014) conducted studies
investigating the effect of the emotional state of the students themselves on academic
achievement. Costa and Faria examined the effect of emotional intelligence on academic
achievement. They conducted the study in Portugal with 380 10th–12th grade student
participants. The researchers found that emotional intelligence had a very strong ability to
predict academic achievement. In a study of 284 students ranging in age from 18–25,
Tulbure (2014) found that lower academic achievement was associated with isolationism,
emotional instability, and negative self-image. Higher academic achievement was
associated with conformity, conscientiousness, and positive self-image. In a study of
1,023 fifth grade students from 50 schools in Ontario, Canada, Wang et al. (2014) found
that peer victimization had a significant effect on student achievement. They found that
this effect on student achievement was not moderated by an otherwise positive school
climate.

44
Implications
Proponents of small class sizes have argued that decreasing class size is the
simplest, most direct approach to improving student achievement (Classes, 2011). While
many researchers have found that class size had an impact on student achievement, the
specific class size was very much in dispute, and there was little to no consensus about
what the optimal size would be and how much of an improvement could actual be gained.
Funkhouser (2009) suggested that there were two competing forces at work when
reducing class size. Increases in teacher-to-student interactions would produce an
improvement in student achievement while a decrease in student-to-student interaction
would create a negative result. Jirjahn, Pfeifer, and Tsertsvadze (2009) argued that it was
impossible to determine the effects of class size without taking into account instructor
fixed effects. In cases where students were allowed to choose their teachers, more highly
qualified teachers would have larger class sizes and as Bosworth (2014) found, principals
often manipulate class size, giving highly qualified teachers larger classes. This would
mitigate the effects of larger class sizes on student grades.
Skeptics have argued that given the substantial cost of CSR and the lack of
definitive improvements in student achievement, there were far better and more cost
effective ways to improve student achievement (Classes, 2011). Normore and Ilon (2006)
conducted a cost effectiveness analysis of Florida’s class reduction law and found that
reducing class size was the single most expensive way to attempt to increase student
achievement and recommended that investing in other strategies such as teacher quality
could produce the same or better results at a lower cost. However, Cheung and Chan

45
(2008) analyzed data from the International Institute for Management Development’s
2004 yearbook and found a positive correlation between countries that spent more on
education by investing in smaller class sizes and higher world rankings in math and
reading. Also, the cost of CSR was, in some cases, overstated. The cost of implementing
the Florida legislation that limited class size to 20 students per teacher in Grades 1–3
actually came in below the original predicted estimates (Januszka & Dixon-Krauss,
2008). Given the great deal of uncertainty of the benefits of class size reduction at all
levels of education, the purpose of this study was to determine the effects of class size at
the secondary school level in a school district in South Carolina.
Summary
The benefit of CSR on student achievement from primary to secondary education
is inconclusive. Some studies indicate that CSR has a large positive impact on student
achievement while other studies show little to no impact on student achievement. At the
elementary school level, the Project STAR study showed a significant improvement in
student achievement when class sizes were reduced. However, later re-analysis of the
Project STAR study data offered conflicting results with some studies supporting the
Project STAR study’s findings while others finding major flaws with the methodology
used that called into question the report’s results. At the middle school level, Chingo
(2012) analyzed standardized test scores and found little to no improvement in student
achievement while Heinesen’s (2010) study focused on specific subjects and showed an
improvement. At the secondary level, Atta et al. (2011) and Brühwiler and Blatchford
(2011), Heinesen (2010), and Krassel and Heinesen (2014) showed statistically

46
significant improvements in academic achievement while Wyss et al. (2007), Shin and
Chun (2009), Corak and Lauzon (2009), and Owoeye and Yara (2011) showed little to no
improvement.
While the effects of CSR on student achievement are inconclusive, research does
show that CSR can have positive effects on student engagement. In addition, parents,
students, and teachers believe that smaller class size creates a more positive learning
environment for students. While these effects may not translate into higher standardized
test scores, they may result in students in smaller classes achieving higher ECG. Based on
the inconclusive findings in the literature, further study is warranted to determine the
effect of class size on student ECG. In the next section, Section 3, I discuss the research
design that was used to conduct this study.

47
Section 3: The Methodology
Introduction
The purpose of this quantitative study was to determine the effect of class size on
student achievement in secondary school as measured by TIECNSG. To address this
purpose, the following research question guided the study: Does class size have an effect
on student achievement in secondary school as measured by TIECNSG? In this section, I
described the methodology that was used to answer this research question, specifically
the research design and approach, setting and sample, instrumentation and materials, data
collection and analysis, and the role of the researcher.
Research Design and Approach
In this study, I used a correlational research design, specifically testing a linear
regression model to answer the research question. In South Carolina, all grades are
recorded on a 100-point grading scale, so raw scores of student grades were used as the
criterion variable. In this study, the academic subjects analyzed were the core high school
subjects of English language arts, math, science, and social studies. Teachers have some
discretion in the makeup of course assignments and how much each assignment counts
toward the ECG; however, similar courses taught at the same school are required to have
aligned grading standards. Across the district, curriculum coordinators make sure that all
schools align grading standards for similar courses. Other electives were excluded from
the study because there might be less consistency in the grading methodology from
teacher to teacher than there are with the core subjects.

48
Setting and Sample
The participants for this study were the students in five of the nine secondary
schools in the South Carolina district under study. These five secondary schools were
chosen because the selected demographic variables were least dissimilar among the five
schools than other high schools within the district. Figure 1 shows a comparison of the
ethnicities of students at the selected secondary schools. While each school is not exactly
similar in its ethnic composition, combined, they are representative of the population of
the county.
Figure 1. School breakdown by ethnicity during the 2010-2011 school year. Adapted
from “School Detail for County," by National Center for Education Statistics, 2012,
http://nces.ed.gov/ccd/schoolsearch/school_detail
0
10
20
30
40
50
60
70
80
90
100
White Black Hispanic Asian Other
HS 1
HS 2
HS 3
HS 4
HS 5
Ethnicity
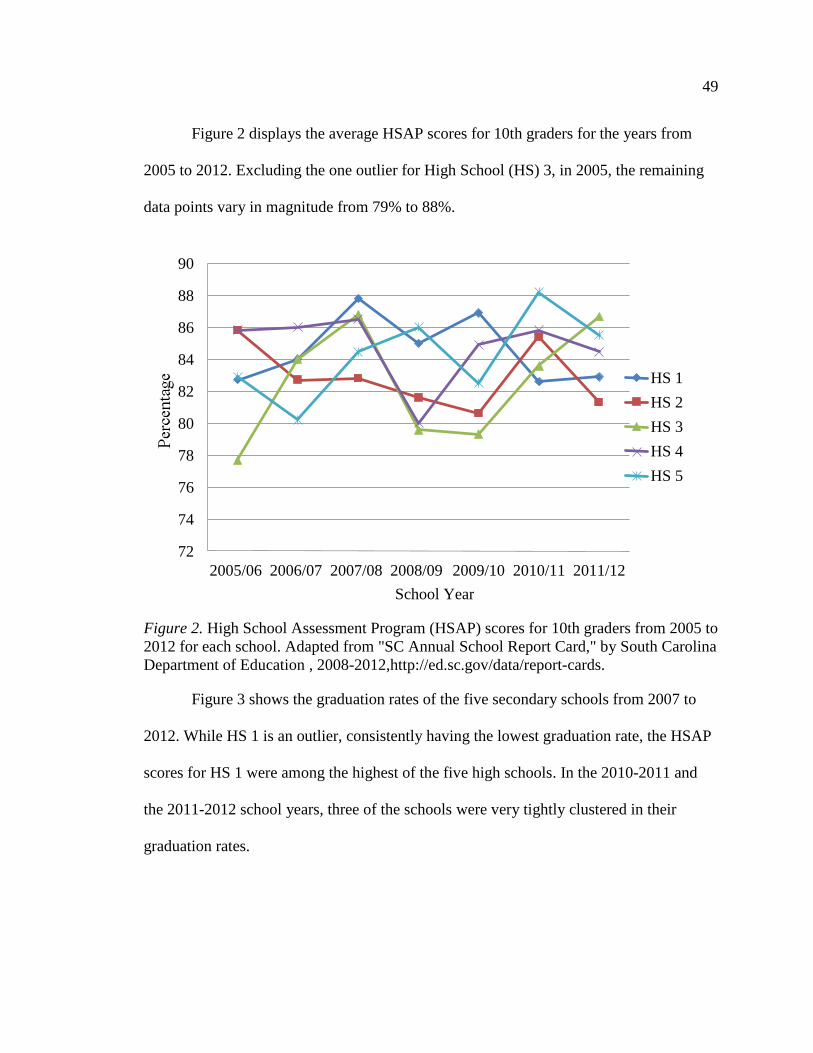
49
Figure 2 displays the average HSAP scores for 10th graders for the years from
2005 to 2012. Excluding the one outlier for High School (HS) 3, in 2005, the remaining
data points vary in magnitude from 79% to 88%.
Figure 2. High School Assessment Program (HSAP) scores for 10th graders from 2005 to
2012 for each school. Adapted from "SC Annual School Report Card," by South Carolina
Department of Education , 2008-2012,http://ed.sc.gov/data/report-cards.
Figure 3 shows the graduation rates of the five secondary schools from 2007 to
2012. While HS 1 is an outlier, consistently having the lowest graduation rate, the HSAP
scores for HS 1 were among the highest of the five high schools. In the 2010-2011 and
the 2011-2012 school years, three of the schools were very tightly clustered in their
graduation rates.
72
74
76
78
80
82
84
86
88
90
2005/06 2006/07 2007/08 2008/09 2009/10 2010/11 2011/12
HS 1
HS 2
HS 3
HS 4
HS 5
School Year

50
Figure 3. Graduation rates from 2007 to 2012 for each school. Adapted from "SC Annual
School Report Card," by South Carolina Department of Education, 2008-
2012,http://ed.sc.gov/data/report-cards.
Figure 4 displays the number of eligible students for free lunches for the 2009-
2010 school year for the five secondary schools under study. This is the most recent year
for which these data are available. Between 33% to 49% of the students in these schools
receive free lunches, which is a proxy measure of socioeconomic status. While HS 3 and
HS 2 have the highest percentage of students receiving free lunches, they also have some
of the highest graduation rates.
60
65
70
75
80
85
90
2007/08 2008/09 2009/10 2010/11 2011/12
HS 1
HS 2
HS 3
HS 4
HS 5
School Year

51
Figure 4. Each school’s eligibility for free lunch during the 2009-2010 school year.
Adapted from "School Detail for County," by National Center for Education Statistics,
2012, http://nces.ed.gov/ccd/schoolsearch/school_detail.
The total number of students enrolled in those schools during the 2012-2013
school year was approximately 7,300 (National Center for Education Statistics, 2012). In
a given year, nearly each secondary student takes one of the four core courses, so the total
number of student grades in mandatory courses was approximately 20,000. For the
purpose of this study, students who dropped out of the course prior to completion were
excluded from the sample. These students were identified because their ECG were
labeled failure due to attendance. According to Wilson Van Voorhis and Morgan (2007),
the minimum reasonable sample size for regression analysis is 50. Soper (2014)
recommended that if a small effect size is anticipated, then a power of .80 and alpha
value of .05 be used in priori sample size calculations. The minimum sample size is 385
for running a linear regression with one predictor for each class type (Algebra 1,
Chemistry Honors, Global Studies 1, etc.). The total number of class types is 40 for the
0
10
20
30
40
50
60
HS 1 HS 2 HS 3 HS 4 HS 5
Eligible for free
lunch (2009/10)
School

52
four core subjects (English language arts, mathematics, science, and social studies) which
would result in a total sample size of 15,400. Therefore, the entire population was used
for this study which consisted of 17,582 TIECNSG.
Instrumentation and Materials
In this study, I determined the effect of class size on TIECNSG for secondary
schools. Class size was the independent (predictor) variable. Student achievement as
measured by TIECNSG, was the dependent (criterion) variable with numerical values
from 0 to 100.
The data used to test the null hypotheses were archival in nature and consisted of
TIECNSG and class size. These data, while not public, are stored at the district office and
collected with grading software currently used by all secondary school teachers in the
district. At the conclusion of each course, every teacher in the district uploads a
spreadsheet for each class that consists of the number of students, the course taught, and
the ECG for each student. ECG are calculated from assignments consisting of homework,
class work, major projects, quizzes, and tests. Teachers have some discretion in the
makeup of these assignments and how much each assignment counts toward the ECG;
however, similar courses taught at the same school are required to have aligned grading
standards and across the district, curriculum coordinators make sure that all schools align
grading standards for similar courses.
Data Collection and Analysis
Prior to data collection, approval was received from Walden’s IRB (approval
number 03-18-14-0171335).The data for this study were collected from the district

53
database and electronically copied by class size and class type into a single data file by
the director of program evaluation and assessment of the district. I analyzed the collected
data using SPSS 22.0 for Windows. The effect of class size was examined using a linear
regression test. Green and Salkind (2011) recommended the use of a bivariate linear
regression test to assess how well an independent (predictor) variable can predict a
dependent (criterion) variable. The predictor variable in this study was class size and the
criterion variable was teacher-issued end-of-course numerical student grade (ranging
from 0-100).
The typical confidence level used in educational research is .05 (Hadzi-Pavlovic,
2009), which I used in this study. The equation I used to model the relationship between
TIECNSG and class size is as follows:
y = xβ + ε
y is the dependent variable (TIECNSG), x is the independent variable (class size), β is the
regression coefficient, and ε is the error term. The error term was used to account for any
factors that might have affected the dependent variable besides the independent variable.
To calculate β, an ordinary least squares approach was used (Mendenhall & Sincich,
1996).
Role of the Researcher
The main ethical concern in this study was that private student records were
accessed. To maintain confidentiality and to protect the anonymity of students, student
names were deidentified from their grades. This step was completed by the director of
program evaluation and assessment at the district office prior to my receiving the data. I

54
was given the data, which consisted of TIECNSG, class size, and subject on a flash drive
in a password protected zip file. The password was only known by me. From this flash
drive, I copied the data onto my district-issued, password protected laptop.
All data were analyzed on my district-issued laptop, which had protections in
place to protect sensitive student data already on the laptop. These preventions included a
password that was only known by me as well as tracking software that can determine the
exact location of the laptop at all times. The laptop remained in my possession during the
entirety of this study. In addition, I was the only individual to access the laptop
throughout the study.
I entered and analyzed all data using my district-issued laptop. Backup copies of
the raw and analyzed data were stored on a flash drive in a password protected file.
Throughout the entire process, I was the only person with access to the data both before
and after they were analyzed. The data were deleted from the laptop immediately
following the analysis of the data and will remain on the flash drive in a locked cabinet in
my home office at my personal residence for 5 years.
Conclusion
To answer the research question of whether class size has an effect on student
achievement in secondary schools (Grades 9–12) as measured by TIECNSG, a
correlational design was used, and linear regression was performed to analyze the data.
Class size was the independent (predictor) variable and student achievement, as measured
by TIECNSG, was the dependent (criterion) variable. The sample consisted of 17,582
TIECNSG from the five schools examined in this study. The main ethical concern was

55
that private student records would be accessed. To maintain confidentiality and to protect
the anonymity of students, their names were deidentified from their grades prior to my
access to the data.
The next section presents an in-depth summary of the results of analyzing the
data. The research question is addressed and answered based on the results of the data
analysis.

56
Section 4: Results
Introduction
The purpose of this quantitative study was to determine the effect of class size on
student achievement in secondary school as measured by TIECNSG. To address this
purpose, the following research question guided the study: Does class size have an effect
on student achievement in secondary school as measured by TIECNSG? This section
describes the results of analyzing the data using a linear regression model. The data were
first organized by subject, and then linear regression was performed for each class type.
English
The English courses taught at the five high schools participating in this study
consisted of eight class types: English 1, English 1 Honors, English 2, English 2 Honors,
English 3, English 3 Honors, English 4, and English 4 Honors. A total of 5,430 grades
were used, which consisted of all grades for the 2012-2013 school year, excluding
failures due to absences and special education students in pull-out, single person courses.
As shown in Table 3, of the eight courses, only English 2, English 2 Honors, and English
4 yielded results that were statistically significant (p < .05). Of these three class types,
English 2 and English 2 honors yielded negative B values of -0.37 and -0.27,
respectively; this indicates that as class size increases, TIECNSG decreases. However,
English 4 yielded a positive B value of 0.31 indicating that as class size increases,
TIECNSG increase as well. English 2 yielded a R value of .09, English 2 Honors a R
value of .11, and English 4 a R value of .10. An R value of .10 indicates a small effect
size (Foster, Barkus, & Yavorsky, 2006).
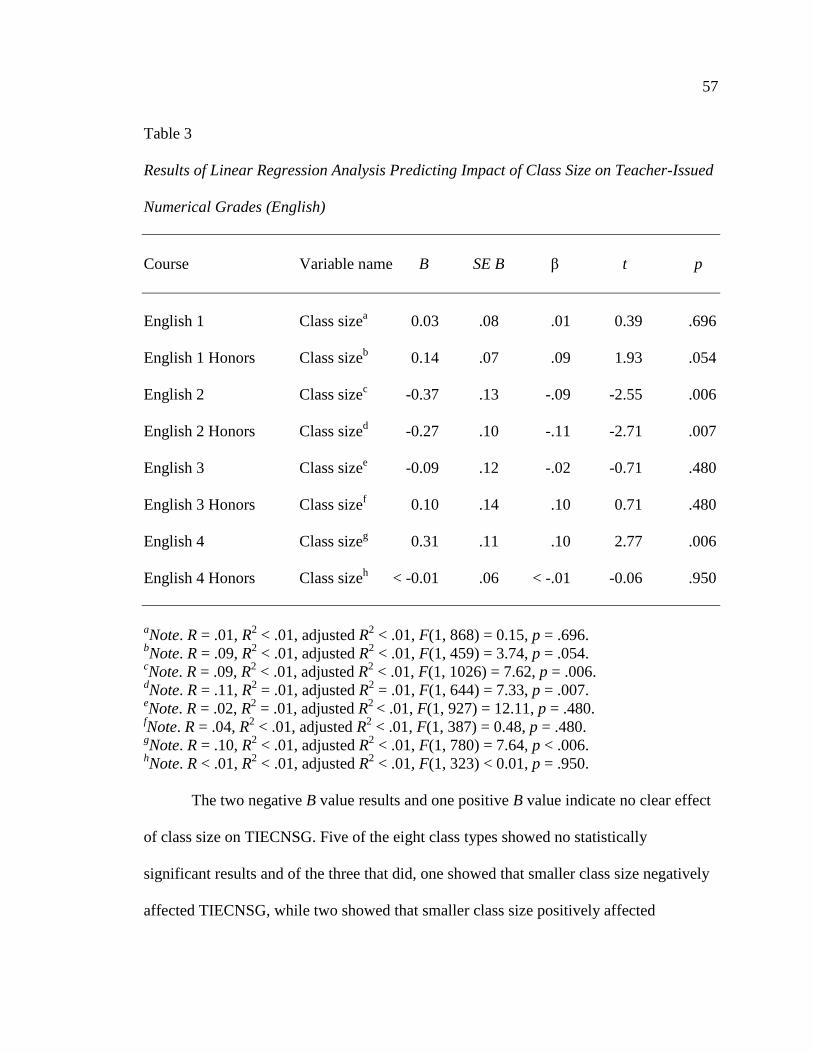
57
Table 3
Results of Linear Regression Analysis Predicting Impact of Class Size on Teacher-Issued
Numerical Grades (English)
Course Variable name B SE B β t p
English 1 Class sizea 0.03 .08 .01 0.39 .696
English 1 Honors Class sizeb 0.14 .07 .09 1.93 .054
English 2 Class sizec -0.37 .13 -.09 -2.55 .006
English 2 Honors Class sized -0.27 .10 -.11 -2.71 .007
English 3 Class sizee
-0.09 .12 -.02 -0.71 .480
English 3 Honors Class sizef
0.10 .14 .10 0.71 .480
English 4 Class sizeg 0.31 .11 .10 2.77 .006
English 4 Honors Class sizeh < -0.01 .06 < -.01 -0.06 .950
aNote. R = .01, R
2 < .01, adjusted R
2 < .01, F(1, 868) = 0.15, p = .696.
bNote. R = .09, R
2 < .01, adjusted R
2 < .01, F(1, 459) = 3.74, p = .054.
cNote. R = .09, R
2 < .01, adjusted R
2 < .01, F(1, 1026) = 7.62, p = .006.
dNote. R = .11, R
2 = .01, adjusted R
2 = .01, F(1, 644) = 7.33, p = .007.
eNote. R = .02, R
2 = .01, adjusted R
2 < .01, F(1, 927) = 12.11, p = .480.
fNote. R = .04, R
2 < .01, adjusted R
2 < .01, F(1, 387) = 0.48, p = .480.
gNote. R = .10, R
2 < .01, adjusted R
2 < .01, F(1, 780) = 7.64, p < .006.
hNote. R < .01, R
2 < .01, adjusted R
2 < .01, F(1, 323) < 0.01, p = .950.
The two negative B value results and one positive B value indicate no clear effect
of class size on TIECNSG. Five of the eight class types showed no statistically
significant results and of the three that did, one showed that smaller class size negatively
affected TIECNSG, while two showed that smaller class size positively affected

58
TIECNSG. In all three cases, the effect size was small. Therefore, for the subject of
English, based on these results, the null hypothesis that class size in secondary school
cannot predict student achievement as measured by TIECNSG cannot be definitively
rejected.
Mathematics
The mathematics courses taught at the five high schools participating in this study
consisted of nine class types: Algebra 1, Algebra 1 Honors, Algebra 2, Algebra 2 Honors,
Geometry, Geometry Honors, Pre-Calculus, Pre-Calculus Honors, and Probability and
Statistics. A total of 4,171 grades were used, which consisted of all grades for the 2012-
2013 school year, excluding failures due to absences and special education students in
pull-out, single person courses. As shown in Table 4, of the nine courses, Algebra 1,
Algebra 1 Honors, Algebra 2, Algebra 2 Honors, Pre-Calculus, and Pre-Calculus Honors
all yielded results that were statistically significant (p < .05). Of these six class types,
only Algebra 1 and Pre-Calculus yielded negative B values of -0.22 and -1.04,
respectively; this indicates that as class size increases, TIECNSG decreases. However,
Algebra 1 Honors, Algebra 2, Algebra 2 Honors, and Pre-Calculus Honors yielded
positive B values of 0.29, 0.33, 0.28, and .26, respectively, indicating that as class size
increases, TIECNSG increase as well.

59
Table 4
Results of Linear Regression Analysis Predicting Impact of Class Size on Teacher-Issued
Numerical Grades (Mathematics)
Course Variable name B SE B β t p
Algebra 1 Class sizea -0.22 .06 -.14 -3.76 <.001
Algebra 1 Honors Class sizeb 0.29 .14 .24 2.11 .039
Algebra 2 Class sizec 0.33 .14 .08 2.49 .013
Algebra 2 Honors Class sized 0.28 .13 .10 2.19 .029
Geometry Class sizee
0.08 .06 .04 1.24 .214
Geometry Honors Class sizef -0.19 .14 -.06 -1.32 .186
Pre-Calculus Class sizeg -1.04 .23 -.38 -4.57 < .001
Pre-Calculus Honors Class sizeh
0.26 .13 .11 2.04 .042
Probability and Statistics Class sizei
-0.03 .11 -.03 -0.22 .824
aNote. R = .14, R
2 = .02, adjusted R
2 = .02, F(1, 687) = 14.17, p < .001.
bNote. R = .24, R
2 = .06, adjusted R
2 = .05, F(1, 70) = 4.44, p = .039.
cNote. R = .08, R
2 < .01, adjusted R
2 < .01, F(1, 858) = 6.17, p = .013.
dNote. R = .10, R
2 = .01, adjusted R
2 = .01, F(1, 497) = 4.77, p = .029.
eNote. R = .04, R
2 < .01, adjusted R
2 < .01, F(1, 797) = 1.55, p = .214.
fNote. R = .06, R
2 < .01, adjusted R
2 < .01, F(1, 442) = 1.75, p = .186.
gNote. R = .38, R
2 = .14, adjusted R
2 = .14, F(1, 124) = 20.91, p < .001.
hNote. R = .11, R
2 = .01, adjusted R
2 < .01, F(1, 373) = 4.16, p = .042.
iNote. R = .01, R
2 < .01, adjusted R
2 < .01, F(1, 305) = 0.05, p = .824.

60
Algebra 1, Algebra 2, Algebra 2 Honors, and Pre-Calculus yielded R values of .14, .08,
.10, and .11, respectively, indicating a small effect size. Algebra 1 Honors had an R value
of .24, indicating a small-to-medium effect size, and Pre-Calculus had an R value of .38,
indicating a medium effect size. An R value of .30 indicates a medium effect size (Foster,
Barkus, & Yavorsky, 2006).
These two negative B value results and four positive B value indicate no clear
effect of class size on TIECNSG. Three of the nine class types showed no statistically
significant results and of the six that did, four showed that smaller class size negatively
affected TIECNSG, while two showed that smaller class size positively affected
TIECNSG. The only class type that showed smaller class size had a strong effect on
TIECNSG was Pre-Calculus; however, there were conflicting results in four other
classes. Therefore, for the subject of mathematics, based on these results, the null
hypothesis that class size in secondary school cannot predict student achievement as
measured by TIECNSG cannot be definitively rejected.
Science
The science courses taught at the five high schools participating in this study
consisted of 13 class types: Anatomy, Anatomy Honors, Biology, Biology Honors,
Chemistry, Chemistry Honors, Environmental Science, Marine Science, Marine Science
Honors, Physical Science, Physical Science Honors, Physics, and Physics Honors. A total
of 4,129 grades were used, which consisted of all grades for the 2012-2013 school year,
excluding failures due to absences and special education students in pull-out, single
person courses. As shown in Table 5, of the 13 courses, only Biology, Marine Science,

61
Physical Science, Physical Science Honors, and Physics Honors yielded results that were
statistically significant (p < .05). Of these five class types, Biology, Marine Science and
Physical Science yielded negative B values of -0.47, -0.34 and -0.49, respectively; this
indicates that as class size increases, TIECNSG decreases. However, Physical Science
Honors and Physics Honors yielded a positive B value of 0.30 and 0.65, respectively,
indicating that as class size increases, TIECNSG increase as well. Biology, Marine
Science, Physical Science, and Physical Science Honors yielded R values of .15, .15, .12,
and .12 respectively. These values indicate a small effect size. Physics Honors yielded an
R value of .27, indicating a small-to-medium effect size (Foster, Barkus, & Yavorsky,
2006).
These three negative B values and two positive B values indicate no clear effect of class
size on TIECNSG. Eight of the 13 class types showed no statistically significant results
and of the five that did, two showed that smaller class size negatively affected TIECNSG
while three showed that smaller class size positively affected TIECNSG. The only class
type that showed smaller class size had a strong effect on TIECNSG was Physics Honors,
which actually showed that increasing class size had a positive effect on TIECNSG.
Therefore, for the subject of science, based on these results, the null hypothesis that class
size in secondary school cannot predict student achievement as measured by TIECNSG
cannot be definitively rejected.

62
Table 5
Results of Linear Regression Analysis Predicting Impact of Class Size on Teacher-Issued
Numerical Grades (Science)
Course Variable name B SE B β t p
Anatomy Class sizea 0.28 .21 .13 1.31 .192
Anatomy Honors Class sizeb 0.59 .38 .12 1.55 .123
Biology Class sizec -0.47 .09 -.15 -5.08 < .001
Biology Honors Class sized -0.07 .07 -.05 -1.01 .313
Chemistry Class sizee
-0.24 .13 -.07 -1.83 .068
Chemistry Honors Class sizef -0.05 .12 -.02 -0.39 .698
Environmental Science Class sizeg 0.05 .23 .02 0.20 .843
Marine Science Class sizeh
-0.34 .11 -.15 -3.13 .002
Marine Science Honors Class sizei
0.14 .11 .12 1.33 .187
Physical Science Class sizej -0.49 .12 -.12 -4.13 < .001
Physical Science Honors Class sizek 0.30 .13 .12 2.42 .016
Physics Class sizel 0.26 .31 .09 0.84 .404
Physics Honors Class sizem
0.65 .24 .27 2.69 .008
aNote. R = .14, R
2 = .02, adjusted R
2 = .01, F(1,96) = 1.73, p = 192.
bNote. R = .12, R
2 = .01, adjusted R
2 < .01, F(1, 180) = 2.40, p = .123.
cNote. R = .15, R
2 = .02, adjusted R
2 = .02, F(1, 1061) = 25.79, p < .001.
dNote. R = .05, R
2 < .01, adjusted R
2 < .01, F(1, 494) = 1.02, p = .313
eNote. R = .07, R
2 < .01, adjusted R
2 < .01, F(1, 679) = 3.33, p = .068.
fNote. R = .02, R
2 < .01, adjusted R
2 < .01, F(1, 395) = 0.15, p = .698.
gNote. R = .02, R
2 = .14, adjusted R
2 = .14, F(1, 157) = 0.04, p = .843.
hNote. R = .15, R
2 = .02, adjusted R
2 = .02, F(1, 449) = 9.82, p = .002.
iNote. R = .12, R
2 = .01, adjusted R
2 < .01, F(1, 122) = 1.77, p = .187.
jNote. R = .12, R
2 = .01, adjusted R
2 = .01, F(1, 1203) = 17.02, p < .001.
kNote. R = .12, R
2 = .01, adjusted R
2 = .01, F(1, 430) = 5.87, p = .016.
lNote. R = .09, R
2 < .01, adjusted R
2 < .01, F(1, 86) = 0.70, p = .404.
mNote. R = .27, R
2 = .07, adjusted R
2 = .06, F(1, 94) = 7.25, p = .008.

63
Social Studies
The social studies courses taught at the five high schools participating in this
study consisted of 10 class types: Global Studies 1, Global Studies 1 Honors, Global
Studies 2, Global Studies 2 Honors, Government/ Economics, Government/ Economics
Honors, U.S. History, U.S. History 2, World Geography, and World History Honors. A
total of 3,852 grades were used, which consisted of all grades for the 2012-2013 school
year, excluding failures due to absences and special education students in pull-out, single
person courses. As shown in Table 6, of the 10 courses, only Government/Economics,
Government/Economics Honors, and World Geography yielded results that were
statistically significant (p < .05). Of these three class types, Government/Economics
Honors and World Geography yielded negative B values of -0.13 and -0.64, respectively;
this indicates that as class size increases, TIECNSG decreases. Government/Economics,
however, yielded a positive B value of 0.34, indicating that as class size increases,
TIECNSG increase as well. Government/ Economics yielded an R value of .15 and
Government/Economics Honors yielded an R value of .12, indicating a small effect size.
World Geography yielded an R of .22, indicating a small-to-medium effect size (Foster,
Barkus, & Yavorsky, 2006).

64
Table 6
Results of Linear Regression Analysis Predicting Impact of Class Size on Teacher-Issued
Numerical Grades (Social Studies)
Course Variable name B SE B β t p
Global Studies 1 Class sizea -0.33 .18 -.08 -1.82 .070
Global Studies 1 Honors Class sizeb -1.12 .85 -.15 -1.32 .191
Global Studies 2 Class sizec -0.17 .15 -.04 -1.18 .239
Global Studies 2 Honors Class sized 0.08 .50 .02 0.17 .868
Government/Economics Class sizee
0.34 .07 .15 4.62 < .001
Government/Economics Honors Class sizef -0.13 .06 -.12 -2.21 .028
US History Class sizeg -0.02 .08 -.01 -0.26 .793
US History 2 Class sizeh
0.30 .19 .10 1.55 .122
World Geography Class sizei
-0.64 .16 -.22 -4.04 < .001
World History Honors Class sizej -0.46 .59 -.09 -0.77 .443
aNote. R = .08, R
2 = .01, adjusted R
2 = .01, F(1, 490) = 3.30, p = .070.
bNote. R = .15, R
2 = .02, adjusted R
2 = .01, F(1, 80) = 1.74, p = .191.
cNote. R = .04, R
2 = .01, adjusted R
2 = .01, F(1, 725) = 1.39, p = .239.
dNote. R = .02, R
2 = .01, adjusted R
2 = .01, F(1, 82) = 0.03, p = .868.
eNote. R = .15, R
2 = .02, adjusted R
2 = .02, F(1, 919) = 21.33, p =.001.
fNote. R = .12, R
2 = .02, adjusted R
2 = .01, F(1, 325) = 4.87, p = .028.
gNote. R = .01, R
2 < .01, adjusted R
2 = .01, F(1, 1154) = 0.07, p = .793.
hNote. R = .10, R
2 = .01, adjusted R
2 = .01, F(1, 224) = 2.41, p = .122.
iNote. R = .22, R
2 = .05, adjusted R
2 = .04, F(1, 336) = 16.30, p = .001.
jNote. R = .09, R
2 = .01, adjusted R
2 = .01, F(1, 73) = 0.59, p = .443.

65
The two negative B value results and one positive B value indicate no clear effect
of class size on TIECNSG. Seven of the 10 class types showed no statistically significant
results and of the three that did, one showed that smaller class size negatively affected
TIECNSG, while two showed that smaller class size positively affected TIECNSG. The
only class type that showed class size had a strong effect on TIECNSG was World
Geography; however, there were conflicting results in the other two classes. Therefore,
for the subject of social studies, based on these results, the null hypothesis that class size
in secondary school cannot predict student achievement as measured by TIECNSG
cannot be definitively rejected.
Conclusion
The research question explored in this study was: Does class size have an effect
on student achievement in secondary school as measured by TIECNSG? Based on an
analysis of the data using a linear regression model, the null hypothesis could not be
definitively rejected. Moreover, the results were conflicting (i.e., smaller class size had a
positive impact on TIECNSG in some courses, and in others, smaller class size had a
negative impact). Therefore, class size does not have a clear impact on student
achievement in secondary school as measured by TIECNSG.
In the next section, I will present an overview of this study, discussing why and
how the study was done, reviewing the research question, and summarizing my findings.
In addition, I will present an interpretation of my findings based on the results detailed in
Section 4. Finally, I will provide implications for social change, recommendations for
action, and recommendations for future research.

66
Section 5: Discussion, Conclusion, and Recommendations
Introduction
This section includes a summary of the study based on the results described in
Section 4, a discussion of the findings based on those results, overall conclusions drawn
from the study, and recommendations for future action and research on the effect of class
size on student academic achievement as measured by TIECNSG. In the district where
this study was conducted, one of the recommendations for the 2012-2013 school budget
was to increase the class room size of fifth through 12th grades by one student (Grooms,
2011). However, there is no clear consensus in the educational research literature whether
increasing average class size in secondary school would have an effect on student
achievement. As a result, the purpose of this study was to predict the effect of changing
class sizes on TIECNSG.
This study addressed the following research question: Does class size in
secondary school predict student achievement as measured by TIECNSG? I used a
correlational research design. I used linear regression to analyze the data to answer the
research question.
Interpretation of Findings
All of the collected data were organized by subject, and a linear regression was
performed on each class type. Based on the results obtained, the null hypothesis could not
be rejected. Of the 40 different class types analyzed, only 17 of 40 yielded statistically
significant results. Out of those 17, nine showed that increasing class size had a negative

67
impact on TIECNSG, while eight showed that increasing class size had a positive impact
on TIECNSG.
These results were very similar in nature to the results found by Shin and Chung
(2009) and Corak and Lauzon (2009) in their studies performed at the secondary level. In
both studies, the researchers found a great inconsistency in results. Some of their results
showed smaller class size to have a positive effect on student achievement while others
showing a negative effect.
While smaller class size was not found to have a consistently positive effect on
student achievement in this study, this result does not mean that the positive benefits of
smaller class size described by Pritchard (1999) were not present. Studies undertaken by
researchers at all levels of education, investigating the effect of class size on student
achievement, have offered inconclusive evidence about the actual effects on student
achievement. Some studies have shown that CSR had a significant effect on student
achievement while others have shown that CSR had little to no effect. As a result, other
confounding variables not accounted for in this study may have had an effect on student
achievement. While parenting, teaching strategies, school principals, school size, and the
emotional state of the students themselves all could have had an effect on student
achievement; Bosworth (2014) described a practice that could be used to explain the lack
of results in this study. Bosworth reported that principal manipulation of class size was
occurring in public schools and that this manipulation could completely mask the positive
effects of smaller class sizes on student achievement. For example, a principal may
increase the class size of experienced, effective teachers while reducing the class size of

68
inexperienced, ineffective teachers. The effective teachers will compensate for any
negative impact resulting from the increase in class size while the ineffective teachers,
who lack the training and skill to take advantage of the opportunities to improve student
achievement provided by the smaller classroom, have access to fewer students.
Implications for Social Change
Based on the results of this study, implications for social change are limited. The
results showed that class size did not have a consistent statistically significant effect on
student achievement. However, because of the number of conflicting variables that were
not accounted for in this study, it cannot be assumed that class size does not have an
effect on student achievement. The results of this study can be used to create a dialogue
between parents and school administrators who may have opposing points of view in
terms of the effects of class size. While the results of this study do not implicitly suggest
a course of action, the fact that the results were inconclusive suggests that simply
decreasing class size would not necessarily result in immediate, measurable
improvements in student achievement. Conversely, increasing class size would not
necessarily negatively impact student achievement.
Recommendations for Action
Since the results of this study were inconclusive, a course of action that increases
or decreases class size cannot be recommended. Based on the inconclusive results of this
study, I recommend that the district school board should authorize additional study of the
impact of changing class size prior to taking any course of action that would affect class
size at the secondary school level. Until the effects of various confounding variables such

69
as principal manipulation of class size and teacher experience are studied, the
implications of reducing or increasing class size on student achievement are not clear.
Recommendations for Further Study
The purpose of this study was to predict the effect of changing class size on
TIECNSG. Although the results of this study did not show that changing class size had a
statistically significant effect on TIECNSG, further study needs to be conducted to
determine if other contributing factors (i.e., confounding variables) may have had an
impact on those student grades in addition to class size. Once I have determined the
confounding variables, I recommend collecting new data and rerunning the analysis while
controlling for confounding variables so I can determine the true effect of class size on
TIECNSG.
Bosworth (2014) found that principal manipulation of class size was occurring
where at risk students were assigned to smaller classrooms. Bosworth found that if class
composition was not taken into account, smaller class size showed no effect on student
achievement; however, when class composition was taken into account, smaller class size
did show a positive effect on student achievement. In light of these findings, further
research on class size reduction needs to be conducted and the effects of variables such as
principal manipulation, class composition, teacher experience, etc. statistically controlled
for, leaving only the effect of class size on the dependent variable. Moreover, I
recommend using a more robust dependent variable. Using a standardized assessment for
a dependent variable instead of teacher-issued grades would reduce the threat to internal
validity.

70
Conclusion
The purpose of this study was to predict the effect of class size on TIECNSG. The
results were inconclusive as to whether class size could predict TIECNSG. As a result,
the school district where this study took place could use this study as a rationale for
conducting further studies in the district prior to making any changes to class size at the
secondary school level.

71
References
Act Number 400, S.C. Stat. §§ 59-63-65 (1998).
Akabayashi, H., & Nakamura, R. (2014). Can small class policy close the gap? An
empirical analysis of class size effects in Japan. Japanese Economic Review,
65(3), 253-281. doi:10.1111/jere.12017
Altinok, N., & Kingdon, G. (2012). New evidence on class size effects: A pupil fixed
effects approach. Oxford Bulletin of Economics & Statistics, 74(2), 203-234.
doi:10.1111/j.1468-0084.2011.00648.x
Arefi, M., Naghibzadeh, M., & Boloki, A. (2014). The relationship of parental
attachment, peer attachment, and academic self-concept to academic achievement
of high school students. International Journal of Academic Research, 6(5), 73-78.
doi:10.7813/2075-124.2014/6-/B.11
Atta, M., Jamil, A., Ayaz, M., Shah, T., & Shah, M. (2011). Effect of small class size on
the academic achievement of students at secondary school level. Interdisciplinary
Journal of Contemporary Research in Business, 3(2), 1592-1599. Retrieved from
http://ijrcb.webs.com
Barrett, N., & Toma, E. F. (2013). Reward or punishment? Class size and teacher quality.
Economics of Education Review, 35, 41-52.
doi:10.1016/j.econedurev.2013.03.001
Bascia, N., & Faubert, B. (2012). Primary class size reduction: How policy space,
physical space, and spatiality shape what happens in real schools. Leadership &
Policy in Schools, 11(3), 344-364. doi:10.1080/15700763.2012.692430

72
Bedard, K., & Kuhn, P. (2008). Where class size really matters: Class size and student
ratings of instructor effectiveness. Economics of Education Review, 27(3), 253-
265. doi:10.1016/j.econedurev.2006.08.007
Blatchford, P., Bassett, P., & Brown, P. (2011). Examining the effect of class size on
classroom engagement and teacher-pupil interaction: Differences in relation to
pupil prior attainment and primary vs. secondary schools. Learning and
Instruction, 21(6), 715-730. doi:10.1016/j.learninstruc.2011.04.001
Bong Joo, L., Hyun Suk, J., & Se Hee, L. (2014). The effects of private tutoring and
parenting behaviors on children's academic achievement in Korea: Are there
differences between low and high-income groups? KEDI Journal of Educational
Policy, 11(2), 163-178. Retrieved from http://eng.kedi.re.kr
Bosworth, R. (2014). Class size, class composition, and the distribution of student
achievement. Education Economics, 22(2), 141-165.
doi:10.1080/09645292.2011.568698
Bressoux, P., Kramarz, F., & Prost, C. (2009). Teachers’ training, class size and students’
outcomes: Learning from administrative forecasting mistakes. Economic Journal,
119(536), 540-561. doi:10.1111/j.1468-0297.2008.02247.x
Breton, T. (2014). Evidence that class size matters in 4th grade mathematics: An analysis
of TIMSS 2007 data for Colombia. International Journal of Educational
Development, 34(2014), 51-57. doi:10.1016/j.ijedudev.2013.04.003
British Department for Education. (2011). Class size and education in England evidence
report (Research Report DFE-RR169). Retrieved from

73
https://www.gov.uk/government/uploads/system/uploads/attachment_data/file/18
3364/DFE-RR169.pdf
Brühwiler, C., & Blatchford, P. (2011). Effects of class size and adaptive teaching
competency on classroom processes and academic outcome. Learning &
Instruction, 21(1), 95-108. doi:10.1016/j.learninstruc.2009.11.004
California Education Code, Cali. Stat. §§ 52120-52128 (1996).
Celik, B., & Koc, N. (2015). Effect of class size on university entrance exam in Turkey.
Procedia - Social And Behavioral Sciences, 191(The Proceedings of 6th World
Conference on Educational Sciences), 919-924. doi:10.1016/j.sbspro.2015.04.466
Chen, W. (2015). The relations between perceived parenting styles and academic
achievement in Hong Kong: The mediating role of students' goal orientations.
Learning and Individual Differences, 37(2015), 48–54.
doi:10.1016/j.lindif.2014.11.021
Cheung, H., & Chan, A. H. (2008). Relationships amongst cultural dimensions,
educational expenditure and class size of different nations. International Journal
of Educational Development, 28(6), 698-707. doi:10.1016/j.ijedudev.2007.11.003
Chingos, M. (2012). The impact of a universal class-size reduction policy: Evidence from
Florida's statewide mandate. Economics of Education Review, 31(5), 543-562.
doi:10.1016/j.econedurev.2012.03.002
Cho, H., Glewwe, P., & Whitler, M. (2012). Do reductions in class size raise students’
test scores? Evidence from population variation in Minnesota's elementary

74
schools. Economics of Education Review, 31(3), 77-95.
doi:10.1016/j.econedurev.2012.01.004
Classes are growing. (2011). Science & Children, 48(5), 12-13. Retrieved from
http://www.learningcenter.nsta.org
Cohen-Zada, D., Gradstein, M. & Reuven, E. (2013). Allocation of students in public
schools: Theory and new evidence. Economics of Education Review, 34(2013),
96-106. doi:10.1016/j.econedurev.2013.01.013
Corak, M., & Lauzon, D. (2009). Differences in the distribution of high school
achievement: The role of class-size and time-in-term. Economics of Education
Review, 28(2), 189-198. doi:10.1016/j.econedurev.2008.01.004
Costa, A., & Faria, L. (2015). The impact of emotional intelligence on academic
achievement: A longitudinal study in Portuguese secondary school. Learning and
Individual Differences, 37(2015), 38–47. doi:10.1016/j.lindif.2014.11.011
County Schools (2010). Official budget 2010-2011 fiscal year. Retrieved from
http://www.horrycountyschools.net/files/_LQJlw_/c906eca676dc9a3a3745a49013
852ec4/2010-11_Budget_Doc_with_cover_and_tabs.pdf
Datar, A., & Mason, B. (2008). Do reductions in class size "crowd out" parental
investment in education? Economics of Education Review, 27(6), 712-723.
doi:10.1016/j.econedurev.2007.10.006
Dee, T. S., & West, M. R. (2011). The non-cognitive returns to class size. Educational
Evaluation and Policy Analysis, 33(1), 23-46. doi:10.3102/0162373710392370

75
DiBiase, W., & McDonald, J. R. (2015). Science teacher attitudes toward inquiry-based
teaching and learning. Clearing House, 88(2), 29-38.
doi:10.1080/00098655.2014.987717
Din, F. S. (1999). The functions of class size perceived by Chinese rural school teachers.
National FORUM of Applied Educational Research Journal, 12(3), 1-6. Retrieved
from http://nationalforum.com
Ding, W., & Lehrer, S. F. (2010). Estimating treatment effects from contaminated
multiperiod education experiments: The dynamic impacts of class size reductions.
Review of Economics & Statistics, 92(1), 31-42. Retrieved from
http://www.mitpressjournals.org
Editorial Projects in Education. (2010). Districts exceeding Fla. class-size lid. Education
Week, 30(14), 20. Retrieved from http://www.edweek.org
Ekembe, E. (2014). Interaction and uptake in large foreign language classrooms. RELC
Journal, 45(3), 237-251. doi:10.1177/0033688214547036
Englehart, J. M. (2007). The centrality of context in learning from further class size
research. Educational Psychology Review, 19(4), 455-467. doi:10.1007/s10648-
006-9039-7
Ercan, O. (2014). The effects of multimedia learning material on students’ academic
achievement and attitudes towards science courses. Journal of Baltic Science
Education, 13(5), 608-621. Retrieved from http://www.scientiasocialis.lt
Fan, F. (2012). Class size: Effects on students' academic achievements and some
remedial measures. Research in Education, 87(1), 95-98. doi:10.7227/RIE.87.1.7

76
Foster, J., Barkus, E., & Yavorsky, C., (2006). Basic features of statistical analysis and
the general linear model. Understanding and using advanced statistics. London,
England: Sage.
Fredriksson, P., Öckert, B., & Oosterbeek, H. (2013). Long-term effects of class size.
Quarterly Journal of Economics, 128(1), 249-285. doi:10.1093/qje/qjs048
Funkhouser, E. (2009). The effect of kindergarten classroom size reduction on second
grade student achievement: Evidence from California. Economics of Education
Review, 28(3), 403-414. doi:10.1016/j.econedurev.2007.06.005
Galton, M., & Pell, T. (2012). Longitudinal effects of class size reductions on attainment:
Results from Hong Kong primary classrooms. International Journal of
Educational Research, 53(2012), 360-369. doi:10.1016/j.ijer.2012.05.001
Geiser, S., & Santelices, M. (2007). Validity of high-school grades in predicting student
success beyond the freshman year: High-school record vs. standardized tests as
indicators of four-year college outcomes (Research and Occasional Paper Series
CSHE.6.07). Retrieved from Center for Studies in Higher Education website:
http://cshe.berkeley.edu/publications/docs/ROPS.GEISER._SAT_6.12.07.pdf
Gershenson, S., & Langbein, L. (2015). The effect of primary school size on academic
achievement. Educational Evaluation and Policy Analysis, 37(1), 135-155.
doi:10.3102/0162373715576075
Gottfredson, D. C., & DiPietro, S. M. (2011). School size, social capital, and student
victimization. Sociology of Education, 84(1), 69-89.
doi:10.1177/0038040710392718

77
Graue, M., Hatch, K., Rao, K, & Oen, D. (2009). You just feed them with a long-handled
spoon: Families evaluate their experiences in a class size reduction reform.
Educational Policy, 23(5), 685-713. doi:10.1177/0895904808321271
Graue, E., Rauscher, E., & Sherfinski, M. (2009). The synergy of class size reduction and
classroom quality. Elementary School Journal, 110(2), 178-201.
doi:10.1086/605772
Green, S., & Salking, N. (2011). Using SPSS for Windows and Macintosh: Analyzing and
understanding data (6th ed.). Upper Saddle River, NJ: Pearson Education.
Grooms, V. (2011, February 1). County school board eyes cuts. Sun News. Retrieved
from http://www.myrtlebeachonline.com/2011/02/01/1955143/school-board-eyes-
cuts.html
Hadzi-Pavlovic, D. (2009). Power and sample size: I. The success of others is a recipe for
your failure. Acta Neuropsychiatrica, 21(4), 202-204. doi:10.1111/j.1601-
5215.2009.00403.x
Handal, B., Watson, K., & Maher, M. (2015, April 16). Multi-positioning mathematics
class size: Teachers' views. International Journal for Mathematics Teaching &
Learning. Retrieved from http://www.cimt.plymouth.ac.uk/journal
Harfitt, G. (2012a). An examination of teachers’ perceptions and practice when teaching
large and reduced-size classes: Do teachers really teach them in the same way?
Teaching and Teacher Education, 28(1), 132-140. doi:10.1016/j.tate.2011.09.001

78
Harfitt, G. (2012b). How class size reduction mediates secondary students' learning:
Hearing the pupil voice. Asia Pacific Education Review, 13(2), 299-310.
doi:10.1007/s12564-011-9193-6
Harfitt, G. (2013). Why "small” can be better: An exploration of the relationships
between class size and pedagogical practices. Research Papers in Education,
28(3), 330-345. doi:10.1080/02671522.2011.653389
Harfitt, G. (2014). Brokering dialogue between secondary students and teachers to co-
construct appropriate pedagogy in reduced-size classes. Teachers & Teaching,
20(2), 212-228. doi:10.1080/13540602.2013.848572
Heinesen, E. (2010). Estimating class-size effects using within-school variation in
subject-specific classes. Economic Journal, 120(545), 737-760.
doi:10.1111/j.1468-0297.2009.02301.x
Jakobsson, N., Persson, M., & Svensson, M. (2013). Class-size effects on adolescents'
mental health and well-being in Swedish schools. Education Economics, 21(3),
248-263. doi:10.1080/09645292.2013.789826
Januszka, C., & Dixon-Krauss, L. (2008). Class size: A battle between accountability and
quality instruction. Childhood Education, 84(3), 167-170.
doi:10.1080/00094056.2008.10523000
Jespen, C., & Rivkin, S. (2009). Class size reduction and student achievement: The
potential tradeoff between teacher quality and class size. Journal of Human
Resources, 44(1), 223-250. doi:10.1353/jhr.2009.0008

79
Jirjahn, U., Pfeifer, C., & Tsertsvadze, G. (2009). Class size, student performance and
Tiebout bias. Applied Economics Letters, 16(10), 1049-1052.
doi:10.1080/13504850701335285
Kassile, T. (2014). Pass rates in primary school leaving examination in Tanzania:
Implication for efficient allocation of resources. South African Journal of
Education, 34(2), 1-21. Retrieved from http://www.scielo.org.za
Konstantopoulos, S. (2008). Do small classes reduce the achievement gap between low
and high achievers? Evidence from Project STAR. Elementary School Journal,
108(4), 275-291. doi:10.1086/528972
Konstantopoulos, S. (2011). How consistent are class size effects? Evaluation Review,
35(1), 71-92. doi:10.1177/0193841x11399847
Konstantopoulos, S., & Chung, V. (2009). What are the long-term effects of small classes
on the achievement gap? Evidence from the Lasting Benefits Study. American
Journal of Education, 116(1), 125-154. doi:10.1086/605103
Konstantopoulos, S., & Li, W. (2012). Are there additional benefits from being in small
classes for more than one year? Educational Research and Evaluation, 18(7),
671-685. doi:10.1080/13803611.2012.718431
Konstantopoulos, S., & Sun, M. (2014). Are teacher effects larger in small classes?
School Effectiveness & School Improvement, 25(3), 312-328.
doi:10.1080/09243453.2013.808233
80
Konstantopoulos, S., & Traynor, A. (2014). Class size effects on reading achievement
using PIRLS data: Evidence from Greece. Teachers College Record, 116(2), 1-29.
Retrieved from http://www.tcrecord.org
Krassel, K., & Heinesen, E. (2014). Class-size effects in secondary school. Education
Economics, 22(4), 412-426. doi:10.1080/09645292.2014.902428
Leuven, E., Oosterbeek, H., & Rønning, M. (2008). Quasi-experimental estimates of the
effect of class size on achievement in Norway. Scandinavian Journal of
Economics, 110(4), 663-693. doi:10.1111/j.1467-9442.2008.00556.x
Lodico, M., Spaulding, D., & Voetgle, K. (2010). Methods in educational research:
From theory to practice. San Francisco, CA: Jossey-Bass.
Mascall, B., & Leung, J. (2012). District resource capacity and the effects of educational
policy: The case of primary class size reduction in Ontario. Leadership and Policy
in Schools, 11(3), 311-324. doi:10.1080/15700763.2012.692428
McKee, G., Sims, K., & Rivkin, S. (2015). Disruption, learning, and the heterogeneous
benefits of smaller classes. Empirical Economics, 48(3), 1267-1286.
doi:10.1007/s00181-014-0810-1
Mendenhall W.. & Sincich, T. (1996). A second course in statistics: Regression analysis
(5th
ed). Upper Saddle River, NJ: Prentice-Hall, Inc.
Milesi, C., & Gamoran, A. (2006). Effects of class size and instruction on kindergarten
achievement. Educational Evaluation & Policy Analysis, 28(4), 287-313.
doi:10.3102/01623737028004287

81
Mosteller, F. (1995). The Tennessee study of class size in the early school grades. The
Future of Children, 5(2), 113-127. doi:10.2307/1602360
Mueller, S. (2013). Teacher experience and the class size effect—Experimental evidence.
Journal of Public Economics, 98(2013), 44-52.
doi:10.1016/j.jpubeco.2012.12.001
National Center for Education Statistics (2012). School detail for County. Retrieved from
http://nces.ed.gov/ccd/schoolsearch/school_detail
Ngware, M., Oketch, M., & Mutisya, M. (2014). Does teaching style explain differences
in learner achievement in low and high performing schools in Kenya?
International Journal of Educational Development, 36(2014), 3-12.
doi:10.1016/j.ijedudev.2014.01.004
NIST/SEMATECH. (2012). e-Handbook of statistical methods. Retrieved from
http://www.itl.nist.gov/div898/handbook
Normore, A. H., & Ilon, L. (2006). Cost-effective school inputs: Is class size reduction
the best educational expenditure for Florida? Educational Policy, 20(2), 429-454.
doi:10.1177/0895904805284053
O’Brennan, L., Bradshaw, C., & Furlong, M. (2014). Influence of classroom and school
climate on teacher perceptions of student problem behavior. School Mental
Health, 6(2), 125-136. doi:10.1007/s12310-014-9118-8
Owoeye, J., & Yara, P. (2011). Class size and academic achievement of secondary school
in Ekiti State, Nigeria. Asian Social Science, 7(6), 184-189. Retrieved from
http://aessweb.com

82
Petrilli, M., & Northern, A. (2014). Right-sizing our classrooms: A surprising experiment
suggests students might benefit from bigger classes-but only if they have good
teachers. Hoover Digest, 2014(2), 81-85. Retrieved from http://hoover-stage.org
Popham, W. (1999). Why standardized tests don't measure educational quality.
Educational Leadership, 56(6), 8-15. Retrieved from http://www.ascd.org
Pritchard, I. (1999). Reducing class size. What do we know? Retrieved from
http://www.classsizematters.org/wp-
content/uploads/2012/11/ReducingClassSize.pdf
Rashidi, N., & Moghadam, M. (2014). The effect of teachers' beliefs and sense of self-
efficacy on Iranian EFL learners' satisfaction and academic achievement.
Electronic Journal for English as a Second Language, 18(2), 1-23. Retrieved
from www.tesl-ej.org
Ready, D. D. (2008). Class-size reduction: Policy, politics, and implications for equity
(Research Review No. 2). Retrieved from The Campaign for Educational Equity
website:
http://www.equitycampaign.org/i/a/document/6863_Ready_Class_Size_Research
_Review.pdf
Rodriguez, R., & Elbaum, B. (2014). The role of student–teacher ratio in parents’
perceptions of schools’ engagement efforts. Journal of Educational Research,
107(1), 69-80. doi:10.1080/00220671.2012.753856
Rutherford, A. (2000). Introducing ANOVA and ANCOVA: A GLM approach. London,
England: Sage.

83
Shin, I.-S., & Chung, J. Y. (2009). Class size and student achievement in the United
States: A meta-analysis. KEDI Journal of Educational Policy, 6(2), 3-19.
Retrieved from http://eng.kedi.re.kr
Shin, Y. (2012). Do Black children benefit more from small classes? Multivariate
instrumental variable estimators with ignorable missing data. Journal of
Educational and Behavioral Statistics, 37(4), 543-574.
doi:10.3102/1076998611431083
Shin, Y., & Raudenbush, S. W. (2011). The causal effect of class size on academic
achievement: Multivariate instrumental variable estimators with data missing at
random. Journal of Educational and Behavioral Statistics, 36(2), 154-185.
doi:10.3102/1076998610388632
Sims, D. (2008). A strategic response to class size reduction: Combination classes and
student achievement in California. Journal of Policy Analysis and Management,
27(3), 457-478. doi:10.1002/pam.20353
Sims, D. (2009). Crowding Peter to educate Paul: Lessons from a class size reduction
externality. Economics of Education Review, 28(4), 465-473.
doi:10.1016/j.econedurev.2008.06.005
Sohn, K. (2010). A skeptic's guide to Project STAR. KEDI Journal of Educational
Policy, 7(2), 257-272. Retrieved from http://eng.kedi.re.kr
Sohn, K. (2015). Nonrobustness of the carryover effects of small classes in Project
STAR. Teachers College Record, 117(3), 1-26. Retrieved from
http://www.tcrecord.org/library

84
Soper, D. S. (2014). A-priori sample size calculator for multiple regression [Online
software]. Available from http://www.danielsoper.com/statcalc
South Carolina Department of Education. (2007). Uniform grading policy. Retrieved
from http://ed.sc.gov/agency
South Carolina Department of Education. (2008-2012). SC Annual School Report Card.
Retrieved from http://ed.sc.gov/data/report-cards
Tatlah, I., Iqbal, M., Amin, M., & Quraishi, U. (2014). Effect of leadership behaviour of
principals on students' academic achievement at secondary level: A comparison of
the leaders and teachers perceptions. Journal of Research & Reflections in
Education, 8(1), 1-12. Retrieved from http://www.ue.edu.pk/jrre
Tienken, C. H., & Achilles, C. M. (2009). Relationship between class size and students'
opportunity to learn writing in middle school. Research in the Schools, 16(1), 13-
24. Retrieved from http://dtm10.cep.msstate.edu
Trochim,W. (2006). The research methods knowledge base (2nd ed.). Retrieved from
http://www.socialresearchmethods.net
Tulbure, C. (2014). Factors of personality involved in adolescents’ academic
achievement. Research Journal of Agricultural Science, 46(2), 412-416.
Retrieved from http://www.rjas.ro
Vaag Iversen, J., & Bonesrønning, H. (2013). Disadvantaged students in the early grades:
Will smaller classes help them? Education Economics, 21(4), 305-324.
doi:10.1080/09645292.2011.623380

85
Walker, A., Lee, M., & Bryant, D. (2014). How much of a difference do principals make?
An analysis of between-schools variation in academic achievement in Hong Kong
public secondary schools. School Effectiveness & School Improvement, 25(4),
602-628. doi:10.1080/09243453.2013.875044
Wang, W., Vaillancourt, T., Brittain, H., McDougall, P., Krygsman, A., Smith, D., &
Hymel, S. (2014). School climate, peer victimization, and academic achievement:
Results from a multi-informant study. School Psychology Quarterly, 29(3), 360-
377. doi:10.1037/spq0000084
Wilson Van Voorhis, C. R., & Morgan, B. L. (2007). Understanding power and rules of
thumb for determining sample sizes. Tutorials in Quantitative Methods for
Psychology, 3(2), 43-50. Retrieved from http://www.tqmp.org
Word, E., Johnston, J., Bain, H., Fulton, B., Zaharias, J., Achilles, C., & Breda, C.
(1990). Student/Teacher Achievement Ratio (STAR) Tennessee's K-3 class size
study. Final summary report 1985-1990. Retrieved from ERIC database
(ED320692).
Wyss, V. L., Tai, R. H., & Sadler, P. M. (2007). High school class-size and college
performance in science. High School Journal, 90(3), 45-53.
doi:10.1353/hsj.2007.0014