Embed Size (px)
Citation preview

City University of New York (CUNY) City University of New York (CUNY)
CUNY Academic Works CUNY Academic Works
Publications and Research Brooklyn College
1971
Effect of Calcium, Temperature, and Polarizing Currents upon Effect of Calcium, Temperature, and Polarizing Currents upon
Alternating Current Excitation of Space-Clamped Squid Axons Alternating Current Excitation of Space-Clamped Squid Axons
Rita Guttman CUNY Brooklyn College
Lon Hachmeister CUNY Brooklyn College
How does access to this work benefit you? Let us know!
More information about this work at: https://academicworks.cuny.edu/bc_pubs/62
Discover additional works at: https://academicworks.cuny.edu
This work is made publicly available by the City University of New York (CUNY). Contact: [email protected]

Effect of Calcium, Temperature, and Polarizing
Currents upon Alternating Current
Excitation of Space-Clamped Squid Axons
RITA GUTTMAN and LON HACHMEISTER
From the Department of Biology, Brooklyn College, Brooklyn, New York 11210, and MarineBiological Laboratory, Woods Hole, Massachusetts 02543. Mr. Hachmeister's present addressis Department of Oceanography, University of Washington, Seattle, Washington 98115.
ABSTRACT Alternating current threshold excitation of space-clamped squidgiant axons was measured as a function of frequency, external calcium con-centration, temperature (from 100 to 350 C), and hyper- and depolarizing steps.In normal axons there is usually an optimum frequency at about 120 Hz, atwhich the threshold is a minimum. The threshold rises at both lower and higherfrequencies to give a resonance curve. Low calcium causes an increase inoptimum frequency, a decrease in current threshold, and an increase in sharp-ness of tuning in both real axons and axons computed according to the Hodgkin-Huxley formulation; high calcium causes opposite effects. An increase in tem-perature causes an increase of optimum frequency, an increase in sharpness oftuning, and an increase in threshold current in both real and computed axons.The Qo for the effect of temperature upon optimum frequency is 1.8 in realand computed axons at moderate temperatures. Hyperpolarization causes (a) adecrease in optimum frequency, (b) a decrease in sharpness of tuning, and(c) an increase in threshold. Depolarization causes opposite effects.
INTRODUCTION
In previous work (Guttman, 1969; Guttman and Barnhill, 1970) the naturalfrequency of subthreshold oscillations and repetitive firing was studied inspace-clamped squid axons during variation of temperature and ionic en-vironment, and the experimental results compared with computations basedon the Hodgkin-Huxley (HH) formulation (1952). In the previous studies, themembrane was stimulated by threshold or just subthreshold steps of current.The present work investigates this subject further, using, however, sinusoidalstimulation and examining the resonance curves resulting from thresholdstimulation at the various frequencies.
The topic is an old one. Classical experiments were carried out byArvanitaki (1939), by Monnier and Copp6e (1939), by Hill, Katz, and
304 THE JOURNAL OF GENERAL PHYSIOLOGY · VOLUME 58, 1971 pages 304-321

R. GUTrMAN and L. HACHMEISTER Alternating Current Excitation of Squid Axons 305
Solandt (1936), by Tasaki and Sato (1951), and by still other earlier workers.These experiments were on the initiation of propagating impulses. Wheninterpreted, these results were described in terms of the formal two-factortheory of excitation. An important conceptual simplification in the presentwork is the use of the sucrose gap space clamp on squid. Later the results areto be again compared with HH calculations, which it was not possible to dofor the early work.
As was pointed out long ago by Katz (1939) the phenomenon of an opti-mum frequency in nerve is a natural consequence of the fact that a nerve fiberfails to respond to a given current if that current (a) does not last long enoughor (b) does not rise fast enough. It is not therefore necessary to invoke someobscure "resonance" mechanism for nerve. Any model or equivalent circuitfor the excitable membrane (cf. Cole, 1968), however, does have to take intoconsideration the resonance phenomenon and the natural frequency of sub-threshold oscillation (such as is obtained in low calcium). Since calcium hassuch a marked effect upon excitability, it was decided to study the effect ofvariation of the concentration of this ion upon resonance curves.
Since temperature effects have long been felt to be an important aspect ofany physical model that is developed for the excitable membrane, it wasthought that it might be of interest to investigate the temperature dependenceof resonance curves and optimum frequencies. Very little work has been car-ried out on the effect of temperature upon resonance curves of nerve. Conti(1970) did not study threshold directly but rather membrane impedance.Moreover, he did not study the effect of temperatures higher than about 16°C.
The present study includes an investigation of the effect of hyperpolariza-tion and depolarization upon resonance curves, because, since we were dealingwith axons in sucrose gaps and since the sucrose gap technique is known toresult in hyperpolarization of the membrane (Blaustein and Goldman, 1966),we wished to establish that hyperpolarization did not in itself affect or obscureour data in any way.
Whenever calculated values are presented in the figures or discussed in thetext, they were computed by Frederick A. Dodge, Jr., at our request.
MATERIAL AND METHODS
The dissection, the axon chamber, and the temperature control were identical withthose used in previous work (cf. Guttman and Barnhill, 1970). The artificial seawaterand the low and high calcium solutions were also made up as in the previous work.All axons were equilibrated in running natural seawater for at least a half hour beforethey were mounted in the chamber. In the calcium experiments, the axon was firstbathed in a "holding" solution of 35 mM Ca (considered equivalent to seawater) and,when fairly well-equilibrated, the artificial seawater solutions containing the indicatedamount of calcium were substituted. In all experiments involving alteration of theionic environment, the temperature was maintained at 200 C.
306 THE JOURNAL OF GENERAL PHYSIOLOGY · VOLUME 58 · 1971
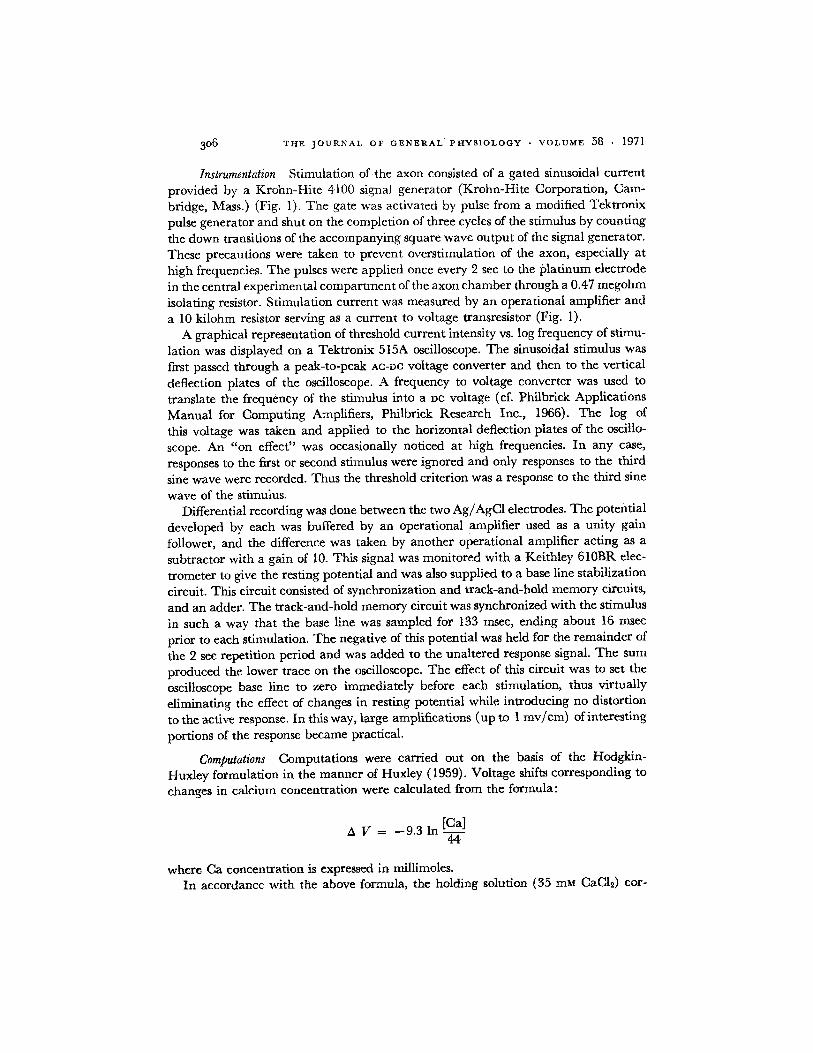
Instrumentation Stimulation of the axon consisted of a gated sinusoidal currentprovided by a Krohn-Hite 4100 signal generator (Krohn-Hite Corporation, Cam-
bridge, Mass.) (Fig. 1). The gate was activated by pulse from a modified Tektronix
pulse generator and shut on the completion of three cycles of the stimulus by counting
the down transitions of the accompanying square wave output of the signal generator.These precautions were taken to prevent overstimulation of the axon, especially at
high frequencies. The pulses were applied once every 2 sec to the platinum electrode
in the central experimental compartment of the axon chamber through a 0.47 megohm
isolating resistor. Stimulation current was measured by an operational amplifier and
a 10 kilohm resistor serving as a current to voltage transresistor (Fig. 1).A graphical representation of threshold current intensity vs. log frequency of stimu-
lation was displayed on a Tektronix 515A oscilloscope. The sinusoidal stimulus was
first passed through a peak-to-peak AC-DC voltage converter and then to the vertical
deflection plates of the oscilloscope. A frequency to voltage converter was used to
translate the frequency of the stimulus into a DC voltage (cf. Philbrick Applications
Manual for Computing Amplifiers, Philbrick Research Inc., 1966). The log of
this voltage was taken and applied to the horizontal deflection plates of the oscillo-
scope. An "on effect" was occasionally noticed at high frequencies. In any case,responses to the first or second stimulus were ignored and only responses to the third
sine wave were recorded. Thus the threshold criterion was a response to the third sine
wave of the stimulus.Differential recording was done between the two Ag/AgCl electrodes. The potential
developed by each was buffered by an operational amplifier used as a unity gain
follower, and the difference was taken by another operational amplifier acting as a
subtractor with a gain of 10. This signal was monitored with a Keithley 610BR elec-
trometer to give the resting potential and was also supplied to a base line stabilization
circuit. This circuit consisted of synchronization and track-and-hold memory circuits,
and an adder. The track-and-hold memory circuit was synchronized with the stimulus
in such a way that the base line was sampled for 133 msec, ending about 16 msec
prior to each stimulation. The negative of this potential was held for the remainder of
the 2 sec repetition period and was added to the unaltered response signal. The sumproduced the lower trace on the oscilloscope. The effect of this circuit was to set the
oscilloscope base line to zero immediately before each stimulation, thus virtually
eliminating the effect of changes in resting potential while introducing no distortion
to the active response. In this way, large amplifications (up to 1 mv/cm) of interestingportions of the response became practical.
Computations Computations were carried out on the basis of the Hodgkin-Huxley formulation in the manner of Huxley (1959). Voltage shifts corresponding to
changes in calcium concentration were calculated from the formula:
A V = -9.3 In [Cal44
where Ca concentration is expressed in millimoles.In accordance with the above formula, the holding solution (35 mM CaC12) cor-
Wu
(V a:
1! t> nE C,o
s_ D
Wui
<: Z .IZ13 J <
:- z - : a
_ m -v Cm c~~~~~~~~~
o> oW 0~~~~oo,
0 ~ ~ ~ ~ ~
ucr B3~~~~~~~~~~~~~~~~~~~~c
~~~~~~~~~~~~~~~~~~~~~~0 of
I >~~~~~~~~~
0g 0 02
_ , I.oW ~L Cr l !r
.~ ~ ~ ~~~~~~~~~~Q.
-~~~~~~~~~~~ - ,.R.4
al
,o ~
I
° a D t t; I Z~LI)r~~~~ l (
-Z -
o~~~~~~~~
---- ~~~ ~ ~~~~~~ Z <~ ,;
o_z OC
LL ,LJ -
0 m Z: ~~ L >!"
ow zc > ou w4~~~~~ e, 3~~L (
(DZ
< --J-U0 Cr
02 5
307

308 THE JOURNAL OF GENERAL PHYSIOLOGY · VOLUME 58 · 1971
responded to a voltage shift of 1.87 mv. Low calcium (18.7 mM CaC12) for the com-puted axon involved a voltage shift of 8.0 mv, while high calcium (107 mM CaC12)corresponded to a voltage shift of -8.0 my.
With regard to the computations involving the effect of temperature variation, itwas assumed that only the rate constants were affected by temperature increasingwith temperature with a Q0L of 3 (Huxley, 1959).
Deterioration In order to understand the effect of changing the ionic environ-ment upon the resonance curve, it was first necessary to determine the effect of
deterioration upon the curve. The resonance curve was monitored for 122 min in anaxon at 10°C bathed in artificial seawater (Fig. 2, where the results are plotted
10 Min fopO A 0 140o B 17 84A C 57 77
5 D 73 44
(,4a) _
E 122 18
0.5120 50 100 200 500 1000
f (Hz)
FIGURE 2. Effect of deterioration upon resonance curve of space-clamped squid axonstimulated by sinusoidal AC current. Threshold current, Io, in microamperes vs. fre-quency (Hz) both on log scales. Curves recorded at times indicated. All points onsame axon at 10°C in artificial seawater. See text for discussion.
logarithmically), when the excitability finally disappeared. (It must be confessed that
after run C, the fiber was overstimulated out of sheer impatience to hasten its demise,
and thus it would doubtless have survived longer under normal circumstances.) Dur-
ing this time interval a number of changes occurred.1. The amount of current required at low frequencies for stimulation decreased.
This might at first appear surprising; i.e., that the seeming "threshold" should
decrease rather than increase. However, it should be kept in mind that we aredealing with a membrane hyperpolarized by sucrose gaps (cf. Blaustein and
Goldman, 1966) and what we are probably actually observing is a gradual decrease
in this hyperpolarization. The fall in resting potential with time, as monitored on
an electrometer, favors this view.2. With time, the optimum frequency (the frequency at which a minimum cur-
rent intensity excites) decreased in this particular fiber from 140 to 18 Hz (Fig. 2).
(Generally the optimum frequency of fibers in good condition varied from about 90
to 160 Hz at the start of experiments.)

R. GUTrMAN and L. HACHMEISTER Alternating Current Excitation of Squid Axons 309
3. The resonance curve becomes less symmetrical as time elapses. Specifically,the low frequency portion becames flat, so that frequency variation has little effectupon excitability in that region; i.e., the membrane is very poorly tuned because ofchanges in threshold in the low frequency region. However, it should be noted thatin this particular fiber and at this low temperature, this effect did not becomemarked until after about an hour had elapsed.Of course, it would be interesting to know what changes in which membrane
parameters are associated with this decrease in tuning. If deterioration alters thesodium conductance, one would expect the low frequency end of the resonance curveto be more affected than the high frequency end since the high frequency end is largelycapacitative. This indeed seems to be the case (Fig. 2). The change at the low fre-quency end on deterioration might be caused by sodium inactivation or delayedrectification or a mixture of both.
It is a possibility, however, that sodium inactivation is not the cause of the changeat the low frequencies since as will be described later, we were able to show (Fig. 9)that the resonance curve does not sharpen up when hyperpolarized.
It was suggested that the changes which occur on deterioration might be caused byincreased leakage conductance. When, however, leakage conductance was increasedfor the calculated HH axon, the effect was opposite to what was found experimentally(decreased leakage conductance rather than increased leakage conductance mimickedthe results found experimentally) so that this idea had to be abandoned.
The data shown in Fig. 2 suggest that only fresh fibers should be oscillatory becauseonly fresh fibers are well tuned. In our experience with squid fibers, this has indeedbeen the case. We observed oscillation only in fibers from animals that were in excel-lent condition and then only when they were freshly dissected.
Now, with the effect of the lapse of time upon the membrane analyzed (whether thisconstitutes merely deterioration or other changes as well), it became possible to studythe effect of varying the concentration of the calcium ion and the effect of variationof temperature upon the resonance curve.
RESULTS
When a strength-frequency curve, using threshold responses to AC sinusoidalstimulation, is plotted on log-log coordinates for a space-clamped squid axon,a nearly symmetrical curve is obtained, as was found earlier by Monnier (cf.Monnier and Coppe, 1939) for frog nerves. Such curves give informationabout the oscillatory nature of the membrane and some of the possible charac-teristics of the equivalent circuit.
One of the aspects of the curve that is of interest is the minimum, thefrequency at which the threshold is the lowest, sometimes referred to as theoptimum or natural frequency.
Another aspect of the curve which is of interest is where on the intensityparameter the entire curve or its minimum falls: the intensity threshold, I.
A third aspect which is significant is the sharpness of the curve; i.e., thedegree of tuning (the reciprocal of the damping factor). Monnier (1952) has

310 THE JOURNAL OF GENERAL PHYSIOLOGY VOLUME 58 1971
suggested that the damping factor should be identified with Kennelly's blunt-ness of resonance, B (Kennelly, 1923). B can be readily calculated from theresonance curves. If f and f2 are respectively the frequencies at which thethreshold current is V/2 times the current, Io, at the optimum frequency,fop, then
B l-f2B= -.fop
Kennelly was the first to emphasize that resonance curves of electrical ormechanical systems are symmetrical in relation to the ordinate of the optimumfrequency, if the frequencies are expressed logarithmically. This symmetryholds in most cases for resonance curves of nerves. Its consequences are thefollowing:
1. The optimum frequency is the geometric mean of any couple, fi andf2, of frequencies, above and below the optimum, measured at any multipleof the optimal current; i.e.,fp, = V/ff 2 or log fop = log f - log f2 .Thesymmetry of the curves, when it is evident, permits an accurate determina-tion of the optimum frequency. The locus of the midpoint of the horizontalchords of the curve is a straight line. Its intersection with the curve indicatesthe optimum frequency.
2. The relative damping or bluntness of resonance, or width index of thecurves (or their reciprocal, i.e., sharpness of resonance, acuity index, ordegree of tuning) can be calculated from any couple off, andf2 frequencies,determined at any multiple of the optimal current, Io,.Kennelly chose the value \2 I0 because in that case the damping factor B
is simply related to the parameters of an R, C, L circuit:
B = 11L
For practical reasons, i.e., a more precise determination of threshold, anothermultiple of the optimal intensity, Io, may be used, for instance, 2I1. Thecouple of frequencies fi and f2 then lies upon steeper factors of the curves, thusensuring a better accuracy of their evaluation. In order to evaluate by simpleinspection the relative bluntness of a set of resonance curves, these curvesshould be plotted on log-log coordinates. The length of the chords for anygiven increment of the ordinate above the optimum allows for a relativeevaluation of the set of curves.
With regard to a comparison of our experimental squid membrane to anR, C, L circuit, it should be kept in mind that in our experimental setup themembrane is behaving very much like the excised Hodgkin-Huxley axon(1.952) except that, as is well known, sucrose gaps tend to repolarize a mem-

R. GUTrTMAN and L. HAcmmEISTER Alternating Current Excitation of Squid Axons 31I
brane, and this has an established effect on the apparent inductive reactance.According to Mauro, Conti, Dodge, and Schor (1970), if the membrane ishyperpolarized, the inductive reactance changes to a capacitative reactancewith potassium turn off.
To recapitulate, then, we will consider three characteristics of the resonancecurves in the following development: (a) optimum frequency, (b) thresholdintensity, and (c) sharpness of tuning, and an attempt will be made to showhow each is affected by variation of calcium ion concentration, by tempera-ture variation, and by polarizing currents.
Effect of Calcium Ion Concentration Depending upon our primary aim, weeither (a) took runs as rapidly as possible, bracketing the run in the experi-mental solution of increased or decreased calcium between a previous andsubsequent run in the holding solution: 35 mM CaCl2 or (b) followed the effectof change in concentration of calcium with time by recording a number ofresonance curves in abnormal calcium concentrations before returning to thecontrol run in the holding solution.
Eight runs were carried out on seven axons treated with low calcium solu-tions and twelve runs were done on nine axons in high calcium.
Typical effects of varying the calcium ion concentration in the bathing me-dium of the axon are shown graphically for the experimental axon in Fig. 3
10 fop BLow Ca (.ao) (Hz)
o 35mM CaCI 2 1.35 142 3.53
* 15mM CaCI 2 0.87 192 3.05
,o ,o I- 15 1
0.510 20 50 100 200 500 1000
f (Hz)
FIGURE 3. Effect of low calcium (15 mM CaC12) on resonance curve of experimentalaxon. Threshold current, IO, in microamperes vs. frequency (Hz), both on log scales.Note that lowering the calcium concentration causes a decrease in threshold current,am increase in optimum frequency, and a decrease in the width index, B. Dashed linesare drawn across the curves at a current intensity twice that of the threshold at theoptimum frequency in order to compute the width index.

312 THE JOURNAL OF GENERAL PHYSIOLOGY ·VOLUME 58 1971
(low calcium) and Fig. 4 (high calcium) and for the computed axon, Fig. 5(low and high calcium).
Effect of Calcium upon Optimum Frequency It is clear that lowering thecalcium concentration results in a raising of the optimum frequency in bothexperimental and computed axons. An increase in the calcium concentration,on the other hand, results in a decrease in optimum frequency of the resonancecurve in both experimental and computed axons.
Effect of Calcium upon Threshold Intensity Lowering calcium concentrationdecreases the current threshold in both the experimental and computed axon.Raising the calcium level increases the intensity of current necessary for excita-tion in both the experimental and computed axons.
Effect of Calcium upon Degree of Tuning The sharpness of the resonancecurve or the degree of tuning (which is related to the damping factor) is alsoaffected by varying the calcium concentration. Rather than rely upon casualinspection, which can be misleading, the formula of Kennelly was invoked, asmentioned above. Lowering the calcium concentration was found to undampthe membrane (increase sharpness of tuning) in both the experimental andcomputed axons, which was to be expected since we know from experiencethat the membrane has a greater tendency to oscillate when deprived of cal-cium.
In the experimental fiber of Fig. 3, when the fiber was bathed in the holdingsolution of 35 mM CaC12 and then treated with a low calcium solution of 15mM CaC2, the width index, B, dropped from 3.53 to 3.05.
Raising the calcium concentration in the experimental axon of Fig. 4 fromthe holding solution of 35 mM to 80 mM CaCl2 , caused increased damping,i.e. the width index rose from an initial 3.38 to 4.08, while in another fiber,raising the calcium concentration from the initial 35 m to 112 m, raised thewidth index from 2.80 to 5.87 (Fig. 4). Of course, the absolute values havelittle significance since they depend not only upon the concentrations of cal-cium used but also upon how long they were permitted to act before measure-ments were taken.
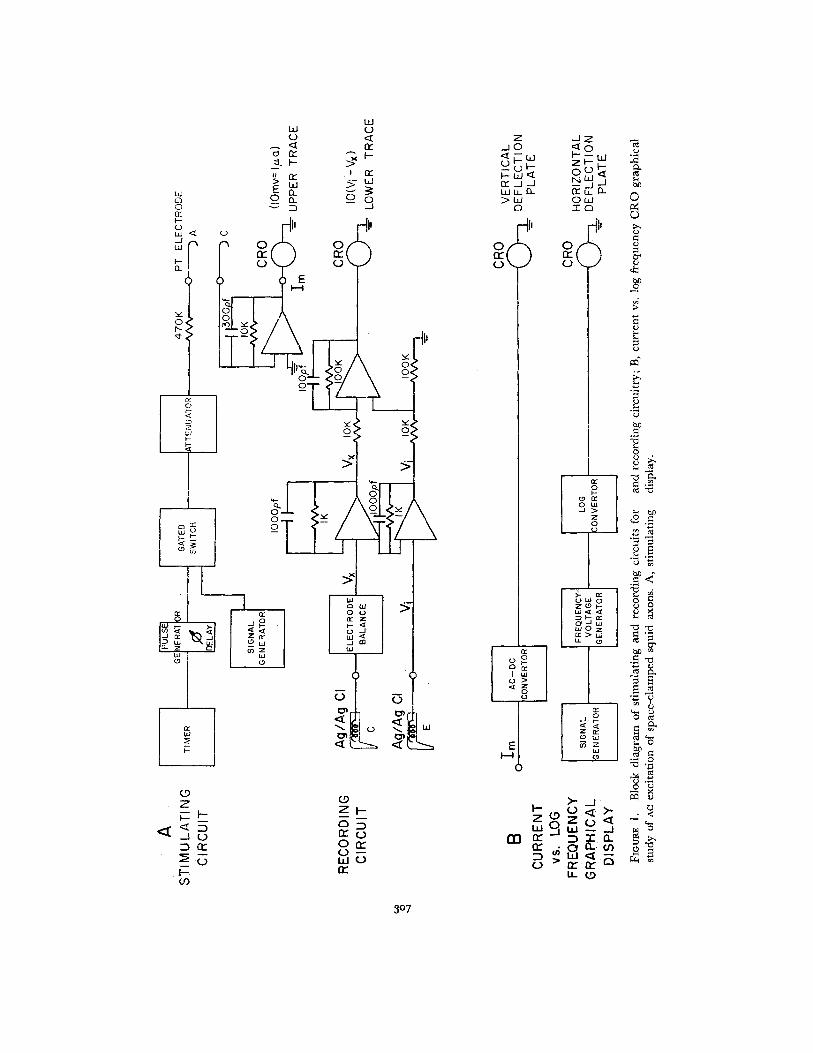
Effect of Calcium upon Computed Axon The effect of varying the calciumconcentration upon the resonance curves of the theoretical axon, calculatedin accordance with the Hodgkin-Huxley formulation, is shown in Fig. 5, wherethreshold current in microamperes vs. frequency (Hz), both on log scales, isdisplayed. The results are similar to the experimental results: increasing thecalcium concentration causes an increase in threshold current and the amountof damping, while it decreases optimum frequency. The sharpness of the curvein low calcium corroborates Cole's finding of a true resonance in low calciumand a pararesonance at higher concentrations (Cole and Marmont, 1942).

R. GUTTMAN and L. HACMEISTER Alternating Current Excitation of Squid Axons 313
10 fP Bo 10 fop B(pa) (Hz) (pa) (Hz)
A 0 35mMCaCl, 1.6 110 3.38 B 0 35mMCaCI, 0.8 160 2.80High Ca (80mM) 0 8OmMCaCI, 2.7 52 4.08 High Ca (112mM) 12mMCaCI, 2.65 55 5.87
10 - 5 -
(pa) o / j 20 0
.5I I I 1 , _ ,. 1 I I I I l '''10 20 50 100 200 500 10 20 50 100 200 500
f (Hz) f(Hz)
FIGURE 4. Effect of high calcium (A, 80 mru CaC 2 and B, 112 mu CaCI2) on resonancecurve of experimental axon. Threshold current, 1o, in microamperes vs. frequency (Hz),both on log scales. Note that raising the calcium concentration has less effect at lowfrequencies than at higher frequencies. Increased calcium concentration causes an in-crease in threshold current, a decrease in optimum frequency, and an increase in thewidth index, B.
Differences between the empirical (Figs. 3 and 4) and computed axons (Fig.5) are in these plots more apparent than real because of the distortion inherentin log-log plotting, but log-log plotting is convenient for showing the resultscompactly. Discrepancies between the empirical and computed axons are notbelieved to be significant.
Effect of Temperature The results of temperature variation upon reso-nance curves became clear only after improvement of instrumentation per-mitted a speeding up of readings so that many points could be taken beforedeterioration occurred. Only after the changes due to deterioration could beavoided, was it possible to analyze temperature effects with any degree ofconfidence.
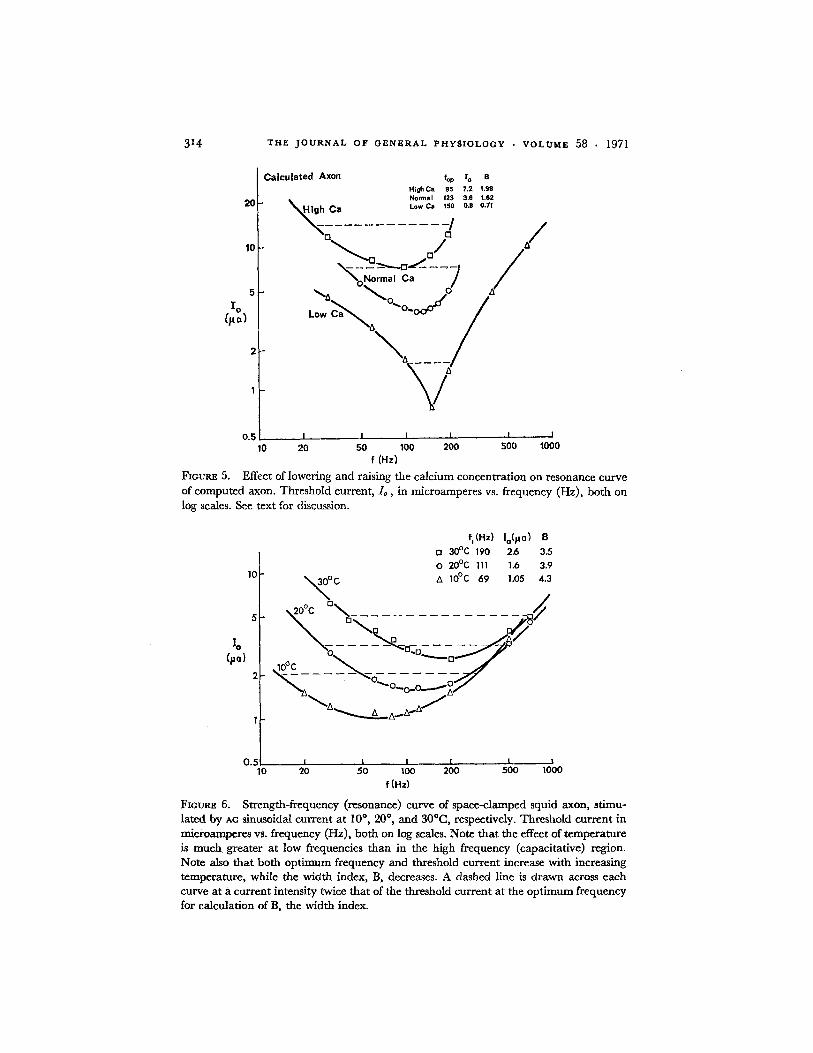
Temperature has a marked effect upon resonance curves in a number ofways. Symmetrical resonance curves are obtained between 100 and 30°C. At35°C the curve becomes irregular and at 400 C only a few readings can beobtained before excitability fails. As Figs. 6-8 clearly indicate, an increase intemperature caused an increase in optimum frequency, an increase in thresh-old current, and an increase in sharpness of tuning.
It should be noted (Fig. 6) that temperature affects the low frequency endof the resonance curve markedly, but not the high frequency end. This is notsurprising, inasmuch as the high frequency end is largely due to capacitiveeffects.
The effect of temperature upon the threshold current at optimum fre-
314 THE JOURNAL OF GENERAL PHYSIOLOGY · VOLUME 58 1971
Calculated Axon f o BHigh Ca 95 7.2 1.98Normal 123 3.6 1.62Lo Ca 150 0.8 0.7120- Ca
10
5I0
(Ca1
2
1
I I11 110 20 so50 100 200 500 1000
f (Hz)
FIGURE 5. Effect of lowering and raising the calcium concentration on resonance curveof computed axon. Threshold current, I1, in microamperes vs. frequency (Hz), both onlog scales. See text for discussion.
f,(Hz)o 300 C 1900 20 0 C 111
A 10o 69
Io(po)2.61.61.05
B
3.5
3.9
4.310
5
Ia(pc)
2
I
Iu.-· i i i i i ---
10 20 50 100
f(Hz)200 500 1000
FIGURE 6. Strength-frequency (resonance) curve of space-clamped squid axon, stimu-lated by AC sinusoidal current at 100, 200, and 30°C, respectively. Threshold current inmicroamperes Vs. frequency (Hz), both on log scales. Note that the effect of temperatureis much greater at low frequencies than in the high frequency (capacitative) region.Note also that both optimum frequency and threshold current increase with increasingtemperature, while the width index, B, decreases. A dashed line is drawn across eachcurve at a current intensity twice that of the threshold current at the optimum frequencyfor calculation of B, the width index.

R. GUrnAN and L. HACHMEISTER Alternating Current Excitation of Squid Axons 315
quency for both experimental and computed axons is shown in greater detailin Fig. 7. Experimental runs on eight axons are displaced vertically up or downby an average of 17.5% for best fit by eye and give a Qto of 1.6. The units onthe ordinate apply to the theoretical curve (solid circles, heavy broken line)only, which has not been displaced to fit the experimental curves. It is clearthat not only does the theoretical curve have a higher threshold, but also moreimportantly that the theoretical axon shows more temperature dependencethan most of the real axons.
t10 i
5 /0
T l l I10 20 30
Temperature (OC)
FIGURE 7. Effect of temperature on threshold current, 10, required at optimum fre-quency for both real and computed axons. Current in microamperes on log scale vs.temperature in C on linear scale. Composite of runs on eight real axons displaced upor down by an average of 17.5% for best fit. Theoretical run not displaced. Units onordinate refer to computed axon only. Note that the computed axon is more temperature-dependent than the real axons. See text for further discussion.
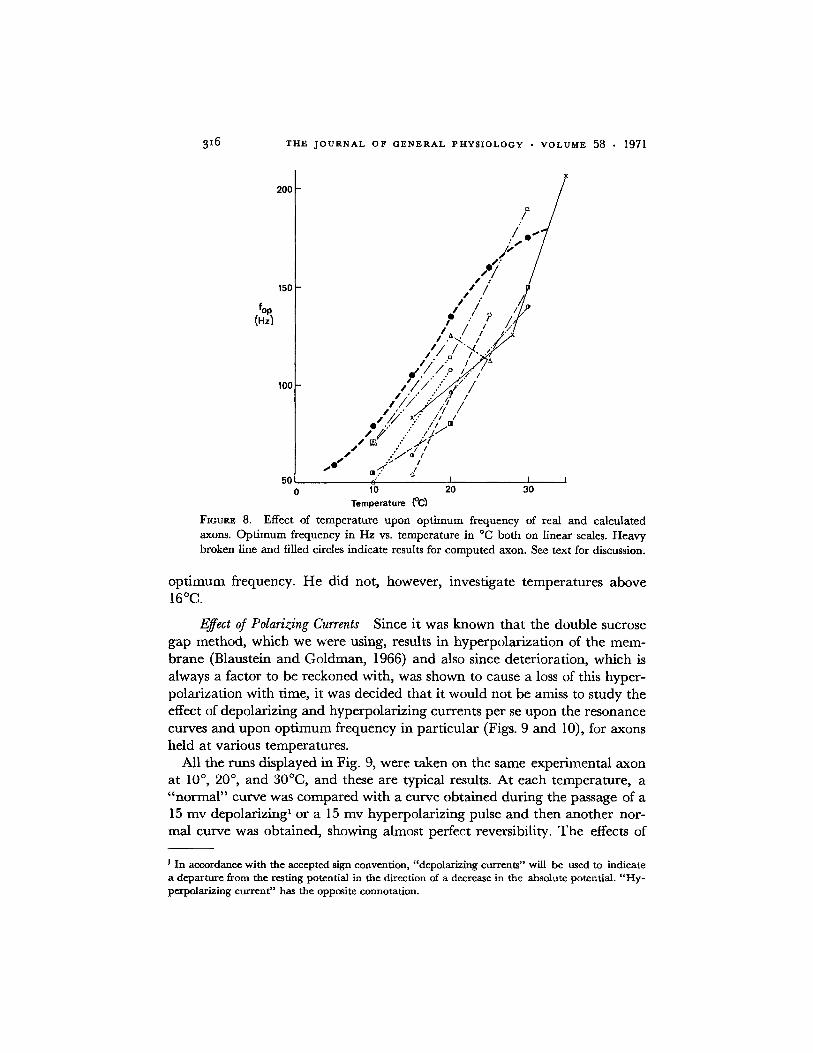
The effect of temperature upon the optimum frequency of real and calcu-lated axons is shown in Fig. 8. In this figure, the runs for the real axons havenot been displaced vertically for best fit. Also, in this figure the optimumfrequency values for the computed axon are based upon calculations of AC
admittance. AC admittance gives the same shape of curve as AC stimulationwould have (cf. Chandler, FitzHugh, and Cole, 1962) but is much easier tocalculate. Both the linear portion of the curve for the theoretical axon and thecurves for real axons give the same Qio of 1.8 for the temperature dependenceof the optimum frequency. Using entirely different methods, Conti (1970)found a Qio variable from 3.7, around 4C (contrary to our result) to 1.9,around 150C (similar to our result) for the temperature dependence of the
THE JOURNAL OF GENERAL PHYSIOLOGY · VOLUME 58 · 1971
so50 10 20 30
Temperature CC)
FIGURE 8. Effect of temperature upon optimum frequency of real and calculatedaxons. Optimum frequency in Hz vs. temperature in C both on linear scales. Heavybroken line and filled circles indicate results for computed axon. See text for discussion.
optimum frequency. He did not, however, investigate temperatures above160C.
Effect of Polarizing Currents Since it was known that the double sucrosegap method, which we were using, results in hyperpolarization of the mem-brane (Blaustein and Goldman, 1966) and also since deterioration, which isalways a factor to be reckoned with, was shown to cause a loss of this hyper-polarization with time, it was decided that it would not be amiss to study theeffect of depolarizing and hyperpolarizing currents per se upon the resonancecurves and upon optimum frequency in particular (Figs. 9 and 10), for axonsheld at various temperatures.
All the runs displayed in Fig. 9, were taken on the same experimental axonat 10°, 20 °, and 30°C, and these are typical results. At each temperature, a"normal" curve was compared with a curve obtained during the passage of a15 mv depolarizing' or a 15 my hyperpolarizing pulse and then another nor-mal curve was obtained, showing almost perfect reversibility. The effects of
I In accordance with the accepted sign convention, "depolarizing currents" will be used to indicatea departure from the resting potential in the direction of a decrease in the absolute potential. "Hy-perpolarizing current" has the opposite connotation.

R. GUTTMAN and L. HACHMEISTER Alternating Current Excitation of Squid Axons 317
Tolo 7-70 f(Hz) (a) B
10° WC f(Hz) (a) B 10 20C Hyper. o 83 2.4 5.010 ~ Hyper. o 55 1.7 4.7 0 Norm. 0 111 1.6 3.9
Norm. o 69 1.05 4.2 Depol. 167 1.1 2.8Depol. 74 0.7 3.9 //
0.5 510 20 50 100 200 500 dOO0 t0 20 50 t00 200 500 1000
f(Hz) f(Hz)
10 30°C
L(/a)
2 1
0.5 l i l10 50 100 200 500 20 50 oo 200 500500 oo
f(Hz)
FIGURE 9. Effect of 15 mv depolarizing and hyperpolarizing currents on resonancecurves of real space-clamped squid axons at 10°, 20°, and 30°C. Threshold current inmicroamperes vs. frequency (Hz) both on log scales. All points taken on same axon.
Note excellent recovery (solid circles) in each case. Typical results. See text for discussionof results.
hyperpolarizing pulses were: (a) an increase in threshold current, (b) a de-crease in sharpness of tuning, and (c) a decrease in optimum frequency. Theeffects of a depolarizing current pulse were (a) a decrease in threshold current,(b) an increase in sharpness of tuning, and (c) an increase in optimum fre-quency.
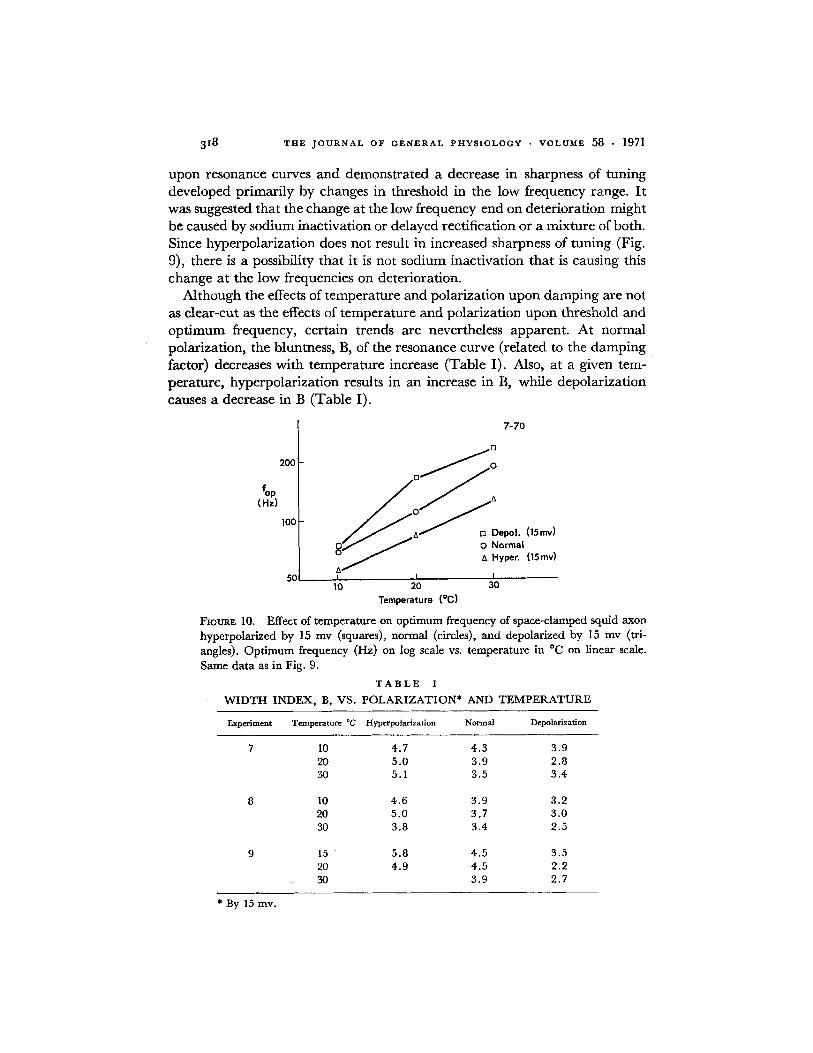
Fig. 10, where optimum frequency is plotted against temperature for thesame hyperffect of 15 my depoarized, normal, and hyperpoarizinged currents on resFig. 9, indi-
cates that ex-damperimental hyperpolarizatio n does not ma rkedly alter the tem-
ricroamperatu res vs. frequpend enc of both optimum frequency. Thus, although our normalaxons were hyperpolarized by the sucrose gaps, we have established that thetempered optimum frequ dependency is plotted against temperature ofor theishyperpolatureion of the axons.
As mentioned above, we investigated (cf. Fig. 2) the effect of deterioration
318 THE JOURNAL OF GENERAL PHYSIOLOGY ·VOLUME 58 · 1971
upon resonance curves and demonstrated a decrease in sharpness of tuningdeveloped primarily by changes in threshold in the low frequency range. Itwas suggested that the change at the low frequency end on deterioration mightbe caused by sodium inactivation or delayed rectification or a mixture of both.Since hyperpolarization does not result in increased sharpness of tuning (Fig.9), there is a possibility that it is not sodium inactivation that is causing thischange at the low frequencies on deterioration.
Although the effects of temperature and polarization upon damping are notas clear-cut as the effects of temperature and polarization upon threshold andoptimum frequency, certain trends are nevertheless apparent. At normalpolarization, the bluntness, B, of the resonance curve (related to the dampingfactor) decreases with temperature increase (Table I). Also, at a given tem-perature, hyperpolarization results in an increase in B, while depolarizationcauses a decrease in B (Table I).
7-70
200 -
fop(Hz)
a D i
0 H
I I II
100 Hepol. (15mv)ormal
yper. (15mv)
snzmu I
10 20
Temperature (C)30
FIGURE 10. Effect of temperature on optimum frequency of space-clamped squid axonhyperpolarized by 15 mv (squares), normal (circles), and depolarized by 15 my (tri-angles). Optimum frequency (Hz) on log scale vs. temperature in C on linear scale.Same data as in Fig. 9.
TABLE I
WIDTH INDEX, B, VS. POLARIZATION* AND TEMPERATURE
Experiment Temperature C Hyperpolarization Normal Depolarization
7 10 4.7 4.3 3.920 5.0 3.9 2.830 5.1 3.5 3.4
8 10 4.6 3.9 3.220 5.0 3.7 3.030 3.8 3.4 2.5
9 15 5.8 4.5 3.520 4.9 4.5 2.230 3.9 2.7
* By 15 my.
R. GUTTMAN and L. HACHMEISTER Alternating Current Excitation of Squid Axons 319
DISCUSSION
Hill et al. (1936) studied the effect of temperature upon the optimum fre-quency of frog nerves stimulated by alternating currents in normal Ringersolution and in high calcium. They were not able to extend these studies tonerves treated with citrate, since the results were very complicated. They feltthis might have been caused by the fact that with the long-lasting waves ofalternating current at low frequencies, the nerve may have responded repeti-tively to each half-wave, for Katz (1939) had shown that a series of actioncurrents may occur when a constant current is passed through a medullatednerve when accommodation is very slow.
Working with axons deprived of calcium ions, both Arvanitaki (1939) andBrink, Bronk, and Larrabee (1946) felt that the frequency of conducted im-pulses along the fiber is determined by the frequency of the local excitatoryprocess. On the other hand, we were able to show that when spikes and sub-threshold responses appeared in squid axons intermixed in a train, the spikefrequency was significantly lower than the frequency of subthreshold oscilla-tions (Guttman and Barnhill, 1970).
Monnier and Coppee used the term, "pararesonance" rather than "reso-nance" in describing their results since the curves they obtained were consider-ably less sharp than true resonance curves. Cole and Marmont (1942) demon-strated that in the absence of calcium, the squid axon membrane showedincreased inductive and capacitive reactances and decreased zero-frequencyresistance, properties of a well-tuned resonant circuit. In the absence of cal-cium, then, true resonance rather than pararesonance was demonstrated. Cole1941) then proposed for the normal membrane in seawater an equivalentcircuit containing an inductive element. He postulated an equivalent in-ductance of 0.1 henry cm2 and suggested that it is the structural characteristicsof the membrane which govern the periodic activity and natural frequency ofnerve. Later measurements (Cole, 1949) gave two capacitive elements. Thiswas accentuated in high calcium.
Using impedance as the dependent variable, Conti very recently (1970)found that the optimum frequency remained the same when the concentrationof calcium (and other ions) was varied. This is contrary to what we foundwhen threshold sinusoidal current intensity was used as the dependent vari-able, for in that case low calcium increased and high calcium decreasedoptimum frequency reversibly.2 (Phenomenological impedance of squid giantaxons and natural frequency of oscillation were studied by Mauro et al.[1970].)
The membrane is acting as a rectifier and the reactance is associated with
2 It should be kept in mind, however, that the amount Conti altered the calcium concentrationfrom the normal was considerably less than in our experiments.
320 THE JOURNAL OF GENERAL PHYSIOLOGY · VOLUME 58 · 1971
its nonlinearity. One would expect that varying the calcium content of theenvironment would somehow affect this aspect of the membrane. Our resultsconfirm this view.
In conclusion, this work has investigated the characteristics of living cellmembranes by studying the effect of variation of the ionic environment uponalternating current excitation. Specifically, changes in calcium concentrationstrongly affect the natural frequency and damping of squid axon membranes.
A resonance curve used for studying AC excitation is a second-order phe-nomenon and not a primary one. Thus, it cannot directly give new insightsinto membrane mechanisms. However, it is a way of showing where the equa-tions are not entirely adequate and so should help in elucidating the mecha-nisms involved.
The agreement obtained here in the investigation of AC excitability of realand computed axons suggests that (a) the manipulation of the concentrationof a divalent ion in a solution bathing a real axon is adequately explained bya shift in the voltage of all parameters of the HH model according to themethod of Huxley (1959); (b) the effect of temperature is to change the timescale of all conductances with a Qio of 3 (Hodgkin, Huxley, and Katz, 1952);and (c) polarization involves setting the balance of resting Na and K con-ductances by adjusting them with the level of the resting potential (Mauroet al., 1970).
We wish to express our thanks to Dr. Frederick A. Dodge, Jr. of IBM Research, Thomas J. WatsonResearch Center, Yorktown Heights, N.Y. for some of the computations on the theoretical axon.We are also grateful to Dr. Kenneth S. Cole of the National Institutes of Health for suggestions anddiscussion and to Professor A. M. Monnier of the University of Paris, who so generously helped usanalyze the experimental data.In addition we wish to acknowledge with thanks the help of Mr. Robert Barnhill, who designed andbuilt much of the equipment.This work has been aided by grants NIH R01 NB07259-04 and 1 R03 MH 17298-0 1 MSMawarded to one of us (RG).
Received for publication 9 March 1971.
REFERENCES
ARVANITAKI, A. 1939. Arch. Int. Physiol. 49:209.BLAUSTEIN, M. P., and D. E. GOLDMAN. 1966. Biophys. J. 6:453.BRINK, F., D. BRONK, and M. G. LARRABEE. 1946. Ann. N.Y. Acad. Sci. 47:457.CHANDLER, W. K., R. FTzHUGH, and K. S. COLE. 1962. Biophys. J. 2:105.COLE, K. S. 1941. J. Gen. Physiol. 25:29.COLE, K. S. 1949. Arch. Sci. Physiol. 3:253.COLE, K. S. 1968. Membranes, Ions and Impulses. University of California Press, Berkeley,
California.COLE, K. S., and G. MARMONT. 1942. Fed. Proc. 1:15.CONTI, F. 1970. Biophysik. 6:257.GUTTMAN, R. 1969. Biophys. J. 9:269.GUTTMAN, R., and R. BARNHILL. 1970. J. Gen. Physiol. 55:24.
R. GUTTMAN and L. HACHMEISTER Alternating Current Excitation of SquidAxons 321
HILL, A. V., B. KATZ, and D. Y. SOLANDT. 1936. Proc. Roy. Soc. Ser. B. Biol. Sci. 121:74.HODGKIN, A. L., and A. F. HUXLEY. 1952. J. Physiol. (London). 117:500.HODGKIN, A. L., A. F. HUXLEY, and B. KATz. 1952. J. Physiol. (London). 116:424.HUXLEY, A. F. 1959. Ann. N. Y. Acad. Sci. 81:221.KATZ, B. 1939. Electric Excitation of Nerve. Oxford University Press, London.KENNELLY, A. E. 1923. Electrical Vibration Instruments. The Macmillan Company, New York.MAURO, A., F. CONTI, F. DODGE, and R. SCHOR. 1970. J. Gen. Physiol. 55:497.MONNIER, A. M. 1952. Cold Spring Harbor Symp. Quant. Biol. 17:69.MONNIER, A. M., and G. COPPvE. 1939. Arch. Int. Physiol. 48:129.TASAKI, I., and M. SATO. 1951. J. Gen. Physiol. 34:373.