Embed Size (px)
Citation preview
BGD11, 13739–13774, 2014
Effect of ammoniuminput over the
distribution of iron inthe seawater and the
phytoplankton
N. Sanchez et al.
Title Page
Abstract Introduction
Conclusions References
Tables Figures
J I
J I
Back Close
Full Screen / Esc
Printer-friendly Version
Interactive Discussion
Discussion
Paper
|D
iscussionP
aper|
Discussion
Paper
|D
iscussionP
aper|
Biogeosciences Discuss., 11, 13739–13774, 2014www.biogeosciences-discuss.net/11/13739/2014/doi:10.5194/bgd-11-13739-2014© Author(s) 2014. CC Attribution 3.0 License.
This discussion paper is/has been under review for the journal Biogeosciences (BG).Please refer to the corresponding final paper in BG if available.
Effect of ammonium input over thedistribution of iron in the seawater andthe phytoplankton in a mesocosmexperiment in a North Patagonian fjord
N. Sanchez1, M. V. Ardelan1, N. Bizsel2, and J. L. Iriarte3
1Norwegian University of Science and Technology (NTNU), Department of Chemistry,Trondheim 7491, Norway2Institute of Marine Sciences and Technology, Dokuz Eylul University, H. Aliyev Bulv., No. 10,Inciralti, Izmir, Turkey3Instituto de Acuicultura and Centro de Investigación en Ecosistemas de la Patagonia-CIEP,Universidad Austral de Chile, Puerto Montt. COPAS Sur-Austral, Universidad de Concepción,Concepción, Chile
Received: 30 July 2014 – Accepted: 11 August 2014 – Published: 22 September 2014
Correspondence to: N. Sanchez ([email protected])
Published by Copernicus Publications on behalf of the European Geosciences Union.
13739
BGD11, 13739–13774, 2014
Effect of ammoniuminput over the
distribution of iron inthe seawater and the
phytoplankton
N. Sanchez et al.
Title Page
Abstract Introduction
Conclusions References
Tables Figures
J I
J I
Back Close
Full Screen / Esc
Printer-friendly Version
Interactive Discussion
Discussion
Paper
|D
iscussionP
aper|
Discussion
Paper
|D
iscussionP
aper|
Abstract
The distribution and concentration of iron in seawater and plankton were studied underdifferent ammonium concentrations along a 22 day mesocosm experiment in order toassess possible effects of aquaculture over the phytoplankton and the biogeochemistryin fjords of Chile. Brackish and marine water were used in two different setups, each5
one with 1 control and 4 different NH+4 concentrations. Total Chelex labile (TFeCh),
dissolved Chelex labile (DFeCh) and DGT labile (FeDGT) iron measurements were per-formed in seawater, wheile the particulate iron content was determined as total (PFe)and fractionated (PFeSF) for the plankton community. Average concentration per treat-ment showed higher concentrations for both TFeCh and DFeCh in the marine system10
compared to the brackish. TFeCh showed general increasing trend in time and withincreasing ammonium concentration, exhibiting positive correlation to the chlorophylland particulate organic carbon content, whereas DFeCh presented an inverse patternas expected. FeDGT showed an average lower concentration compare to DFeCh withfinal concentrations significantly lower in treatments with artificial ammonium addition.15
PFe showed an increasing trend in time and with increasing ammonium in both sys-tems. Yet, when normalized to Chlorophyll a or particulate organic carbon the trendinverted, showing that at higher ammonium loading the iron per Chlorophyll a or partic-ulate organic carbon decreases. PFeSF major changes occurred in the marine systemin the ratio between the 20–140 µm and the 2–20 µm fractions, suggesting possible20
community structure shift. Overall, ammonium input indicated an effect over iron inthe seawater and the particulate matter, depending on the iron form and the microbialassemblage. The further changes over the microbial composition due to ammoniumaddition may affect the cycling of iron, having possible negative or positive feedbacksover major biogeochemical cycles.25
13740
BGD11, 13739–13774, 2014
Effect of ammoniuminput over the
distribution of iron inthe seawater and the
phytoplankton
N. Sanchez et al.
Title Page
Abstract Introduction
Conclusions References
Tables Figures
J I
J I
Back Close
Full Screen / Esc
Printer-friendly Version
Interactive Discussion
Discussion
Paper
|D
iscussionP
aper|
Discussion
Paper
|D
iscussionP
aper|
1 Introduction
Fjords ecosystem in Chile, constitute nearly pristine environment experiencing a grow-ing anthropogenic influence, being aquaculture one of the main drivers. This industryhas seen and increased expansion in the last two decades, causing growing concernover the environmental impact. Salmon farming releases nutrients as dissolved inor-5
ganic species through excretion (Ammonium (NH+4 ) and phosphate (PO3−
4 )), particu-late organic nitrogen (PON) and phosphorus (POP) through defecation, and its dis-solved components (DON and DOP) through resuspension from the particulate frac-tions (Olsen and Olsen, 2008). Oxygen depletion and decreased biodiversity amongothers are well documented effects for the marine sediments and benthic fauna. How-10
ever, current knowledge of how waste release affects the structure and function of thepelagic ecosystems is still scarce (Cloern, 2001; Olsen et al., 2006). It has been pro-posed that this waste release may alter nutrient stoichiometry in the seawater determin-ing to some extent how the marine environment responds to increasing anthropogenicinputs of nutrients (Arrigo, 2005).15
Major biogeochemical cycles (carbon, nitrogen and phosphorus) in the marine en-vironment, are strongly dependent on marine microbes as this group is directly re-sponsible for approximately half of the earth’s primary production (Field et al., 1998).In coastal areas like fjord regions, the macronutrient nitrogen is mainly contributedas nitrate NO−
3 with the incoming deep water (nutrient-rich) and/or the surface layers20
through the run-off of inland fertilizers. After phytoplankton uptake, a series of metabolicprocess occur in order to be finally assimilated as NH+
4 . Within these steps of the ni-trogen cycle, as well as for that of major elements, are involved metabolic processesthat are dependent on the availability of certain “micro-nutrients”. Trace metals suchas Mn, Fe, Co, Ni, Cu, Zn and Cd are involved in several biological processes capa-25
ble of influencing the biochemical cycling in aquatic systems such as of carbon (e.g.carbon-concentrating mechanism involves the Zn metalloenzyme carbonic anhydrase)or nitrogen (e.g. Fe requirements for metalloenzymes in nitrogen cycle) (Morel and
13741

BGD11, 13739–13774, 2014
Effect of ammoniuminput over the
distribution of iron inthe seawater and the
phytoplankton
N. Sanchez et al.
Title Page
Abstract Introduction
Conclusions References
Tables Figures
J I
J I
Back Close
Full Screen / Esc
Printer-friendly Version
Interactive Discussion
Discussion
Paper
|D
iscussionP
aper|
Discussion
Paper
|D
iscussionP
aper|
Price, 2003). As most of these elements are continuously exported out the photic zoneto depth as settling organic biomass, biological processes (uptake, trophic transfer,regeneration, excretion and decomposition) are critical in controlling the fate of thesebioactive metals in the ocean (Wang et al., 2001). In the case of iron, the key role itplays on major biochemical cycles in the marine environment is well acknowledged5
(Martin et al., 1991; Martin, 1991; Morel et al., 1991). Specifically related to nitrogen,Fe is involved in the nutrient uptake by diatoms as NO−
3 undergoes sequential reduc-tion to nitrite and ammonium, each step involving the assimilatory nitrate reductaseand assimilatory nitrite reductase enzymes respectively (Zehr and Ward, 2002).
Through this feedback control mechanism between so-called “macro” and “micro”10
nutrients, it can be expected that a species shift in the macronutrient load (e.g. NO−3 to
NH+4 ) in a given environment, may affect in the long term the cycling of trace elements.
The biologically “New” vs. “Regenerated” production, based on the NO−3 : NH+
4 ratio inthe water column, is a determinant factor favoring growth rates of certain groups ofprimary producers (Thompson et al., 1989). Therefore, increased input of dissolved15
inorganic nutrients (NH+4 and PO3−
4 ) by aquaculture activities may have a direct effecton the phytoplankton community structure (Olsen and Olsen, 2008). The general re-sponse from marine pelagic ecosystems to nutrient enrichment is reflected in increasenutrient uptake by phytoplankton and bacteria and hence growth rate, with the con-sequent increased autotrophic biomass transfer to higher trophic levels (Olsen and20
Olsen, 2008). However, knowledge on the capacity for phytoplankton to biologicallyuptake and metabolize these surplus of nutrients, strongly link to the bioavailability ofcertain trace metals, is still scarce. For instance, changes in nitrogen supply (e.g. NH+
4 ),could potentially affect the cycling of iron, perhaps modifying the Fe requirements ofthe phytoplankton community.25
Base on the above, it can be expected that an environment following nutrient enrich-ment through NH+
4 may modify nitrogen cycling and the stoichiometry of trace elementslinked to it. Therefore, it is likely that NO−
3 to NH+4 shift achieved through progressive
addition of nutrients would imply in the long term, changes in Fe requirements by phy-
13742

BGD11, 13739–13774, 2014
Effect of ammoniuminput over the
distribution of iron inthe seawater and the
phytoplankton
N. Sanchez et al.
Title Page
Abstract Introduction
Conclusions References
Tables Figures
J I
J I
Back Close
Full Screen / Esc
Printer-friendly Version
Interactive Discussion
Discussion
Paper
|D
iscussionP
aper|
Discussion
Paper
|D
iscussionP
aper|
toplankton, with a consequent effect on trophic transfer to higher trophic levels. In orderto asses probable feedbacks process between nitrogen and iron marine cycles and im-plications in the base of the pelagic marine food web, a mesocosm experiment wascarried out to simulate the nutrient enrichment occurring in fjords ecosystems prod-uct of salmon farming, to determine the concentration and variation in time of different5
fractions of Fe in the seawater and plankton community under different NH+4 concen-
trations.
2 Materials and methods
2.1 Study area
Experiments were carried out during the austral summer season between January10
and February 2011 at the facilities of the Huinay Scientific Field Station (42◦22′46′′ S–72◦25′12′′ W) in the Comau fjord, Northern Patagonia (Fig. 1). The fjord hydrographyfeatures a two layer system with the presence of a permanent low salinity layer (LSL)between the surface and ∼ 5 m, product of the mixing of freshwater (precipitation andriver runoff) with oceanic water where the salinity regulates the formation of the pyc-15
nocline. The latter determined the reason for using two types of water to perform theexperiments.
2.2 Mesocosms set up
A total of 10 (1 m3) tanks were filled with water collected at depths of 2 (brackish) and10 (marine) meters respectively, each one representing one treatment (Fig. 1). Water20
pumped into the tanks was collected with a peristaltic pump (Multifix type M80), placedin a peer and using plastic hose (35 mm diameter) projected 30 m offshore. Flowingwater were pumped into a 33 L plastic collector, then afterwards equally distributed toeach of the five tanks. The water was not prescreened, in order to contain the differenttaxonomic groups at the various trophic levels of the natural plankton assemblage.25
13743

BGD11, 13739–13774, 2014
Effect of ammoniuminput over the
distribution of iron inthe seawater and the
phytoplankton
N. Sanchez et al.
Title Page
Abstract Introduction
Conclusions References
Tables Figures
J I
J I
Back Close
Full Screen / Esc
Printer-friendly Version
Interactive Discussion
Discussion
Paper
|D
iscussionP
aper|
Discussion
Paper
|D
iscussionP
aper|
2.3 Nutrient additions
In order to simulate nutrient enrichment occurring in the water column product ofsalmon aquaculture waste, tanks were supplied with four different concentration (treat-ments) of macronutrients (nitrogen, phosphorus and silicon) as ammonium chloride(NH4Cl), sodium dihydrogen phosphate monohydrate (NaH2PO4.H2O) and sodium5
metasilicate enneahydrate (Na2SiO39.H2O) every third day at a fix ratio. Althoughsalmon aquaculture does not add silicon into the marine environment, it was supplieddue to fjords ecosystem in southern Chile has continuous and in excess natural inputof it, thus preventing potential nutrient limiting specifically for diatoms. The five unitsused per system, were denominated as Control, Natural, Conc 1, Conc 2 and Conc 3,10
where “Control” corresponded to the unit with no addition of nutrients, whereas “Natu-ral”, received a nutrient input at the average ratio for N : P : Si, occurring in the naturalenvironment (González et al., 2010, 2011; Iriarte et al., 2013). The three other units re-ceived the experimental nutrient concentrations from the lowest (Conc1) to the highest(Conc3) (Table 1).15
2.4 Laboratory work
Processing of the samples collected in the field as performed under Class-100 lam-inar flow hood (AirClean 600 PCR Workstation) minimizing possible contamination,whereas laboratory worked was carried out in a class 1000 clean laboratory at theDepartment of Chemistry at NTNU. After processing, all samples were analyzed by20
High Resolution Inductive Coupled Plasma Mass Spectrometry (HR-ICP-MS) Element2 (Thermo-Finnigan) with PFA-Schott type spray chamber and nebulizer.
2.5 Chelex samples
Samples for total Chelex labile (TFeCh) and dissolved Chelex labile (DFeCh) iron werecollected in acid washed PE bottles, where a volume (∼ 150 mL) of water was collected25
13744

BGD11, 13739–13774, 2014
Effect of ammoniuminput over the
distribution of iron inthe seawater and the
phytoplankton
N. Sanchez et al.
Title Page
Abstract Introduction
Conclusions References
Tables Figures
J I
J I
Back Close
Full Screen / Esc
Printer-friendly Version
Interactive Discussion
Discussion
Paper
|D
iscussionP
aper|
Discussion
Paper
|D
iscussionP
aper|
and added 0.8 mL of Chelex-100 slurry (Bio-Rad Laboratories) (previously treated withAmmonium Acetate buffer (C2H4O2 ·NH3)). For the DFeCh, 0.2 µm acid washed filters(0.45+0.2 µm Sartorious Sartobran 300) and all-plastic syringes (PE) were used tofilter the water. All samples were double bagged and placed in a shaker (65–80 rpm) for48–72 h. After this period, each sample was transferred to an acid-washed plastic PE5
column (Bio-Rad Laboratories), where the water was washed out through the column,and the Chelex-100 containing the material was restrained by the resin present at theend of the column. Columns were first rinsed with Milli-Q water and secondly with∼ 10 mL of 0.1 M Ammonium Acetate buffer to remove the residue of seawater matrix,then afterwards packed and stored at 4 ◦C. In the clean laboratory, extraction of trace10
metals was done in a two-step acidifying process, obtaining a final 5 mL 0.6 M HNO3sample (Ardelan et al., 2010; Öztürk et al., 2002).
2.6 DGT samples
Diffusive gradient in thin films (DGT) (Zhang and Davison, 1995) samples were col-lected for labile iron (FeDGT), placing three DGT samplers in acid washed plastic con-15
tainers with a known volume (∼ 2000 mL) of water. Containers were placed in a shaker(60–80 rpm) for 48–72 h, then after emptied and samplers stored at 4 ◦C. In the cleanlaboratory, all DGT samplers were processed over a Teflon sheet, where the first twolayers (filter and gel) were removed. The third layer, containing the gel with the resinwas transferred to an acid washed PE tube and 4 mL 3 M UP HNO3 was added. PE20
tubes containing the resin were put on a shaker at (60–80 rpm) for a 12 h period. After-wards, content in the PE tubes were transferred to new acid-washed PE tubes, keepingout the gel with resin. To assured total transfer of material, 4 mL of Milli-Q water wereused to rinse old tubes and then poured into the new ones, obtaining a final 5 mL0.6 M HNO3 sample (Ardelan et al., 2009).25
13745

BGD11, 13739–13774, 2014
Effect of ammoniuminput over the
distribution of iron inthe seawater and the
phytoplankton
N. Sanchez et al.
Title Page
Abstract Introduction
Conclusions References
Tables Figures
J I
J I
Back Close
Full Screen / Esc
Printer-friendly Version
Interactive Discussion
Discussion
Paper
|D
iscussionP
aper|
Discussion
Paper
|D
iscussionP
aper|
2.7 Size fraction filtration
To determine the concentration and distribution of the particulate iron within theplankton community as a total (PFe) and in different size fractions (PFeSF) presentin the mesocosms, simple and sequential fractionation filtration were performed re-spectively. The former, implied filtration only through 0.2 µm, while the later, encom-5
passed a range of five size classes: 0.8–2 µm (picoplankton), 2–10 µm (nanoplankton),10–20 µm (larger nanoplankton), 20–140 µm (microplankton) and >140 µm (mesozoo-plankton). Filtration up to the 10 µm was performed with a simple filtration system fittedto a peristaltic pump and using acid washed filters (Isopore Membrane, polycarbonate,Hydrophilic, 0.2, 2, 10 µm, 47 mm), whereas filtration from 20, 140 and 220 µm fractions10
were performed with acid washed meshes (Nitex) with different pore size, with the re-tained material then afterwards washed into 0.2 µm filters. Filtration volumes rangedfrom ≥ 2000 mL for bigger fractions to a 100 mL for the smaller ones. Samples werekept frozen until further processing.
In the clean laboratory, samples went under High Performance Microwave Reactor15
(Ultra Clave UC Milestone) digestion, by placing the filters into Teflon tubes, adding5 mL of 7 M UP HNO3 and then inside the UC for two hours. After digestion process,samples were set to final dilution of 61±0.3 mg. Original volume was recalculated(density of ultra-pure water 0.998 gr cm−3 at room temperature), using initial volumefiltered to obtain final concentration.20
2.8 Blanks and detection limits
The detection limit used here is three times the standard deviation calculated fromthe measured method blank values. All values reported here, lie above the blank valuedetermined, first subtracted from the blanks obtained from HR-ICP-MS values and thencalculated to the appropriate concentration. Blanks and detection limits of the analysis25
performed in HR-ICP-MS for each technique are presented (Table 2) (Ardelan et al.,2010).
13746

BGD11, 13739–13774, 2014
Effect of ammoniuminput over the
distribution of iron inthe seawater and the
phytoplankton
N. Sanchez et al.
Title Page
Abstract Introduction
Conclusions References
Tables Figures
J I
J I
Back Close
Full Screen / Esc
Printer-friendly Version
Interactive Discussion
Discussion
Paper
|D
iscussionP
aper|
Discussion
Paper
|D
iscussionP
aper|
3 Results
3.1 Iron variability in the mesocosms seawater
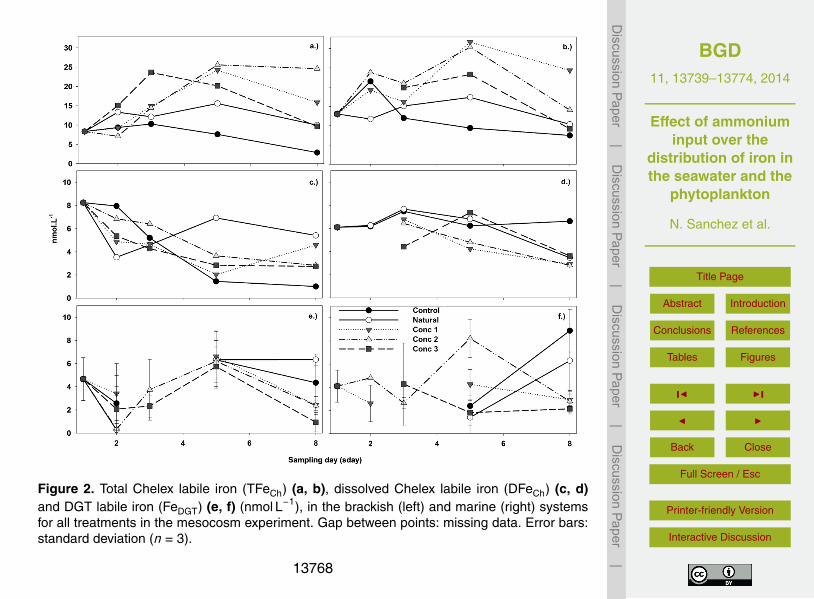
Measurements for TFeCh, DFeCh and FeDGT along the experiment presented high vari-ability between treatments and among the two systems (Fig. 2). Overall, TFeCh andDFeCh concentrations presented higher values on the marine compared to the brack-5
ish system. In the other hand, average FeDGT concentration for all treatments showedno difference between the brackish (4.0±2.4 nmol L−1) and marine (3.9±2.3 nmol L−1)system (Table 3). TFeCh distribution for every treatment in both systems, tended tofollow the same distribution pattern in time, with an initial increase followed by a max-imum and a posterior decrease (Fig. 2a and b). Mean TFeCh concentrations for the10
Control and Natural treatments in both systems presented the lowest values (brack-ish: 7.7±2.9 nmol L−1 and 11.9±2.8 nmol L−1 and marine: 12.7±5.4 nmol L−1 and13.5±2.8 nmol L−1 respectively) among all five treatments (Table. 3). DFeCh distribu-tion in time, exhibited lower range of variability compared to TFeCh, with a more con-sistent decreasing trend in time for both systems (Fig. 2c and d). Except for the Natural15
treatment in the marine system, final concentrations for all treatments in both systemspresented lower values than initial ones (Table 3).
Conversely to TFeCh and DFeCh, FeDGT distribution in time showed no clear trend nei-ther in the brackish nor in the marine system (Fig. 2e and f).Values in the brackish sys-tem ranged from very low 0.3±0.1 nmol L−1 up to 6.6±2.2 nmol L−1, while those in the20
marine system presented a broader range (up to 9.5±2.0 nmol L−1). In both systemsthe final concentrations in the Control and Natural treatments presented the highestvalues, being above initial values, whereas the final concentrations for the other treat-ments were below initial values. A comparison between treatment’s final concentrationsshowed significant differences between the Natural and the three artificial nutrient ad-25
dition treatments (Conc 1, Conc 2 and Conc 3) (1-way ANOVA; DF: 14, Holm–Sidaktest), for both brackish and marine mesocosms.
13747

BGD11, 13739–13774, 2014
Effect of ammoniuminput over the
distribution of iron inthe seawater and the
phytoplankton
N. Sanchez et al.
Title Page
Abstract Introduction
Conclusions References
Tables Figures
J I
J I
Back Close
Full Screen / Esc
Printer-friendly Version
Interactive Discussion
Discussion
Paper
|D
iscussionP
aper|
Discussion
Paper
|D
iscussionP
aper|
3.2 TFeCh, DFeCh, FeDGT and NH+4 loading
No significant relationship was found between TFeCh and DFeCh and between DFeChand FeDGT for all 5 treatments neither for the brackish nor the marine system. Yet,comparing TFeCh and DFeCh only for treatments with artificial nutrient addition (Conc1, Conc 2 and Conc 3), a negative correlation (R2 = 0.535) appears for these vari-5
ables in the brackish system (Fig. 3a). Relative to the NH+4 loading, concentrations
for TFeCh presented positive correlation for both the brackish (R2 = 0.606) and marine(R2 = 0.839) systems, reflecting the increasing trend time observed with increasingNH+
4 concentration. Contrary to TFeCh, the DFeCh exhibited a negative trend in bothsystems, but not significant (Fig. 3b and c).10
3.3 Iron variability in the mesocosms plankton community
PFe in all treatments presented a higher mean value (116.3±75.1 nmol L−1) in the ma-rine compare to the brackish system (80.6± 44.6 nmol L−1). Average in time for eachtreatment with artificial NH+
4 addition in both systems, showed higher values compareto those of the Control and the Natural treatments. The trend exhibited by PFe content15
in the plankton biomass followed an increase along time and with increased NH+4 load-
ing (Conc 3 treatment values in both systems, showed an noticeable decrease at theend of the experiment) (Fig. 4a). However, when standardized by the total Chlorophyll(Chl a) content, PFe : Chl a reflected an inverse trend with a decreasing concentrationwith increasing NH+
4 loading along time in both systems (Fig. 4b). Same change in trend20
occurred when PFe was standardized by the particulate organic carbon (PFe : POC)(Fig. 4c). Furthermore, when standardized by and plotted against either Chl a or POC,the PFe the three artificial addition treatments showed a negative exponential correla-tion (R2: 0.507 to 0.960), supporting the trend observed (Fig. 5).
Likewise PFe in the Control treatments, PFeSF showed a decreasing trend from an25
initial concentration (all fractions added) of 95.9 nmol L−1 to 32.9 nmol L−1 (65.7 % re-
13748
BGD11, 13739–13774, 2014
Effect of ammoniuminput over the
distribution of iron inthe seawater and the
phytoplankton
N. Sanchez et al.
Title Page
Abstract Introduction
Conclusions References
Tables Figures
J I
J I
Back Close
Full Screen / Esc
Printer-friendly Version
Interactive Discussion
Discussion
Paper
|D
iscussionP
aper|
Discussion
Paper
|D
iscussionP
aper|
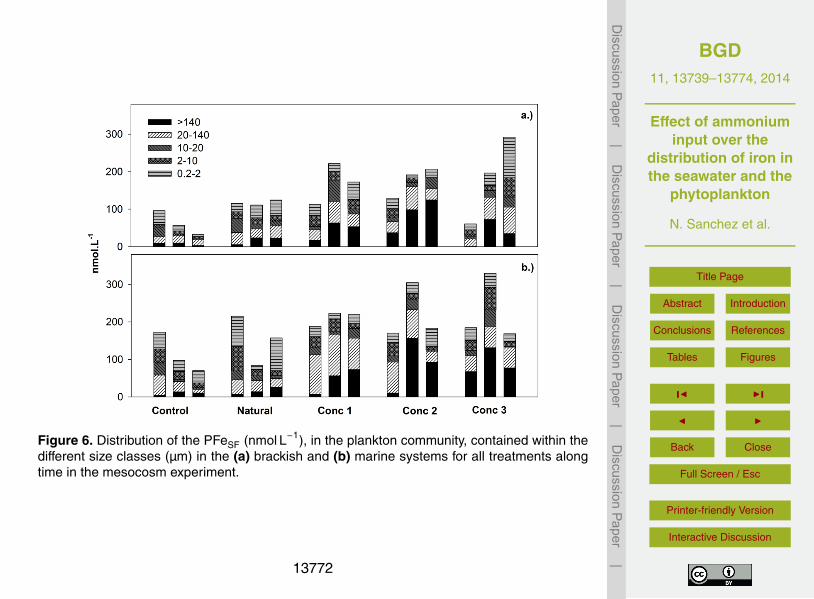
duction), and from 173.8 nmol L−1 to 70.1 nmol L−1 (59.7 % reduction) for the brackishand for the marine mesocosms respectively (Fig. 6). For the Natural treatment, no trendin time for any of the systems was observed. In the same way as PFe, all treatmentswith artificial nutrient addition showed higher total mean concentration than Control andNatural treatments. Mean total PFeSF concentrations for Conc 1, Conc 2 and Conc 35
of 168.8±54.4, 176.0±40.9 and 230.9±85.6 nmol L−1 (mean ± SD) for the brackishand 210.2±19.3, 219.6±74.2 and 183.0±116.4 nmol L−1 (mean±SD) for the marinesystem, showed increasing trend with increased NH+
4 loading (Fig. 6).PFeSF in the 0.8–2 µm fraction as percentage of the total, remained in the same
range with no significant changes among treatments in the brackish system. Yet, 0.8–10
2 µm fraction in the marine system, for all treatments with artificial nutrient additionshowed a lower proportion (Conc 1: 10.9 % Conc 2: 17.5 % and Conc 3: 13.7 %) com-pare to Control (34.8 %) and Natural (35.3 %) treatments. In the case of the PFeSF inthe fraction > 140 µm, it was appreciable an increase in the proportion in all treatmentswith artificial nutrient addition in the brackish (Conc 1: 24.9 %, Conc 2: 46.7 % and15
Conc 3: 16.7 %) compare to Control (11.6 %) and Natural (14.9 %)), and in the marine((Conc 1: 20.8 % Conc 2: 35.9 % and Conc 3: 39.8 %) compare to Control (10.3 %) andNatural (12 %)) yet not significant in either case.
3.4 PFeSF in the 20–140 and 2–20 µm fraction
To compare PFeSF contained in the plankton community in the size spectrum from20
2 to140 µm, the fractions 2–10 µm and 10–20 µm (containing the nanoplankton) wereadded and then compare against the 20–140 µm fraction (containing the microplank-ton) (Fig. 8a and c). In the brackish system, the microplankton – nanoplankton ratio(µ/n ratio) presented no significant differences between treatments (1-way ANOVA,DF: 14 P: 0.589). In the other hand, in the marine system the Control and Natural25
treatments presented mean ratios of 0.8±0.2 and 0.8±0.4 respectively, while Conc 1,Conc and Conc 3 mean ratios values were 2.4±0.4, 1.9±0.3 and 0.9±0.4 respectively.
13749
BGD11, 13739–13774, 2014
Effect of ammoniuminput over the
distribution of iron inthe seawater and the
phytoplankton
N. Sanchez et al.
Title Page
Abstract Introduction
Conclusions References
Tables Figures
J I
J I
Back Close
Full Screen / Esc
Printer-friendly Version
Interactive Discussion
Discussion
Paper
|D
iscussionP
aper|
Discussion
Paper
|D
iscussionP
aper|
Mean ratio for Conc 1 and Conc 2 presented significant differences respect to the Con-trol and Natural (1-way ANOVA, DF: 14 P: < 0.002; Holm–Sidak method). Significanthigher ratios imply that the PFeSF in the 20–140 µm fractions increased its proportionrelative to the 2–20 µm.
3.5 Phytoplankton assemblages5
The total abundance of phytoplankton presented average higher values in the brackishsystems compare to the marine, being proportional to the NH+
4 concentration in bothcases i.e. Control and Natural presented the lowest values, while Conc 2 and Conc 3presented the highest (Fig. 8b and d). Abundance by main groups revealed initial highvalues (> 2×10⁶ cell mL−1) and dominance of nanoplankton in the brackish system,10
while diatoms and nanoplankton were both present in low numbers (3–7×10⁵ cell mL−1)in the marine system. A long time, for the brackish system it was observed a rapidlydecline of the nanoplankton, maintaining low abundance in all treatments (except forsome peaks), while in the marine system the nanoplankton remained low throughoutthe experiment in all treatments. On the contrary, diatoms in the treatments with NH+
415
addition grew steadily until the abrupt decline in both systems despite of the low initialvalues and the higher nanoplankton abundance in the brackish system (Fig. 8b and d).Concerning the diatom composition, no significant trend was found related to the watertype or for NH+
4 concentration. Both systems showed the dominance of chain-formingcentric diatoms as Chaetoceros spp. (medium and small sizes) and Guinardia deli-20
catula. By the middle of the experiment, medium size Chaetoceros spp. represented> 70 % in all treatments, both in the brackish and marine mesocosms.
13750

BGD11, 13739–13774, 2014
Effect of ammoniuminput over the
distribution of iron inthe seawater and the
phytoplankton
N. Sanchez et al.
Title Page
Abstract Introduction
Conclusions References
Tables Figures
J I
J I
Back Close
Full Screen / Esc
Printer-friendly Version
Interactive Discussion
Discussion
Paper
|D
iscussionP
aper|
Discussion
Paper
|D
iscussionP
aper|
4 Discussion
4.1 Iron variability in the mesocosms
The Fe distribution pattern appeared to be correlated to the POC and Chl a trendsobserved along the experiment. This implies a direct biological role on the changes indistribution of the different fractions of the element in the seawater (Fig. 7). TFeCh and5
DFeCh followed this pattern with opposite trends, particularly that of TFeCh exhibitinga remarkably similar trend to that followed by the POC. Given the observed decreas-ing concentration in DFeCh, the increase of TFeCh is presumed as a product of anincrease in the particulate iron, via physical-chemical changes and/or uptake by thebiota. A possible explanation could be that enhanced biological activity (e.g. release of10
organic ligands, exudates etc.) might have induced chemical changes in the speciationin a fraction of iron previously not available (e.g. complexed) to the chelex resin, form-ing newly dissolved iron (including colloids) that afterwards progressively transformedin time into TFeCh.
A relevant factor related to the observed results, was the high biomass production15
attained in the mesocosms. Compare to the natural productivity of the region (Iriarteet al., 2007, 2013; González et al., 2010, 2011), the concentrations of Chl a and POCobserved in the treatments, were higher (due to artificial nutrient addition) and thuscontributing to the formation of aggregate material at high rate (noticeable at simpleobservation). Possible results of this type of particle aggregation could have been20
enhanced adsorption of the dissolved form onto the aggregates and coagulation ofcolloids, therefore removing portion of the dissolved fraction and transforming it intoparticulate. Wong et al. (2006) in a mesoscale experiment reported a quick transfor-mation of the dissolved iron to particulate forms, with as much as 70 % of the addediron transformed in the non-dissolved form after less than 24 h. The trend described25
lower colloidal iron percentages as the experiment progressed while the particulatefractions increased. The mechanism alleged to be involved, could be a combination ofbiological uptake (Chen et al., 2003; Nodwell and Price, 2001) or simply adsorption of
13751
BGD11, 13739–13774, 2014
Effect of ammoniuminput over the
distribution of iron inthe seawater and the
phytoplankton
N. Sanchez et al.
Title Page
Abstract Introduction
Conclusions References
Tables Figures
J I
J I
Back Close
Full Screen / Esc
Printer-friendly Version
Interactive Discussion
Discussion
Paper
|D
iscussionP
aper|
Discussion
Paper
|D
iscussionP
aper|
dissolved (including colloidal) iron to the plankton cell surfaces as well as aggregationof oxyhydroxides (Wong et al., 2006). Accordingly, the decrease observed in TFeChtowards the end of the experiment, coupled to that of Chl a and POC, seems to pointto the settlement of the dying phytoplankton, and therefore suggesting that the PFeattached was eventually exported to the bottom of the mesocosm tanks.5
Among other factors that could account for the poor correlation between differentfractions of iron, mechanical artifact could be an important one. It is known that col-loids encompasses a size range from 1 to 1000 nm in diameter (Wells, 1998), lyingwithin the boundaries of the dissolved and particulate matter, consequently subjectedto possible bias via artificial manipulation. Moreover, colloid production rates could be10
enhanced by biological action, presumably through a combination of cell exudation andlysis, microbial degradation of particulate organic matter, sloppy feeding and excretionby zooplankton (Wells and Goldberg, 1994), all factors which were gradually increasedin the experiment by the NH+
4 input. The factors above combined, could have modu-lated the increase of TFeCh, and therefore the significant positive linear correlation with15
NH+4 input and TFeCh. The rather poor negative correlation for DFeCh and NH+
4 couldbe related to the mismatch between newly DFeCh made available and the uptake byphytoplankton, making an expected decreasing DFeCh trend less evident.
In the case of the FeDGT, the fact that the average concentration for all treatmentswas lower than that of DFeCh, would suggest that the chelex labile dissolved fraction,20
was probably not all readily bioavailable. Nevertheless, when looking at the trends intime between FeDGT and DFeCh, it was evident the high variation, exhibiting at somepoints opposite trends even with FeDGT values higher than the DFeCh (Fig. 7a and c).The average ratio between DFeCh and FeDGT, higher for the marine (1.44) comparedto the brackish (1.27), would suggest differences in the proportion of the bioavailable25
fraction between the systems. Yet, given such variability the latter could not prove sig-nificant, but rather to establish a gross pattern. Observing the trends in time, it canbe argued that the mechanism behind FeDGT high variability, might be the response toa dynamic system in which biological (release of organic ligands) and chemical (kinet-
13752
BGD11, 13739–13774, 2014
Effect of ammoniuminput over the
distribution of iron inthe seawater and the
phytoplankton
N. Sanchez et al.
Title Page
Abstract Introduction
Conclusions References
Tables Figures
J I
J I
Back Close
Full Screen / Esc
Printer-friendly Version
Interactive Discussion
Discussion
Paper
|D
iscussionP
aper|
Discussion
Paper
|D
iscussionP
aper|
ics and equilibrium) forcing determine changes in the iron speciation in short periodsof time. Nonetheless, despite all the variation in time, at the end of the experiment thesignificant lower FeDGT concentrations for all the treatments with NH+
4 compared to theNatural one, reflected the decrease of the bioavailable fraction of iron as consequenceof the increased uptake by the growing phytoplankton biomass.5
Further sources of variability affecting the results could be invoked. Although care-fully performed, the fieldwork carried out was not under 100 % ultra clean conditions,leaving room for possible contamination. Indeed, the high peaks obtained for bothTFeCh and DFeCh samples appeared to be clear sample artifact. Moreover, providedmethodological errors were ruled out, other source of high variation could have been10
the enclosed system and the conditions set up. Such case could be the NH+4 rate supply
(4.6 µmol L−1 d−1) applied in treatment Conc 3. A significant high concentration (Olsenet al., 2006) was applied to expect for possible toxic effects, in that way exposing theplankton community to drastic changes in short periods of time that would rather notoccurred in natural environment.15
4.2 Iron content in the planktonic community
Determination of the PFe and PFeSF, aimed to provide an estimation of the particulateiron relative to the particulate carbon pool in the system and hence within the planktoniccommunity revealed changes occurred in time of the concentration and distribution.The results, presumably reflects the effects of the NH+
4 input over the planktonic com-20
position in both systems. PFe standardized both by POC and Chl a, showed a negativeexponential relation with NH+
4 , for both the brackish and marine systems, while PFeSF(although not standardized due to lack of fractionated data for POC and Chl a) showedfor two treatments in the marine system a significant change of the ratio of the absoluteiron content between two fractions (micro and nano) of the plankton community. The25
observed differences for the brackish and marine systems, can be attributed to a greatextent to the biological features (different microbial assemblages) under constant physi-cal forcing (i.e. presence of permanent LSL) and other hydrographic parameters proper
13753
BGD11, 13739–13774, 2014
Effect of ammoniuminput over the
distribution of iron inthe seawater and the
phytoplankton
N. Sanchez et al.
Title Page
Abstract Introduction
Conclusions References
Tables Figures
J I
J I
Back Close
Full Screen / Esc
Printer-friendly Version
Interactive Discussion
Discussion
Paper
|D
iscussionP
aper|
Discussion
Paper
|D
iscussionP
aper|
of fjord ecosystems (Pickard, 1971). The LSL particularly affects the water column fea-tures, reducing light penetration, nutrient exchange and limiting wind-induced mixing,during period of strong water column stratification (Gibbs, 2001). The result is an en-vironmental partitioning, with an often less productive (primary productivity) brackishlayer based on nutrient recycling, dominated regularly by the nano-plankton size class,5
whereas below the halocline a marine layer with peak productivity (10–15 m) based onconstant nutrient input (deep nutrient-rich waters) and with micro-phytoplankton as thedominant component (Sánchez et al., 2011).
Base on the higher Fe µ/n ratio observed in the marine system, could be suggestedthat micro-phytoplankton (diatoms in particular), took advantage of the NH+
4 input at10
less energy expense, with a consequent probable lesser preference over nitrate. There-fore, a plankton community dominated by big diatoms could be expected to be resem-bled in the marine system. Yet this was the case, it was also evident that diatomsoutweighed in abundance and certainly biomass the nanoplankton fraction in both sys-tems. The evidence of successful growth of diatoms based on NH+
4 is substantial. The15
diatom Thalassiosira pseudonana was exhibited an 8 % increase in growth based onNH+
4 compared to NO−3 , under saturating light and Fe-replete conditions (Thompson
et al., 1989), while another study found higher growth rates for ammonium-grown cellsthan for nitrate-grown cells of several species under the same conditions (Levasseuret al., 1993). In the other hand, an oceanic diatom isolated from the subarctic Pacific20
was found to have no difference in the growth rates of nitrate- and ammonium-growncells under Fe-replete conditions (Muggli et al., 1996). It is worth noting that NO−
3 (notadded as nutrient), concentrations in the marine system showed a decreasing trendin the Control and Natural, while in the treatments with artificial addition NO−
3 concen-tration remained constant along the experiment (data not shown), thus supporting the25
idea of preferential ammonium uptake. Nevertheless, Price et al. (2005) found contrast-ing results when growing diatoms with NO−
3 and NH+4 under high and low Fe-mediums.
While the iron quota (Q) was higher for NO−3 under low Fe, at high Fe, was higher for
13754

BGD11, 13739–13774, 2014
Effect of ammoniuminput over the
distribution of iron inthe seawater and the
phytoplankton
N. Sanchez et al.
Title Page
Abstract Introduction
Conclusions References
Tables Figures
J I
J I
Back Close
Full Screen / Esc
Printer-friendly Version
Interactive Discussion
Discussion
Paper
|D
iscussionP
aper|
Discussion
Paper
|D
iscussionP
aper|
NH+4 grown cells. Main reasons pointed out referenced that the growth conditions and
species differences may be responsible for the contrasting results.As the Fe µ/n ratio here discussed, the Fe : C ratio is determined mainly by the dif-
ferences in the community species composition and its physiological state. Contrast torelatively constant Redfield ratios of C : N : P, the cellular Fe : C ratios vary markedly5
(by a factor of 30) as a function of the iron available (Bruland et al., 2001). Hence, mostof the data available on estimation of trace element quotas come from laboratory cul-tures (e.g. Sunda and Huntsman, 1995), with still few data from natural environments(Cullen and Sherrell, 1999). In such a way, in the scenario with the natural communitystudied here, it could be expected a high variability but with a tendency to reducing iron10
uptake, due to the conditions of NH+4 excess supply and diatoms dominance (Sunda
and Huntsman, 1995). Accordingly, the POC based Fe : C ratio obtained per treatmenton both systems, followed a rather decreasing trend on time with increasing NH+
4 con-centration (Fig. 8b and d). Yet, it is observed a more pronounced reduction for thebrackish mesocosms despite that initial Control and Natural values were higher com-15
pared to marine ones. Given the dominance of diatoms in both systems, it could beargued these would reflect species-specific differences (e.g. diatom species with differ-ent Fe requirements). Nevertheless, the diatom composition found (at the genus level)in both systems did not differ significantly to account for the different slopes observedin Fe : C in time.20
On the other hand, looking on the composition within the nanoplankton size fractionit is observed that nanoflagellates made up in average double (5 % versus 10 %) ofthe total abundance in the brackish system compare to the marine. Pico- and nano-plankton with higher surface to volume ratios and a more efficient uptake at low nutrientconcentrations (Chisholm, 1992; Price et al., 1994), thrive in environments were the25
main source of nitrogen is recycled like NH+4 , hence having lower Fe requirements.
Conversely, diatoms in general have a higher requirement on iron to satisfy certainmetabolic demands (Bruland et al., 2001), even more so for coastal assemblages sincehave been shown to have an order-of-magnitude higher iron requirement (on a Fe : C
13755
BGD11, 13739–13774, 2014
Effect of ammoniuminput over the
distribution of iron inthe seawater and the
phytoplankton
N. Sanchez et al.
Title Page
Abstract Introduction
Conclusions References
Tables Figures
J I
J I
Back Close
Full Screen / Esc
Printer-friendly Version
Interactive Discussion
Discussion
Paper
|D
iscussionP
aper|
Discussion
Paper
|D
iscussionP
aper|
basis) than oceanic species (Sunda and Huntsman, 1995). For this reason, could beargued that nanoflagellates by having a higher contribution to the carbon pool to thebrackish system, would have a consequently decrease in the iron to carbon proportion(Schmidt and Hutchins, 1999; Sunda and Huntsman, 1997), whereas diatoms (highercontribution in the marine system), needing to meet minimum Fe requirements, could5
account for the rather smoothly decrease in Fe : C ratio observed in the marine system.Despite the reduction on Fe : C ratio, estimated ratios as a proxy for the Fe content of
plankton community in Comau fjord during the experiment covered a broad range (265up to 4224 µmol mol−1). Medians values (more representative here) were between 419to 1430 and 753 to 1765 µmol mol−1 for the brackish and marine mesocosms respec-10
tively, situating these values above to what is reported on the literature for phytoplank-ton (2.3 to 370 µmol mol−1) (Sunda and Huntsman, 1995; Ho et al., 2003; Sarthou et al.,2005). Values reported here account for the potential total cellular iron, not distinguish-ing between external and intracellular iron content. Reported values range from 63 to90 % of intracellular iron of total cellular iron under Fe limiting conditions for different15
cell diameter and phytoplankton class species (Sunda and Huntsman, 1995). More-over, the study reports intracellular max concentrations of 1700 µmol mol−1 for diatomspecies at high Fe conditions, 30 times higher than needed to support maximum growthrate. Therefore, the values reported here could be reduced by at least 20 %. For furthercomparisons, a range of carbon to chlorophyll ratios from literature and the Fe : Chl20
found here, to estimate Fe : C by other means (Table 4). Values obtained were higherthan the POC based Fe : C yet, the trend was consistent, thus seeing a decrease inthe Fe : C at higher NH+
4 .When addressing the iron to carbon ratio, it was considered that Chl a only account
for the autotrophic component of the plankton community (i.e. diatoms, autotrophic25
dinoflagellates and autotrophic nanoflagellates), whereas POC render the completeamount of organic carbon in the whole community (i.e. including bacteria and protists).Likewise, POC measurements include all organic carbon whether of autochthonousor allochthonous origins, which might be of particular relevance in fjords ecosystem
13756

BGD11, 13739–13774, 2014
Effect of ammoniuminput over the
distribution of iron inthe seawater and the
phytoplankton
N. Sanchez et al.
Title Page
Abstract Introduction
Conclusions References
Tables Figures
J I
J I
Back Close
Full Screen / Esc
Printer-friendly Version
Interactive Discussion
Discussion
Paper
|D
iscussionP
aper|
Discussion
Paper
|D
iscussionP
aper|
subjected to constant input of terrigenous origin (Syvitski et al., 1987; Vargas et al.,2011). Northern Patagonia fjords, where the Comau fjord is located, are not influencedby glaciers and thus have significantly lower loads of fine inorganic sediments thanmost fjords further south (Pickard, 1971), for which the input of marine-derived organiccarbon on surface sediments varied widely and accounted for 13–96 % (average 61 %)5
(Sepúlveda et al., 2011). Yet, a study for Comau fjord reports allochthonous contribu-tions to the sediments of 23.6 to 89.9 % at depths of 35 and 475 m respectively (Silvaet al., 2011). In this sense, it is important to highlight that this high variability couldhave a significant effect on the composition of the water collected for the experiments,in particular the brackish system. The pycnocline formed by fresh water input act as10
barrier, therefore retarding the water mixing, with the probable consequence of tempo-rary accumulation of organic carbon of allochthonous origin in the first meters of watercolumn. As observed in the initial POC content, the brackish water showed a three-folddifference (263.9±23.3 mg m−3) compare to the marine (70.1±11.8 mg m−3) meso-cosm, hence increasing the carbon to iron ratio and simulating a lower Fe : C in the15
plankton community for the brackish mesocosms. Regardless the above, and giventhat both Chl and POC related to the iron showing same trend (exponential decrease),the POC based Fe : C ratio estimation was still considered a reliable approach.
5 Summary
The addition of NH+4 in our experimental set up showed that there was an effect on the20
distribution of the different forms of iron measured in the seawater as well as in theparticulate matter representing the content of iron in the plankton community.
The response for both type of water was different in magnitude; the effect depend-ing on the iron form measured and was correlated either positively or negatively withincreased NH+
4 concentration, as seen from the TFeCh and DFeCh correlation in the25
brackish water. The physical-chemical changes observed in Fe measured in the seawater, suggest that apart from dissolvable Fe, TFe (non-filtered) is related to the bio-
13757

BGD11, 13739–13774, 2014
Effect of ammoniuminput over the
distribution of iron inthe seawater and the
phytoplankton
N. Sanchez et al.
Title Page
Abstract Introduction
Conclusions References
Tables Figures
J I
J I
Back Close
Full Screen / Esc
Printer-friendly Version
Interactive Discussion
Discussion
Paper
|D
iscussionP
aper|
Discussion
Paper
|D
iscussionP
aper|
logical uptake, and that under certain conditions should not be neglected as potentialbioavailable source of Fe.
In presence of excess nutrients was observed dominance of microphytoplankton anddecrease in Fe : C in both water types. However, the fact that Fe µ/n and Fe : C ratios,species composition and parameters like Chl a and POC were considerably different,5
highlights the key role of the microbial assemblage within each type of water and there-fore in the natural environment. Determining Q of certain key species is important toinfer over the physiological state, adaptation to environment or possible growth limita-tion in phytoplankton and therefore useful to understand possible ecosystem changes(e.g. a phytoplankton community with a low Fe : C but rather high Chl a yield, as seeing10
here, could result in higher efficiency in carbon export).Likewise microcosm essays, these results are product of enclosed manipulated sys-
tems and therefore interpretations must take this into account. Natural systems arecomplex and this could be seeing from the differences observed in the brackish andmarine systems. Consequently, to better understand the impact that anthropogenic in-15
fluence (e.g. increase input of NH+4 via salmon aquaculture) can cause over the cycling
of iron and presumably in a similar way to the biogeochemical cycling of major elements(C, N, and P) in the pelagic ecosystem such as in the fjords of Chile, more emphasisneeds to be allocated to study the links between macro and micro-nutrients cycles andhe role of the marine biota within.20
Acknowledgements. This work was part of the project “CAN WASTE EMISSION FROM FISHFARMS CHANGE THE STRUCTURE OF MARINE FOOD WEBS (WAFOW)? – A comparativestudy of coastal ecosystems in Norway and Chile (project 193661), and the project “A Cross-disciplinary Integrated Eco-systemic Eutrophication Research and Management Approach –CINTERA” (project 216607), both funded by NTNU – Norwegian Research Council. This work25
was partially supported by CONICYT of the Chilean government, through the FONDECYTresearch project (1110614).
We would like to thank the scientists and staff of the Fundacion San Ignacio del Huinayscience station for their valuable support and the logistics provided during sampling. We also
13758
BGD11, 13739–13774, 2014
Effect of ammoniuminput over the
distribution of iron inthe seawater and the
phytoplankton
N. Sanchez et al.
Title Page
Abstract Introduction
Conclusions References
Tables Figures
J I
J I
Back Close
Full Screen / Esc
Printer-friendly Version
Interactive Discussion
Discussion
Paper
|D
iscussionP
aper|
Discussion
Paper
|D
iscussionP
aper|
greatly appreciate the comments of the anonymous reviewer, who help us to considerably im-prove the manuscript. This is publication 116 of the Huinay Scientific Field Station.
References
Ardelan, M. V., Steinnes, E., Lierhagen, S., and Linde, S. O.: Effects of experimental CO2leakage on solubility and transport of seven trace metals in seawater and sediment, Sci.5
Total Environ., 407, 6255–6266, doi:10.1016/j.scitotenv.2009.09.004, 2009.Ardelan, M. V., Holm-Hansen, O., Hewes, C. D., Reiss, C. S., Silva, N. S., Dulaiova, H.,
Steinnes, E., and Sakshaug, E.: Natural iron enrichment around the Antarctic Peninsula inthe Southern Ocean, Biogeosciences, 7, 11–25, doi:10.5194/bg-7-11-2010, 2010.
Arrigo, K. R.: Marine microorganisms and global nutrient cycles, Nature, 437, 349–355,10
doi:10.1038/nature04159, 2005.Bruland, K. W., Rue, E. L., and Smith, G. J.: Iron and macronutrients in California coastal
upwelling regimes: implications for diatom blooms, Limnol. Oceanogr., 46, 1661–1674, 2001.Chen, M., Dei, R. C. H., Wang, W. X., and Guo, L.: Marine diatom uptake of iron bound with
natural colloids of different origins, Mar. Chem., 81, 177–189, 2003.15
Chisholm, S. W.: Phytoplankton Size, Primary Productivity and Biogeochemical Cycles in theSea, Plenum, 213–237, 1992.
Cloern, J. E.: Our evolving conceptual model of the coastal eutrophication problem, Mar. Ecol.-Prog. Ser., 210, 223–253, 2001.
Cullen, J. T. and Sherrell, R. M.: Techniques for determination of trace metals in small sam-20
ples of size-fractionated particulate matter: phytoplankton metals off central California, Mar.Chem., 67, 233–247, 1999.
Field, C. B., Behrenfeld, M. J., Randerson, J. T., and Falkowski, P.: Primary production of thebiosphere: integrating terrestrial and oceanic components, Science, 281, 237–240, 1998.
Gibbs, M. T.: Aspects of the structure and variability of the low-salinity-layer in25
Doubtful Sound, a New Zealand fiord, New Zeal. J. Mar. Fresh., 35, 59–72,doi:10.1080/00288330.2001.9516978, 2001.
González, H. E., Calderón, M., Castro, L., Clément, A., Cuevas, L., Daneri, G., Iriarte, J., Lizár-raga, L., Martínez, R., and Menschel, E.: Primary production and plankton dynamics in the
13759

BGD11, 13739–13774, 2014
Effect of ammoniuminput over the
distribution of iron inthe seawater and the
phytoplankton
N. Sanchez et al.
Title Page
Abstract Introduction
Conclusions References
Tables Figures
J I
J I
Back Close
Full Screen / Esc
Printer-friendly Version
Interactive Discussion
Discussion
Paper
|D
iscussionP
aper|
Discussion
Paper
|D
iscussionP
aper|
Reloncaví Fjord and the Interior Sea of Chiloé, Northern Patagonia, Chile, Mar. Ecol.-Prog.Ser., 402, 13–30, 2010.
González, H. E., Castro, L., Daneri, G., Iriarte, J., Silva, N., Vargas, C., Giesecke, R., andSánchez, N.: Seasonal plankton variability in Chilean Patagonia fjords: carbon flow throughthe pelagic food web of Aysen Fjord and plankton dynamics in the Moraleda Channel basin,5
Cont. Shelf Res., 31, 225–243, 2011.Ho, T. Y., Quigg, A., Finkel, Z. V., Milligan, A. J., Wyman, K., Falkowski, P. G., and
Morel, F. M. M.: The elemental composition of some marine phytoplankton, J. Phycol., 39,1145–1159, 2003.
Iriarte, J. L., González, H., Liu, K., Rivas, C., and Valenzuela, C.: Spatial and temporal variabil-10
ity of chlorophyll and primary productivity in surface waters of southern Chile (41.5–43 S),Estuar. Coast. Shelf S., 74, 471–480, 2007.
Iriarte, J. L., Pantoja, S., González, H., Silva, G., Paves, H., Labbé, P., Rebolledo, L., Arde-lan, M., and Häussermann, V.: Assessing the micro-phytoplankton response to nitrate inComau Fjord (42◦ S) in Patagonia (Chile), using a microcosms approach, Environ. Monit.15
Assess., 185, 5055–5070, doi:10.1007/s10661-012-2925-1, 2013.Levasseur, M., Thompson, P. A., and Harrison, P. J.: Physiological acclimation of marine phyto-
plankton to different nitrogen source, J. Phycol., 29, 587–595, 1993.Martin, J. H.: Iron, Liebig’s law, and the greenhouse, Oceanography, 4, 52–55, 1991.Martin, J. H., Gordon, M. R., and Fitzwater, S.: The case for iron, Limnol. Oceanogr., 36, 1793–20
1802, 1991.Morel, F. M. M. and Price, N.: The biogeochemical cycles of trace metals in the oceans, Science,
300, 944–947, 2003.Morel, F. M. M., Rueter, J., and Price, N.: Iron nutrition of phytoplankton and its possible impor-
tance in the ecology of ocean regions with high nutrient and low biomass, Oceanography, 4,25
56–61, 1991.Muggli, D. L., Lecourt, M., and Harrison, P.: Effects of iron and nitrogen source on the sinking
rate, physiology and metal composition of an oceanic diatom from the subarctic Pacific, Mar.Ecol.-Prog. Ser., 132, 215–227, 1996.
Nodwell, L. M. and Price, N. M.: Direct use of inorganic colloidal iron by marine mixotrophic30
phytoplankton, Limnol. Oceanogr., 46, 765–777, 2001.
13760

BGD11, 13739–13774, 2014
Effect of ammoniuminput over the
distribution of iron inthe seawater and the
phytoplankton
N. Sanchez et al.
Title Page
Abstract Introduction
Conclusions References
Tables Figures
J I
J I
Back Close
Full Screen / Esc
Printer-friendly Version
Interactive Discussion
Discussion
Paper
|D
iscussionP
aper|
Discussion
Paper
|D
iscussionP
aper|
Öztürk, M., Steinnes, E., and Sakshaug, E.: Iron speciation in the Trondheim Fjord fromthe perspective of iron limitation for phytoplankton, Estuar. Coast. Shelf S., 55, 197–212,doi:10.1006/ecss.2001.0897, 2002.
Olsen, Y., Agustí, S., Andersen, T., Duarte, C. M., Gasol, J. M., Gismervik, I., Heiskanen, A. S.,Hoell, E., Kuuppo, P., and Lignell, R.: A comparative study of responses in planktonic food5
web structure and function in contrasting European coastal waters exposed to experimentalnutrient addition, Limnol. Oceanogr., 51, 488–503, 2006.
Pickard, G.: Some physical oceanographic features of inlets of Chile, J. Fish. Res. Board Can.,28, 1077–1106, 1971.
Price, N. M., Ahner, B., and Morel, F.: The equatorial Pacific Ocean: grazer-controlled phyto-10
plankton populations in an iron-limited ecosystem, Limnol. Oceanogr., 39, 520–534, 1994.Sánchez, N., González, H. E., and Iriarte, J. L.: Trophic interactions of pelagic crustaceans in
Comau Fjord (Chile): their role in the food web structure, J. Plankton Res., 33, 1212–1229,doi:10.1093/plankt/fbr022, 2011.
Sarthou, G., Timmermans, K. R., Blain, S., and Tréguer, P.: Growth physiology and fate of15
diatoms in the ocean: a review, J. Sea Res., 53, 25–42, 2005.Schmidt, M. and Hutchins, D.: Size-fractionated biological iron and carbon uptake along
a coastal to offshore transect in the NE Pacific, Deep-Sea Res. Pt. II, 46, 2487–2503, 1999.Sepúlveda, J., Pantoja, S., and Hughen, K. A.: Sources and distribution of organic matter in
northern Patagonia fjords, Chile (∼ 44–47◦ S): a multi-tracer approach for carbon cycling20
assessment, Cont. Shelf Res., 31, 315–329, 2011.Silva, N., Vargas, C. A., and Prego, R.: Land–ocean distribution of allochthonous organic matter
in surface sediments of the Chiloé and Aysén interior seas (Chilean Northern Patagonia),Cont. Shelf Res., 31, 330–339, 2011.
Sunda, W. G. and Huntsman, S. A.: Iron uptake and growth limitation in oceanic and coastal25
phytoplankton, Mar. Chem., 50, 189–206, doi:10.1016/0304-4203(95)00035-p, 1995.Sunda, W. G. and Huntsman, S. A.: Interrelated influence of iron, light and cell size on marine
phytoplankton growth, Nature, 390, 389–392, 1997.Syvitski, J. P., Burrell, D. C., and Skei, J. M.: Fjords: Processes and Products, 1987.Thompson, P. A., Levasseur, M. E., and Harrison, P. J.: Light-limited growth on ammonium vs.30
nitrate: what is the advantage for marine phytoplankton?, Limnol. Oceanogr., 34, 1014–1024,1989.
13761

BGD11, 13739–13774, 2014
Effect of ammoniuminput over the
distribution of iron inthe seawater and the
phytoplankton
N. Sanchez et al.
Title Page
Abstract Introduction
Conclusions References
Tables Figures
J I
J I
Back Close
Full Screen / Esc
Printer-friendly Version
Interactive Discussion
Discussion
Paper
|D
iscussionP
aper|
Discussion
Paper
|D
iscussionP
aper|
Vargas, C. A., Martinez, R. A., San Martin, V., Aguayo, M., Silva, N., and Torres, R.: Al-lochthonous subsidies of organic matter across a lake-river-fjord landscape in the ChileanPatagonia: implications for marine zooplankton in inner fjord areas, Cont. Shelf Res., 31,187–201, 2011.
Wang, W. X., Dei, R. C. H., and Xu, Y.: Cadmium uptake and trophic transfer in coastal plankton5
under contrasting nitrogen regimes, Mar. Ecol.-Prog. Ser., 211, 293–298, 2001.Wells, M. L.: Marine colloids: a neglected dimension, Nature, 391, 530–531, 1998.Wells, M. L. and Goldberg, E. D.: The distribution of colloids in the North Atlantic and Southern
Oceans, Limnol. Oceanogr., 39, 286–302, 1994.Wong, C. S., Johnson, W. K., Sutherland, N., Nishioka, J., Timothy, D. A., Robert, M.,10
and Takeda, S.: Iron speciation and dynamics during SERIES, a mesoscale ironenrichment experiment in the NE Pacific, Deep-Sea Res. Pt. II, 53, 2075–2094,doi:10.1016/j.dsr2.2006.05.037, 2006.
Zehr, J. P. and Ward, B. B.: Nitrogen cycling in the ocean: new perspectives on processes andparadigms, Appl. Environ. Microb., 68, 1015–1024, 2002.15
Zhang, H. and Davison, W.: Performance characteristics of diffusion gradients in thin films forthe in situ measurement of trace metals in aqueous solution, Anal. Chem., 67, 3391–3400,1995.
13762

BGD11, 13739–13774, 2014
Effect of ammoniuminput over the
distribution of iron inthe seawater and the
phytoplankton
N. Sanchez et al.
Title Page
Abstract Introduction
Conclusions References
Tables Figures
J I
J I
Back Close
Full Screen / Esc
Printer-friendly Version
Interactive Discussion
Discussion
Paper
|D
iscussionP
aper|
Discussion
Paper
|D
iscussionP
aper|
Table 1. Rate supply (µmol m−3 d−1) and ratio for the different macronutrients added as NH4Clfor Nitrogen (N), NaH2PO4 ·H2O for Phosphorus (P) and Na2SiO3 ·9H2O for Silicon (Si) inthe different treatments for the brackish (6–10) and marine systems (1–5), in the mesocosmexperiment. Control units had no nutrient addition.
Treatment Mesocosm N P Si N : P N : Si
Control 1–6 – – – – –Natural 2–7 296.0 19.4 146.8 15.3 2Conc 1 3–8 1199.7 49.7 594.7 24.2 2Conc 2 4–9 2991.3 123.8 1483.0 24.2 2Conc 3 5–10 4674.0 193.5 2317.2 24.2 2
13763

BGD11, 13739–13774, 2014
Effect of ammoniuminput over the
distribution of iron inthe seawater and the
phytoplankton
N. Sanchez et al.
Title Page
Abstract Introduction
Conclusions References
Tables Figures
J I
J I
Back Close
Full Screen / Esc
Printer-friendly Version
Interactive Discussion
Discussion
Paper
|D
iscussionP
aper|
Discussion
Paper
|D
iscussionP
aper|
Table 2. Concentration (nmol L−1) relative standard deviation (RSD %), for the blanks analyzedin HR-ICP-MS for the chelex, DGT and fractionation samples in the mesocosm experimentFilter: filter pore size. Std: standard deviation. C. Int 95 %: confidence interval 95 %. C. Int.95 % (%): confidence interval 95 % percentage.
Technique Chelex DGT FractionationReplicate nmol L−1 RSD nmol L−1 RSD nmol L−1 RSD Filter
1 0.02 0.01 0.04 0.05 0.02 0.15 0.82 0.01 0.10 0.02 0.08 0.01 0.06 0.83 0.02 0.01 0.02 0.03 0.02 0.14 0.84 0.03 0.09 0.03 0.05 0.01 0.02 25 0.04 0.05 0.03 0.08 0.02 0.12 26 0.04 0.08 0.01 0.01 27 0.03 0.05 0.01 0.03 108 0.03 0.09 0.02 0.01 109 0.01 0.08 10
Average 0.02 0.05 0.03 0.06 0.02 0.07Std 0.01 0.04 0.01 0.02 0.00 0.06Rsd (%) 39.07 80.89 23.79 34.52 30.86 80.44C. Int. 95 % 0.01 0.04 0.01 0.02 0.00 0.04C. Int. 95 % (%) 39.07 17.98 21.82Number 5 5 8 8 9 9
13764
BGD11, 13739–13774, 2014
Effect of ammoniuminput over the
distribution of iron inthe seawater and the
phytoplankton
N. Sanchez et al.
Title Page
Abstract Introduction
Conclusions References
Tables Figures
J I
J I
Back Close
Full Screen / Esc
Printer-friendly Version
Interactive Discussion
Discussion
Paper
|D
iscussionP
aper|
Discussion
Paper
|D
iscussionP
aper|
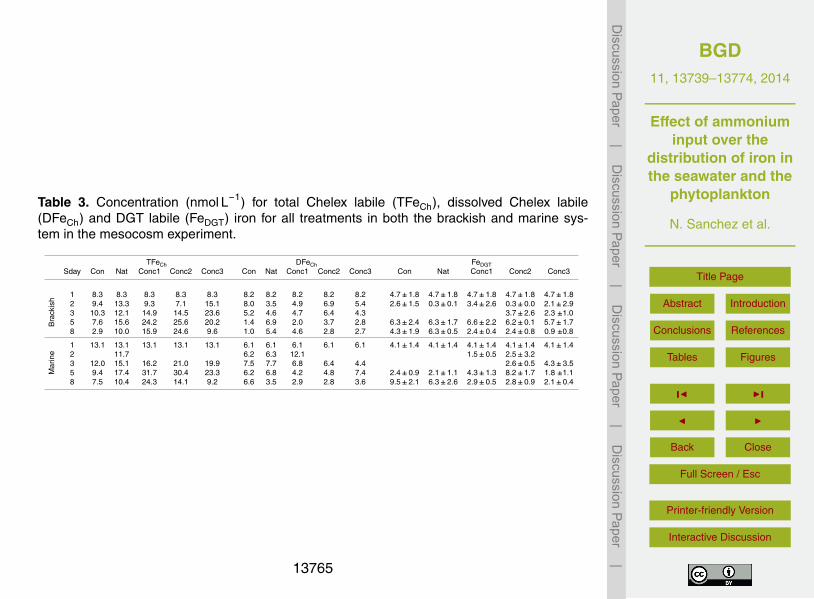
Table 3. Concentration (nmol L−1) for total Chelex labile (TFeCh), dissolved Chelex labile(DFeCh) and DGT labile (FeDGT) iron for all treatments in both the brackish and marine sys-tem in the mesocosm experiment.
TFeCh DFeCh FeDGTSday Con Nat Conc1 Conc2 Conc3 Con Nat Conc1 Conc2 Conc3 Con Nat Conc1 Conc2 Conc3
Bra
ckis
h
1 8.3 8.3 8.3 8.3 8.3 8.2 8.2 8.2 8.2 8.2 4.7±1.8 4.7±1.8 4.7±1.8 4.7±1.8 4.7±1.82 9.4 13.3 9.3 7.1 15.1 8.0 3.5 4.9 6.9 5.4 2.6±1.5 0.3±0.1 3.4±2.6 0.3±0.0 2.1±2.93 10.3 12.1 14.9 14.5 23.6 5.2 4.6 4.7 6.4 4.3 3.7±2.6 2.3 ±1.05 7.6 15.6 24.2 25.6 20.2 1.4 6.9 2.0 3.7 2.8 6.3±2.4 6.3±1.7 6.6±2.2 6.2±0.1 5.7±1.78 2.9 10.0 15.9 24.6 9.6 1.0 5.4 4.6 2.8 2.7 4.3±1.9 6.3±0.5 2.4±0.4 2.4±0.8 0.9 ±0.8
Mar
ine
1 13.1 13.1 13.1 13.1 13.1 6.1 6.1 6.1 6.1 6.1 4.1±1.4 4.1±1.4 4.1±1.4 4.1±1.4 4.1±1.42 11.7 6.2 6.3 12.1 1.5±0.5 2.5±3.23 12.0 15.1 16.2 21.0 19.9 7.5 7.7 6.8 6.4 4.4 2.6±0.5 4.3±3.55 9.4 17.4 31.7 30.4 23.3 6.2 6.8 4.2 4.8 7.4 2.4±0.9 2.1±1.1 4.3±1.3 8.2±1.7 1.8 ±1.18 7.5 10.4 24.3 14.1 9.2 6.6 3.5 2.9 2.8 3.6 9.5±2.1 6.3±2.6 2.9±0.5 2.8±0.9 2.1±0.4
13765

BGD11, 13739–13774, 2014
Effect of ammoniuminput over the
distribution of iron inthe seawater and the
phytoplankton
N. Sanchez et al.
Title Page
Abstract Introduction
Conclusions References
Tables Figures
J I
J I
Back Close
Full Screen / Esc
Printer-friendly Version
Interactive Discussion
Discussion
Paper
|D
iscussionP
aper|
Discussion
Paper
|D
iscussionP
aper|
Table 4. Chlorophyll to carbon ratio (Chl : C) (mol mmol−1) and iron to carbon ratio (Fe : C)(µmol mol−1) for a range of values for T. pseudomona (Sunda and Huntsmann, 1995). Fe : C(µmol mol−1) based on Fe : Chl (µmol mmol−1) and Chl : C from literature, for all the treatmentsin both the brackish and marine system in the mesocosm experiment.
Reference Control Natural Conc 1 Conc 2 Conc 3Chl : C Fe : C Fe : Chl Fe : C Fe : Chl Fe : C Fe : Chl Fe : C Fe : Chl Fe : C Fe : Chl Fe : C
0.127 12.5 Brackish 59968.7 7616.0 121318.2 15407.4 24971.3 3171.4 28578.5 3629.5 9552.5 1213.20.258 1770.0 15471.9 31300.1 6442.6 7373.2 2464.6
Marine 53320.7 6771.7 43888.3 5573.8 62126.1 7890.0 47562.2 6040.4 13315.0 1691.013756.7 11323.2 16028.5 12271.0 3435.3
13766

BGD11, 13739–13774, 2014
Effect of ammoniuminput over the
distribution of iron inthe seawater and the
phytoplankton
N. Sanchez et al.
Title Page
Abstract Introduction
Conclusions References
Tables Figures
J I
J I
Back Close
Full Screen / Esc
Printer-friendly Version
Interactive Discussion
Discussion
Paper
|D
iscussionP
aper|
Discussion
Paper
|D
iscussionP
aper|
Figure 1. Study area, sampling site (Huinay Stn) and deployment of the brackish and ma-rine systems for the mesocosm experiment in the Comau Fjord, Chile during January–February 2011.
13767
BGD11, 13739–13774, 2014
Effect of ammoniuminput over the
distribution of iron inthe seawater and the
phytoplankton
N. Sanchez et al.
Title Page
Abstract Introduction
Conclusions References
Tables Figures
J I
J I
Back Close
Full Screen / Esc
Printer-friendly Version
Interactive Discussion
Discussion
Paper
|D
iscussionP
aper|
Discussion
Paper
|D
iscussionP
aper|
Figure 2. Total Chelex labile iron (TFeCh) (a, b), dissolved Chelex labile iron (DFeCh) (c, d)and DGT labile iron (FeDGT) (e, f) (nmol L−1), in the brackish (left) and marine (right) systemsfor all treatments in the mesocosm experiment. Gap between points: missing data. Error bars:standard deviation (n = 3).
13768

BGD11, 13739–13774, 2014
Effect of ammoniuminput over the
distribution of iron inthe seawater and the
phytoplankton
N. Sanchez et al.
Title Page
Abstract Introduction
Conclusions References
Tables Figures
J I
J I
Back Close
Full Screen / Esc
Printer-friendly Version
Interactive Discussion
Discussion
Paper
|D
iscussionP
aper|
Discussion
Paper
|D
iscussionP
aper|
Figure 3. Relation between (a) TFeCh (nmol L−1) vs. DFeCh (nmol L−1) for both systems (Conc 1,Conc 2, Conc3), TFeCh and DFeCh vs. NH+
4 loading in the (b) brackish and (c) marine systemsfor all treatments in the mesocosm experiment. Error bars: standard deviation (n = 5).
13769

BGD11, 13739–13774, 2014
Effect of ammoniuminput over the
distribution of iron inthe seawater and the
phytoplankton
N. Sanchez et al.
Title Page
Abstract Introduction
Conclusions References
Tables Figures
J I
J I
Back Close
Full Screen / Esc
Printer-friendly Version
Interactive Discussion
Discussion
Paper
|D
iscussionP
aper|
Discussion
Paper
|D
iscussionP
aper|
Figure 4. Distribution of (a) PFe (nmol L−1), standardized by (b) chlorophyll a (Chl a)(nmol ugr−1) (PFe : Chl a) and (c) particulate organic carbon (POC) (nmol ugr−1) (PFe : POC),for all treatments along time in the brackish and marine systems in the mesocosm experiment.
13770

BGD11, 13739–13774, 2014
Effect of ammoniuminput over the
distribution of iron inthe seawater and the
phytoplankton
N. Sanchez et al.
Title Page
Abstract Introduction
Conclusions References
Tables Figures
J I
J I
Back Close
Full Screen / Esc
Printer-friendly Version
Interactive Discussion
Discussion
Paper
|D
iscussionP
aper|
Discussion
Paper
|D
iscussionP
aper|
Figure 5. PFe standardized by Chlorophyll a (Chl a) (nmol µg−1) and by particulate organiccarbon (POC) vs. chlorophyll (ugr L−1) and particulate organic carbon (ugr L−1) concentrationin the (a, b) brackish and (c, d) marine systems, for treatments with artificial nutrient addition(Conc 1, Conc 2 and Conc 3) in the mesocosms experiment.
13771
BGD11, 13739–13774, 2014
Effect of ammoniuminput over the
distribution of iron inthe seawater and the
phytoplankton
N. Sanchez et al.
Title Page
Abstract Introduction
Conclusions References
Tables Figures
J I
J I
Back Close
Full Screen / Esc
Printer-friendly Version
Interactive Discussion
Discussion
Paper
|D
iscussionP
aper|
Discussion
Paper
|D
iscussionP
aper|
Figure 6. Distribution of the PFeSF (nmol L−1), in the plankton community, contained within thedifferent size classes (µm) in the (a) brackish and (b) marine systems for all treatments alongtime in the mesocosm experiment.
13772

BGD11, 13739–13774, 2014
Effect of ammoniuminput over the
distribution of iron inthe seawater and the
phytoplankton
N. Sanchez et al.
Title Page
Abstract Introduction
Conclusions References
Tables Figures
J I
J I
Back Close
Full Screen / Esc
Printer-friendly Version
Interactive Discussion
Discussion
Paper
|D
iscussionP
aper|
Discussion
Paper
|D
iscussionP
aper|
Figure 7. Total Chelex labile iron (TFeCh), dissolved Chelex labile iron (DFeCh), DGT labile iron(FeDGT) (nmol L−1), Chlorophyll (Chl a) (mg m−3) (right axis) and Particulate Organic Carbon(POC) (mg m−3) (left axis) concentrations in the (a, b) brackish and (c, d) marine systems forall treatments in the mesocosm experiment. Isolated points: contamination outliers. Dash line:missing data. Error bars: standard deviation (n = 3).
13773

BGD11, 13739–13774, 2014
Effect of ammoniuminput over the
distribution of iron inthe seawater and the
phytoplankton
N. Sanchez et al.
Title Page
Abstract Introduction
Conclusions References
Tables Figures
J I
J I
Back Close
Full Screen / Esc
Printer-friendly Version
Interactive Discussion
Discussion
Paper
|D
iscussionP
aper|
Discussion
Paper
|D
iscussionP
aper|
Figure 8. Distribution of PFeSF (nmol L−1) in three fractions (2–10 µm, 10–20 µm and 20–140 µm) of the plankton community (left axis), ratio between PFeSF in the 20–140 µmand 2–10+10–20 µm (encompassing the microplankton and nanoplankton fractions respec-tively) (right axis), abundance (cell L−1) of total phytoplankton, diatoms (microplankton) andnanoplankton and Iron to Carbon ratio (Fe : C) (µmol mol−1) (right axis) in the (a, b) brackishand (c, d) marine systems for all treatments along time in the mesocosms experiment. Errorbars: standard deviation (n = 3).
13774