Embed Size (px)
Citation preview

Effect of Agricultural Extension Program on
Smallholders’ Farm Productivity, Efficiency and
Women Farmers’ Empowerment: A Case Study in
North West Ethiopia
(小規模農場の生産性・効率性および女性農業者の能力向上に対する農業普
及プログラムの効果―エチオピア北西部における事例研究―)
ASRES ELIAS BAYSA
The United Graduate School of Agricultural Sciences
Tottori University, Japan
March 2015

Effect of Agricultural Extension Program on Smallholders’ Farm
Productivity, Efficiency and Women Farmers’ Empowerment: A
Case Study in North West Ethiopia
By
Asres Elias Baysa
A Dissertation Submitted to the United Graduate School of Agricultural Sciences
Tottori University, Japan
In partial fulfillment of the requirements for the degree of
DOCTOR OF PHILOSOPHY IN MANAGERIAL ECONOMICS
Supervisors:
Professor Dr. Makoto NOHMI
Professor Dr. Kumi YASUNOBU
Associate Professor Dr. Norikazu INOUE (October 2014 - March 2015)
Associate Professor Dr. Akira ISHIDA (April 2012 - September 2014)
March 2015

iii
Acknowledgements
I am indebted to many people who have been an integral part of my research and supportive
throughout my graduate studies.
First and foremost, I would like to thank Almighty GOD for the patience and perseverance that
he has been bestowed upon me during my study, and indeed, throughout my life.
I wish to express my sincere gratitude to the Ministry of Education, Culture, Sports, Science and
Technology of the Government of Japan for offering me the Japanese government scholarship
(monbukagakusho) to pursue higher studies in Japan. My deepest gratitude goes to my
supervisors: Prof. Makoto Nohmi, Prof. Kumi Yasunobu and Prof. Akira Ishida who greatly
contributed to this study. I am thankful for all their insights, constructive comments and
suggestions to produce this research work. Prof. Makoto Nohmi, I sincerely appreciate your
kindness; I could get your prompt response and assistance whenever I need and for providing the
necessary financial support during the different phases of this research work. I am also greatly
indebted to Prof. Atsushi Tsunekawa for recommending me to my major supervisor.
I am also grateful to the contribution of agricultural extension experts and other teams who
belong to federal, zonal (East Gojam zone) and district level agriculture and rural development
offices for providing me with the necessary information for my study. I owe the success of both
the surveys I have undertaken for this dissertation to the dedication and hard work of the data
collection team and to the kind cooperation of the respondent farmers in Gozamin district.
Special thanks to Mr. Girma for assisting me in conducting the pilot surveys and coordinating the
actual surveys. Though he is not alive I will always remember his kindness and helpfulness. May
God rest his soul in peace!
I gratefully acknowledge the support of Wubshet Abebe and his wife Lidya for their hospitality
during our stay with them and commitment to take care of my daughter while I am at field work.
Great thanks are also due to Hibret Belete for his insights, guidance and unreserved support to
make me familiar with the different tools of econometrics.
I wish to thank the following, for their assistance during my stay in Tottori: Dr. Dagnachew
Aklog, Dr. Derege Tsegaye, Hanna Mesfin, Hiwot Aklilu, Michael Yohannes, Fantahun Aklog,

iv
Naoko Sato and for all my laboratory members for their encouragement and sharing social life
with all happy and bad times which made my life tolerable. I enjoyed all our social gatherings
and made me to feel like at home.
The contribution of my ever loving and caring family is colossal. The support, motivation and
encouragement of my father, mother and brothers make my life comfortable during all my
education carriers and their prayers are the roots of my success.
Last but not least I would like to thank my loving husband Dr. Nigussie Haregewein (Babi) and
my beloved daughter Hana Nigussie. Babi, I have no words to explain what you mean for me.
You always encouraged me and played a pivotal role in achieving higher goals of life. I could
not be here without your support. Babi and Hanye thank you for your endurance, unconditional
love and patience throughout the achievements of my study.
Thank you God for answering my prayers in a period of endless great need!!!
Asres Elias

v
Dedication
This work is dedicated to my parents, whose good examples have taught me to work hard for the
things that I aspire to achieve. This dissertation is also dedicated to my husband, who has been a
persistent source of support and encouragement during the challenges of graduate school and
life. I am truly thankful for having you in my life.

vi
Table of Contents
Acknowledgements................................................................................................. iii
List of Tables .......................................................................................................... ix
List of Figures ......................................................................................................... xi
Acronyms and abbreviations ............................................................................... xii
Chapter 1.................................................................................................................14
Introduction ............................................................................................................14
1.1 Background of the study ..................................................................................................... 14
1.2 Statements of the research problem .................................................................................... 16
1.3 Objectives of the study ........................................................................................................ 19
1.4 Research questions .............................................................................................................. 19
1.5 Structural organization of the study .................................................................................... 20
Chapter 2.................................................................................................................22
Overview of development strategies and agricultural productivity in Ethiopia
..................................................................................................................................22
2.1 Introduction ......................................................................................................................... 22
2.2. Policy reforms during the transitional period (1991-1994) ................................................ 23
2.3 Agriculture Development Led Industrialization development policy ................................. 24
2.3.1 The National Extension Intervention Program ............................................................. 27
2.3.1.1 Structural organization of agricultural extension service ...................................... 28
2.3.1.2 Farmers training centers ......................................................................................... 29
2.4 Trends in agricultural inputs distribution and utilization .................................................... 30
2.4.1 The nature of the seed system ....................................................................................... 30
2.4.2 Trends in improved seed supply and utilization ........................................................... 31
2.4.3 Trends in fertilizer distribution and utilization ............................................................. 33
2.5 The state of crop production and productivity .................................................................... 35
Chapter 3.................................................................................................................37
Research methodology ...........................................................................................37
3.1 Description of the study area ............................................................................................... 37
3.2 Sampling procedures and sample size ................................................................................. 38

vii
3.3 Data collection techniques .................................................................................................. 39
Chapter 4.................................................................................................................41
Effect of agricultural extension program on smallholders’ farm productivity
in North West Ethiopia ..........................................................................................41
4.1 Introduction ......................................................................................................................... 41
4.2. Conceptual framework ....................................................................................................... 41
4.3 Model specifications ............................................................................................................ 43
4.3.1 The “benchmark” OLS model ...................................................................................... 43
4.3.2 Heckman’s treatment effect model ............................................................................... 45
4.3.3 Propensity score matching method ............................................................................... 48
4.4 Empirical results .................................................................................................................. 50
4.4.1 Descriptive analysis of bio-physical and socio-economic conditions .......................... 50
4.4.2. Ordinary least square results ........................................................................................ 53
4.4.3 Heckman treatment effect model results ...................................................................... 54
4.4.3.1 Determinants of extension program participation .................................................. 54
4.4.3.2 Effect of extension program participation on farm productivity ........................... 57
4.4.4 Propensity score matching results ................................................................................ 58
4.4.4.1 Average treatment effect on the treated ................................................................. 60
4.4.4.2 Assessment on the overlap and unconfoundedness assumptions .......................... 61
4.5 Conclusions ......................................................................................................................... 64
Chapter 5.................................................................................................................65
The effect of agricultural extension service on the technical efficiency of teff
(Eragrostis tef) producers in North West Ethiopia .............................................65
5.1 Introduction ......................................................................................................................... 65
5.2 Motivation for efficiency analysis of teff production in Ethiopia ....................................... 66
5.3 Empirical framework........................................................................................................... 67
5.3.1 Stochastic frontier production function ........................................................................ 68
5.3.2 Self-selection into agricultural extension program participation ................................. 69
5.4 Empirical models................................................................................................................. 71
5.5 Empirical results and discussions ........................................................................................ 74
5.5.1 Descriptive analysis of unmatched samples ................................................................. 74

viii
5.5.2 Propensity score matching results ................................................................................ 75
5.5.3 Assessment on the overlap and unconfoundedness assumptions ................................. 76
5.5.4 Parametric estimate of stochastic frontier production function .................................... 80
5.5.4.1. Factors influencing technical efficiency ............................................................... 82
5.5.4.2 Technical efficiency distribution............................................................................ 85
5.6 Conclusions ......................................................................................................................... 86
Chapter 6.................................................................................................................88
Gender roles in agriculture and its implication for agricultural extension: a
case study in North West Ethiopia .......................................................................88
6.1 Introduction ......................................................................................................................... 88
6.2 Empirical methods............................................................................................................... 90
6.3 Results and discussion ......................................................................................................... 90
6.3.1 Demographic characteristics by gender of household head ......................................... 90
6.3.2 Gender division of labor in crop and livestock production .......................................... 92
6.3.3 Crop types grown by male and female headed households .......................................... 94
6.3.4 Gender-labor time budget analysis in domestic and farm activities ............................. 95
6.3.5 Gender dimension in agricultural extension services ................................................... 96
6.3.6 Constraints to access agricultural extension service for female headed households .... 96
6.4 Conclusions ......................................................................................................................... 99
Chapter 7...............................................................................................................101
Summary, overall conclusions and implications of the study ..........................101
7.1 Summary of main results................................................................................................... 101
7.2 Conclusions and policy implications ................................................................................ 103
7.3 Research prospects ............................................................................................................ 105
References .............................................................................................................106
Appendix ...............................................................................................................122
Thesis Summary ...................................................................................................123
Thesis Summary in Japanese ..............................................................................126
List of Publications...............................................................................................128

ix
List of Tables
Table 2.1: Averages and growth rates of grains planted area, production and average yield
(2007/08-2010/11) ........................................................................................................................ 36
Table 4.1: Descriptive statistics of household level data (n = 300) used in the econometric
analysis .......................................................................................................................................... 51
Table 4.2: Descriptive statistics of plot level data (n=1112) used in the econometric analysis ... 52
Table 4.3: Results of OLS and HTEM (Dependent variables: ln (value of crop produced/ha) and
AE participation (1/0) ................................................................................................................... 54
Table 4.4: Estimation of the propensity score (Dependent variable: AE participation 1/0) ......... 60
Table 4.5: Estimating the ATT using different matching methods ............................................... 61
Table 4.6: Balancing test of matched samples .............................................................................. 62
Table 4.7: Comparative average yields (quintal/hectare) of the three main crops grown in the
study area ...................................................................................................................................... 63
Table 5.1: Descriptive statistics of variables included in the PSM analysis ................................. 74
Table 5.2: Results of logistic regression on AE participation (1/0) .............................................. 75
Table 5.3: Balancing test of matched samples .............................................................................. 77
Table 5.4: Summary statistics of variables included in the efficiency analysis for matched
samples .......................................................................................................................................... 79
Table 5.5: Maximum likelihood estimates of the translog stochastic frontier and inefficiency
model............................................................................................................................................. 80
Table 5.6: Generalized Likelihood Ratio (LR) tests of hypotheses involving the parameters of the
stochastic frontier and inefficiency model .................................................................................... 84
Table 5.7: Technical efficiency distribution of AE participant and non-participant teff producer
farms ............................................................................................................................................. 85
Table 6.1: Mean difference test of demographic characteristics, access to human, physical,
capital and social resources by gender of household head ........................................................... 91
Table 6.2: Gender role for crop production in the three rural villages (Kebele’s) during the main
agricultural season ........................................................................................................................ 93
Table 6.3: Gender role for livestock production in the three rural villages (Kebele’s) ................ 94
Table 6.4: Time budget analysis for gender division of labor (hrs/day) in the main agricultural
season ............................................................................................................................................ 96

x
Table 6.5: Distribution of farmers according to their agricultural extension participation level in
2012............................................................................................................................................... 97
Table 6.6: Factors hindering female headed households’ participation in agricultural extension
service ........................................................................................................................................... 98
Table A.1, A.2: Placebo regression result ................................................................................... 122

xi
List of Figures
Figure 1.1: Structural organization of the thesis ........................................................................... 21
Figure 3.1: Location map of the study area .................................................................................. 37
Figure 3.2: Focus group interview as research instrument .......................................................... 40
Figure 4.1: Impact pathway of agricultural extension on farm productivity ................................ 42
Figure 4.2: Propensity score distribution of matched samples ..................................................... 59
Figure 5.1: Propensity score distribution of matched samples ..................................................... 78
Figure 6.1: Crops grown by male and female headed households ............................................... 95

xii
Acronyms and abbreviations
ADLI Agricultural Development Led Industrialization
AISCO Agricultural Input Supply Corporation
AISE Agricultural Input Supply Enterprise
ARDU Agricultural
ASE Amhara Seed Enterprise
ATA Agricultural Transformation Agency
ATT Average Treatment effect on the Treated
BoARD Bureau of Agriculture and Rural Development
CADU Chilalo Agricultural Development Unit
CIA Conditional Independence Assumption
CIA Central Intelligence Agency
CSA Central Statistics Agency
DEA Data Envelopment Analysis
EEA Ethiopian Economics Association
EIAR Ethiopian Institute of Agricultural Research
EMTP Extension Management Training Plot
ERSS Ethiopian Rural Smallholder Survey
ESE Ethiopian Seed Enterprise
GDP Growth Domestic Product
GoE Government of Ethiopia
GTP Growth and Transformation Plan
Ha Hectare
IFAD International Fund for Agricultural Development
IFPRI International Food and Policy Research Institute
IRIN Integrated Regional Information Networks
Kg Kilogram
LR Likelihood Ratio
Masl Meters Above Sea Level
MEDaC Ministry of Economic Development and Cooperation

xiii
MoARD Ministry of Agriculture and Rural Development
MoFED Ministry of Finance and Economic Development
MPP Minimum Package Project
Mt Metric Ton
NAIA National agricultural Input Authority
NEIP New Extension Intervention Program
NFIA National Fertilizer Industry Agency
NGO Non-Governmental organization
NSIA National Seed Industry Agency
OLS Ordinary Least Square
OoARD Office of Agriculture and Rural Development
OSE Oromia Seed Enterprise
PA Peasant Association
PADETES Participatory Demonstration and Training Extension System
PADEP Peasant Agriculture Development Program
PASDEP Plan for Accelerated and Sustained Development to End
Poverty
PIF Policy and Investment Framework
PSM Propensity Score Matching
SDPRP Sustainable Development and Poverty Reduction Program
SFPF Stochastic Frontier Production Function
SG Sasakawa-Global
SNNPR Southern Nations Nationalities and people’s region
SRSE Southern Nations Nationalities and people’s region Seed
Enterprise
SSA Sub-Saharan Africa
TGE Transitional Government of Ethiopia
TE Technical Efficiency
TLU Tropical Livestock Unit
WADU Welayta Agricultural Development Unit
WDR World Development Report

14
Chapter 1
Introduction
1.1 Background of the study
Three out of four poor people in the developing world live in rural areas, and most of them
depend directly or indirectly on agriculture for their livelihoods (World Bank, 2010). Especially
in Sub-Saharan Africa (SSA), agriculture is the sector in which the majority of the region’s
people draw their livelihood, and their welfare is tied directly to the productivity of the resources
at their disposal (USDA, 2013). Agriculture in SSA (excluding South Africa) employed 62
percent of the population and generated 27 percent of the GDP of these countries in 2005 (Staatz
and Dembele, 2007). These agricultural production systems are largely based on smallholder
farms possessing two hectare or less, represent 80 percent of all farms in SSA, and contribute up
to 90 percent of the production in some SSA countries (Wiggins, 2009). As a result, improving
rural livelihoods and achieving household food security among small and marginal farm families
has become an increasingly important national goal in most developing countries in general and
in SSA in particular (FAO, 2011).
Agricultural extension is one of the policy instruments to stimulate agricultural development
through promoting the adoption and diffusion of improved technologies. The presence of
efficient and effective agricultural extension system helps farmers to identify and overcome
agricultural production problems, increases agricultural production and productivity, efficiency
and household income in a sustainable way that paves the way to agricultural development
(Anderson, 2007; Kassa, 2008; Christoplos, 2010). Thus, many developing countries have been
established their agricultural extension systems in order to realize their national food security
goals and improving rural livelihood (Swanson, 2006; Hu et al., 2009), through providing
knowledge for improved agricultural productivity, linking smallholder farmers to high-value and
export markets, and promoting environmentally sustainable production techniques (Andorson,
2007).
With a population of about 92 million and 3.17 percent growth rate per year (CIA, 2012),
Ethiopia is the second most populous country in SSA (United Nations, 2012). Like in many other

15
SSA countries, agriculture is the most important sector for sustaining growth and reducing
poverty in Ethiopia. It accounts for 85 percent of employment, 90 percent of exports, and 47
percent of gross domestic product (GDP) (FAO, 2010; CIA, 2014). Within the agricultural sector,
the crop subsector is the most important in terms of contribution to GDP. In 2006/07 the crop
sub-sector contribution to GDP was 30 percent while its share to the agriculture GDP was 65
percent. Although the Ethiopian economy is heavily reliant on agriculture, agricultural
production is yet characterized by low productivity, dominated by smallholders who are
subsistence, small-scale and resource poor farmers, fragmented and small plots of land (World
Bank, 2010) and almost entirely rain-fed agriculture. The country has the potential to irrigate
about 4.3 million ha, out of which only an estimated 6 percent is currently being utilized (PIF,
2010).
On the other hand, Ethiopia has great agricultural potential because of its vast areas of arable
land (with approximately 51.3 million ha), diversified agro-climatic zone, relatively adequate
rainfall in most parts and large labor pool. Despite this potential, however, the country's
agricultural performance has been dismal. This is further exacerbated by severe land degradation,
recurrent drought, low level of technology adoption, low productivity, weak infrastructure and
overpopulation (Falco et al., 2010; PIF, 2010). Smallholders’ crop productivity is still below
potential in Ethiopia and food security remains a critical issue for many households and for the
country as a whole. For instance, between 1998 and 2012 the average number of Ethiopians in
need of food assistance through a social welfare scheme fluctuated between 3 million and 14
million (IRIN, 2012). Moreover, the country ranks at 173th
out of 187 nations in terms of Human
Development Index (UNDP, 2013).
In an effort to curb the challenges facing the agricultural sector and achieve faster agricultural
growth and food security, the Government of Ethiopia (GoE) launched a new development
strategy-Agriculture Development Led Industrialization (ADLI) in 1993 that sets out agriculture
as a primary stimulus to generate increased output, employment and income for the people, and
as the spring board for the development of the other sectors of the economy (Kassa and Abebaw,
2004; Gebremedhin et al., 2009). Subsequently, agriculture has become the main focus of the
GoE's poverty reduction strategy, which includes the Sustainable Development and Poverty
Reduction Program (SDPRP) approved in 2002, the 2004 Food Security Strategy (FSS), the

16
2006 Plan for Accelerated and Sustained Development to End Poverty (PASDEP), and, most
recently, the 2011 Growth and Transformation Plan (GTP) (MoFED, 2002, 2007, 2010). The
core goal of all these strategies was to increase yield and improve rural livelihoods through a
centralized extension-based service known as Participatory Demonstration and Training
Extension System (PADETES) focusing on technological packages that combined credit,
fertilizers, improved seeds and better management practices. The goal of PADETES are to
improve incomes via increasing agricultural productivity; ensure self‐sufficiency in food
production; establish farmer organizations; to increase the production of industrial and export
crops; conserve and rehabilitate natural resources; to empower farmers to actively participate in
the development process and to encourage the participation of female farmers in agricultural
development (Kassa, 2003; EEA/EEPRI, 2006; World Bank, 2010).
In spite of the numerous national policies and development strategies that placed high priority on
boosting agricultural production and productivity, Ethiopia has yet to see payoffs in terms of
higher and more stable cereal yields, lower consumer prices for food staples, and reduced
dependence on food aid (Alene, 2003; Spielman et al., 2011; Mitik and Engda, 2013). At
national level gross crop yield is lingering behind the national food demand despite the
implementation of extension programs that aim to expand the use of modern agricultural input
technologies like chemical fertilizers, improved seed, herbicides, pesticides and new or improved
agronomic practices (Gebre-Selassie, 2003; World Bank, 2007; Yu et al., 2011). Despite the
major reform measures, including market and trade liberalization, economic policy and a
development strategy giving agriculture the lead role, the growth of the agricultural sector
remains a major policy challenge for the current government. The growing demand for food and
agricultural products to feed nearly 92 million people, the growing income gap between urban
and rural areas, dwindling natural resources, vulnerable to recurrent food shortfalls and national
food insecurity (Devis et al., 2010; Abate et al., 2011) are among the challenges confront policy
makers and other agents of change.
1.2 Statements of the research problem
As previously stated, one of the major programs in the rural development in general and the
Ethiopian agriculture in particular is the agricultural extension package program that supported
the promotion of modern agricultural technologies and intensifies agricultural growth

17
(EEA/EEPRI, 2006; Kassa, 2008). The provision of agricultural extension services is especially
important issue for agrarian countries like Ethiopia, where agriculture dominates the economy,
over 80 percent of the country’s people live in rural areas (FAO, 2010; CIA, 2012), and most are
extremely poor, with a daily per capita income of less than $0.50, and access to one hectare or
less of land (IFAD, 2011). To tackle these shortcomings, over the past two decades, policy
makers in Ethiopia have pursued a range of policies and investments to boost agricultural
production and productivity, particularly with respect to the food staple crops that are critical to
reducing poverty in the country. A central aim of this process has been to increase the
availability of improved seed, chemical fertilizers, and advisory services for small-scale,
resource-poor farmers, particularly those cultivating food staple crops (Spielman et al., 2011).
However, despite the implementation of a range of policies and strategies, the rate of return of
the agricultural sector remains relatively low and production is growing unsatisfactorily. Average
productivity was 12 quintal per hectare of land before the PASDEP period and it showed a
slower improvement and reached 15.7 at the end of PASDEP (2009/10) (Mitik and Engda, 2013).
In fact, with the special attention and significant investment made by the GoE on agricultural
extension service, agricultural production and productivity would have been increased more from
year to year.
While there is a large literature dealing with agricultural extension issues in developing countries
including Ethiopia, rigorous impact evaluations of agricultural extension interventions on
expected outcomes are less common (Waddington et al., 2010; Spielman et al., 2010). In this
regard, factors influencing effectiveness of agricultural extension services in fostering improved
outcomes for farmers and the reasons for different levels of effectiveness in different contexts
need to be investigated (Birner et al., 2006). Quantitative estimates of effect of extension
intervention related to intermediate outcomes such as knowledge acquisition, farmers’
empowerment, adoption and diffusion of technologies, and final outcomes such as agricultural
yield, household income and poverty status also need to be evaluated (Waddington et al., 2010).
This evaluation can help to answer the question “why, how and in which contexts agricultural
extension interventions are effective?” (Noyes et al., 2008), the answer of which could help
policy makers and practitioners in designing effective extension programs.

18
A number of useful published and unpublished materials are available concerning agricultural
extension in Ethiopia. Many of them deal with the type of extension approaches followed (for
example, Training and Visit System, Participatory Demonstration and Training Extension
System), challenges facing extension agents, role of extension service in commercialization, and
challenges of seed and fertilizer policies in cereal intensification (see Kassa, 2003; Kassa and
Abebaw, 2004; Gebremedhin et al., 2006; Byerlee et al., 2007; Spielman et al., 2011, among
others). Others dealing with issues related to adoption status of improved agricultural
technologies (Feleke and Zegeye, 2006; Darcon and Christiaensen, 2007; Gebregziabher and
Holden, 2011; Beshir et al., 2012 among others). Even though very few impact studies that
evaluate the contribution of agricultural extension in Ethiopia are available (e.g. Alene and
Hassan, 2003; Birner et al., 2006; Gebremedhin et al, 2009; Dercon et al., 2009), the results are
mixed and other studies as well as government reports so far have been measuring the success of
agricultural extension service mainly in terms of the number of farmers taking part or full of the
packages and/or physical inputs such as improved seed, chemical fertilizer, herbicides and
pesticides. But studies on the effect of the agricultural extension service in terms of agricultural
productivity and efficiency as well as its impact on female farmers’ empowerment in agricultural
development are scanty (EEA/EEPRI, 2006; Gebremedhin et al., 2009, Nega et al., 2010; World
Bank, 2010). Moreover, in spite of the huge investment made by GoE, there has been little
attention and careful analysis to study rigorous impact evaluations of agricultural extension
interventions (Kassa, 2008; Dercon et al., 2009; Spielman et al., 2010). Thus, evidences that
focus on the final outcomes of agricultural extension remain important.
In line with the effect of agricultural extension program on final outcomes, previous studies
reported contradictory findings. On one hand few evidences available suggest that participation
in agriculture extension program has led to improvements in output (Gebremedhin et al, 2009;
Bachewe, 2009; Ayele et al., 2005) and technical efficiency i.e., the extent to which the
maximum possible output is achieved from a given combination of inputs (Seyoum et al., 1998;
Khairo and Battese, 2005). On the other hand, other evidences asserted that the Ethiopian
extension program has non-significant effect on productivity (EEA/EEPRI, 2006) as well as
technical efficiency (Alene and Hassan, 2008; Alemu et al., 2009; Thangata and Mequaninte,
2011). All these studies however failed to address the problem of selection-bias that comes due
to self-selection of farmers into the program and endogenous program placement. The sample

19
selection problem may arise from (1) self-selection where the households themselves decide
whether or not to participate in extension program, due to differential resource endowments
and/or (2) endogenous program placement where those who administer extension program (such
as extension workers) select households with specific characteristics (relatively poor or
reasonably wealthy). In the actual situation extension program participants are not selected
randomly, as it is often the case with non-experimental data and this leads to a biased result. The
estimation will be either overestimate or underestimate.
The main aim of this study is therefore, to contribute towards systematic empirical evaluation of
the existing agricultural extension program (PADETES) in terms of its effect on farm
productivity, technical efficiency and female farmers’ empowerment in agricultural development
in a case study conducted in North West Ethiopia.
1.3 Objectives of the study
The specific objectives of the study were:
to evaluate the effect of participation in agricultural extension program (PADETES) on
smallholders’ farm productivity;
to measure the effect of agricultural extension on farm level technical efficiency;
to identify socio-economic and institutional factors influencing on farm technical
efficiency ;
to analyze the gender division of labour in agricultural production and its implication for
agricultural extension service;
to make policy recommendations based on findings of the study.
1.4 Research questions
1. Does PADETES meet its objective on improving farm productivity of smallholder farmers?
2. How is the effect of PADETES in enhancing smallholders’ farm technical efficiency? And
what are the determinant factors for inefficiency?
3. Does PADETES pro-poor and gender sensitive?

20
1.5 Structural organization of the study
In order to address the main objective i.e., evaluating the impact of agricultural extension
program on farm productivity, efficiency and empowerment of female farmers in Ethiopia, this
study address a range of issues in its seven chapters (Figure, 1). The next chapter provides an
overview of the GoE’s development policy and strategies pursued in the country since 1991with
the aim of providing background information and identifying their trend and overall impact on
smallholders’ farm productivity. Chapter 3 is devoted to the detailed description of the research
methodology used in this study. It includes description of the study area, the sampling
procedures of the study, the type of data used for analysis and empirical approaches used to
investigate objectives of the study. Chapter 4 gives detailed account on the conceptual frame
work for the intended analysis i.e., the effect of agricultural extension program on farm
productivity, theoretical and empirical issues related to farm productivity. Results of the
empirical investigation are also presented in this chapter. Chapter 5 comprises the motivation of
performing technical efficiency analysis, empirical approaches used and results on the level and
variability of agricultural extension participant and non-participant teff1 producer smallholders’
technical efficiency. Chapter 6 deals about the extent of female headed farm households’
participation in the current agricultural extension program. Special attention is given for the
gender division of labour due to its mainly used as a justification for their low participation level
in development intervention programs.
The last chapter brings together the major findings, draws conclusions and makes
recommendations with a view to enhance the effect of agricultural extension service in
improving farm productivity, efficiency and female farmers’ participation in agricultural
development in the study areas. Furthermore, future research directions are suggested.
1 Teff is a small grain crop widely consumed in Ethiopia and is the main ingredient in injera (pancake-like staple
food).

21
Figure 1.1: Structural organization of the thesis
Chapter 1: Introduction
Background of the study
Research problem
Objectives of the study
Structural organization of the study
Chapter 2: Overview of Development Policies,
Strategies and Agricultural Productivity in Ethiopia
Agriculture Development Led Industrialization
(ADLI) policy: SDPRP, PASDEP and GTP
The national extension intervention program
Trends in agricultural productivity
Chapter 4: Effect of Agricultural Extension Program on Smallholders’ Farm Productivity
Specific objectives
Empirical methods: bench mark OLS, Hackman’s treatment effect model, Propensity score
matching.
Results and discussion
Conclusions
Chapter 5: Effect of Agricultural Extension Program on Farm Technical Efficiency
Specific objectives
Empirical methods: Propensity score matching and stochastic frontier production function
Results and discussion
Conclusions
Chapter 6: Gender Role in Agriculture and its Implication for Agricultural Extension
Specific objectives
Empirical methods: Descriptive statistics and score values
Results and discussion
Conclusions
General Conclusions and Implications
Chapter 3: Research Methodology
Description of the study area and sampling design
Data collection techniques

22
Chapter 2
Overview of development strategies and agricultural productivity in Ethiopia
2.1 Introduction
Sustained and accelerated development of agriculture is the key to economic development and
poverty reduction in most agriculture-based economies. By building up smallholders knowledge
in the development of sustainable agricultural practices, smallholder farming can lead to a faster
rate of poverty alleviation, by raising the incomes of rural cultivators and reducing food
expenditure, and thus reduces income inequality (Magingxa and Kamara, 2003; Diao and Hazell,
2004; Resnick, 2004; Bahram and Chitemi, 2006; Anriquez. and Stamoulis, 2007; World Bank,
2008). However, developing countries encountered challenges related to their capacity to design
and implement effective agricultural development policies and strategies that will help improve
the livelihood of the rural communities and that promotes overall economic development.
Despite the number of agricultural policies adopted by most countries, implementation has been
lagging (Salami et al., 2010). Moreover, farming is generally confronted with many risks such as
climate change, drought and flood, unstable market condition, increasing prices of agricultural
inputs and threat of diseases and pests are only a few of the risk factors with which farmers must
contend. Appropriate agricultural policies could help in reducing some of these uncertainties.
There is no doubt that by all measures, Ethiopia is at a low level of social and economic
development. A large part of the economy is characterized by subsistence agriculture with
exceedingly low income and hand-to-mouth livelihoods (MOFED, 2003). While agriculture is
the backbone of the Ethiopian economy, it is characterized by low performance in terms of
production and productivity. Productivity gains are to a large extent due to land expansion and
favorable climate. Despite unprecedented economic growth reported over the past consecutive
years, Ethiopia remains one of the most food insecure and the poorest countries in the world
(WDI, 2009; IFDC, 2012).
Specifically, the share of poor people (poverty head count index) in Ethiopia is estimated to have
45.5 percent in1995, 44.2 percent in 1999 (WDI, 2013), 38.9 percent in 2004/5 (Salami et al.,
2010) and declined to 29.6 percent in 2009/10 fiscal year (GTP, 2011). Moreover, poverty is
more prevalent in rural (30.4 percent) than urban areas (25.7 percent) (MoFED, 2012).

23
Agriculture, although the dominant sector of the economy contributing about half of the GDP, is
constrained by several factors. It has failed to provide moderate and sustained incomes for many
who are engaged in the sector. Indeed, it has even failed to satisfy national food requirements
(MoFED, 2003).
The development of the agricultural sector is reflected by its capacity to supply adequate amount
of food for the growing population and raw materials for the industries; by its potential to
generate adequate foreign exchange; and by its capacity to provide market for industrial output.
Judged on the bases of these criteria, the development of the sector has been unsatisfactory and it
has not been able to produce surplus production to meet the growing demand for agricultural
products (Assefa, 1995; Abate et al., 2011). For instance, between 1998 and 2012 the average
number of Ethiopians in need of food assistance through a social welfare scheme fluctuated
between 3 million and 14 million (IRIN, 2012). Moreover, the country ranks at 173th
out of 187
nations in terms of Human Development Index (UNDP, 2013). The proportion of population
undernourished has been 40 percent (32 million people) in 2010 (FAO-food security indicator,
2013).
Thus, the purpose of this chapter is to give a brief account of the agricultural development policy
and strategies pursued in the country and their impact on smallholder’s farm productivity.
Particular emphasis is given to agricultural extension programs which has been formulated and
implemented by the current government, Ethiopian People's Revolutionary Democratic Front
(EPRDF) as a strategy to provide smallholder farmers with new technologies and improved
farming practices that enable them to increase productivity and to boost output.
2.2. Policy reforms during the transitional period (1991-1994)
The Ethiopian economy has had mixed fortunes. It exhibited a situation from one of respectable
growth of 1960’s to the stagnation and decline of the 1970’s and 1980’s. GDP grew only by 1.5
percent during 1974-1990. By the dawning of 1990’s, the economy showed severe
macroeconomic imbalances, severe food deficit, growing indebtedness and increased
vulnerability (Alene, 2003). Such social and economic problems of the country have
cumulatively become severe and complex mirroring sharp contrast between considerable
potential and widespread poverty. Thus, in 1991 by the beginning of the transition period, it was

24
clearly observed that Ethiopia face daunting economic development challenges. Subsequently,
like the previous governments who gave greater attention to the sector, Ethiopian agriculture has
got once again a new government commitment by the Transitional Government of Ethiopia
(TGE) in the 1990s. Since 1992 TGE favor market driven development policy by undergoing
important structural adjustments and reforms (European Union, 2002). These include the
abolishment of all price controls to agricultural products, the reduction and harmonization of
trade tariffs and privatization of state owned enterprises. Moreover, the transitional economic
policy had also underscored the need to encourage the peasant sub-sector since it occupies a
dominant position in terms of agricultural production (TGE, 1991). It has also been stated that
the TGE would allocate more resource to expand and improve their productivity especially
through improved agricultural production technologies.
2.3 Agriculture Development Led Industrialization development policy
The present Ethiopia’s macroeconomic development policy has been evolved from the new
economic policy of TGE (Mekonnen, 1994). Agricultural Development Led Industrialization
(ADLI) policy was introduced in 1993, which has been a central plank of the government’s
development program to date. The main motivation behind ADLI is the recognition that Ethiopia
is predominantly an agrarian society in which the bulk of the population, about 85 percent,
resides in rural areas earning a livelihood from land. In addition, agriculture has long dominated
the economy in terms of output, employment, and export earnings. The government emphasizes
that economic development and structural transformation should be initiated through robust
agricultural growth, and that peasant farmers and pastoralists should constitute the main agents
of economic growth. Labor and land are the main and abundant factors of production in the
nation and their effective use should generate rapid and sustainable development (Gebre-Selassie
and Bekele, 2011; Rahmato, 2008). ADLI guides government policies regarding both overall
economic development and agricultural development which recognizes the agriculture sector as
engine of growth and the prime focus of development policy. Through ADLI, the country plans
to end up with rapid and sustainable economic growth and independence from foreign food aid,
ensuring maximum benefit for the local population in the context of free and open market. Thus,
ADLI focuses on productivity growth on small farms which is attained through improved
smallholder agricultural productivity (MEDaC, 1999) as well as industrialization based on

25
utilization of domestic raw materials with labor intensive technology (Mekonnen, 1999) and
incorporating existing indigenous farming technologies where suitable (MoFED, 2003).
In order to realize the development goals of ADLI, the Ethiopian government introduced the
National Extension Intervention Program (NEIP) strategy, known as the Participatory
Demonstration, Training and Extension System (PADETES) in 1995. PADETES aims at
improving income and supply of food via agricultural production and productivity, increasing
industrial and export crops, ensuring rehabilitation and conservation of natural resources, and
empowering farmers, especially female farmers in agricultural development.
Furthermore, ADLI had been supplemented by new development strategies and/or plans, which
include Sustainable Development and Poverty Reduction Program (SDPRP), which cover the
year 2002/3-2004/5, Plan for Accelerated and Sustained Development to End Poverty (PASDEP),
that ran from 2005/6-2009/10 and most recently the 2011 Growth and Transformation Plan
(GTP) which ends up in 2015. SDPRP has centered on the principal goal of poverty reduction. In
line with this program, the government has introduced fiscal decentralization, judicial and civil
service reform, and public sector capacity building. After the continuing evidence of widespread
food insecurity in the drought of 2002/03, the government also initiated a strong focus on safety
nets, programs to build the assets of food insecure households, resettlement, and soil and water
conservation (especially water harvesting).
The main objective of PASDEP was to accelerate the transformation from subsistence to
commercialization of smallholder agriculture through attaining increased productivity and
increased share of marketed production and continued support to pro-poor basic agriculture
within the framework of the national food security program. Elements of the PASDEP program
in the agricultural sector include capacity building through training, development and adoption
of a high yielding technology through strengthened agricultural research and extension service
delivery mechanism, promotion of increased diversification of agriculture through high value
added commodities, promotion of commercialization of agriculture and establishment of a
marketing system, development of small-scale irrigation and water harvesting technologies and
sustainable use and management of natural resources (MoRAD, 2006).

26
Currently the GTP has been adopted and implemented considering the priority to intensify
productivity of smallholders and strongly supports the intensification of market-oriented
agriculture, either at national or international level, and promotes private investments. The plan
includes scaling up of best practices to bring average farmers’ productivity closer to those of best
farmers, expanding irrigation coverage and shifting to production of high value crops to improve
income of farmers and pastoralists, with complementary investments in market and infrastructure
development (GTP, 2011). By and large, all these strategies have given high priority and special
attention for agriculture and rural development. As a result, the agricultural extension service is
one of the major institutional support services that have a central role to play in the
transformation process.
Development and implementation of agricultural extension programs was not a new practice
when the current Ethiopian government adopts PADETES. Ethiopia has had long history in
implementing government agricultural extension services since the 1950s, when a model similar
to the United States Land Grant approach was used, in which universities reached out to
communities with research-based knowledge and through adult education (Kassa, 2003, Kassa,
2008). The Imperial Ethiopian College of Agriculture and Mechanical Arts (IECAMA) provided
extension services in addition to research and teaching. In 1963, the Ministry of Agriculture was
established, and the mandate of extension provision was transferred to this institution. The
Ministry of Agriculture established extension departments at the headquarters and provincial
levels (Abate, 2007). During this time, several national development plans were devised, the last
of which supported small-scale farmers through comprehensive package programs
(Comprehensive Integrated Package Projects, or CIPPs), the most prominent of which were the
Chilalo and Wolayita Agricultural Development Units (CADU and WADU). CADU was
established in Arsi to improve living standards through increased production and infrastructure.
The WADU program, based in Wolayita, although still focused on improving living standards,
based on its approach on agro-ecological zones (Abate 2007). A minimum package (Minimum
Package Program MPP1 and MPP2) approach then followed these programs, to help to scale up
the CIPPs. MPP1 lasted from about 1971 to 1975. The country then moved into a socialist period.
During this time the government implemented “quasi-participatory extension approaches” and
continued with the MPP2 program until 1985. Much of the focus during this time was on land
reform. The MPP2 program ended around 1985 (Abate 2007). In the mid-1980s, various new

27
programs were implemented, such as the National Program for Food Self Sufficiency (1986–
1989), the Modified Training and Visit (T&V) Approach, and the Peasant Agriculture
Development Extension Projects (PADEP) (1986–1995) (Abate, 2007). Detail historical analysis
about models and approaches of extension used since 1950’s are found in other reviews (see,
Kassa, 2003; Abate, 2007; Kassa, 2008).
2.3.1 The National Extension Intervention Program
The T&V approach continued as the national extension approach until the mid of 1990,s. In
formulating PADETES, a task force was set up to evaluate and screen out shortcomings of
previous extension approaches. Accordingly the task force concluded the following points as
shortcomings of past extension approaches: extension service was organized by commodity
rather than by function; the extension service was given on the sense of transmitting information
without adequate or no input supply; less attention was given in organizing farmers; the service
was limited only to high potential areas; the link between research and extension on the one hand
and with credit and marketing agencies on the other were extremely weak; problems of
coordination and integration among programs and projects remained apparent; and the
participation of farmers remained low (MoA, 1994). In response to these limitations, NEIP was
designed to improve farmers’ production and productivity through better access to technologies.
The new extension program (PADETES) was formulated based on the experience of a pilot
extension program of the SG-2000. The Sasakawa Africa Association and Global 2000 of the
Carter Center initiated a pilot extension service program in 1993 which lasted for two years and
was implemented by SG-2000 and the ministry of agriculture extension staffs. During this time,
available agricultural technologies were assessed and technology packages for maize, wheat,
sorghum and teff were developed and tested in Oromiya; Southern Nations, Nationalities and
Peoples Region (SNNPR); Tigray and Amhara Regions. In 1993, 160 farmers were involved in
maize and wheat on-farm Extension Management Training Plots (EMTP), while this number
grew to 1600 farmers in 1994 and included additional demonstrations for sorghum and teff. The
remarkable yield increases demonstrated under the SG-2000 pilot extension program convinced
the government to adopt it as a national extension intervention program - PADETES in 1995.

28
PADETES involved the use of Extension Management and Training Plots (EMTP), usually half
hectare on-farm demonstration plots which were managed by farmers and used to train farmers
and extension workers on appropriate agronomic and farm management practices (Alene, 2003;
Alemu and Demese, 2005). PADETES also follows package approach for agricultural
development that incorporates information on agricultural technology, provision of inputs and
credit, and communication methods (Kassa, 2003; Ibrahim, 2004; Alemu and Demese, 2005).
The program initially started in seven regions with technology packages for wheat, maize,
sorghum and teff in high rainfall areas. Later, the program expanded its area coverage and
number of technology packages, and included technology packages for crop production for
moisture stress areas, livestock, high value crops, post-harvest technology, and agro-forestry,
among others. The number of participant farmers increased from 32 thousand in 1995 to about
12.7 million at the end of PASDEP period (2009/10). The number of extension agents also
increased from 2500 in 1995 to about 60 thousand in 2009/10 (GTP, 2011).
2.3.1.1 Structural organization of agricultural extension service
The current extension service is almost exclusively funded and provided by the government
through its woreda level Offices of Agriculture and Rural Development (OoARD) (Gebremedhin
et al, 2006). All agricultural finances are handled by the ministry of finance and economic
development (Davis et al, 2010). The Ministry of Agriculture and Rural Development (MoARD)
at the federal level is responsible for developing and refining the overall national agricultural and
rural development strategies and policies for the country. Several agencies sit beneath the
MoARD: the agricultural marketing and inputs sector, the natural resources sector, and the
agricultural development sector. In turn, the agricultural extension department, and the training
and vocational education department, falls under the agricultural development sector.
Next to the federal MoARD, regions are responsible for agricultural and rural development
policy implementation, coordination, and evaluation. Each Bureau of Agriculture and Rural
Development (BoARD) has a head and a number of technical and administrative staff, including
department heads. These personnel provide technical and administrative support, as well as
supervision and monitoring for the woreda and kebele2 level extension offices. Each region’s
2 Kebele is the lowest administrative unit in Ethiopia and often translated as peasant association.

29
agricultural advisory support is internally divided according to major agro-ecological zones,
providing more detailed technical and administrative support.
Under the regions are zonal offices, which mainly operate as liaison offices between regions and
woredas. However, the woreda offices of agriculture and rural development are the main
frontline administrative structures implementing agricultural extension. The woreda level
OoARDs are composed of five main sectors: agricultural development, natural resources,
environmental protection and land administration, water supply and rural roads, and input supply
and cooperative promotion (Gebremedhin et al, 2006). The largest sector, agricultural
development, is responsible for extension services and is usually divided into crop production,
livestock production, natural resource management, and extension teams (Gebremedhin et al,
2006).The extension team is expected to have a team leader and extension supervisors, all based
at the woreda level. Each extension supervisor is responsible for the supervision of extension
activities in several PAs (kebeles). Generally, the woreda level OoARD represents a more
operational level in terms of reaching smallholder farmers and pastoralists.
2.3.1.2 Farmers training centers
In Ethiopia, where public agricultural extension remains dominant and pluralism in the service
delivery is just emerging, strengthening public agricultural extension has received due policy
attention. Since 2004, more than 60,000 development agents were trained in 25 agricultural
technical and vocational education and training colleges to serve in the public extension.
Thousands of farmer training centers (FTCs) have been established by government with
substantial contributions from rural communities. The ministry of agriculture and rural
development planned to establish at least 15, 000 FTCs, one in every rural kebele. About 8,500
FTCs have been built so far and about 45, 000 development agents are engaged as service
providers in these FTCs (MoARD, 2009). FTCs were designed as local-level focal points for
farmers to receive information, training, demonstrations, and advice, and included both
classrooms and demonstration fields. The FTCs are expected to form an important node between
extension and farmers in the agricultural sector. FTCs are managed at the kebele level, but
funding for capital, operational, and salary costs come from the woreda level.

30
The establishment of FTCs and the accompanying strategy and guidelines of the Ethiopian
MoARD suggest the beginning of a strategic shift towards knowledge based approach to
smallholder agricultural development as well as a shift from a sole focus on the transfer of
technology to emphasis on human resource and social capital development. This approach, if
effectively implemented, it can empower smallholder farmers and in the long run can enable
rural households and communities to solve their own problems.
While FTCs and the assignment of thousands of graduates as staff in these centers represents
huge resource and opportunity to move forward, making the FTCs functional, responsive,
effective and dynamic remains a real challenge (Lemma, 2011). According to MoARD (2009),
about 2, 500 (30 percent) out of 8, 500 FTCs were somewhat functional.
2.4 Trends in agricultural inputs distribution and utilization
2.4.1 The nature of the seed system
Seed systems in Ethiopia can be divided into two broad types: the formal system and the
informal system. Both systems are operating simultaneously in the country and difficult to
demarcate between the two. There is however, a fact that the formal system is the original source
of improved seeds in the informal system (Atilaw and Korbu, 2011). According to Alemu et al.
(2010), the informal seed system under Ethiopian context is defined as seed production and
distribution along with the different actors where there is no legal certification in the process.
This includes retained seed by farmers, farmer-to-farm seed exchange, cooperative based seed
multiplication and distribution, Non-Government Organization (NGO) based seed multiplication
and distribution etc. The formal seed system on the other hand is a system that involves the
production and distribution of basic seed mainly by the research system or certified multipliers
like the Ethiopian Seed Enterprise (ESE), the Regional Seed Enterprises etc.
Like the previous governments who gave attention for the development of the seed sector, the
current GoE has also realized the importance of further strengthening the seed system and
established a National Seed Industry Agency (NSIA) in 1993 along with a National Fertilizer
Industry Agency (NFIA) with the support of International Development Association (IDA) and
International Fund for Agricultural Development (IFAD) seed system development project
(Alemu, 2010). For the purpose of creation of institutional synergy, the NSIA and NFIA were
31
merged in 2003 and established the National Agricultural Input Authority (NAIA), which was
functional only for about one year (Alemu et al., 2008). In 2004, the NAIA was integrated to the
agricultural input quality control and inspection department and the agricultural input market
department of the MoARD.
Currently the Ethiopian seed system is governed by policies stipulated in the public
proclamations and regulations that were put in place in the early 1990s (Alemu et al., 2010). The
main responsibility of implementing these policies is given to MoARD at the federal level and to
BoARDs at the regional level. The national research system headed by the Ethiopian Institute of
Agricultural Research (EIAR) and comprised of a range of federal research centers, regional
research centers, agricultural universities and faculties are responsible for developing improved
varieties, breeder and pre-basic seed needed by other players in the industry (Spilman et al.,
2011). Regulatory functions such as varietal release reviews and seed certification are performed
by various departments of the MoARD. Basic and certified seed production is carried out by the
Ethiopian Seed Enterprise (ESE), which relies on its own farms alongside private companies,
private subcontractors, state farms, and cooperatives, to bulk up seed that is supplied to the
regional extension and input supply systems. Recently, state owned regional seed enterprises are
established such as Oromiya Seed Enterprise (OSE), Amhara Seed Enterprise (ASE), and
Southern Nations nationalities and Peoples Region Seed Enterprise (SRSE) and entered in to the
formal seed system (Alemu et al., 2010).
Improved certified seed is supplied to Ethiopian smallholders primarily through regional, state-
run extension, and input supply systems that operate with a degree of guidance from the federal
MoARD. This regional system is made up of regional bureaus of agriculture and rural
development, their woreda offices, and extension agents (termed “development agents” in
Ethiopia) working at the kebele (peasant association) level. These organizations collaborate
closely with farmers’ cooperatives and regional credit and savings institutions in both supplying
inputs and disbursing credit.
2.4.2 Trends in improved seed supply and utilization
Seed is a key input for improving crop production and productivity. Increasing the quality of
seeds can increase the yield potential of the crop by significant folds and thus, is one of the most

32
economical and efficient inputs to agricultural development (FAO, 2006). In recent years, there
has been a growing recognition in some policy circles of the existence of agricultural
technologies that can considerably improve productivity and the limited access of these
technologies to farmers. In addition, there is a substantial improvement in the level of farmers’
awareness about the use of those improved technologies.
With considerable variability among the different crops, the total supply of improved seed in
Ethiopia was only 27 percent of the officially estimated demand in 2005 (Byerlee et al., 2007;
Alemu and Spielman, 2006) and with a 72 percent shortfall in 2008 (Speilman et al., 2011). The
overall annual average seed requirement for cereals, pulses and oil crops is estimated to be over
400,000 tons (Marja H. et al., 2008). However, the average yearly supply of improved seed
doesn’t exceed 20,000 tons since the establishment of ESE (Atilaw and Korbu, 2011). The
supply still is far below the increasing demand even though there are many efforts under way
aimed at increasing production and distribution by strengthening the public and private sectors.
The limited production capacity at ESE for certified seed, combined with insufficient provision
of breeder and pre-basic seed from the research system, contribute much to these shortfalls
(Speilman et al., 2011).
Furthermore, due to the shortage of supply of certified seed, the allocation of the produced
certified seed among the different regions is normally made by the policy makers. The most
important criteria used for the allocation are the regional importance in the national production of
the crop, the size of the revealed demand, and also regional equity (Alemu et al., 2010). For
instance, the same report indicated that, in 2008 agricultural season Oromiya’s share from the
total cropped areas is about 45 percent and from area allocated for cereals is about 46 percent,
which is similar to its total seed received. On the other hand, Amhara, Somali and Benishangul-
Gumuz seem to get lower proportion and Tigray and SNNP receive a higher proportion as
compared to their share in the total cropped area and area allocated for cereals.
On the other hand, adoption of improved seed in Ethiopia is very low while the total quantity of
improved seed supplied nationally has been increasing during the PADETES period (Byerlee et
al., 2007; Spielman, 2011), though not the required level. The nationally representative Ethiopia
Rural Smallholder Survey (ERSS) conducted in 2005 indicated that the adoption rate is only 3

33
Percent. This figure is until recently unchanged. For instance according to Atilaw and Korbu
(2011) the total cultivated area covered by improved seed from 2005/6 to 2010/11 at national
level ranges 3.97 percent, 3.05 percent, 3.48 percent, 3.72 percent and 3.44 percent respectively.
This indicated that most farmers still rely primarily on farmer-to-farmer exchanges or saved seed.
2.4.3 Trends in fertilizer distribution and utilization
In 1993, the GoE had issued the national fertilizer policy, which supported fertilizer market
development. The GoE had launched the national fertilizer sector project with financial support
from the World Bank and other donors in 1996. This project supported fully liberalized pricing,
the abolition of subsidies, and the regulation of fertilizer standards. Subsequently the
Agricultural Input Supply Corporation (AISCO) which was established in 1984 was renamed as
the Agricultural Inputs Supply Enterprise (AISE). Policy changes that fully liberalized fertilizer
pricing and the removal of subsidies followed in1997/98. The private sector’s initial response to
market liberalization was rapid. By 1996, several private firms were importing fertilizer, and 67
private wholesalers and 2,300 retailers had taken over a significant share of the domestic market
(Spielman et al., 2011). However, since 1999 the private sector that had initially responded to the
reforms has largely exited the fertilizer market. In the case of imports, the share of private firms
operating in the market went from 33 percent in 1995 to zero in 1999. Since then, the AISE has
taken the majority share, followed by “private” companies closely affiliated with or owned by
the governing party and, more recently, cooperative unions (Jayne et al., 2003; Byerlee et al.,
2007). These days due to the entrance of cooperative unions in fertilizer import market with
considerable technical assistance from the ministry of agriculture, the share of party affiliated
companies are declined.
The public sector that accounted for over 70 percent of distribution and cooperatives have
become almost the sole distributors of fertilizer since early 2000 (DSA, 2006). The current
government policy is to target at least 80 percent of fertilizer sales through cooperatives, which
are eventually intended to replace the public sector involvement in retail distribution of fertilizers
(Byerlee et al., 2007). However, difficulties are observed in the estimation of demand and
distribution of fertilizer. Estimations of demand are compiled through official channels and
aggregated to the national level. Importers respond to official demand estimates and organize

34
distribution through the regional bureau of agriculture or cooperatives, depending on the region
(DSA, 2006).
Regarding the uptake and use of chemical fertilizer in Ethiopia, it can be assessed in several
ways in terms of total fertilizer imported, percentage of cultivated land under fertilizer
application, and household-level estimates of fertilizer application per hectare.
When measured in terms of quantity imported, over the last one decade, total fertilizer imports
have increased by more than 50 percent, from less than 370,000 metric-tons (mt) in 2002 to
almost 570,000 mt in 2011, with a spike of 627,000 mt in 2009. Fertilizer carryover stocks
averaged 33 percent of imports between 2002 and 2011, with a high of 61 percent in 2002 and a
low of 12 percent in 2007. These stocks, resulting from the mismatch between actual fertilizer
demand and imports, accentuate the year-to-year variability in fertilizer import levels.
Consumption levels vary across the country with Oromia, Amhara, SNNP and Tigray regions,
using an average of 92 percent of total fertilizer sales between 2003 and 2011 (IFDC,2012).
According to CSA (2011) ninety percent of fertilizer consumed in Ethiopia is used on cereals,
4.7 percent on pulses and 1.8 percent on oil seeds. Non-grain crops account for only 3 percent of
fertilizer use. From total fertilizer use in cereals, teff receives the highest share with almost 40
percent of fertilizer use, followed by wheat (26 percent), maize (17 percent), barley (9 percent)
and sorghum (3 percent).
The amount of fertilizer applied to crops in 2010/11 is estimated at 550,500 mt, an increase of 30
percent compared with about 426,700 mt in 2009/10. For 2010/11, 4.8 million ha of cultivated
land were fertilized, compared with 3.2 million ha in 2009/10, a 53 percent increase. These
figures suggest that the average fertilizer application rate per hectare of cultivated land decreased
from 133 to 115 kg/ha. Among major cereal crops, maize has a higher average application rate of
175 kg/ha by 2011, while the lowest application rate was for sorghum with 97 kg/ha (CSA,
2011). These statistics indicate that the national level intensity of fertilizer use is still lower than
the recommended rate of 200 kg per ha (100 kg of DAP and 100 kg of Urea) (Demeke et al.
1998 in Alem et al. 2008; Fufa and Hassen, 2005). Moreover, different types of data on
application rates indicate a slightly different, and often confusing, story about the intensity of
fertilizer use in Ethiopia (Spielman et al, 2011).

35
2.5 The state of crop production and productivity
Data on national crop production levels and trends are controversial. Changes in government and
methodologies have coincided with distinct breaks in the data, making it difficult to distinguish
between actual changes and statistical artefacts (Taffesse et al., 2011). Thus, independent data
sources who can compile nationally representative data are highly needed regardless of
government change and its political ideology to understand the actual change in agricultural
production and productivity.
During the 1990s the performance of crop production showed an improvement over the 1980s.
Performance throughout in the 1980s was low with cereal production increasing at a rate of 1.7
percent annually compared to a population growth rate 2.9 percent (Alene, 2003). In the 1990s,
growth in cereal production accelerated to about 5 percent per year according to both FAO and
CSA data. The rise was entirely due to very good weather and increases in area cultivated (by
almost 6 percent per year), while yields continued to decline by 0.5 – 0.7 percent per year (Alene,
2003; Taffesse et al., 2011). But the contribution of increased use of improved agricultural
technologies was argued to have been minimal mainly because yield of most cereals remained
stagnant (Mulat, 1999).
On the other hand, according to CSA data which is compiled by Taffesse et al., (2011), growth in
cereal production accelerated further to 7 percent per year from 1999/2000 to 2007/08. Average
cereal production increased to 10.94 million ton per year during this time period. Though growth
in area cultivated slowed to 3.1 percent per year, yields increased by 3.5 percent per year. Cereal
production and yield growth was particularly rapid from 2004/05 to 2007/08 (12.2 and 6.2
percent, respectively), while cereal acreage recorded an annual growth rate of only 4.8 percent.
During the same time period, cereal production on average involved 11 million holders. Cereal
acreage and cereal output averaged 8.2 million hectares and 12.1 million tons, respectively.
However, in contrast to the increasing trend observed in cereal production and yield during
2000/01- 2007/08 crop seasons, a declining trend in yield has been observed since 2007/08. CSA
data compiled by IFDC (2012) revealed that planted area has been increasing steadily since the
2007/08 crop season with a 13.7 percent increase by 2010/11 season, driven by oil crops and, to
a minor scale, by pulses and by cereals. As depicted in Table 2.1, in terms of grains production,

36
the upward trend between 2007/08 and 2010/11 was again driven by cereals along with a
substantial percentage increase in oil crop production from a low base. The increase in
production between 2007/08 and 2010/11 is clearly attributable to the increase in cultivated area.
Yield performance between 2007/08 and 20010/11 was stagnant to negative except for oil crops,
which increased slightly.
Table 2.1: Averages and growth rates of grains planted area, production and average yield
(2007/08-2010/11)
Crop seasons Percent change
2007/8 2008/9 2009/10 2010/2011 2007/08-2010/11
Total area in
ha (x103)
Cereals 9,690.7 9,951.8 10,457.8 10,807.5 11.5%
Pulses 1,357.5 1,803.9 1,727.4 1,582.0 16.5%
Oil crops 774.5 1,006.5 978.0 1,058.6 36.7%
Total grains 11,822.8 12,762.2 13,163.2 13,448.1 13.7%
Total
production
in mt(x103)
Cereals 17,761.3 15,606.8 17,320.8 19,180.7 8.0%
Pulses 1,953.2 2,060.5 2,065.0 2,065.7 5.8%
Oil crops 634.0 777.7 860.3 935.7 47.6%
Total grains 20,348.5 18,444.9 20,246.1 22,182.1 9.0%
Average
yield (mt/ha)
Cereals 1.8 1.6 1.7 1.8 -3.2%
Pulses 1.4 1.1 1.2 1.3 -9.2%
Oil crops 0.8 0.8 0.9 0.9 8.0%
Total grains 1.7 1.4 1.5 1.6 -4.2%
Source: Adapted from IFDC, 2012.

37
Chapter 3
Research methodology
3.1 Description of the study area
This study was conducted in Gozamin woreda (district), East Gojjam Zone of the Amhara
regional state, North West Ethiopia. Amhara regional state is the second largest region next to
Oromia region. Gozamin is one of the 17 administrative woredas in the zone (Figure 3.1). It is
found at about a distance of 265 km far from Bahir Dar city, the regional capital, and at about
300 km from Addis Ababa city, the national capital. The woreda is bordered by Sinan woreda to
the North, Machacle and Debre Eliyas woreda to the West, Abay river gorge to the South and
Basoliben and Anedede woreda to the East.
Figure 3.1: Location map of the study area
Case study area (Gozamin district)

38
The woreda has a total area of 1,217.8 km2
and an estimated population of 133, 856, out of which
98 percent are living in rural areas (CSA, 2008). The woreda comprises 14 sector offices and 25
rural Kebeles surrounding Debre Markos town.
Average annual rainfall of the wereda ranges from 1400 mm to 1800 mm and have an annual
daily average temperature ranging between 11°C and 25
°C. It covers three agro-ecological zones
with 19 percent highland (2300 to 3200 meter above sea level), 65 percent midland (1500 to
2300 meter above sea level) and 16 percent lowland ( below 1500 meter above sea level)
(Gozamin woreda administration sector office, 2010). About 95 percent of total crop production
is rainfall dependent (Benin, 2006). Generally, the district has a big potential for agricultural
activities due to its agro-ecological diversification and dependable rainfall and optimum
temperature.
The economy of the woreda is based on plough-based and labour intensive agriculture, which
depends mainly on meher rain (main rainy season). Cultivation of annual and perennial crops
and rearing of livestock are the common farming practices. Main crops grown in the woreda in
order of abundance include teff, wheat, maize, barely, check pea, soya bean, oats, niger seed
(Neug) and lentil.
3.2 Sampling procedures and sample size
In principle, accurate information about a given population could be obtained only from a census
study. However, due to financial and time constraints, in many cases a complete coverage of the
population is not possible. Thus sampling is one of the methods, which allow the researcher to
study a relatively small number of units representing the whole population (Saratnakos, 1998). In
order to draw valid inferences from the sample and to ascertain the degree of accuracy of the
results, the sample needs to be drawn following the rules of probability. The appropriateness of a
sampling method depends on how it will successfully meet study objectives. Thus, this study
followed a multi-staged stratified random sampling procedure in selecting farmers to be surveyed.
In the first stage sampling Gozamin woreda was selected purposively for satisfying the following
criteria; where crop production is widely practiced, where extension program have been
implemented for relatively longer period of time, the availability of different agro-ecologies and
its representativeness to the Ethiopian highlands. The Ethiopian highlands comprise nearly 45

39
percent of the total land area of 1.12 million square km, and support over 85 percent of the
country’s 92 million population that are overwhelmingly rural. In the second stage sampling
three kebeles namely, Enerata, Kebi and Wonka based on their adequate representation of
distinct agro-climatic zone were randomly selected out of the total 25 kebeles found in the
woreda.
Because of the complexity of data requirements, financial and time constraints sample sizes are
usually small and cannot be expected to produce highly reliable estimates for all parameters.
Nevertheless, it is possible to improve this situation by stratifying the population in to many sub-
populations based on one or more classification variables. Taking these issue in to account,
stratified random sampling technique was employed to select a total of 300 (225 male headed
and 75 female headed) farm households. First, farmers in each selected kebele were stratified
into two groups as participant and non-participant of the extension program. The groups were
identified from a list made available by the front-line extension workers, and then the
information was confirmed by the farmers. Second, the two groups were further stratified in to
male and female headed households to ensure, as much as possible, representation of female-
headed households in the sample. From each kebele a total of 100 households which comprises
50 extension program participant and 50 non participants were randomly selected.
3.3 Data collection techniques
The household survey data was collected during May and June 2011/2012 main cropping season.
Data were collected both at household and plot level using structured questionnaire which was
pre-tested through a pilot survey to ensure clarity and adequacy of the questions. Based on the
results of the pilot survey, the questionnaire was revised and finalized for actual data collection.
The actual data collection was done by the researcher and selected enumerators, who were living
and working with the farmers as well as having acquaintance with socio economic concepts and
knowledge of the culture of the society. The selected enumerators received an intensive training
before and after the pilot survey on the objectives, content and methods of the survey.
The household data consists of demographic and socio-economic characteristics of household
head, resource endowment, use of credit, training access, extension participation experience,

40
membership in farmers’ organization, involvement in kebele-administration3 and leadership
position. The plot level data consists of information on the intensity of input use (improved seed,
inorganic fertilizer, compost and agro chemicals for pest and weed control), plot soil quality, plot
slope, farm management practice (such as ploughing frequency), labor time disaggregated by
field operation and amount of yield obtained for all types of crops grown during the 2011/12
main agricultural season. Unfortunately, neither farm records nor adequate disaggregated time
series data on inputs and outputs particularly those relating smallholder agriculture exist in
Ethiopia. As a result farmers respond mainly based on recall for up to the past one year, since
respondents rarely had written records. Due to the lack of keeping records, especially data that
were related to land use and inputs for individual crops were difficult tasks to collect. However,
whenever possible, cross checking was done simultaneously with the help of individual farmers,
head of the village and using land holder certificate, to minimize the straight forward recall error.
Output and input price information was collected from nearby markets and Gozamin district
marketing office. Moreover, area measurements, quantity of input and output were taken in local
units and these were later converted to standard units.
Interviews and focus group discussions (consisting of nine groups, each of the group consists of
8-15 farmers) were used to compliment the data obtained through the field survey.
Figure 3.2: Focus group interview as research instrument (photo taken by author, June 2012)
3 Kebele-administration consists of an elected kebele council, a kebele cabinet, a social court and security persons
posted in the kebele. The kebele council and executive committee’s main responsibilities are preparing annual kebele
development plan, ensuring the collection of land and agricultural income tax, organizing local labour and in kind
contributions to development activities, resolving conflicts with in the community (Yilmaz and Venugopal, 2008).

41
Chapter 4
Effect of agricultural extension program on smallholders’ farm productivity
in North West Ethiopia
4.1 Introduction
The agricultural growth rate over the past two decades has been quite low in spite of
implementing the national extension package program-PADETES. The impacts of the
implemented technologies have been mixed, with increased use of fertilizer but poor productivity
growth (World Bank, 2006). The low agricultural production and productivity growth has been
raising a growing concern about the effectiveness of the extension program in enhancing farm
productivity. However, rigorous impact evaluations of agricultural extension interventions on
farm production and productivity are scanty (Anderson & Feder, 2007; Gebremedhin et al., 2009;
Nega et al., 2010; World Bank, 2010).
Therefore, the aim of this chapter is evaluating the impact of agricultural extension program (AE)
participation on smallholders’ farm productivity using a plot-level data and identifying
determinants of extension participation. The three crops, maize, wheat and teff are selected for
this analysis due to mainly targeted by the extension program as well as among cereal crops,
these crops including barely and sorghum represent 95 percent of total cereal planted area and 96
percent of total cereal production. We started with a baseline model to estimate the impact of AE
participation on farm productivity using Ordinary Least Square (OLS). Then we employed
Heckman Treatment Effect Model (HTEM) and Propensity Score Matching (PSM) methods to
address the problem of selection-bias due to self-selection of farmers into the program and
endogenous program placement.
4.2. Conceptual framework
The conceptual framework illustrates how agricultural extension program that is expected to
enhance farmers’ knowledge and skills, as well as promote and expand improved technologies
affect farm productivity of Ethiopian smallholders. It is a general fact that, agricultural extension
and/or advisory services play an important role in agricultural development and can contribute to
improve the welfare of farmers and other people living in rural areas. In spite of this, there are

42
many factors that condition the relationship between extension inputs and outcomes, and these
factors act in complex ways.
According to Anderson and Feder (2003) productivity improvements are only possible when
there is a gap between actual and potential productivity. They suggest two types of ‘gaps’ that
contribute to the productivity differential, the technology gap and the management gap.
Extension can contribute to the reduction of the productivity differential by increasing the speed
of technology transfer and by increasing farmers’ knowledge and assisting them in improving
farm management practices (Feder et al., 2004).
To make it understandable and consistent with the objective of this paper and the design of
agricultural extension program in Ethiopia, the pathways showing how the extension program
impact agricultural productivity are illustrated in Figure 4.1.
Figure 4.1: Impact pathway of agricultural extension on farm
The mechanism to increase production and farm productivity through agricultural extension
services are mainly tied with adoption of improved seeds, inorganic fertilizers, agro chemicals
(herbicide and pesticide) and credit for the Ethiopian smallholders.

43
By facilitating credit services via cooperatives and microfinance institutions (e.g., credit in cash
or in kind), the extension program enhances farmers’ financial capacity which leads farmers to
adopt improved technologies as well as practices that will ultimately meet their local farm
production. Equally important, the extension service facilitates the adoption of improved
technologies through awareness creation, acquiring knowledge and skill with dissemination of
information and providing training that will ultimately help increase agricultural productivity.
However, whether farmers actually adopt improved technologies and practices being promoted
by the program is conditioned by several other household and farm level factors as well, such as
human capital (sex, age, education level, and labour), physical capital (land size, livestock
ownership), social capital (membership in farmers’ organizations) and others (soil type, slope of
the land, and farm management practices like intensity of ploughing frequency). The possible
effect of each variable on land productivity has been hypothesized in Section 4.3
4.3 Model specifications
This study uses a combination of three methods (a benchmark Ordinary Least Square,
Heckman’s Treatment Effect and Propensity Score Matching) to assess the effect of participation
in agricultural extension program on farm productivity.
4.3.1 The “benchmark” OLS model
We start with a baseline model by estimating the impact of agricultural extension program (AE)
participation on productivity using OLS.
The model is specified as follows:
𝑌𝑖𝑗=β𝑥𝑖 +𝜓𝑥𝑗+ δ𝐴𝐸𝑖 + ϵ𝑖𝑗 (4.1)
where, 𝑖 and 𝑗 denotes household and plot level characteristics, the dependent variable 𝑌𝑖𝑗
denotes the natural logarithmic transformation of gross value of crop produced per hectare
(expressed in Ethiopian Birr4/ ha), 𝑥𝑖 is a vector of household level explanatory variables (sex,
age, education level, labor, livestock ownership, membership in farmers’ organization), 𝑥𝑗 refers
plot level explanatory variables (plot size, slope, soil fertility, amount of agrochemicals and
4 Birr is Ethiopian currency and during the survey period 1US$ = 17 Birr.

44
inorganic fertilizer, compost, seed type, tenure type, draft power ,plot distance from home stead
and ploughing frequency), β, 𝜓 and δ are vector of parameters to be estimated, 𝐴𝐸𝑖 is a dummy
variable indicating whether or not the 𝑖𝑡ℎ household participate in the agricultural extension
program and ϵ𝑖𝑗 is the error term. In this “benchmark” specification, the dummy has a constant
coefficient, which gives the average treatment for the treated (ATT). The parameter δ measures
the effect of AE program participation on farm productivity.
The effect of explanatory variables on the dependent variable has been hypothesized as follows.
The variable age can be considered as an indicator of farming experience, on the other hand,
those who are aged households may be reluctant to take up and apply improved technologies as a
result the effect of age on crop productivity is ambiguous. Higher level of household education is
likely to be associated with higher productivity because education enhances the ability of
individuals to utilize technical information and such households would have better use of
technologies and farming practice via access to information. On the other hand, there could be
cases that educated households have high chance of engaging themselves in other non-farm
related activities such as sideline business, involvement in kebele administration that would leave
them with little time to spend on their farming activities. Regarding the sex of household head,
most studies in developing countries report that female-headed households are the poorest and
marginalized people due to their resource and other constraints such as access to credit, market
information, assets, technical knowledge, cultural taboos and the likes. Hence we expect male-
headed households would have better crop productivity than female headed households.
Physical capital or asset ownership which is usually used as a proxy to explain the wealth status
of rural households can be explained by different variables. These are land and livestock which
have been shown to overcome credit constraints in rural areas (Thirtle et al., 2003). The
estimated coefficient is thus expected to be positive.
Social capital such as membership in farmers’ organization might have indirect influence on
productivity. This type of organization is mostly targeted by extension workers to disseminate
information about improved technologies and farm practices. Therefore those farmers who are
members of farmers’ organizations might have greater chance to adopt technologies that lead to
increase productivity.

45
OLS estimate of the coefficient for AE participation dummy is unbiased as far as participation is
random. However, if the sample of the participants and non-participants is non-random, as it is
often the case with non-experimental data like the data this study used, OLS estimates of δ lead
to a biased result. There are several approaches to deal with this problem (e.g. Heckman & Robb,
1985; Rosenbaum & Rubin, 1985; Angrist & Imbens, 1995; Wooldridge, 2010). The sample
selection problem may arise from (1) self-selection where the households themselves decide
whether or not to participate in extension program, due to differential resource endowments
and/or (2) endogenous program placement where those who administer extension program (such
as development agents) select households with specific characteristics (relatively poor or
reasonably wealthy). As a result, extension participation may not be random that could give us a
biased OLS result. To address the possible sample selection bias this study employed Heckman
Treatment Effect and Propensity Score Matching techniques as discussed below.
4.3.2 Heckman’s treatment effect model
One of the most widely used approaches to deal with selection bias is the Heckman treatment
effect model. The Heckman correction, a two-step statistical approach, offers a means of
correcting for non-randomly selected samples. The model can be specified in two steps:
Outcome equation:
𝑌𝑖𝑗=β𝑥𝑖 +𝜓𝑥𝑗+ δ𝐴𝐸𝑖 + ϵ𝑖𝑗 (4.2)
This is the same as the OLS equation in Eq. (4.1)
Selection equation:
𝑡𝑖∗=𝑍𝑖γ +𝜐𝑖, 𝑡𝑖 = 1 if 𝑡𝑖
∗ > 0 and 𝑡𝑖 = 0 otherwise. (4.3)
Where 𝑡𝑖∗ is the latent endogenous variable i.e. extension participation, υ is error term of the
selection equation, 𝑍𝑖 is a set of exogenous variables predicting the selection of households into
the extension program, ϵ𝑖 and 𝜐𝑖 are bi-variate normal with mean zero and covariance

46
matrix[σϵ ρρ 1]. Where ρ is the correlation between ϵ and υ, and σϵ is the variance of ϵ. The
inverse mills ratio, λ, is a product of this two i.e. λ = ��𝜖 ρ5.
Selection equation: Probit model is estimated in which extension participation is regressed on a
set of household characteristics 𝑍𝑖. Variables included in the selection equation are: age of the
household head (Age), total land holding of the household (LSize), owned livestock (TLU),
family labor in adult equivalent (Adequv), distance from plot to extension center (Pdadist),
number of oxen used (Oxenday) and a set of dummies indicating (i) whether the household head
is educated (Educ) (ii) whether the household is member of kebele administration (Kebadm) and
(iii) whether the household is member of farmers’ organization (Frorg). Each of these variables
is expected to only affect farm productivity through their impact on participation. The extension
program participation equation is given by:
Pr(AEParticipationi=1) = Φ[γo+γ1Kebadm +γ2 Frorg +γ3Age+γ4Educ+ γ5Pdadist+γ6LSize +
γ7 Adequv+γ8TLU+γ9Oxenday+ υi] (4.4)
The choice of the explanatory variables included in Z is guided by previous empirical literature
on the decision of participation in development intervention programs.
Age can influence participation negatively or positively. Older farmers are often viewed as less
flexible, and less willing to engage in a new or innovative activity due to fear of risk whereas
young farmers may be more risk averse to implement new technologies on their farm. Hence, the
influence of age on participation decision is ambiguous. Education might have positive
contribution for participation in two ways. Either the farmers select the program due to their
ability to understand the cost and benefit of participation in the program as well as easily
understand how to implement new technologies (Doss and Morris, 2001) or extension program
might target farmers who are educated due to their capacity of investing in improved
technologies through participation in the non-farm sector (Barrett et al., 2001; Cunguara and
Moder, 2011).
5 The treatment effect assumes non-zero correlation between ϵ and υ and hence violation of this assumption can lead
to biased estimation.

47
Wealth (land, livestock ownership, and family size in adult equivalent scale) might help farmers
mitigate incomplete credit and insurance markets (Zerfu and Larsony, 2011; Ayalew and
Deininger, 2012). Extension program may also target wealthier farmers due to their financial
capacity to adopt improved technologies, and thus extension workers might want to deal with
them to implement improved technologies promoted by the program.
In the study area, a hard-working and productive farmer is often described by the locals by how
well he/she does the different farm activities starting from land preparation to post-harvest. The
quality of doing these activities can better be estimated from the number of oxen days a farmer
used at plot level, which was collected during our survey. Hence this study used number-of-oxen
days to characterize each farmer’s commitment to farming and such kind of farmers might have
high probability of participation in the extension program.
Membership in farmers’ organizations can influence participation positively due to either
extension workers might find it cheaper to target farmers group which helps them maximize the
payoffs from efforts to build farmers capacity to demand advisory service (Benin et.al., 2011;
Cunguara and Moder, 2011) or membership in a social group provides opportunities to discuss
and observe practices of other members at no cost or time intensity (Gebreegziabher, et al., 2011).
Involvement in kebele administration could influence participation positively. One kebele
consists of four to seven villages and these villages are often relevant units for government
initiatives and program. A village consists of limat budin, or development team for the
implementation of a range of government activities, including mobilizing household labor for
community projects. They also have political functions, such as mobilizing support and votes for
the ruling party. Extension workers often work closely with limat budin (Cohen and Lemma,
2011; Birhanu, 2012). Hence, being in a position to involve in kebele administration with such
kind of network system might increase the probability of participation in government sponsored
extension program. We do not expect involvement in kebele administration to be correlated with
farm productivity hence it might function as an identifying variable in the sample selection
model.
The productivity equation is estimated in which farm productivity is regressed on a set of
household and plot level characteristics. This is similar to those variables used in the OLS
48
regression with additional regressor the Inverse Mill’s Ratio (IMR) or Lambda (the residuals
produced by the first-stage estimate of HTEM) included as a control variable in the productivity
equation.
Outcome (farm productivity) equation is given by:
Yieldij=α+δAEParticipationi+𝛽1Sexi+𝛽2Agei+𝛽3Educi+𝛽4TLUi+ψ1PlotSizeij+ψ2Slopeij+ψ3Soilf
ertilityij+ψ4Agrochemicalij+ψ5Compostij+ψ6Fertlizerij+ψ7Seedtypeij+ψ8Distij+ ψ9Tenuretypeij
+ ψ10Oxendayij + ψ11Labour + ψ12Ploughingfrequencyij + ψ13Cropdummyij + ψ14Sitedummyij
+ IMR + ϵij (4.5)
where, 𝑖 is household characteristics and j denotes plot characteristics.
However, a major limitation of the Heckman treatment model is that it imposes a linear form on
the productivity equation and it extrapolates over the regions of no common support, where no
similar participant and non-participant exist. But economic theory suggests that imposing such
distributional and functional restriction may lead to biased result (Rosenbaum and Rubin, 1983;
Dehejia and Wahba, 2002; Heckman and Navarro-Lozano, 2004). Therefore, this study
complements the analysis with semi-parametric matching approach (Rosenbaum and Rubin,
1985) to ensure the robustness of our previous model estimations.
4.3.3 Propensity score matching method
Matching is a widely used non-experimental method of evaluation that can be used to estimate
the average effect of a particular program (Smith and Todd, 2005; Caliendo and Kopeinig, 2008).
This method compares the outcomes of program participants with those of matched non-
participants, where matches are chosen on the basis of similarity in observed characteristics.
Suppose there are two groups of farmers indexed by participation status P = 0/1, where 1 (0)
indicates farms that did (not) participate in a program. Denote by 𝑦𝑖1 the outcome (farm
productivity) conditional on participation (P = 1) and by 𝑦𝑖0 the outcome conditional on non-
participation (P = 0).
The most common evaluation parameter of interest is the mean impact of treatment on the
treated, 𝐴𝑇𝑇 = 𝐸(𝑦𝑖1 − 𝑦𝑖
0| 𝑝𝑖 = 1) = 𝐸(𝑦𝑖1|𝑝𝑖 = 1) − 𝐸(𝑦𝑖
0|𝑝𝑖 = 1), which answers the

49
question: ‘How much did farms participating in the program benefit compared to what they
would have experienced without participating in the program?’ Data on 𝐸(𝑦𝑖1 | 𝑝𝑖 = 1) are
available from the program participants. An evaluator’s main problem is to find (𝑦𝑖0|𝑝𝑖 = 1) ,
since data on non-participants enables one to identify 𝐸(𝑦𝑖0|𝑃 = 0) only. So the difference
between 𝐸(𝑦𝑖1|𝑃 = 1) and 𝐸(𝑦𝑖
0|𝑃 = 1) cannot be observed for the same farm.
The solution advanced by Rubin (1977) is based on the assumption that given a set of observable
covariates X, potential (non-treatment) outcomes are independent of the participation status
(conditional independence assumption-CIA): 𝑦𝑖0 ⊥ 𝑆𝑖 | X. Hence, after adjusting for observable
differences, the mean of the potential outcome is the same for P = 1 and P = 0,
(𝐸(𝑦𝑖0|𝑃 = 1, 𝑋) = 𝐸(𝑦𝑖
0|𝑃 = 0, 𝑋)). This permits the use of matched non-participating farms to
measure how the group of participating farms would have performed, if they had not participated.
Like the Heckman treatment effect model, propensity score matching has two-step. First, the
propensity score (pscore) for each observation is calculated using logit model for AE
participation (estimating a first-step equation similar to equation 3). The second step in the
implementation of the PSM method is to choose a matching estimator. A good matching
estimator does not eliminate too many of the original observations from the final analysis while it
should at the same time yield statistically equal covariate means for treatment and control groups
(Caliendo and Kopeinig, 2008). Hence, a kernel matching algorithm is used to pair each AE
participant to similar non-participant using propensity score values in order to estimate the ATT.
This study also analyzed the data using alternative matching estimators to check the robustness
of the results.
As explained above, the main assumption of PSM is selection on observables, also known as
conditional independence or unconfoundedness assumption. Therefore, the specification of the
propensity score is crucial because the logit model results depend on the unconfoundedness and
overlap assumptions among others. Unconfoundedness assumption implies that adjusting for
differences in observed covariates removes bias in comparisons between the two similar groups
that only differ by AE participation. In other words, beyond the observed covariates, there are no
unobserved characteristics that are associated both with the potential outcome and the treatment
(Imbens and Wooldridge, 2009). Although unconfoundedness is formally untestable, there are

50
ways to assess its plausibility. To address the unconfoundedness assumption in this study,
different measures are taken such as inclusion of many covariates in the propensity score
specification to minimize omitted variables bias following the suggestion in (Smith and Todd,
2005), then matching is implemented on the region of common support (Heckman et al., 1997).
In addition, a placebo regression was employed (Imbens and Wooldridge, 2009) as a robustness
check of the impact estimates to unobserved selection bias. This approach was also used by
Abebaw and Haile (2013) and Cunguara and Moder, (2011) to test unobserved bias in the impact
estimate.
The overlap assumption implies that the conditional distributions of the covariates of AE
participants overlap completely with non-participants (Dehejia and Wahba, 2002; Imbens and
Wooldridge, 2009). There are two formal methods of testing the overlap assumption. The first is
to plot the distribution of the propensity scores of AE participants and non-participants and
visually assess whether the overlap assumption holds or not. The second method is to compute
normalized differences between the two groups (Imbens and Woolridge, 2009). The normalized
difference is given by:
∆𝑥 = ��1 − ��0
√𝜎12 + 𝜎0
2 (4.6)
where 𝑥�� is the mean, and 𝜎𝑖2 is the sample variance.
4.4 Empirical results
4.4.1 Descriptive analysis of bio-physical and socio-economic conditions
Tables 4.1 and 4.2 indicate a summary of descriptive statistics for household and plot level data
respectively. Regarding demographic characteristics, the result revealed that, the average age for
participant farmers were slightly less than nonparticipants. Literacy rate is significantly high for
participant (68 percent) household heads than those who did not participate (24 percent). The
average family size is 6.35 and 4.89 for participants and non-participants respectively. Available
active family labor in adult equivalent for participants is 3.22 and 2.61 for non-participants.
Average land holding size for participants is 1.53 and 1.05 hectare for non-participants. The

51
average owned livestock size in TLU is 8.91 and 4.48 for participants and non- participants
respectively.
Access to credit remains very low for majority of sample households. Only 17 percent of
participants and 16 percent of non-participants had access to credit. About 96 percent of
participants and 58 percent of non-participants were members of farmers’ organization.
Table 4.1: Descriptive statistics of household level data (n = 300) used in the econometric
analysis
Variables
All sample Participant Non- participant
Mean S.D Mean S.D Mean S.D P-
value
Age of Household head (HH)
(years)
45.70 10.07 45.45 10.02 46.09 10.14 0.303
Sex of HH (1 = male,0 = female) 0.82 0.38 1.00 0.00 0.54 0.49 0.000
Education of HH(1 = literate, 0 =
illiterate)
0.50 0.50 0.68 0.47 0.24 0.43 0.000
Family size 5.77 1.92 6.35 1.81 4.89 1.74 0.000
Available family labor (adult
equivalent)
2.98 1.06 3.22 1.03 2.61 1.01 0.000
Owned land size (hectare) 1.34 0.63 1.53 0.60 1.05 0.57 0.000
Owned livestock (Tropical
Livestock Unit, TLU)
7.14 3.92 8.91 3.83 4.48 2.18 0.000
Use of credit previous year(1 = yes,
0 = no)
0.16 0.37 0.17 0.37 0.16 0.37 0.839
Number of training received for the
last three years.
3.79 5.31 5.72 6.08 0.89 1.10 0.000
Membership in farmer’s
organizations (1 = yes, 0 = no)
0.81 0.39 0.96 0.21 0.58 0.49 0.000
Involvement in kebele
administration work (1= yes, 0= no)
0.25 0.44 0.46 0.49 0.01 0.10 0.000
Note: S.D: Standard deviation
Source: Own survey, 2012
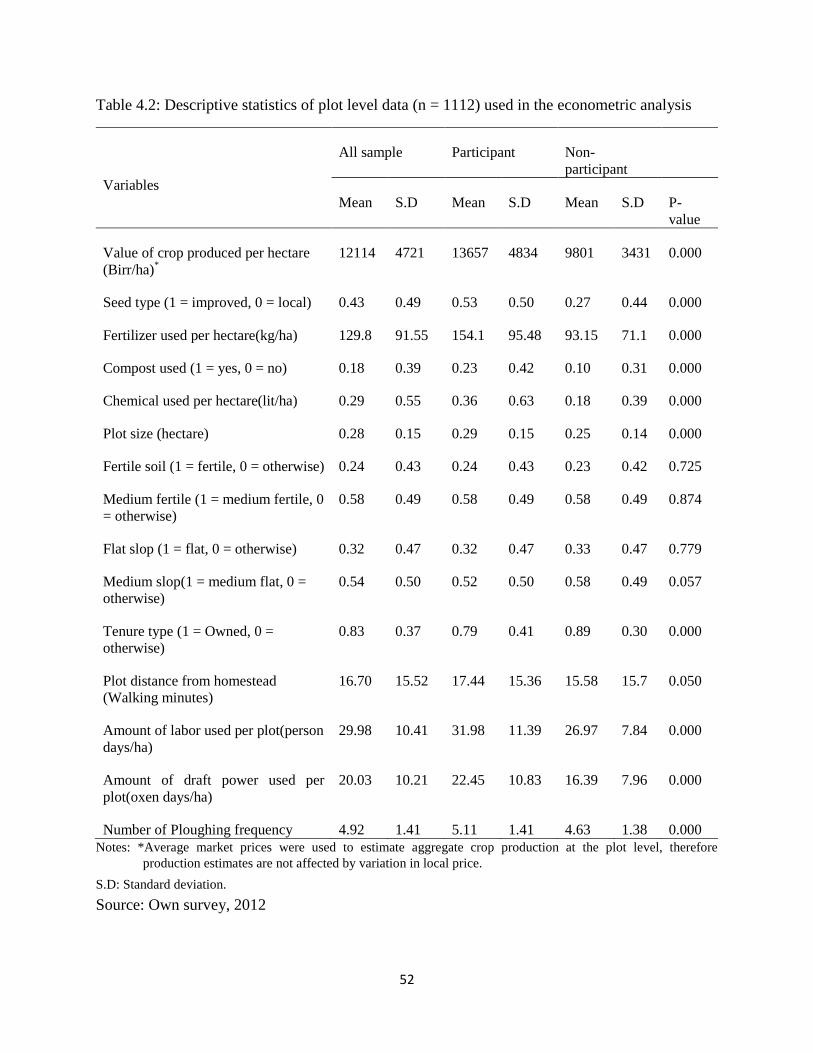
52
Table 4.2: Descriptive statistics of plot level data (n = 1112) used in the econometric analysis
Variables
All sample Participant Non-
participant
Mean S.D Mean S.D Mean S.D P-
value
Value of crop produced per hectare
(Birr/ha)*
12114 4721 13657 4834 9801 3431 0.000
Seed type (1 = improved, 0 = local) 0.43 0.49 0.53 0.50 0.27 0.44 0.000
Fertilizer used per hectare(kg/ha) 129.8 91.55 154.1 95.48 93.15 71.1 0.000
Compost used (1 = yes, 0 = no) 0.18 0.39 0.23 0.42 0.10 0.31 0.000
Chemical used per hectare(lit/ha) 0.29 0.55 0.36 0.63 0.18 0.39 0.000
Plot size (hectare) 0.28 0.15 0.29 0.15 0.25 0.14 0.000
Fertile soil (1 = fertile, 0 = otherwise) 0.24 0.43 0.24 0.43 0.23 0.42 0.725
Medium fertile (1 = medium fertile, 0
= otherwise)
0.58 0.49 0.58 0.49 0.58 0.49 0.874
Flat slop (1 = flat, 0 = otherwise) 0.32 0.47 0.32 0.47 0.33 0.47 0.779
Medium slop(1 = medium flat, 0 =
otherwise)
0.54 0.50 0.52 0.50 0.58 0.49 0.057
Tenure type (1 = Owned, 0 =
otherwise)
0.83 0.37 0.79 0.41 0.89 0.30 0.000
Plot distance from homestead
(Walking minutes)
16.70 15.52 17.44 15.36 15.58 15.7 0.050
Amount of labor used per plot(person
days/ha)
29.98 10.41 31.98 11.39 26.97 7.84 0.000
Amount of draft power used per
plot(oxen days/ha)
20.03 10.21 22.45 10.83 16.39 7.96 0.000
Number of Ploughing frequency 4.92 1.41 5.11 1.41 4.63 1.38 0.000
Notes: *Average market prices were used to estimate aggregate crop production at the plot level, therefore
production estimates are not affected by variation in local price.
S.D: Standard deviation.
Source: Own survey, 2012

53
Moreover about 46 percent of participant farmers are involved in kebele administration whereas
the non-participant’s involvement in kebele administration is only 1 percent.
The average value of crop produced per hectare is 13,657 birr for participants and 9,801 birr for
non-participants. The amount of inorganic fertilizer, chemical (pesticide and herbicide), and seed
inputs used per hectare were computed from the actual amounts of those inputs used on each
plots standardized to a per hectare level. Accordingly, the average intensity of fertilizer used per
hectare by the sample households is 129 kg, 154 kg and 93 kg for all sample plots, plots of
participant and non-participants respectively, which is lower, compared to the recommended rate
200 kg per hectare. Our result is consistent with findings of Zerfu and Larsony (2011). The
average intensity of chemical use rate by participants was 0.36 liters per hectare whereas non-
participants used 0.18 liters per hectare. Average plot size is 0.28, 0.29 and 0.25 for all farmers,
participants and non-participants respectively.
Generally the descriptive statistics result indicates that there is significant difference between
participants and non-participants in terms of household characteristics, resource endowment,
input use and productivity without controlling other factors. Therefore, our next question is what
would happen if other factors controlled? The different models used in this study could give the
answer.
4.4.2. Ordinary least square results
The results presented in Table 4.3 show that participation in extension program leads to
increased farm productivity by about 6 percent. However, to measure the benefit of participation
in the program in terms of farm productivity, it is necessary to take into account the fact that,
individuals those who participated might have produced higher production even if they had not
participated. That is, there may be unobserved factors (e.g. ability) that increases the likelihood
of participation in the program that in turn increase productivity. When this is the case the impact
of the program would be overestimated by simply regressing farm productivity on a binary
variable that indicates participation in the extension program. To control this sample selection
bias, we estimated equations (4) and (5) together using treatment effect model and the result is
presented in the following section.

54
4.4.3 Heckman treatment effect model results
4.4.3.1 Determinants of extension program participation
The probit model for AE program participation shows that all variables except distance to
extension center are significant determinants of participation in the current agricultural extension
program. The model correctly predicted 70 percent of observed characteristics of participants
and non-participants. The likelihood of participation in the extension program is affected
significantly by age, education, livestock ownership, adult equivalent, oxen days, membership in
farmers’ organizations and involvement in kebele administration.
The negative and significant impact of household head age on the probability of joining the
extension program indicates the lower likelihood of older farmer’s participation in the program.
Table 4.3: Results of OLS and HTEM (Dependent variables: ln (value of crop produced/ha) and
AE participation (1/0)
OLS HTEM Probit
Variables Coef. Std.err. Coef. Std.err. Coef. Std.err
AE participation 0.0606** 0.0265 0.179*** 0.0445
Sex of HH 0.0685*** 0.0256 0.0482* 0.0281
Age of HH (ln) -0.0847** 0.0427 -0.0753* 0.0418 -0.949*** 0.289
Education of HH -0.0132 0.0189 -0.0425** 0.0210 0.852*** 0.116
Owned livestock(ln) (TLU) 0.0403** 0.0165 0.00607 0.0197 1.463*** 0.145
Plot size (ln)(ha) 0.0917** 0.0366 0.0729** 0.0358
Flat slop 0.0778** 0.034 0.0758** 0.0306
Medium slop 0.0308 0.0323 0.0317 0.0278
Fertile soil 0.330*** 0.0324 0.337*** 0.0303
Medium fertile 0.247*** 0.0283 0.250*** 0.0244
Tenure type 0.00343 0.0253 -0.00742 0.0243
Seed type 0.183*** 0.0231 0.175*** 0.0222

55
Fertilizer (kg/ha) 0.0013*** 0.0001 0.0013*** 0.0001
Compost 0.126*** 0.0314 0.126*** 0.0285
Agro chemicals(lit/ha) 0.0307** 0.0153 0.0253 0.0161
Plot distance to home-
stead(ln)(walking minute) 0.0028 0.00912 0.0020 0.0088
Draft power(ln)(oxen day/ha) 0.155*** 0.0459 0.150*** 0.041
Labour (ln)(person day/ha) 0.137*** 0.0418 0.124*** 0.0397
Ploughing frequency 0.0216** 0.00965 0.0224** 0.0094
Sitedummy_Enerata (cf:Kebi) 0.0267 0.024 0.0255 0.0225
Sitedummy_Wonka 0.106*** 0.0201 0.105*** 0.0212
Cropdummy_wheat(cf:maize) 0.0599 0.052 0.0523 0.0447
Cropdummy_teff 0.208*** 0.053 0.201*** 0.0458
Adult equivalent
0.178*** 0.0615
Owned land (ha)
0.321** 0.118
Kebele administration
1.572*** 0.257
Membership in farmers’
organizations
1.292*** 0.172
Oxen days
0.428*** 0.101
Plot distance from extension
center(ln)(walking minute)
-0.115 0.0774
Lambda
-0.0904*** 0.0279
Constant 7.477*** 0.222 7.534*** 0.212 -1.64 1.087
Observations 1,112
1,112
1,112
R-squared 0.567
LR test of indep. eqns. (rho =
0): chi2(1) = 8.37 Prob >
chi2 = 0.0038
*** p<0.01, ** p<0.05, *p <0.1
Source: Own survey, 2012

56
This can be explained by the fact that older farmers are reluctant to accept new information and
improved technologies. This result is consistent with studies reported by Genius et al (2006).
However, this result is contradicting with observations made by Tiwari et al. (2008); Mendola,
(2007). Hence, the impact of farmers’ age on extension participation and/or technological
adoption is ambiguous as expected. Education increases the probability of joining the extension
program. This is consistent with the notion that farmers with better human capital like education
are among the early adopters (Gebreegziabher et.al, 2011; Giovanopoulou et al., 2011).
As hypothesized, all wealth indicator variables have significant effect on the probability of
participation. One more tropical livestock unit increases the probability of participation in the
extension program by about 14 percent. Owned land and family size in adult equivalent scale
also increases the likelihood of participation. One of the characteristics of Ethiopian agriculture
is its labour intensive nature; hence, households who have large number of family size in adult
equivalent scale have high likelihood of participation in the extension program.
As expected, use of intensive oxen power is positively significant with participation. This
implies that farmers who are believed to be hard-working have a high chance of joining the
extension program and other similar development interventions in a bid to improve their
productivity. However, the measurement used to characterize a hardworking farmer is still a
subject of refinement in future researches.
Membership in farmers’ organization has positive significance for the probability of participation
in the extension program as expected and consistent with past findings (Benin et al., 2011;
Abebaw and Haile, 2013).
Involvement in kebele administration has the highest coefficient value among all the variables
which affect the likelihood of participation. This implies that being affiliated with kebele
administration, which is a nonfarm related activity, increases significantly the likelihood of
farmers to join the extension program. This is due to lack of clear boundary between the
extension program and the political administration which often share common human and
material resources. For instance, as explained in our assumption, development agents often work
closely with development team who are the major components of the kebele structure established
by the government. The development team has also political functions, such as mobilizing

57
support and votes for the ruling party (Cohen and Lemma, 2011; Birhanu, 2012). Hence, it is not
surprising that being in a position to involve in kebele administration increases the probability of
participation in government sponsored extension program. Previous studies show that involving
in local administration facilitates access to credit and fertilizer because these supplies are
channeled through local agencies (Ayalew and Deininger, 2012; Zerfu and Larsony, 2011).
Furthermore other studies show that implementation modalities are given to local agencies, so
that the system is potentially open to local influence (DSA, 2006). This fact is confirmed by
World Bank (2010) report; politicians provide public services to clients in exchange for political
advantage. This, in turn, leads to inequality in service provision, typically to the disadvantage of
female and the poor.
4.4.3.2 Effect of extension program participation on farm productivity
The result from HTEM in Table 4.3 shows that participation in AE increases farm productivity
by about 20 percent. Unexpectedly the HTEM estimation for the effect of AE participation on
productivity is higher compared to OLS estimation (6 percent), which was estimated without
treating the endogenity of extension participation. The inverse mills ratio is negatively
significant which indicates the presence of serious selection bias, due to the fact that program
participants were selected by other nonagricultural related affiliations such as involvement in
kebele administration (Table 4.3).
Other factors which have positive influence on farm productivity were sex of household head,
age, plot size, soil quality, slope of the plot, use of improved seed, amount of inorganic fertilizer,
application of compost, ploughing frequency, labour and oxen days. All significant variables
have the expected signs. Male headed households have 5 percent higher farm productivity than
female headed households. The result is consistent with literatures which deals with the existence
of gender variation in productivity (Pender and Gebremedhin, 2007) due to constraints related to
labor, resource endowment, access to information and cultural taboo.
According to our result, as age increases farm productivity decreases. This could be attributed to
the reason that getting older might pose disadvantages in agriculture because most of the work is
physically demanding and also because older household heads might be too conservative to try

58
new and more efficient techniques that could help to increase farm productivity. This result is
consistent with the findings of Gul Unal (2008) and Dong et al. (2010).
Despite the importance of education in increasing farm productivity (Alene and Manyong, 2007;
Gebremedhin et al., 2009), surprisingly its effect was negatively significant. This could be partly
attributed to the fact that educated farmers are involved in non-agricultural related activities (e.g.
kebele administration in this study context), which would consume much of their farming time.
However this is a tentative hypothesis to explain the unexpected result and needs further
empirical study.
Plot size is positively significant with farm productivity. An increase in plot size by one hectare
could increase yield by about 0.073 percent. This finding is consistent with earlier observations
by Sharma et al. (1999), Lundvall and Battese (2000), and Alvarez and Arias (2004), who have
all reported a positive relation between average land productivity and land size.
As expected, crop yield on fertile soil is higher due to the good quality advantage of such soils.
Ploughing frequency has also significant positive effect for farm productivity. Similarly
improved seed use increases productivity by 19 percent, indicating the relative importance of
promoting improved seed to increase crop productivity in Ethiopia. Application of compost
increases productivity by 13 percent. This reinforces the importance of soil fertility management
in the Ethiopian agriculture. An increase in fertilizer use by about 50 kg/ha increases yield by
about 7 percent6.
4.4.4 Propensity score matching results
As shown in Table 4.4, the propensity scores for each observation is calculated using logit model
to predict the conditional probability of participation in AE program. The empirical model for
AE participation correctly predicts 71 percent of the sample observations. The region of common
support for the distribution of estimated propensity scores of participants and non-participants
ranges between 0.014763 and 0.900497. Observations whose propensity score lies outside this
range are discarded. The distributions of the propensity scores are plotted in Figure 4.2.
6 Semi-elasticities are estimated using the following formula: [𝑒𝑥𝑝
(𝛽𝑗 ∆ 𝑋𝑗)
− 1] ∗ 100.

59
Figure 4.2: Propensity score distribution of matched samples
Most of the covariates in the logit model have the expected sign and comply with our previous
result. The estimation results indicate that participation in AE program is strongly associated
with the household’s demographic characteristics and resource endowment as well as
membership in farmers’ organization and involvement in kebele administration. This result
confirms again involvement in kebele administration, livestock ownership, and membership in
farmers’ organizations according to their importance order play a significant role on the
likelihood of participation in extension program. From this, it can be generalized that the current
agricultural extension program in Ethiopia is not targeting the majority poor. This finding is in
line with the work by Lefort (2010) who reported that wealthier farmers are forcibly enrolled in
the ruling party and appointed as model farmers who received privileged access to credit, state-
controlled agricultural inputs, and technical knowledge spread by development agents.
.2 .4 .6 .8 1Propensity Score
Untreated Treated

60
Table 4.4: Estimation of the propensity score (Dependent variable: AE participation 1/0)
Variables Coef. Std.err.
Age of HH(ln) -1.487*** 0.541
Education of HH 1.479*** 0.209
Owned livestock(ln) 2.582*** 0.272
Owned land 0.419** 0.156
Adult equivalent 0.302*** 0.108
Oxen days (ln) 0.745*** 0.181
Plot distance from extension
center(ln) -0.154 0.145
Kebele administration 2.987*** 0.526
Membership in farmers’
organizations 2.348*** 0.331
Sitedummy_Enerata(cf:Kebi) -0.009 0.259
Sitedummy_Wonka -0.068 0.243
Constant -3.820* 2.048
Observations 1,112
Pseudo R2 0.5354
*** p<0.01, ** p<0.05, *p<0.1
Source: Own survey, 2012
4.4.4.1 Average treatment effect on the treated
The PSM method is employed in estimating the impact of participation in agricultural extension
on farm productivity. The impacts are estimated using alternative estimators to ensure robustness.
As indicated in Table 4.5, all the matching estimators show that participation in agricultural
extension program has a positive and statistically significant effect on farm productivity. To
ensure the reliability of the estimated results, assessment on the overlap and unconfoundedness
assumptions are made.

61
Table 4.5: Estimating the ATT using different matching methods
Matching estimators Coefficient t-statistics
Kernel matching 0.203*** 4.738
Stratification matching 0.190*** 3.289
Radius matching 0.175*** 2.763
Nearest Neighbor matching 0.327*** 3.288
Note: Significance levels are based on bootstrapped standard errors with 50 replications.
*** p<0.01
Source: Own survey, 2012
4.4.4.2 Assessment on the overlap and unconfoundedness assumptions
To evaluate the overlap assumptions we checked whether the balancing requirements of PSM are
satisfied in our data. The balancing test in Table 4.6 indicates that the covariates of the two
matched groups are well balanced in contrast to the unmatched samples presented in Table 4.1.
All results of normalized differences between the two matched groups are small, suggesting that
the overlap assumption is reasonable. Imbens and Wooldridge (2009) consider a normalized
difference greater than 0.25 (in absolute value) to be substantial to detect any lack of overlap. In
addition as shown in Figure 4.2 the two groups have substantial overlap in their propensity score
distribution.
The placebo regression (Table A.1) were employed using age of spouse of the household head as
a dependent variable including AE participation and similar variables used in the estimation of
the propensity scores. The dependent variable is known a priori not to be caused by AE
participation. The result shows that AE participation does not have influence on the dependent
variable, suggesting that there are no significant omitted variables that affect the impact
estimates obtained by PSM method. Therefore, the unconfoundedness assumption about
‘selection on observables’ can be maintained and the causal interpretation of the results is
plausible.

62
Table 4.6: Balancing test of matched samples
Variable AE participants Non-participants Normalized
difference
(∆𝑥) Mean Standard
deviation
Mean Standard
deviation
Age of HH(ln) 3.823 0.258 3.823 0.206 0.00
Education of HH 0.451 0.498 0.377 0.487 0.07
Owned livestock(ln) 1.955 0.361 1.84 0.336 0.13
Owned land size 1.411 0.539 1.369 0.647 0.03
Adult equivalent 3.148 1.037 3.043 1.004 0.07
Oxen days (ln) 2.897 0.520 2.825 0.521 0.06
Plot distance from extension
center(ln)
3.426 0.654 3.354 0.721 0.05
Kebele administration 0.040 0.199 0.018 0.135 0.03
Membership in farmers’
organizations
0.977 0.148 0.918 0.275 0.07
Sitedummy_Enerata(cf:Kebi) 0.294 0.456 0.295 0.458 0.00
Sitedummy_Wonka 0.406 0.492 0.336 0.475 0.13
Source: Own survey, 2012
Generally, all the estimated results obtained from the different models confirm that AE
participation in the study area have increased farm productivity. However, the overall level of
farm productivity observed in this study for the three case study crops (teff, wheat and maize) is
still low compared to the target yield set by the regional extension program based on farmers’
field conditions and research stations (Table 4.7). For instance average teff yield observed form
extension participants (16 quintal/ha) is less by half from the extension targets (20-32 quintal/ha).
Similarly, the yield levels attained by participant farmers for wheat and maize were less by 1/3
from the set target for the corresponding crops (43-58 quintal/ha and 70-107 quintal/ha). Several
reasons could explain these discrepancies. Our field investigation and review of past researches
(Abate, 2007; Kasa, 2008) show that the extension implementation in Ethiopia is constrained by

63
a number of factors such as supply-push rather than demand-pull approach, poorly organized
technology multiplication system, absence of institutional pluralism, low technology adoption
rate, shortage of basic training for extension staff and farmers. For example in our study area,
average application of fertilizer, improved seed and compost users were 129 kg/ha, 42 percent
and 18 percent, respectively. Besides, credit users in the study area were only 16 percent,
influenced by the nature of credit arrangements that reduces the attractiveness of input uptake.
To be eligible, a farmer must have repaid all previous loans (Dercon, 2000). Inconvenient
payback time and lack of interest due to the tendency of farmers to avoid risk in instances of crop
failure are other factors for farmers’ low use of credit (Carlesson et al., 2005). Farmers who
participated in our group discussion explained lack of quality improved seed, high price of
fertilizers, limited technology choices and inconvenient loan system are the major constraints to
adopt improved technologies promoted by the extension program. This fact is also observed by
Byerlee et al. (2007) who concluded that some of the major factors affecting the results of the
intensification program are low technical efficiency in the use of fertilizer, poor performance of
the extension service, shortcomings in seed quality and timeliness of seed delivery, promotion of
regionally inefficient allocation of fertilizer, no emergence of private-sector retailers negatively
affected by the government’s input distribution tied to credit. Furthermore our focus group
discussion and field survey revealed that no single farmer has been visited by researchers
implying the missing link between research and extension.
Table 4.7: Comparative average yields (quintal/hectare) of the three main crops grown in the
study area
Type of crops Participants’
yield
Targeted yield on
farmers plot
Yield obtained from
research stations
Teff 16 20 32
Wheat 21 43 58
Maize 25 70 107
Note: Average yield obtained by participants is calculated from sample plots taken by this study. Average targeted
yield on farmers plot and yield obtained by research station is taken from a guideline compiled by Agriculture and
Rural Development Office of the Amhara National Regional state (2011).

64
4.5 Conclusions
This study evaluates the effect of agricultural extension program participation on farm
productivity using cross-sectional data collected in three kebeles from the Ethiopian highlands.
Even though the overall impact of extension program participation cannot be known for certain
because of the lack of reasonably accurate baseline data for comparison, this study employs a
bench mark OLS, treatment effect model and propensity score matching methods to mitigate
some of the challenges in the estimation of effect of agricultural extension participation on farm
productivity.
Our model estimations indicate the positive effect of extension participation on farm productivity.
However, in spite of its positive effect, our finding clearly shows the existence of selection bias
which tends to target relatively wealthier farm households and those affiliated to kebele
administration, which is not directly related to farm productivity. These make the effect of
agricultural extension program on farm productivity to be marginal. Furthermore, the program
has been constrained by insufficient and/or poor quality farm inputs, such as improved seeds, and
services like credit to buy inputs and training on how to implement the program. As a result, the
observed overall farm productivity is less by about half than the target set by the extension
program.
Therefore, in order to improve the benefits to be gained through agricultural extension program
participation, the following constraints need serious consideration. First, the extension program
should avoid entry barriers and this requires maintaining a clear boundary between the program
and the local politics which is lacking at the moment. Second, improved access to diversified and
quality agricultural inputs still remain critically important. Third, the local government should
create the necessary asset portfolio among the poor due to the fact that resource poor farmers in
Ethiopia lack the necessary means to implement extension advices.

65
Chapter 5
The effect of agricultural extension service on the technical efficiency of teff
(Eragrostis tef) producers in North West Ethiopia
5.1 Introduction
The government of Ethiopia has made substantial investments in agricultural research and
extension to increase agricultural production and productivity through new technologies.
However, despite considerable technological changes attempted through expansion of modern
agricultural inputs, agricultural production and productivity in the country remains low and
encounter substantial inefficiencies due to farmers’ high degree of unfamiliarity with new
technology coupled with poor extension, education, credit, and input supply system (Alene and
Zeller, 2005), as well as low technical efficiency in the use of modern inputs (Byerlee et al.,
2007). According to World Bank (2006), farmers are only achieving on average 60 percent of
their potential production, given current levels of input use. Since the introduction of new
technologies requires intensive management and information, farmers in developing countries
with low literacy rates, poor extension services and inadequate physical infrastructures have
great difficulty in adopting new technologies, let alone exploiting their full potentials (Alene and
Hassan, 2006). In Ethiopia, as stated above, measures have been taken to achieve high rate of
adoption of new technologies, while little or no attention has been given to the question of
whether there is appropriate application and efficient use of available resources and technologies.
Efficient utilization of resources is considered to be one of the most important issues in the
production process. In microeconomic theory efficiency is decomposed in to technical (the
subject of this chapter) and allocative efficiency. A producer is said to be technically efficient if
production occurs on the boundary of the producer’s production possibilities set, and technically
inefficient if production occurs on the interior of the production possibilities set. Therefore,
technical efficiency is the extent to which the maximum possible output is achieved from a given
combination of available inputs. Any deviation from the maximal output is typically considered
as technical inefficiency (Coelli et al., 2005). Hence, the presence of shortfalls in efficiency
means that output can be increased without requiring additional conventional inputs and need for
new technologies (Binam et al., 2004). If this is the case, then empirical measures of efficiency

66
are necessary in order to determine the magnitude of the gain that could be obtained by
improving performance in production with available resources.
Hence, the measurement of technical efficiency has relevance for policy intervention, especially,
in countries, like Ethiopia, where resources are meager and opportunities for developing and
adopting better technologies are scarce. However, studies that are systematically measuring
technical efficiency of farmers who are participants and non-participants of agricultural
extension (AE) program are scanty. Though previous studies by Seyoum et al. (1998); Khairo
and Battese (2005); Ayele et al. (2006); Alene and Hassan (2008); Thangata and Mequaninte
(2011) are available, they did not consider selection bias in agricultural extension participation.
This study makes an attempt to go one step further and compare the difference in technical
efficiency between the two groups that are similar in their observable covariates. Therefore, the
objective of this study is to measure the effects of extension services and other factors on
technical efficiency of teff producers and to identify determinant factors of inefficiency in three
selected kebeles (peasant associations) of North West Ethiopia.
This chapter used data obtained from 578 teff plots cultivated by 300 participant and non-
participant farm households of the extension program in Gozamin district, North Western
Ethiopia.
5.2 Motivation for efficiency analysis of teff production in Ethiopia
Teff, (Eragrostis tef) is the main Ethiopian cereal crop annually grown on 2.5 million ha, and
accounts for 30 percent of total acreage and 19 percent of gross cereal production (CSA, 2008).
The crop has both its origin and diversity in Ethiopia, and plays a vital role in the country’s
overall food security. The straw is an important cattle feed source, and the high market prices of
both its grains and the straw make it a highly valued cash crop for teff growing smallholder
farmers. Teff is a highly versatile crop with respect to adaptation to different agro-ecologies, with
reasonable resilience to both drought and waterlogging (Assefa et al., 2010). Scientific research
on teff began in the late 1950s and over the years a number of improved varieties and
management practices have been developed. Now a days it is one of the major cereal crops
which is promoted by the agricultural extension program in Ethiopia. It has its own
recommended rates of chemical fertilizer, seed and management practices (such as plouing

67
frequency, weed control, postharvest activities among others). However, there is little adoption
rate by farmers and have brought few impact on teff production (Assefa et al., 2011). In addition,
despite teff’s great significance to Ethiopians, its average yield has remained low (1.3 t/ha) and
supply has not kept pace with demand. Furthermore, growth in teff production has mainly come
from expanding the amount of land under cultivation (Agricultural Transformation Agency
[ATA], 2012), which is a limited resource in Ethiopia. Therefore, teff production growth through
land expansion would not be sustainable. Moreover, past studies on TE in Ethiopia were limited
to very few crops; it even did not take into account teff crop. Therefore, it’s important to study
technical efficiency level of teff producers and identify determinant factors of inefficiency to
understand by how much production can be grown through efficient utilization of available
technology and resources.
5.3 Empirical framework
Technical efficiency (TE) can be measured by using input or output-oriented approaches. The
input-oriented approach addresses the question “by how much can input quantities be
proportionally reduced without changing the output quantities produced?” The output-oriented
approach (which is the focus of this study, given we are considering developing country settings,
the concern is rather not inputs are over-used but output short-fall) addresses the question “by
how much can output be increased without increasing the amount of input use by utilizing the
given inputs more efficiently?” (Coelli et al., 2005).
Frontier techniques have been widely used in determining the farm-level efficiency in developing
countries’ agriculture since the publication of a seminal article of Farrell (1957) on efficiency
measurement and subsequent development of several approaches to efficiency and productivity
measurement. Among the different approaches followed to measure efficiency, the stochastic
frontier production function (SFPF) approach involving econometric estimation of parametric
function (Aigner et al. 1977; Meeusen and van den Broeck, 1977) and nonparametric
programming, known as data envelopment analysis (DEA), are the most popular. The stochastic
frontier is considered more appropriate for assessing TE in developing countries’ agriculture,
where the data are often heavily influenced by measurement errors and other stochastic factors
such as weather condition and others (Coelli et al., 2005; Dey et al., 2005).

68
With regard to the determinants of technical efficiency, there are two approaches to analyze.
Several efficiency measurement studies (Bravo-Ureta and Pinheiro, 1997; Nyemeck et al., 2003;
Nkamleu, 2004) have first estimated stochastic frontiers to predict farm-level efficiencies and
then regress these predicted efficiencies upon farm-specific variables in an attempt to explain
variations in output between firms in an industry. This is usually referred as a two-stage
procedure. However, several economists have criticized the two stage procedure (Battese et al.
1989; Reifschneider and Stevenson, 1991; Battese and Coelli, 1995) arguing that the
socioeconomic variables should be incorporated directly into the estimation of production
frontier model because such variables may have a direct influence on the production efficiency.
To overcome inconsistencies in the assumptions regarding the independence of inefficiency
effects Battese and Coelli (1995) and Coelli (1996) extended the stochastic production frontier
model by suggesting that inefficiency effects (𝑢𝑖 ) are expressed as an explicit function of a
vector of farm specific variables and a random error. The Battese and Coelli (1995) model allows
estimation of the farm specific efficiency scores and the factors explaining efficiency variations
among farmers in a single stage estimation procedure. This study applies this model.
5.3.1 Stochastic frontier production function
The Stochastic frontier model was first proposed by Aigner et al. (1977) and Meeusen and van
den Broeck (1977) independently to account for the presence of measurement errors and other
noise in the data, which are beyond the control of firms. The model decomposes the error term
into a two-sided random error that captures the random effects outside the control of the firm (the
decision making unit) and the one-sided efficiency component.
The stochastic frontier production function model is given by:
𝑌𝑖 = 𝑓(𝑥𝑖; 𝛽) exp(𝑣𝑖 − 𝑢𝑖) (5.1)
where Y is the quantity of output on the 𝑖th firm, x is a vector of inputs used, 𝛽 is a vector of
parameters, 𝑓(𝑥𝑖; 𝛽) is a suitable production function, v is a random error term assumed to be
independently and identically distributed as 𝑁(0, 𝜎𝑢2) , independent of u, which represents
technical inefficiency and is identically and independently distributed as truncated normal, with
truncation at zero of the normal distribution (Battese and Coelli, 1995). The maximum likelihood

69
estimation of Eq. (1) yields estimator for 𝛽 and 𝛾, where 𝛾 =𝜎𝑢
2
𝜎2 and 𝜎2 = 𝜎𝑢
2 + 𝜎𝑣2. The total
variation of output from the frontier, which is attributed to technical inefficiency, is given by
and has a value between zero and one.
Battese and Coelli (1995) proposed a model in which the technical inefficiency effects in a
stochastic production frontier are a function of other explanatory variables. In their model, the
technical inefficiency effects, u are obtained by truncation (at zero) of the normal distribution
with mean, 𝜇𝑖 and variance 𝜎𝑢2 , such that:
𝜇𝑖 = 𝑧𝑖𝛿 (5.2)
where 𝑧𝑖 is a vector of farm-specific explanatory variables and 𝛿 is a vector of unknown
coefficients of the farm-specific inefficiency variables.
5.3.2 Self-selection into agricultural extension program participation
When estimating a production frontier the underlying assumption is that all farmers in the sample
have access to the same production technology. But this study includes a sub-sample of farmers
participating in AE program who have information access and technical support from extension
workers. To account for differences in AE participation separate production frontiers are
estimated for each sub-sample of farmers by previous studies (Seyoum et al., 1998; Alene and
Hassan, 2006). These sub-samples, however, are unlikely to represent unbiased representations
of the population. If farmers choose to participate in the AE program based on their expected
performance, the two sub-samples will systematically differ with respect to certain farm and
household characteristics. As discussed in chapter 4, several factors determine the decision to
participate in extension program in the study area. These are age, education, livestock ownership,
adult equivalent, use of oxen power, membership in farmers’ organizations and involvement in
kebele administration among others. Details of how these factors determine extension
participation is found in chapter 4, section 4.3.2.
While these factors may influence the farmer’s propensity to participate in the program and they
are also likely to influence the farmer’s production performance. Consequently, if selection bias
is ignored in the estimation of separate production frontiers, coefficient estimates will be biased

70
(Heckman, 1979). A common approach to address selection bias is the two-step Heckman
procedure (e.g., Solis et al., 2007). However, this procedure is less suitable for nonlinear
functions such as the stochastic frontier. We therefore use matching techniques similar to those
of Mayen et al. (2010) and Rao et al. (2012) to compare the TE of AE participant farms with
similar non-participant farms. We employed a matching model known as propensity score
matching (Smith and Todd, 2005; Caliendo and Kopeinig, 2008). Details of the propensity score
matching method has already been discussed in chapter 4 section 4.3.3.
As explained in section 4.3.3, the main assumption of PSM is selection on observables, also
known as conditional independence or unconfoundedness assumption. Therefore, the
specification of the propensity score is crucial because the logit model results depend on the
unconfoundedness and overlap assumptions among others. Unconfoundedness assumption
implies that adjusting for differences in observed covariates removes bias in comparisons
between the two similar groups that only differs by AE participation. In other words, beyond the
observed covariates, there are no unobserved characteristics that are associated both with the
potential outcome and the treatment (Imbens and Wooldridge, 2009). Although
unconfoundedness is formally untestable, there are ways to assess its plausibility. To address the
unconfoundedness assumption different measures are taken by this study such as we included
many covariates in our propensity score specification to minimize omitted variables bias
following the suggestion in (Smith and Todd, 2005), then matching is implemented on the region
of common support (Heckman et al., 1997). In addition, we employed a placebo regression
(Imbens and Wooldridge, 2009) as a robustness check of the impact estimates to unobserved
selection bias. This approach was used by Abebaw and Haile (2013); and Cunguara and Moder,
(2011) to test unobserved bias. The overlap assumption implies that the conditional distributions
of the covariates of AE participants overlap completely with non-participants (Dehejia and
Wahba, 2002; Imbens and Wooldridge, 2009). There are two formal methods of testing the
overlap assumption. The first is to plot the distribution of the propensity scores of AE
participants and non-participants and visually assess whether the overlap assumption holds. The
second method is to compute normalized differences between the two groups (Imbens and
Woolridge, 2009).

71
5.4 Empirical models
In preliminary analysis, the trans-log stochastic production function was found to be an adequate
representation of the data, given the specifications of the Cobb-Douglass stochastic frontier
production function. The trans-log stochastic production functional form of equation (1) is given
by:
ln(𝑌𝑖𝑗) = 𝛽0 + 𝛽01(𝑆𝑇𝑖𝑗) + 𝛽1 ln(𝐿𝐷𝑖𝑗) + 𝛽2𝑙𝑛(𝐿𝑅𝑖𝑗) + 𝛽3𝑙𝑛(𝑂𝑋𝑖𝑗) + 𝛽4𝑙𝑛(𝑆𝐶𝑖𝑗) +
𝛽5𝑙𝑛(𝐹𝑇𝑖𝑗) + 𝛽12𝑙𝑛(𝐿𝐷𝑖𝑗) ln(𝐿𝑅𝑖𝑗) + 𝛽13 ln(𝐿𝐷𝑖𝑗) ln(𝑂𝑋𝑖𝑗) + 𝛽14 ln(𝐿𝐷𝑖𝑗) ln(𝑆𝐶𝑖𝑗) +
𝛽15 ln(𝐿𝐷𝑖𝑗) ln(𝐹𝑇𝑖𝑗) + 𝛽23 ln(𝐿𝑅𝑖𝑗) ln(𝑂𝑋𝑖𝑗) + 𝛽24 ln(𝐿𝑅𝑖𝑗) ln(𝑆𝐶𝑖𝑗) +
𝛽25 ln(𝐿𝑅𝑖𝑗) ln(𝐹𝑇𝑖𝑗) + 𝛽34 ln(𝑂𝑋𝑖𝑗) ln(𝑆𝐶𝑖𝑗) + 𝛽35 ln(𝑂𝑋𝑖𝑗) ln(𝐹𝑇𝑖𝑗) +
𝛽45 ln(𝑆𝐶𝑖𝑗) ln(𝐹𝑇𝑖𝑗) + 𝛽11 1 2⁄ [𝑙𝑛(𝐿𝐷𝑖𝑗)]2
+ 𝛽22 1 2⁄ [𝑙𝑛(𝐿𝑅𝑖𝑗)]2
+ 𝛽33 1 2⁄ [ln (𝑂𝑋𝑖𝑗)]2
+
𝛽44 1 2⁄ [ln (𝑆𝐶𝑖𝑗)]2
+ 𝛽55 1 2⁄ [ln (𝐹𝑇𝑖𝑗)]2
+ 𝑉𝑖𝑗 − 𝑈𝑖𝑗 (5.3)
where ln denotes natural logarithm and 𝑌𝑖𝑗 denotes the quantity of teff yield of the 𝑖th farmer on
the jth plot in kilograms per hectare; 𝑆𝑇𝑖𝑗 is Soil type dummy (1 = fertile, 0 = otherwise), 𝐿𝐷𝑖𝑗 is
land planted for teff production in hectares; 𝐿𝑅𝑖𝑗 is family and hired labor used for teff
production in person day/ha; 𝑂𝑋𝑖𝑗 is oxen labor used for teff production in oxen day/ha; 𝑆𝐶𝑖𝑗 is
the value of seed and agro-chemicals (pesticide, insecticide and herbicide) in Birr/ha and 𝐹𝑇𝑖𝑗 is
chemical fertilizer used for teff production in kg/ha. The quantity of fertilizer used on some plots
was zero, so we used the approach in Sherlund et al. (2002) and equated the natural logarithm of
zero to the logarithm of one-tenth of the smallest non-zero value in the sample (which turned out
to be 1 kilogram of fertilizer used on the plot). 𝛽0, 𝛽𝑖 are unknown parameters to be estimated. V
is the symmetric random variable associated with disturbances in production. U is a non-negative
random variable associated with technical inefficiency and is obtained by truncation (at zero) of
the normal distribution with mean 𝜇𝑖 and variance 𝜎𝑢2 , such that:
𝜇𝑖𝑗 = 𝛿0 + 𝛿1𝐴𝐺𝐸𝑖𝑗 + 𝛿2𝐴𝐷𝐸𝑄𝑖𝑗 + 𝛿3𝐸𝐷𝑈𝑖𝑗 + 𝛿4𝑇𝐿𝑈𝑖𝑗 + 𝛿5𝐿𝐷𝑖𝑗 + 𝛿6𝐶𝑅𝐷𝑖𝑗 + 𝛿7𝐴𝐸𝑖𝑗 +
𝛿8𝐶𝑂𝑃𝑖𝑗 + 𝛿9𝑆𝐸𝑇𝑖𝑗 (5.4)
where AGE is household head age in year; ADEQ is family size in adult equivalent scale; EDU
is education status of the household head (1 = educated, 0 = otherwise); TLU is livestock

72
ownership in Tropical Livestock Unit; LD is land planted for teff production in hectare; CRD is
use of credit the previous year (1 = yes, 0 = no); AE represents agricultural extension program
participation as dummy variable; COP is a dummy variable representing member ship in
cooperatives and SET refers seed type (1= improved, 0=otherwise). 𝛿𝑖𝑗′ 𝑠, are unknown
parameters to be estimated.
It should be noted that the above model for technical inefficiencies in equation (5.4) can only be
estimated if the technical inefficiency effects,𝑈𝑖 are stochastic and have particular distributional
properties (Coelli and Battese, 1996). These conditions lead to conduct different hypothesis test
using generalized likelihood- ratio statistic, λ, given by:
𝜆 = −2[ln{𝐿(𝐻0)} − ln{𝐿(𝐻1)}] 5.5)
where L(𝐻0 ) and L(𝐻1 ) denote the values of likelihood function under the null (𝐻0 ) and
alternative (𝐻1) hypotheses, respectively. Given the specifications of the stochastic production
frontier model in equations (5.3) and (5.4), the technical efficiency index is defined as the ratio
of observed output to the corresponding frontier output is given by:
𝑇𝐸𝑖𝑗 = exp(−𝑈𝑖𝑗) (5.6)
The prediction of technical efficiency is based on its conditional expectations, given the model
assumptions (Battese and Coelli, 1995). The parameters for the stochastic production function
model in equation (5.3) and those for technical inefficiency model in equation (5.4) are estimated
simultaneously using maximum-likelihood estimation of Frontier 4.1 program developed by
Coelli (1994), which estimates the variance parameter of the likelihood function in terms of
𝛾 =𝜎𝑢
2
𝜎2 and 𝜎2 = 𝜎𝑢2 + 𝜎𝑣
2.
Unlike Cobb Douglas stochastic frontier production function the coefficients of translog
production function does not have straight forward interpretation. Following Battese and Broca
(1997), the elasticity of output with respect to the kth inputs are computed as:

73
𝜕𝑙𝑛𝑌
𝜕𝑙𝑛𝑋𝑘= 𝛽𝑘 + 𝛽𝑘𝑘𝑙𝑛𝑋𝑘
+ ∑ 𝛽𝑘𝑗
𝑘
𝑗=1≠𝑘
𝑙𝑛𝑋𝑘𝑗 − 𝜃 (
𝜕𝜇
𝜕𝑋𝑘),
(5.7)
where 𝜇 is defined by equation (5.4) and 𝜃 is defined by:
𝜃 = 1 −1
𝜎{
∅ (𝜇𝜎 − 𝜎)
(𝜇𝜎 − 𝜎)
−∅ (
𝜇𝜎)
(𝜇𝜎)
}
(5.8)
where ∅ and represent the density and distribution functions of the standard normal random
variable, respectively. The last term in equation (5.7) excluded for all variables except land as it
also included in the inefficiency effects model. The elasticity of production with respect to land
has two components: the first component referred to as elasticity of frontier output and the
second referred to as elasticity of technical efficiency (Battese and Broca, 1997). The elasticities
are evaluated at the means of the natural logarithms of the inputs.
To address selection bias in AE program participation the following logit model is estimated to
obtain the propensity scores:
𝑝𝑟(𝐴𝐸 𝑝𝑎𝑟𝑡𝑖𝑐𝑖𝑝𝑎𝑡𝑖𝑜𝑛 = 1) = 𝑧𝑖𝛼 + 𝑒𝑖 (5.9)
where 𝑧𝑖 is a vector of farm and farmer characteristics (age, education, land size, livestock
ownership, family size, oxen power, distance from extension center, involvement in kebele
administration, member ship in cooperatives and location). 𝛼 is a vector of parameters to be
estimated. The propensity score of each farm is the estimated probability of being AE participant.
To address the overlap assumption the normalized difference (Imbens and Woolridge, 2009) is
given by:
∆𝑥 =
��1 − ��0
√𝜎12 + 𝜎0
2
(5.10)
Where 𝑥�� is the mean, and 𝜎𝑖2 is the sample variance.

74
5.5 Empirical results and discussions
5.5.1 Descriptive analysis of unmatched samples
Table 5.1: Descriptive statistics of variables included in the PSM analysis
Variables
Definition
Participants
(N=364)
Non-participants
(N=214)
P-
value Mean S.D Mean S.D
Age Age of the head in year 45.52 10.03 45.45 9.99 0.937
Education Education of the head(1 =
educated,0 = otherwise)
0.679 0.468 0.229 0.421 0.000
TLU Livestock ownership in Tropical
livestock Unit
8.822 3.59 4.45 2.18 0.000
Owned Land Total cultivated owned land in ha 1.532 0.591 1.06 0.582 0.000
Family size Family size in adult equivalent
scale
3.212 1.041 2.566 0.956 0.000
Oxen day Oxen labour used for teff
production in oxen day/ha)
100.33 51.76 84.81 37.19 0.000
pdadist Distance from Plot to extension
center(walking minute)
38.173 21.97 40.789 24.09 0.183
Kebele
adminstration
Involvement in kebele
administration work
0.398 0.490 0.014 0.117 0.000
Cooperatives Member in cooperatives(1 = yes,
0 = no)
0.953 0.211 0.588 0.493 0.000
Source: Own survey, 2012
As shown in Table 5.1 there is significant variation between AE participants and non-participants
in all household and farm related characteristics except age and distance from extension center.
Participants have higher mean value for education, livestock ownership, land size, family size,
oxen labor, involvement in kebele administration and membership in cooperatives. These
observable characteristics are used to estimate the propensity score of unmatched samples to
obtain comparable groups for frontier analysis.

75
5.5.2 Propensity score matching results
The logit estimates of the AE participation are presented in Table 5.2. The logit model has a
pseudo R2 value of 0.52 and correctly predicts 76 percent of AE participation. Several variables
are statistically significant and associated with AE participation. As expected education increases
the probability of joining the extension program. This result is consistent with the notion that
farmers with better human capital like education are among the early adopters (Gebreegziabher
et al., 2011; Giovanopoulou et al., 2011). As hypothesized, wealth indicator variables except
owned land size have significant effect on the probability of participation. One more tropical
livestock unit increases the probability of participation in the extension program by about 26
percent. Family size in adult equivalent scale also increases the likelihood of participation. This
is due to the labor intensive nature of Ethiopian agriculture. Hence, households who have large
number of family size in adult equivalent scale have high likelihood of participation in the
extension program.
Involvement in kebele administration has high coefficient value which affects the likelihood of
participation. This implies that being affiliated with kebele administration, which is a non-farm
related activity, increases significantly the likelihood of farmers to join the extension program.
This is due to lack of clear boundary between the extension program and the political
administration which often share common human and material resources. Hence, it is not
surprising that being in a position to involve in kebele administration increases the probability of
participation in government sponsored extension program. Membership in farmers’ organization
has also positive significance for the probability of participation in the extension program as
expected and consistent with past findings (Benin et al., 2011; Abebaw and Haile, 2013).
In order to improve the robustness of the estimate the matches are restricted to AE participant
and nonparticipant who have common support in the distribution of the propensity score. The
non-parametric kernel method is used to allow matching of AE participants with the whole
sample of non-participants, since the technique uses the whole sample of the comparison with
common support to construct a weighted average match for each treated sample (Heckman et al.,
1997 and 1998). That is, the entire sample of non-participants in the comparison group is used to
construct a weighted average match to each participant in the treatment group.

76
Table 5.2: Results of logistic regression on AE participation (1/0)
Variables Coef. Std.err.
Age (ln) -0.587 0.739
Education 1.651*** 0.296
TLU (ln) 2.624*** 0.388
Owned land -0.313 0.299
Family size 0.309** 0.151
Oxen days (ln) 0.735 0.497
Plot distance from extension
center -0.154 0.145
Kebele administration 2.646*** 0.685
Membership in Cooperatives 2.397*** 0.465
Sitedummy_Enerata(cf:Kebi) -0.140 0.379
Sitedummy_Wonka -0.324 0.323
Constant -3.058** 3.058
Observations 576
Pseudo R2 0.5219
Model prediction rate: 76%
Source: Own survey, 2012
5.5.3 Assessment on the overlap and unconfoundedness assumptions
To evaluate the overlap assumption we checked whether the balancing requirements of PSM are
satisfied in our data. The balancing test in Table 5.3 indicates that the covariates of the two
matched groups are well balanced in contrast to the unmatched samples presented in Table 5.1.
All results of normalized differences between the two matched groups are small, suggesting that
the overlap assumption is reasonable. Imbens and Wooldridge (2009) consider a normalized
difference greater than 0.25 (in absolute value) to be substantial to detect any lack of overlap.
Imbens and Wooldridge (2009) also argue that the assessment of the overlap assumption can be
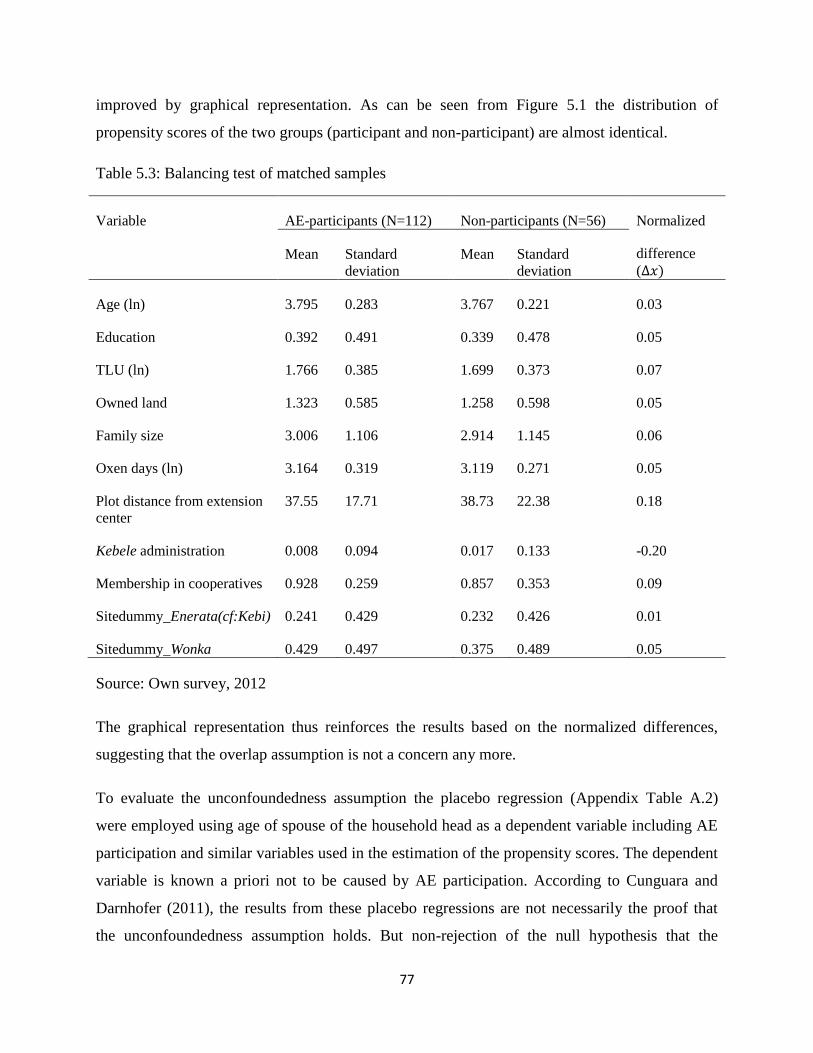
77
improved by graphical representation. As can be seen from Figure 5.1 the distribution of
propensity scores of the two groups (participant and non-participant) are almost identical.
Table 5.3: Balancing test of matched samples
Variable AE-participants (N=112) Non-participants (N=56) Normalized
difference
(∆𝑥) Mean Standard
deviation
Mean Standard
deviation
Age (ln) 3.795 0.283 3.767 0.221 0.03
Education 0.392 0.491 0.339 0.478 0.05
TLU (ln) 1.766 0.385 1.699 0.373 0.07
Owned land 1.323 0.585 1.258 0.598 0.05
Family size 3.006 1.106 2.914 1.145 0.06
Oxen days (ln) 3.164 0.319 3.119 0.271 0.05
Plot distance from extension
center
37.55 17.71 38.73 22.38 0.18
Kebele administration 0.008 0.094 0.017 0.133 -0.20
Membership in cooperatives 0.928 0.259 0.857 0.353 0.09
Sitedummy_Enerata(cf:Kebi) 0.241 0.429 0.232 0.426 0.01
Sitedummy_Wonka 0.429 0.497 0.375 0.489 0.05
Source: Own survey, 2012
The graphical representation thus reinforces the results based on the normalized differences,
suggesting that the overlap assumption is not a concern any more.
To evaluate the unconfoundedness assumption the placebo regression (Appendix Table A.2)
were employed using age of spouse of the household head as a dependent variable including AE
participation and similar variables used in the estimation of the propensity scores. The dependent
variable is known a priori not to be caused by AE participation. According to Cunguara and
Darnhofer (2011), the results from these placebo regressions are not necessarily the proof that
the unconfoundedness assumption holds. But non-rejection of the null hypothesis that the

78
coefficient on AE participation is zero suggests that there are no omitted variables correlated
with AE participation. The result shows that AE participation does not have influence on the
dependent variable, suggesting that there are no significant omitted variables. Therefore, the
unconfoundedness assumption about selection on observables can be maintained and the causal
interpretation of the results is plausible.
Figure 5.1: Propensity score distribution of matched samples
0 .2 .4 .6 .8Propensity Score
Untreated Treated

79
Table 5.4: Summary statistics of variables included in the efficiency analysis matched samples
Variables Definition Participants
(N=112)
Non-
participants
(N=56)
Dependent
variable: Yield
teff yield in kg/ha
Mean S.D Mean S.D
1558.9 568 1285.6 358.0
Input variables:
Soil type 1 = fertile, 0 = otherwise 0.25 0.434 0.23 0.426
Land land planted to teff production in ha 0.299 0.166 0.333 0.159
Labour labour used in person day/ha 125.6 69.86 106.4 33.37
Oxen day oxen labour used in oxen day/ha 100.1 53.84 80.19 28.88
Seed and agro-
chemicals
seed and agro-chemicals (pesticide
and herbicide) cost in birr/ha
355.2 112.1 327.1 91.29
Fertilizer chemical fertilizer used in kg/ha 140.0 93.95 85.51 43.44
Farm specific variables
Age Age of the head in year 46.24 12.68 45.27 10.51
Family size Family size in adult equivalent scale 3.001 1.105 2.915 1.144
Education Education of the head (1 = educated,
0 = otherwise)
0.392 0.491 0.339 0.478
TLU Livestock ownership in Tropical
livestock Unit
6.279 2.417 5.867 2.364
Plot size Land planted to teff production in ha 0.299 0.165 0.333 0.159
Credit Use of credit previous year (1 = yes,
0 = no)
0.232 0.426 0.196 0.399
AE participation 1 = participant 0 = non-participant 1 0 0 0
Cooperatives Member in cooperatives(1 = yes, 0 =
no)
0.928 0.259 0.857 0.353
Seed type 1 = improved seed, 0 = local seed 0.205 0.405 0.136 0.277
Source: Own survey, 2012

80
5.5.4 Parametric estimate of stochastic frontier production function
In our preliminary analysis we estimate two different models. In the first we assume that both
participants and non-participants have the same production technology. The second assumption
is both groups have different production technology. Using the model that allows for different
technologies (estimating a frontier with the AE participation dummy and the interaction terms
with all the inputs), we test the null hypothesis that all these coefficients are jointly equal to zero.
The result from F-stat’s P-value = 0.4153, indicates we cannot reject the null hypothesis that
implies the two groups use same production technology. Hence the following frontier analysis
result is based on same production technology assumption.
The maximum-likelihood estimates of the parameters of the translog stochastic frontier and
inefficiency models based on PSM subsample are presented in Table 5.5. The functional
specification is tested first. The choice of the empirical frontier production function was made
based on the generalized likelihood ratio test (Coelli and Battese, 1996). The null hypothesis that
the Cobb-Douglas model is appropriate representation of the data was strongly rejected (Table
5.6).
Table 5.5: Maximum likelihood estimates of the translog stochastic frontier and inefficiency
model
Variables Parameters ML
estimate
t-value Elasticity
of output
t-value
Stochastic frontier
Constant 𝛽0 26.598 3.170***
Soil type (dummy) 𝛽01 0.199 4.226***
ln(Land) 𝛽1 -4.102 -2.025** 0.144 2.115**
ln(Labour) 𝛽2 -1.795 -0.628 0.236 1.99*
ln(Oxen day) 𝛽3 -2.101 -0.723 0.343 3.190***
ln(Seed and agro-chemicals) 𝛽4 -5.421 -2.366** 0.122 1.853*
ln (Fertilizer) 𝛽5 0.621 1.451 0.066 3.621***
ln(Land)x ln(Labour) 𝛽12 0.709 2.175**

81
ln(Land)x ln(Oxen day) 𝛽13 -0.096 -0.297
ln(Land)x ln(Seed and agro-
chemicals) 𝛽14 0.380 1.319
ln(Land)x ln (Fertilizer) 𝛽15 -0.101 -0.996
ln(Labour)x ln(Oxen day) 𝛽23 0.043 -0.076
ln(Labour)x ln(Seed and agro-
chemicals) 𝛽24 0.222 0.488
ln(Labour)x ln (Fertilizer) 𝛽25 -0.127 -1.553
ln(Oxen day)x ln(Seed and agro-
chemicals) 𝛽34 0.523 1.113
ln(Oxen day)x ln (Fertilizer) 𝛽35 -0.087 -0.917
ln(Seed and agro-chemicals)x ln
(Fertilizer) 𝛽45 -0.004 -0.043
ln(Land)x ln(Land) 𝛽11 0.161 0.949
ln(Labour)x ln(Labour) 𝛽22 0.203 0.609
ln(Oxen day)x ln(Oxen day) 𝛽33 -0.056 -0.209
ln(Seed and agro-chemicals)x
ln(Seed and agro-chemicals) 𝛽44 0.220 1.171
ln (Fertilizer)x ln (Fertilizer) 𝛽55 0.053 4.927***
Inefficiency model
Constant 0 0.464 2.299**
Age 1 0.004 1.214
Family size 2 0.032 1.097
Education 3 -0.088 -1.018
TLU 4 -0.039 -2.519**
Plot size 5 -0.419 -1.081
Credit 6 -0.242 -2.535**
AE participation 8 -0.048 -0.708

82
Membership in cooperatives 9 -0.011 -0.103
Seed type 10 -0.239 -1.98*
Variance parameters
Sigma-square 𝜎2 0.063 4.266***
Gamma 𝛾 0.881 8.715***
Ln likelihood 27.896
Source: Own computation
Therefore, the trans-log stochastic frontier and inefficiency model is more suitable to the farm
survey data that adequately captures the production behavior of teff producer farmers in the study
area. As expected, the frontier output elasticities (the percentage change in output divided by the
percentage change of an input) of land, labor, oxen, seed and agrochemicals and fertilizer, are
positive and significant. The dummy variable soil type has also positive and significant effect on
teff production.
5.5.4.1. Factors influencing technical efficiency
The estimated coefficients of the explanatory variables in the model for technical inefficiency
effects are of particular interest of this study and have important implications. The values for the
parameters 𝜎2 and 𝛾 are reported at the end of Table 5.5. The parameter 𝛾 is statistically
significant at the 1 percent level, with an estimated value of 0.88. These results indicate that
inefficiency is highly significant among the studied farms. On top of that, the value of gamma (γ)
indicates that there is 88 percent variation in output due to technical inefficiency. Furthermore,
the null hypothesis 𝐻0: 𝛾 = 0 , tests whether the traditional average production function is
appropriate as opposed to a frontier production function. As shown in Table 5.6, the test result
revealed that the traditional response function is not an adequate representation of teff production
in the study area, given the specifications of the translog stochastic frontier and inefficiency
model. In other words, the result confirms that inefficiency exist and is indeed stochastic. The
hypothesis that the explanatory variables in the model for the technical inefficiency effects have
zero coefficients 𝐻0 = 𝛿1 = 𝛿2 == 𝛿10 = 0 is rejected. This implies that joint estimation of the
explanatory variables have a significant impact on technical efficiency.

83
Since the dependent variable of the inefficiency model, Equation 5.4, is defined in terms of
technical inefficiency, a farm-specific variable associated with the negative (positive) coefficient
will have a positive (negative) impact on technical efficiency. The results of the study in Table
5.5 indicate that, livestock ownership (TLU), credit and seed type are significant factors and have
positive impact on technical efficiency (negative impact on technical inefficiency), while age of
the head, family size, education, plot size, AE participation and member ship in cooperatives do
not have significant effect in reducing technical inefficiency.
The variable (TLU) has a positive and significant effect on technical efficiency in teff production.
Livestock holding is a proxy for liquidity or access to cash. It is obvious that the crop husbandry
is highly supplemented and complemented by the animal husbandry. It has systematic effect on
efficiency i.e., the farmer who possesses more number of livestock will have more money to
purchase agricultural inputs, and again used for draft power especially teff production in Ethiopia
needs intensive draft power from land preparation to post harvest and timely transportation of the
yield. The result is in agreement with Ahmed et al. (2002); Alene and Manyong (2006); Alemu
et al. (2009) who found a positive and significant effect of livestock ownership on technical
efficiency.
Credit has a significant inefficiency reducing effect on technical efficiency. This implies that
access to credit in cash and/or in kind is likely to enhance the technical efficiency of teff
producer farmers in the study area through the alleviation of capital constraints and thus enables
farmers to make timely purchases of inputs that they cannot afford from their own resources. In
the study area, credit is used for purchase of oxen and agricultural inputs. Our result is in
agreement with Binam et al., (2004); Alene and Hassan (2008); Assefa (2011); who found the
inefficiency reducing effect of credit on technical efficiency.
Use of improved seed has a significant inefficiency reducing effect. Farms with improved seed
are more efficient than farms using local seeds. The popular teff variety in general in Ethiopia
and particularly in the study area is called Quncho. According to Assefa et al., (2011) and Fufa et
al., (2011) Quncho was developed from an intra-specific hybridization between two improved
pure line selection varieties (DZ-01-974 and DZ-01-196). However, the role of improved teff
seed is not overemphasized due to shortcomings in seed quality and timeliness of delivery that

84
have been longstanding issues in Ethiopia (spileman, 2011). According to DSA (2006) poor
cleaning, broken seed, low germination rates and the presence of mixed seeds have been reported
in supplied seeds. This fact is also confirmed during our discussion with farmers and extension
workers.
Although insignificant, the influence of AE participation which is the main point of this study on
technical efficiency tends to be positive. The insignificant positive effect of AE participation on
technical efficiency might be due to poor performance in the operation of extension systems and
information delivery systems. Our field investigation and review of past researches (Abate, 2007;
Kasa, 2008) show that the extension implementation in Ethiopia is constrained by a number of
factors such as supply-push rather than demand-pull approach, poorly organized technology
multiplication system, absence of institutional pluralism, low technology adoption rate, shortage
of basic training for extension staff and mainly the tendency of many extension stakeholders
dealing with the transmission of knowledge to conduct their assignment in a top-down manner.
Often, the information conveyed is presented as a technological package comprising
recommended practices. This is perceived as a less effective method for improving knowledge
and skill. In this case, more participatory approaches are suggested to extend science-based
knowledge and practices (Braun et al., 2002). The empirical evidence regarding the influence of
the Ethiopian agricultural extension service on technical efficiency is mixed.
Table 5.6: Generalized Likelihood Ratio (LR) tests of hypotheses involving the parameters of the
stochastic frontier and inefficiency model
Null hypothesis LR statistics () Critical value (x2) Decision
𝐻0: 𝛽𝑘𝑗 = 0 (Cobb-Douglas) 53.64 24.99 Reject 𝐻0
𝐻0: = 0(tradional production
function)
40.79 2.71 Reject 𝐻0
𝐻0: 𝛿1 = 𝛿2 == 𝛿10 = 0 31.09 18.31 Reject 𝐻0
Source: Own computation
For instance, Seyoum et al. (1998) and Khairo and Battese (2005) found a positive significant
effect of agricultural extension service on technical efficiency of maize producers. On the other
hand other studies conducted in Ethiopia by Alene and Hassan (2008) and Alemu et al., (2009)

85
reported that agricultural extension participation has no effect on technical efficiency, which is
consistent with our result.
5.5.4.2 Technical efficiency distribution
Frequency distributions of the TE estimates are presented in Table 5.7. Estimated TE scores
revealed that nearly 22 percent of the farms achieved efficiency from 81 to 90 percent, nearly 11
percent from 91 to 100 percent and the rest below these ranges with the mean efficiency of all the
farms about 72 percent. This means that farms are performing on average 28 percent below their
potential level. With little changes in the production process like better use and allocation of
resources, efficient farm management practices and farming decisions, TE and hence the
production level of the farms could be increased by around 28 percent.
Table 5.7: Technical efficiency distribution of AE participant and non-participant teff producer
farms
Efficiency
score
AE participants Non-participants All
Number Percent Number Percent Number Percent
<50 8 7.14 5 8.93 13 7.74
51-60 17 15.18 9 16.08 26 15.48
61-70 28 25 11 19.64 39 23.21
71-80 20 17.86 14 25 34 20.23
81-90 24 21.43 13 23.21 37 22.02
91-100 15 13.39 5 8.93 20 11.91
Mean 72.29 71.44 72.00
Minimum 33.09 35.01 33.09
Maximum 95.98 95.87 95.98
Source: Own computation
Since most of the farms are operating below the frontier level there is ample space for teff output
growth through full improvements in TE.

86
On the other hand, the mean TE estimates for AE participant and non-participant teff producer
farms are almost similar. AE participant farms have an average TE of 72.29 percent and the
corresponding measure for non-participants is 71.44 percent. The participants and non-
participants can gain, respectively, an average teff output growth of 27.71 percent and 28.56
percent through full improvements in TE. Most (25 percent) of AE participant farms have TE
score between 61 to 70 percent whereas 25 percent of non-participant farms have TE ranging
between 71 to 80 percent.
5.6 Conclusions
This chapter employed propensity score matching technique that accounts for endogenity of
agricultural extension participation to estimate technical efficiency of two types of farmers,
participants and non-participants of agricultural extension program in Gozamin district, north
western highlands of Ethiopia. Since teff is the main staple food in Ethiopia, high productivity
and efficiency in its production are crucial to food security in the country. However, teff
production under improved technology encounters substantial inefficiencies.
The econometric results based on the stochastic production function indicate that the mean
technical efficiency estimates for AE participant and non-participant teff producer farms are
almost similar i.e., 72.29 percent and 71.44 percent respectively. Therefore, AE participation has
had no positive significant influence on technical efficiency of teff producer farms. Moreover,
both groups of farms have considerable overall technical inefficiencies suggesting the existence
of immense potentials for enhancing production through improvements in efficiency with
available technology and resources. An investigation of the influence of household and farm
specific factors on efficiency revealed that livestock ownership (TLU), credit and improved seed
are positively influence technical efficiency.
Despite the long history of government investment in the agricultural sector through extension
service and promotion of new technology, smallholders’ teff production remains technically
inefficient. Therefore, based on the results of this study the following points are suggested to
enhance teff production via improvement in efficiency. First there is a need for providing
extension services with respect to technical skill and farm management capacity of the farmers.
Besides demand driven livestock extension service are needed to enhance the complementary

87
role of livestock production in minimizing liquidity constraints of farmers. Second greater access
to credit service for farmers are needed to enhance their financial capacity which leads them to
adopt improved technologies as well as practices that will ultimately increase their efficiency in
farm production. Third, increasing the availability, quality and adoption of improved seed is
required.
88
Chapter 6
Gender roles in agriculture and its implication for agricultural extension: a
case study in North West Ethiopia
6.1 Introduction
Empowering poor and vulnerable household groups in a fundamental manner, as opposed to
providing them with transitory support, has been increasingly sought as a way of ensuring their
effective participation in the development process (Barrett et al., 2006). A critical aspect of
promoting gender equality is the empowerment of women. Gender equality is an essential
component for sustainable economic growth and poverty reduction (FAO, 2010). As a result
several literatures have alerted development practitioners to give emphasis for gender-specific
constraints faced by poor female farmers (Quisumbing and Pandolfelli, 2010; Ragasa et al., 2012;
Kiptot and Franzel, 2012).
In many parts of the world and especially in developing countries females are the main farmers
or producers who are actively involved in agriculture (FAO, 2009; Rahman et al., 2007).
According to FAO (2011), females comprise, on average, 43 percent of the agricultural labor
force in developing countries, ranging from 20 percent in Latin America to 50 percent in Eastern
Asia and Sub-Saharan Africa. The same report argues that reducing gender inequalities in access
to productive resources and services could produce an increase in yields on female’s farms of
between 20 percent and 30 percent, which could raise agricultural output in developing countries
by 2.5 percent to 4 percent. Realizing these gains requires male and female farmers to have
access to information and assistance. But despite of female farmers’ role in agricultural
production, their roles remain largely unrecognized and they have been virtually ignored by
agricultural intervention programs (World Bank, 2010). Failure to recognize the different roles of
males and females is costly because it results in misguided projects and programs, forgone
agricultural output and incomes, and food and nutrition insecurity (FAO, 2010).
Globally, rural females, especially those from poor households, face a particular burden. This
fact is also common phenomenon in Ethiopia. Even though gender division of labour in rural
Ethiopia varies in terms of farming systems, cultural settings, location and the different wealth
categories (Abera et al., 2006), female farmers perform up to 75 percent of farm labor,

89
representing 70 percent of household food production in Ethiopia (USAID, 2013), contribute
more than their male counterparts in crop production and management in Ambo district (Ogato et
al., 2009).
However, in spite of the many farming activities they perform (EEA/EEPRI, 2006; Kassa, 2008),
they are not fully perceived as farmers and agricultural decision makers. Traditionally, the
farming systems research and extension approach has obscured the complexity of female’s
position in regard to household labor requirements (Frank, 1999). Furthermore, the community
consider farming as inappropriate activity and physically demanding for females. When females
do participate in extension activities they may not be provided equal recognition for their
responsibilities and skills. This is because farmers and farming activities continue to be
perceived as “male” by planners and agricultural service deliverers, thereby ignoring the
important and increasing role females play in agriculture. Moreover, technology packages
delivered by extension services sometimes reinforce stereotypic divisions of labor (Manfre et al.,
2013). For instance Ethiopia’s Women’s Development and Change extension package provides
advice related to horticultural production, raising of poultry and small ruminants on the basis of
the assumption that female do not farm but garden (World Bank, 2010; Cohen and Lemma,
2011).
In contrast to the national policy and Ethiopian government ideology that strongly promote
gender equality in all aspects of life, the top-down approach, the perception that “females are not
farmers” and the focus on getting model farmers to adopt fixed-technology packages (World
Bank, 2010) and serious selection bias during placement of program participants (Elias et al.,
2013), the agricultural extension program tends to neglect poor farmers in general and females in
particular (Ogato et al., 2009; Umeta, 2013). Although gender training and mainstreaming take
place in some areas, women focused extension approaches are limited, and gender considerations
are missing at all levels (Buchy and Basaznew, 2005). Furthermore, the development and
dissemination of agricultural innovations rarely take gender-specific characteristics and
requirements into account (Action Aid and CARE, 2012).
The PASDEP (Plan for Accelerated and Sustained Development to End Poverty) annual progress
report 2007/8 states that PASDEP aims to reach all female headed households and 30 percent of

90
married females in agricultural extension programs. However, according to the GTP document of
the Ethiopian government, increasing extension service to female farmers in rural areas remains
challenging.
As stated above many research studies had been designed to investigate the rural females’
involvement in agriculture but there is still inadequate database on 'what kind of farm activities
females do’ in different regions of Ethiopia especially for female headed households. To
integrate females in any agricultural development project's design and implementation as well as
to understand how interventions can be best be targeted, it is essential to have a complete
knowledge of 'what females do' in a specific location and cultural setting. Because extension
service demands are location specific, flexible and often quick decisions and actions. Therefore,
the purpose of this study is to analyze the gender division of labor in agricultural production in
Amhara region, Gozamin district and to understand the level of female headed households’
participation in the current agricultural extension program–PADETES.
6.2 Empirical methods
Data collected from 300 (225 male head and 75 female head farm households) are used for the
analysis. The extent of gender role in agricultural activities were measured by using a three point
continuum namely ‘Always’, ‘Sometimes’ and ‘Not at all’. Descriptive statistics, t test and chi-
square tests are used to understand the variation in gender division of labour in agriculture,
female headed households' participation in agricultural extension program as well as their access
to and use of resources. The rank orders of constraints that inhibit female headed households’
access to extension service are identified through calculating score values of the constraints. The
constraint list included nine items and among these, the constraints given by the respondents as
first constraint has given nine points and the last constraint has one point. And then, by adding
up all values, the score value of each constraint is identified and the constraint that got the
highest score value is taken as the most important constraint.
6.3 Results and discussion
6.3.1 Demographic characteristics by gender of household head
Using simple mean comparison tests (Table 6.1), female heads differ significantly from their
male headed counterparts across a number of dimensions. Female heads are on average less

91
educated than male heads. The gender disparity in schooling is not limited to the education of the
head but is also true for the household at large. Female headed households also tend to be smaller,
family size and labour force in terms of adult equivalent scale. Household size is proportional to
the amount of labor resources the household controls in a rural area because many farm
operations (especially oxen ploughing) require intensive labor. Hence, with respect to labor
endowments female headed households are at a disadvantaged position.
Table 6.1: Mean difference test of demographic characteristics, access to human, physical,
capital and social resources by gender of household head
Resources Mean Std.dev P-value
Male Female Male Female
Age of head 45.3 46.7 10.8 7.54 NS
Education of head
(1=literate)
0.51 0.18 0.50 0.39 ***
Number of educated
family members
3.89 2.11 1.76 0.97 ***
Family size 5.97 4.09 1.81 1.41 ***
Active family labour in
adult equivalent
3.03 2.42 1.01 1.03 ***
Land size in hectar 1.44 0.89 0.64 0.37 ***
Livestock ownership in
TLU
7.54 3.54 3.82 1.71 ***
Credit (1= Yes) 0.15 0.01 0.27 0.11 ***
Training (1= Yes) 0.80 0.32 0.40 0.46 ***
Leadership position (1=
Yes)
0.27 0.01 0.44 0.11 ***
Membership in
cooperatives
0.87 0.38 0.02 0.06 ***
Notes: *** and NS represent statistical significance at 1 percent and non-significance respectively
Source: Own survey, 2012

92
Female headed households are also worse off compared to their male counterparts in terms of
land and asset ownership. Male headed households own 1.4 hectares of land, on average,
compared to 0.89 hectares for female headed households. Male headed households also have an
average of 7.5 TLUs, which is significantly different from female headed households’ holdings
of 3.5 TLUs. In terms of capital and social resources, men heads, on average, have better access
to credit, higher leadership position and member ship in cooperatives than female heads. All
these indicate the disadvantaged position of female headed households’ in terms of human,
physical, capital and social resources.
6.3.2 Gender division of labor in crop and livestock production
As shown in Table 6.2 about 92 percent of male heads and about 82 percent of female heads,
except for oxen ploughing for females, are engaged in crop production and related management
activities. In the study area like male farmers who involved in all aspects of agricultural activities,
majority of the rural female heads do manual ploughing, planting, weeding, harvesting, threshing,
production transport, production storage and marketing. This fact is also observed by Ogato
(2009), World Bank (2010) and USAID (2013) that state females are intimately involved in all
aspects of agricultural production process. Unlike other activities their involvement in fertilizer
and pesticide application is low. Mainly these two activities are undertaken by their sons’ or
relatives and/or they are not using inputs at all.
Regarding the gender division of labour in livestock production (Table 6.3), about 71 percent of
female heads are engaged in livestock production and related management activities whereas
male heads involvement is only 36 percent. Pen cleaning, dung processing, feeding, poultry
production, forage preparation as well as milking and milk processing are among the main
activities performed by females. Majority of males are mainly involved in pen construction,
herding, livestock selling, feeding and forage preparation respectively.

93
Table 6.2: Gender role for crop production in the three rural villages (Kebele’s) during the main
agricultural season
Activities Frequency of doing crop production activities
Always Sometimes Not at all
Male Female Male Female Male Female
Number
(percent)
Number
(percent)
Number
(percent)
Number
(percent)
Number
(percent)
Number
(percent)
Oxen ploughing 222 (98.7) 0 (0.0) 3 (1.33) 0 (0.0) 0 (0.0) 75 (100.0)
Manual ploughing 175 (77.8) 69 (92.0) 37 (16.4) 3 (4.0) 13 (5.8) 3 (4.0)
Planting 223 (99.1) 75 (100.0) 0 (0.0) 0 (0.0) 2 (0.9) 0 (0.0)
Weeding 222 (98.7) 74 (98.7) 0 (0.0) 0 (0.0) 3 (1.3) 1 (1.3)
Fertilizer application 150 (66.7) 25 (33.3) 72 (32.0) 25 (33.3) 3(1.3) 25 (33.3)
Pesticide application 102 (45.3) 20 (26.7) 52 (23.1) 5 (6.7) 71 (31.6) 50 (66.7)
Harvesting 223 (99.1) 74 (98.7) 1 (0.44) 0 (0.0) 1 (0.4) 1 (1.3)
Threshing 222 (98.7) 67 (89.3) 1 (0.44) 5 (6.7) 2 (0.89) 3 (4.0)
Production transport by cart 218 (96.9) 38 (50.7) 5 (2.22) 32 (42.7) 2 (0.89) 5 (6.7)
Manual production transport 140 (62.2) 72 (96.0) 39 (17.3) 0 (0.0) 46 (20.4) 3 (4.0)
Production storage 140 (62.2) 75 (100.0) 45 (20.0) 0 (0.0) 40 (17.9) 0 (0.0)
Production market 195 (86.7) 75 (100.0) 0 (0.0) 0 (0.0) 30(13.3) 0 (0.0)
Total 186 (82.7) 55 (73.9) 21 (9.4) 5.8 (7.7) 17.8 (7.9) 13.8(18.4)
Source- Survey data, 2012

94
Table 6.3: Gender role for livestock production in the three rural villages (Kebele’s)
Activities Frequency of doing livestock production activities
Always Sometimes Not at all
Male Female Male Female Male Female
Number
(percent)
Number
(percent)
Number
(percent)
Number
(percent)
Number
(percent)
Number
(percent)
Livestock pen
construction
199 (88.4) 16 (21.3) 20 (8.9) 9 (12.0) 6 (2.7) 50 (66.7)
Livestock feeding 120 (53.3) 64 (85.3) 15 (6.7) 3 (4.0) 90 (40.0) 8 (10.7)
Pen cleaning 11 (4.9) 71 (94.7) 0 (0.0) 0 (0.0) 214 (95.1) 4 (5.3)
Dung processing 5 (2.2) 71 (94.7) 0 (0.0) 0 (0.0) 220 (97.8) 4 (5.3)
Milking and milk
processing
23 (10.2) 44 (58.7) 12 (5.3) 19 (25.3) 190 (84.4) 12 (16.0)
Livestock selling 131 (58.2) 55 (73.3) 0 (0.0) 5 (6.7) 94 (41.8) 15 (20.0)
Herding 138 (61.3) 0 (0.0) 17 (7.6) 52 (69.3) 70 (31.1) 23 (30.7)
Forage preparation 70 (31.1) 48 (64.0) 23 (10.2) 0 (0.0) 132 (58.7) 27 (36.0)
Poultry production 12 (5.3) 49 (65.3) 0 (0.0) 20 (26.7) 213 (94.7) 6 (8.0)
Fattening 18 (8.0) 5 (6.7) 0 (0.0) 0 (0.0) 207 (92.0) 70 (93.3)
Total 72.7(32.3) 42.3(56.4) 8.7(3.9) 10.8(14.4) 143.6(63.8) 21.9(29.2)
Source: Survey data, 2012
6.3.3 Crop types grown by male and female headed households
Males are often viewed as being responsible for producing cash crops, while females are viewed
responsible for producing subsistence crops for home consumption (Doss, 2002, World Bank,
2010). As a result technology packages delivered by extension services sometimes reinforce
stereotypic divisions of labor (Manfre et al., 2013). However, the data presented in this study
(Figure 6.1) revealed that substantial number of female farmers grow almost similar types of
crops dominantly grown in the area such as teff, maize, wheat, barley, vegetables etc with their

95
male counterparts and there are no crops that are grown exclusively by either male or female in
the study area, implying that we cannot divide crops in to those grown by male and those grown
by female at least in the study area.
Figure 6.1: Crops grown by male and female head households
6.3.4 Gender-labor time budget analysis in domestic and farm activities
The time budget analysis (Table 6.4) indicates that females spent about 50 percent more time for
domestic and farm activities compared to males. Gender differences become clearer when
looking at female’s workloads. Cooking and related activities (cleaning, child care, etc.), fire
wood collection and fetching water are among the domestic activities they mainly perform. They
also play significant role on farm work, poultry and livestock as well as vegetable gardening.
0
50
100
150
200
250
300
350
400
450
500
Bar
ely
Be
ans
Ch
ick
pe
as
Engd
o
Lup
in
Lin
seed
Mai
ze
Neu
g
Oat
s
Pe
as
Teff
Ve
geta
ble
s
Ve
tch
Wh
eat
Nu
mb
er
of
plo
ts
Type of crops
Plots managed by men heads
Plots managed by womenheads
Women heads' Plots undershare cropping

96
Table 6.4: Time budget analysis for gender division of labor (hrs/day) in the main agricultural
season
Activities Male heads Female heads
Cooking & related works (cleaning, childcare…) 0.005 5.893
Fetching water 0.020 0.885
Fire wood collection 0.247 0.952
Vegetable gardening 0.384 0.798
Poultry and livestock related works 0.398 0.870
On farm work 9.116 5.840
Total 10.17 15.24
Source- Survey data, 2012
6.3.5 Gender dimension in agricultural extension services
As stated above female farmers are actively engaged in agricultural production and management
activities. However, irrespective of their role, the extension service remains dominated by males.
Male heads are more likely receive advice from development or extension agents than female
heads. As shown in Table 6.5, from the total farm households (2077 [298 female heads plus 1779
male heads]) living in the three villages, only 15.8 percent of female headed farm households are
users of the extension service whereas male headed farm households’ extension service users
account for the lion share (70.7 percent). The result is consistent with other studies that observed
access to extension services is lower for females as compared with males (Kassa, 2008; World
Bank, 2010; Ragasa, 2012; Birhane, 2013).
6.3.6 Constraints to access agricultural extension service for female headed households
In this section the first five most important constraints are discussed. During data pretesting one
of the variable we used as a constraint was ‘cultural (society) influence’. However most of the
respondents clearly explained the influence is directly reflected by extension workers not by
other members of the society. But it does not mean that there is no cultural influence at all as far
as extension workers are part of the society rather we used the variable agricultural extension
workers attitude because it is specifically related to our subject of study.

97
Table 6.5: Distribution of farmers according to their agricultural extension participation level in
2012
Participation level Village 1(Enerata) Village 2 (Wonka) Village 3(Kebi)
Male Female Male Female Male Female
Model farmers 146 1 75 1 42 0
Copy (follower) farmers 548 27 169 8 279 10
Traditional farmers 229 64 252 157 39 30
Total 923 92 496 166 360 40
Source- Extension workers documented report, 2012
As shown in Table 6.6, agricultural extension workers attitude towards female farmers ranked as
first constraint to access agricultural extension service. Farmers who participated in our focus
group discussion explained that most of the time extension workers are not motivated to work
with female farmers due to the low recognition towards female’s agricultural responsibility, skill
and their limited productive assets. More importantly based on discussion with extension
workers, they prefer to do with farmers who have better resource endowments that enable them
to adopt the technology packages; just to skip the criteria used to evaluate the performance of
extension workers i.e., the number of farmers adopting the technology packages in their mandate
area. This fact is well observed by Kassa and Degnet (2004) and Lemma (2007) that quotas (the
minimum number of farmers who should take up the technology packages) are imposed on
extension agents. As a result, extension agents use whatever means available to persuade farmers
who are able to adopt the packages to take part in PADETES and thereby meet their quotas. In
addition, Tewedaj et al., (2009) stated that the incentives of extension agents are set in a way that
they try to maximize farmers’ adoption of standardized packages. This makes extension workers
to function to meet the expectations of their supervisors, on whom their promotion and job
security depended. All these intensify quantitative targeting of clients and preference of resource
full farmers by extension workers. Even the strategy which has been designed to provide gender
equitable extension service by recruiting female extension workers cannot handle the systematic
discrimination of female farmers from extension services due to the quota system. Thus, the

98
extension program needs to consider targeting mechanisms carefully because meeting
quantitative targets may conflict with program objectives.
Table 6.6: Factors hindering female headed households’ participation in agricultural extension
service
Constraints Score Rank order
Attitude of extension workers 540 1st
Shortage of family labour 522 2nd
Lack of credit access 475 3rd
Low education level 396 4th
High price of agricultural inputs 335 5th
Shortage of draft power 276 6th
Small land size 200 7th
Workload 112 8th
Lack of awareness 63 9th
Source- Survey data, 2012
The second constraint faced by female headed households to access extension service is shortage
of family labour. According to Bezabih and Holden (2007) female headed households are
characterized by lack of assets (including draught power) as well as labor shortage in Ethiopia.
More importantly, one of the characteristics of Ethiopian agriculture is its labour intensive nature
which depends mainly on human labour and draft power. Botlhoko and Oladele (2013) observed
that households who have large number of family size in adult equivalent scale have high
likelihood of participation in the extension program. This fact is also discussed in Chapter 4 and
5 of this study.
Lack of access to credit is another constraint to get extension service. Credit arrangements
alleviate capital constraints of farmers that enable them to timely purchase of agricultural inputs
promoted by the extension service. Credit users in the study area were only 16 percent, of which
female heads have only 1 percent access that is influenced by the nature of credit arrangements
99
that reduces the attractiveness of input uptake. To be eligible, a farmer must have repaid all
previous loans (Dercon, 2000) and the capacity to pay the loan is evaluated. Inconvenient
payback time and lack of interest due to the tendency of farmers to avoid risk in instances of crop
failure (Carlesson et al., 2005) are other factors for farmers’ low use of credit. Moreover
according to Davis et.al, (2010) in Ethiopia, farmers’ access to agricultural credit (and financial
services more broadly), remains inadequate, particularly female heads frequently lack credit,
making it difficult for them to obtain inputs (Tewodaj et. al, 2009).
Education is a major factor enabling females to break down barriers to some cultural and social
factors giving rise to the division of household labour. However, female’s low education level
hampers their participation in the extension program. As shown in Table 6.1 only 18 percent of
female heads are literate. According to Gebreegziabher et al., (2011); Giovanopoulou et al.,
(2011), education increases the probability of joining the extension program with the notion that
farmers with better human capital like education are among the early adopters.
High price of agricultural inputs is another important barrier to use extension service for female
heads who often lack productive assets. This is not surprising given the fact that most of the
modern inputs (especially fertilizers and agro-chemicals) prices have been increasing year after
year. The remaining constraints are lack of draft power, small land size, work load and lack of
awareness respectively.
6.4 Conclusions
This study clearly indicates the involvement of female farmers in agricultural production and
management activities. Female heads play a key role in both crop and livestock production and
management activities in the study area. However, their important agricultural role is often
obscured as a result of their non-contribution in oxen ploughing which is mainly done and
culturally given to men. Though, their absence in oxen ploughing could not be a justification for
perceiving them as non-farmers and/or seen to be only helping, but they are excluded from
extension programs. Indeed female headed households’ lack of productive assets also creates
bias towards their agricultural role and in turn denies their access to agricultural extension
service. Thus, capturing the differences between males and females in terms of productive assets
should be boldly underlined to design gender responsive services.

100
In general, the results of the study clearly revealed the existence of gender-biased extension
system in the study area irrespective of female’s role in agriculture and ignoring female’s
important roles in agricultural production limits their contribution for agricultural development.
Therefore, in order to improve rural livelihoods and to reduce the gender gap in agricultural
extension service, it is essential to promote female farmers’ participation in agricultural
extension activities by providing gender-responsive training to extension workers, improving the
criteria used for performance evaluation of agricultural extension workers to minimize the effect
of quantitative targeting of clients that may conflict with program objectives, developing policies
and programs that strengthen female’s physical access to resources, and introducing time-saving
infrastructures. All these measures not only increase female’s ability to adopt improved
technologies or engage in more remunerative livelihood strategies, but also contribute to
female’s empowerment in the household and the community at large. In general bringing the
rural female folk in to the main stream of the community life and making them active
participants in the rural life reformation process needs serious considerations.
101
Chapter 7
Summary, overall conclusions and implications of the study
7.1 Summary of main results
As part of the agriculture development led industrialization strategy, the Ethiopian government
introduced the National Extension Intervention Program, i.e., the Participatory Demonstration,
Training and Extension System in 1995 to improve smallholders’ farm production and
productivity through better access to technological packages that combined fertilizers, improved
seeds and better management practices.
The success of agricultural extension service in Ethiopia is often measured in terms of the
number of farmers taking part or full of the packages and/or physical inputs such as improved
seed, chemical fertilizer, herbicides and pesticides. Few empirical evidences reported that
participation in agriculture extension program has led to improvements in agricultural
productivity and efficiency, while other evidences asserted that the Ethiopian extension program
has non-significant effect on productivity as well as technical efficiency. All these studies
however, did not address the problem of selection-bias that comes due to self-selection of
farmers into the program and endogenous program placement. In the actual situation extension
program participants are not selected randomly, as it is often the case with non-experimental data
and this leads to a biased result. The resulting estimates will either overestimate or underestimate.
This study for the first time attempted to analyze the effect of agricultural extension program-
PADETES on smallholders’ farm productivity, efficiency and female farmers’ empowerment in
North West Ethiopia through addressing selection biases that occur during program placement.
Even though the overall effect of extension program participation cannot be known for certain
because of the lack of reasonably accurate baseline data for comparison, this study employs a
bench mark OLS, treatment effect model, propensity score matching methods and translog
stochastic frontier production function to mitigate some of the challenges in the estimation of
effect of agricultural extension participation on farm productivity and efficiency.
This study used cross-sectional data obtained from farm households who participated and non-
participated in PADETES in Gozamin district, North West Ethiopia. Gozamin district was

102
selected purposively to fulfill the following criteria; where crop production is widely practiced,
where extension program have been implemented for relatively longer period of time, the
availability of different agro-ecologies and its representativeness to the Ethiopian highlands.
Three hundred farm households consisting of a comparable group of participants and non-
participants were surveyed during 2011/12 main agricultural season. To understand how farmers
are using the technologies promoted by the extension program intensive plot level data were
collected. Data collection was done using structured questionnaire which was pre-tested through
a pilot survey.
The different model estimations indicate the positive effect of extension participation on farm
productivity. Different factors had positively influence farm productivity. These are age, plot
size, soil quality, slope of the plot, use of improved seed, amount of chemical fertilizer,
application of compost, ploughing frequency, intensity of labour and oxen power. However, in
spite of its positive effect, our finding clearly shows the existence of selection bias which tends
to target relatively wealthier farm households and those affiliated to kebele administration, which
is not directly related to farm productivity. The participation could have increased farm
productivity by up to 20 percent had it not been to the serious selection bias observed during
program placement. Furthermore, the program has been constrained by insufficient, non-
diversified and/or poor quality farm inputs, such as improved seeds, weak research-extension
linkage and services like credit and training to implement technologies promoted by the program.
As a result, the observed overall farm productivity is less by about half than the target set by the
extension program.
Despite the long history of government investment in the agricultural sector through extension
service and promotion of new technology, smallholders’ are found technically inefficient as
evidenced with teff production. The econometric results based on the stochastic production
function indicate that the mean technical efficiency estimates for agricultural extension
participant and non-participant teff producers’ are almost similar i.e., 72.29 percent and 71.44
percent respectively. This implied that participants and non-participants can achieve, respectively,
an average of about 27.71 percent and 28.56 percent growth in teff production through full
technical efficiency improvements. This indicated that, participation in agricultural extension
program has had no positive significant influence on technical efficiency of teff producer farms.

103
Moreover, both groups of farms have considerable overall technical inefficiencies suggesting the
existence of immense potentials for enhancing production through improvements in efficiency
with available technology and resources. Livestock ownership (TLU), credit and improved seed
are found to positively influence technical efficiency of teff producer farmers, while age of the
head, family size, education, plot size, AE participation and membership in cooperatives did not
have significant effect in reducing technical inefficiency.
The results from the gender division of labour in agricultural production revealed that female
heads spent about 50 percent more time for domestic and farm activities compared to male heads.
Female heads play a key role in both crop and livestock production and management activities in
the study area. About 92 percent of male heads and about 82 percent of female heads, except for
oxen ploughing for female, are engaged in crop production activities. In addition, about 71
percent of female are engaged in livestock production and related management activities whereas
male’s involvement is only 36 percent. Our result also indicated that substantial number of
female farmers grows almost similar types of crops dominantly grown in the area such as teff,
maize, wheat, barley, vegetables etc with their male counterparts and there are no crops that are
grown exclusively by. However, in spite of female’s significant role in crop and livestock
production, only 15.8 percent of females are users of the agricultural extension service whereas
males account for the lion share (70.7 percent). This clearly revealed that the program failed to
target female farmers in the study area. The quota system imposed on extension workers that led
them to target resource-rich farmers combined with female’s poor access to resources are the
most important factors that led to the denial of female’s client-ship in extension services. This
calls for serious consideration and actions by all bodies concerned.
7.2 Conclusions and policy implications
The above findings show that the agricultural extension program failed to bring the desired level
of change by the measures of crop productivity, technical efficiency and women’s empowerment.
It may be difficult to draw definite policy recommendations based on these results as this study
was based on limited macro level and cross sectional data covering only one production year.
Nevertheless, the results could still be very informative for re-designing agricultural
development strategies aimed at raising farm productivity, farm efficiency and empowering
female farmers through agricultural extension service. The results could help to design

104
appropriate strategies on the implementation of the agricultural extension program on the ground
to make the service accessible for all farmers without any partiality. It could also give insight for
policy planners on how the real implementation of the program is mismatched with the
objectives of the program on paper. Therefore, based on the results obtained some important
implications and recommendations can be drawn as follows:
(1) In order to improve the benefits to be gained in terms of farm productivity through
agricultural extension program, the extension program should be accessible for all without any
entry barriers and this requires maintaining a clear boundary between the program and the local
politics which is lacking at the moment. The program should not be used to gain political/power
control; instead the role of extension service in enhancing agricultural production growth should
get serious attention. In addition, despite the emphasis in raising agricultural productivity
through improved technologies, there is serious shortage of improved and diversified crop
technologies. Therefore, generation and adaptation of improved, diversified and quality
agricultural inputs remain critically important, for this establishing and strengthening research-
extension linkage is very crucial. Moreover, to strengthen the capacity of resource poor farmers
in implementing extension advices, the local government should create the necessary asset
portfolio among the poor.
(2) The substantial technical inefficiency observed in teff production implies the availability of
ample opportunities to raise teff production with available technology and resources. Hence,
given farmer’s resource constraints to modernize their agricultural practices and increase farm
production in a sustainable manner, agricultural development strategies should consider feasible
strategies that would raise the efficiency of farm production. In addition, policies and strategies
that improve technical skill and farm management capacity of farmers, access to demand driven
livestock extension service, credit and availability of quality and diversified improved seed could
help to raise the efficiency of teff production.
(3) Despite the Ethiopian government’s strong advocacy for promoting gender equality in all
sphere of life, this study indicated the existence of male farmers dominated extension service. To
reduce the gender gap in agricultural extension service, it is essential to promote female farmers’
participation in agricultural extension activities by providing gender-responsive training to

105
extension workers in particular and the community at large. Improving the criteria used for
performance evaluation of agricultural extension workers and targeting mechanisms need
attention to minimize the effect of quantitative targeting that may conflict with program
objectives. Rather it is essential to make female’s participation in training and skill development
be part of the extension workers evaluation criteria until the gender gap becomes insignificant. In
addition, capturing the differences between male and female in terms of productive assets should
be boldly underlined to design gender responsive services. Further, developing policies and
programs that strengthen female’s physical access to resources, and introducing time-saving
infrastructures remains critical.
In general to achieve full potential impact of agricultural extension and to get the expected
outcome in terms of farm productivity, efficient utilization of available technologies and
resources as well as to maintain the reliability and responsiveness of the extension program, this
study argue that refinements in the extension approach should be explored. Such refinements
would need to disentangle the system away from politics, top-down, supply-driven, package
approaches for limited crops, to more dynamic, responsive, impartial and competitive service
provision. However, without such changes, the agricultural extension system in Ethiopia will
become extraneous to the needs of smallholders production system.
7.3 Research prospects
Attribution and estimating the counterfactual are the challenges that emanate from the nature of
impact evaluation itself. Thus, in order to control these challenges and to get more representative
figure about the impact of the extension program on farm productivity, efficiency and women
farmer’s empowerment at national level, conducting similar studies further dealing with wider
sample size and area coverage remain important. Moreover, establishing time series data that
considers how other aspects of the national extension program such as natural resource
conservation practices, role of farmer training centers and other collaborative institutions affect
impact of extension program in terms of intermediate and final outcomes remain important.

106
References
Abate, H. (2007). Review of extension systems applied in Ethiopia with special emphasis to the
participatory demonstration and training extension system. Food and Agriculture
Organization of the United Nations, (unpublished), Addis Ababa, Ethiopia.
Abate, T., Shiferaw, B., Gebeyehu, S., Amsalu, B., Negash, K., Assefa, et al. (2011). A systems
and partnership approach to agricultural research for development: Lessons from Ethiopia.
In Outlook on Agriculture Journal, 40(3): 213–220.
http://dx.doi.org/10.5367/oa.2011.0048
Abebaw, D. and Haile, M.G. (2013). The impact of cooperatives on agricultural technology
adoption: Empirical evidence from Ethiopia. Food policy, 38: 82-91.
http://dx.doi.org/10.1016/j.foodpol.2012.10.003
Abera, G., Gudeta, H., Belissa, M., Shale, G., Degefe, A. and kassa, B. (2006). Gender Based
Roles and Resource Use Right in Potato Production and Marketing System: The Case of
Some Districts in Oromia, Ethiopia. A Research Report, Addis Ababa.
Action Aid and CARE (2012). What works for women: Proven approaches for empowering
women smallholders and achieving food security. Retrieved from
http://www.actionaidusa.org/publications/.
ATA (Agricultural Transformation Agency) (2012). www.ata.gov.et/programs/value-chain-
programs/tef.
Ahmed, M. M., Gebremedhin, B., Benin, S. and Ehui, S. (2002). Measurement and source of
technical efficiency of land tenure contracts in Ethiopia. Environmental and Development
Economics, 7: 507-528.
Aigner, D.J., Lovell, C.K. and Schmidt, P. (1977). Formulation and estimation of stochastic
frontier production function models. Journal of Econometrics, 6 (1): 21–37.
Alemu, B. A., Nuppenau, E. A. and Boland, H. (2009). Technical efficiency of farming systems
across agro-ecological zones in Ethiopia: An application of stochastic frontier analysis.
Agricultural Journal, 4 (4): 202-207.
Alemu, D. and Tripp, R. (2010). Seed system potential in Ethiopia: Constraints and opportunities
for enhancing production, IFPRI Working Paper, Washington DC.
http://www.ifpri.org/sites/default/files/publications
Alene, A. D. (2003). Improved production technology and efficiency of smallholder farmers in
Ethiopia: Extended parametric and non-parametric approaches to production efficiency
analysis, PhD dissertation.

107
Alene, A. D. and Hassan, R. M. (2008). Efficiency of food production under old and new
technology: The case of farmers within and outside the extension package program in
Ethiopia. The Journal of Developing Areas, 41(2): 233-249.
Alene, A. D. and Hassen, R. M. (2006). The efficiency of traditional and hybrid maize
production in Eastern Ethiopia: An extended efficiency decomposition approach. Journal
of African Economies, 15(1): 91-116.
Alene, A. D. and Manyong, V. M. (2006). Farmer to farmer technology diffusion and yield
variation among adopters: the case of improved cowpea in northern Nigeria. Agricultural
Economics, 35: 203-211.
Alene, A. D. and Zeller, M. (2005). Technology adoption and farmers efficiency in multiple
crops production in eastern Ethiopia: A comparison of parametric and non-parametric
distance functions. Agricultural Economics Review, 6(1):5-17
Alene, A. D. and Manyong, V. M. (2007). The effects of education on agricultural productivity
under traditional and improved technology in Northern Nigeria: An Endogenous
Switching Regression Analysis. Empirical Economics, 32:141-159.
Alvarez, A. and Arias, C. (2004). Technical efficiency and farm size: A conditional analysis.
Agricultural Economics 30(3), 241–250. http://dx.doi.org/10.1016/j.agecon.2003.04.001
Anderson J. R. (2007). Agricultural advisory services: a background paper for “innovating
through science and technology”. Background paper for the World Development Report
2008.
Anderson, J. R. and Feder, G. (2003). Rural extension services: World Bank Policy Research
Working Paper, 2976, World Bank, Washington D.C.
Anderson, J. R. and Feder, G. (2007). Hand book of agricultural economics, agricultural
extension (pp. 2343-2372). In R. Evenson, & P. Pingali (Eds.). Agriculture and Rural
Development Department, World Bank, Washington, DC.
Angrist, J. D. and Imbens, G. W. (1995). Two-stage least squares estimates of average causal
effects in models with variable treatment intensity. Journal of the American Statistical
Association, 90(430), 431-442.
Anriquez, G. and Stamoulis, K. (2007). Rural development and poverty reduction: Is agriculture
still the key? ESA Working Paper No.7-02, Rome Italy.
Asfaw, S., Shiferaw, B., Simtowe, F. and Lipper, L. (2012). Impact of modern agricultural
technologies on smallholder welfare: Evidence from Tanzania and Ethiopia. Food policy,
37: 283-295. http://dx.doi.org/10.1016/j.foodpol.2012.02.013

108
Assefa, K., Aliye, S., Belay, G., Metaferia, G., Tefera H. and Sorrells, M. E. (2011). Quncho: the
first popular tef variety in Ethiopia. International Journal of Agricultural Sustainability,
25-34.
Assefa, K., Yu, J. K., Zeid, M., Belay, G., Tefera, H. and Sorrells, M. E., (2010). Breeding tef
[Eragrostis tef (Zucc.) Trotter]: conventional and molecular approaches (review). Plant
Breeding. http://dx.doi.org/j.1439–0523.2010.01782.x.
Assefa, S. (2011). Analysis of technical efficiency of crop producing smallholder farmers in
Tigray, Ethiopia. Munich Personal RePEc Archive.
Atilaw, A. and L. Korbu (2011). Recent development in seed systems of Ethiopia. In: Alemu, D.,
S. Kiyoshi and A. Kirub (eds). Improving Farmers' Access to Seed. Empowering
Farmers' Innovation. Series No. 1: 13-30.
Ayalew, D. and Deininger, K. 2012. Causes and implications of credit rationing in rural Ethiopia.
The importance of spatial variation. Policy Research Working Paper, 6096, the World
Bank e-Library.
Ayele,G., Bekele, M. and Zekeria, S. (2006). Productivity and Efficiency of Agricultural
Extension Package in Ethiopia. The Ethiopian Development Research Institute Research
Report 5, Addis Ababa, Ethiopia.
Bachewe, F (2009). The state of subsistence agriculture in Ethiopia: sources of output growth
and agricultural inefficiency. PhD. dissertation submitted to the faculty of the graduate
school of the University of Minnesota.
Barham J. and Chitemi C. (2008). Collective action initiatives to improve marketing
performance: Lessons from farmer groups in Tanzania. Collective Action for Property
Rights (Capri) Working Paper No. 74.
Barrett, C., Reardon, T. and Webb, P. (2001). Non-farm income diversification and household
livelihood strategies in rural Africa: Concepts, dynamics, and policy implications. Food
Policy, 26(4), 315–331. http://dx.doi.org/10.1016/S0306-9192(01)00014-8
Battese, G. and Broca, S. (1997). Functional forms of stochastic frontier production functions
and models for technical inefficiency effects: a comparative study for wheat farmers in
Pakistan. J. Prod. Anal., 8: 395–414.
Battese, G. E. Coelli, T. J., and Colby, T. C. (1989). Estimation of frontier production functions
and the efficiencies of Indian farms using panel data from ICRISAT’s village level
studies. J Quant Econ., 5:327–348

109
Battese. G. E. and Coelli, T. J. (1995). A model of technical inefficiency effects in a stochastic
frontier production function for panel data. Empir. Econ., 20: 325–332
Benin, S. (2006). Policies and programs affecting land management practices, input use, and
productivity in the highlands of Amhara Region, Ethiopia. In J. Pender, F. Place, & S. Ehui
(Eds.), strategies for sustainable land management in the East African Highlands.
Washington, DC: IFPRI.
Benin, S., Nkonya, E., Okecho, G., Randriamamonjy, J., Kato, E., Lubade, G., & Kyotalimye, M.
(2011). ). Returns to spending on agricultural extension: The case of the National
Agricultural Advisory Services (NAADA) Program of Uganda. Agricultural economics,
42: 249-267. http://dx.doi.org/10.1111/j.1574-0862.2010.00512
Berhane G. (2013). Gender differences in access to extension services and agricultural
productivity. Journal of Agricultural Education and Extension, 19, 5, 437-468.
Beshir H., Emana, B., Kassa, B., & Haji, J. (2012). Determinants of chemical fertilizer
technology adoption in North Eastern Highlands of Ethiopia: The double hurdle approach.
Journal of Research in Economics and International Finance, 2, 39-49.
Binam, J. N., Tonye, J., Wandji, N., Nyambi, G. and Akoa, M. (2004). Factors affecting the
technical efficiency among smallholder farmers in the slash and burn agriculture zone of
Cameroon. Food Policy, 29: 531-545.
Birhanu, K. (2012). The political economy of agricultural extension in Ethiopia: Economic
growth and political control: working paper, 042 future agriculture.
Birhanu, K. (2014). The political economy of agricultural extension in Ethiopia: Economic
growth and political control. 21th
KUASS (Kyoto University African Studies Seminar).
Birner, R., Davis, K., Pender, J., Nkonya, E., Anandajayasekeram, P., Ekboir, J., Mbabu, A.,
Spielman, D. J. Horna, D., and Benin, S. (2009). “From Best Practice to Best Fit: A
framework for designing and analysing agricultural advisory services worldwide”.
Journal of Agricultural Extension and Education, 15(4): 341-355
Bishaw, Z., Sahlu, Y. and Simane B. (2008). The status of the Ethiopian seed industry. In
Farmers, seeds and varieties: Supporting informal seed supply in Ethiopia. Ed. M. H.
Thijssen, Z. Bishaw, A. Beshir, and W.S. de Boef. Wageningen.

110
Bonger, T., Ayele, G. and Kumsa. T. (2004). Agricultural extension, adoption and diffusion in
Ethiopia. Ethiopian Development Research Institute (EDRI) Research report 1. Addis
Ababa.
Braun, A., Thiele, G. and Fernandez, M. (2002). Farmer field schools and local agricultural
research committee: complementary platforms for integrated decision-making in
sustainable agriculture. ODI, Agricultural Research and Extension, Network Paper 105.
Bravo-Ureta, B. E. and Pinheiro, A. E. (1997). Technical, economic and allocative efficiency in
peasant farming: evidence from the Dominican Republic. The Developing Economics,
xxxv (1): 48–67.
Caliendo, M. and Kopeinig, S. (2008). Some practical guidance for the implementation of
propensity score matching. Journal of Economic Surveys, 22: 31–72.
http://dx.doi.org/10.1111/j.1467-6419.2007.00527
Carlesson, F., Kohlin, G., Mekonnen, A. and Yusuf, M. (2005). Are agricultural extension
packages what Ethiopian farmers want? A stated preference analyses, working paper No.
172, Department of Economics, Goteborg University.
Charatsary C., Papadaki-Klaudianou, A. and Michailidis, A. (2011). Farmers as consumers of
agricultural education services: willingness to pay and spend time. Journal of agricultural
education and extension, 3:253-266.
Christoplos, I. (2010). Mobilizing the Potential of Rural and Agricultural Extension. Neuchatel
Group.
CIA (Central Intelligence Agency) (2014). The world fact book.
https://www.cia.gov/library/publications/the-world-factbook/geos/et.html
CIA (Central Intelligence Agency) (2012). The world fact book.
http://www.immigration-usa.com/world_fact_book_2012/ethiopia/ethiopia_people.html
Coelli, T. J. (1994). A guide to FRONTIER version 4.1: A computer program for stochastic
frontier production and cost function estimation. Mimeo, Department of Econometrics,
University of New England, Armidale, Australia.
Coelli, T. J. and Battese, G. E. (1996). Identification of factors which influence the technical
efficiency of Indian farmers. Aust J Agric Econ., 40(2): 103–128.

111
Coelli, T. J., Prasada Rao, D. S., O’Donnell, C. J. and Battese, G. E. (2005). An introduction to
efficiency and productivity analysis, 2nd
.ed. New York: Springer Science.
Coelli, T. J. (1996). A guide to Frontier Version 4.1: A computer Program for Frontier
Production Function Estimation. CEPA Working Paper 96/07, Department of
Econometrics, University of New England, Armidale.
Cohen, M. J. and Lemma, M. (2011). Agricultural extension services and gender equality: An
institutional analysis of four districts in Ethiopia, IFPRI Discussion Paper, 01094.
Coughenour, C. M. and Swanson, L. E. (1988). Rewards, values and satisfactions with farm
work. Rural Sociology, 53 (4): 442–459.
CSA (Central Statistical Agency) (2008). Statistical abstract 2008, Central Statistical Agency,
Addis Ababa, Ethiopia.
CSA. (2011). Agriculture in Figures: Key findings of the 2008/09-2010/11 agricultural sample
surveys for all sectors and seasons, Country Summary.
Cunguara, B. and Darnhofer, I. (2011). Assessing the impact of improved agricultural
technologies on household income in rural Mozambique. Food Policy, 36: 378-390.
Cunguara, B. and Moder, K. (2011). Is agricultural extension helping the poor? Evidence from
rural Mozambique. Journal of African Economies, 0: 1-34.
http://dx.doi.org/10.1093/jae/ejr015
Davis, K., Swanson, B., Amudavi, D., Ayalew, D., Flohrs , A., Riese, J., Lamb, C. and Zerfu, E.
(2010). In-depth assessment of the public agricultural extension system of Ethiopia and
recommendations for improvement. IFPRI, Discussion Paper 01041.
Dehejia, R. and Wahba, S. (2002). Propensity score matching methods for non-experimental
causal studies. The Review of Economics and Statistics, 84 (1): 151–161.
Dercon, S. (2000). Growth and poverty in Ethiopia in the 1990s: An economic perspective.
Centre for the study of African Economies, Oxford University.
Dercon, S. and Christiaensen, L. (2007). Consumption risk, technology adoption and poverty
traps: Evidence from Ethiopia. World Bank Policy Research Working Paper 4527,
Washington, DC: World Bank.

112
Dey, M. M., Paraguas, F. J., Sricantuk, N., Xinhua, Y., Bhatta, R. and Dung, L.T.C. (2005).
Technical efficiency of fresh water pond polyculture production in selected Asian
countries: estimation and implication. Aquac Econ Manag., 9(1&2): 39–63.
Diao, X. and P. Hazell. (2004). Exploring market opportunities for African smallholders. 2020
Africa Conference Brief No. 6. Washington D.C., USA.
Dong F., Lu, J. and Featherstone, A. M. (2010). Effects of credit constraints on productivity and
rural household income in China Working Paper 10-WP 516.
Doss, C. R. (2002). Men’s crops? Women’s crops? The gender patterns of cropping in Ghana.
World development, 30, 11, 1987-2000.
Doss, C. R. and Morris, M. L. (2001). How does gender affect the adoption of agricultural
innovations? The case of improved maize technology in Ghana. Agricultural Economics,
25: 27–39. http://dx.doi.org/10.1111/j.1574-0862.2001.tb00233.x
DSA (Development Studies Associates) (2006). Study on improving the efficiency of input
markets. Ministry of Agriculture and Rural Development, Addis Ababa, Ethiopia.
DSA (Development Studies Associates). (2006). Study on improving the efficiency of input
markets. Ministry of Agriculture and Rural Development, Addis Ababa, Ethiopia.
EEA/EEPRI (2006). Evaluation of the Ethiopian agricultural extension with particular emphasis
on the Participatory Demonstration and Training Extension System (PADETES). First
edition, Addis Ababa, Ethiopia.
Falco, S., Bezabih, M. and Yesuf, M. (2010). Seeds for livelihood: Crop biodiversity and food
production in Ethiopia. Ecological Economics 69 (2010) 1695–1702
FAO (2009). Gender in Agriculture: Sourcebook, http://www.genderinag.org/content/gender-
agriculture-sourcebook.
FAO (2010). Gender dimensions of agricultural and rural employment: Differentiated pathways
out of poverty Status, trends and gaps Published by the Food and Agricultural Organization
of the United Nations, the International Fund for Agricultural Development and the
International Labour Office Rome, 2010.
FAO (2013). FAO-Food Security Indicators.
http://faostat3.fao.org/home/index.html#DOWNLOAD

113
FAO (2011). The state of food and agriculture 2010-2011. Rome: Food and Agriculture
Organization of the United Nations.
FAO (2010). Ethiopia country brief. Retrieved from www.fao.org/countries/55528/en/eth/
FAO 1995. Improving the relevance and effectiveness of agricultural extension activities for
women farmers - An André Mayer research study.
Farrell, M. J. (1957). The measurement of production efficiency. Journal of Royal Statistical
Society, 120: 253–282.
Feder, G., Murgai, R. and Quizon, J. B. (2004). The acquisition and diffusion of knowledge: The
case of pest management training in farmer field schools, Indonesia. Journal of Agricultural
Economics, 55(2), 221-243.
Feleke, S. and Zegeye, T. (2006). Adoption of improved maize varieties in southern Ethiopia:
factors and strategy options. Food Policy, 31(5), 442-457.
http://dx.doi.org/10.1016/j.foodpol.2005.12.003
Frank, E. (1999). Gender, agricultural development and food security in Amhara, Ethiopia: The
contested identity of women farmers in Ethiopia .USAID/Ethiopia.
Fufa, B., Behute, B., Simons, R. and Berhe. T. (2011). Strengthening the teff value chain in
Ethiopia. Mimeo, Agricultural Transformation Agency (ATA), Addis Ababa.
Gebregziabher, G. and Holden, S. (2011). Does irrigation enhance and food deficits discourage
fertilizer adoption in a risky environment: Evidence from Tigray, Ethiopia. J. Dev. Agric.
Econ., 30(10), 514–528.
Gebregziabher, K., Mathijs, E., Maertens, M., Deckers, J. and Bauer, H. (2011). Extension
participation, household income and income diversification: A system equations approach.
Retrieved from www.csae.ox.ac.uk/conferences/2011-EDiA/.../437
Gebremedhin, B., Hoekstra, D. and Tegegne A. (2006). Commercialization of Ethiopian
agriculture: Extension service from input supplier to knowledge broker and facilitator.
IPMS Working Paper No. 1,36. International Livestock Research Institute
Gebremedhin, B., Jalata, M. and Hoekstra, D. (2009). Smallholders, institutional services, and
commercial transformation in Ethiopia. Journal of Agricultural Economics, 40, 773-787.
http://dx.doi.org/10.1111/j.1574-0862.2009.00414

114
Gebre-Selassie, A. and Bekele, T. (2011). A review of Ethiopian agriculture: Roles, policy and
small-scale farming systems. Country analysis: Ethiopia and D.R. Congo. Global growing
case book.
Gebreselassie, S. (2006). Intensification of smallholder agriculture in Ethiopia: Options and
scenarios. Paper presented for the Future Agricultures Consortium meeting at the Institute
of Development Studies.
Gebre-Selassie S. (2003). Summary report on recent economic and agricultural policy. Paper
prepared for the roles of agriculture international conference 20-22 October, 2003 – Rome,
Italy.
Genius M. G., Pantzios, C. J. and Tzouvelekas, V. (2006). Information acquisition and adoption
of organic farming practices. Journal of Agricultural and Resource Economics, 31(1), 93-
113.
Giovanopoulou, E., Nastis, S. A. and Papanagiotou, E. (2011). Modeling farmer participation in
agri-environmental nitrate pollution reducing schemes. Ecological economics, 70, 2175-
2180.
Gozamin Woreda Finance and Economic Development sector Office Document. (2010).
Allocation of budget from 2003 to 2010, East Gojam zone, Amhara Regional State.
Grepperud, S. (1996). Population pressure and land degradation: The case of Ethiopia. Journal of
Environmental Economics and Management, 30 (1): 18–33.
http://dx.doi.org/10.1006/jeem.1996.0002
GulUnal, F. (2008). Small is beautiful: Evidence of an inverse relationship between farm size
and yield in Turkey. Working Paper No. 551. The Levy Economics Institute.
Heckman, J.and Navarro-Lozano, S. (2004). Using matching, instrumental variables, and control
functions to estimate economic choice models. The Review of Economics and Statistics,
86(1), 30–57.
Heckman, J.and Robb, R. (1985). Alternative methods for evaluating the impact of interventions:
An overview. Journal of Econometrics, 30(1), 239–267.

115
Heckman, J., Ichimura H., Smith J. and Todd P. (1997). Matching as econometric evaluation
estimator: Evidence from evaluating a job-training program. Review of Economic Studies,
64: 605–654. http://dx.doi.org/10.1111/1467-937X.00044
Heckman, J., Ichimura H., Smith J. and Todd P. (1998). Characterizing selection bias using
experimental data. Econometrica, 66: 1017–1098.
Hegde, N. G. (2005). Traditional extension methods in modern agriculture. Indian farming
special issue on World food day. Pp.45-47
Henseler, J., Ringle, C. M. and Sinkovics, R. R. (2009). The use of partial least squares path
modeling in international marketing. Advances in International Marketing, 20: 277–319.
Hu, R., Yang, Z., Kelly, P. and Huang, J. (2009). Agricultural extension system reform and agent
time allocation in China. China Economic Review 20: 303–315.
IFDC (International Fertilizer Development Center) (2012). Ethiopia fertilizer assessment
Imbens, G. and Wooldridge, J. (2009) .Recent developments in the econometrics of program
evaluation. Journal of Economic Literature, 47 (1): 5–86.
http://dx.doi.org/10.1257/jel.47.1.5
IRIN (Integrated Regional Information Networks). (2012). Humanitarian news and analysis
Ethiopia: http://www.irinnews.org/report/96154/ethiopia
Jones, L. E., Diekmann, F. and Batte, M. T. (2010). Staying in touch through extension: An
analysis of farmers’ use of alternative extension information products. Journal of
agricultural and applied economics, 42(2): 229-246
Jones, R., Goheen, A., Dhuyvetter, K., Kastens, T. and AmanorBoadu, V. (2007). Using distance
Education in extension programming. Journal of agricultural and applied economics,
39(2):265-274
Kassa, B. (2003). Agricultural extension in Ethiopia: The case of participatory demonstration
and training extension system. Journal of Social Development in Africa, 18(1), 49–83.
Kassa, B. and Abebaw, D. (2004). Challenges facing agricultural extension agents: A case study
from South-Western Ethiopia. African Development Review, 16 (1): 139–168.
http://dx.doi.org/10.1111/j.1467-8268.2004.00087
116
Kassa, H. (2008). Agricultural extension in Ethiopia: Historical evolution, relevant policies and
challenges, in Taye Assefa (ed.), Digest of Ethiopia’s national policies, strategies and
programs: Addis Ababa: Eclipse Printers.
Kassie, M., Zikhali, P., Manjur, K. and Edward, E. (2009). Adoption of sustainable agriculture
practices: Evidence from a semi-arid region of Ethiopia. Natural Resources Forum, 39:
189–98. http://dx.doi.org/10.1111/j.1477-8947.2009.01224
Khairo, S. A., Battese, G. E. (2005). A study of technical inefficiencies of maize farmers within
and outside the new agricultural extension program in the Harari region of Ethiopia.
South African Journal of Agricultural Extension, 34(1): 136-150.
Kiptot, E. and Franzel, S. (2012). Gender and agroforestry in Africa: a review of women’s
Participation. Agro-forestry System, 84, 35–58
Lefort, R. (2010). Powers – Mengist – and peasants in rural Ethiopia: The post-2005 interlude.
Journal of Modern African Studies, 48(3), 435-460.
http://dx.doi.org/10.1017/S0022278X10000297
Lemma, M. (2007). The agricultural knowledge system in Tigray, Ethiopia: Recent history and
actual effectiveness. Weikersheim, Germany: Margraff Publishers.
Lemma, T., Sehai, E. and Hoekstra, D. (2011). Status and capacity of Farmer Training Centers
(FTCs) in the Improving Productivity and Market Success (IPMS) Pilot Learning Woredas
(PLWs). Retrieved from http://cgspace.cgiar.org/handle/10568/16899
Lundvall, K. and Battese, G. E. (2000). Farm size, age, and efficiency: Evidence from Kenyan
manufacturing farms. Journal of Development Studies, 36(3), 146–163.
Magingxa, L. and A. Kamara (2003). Institutional perspectives of enhancing smallholder market
access in South Africa, paper presented at the 41st annual conference of the Agricultural
Economic Association of South Africa held in Pretoria.
Manfre, C., Deborah R., Andrea A., Gale S., Kathleen C., Mercy A. and MEAS Project (2013).
Reducing the gender gap in agricultural extension and advisory services: How to find the
Best Fit for men and women farmers. MEAS discussion paper series on Good Practices and
Best Fit approaches in extension and advisory service provision, USAID.

117
Mayen, C. D., Balagtas, J.V. and Alexander, C. E. (2010). Technology adoption and technical
efficiency: Organic and conventional dairy farms in the United States. Amer. J.Agr.
Econ., 1–15.
Meeusen, W. and van den Broeck, J. (1977). Efficiency estimation from Cobb-Douglas
production functions with composed error. International Economic Review, 18: 435–444.
Mendola, M. (2007). Agricultural technology adoption and poverty reduction: A propensity
score matching analysis for rural Bangladesh. Food Policy, 32, 372-393.
http://dx.doi.org/10.1016/j.foodpol.2006.07.003
Mitik, L. and Engida, E. (2013). Public investment in irrigation and training for an agriculture
led-development: A CGE Approach for Ethiopia, working paper 2013-02, PEP project.
MoFED (Ministry of Finance and Economic Development) (2002) Ethiopia: Sustainable
Development and Poverty Reduction Program, Federal Democratic Republic of Ethiopia
(FDRE), Addis Ababa, Ethiopia.
MoFED (2003). Rural development policy and strategies, government of the federal democratic
republic of Ethiopia. Ministry of Finance and Economic Development Economic Policy and
Planning Department Addis Ababa.
MoFED (2007). Ethiopia: Building on Progress: A Plan for Accelerated and Sustained
Development to End Poverty (PASDEP). Addis Ababa: MOFED.
MoFED (2010). Growth and Transformation Plan: 2010/11-2014/15. Volume I: Main Text.
Addis Ababa: Ministry of Finance and Economic Development (MoFED). Available
at:http://www.mofed.gov.et/index.php?option=com_content&view=article&id=14&Itemid=
94MoFED (2012) “Ethiopia’s progress towards eradicating poverty: An interim report on
poverty analysis study (2010/11)”, Addis Ababa.
MoFED (2012). Ethiopia’s Progress towards Eradicating Poverty: An Interim Report on Poverty
Analysis Study (2010/11), Addis Ababa, Ethiopia.
Mulat, D. (1999). The challenge of increasing food production in Ethiopia. In Alemayehu, G.
and Berhanu, N. (eds) The Ethiopian economy: Performance and evaluation. Proceedings of
the eighth annual conference on the Ethiopian economy, Nazareth.

118
Nega, F., Mathijs, E., Deckers, J., Haile, M., Nyssen, J. and Tollens, E. (2010). Rural poverty
dynamics and impact of intervention programs up on chronic and transitory poverty in
Northern Ethiopia. African Development Review, 22, 92–114.
http://dx.doi.org/10.1111/j.1467-8268.2009.00229
Nkamleu, G. B. (2004). Productivity growth, technical progress and efficiency change in African
agriculture. African Development Review, 16 (1): 203–222.
Nyemeck, B. J., Sylla, K., Diarra, I. and Nyambi, G. (2003). Factors affecting technical
efficiency among coffee farmers in Coˆte doIvoire: an evidence of Centre West region.
African Development Review, 15 (1): 66–76.
Ogato, G. S., Boon, E. K. and Subramani, J. (2009). Improving access to productive resources
and agricultural services through gender empowerment: A case study of three rural
communities in Ambo district, Ethiopia. Journal of Human Ecology, 27, 2, 85-100.
Pender, J. and Gebremedhin, B. (2007). Determinants of agricultural and land management
practices and impacts on crop production and household income in the highlands of Tigray,
Ethiopia. Journal of African Economies, 17(3), 395–450.
http://dx.doi.org/10.1093/jae/ejm028
PIF (2010). Ethiopia’s agricultural sector Policy and Investment Framework (PIF) 2010-2020.
MoRAD final report.
Quisumbing, A. R. and Pandolfelli, L. (2010). Promising approaches to address the needs of poor
female farmers: Resources, constraints, and interventions. World Development, 38, 4, 581-
592.
Ragasa, C., Berhane, G. Tadesse, F. and Seyoum, T. A. (2012). Gender differences in access to
extension services and agricultural productivity. Working paper, 49, IFIPRI.
Rahman, S. A. and Ibrahim, H. (2007). Socio-economic study of gender role in farm production
in Nasarawa State of Nigeria. Asia-Pasfic Journal of Rural Development, 1, 57-66.
Rao, E. J.O, Brummer, B. and Qaim, M. (2012). Farmer participation in supermarket channels,
production technology, and efficiency: the case of vegetables in Kenya. Amer. J. Agr. Econ.,
94(4): 891–912.
Reifschneider, D. and Stevenson, R. (1991). Systematic departures from the frontier: a
framework for the analysis of firm inefficiency. Int. Econ. Rev., 32: 715–723.
119
Ridaura, S. L., Masera, O. and Astier, M. (2002). Evaluating the sustainability of complex socio-
environmental systems— the MESMIS framework. Ecological Indicators, 2 (2): 135–148.
Rosenbaum, P. and Rubin, D. (1985). Constructing a control group using multivariate matched
sampling methods that incorporate the propensity score. American Statistician, 39, 33–38.
http://dx.doi.org/10.2307/2683903
Rosenbaum, P. and Rubin, D. (1983). The central role of the propensity score in observational
studies for causal effect. Biometrika, 70(1), 41-55. http://dx.doi.org/10.1093/biomet/70.1.41
Rubin, D. B. (1977). Assignment to treatment group on the basis of a covariate. Journal of
Educational Statistics, 2, 1–26. http://dx.doi.org/10.3102/10769986002001001
Salami, A., Kamara, A. B. and Brixiova, Z. (2010). Smallholder agriculture in East Africa:
Trends, constraints and opportunities, Working Papers Series No 105 African
Development Bank, Tunis, Tunisia
Seyoum, E. T., Battese, G. E. and Fleming, E. M. (1998). Technical efficiency and productivity
of maize producers in eastern Ethiopia: a study of farmers within and outside the
Sasakawa-Global 2000 project. Agricultural Economics, 341-348.
Sharma, K. R., Leung, P. and Zaleskib, H. M. (1999). Technical, allocative, and economic
efficiencies in swine production in Hawaii: A comparison of parametric and
nonparametric approaches. Agricultural Economics, 20(1), 23–35.
http://dx.doi.org/10.1016/S0169-5150(98)00072-3
Sherlund, S. M., Barrett, C. B. and Adesina, A. A. (2002). Smallholder technical efficiency
controlling for environmental production conditions. Journal of Development Economics,
69(1): 85-101.
Smith, J. and Todd, P. (2005). Does matching overcome Lalonde’s critique of non-experimental
estimators? Journal of Econometrics, 125, 305–353.
http://dx.doi.org/10.1016/j.jeconom.2004.04.011
Solis, D., Bravo-Ureta, B. E. and Quiroga, R. E. (2007). Soil conservation and technical
efficiency among hillside farmers in Central America: A switching regression model.
Australian Journal of Agricultural and Resource Economics, 51(4): 491–510.

120
Spielman D. J. (2008). Encouraging economic growth in Ethiopia: Perspectives on agricultural
input markets. Agricultural extension and advisory services, and agricultural education and
training. Briefing note prepared for DIFID.
Spielman D. J., Byerlee, D., Alemu, D. and Kelemework, D. (2010). Policies to promote cereal
intensification in Ethiopia: The search for appropriate public and private roles. Food Policy,
35:185-194. http://dx.doi.org/10.1016/j.foodpol.2009.12.002
Spielman, D. J., Davis, K., Negash, M. and Ayele, G. (2011). Rural innovation systems and
networks: findings from a study of Ethiopian smallholders. Agriculture and human values,
28:195–212
Spielman, D. J., Kelemework, D. and Alemu, D. (2011). Seed, fertilizer, and agricultural
extension in Ethiopia. Ethiopia Strategy Support Program II (ESSP II) Working Paper No
20. International Food Policy Research Institute.
Staatz, J., and Dembele, N. (2007). Agriculture for development in sub-Saharan Africa.
Background paper for the World Development Report 2008.
Tewodaj, M., Cohen, M. J. Birner, R., Lemma, M., Randriamamonjy, J. Tadesse, F. and Paulos,
Z. (2009). Agricultural extension in Ethiopia through a gender and governance lens.
IFPRI: Washington D.C.
Thangata, P. and Mequaninte, T. (2011). The impact of agricultural extension services on farm
household efficiency in Ethiopia.
The Federal Democratic Republic of Ethiopia .Growth and Transformation Plan (GTP) 2010/11-
2014/15 Draft Ministry of Finance and Economic Development (MoFED) September
2010 AA.
Thirtle, C., Beyers, L., Ismael, Y. and Piesse, J. (2003). Can GM technologies help the poor? The
impact of Bt cotton in Makhathini Flats, KwaZulu-Natal. World Development, 31(4),
717–732.
Tiwari, K. R., Sitaula, B. K., Nyborg, I. L. P. and Paudel, G. S. (2008). Determinants of farmers
adoption of improved soil conservation technology in a middle mountain watershed of
Central Nepal. Environmental Management, 42, 210-222
Umeta, G. (2013). Analysis of female headed households’ participation in agricultural extension
package program in East Showa Zone, Ethiopia. American Journal of Research
Communication, 1, 8, 227-245.

121
UNDP. (2013). Human Development Report, New York: UNDP.
UNESCO Institute for Education (2005). Foundations of Adult Education in Africa. Cape
Town/South Africa: UNESCO Institute for Education.
USAID (2013). Empowering women through agricultural development in Ethiopia.
USDA (United States Department of Agriculture) (2013). Resources, policies, and agricultural
productivity in Sub-Saharan Africa. Economic Research Report Number 145
Wiggins, S. (2009). Can the smallholder model deliver poverty reduction and food security for a
rapidly growing population in Africa? Paper for the Expert Meeting on How to feed the
World in 2050, Rome.
Wooldridge, J. M. (2010). Econometric analysis of cross section and panel data. volume 1 of
MIT Press Books.
World Bank, (2006). Ethiopia: Policies for pro-poor agricultural growth. Washington, DC:
World Bank.
World Bank (2007). Ethiopia: Accelerating equitable growth. Country economic memorandum,
Part I: overview, report no 36662-ET. Washington, D.C.
World Bank (2008). The growth report: Strategies for sustained growth and inclusive
development, Washington D.C., Commission on Growth and Development, World Bank.
World Bank, (2010). Agriculture and rural development series: Gender and governance in rural
Service: Insight from India, Ghana, and Ethiopia. World Bank, Washington, D.C.
World Development Report (WDR). (2008). Agriculture for development. The World Bank,
Washington, DC
World Health Organization. (2000). Client satisfaction evaluation. Work book 6.
Yilmaz, S. and Venugopal, V. (2008). Local government discretion and accountability in
Ethiopia. International Studies Program Working Paper 08-38, Atlanta: Georgia State
University.
Yu, B., Nin-Pratt, A., Funes, J. and Gemessa, S. A. (2011). Cereal production and technology
adoption in Ethiopia. IFPRI Discussion Paper 01131
Zerfu, D. and Larsony, D. F. (2011). Incomplete markets and fertilizer use: Evidence from
Ethiopia.

122
Appendix
Table A.1: Placebo regression result
Dependent variable: age of head’s spouse Coefficient Standard error P-value
Agricultural extension participation 0.554 0.653 0.397
Age of HH(ln) 36.37 1.443 0.001
Education of HH -0.17 0.517 0.742
Owned livestock(ln) 0.394 0.805 0.625
Owned land 0.311 0.502 0.537
Adult equivalent 0.122 0.258 0.637
Oxen days (ln) 0.012 0.474 0.979
Plot distance from extension center(ln) -0.473 0.416 0.256
Kebele administration -0.161 1.832 0.930
Membership in farmers’ organizations -1.418 1.752 0.419
Sitedummy_Enerata(cf:Kebi) 1.789 0.676 0.008
Sitedummy_Wonka 1.602 0.606 0.009
Constant -99.52 5.21 0.003
Number of observations 366
F(12, 353) 142.87
Prob> F 0.000
R squared 0.81
Table A.2: Placebo regression result
Dependent variable: age of head’s spouse Coefficient Standard error P-value
Agricultural extension participation 1.077 0.863 0.214
Age of HH(ln) 36.37 1.443 0.001
Education of HH 1.451 0.935 0.123
Owned livestock(ln) 0.394 0.805 0.625
Owned land -0.546 0.945 0.564
Adult equivalent -0.403 0.470 0.393
Oxen days (ln) 0.012 0.474 0.979
Plot distance from extension center(ln) -0.473 0.416 0.256
Kebele administration -0.161 1.832 0.930
Membership in cooperatives -1.418 1.752 0.419
Sitedummy_Enerata(cf:Kebi) 1.789 0.676 0.008
Sitedummy_Wonka 1.602 0.606 0.009
constant -99.52 5.21 0.003
Number of observations 168
F(10, 156) 142.87
Prob > F 0.000
R squared 0.76

123
Thesis Summary
Ethiopia’s economy is heavily reliant on the agriculture sector. The sector is yet characterized by
low productivity, dominated by smallholders who are subsistence, small-scale and resource poor.
To improve the performance of the sector the Government of Ethiopia (GoE) launched various
policies and strategies including the National Extension Intervention Program (NEIP) strategy,
known as the Participatory Demonstration, Training and Extension System (PADETES) in 1995.
PADETES aims at improving income and supply of food via agricultural production and
productivity, increasing industrial and export crops, ensuring rehabilitation and conservation of
natural resources, and empowering farmers, especially female farmers in agricultural
development. However, there has been little attention and rigorous analysis on the impact of
agricultural extension interventions. The few impact studies available showed mixed results and
mainly the success of the program was literally judged by the number of farmers taking part or
full of the packages and/or farm inputs.
The objectives of this study were to analyze the effect of agricultural extension program-
PADETES on smallholders’ farm productivity, efficiency and women farmers’ empowerment in
North West Ethiopia. This study used cross-sectional data obtained from three case study rural
villages consisting of 300 farm house holds, comprising extension program participant and no-
participant, including 1112 plot level data for the productivity analysis and 576 plots for
efficiency analysis. Even though the overall effect of agricultural extension program cannot be
known for certain because of the lack of reasonably accurate baseline data for comparison, this
study employed a bench mark ordinary least square method, Heckman treatment effect model
and propensity score matching methods to control unobserved variability and potential
endogeniety.
The different model estimations indicate the positive effect of agricultural extension on farm
productivity. However, the positive effect in productivity is marginal (6%). Different factors had
positively influence farm productivity, such as age, plot size, soil quality, slope of the plot, use of
improved seed, amount of chemical fertilizer, and application of compost, ploughing frequency,
intensity of labour and oxen power. Although the result indicated a positive effect of agricultural
extension on farm productivity, the study found existence of selection bias which tends to target
relatively wealthier farm households and those affiliated to kebele administration which is a non-

124
agricultural activity. The participation could have increased farm productivity by up to 20
percent had it not been to the serious selection bias observed during program placement.
On the other hand, the econometric results based on the stochastic frontier production function
indicated that substantial inefficiency is observed in extension participant’s production. The
participants and non-participants can, respectively, increase teff production by an average of
about 27.71 percent and 28.56 percent through full technical efficiency improvements. This
implied that, participation in agricultural extension program has had no positive significant
influence on the technical efficiency of teff production. Moreover, both groups of farms have
considerable overall technical inefficiencies suggesting the existence of immense potentials for
enhancing production through improvements in efficiency with available technology and
resources. This study provided evidence of the positive role of livestock ownership, credit and
improved seed (though not overemphasized due to shortcomings in seed quality and timeliness
of delivery) in enhancing efficiency of teff production.
The results from the gender division of labour in agricultural production revealed that female
heads spent about 50 percent more time for domestic and farm activities compared to male heads.
Female heads play a key role in both crop and livestock production and management activities in
the study area. However, in spite of women’s significant role in crop and livestock production,
only 15.8 percent of female heads are users of the extension service whereas male heads account
for the lion share (70.7 percent). Despite of the Ethiopian government advocacy that strongly
promotes gender equality in all sphere of life, this study indicated the existence of male
dominated extension service. The quota system imposed on extension workers that led them to
target resource-rich farmers combined with women’s poor access to resources are the most
important factors for the denial of women’s client-ship in extension services.
The results of this study provide a valuable policy insight in which improving access to
diversified technology choices, quality agricultural inputs and well-defined advisory service are
critically necessary for extension participants on top of expanding the program to less
resourceful farmers by avoiding any entry barriers in the future. For the generation and
adaptation of improved, diversified and quality agricultural inputs establishing and strengthening
the research-extension linkage is very crucial. In addition, policies and strategies that improve

125
technical skill and farm management capacity of farmers, access to demand driven livestock
extension service, credit and availability of quality improved seed could help to raise the
technical efficiency of smallholder farmers. To reduce the gender gap in agricultural extension
service, it is essential to promote female farmers’ participation in agricultural extension activities
by providing gender-responsive training to extension workers in particular and the community at
large. Further, improving the criteria used for performance evaluation of agricultural extension
workers and targeting mechanisms need attention to minimize the effect of quantitative targeting
that may conflict with program objectives. In addition, capturing the differences between male
and female in terms of productive assets should be boldly underlined to design gender responsive
services.
Furthermore, to get the expected outcome in terms of farm productivity, efficient utilization of
available technologies and resources as well as to maintain the reliability and responsiveness of
the extension program, refinements in the extension approach should be explored. Such
refinements would need to disentangle the system away from politics, top-down, supply-driven
package approaches to limited crops, to more dynamic, responsive, impartial and competitive
service provision. However, without such changes, the agricultural extension system in Ethiopia
will become extraneous to the needs of smallholders production systems.
126
Thesis Summary in Japanese
摘 要
エチオピア経済は、農業部門に重度に依存している。しかし、農業部門は、低生産性で特徴
づけられ、小規模かつ資源の乏しい生存目的の小農が優勢である。そこで、農業部門の成果を
改善するため、エチオピア政府は、1995 年に参加型実証・訓練・普及システム(PADATES)と
して知られる国家普及活動プログラム戦略を含むさまざまな政策や戦略を立ち上げた。
PADATES は、農業生産の増大や生産性向上を通じた所得や食料供給の改善、工芸作物や輸出作
物の増大、自然資源の回復・保全、農業者、特に女性農業者に対する能力付与を図ることを目
的としている。しかしながら、農業普及活動がもたらすインパクトに対しては、ほとんど関心
が払われてこなかったほか、それに関する念入りな分析も行われてこなかった。そのインパク
トに関するわずかな研究も、雑多な結論を示しているとともに、普及プログラムの成果は、主
にプログラム・パッケージや農業投入物の全体または一部を利用した農業者数によって検討さ
れてきた。
本研究の目的は、小農の土地生産性、効率性、女性農業者に対する能力付与に対して農業普
及プログラム(PADATES)がもたらした効果を、エチオピア北西部を対象として分析すること
である。本研究では、普及プログラム参加者と非参加者で構成される 300 戸の農家世帯を含ん
だ3ヵ所の農村集落から得られた横断面データ(生産性分析のための 1,112 圃場のデータと効
率性分析のための 576 圃場データも含む)を使用した。比較対象となる正確な基準データがな
いため、農業普及プログラムの全体効果は把握できないが、本研究では通常の最小二乗法(重
回帰分析)のほか、非観測変数や潜在的な内生性を制御するために、Heckman の Treatment
effect モデル、傾向スコアマッチング法(Propensity score matching method)やトランス・ログ
型生産関数モデルを採用した。
さまざまなモデルによる評価は、土地生産性に対する農業普及活動のプラス効果を示してい
る。しかし、土地生産性に対するプラス効果は、限界的(ぎりぎり)なものであった(6%)。
なお、年齢、圃場サイズ、土壌の質、圃場傾斜度、改良種子の使用、化学肥料投入量、堆肥施
用、耕耘頻度、労働集約度、畜力(雄牛)利用、等のさまざまな要因が、土地生産性に対して
プラスの効果を与えていた。ただし、この結果は、土地生産性に対する農業普及活動のプラス
効果を示しているものの、相対的に裕福な農家や地区(kebele)行政当局の関係者が農業普及
活動の対象となっている傾向があり、普及プログラム参加者の選択には偏りが存在することが
明らかになった。かりに、普及プログラムの実施において深刻な参加者選択の偏りがなければ、
プログラム参加者は 20%まで土地生産性を増加させることが可能であったと考えられる。
他方、フロンティア生産関数に基づいた計量経済学的計測結果からは、普及プログラム参加
者の生産活動には実質的な非効率性が観測されることが明らかになった。普及プログラムの参
加者と非参加者は、テフ生産量を平均でそれぞれ 27.71%、28.56%ほど高めることが可能であ

127
る。このことは、農業普及プログラムへの参加は、テフ生産の技術効率性に対して統計的に有
意なプラスの効果をもたらしていなかったことを表している。さらに、両方の農業者グループ
(普及プログラム参加者と非参加者)は、全体的にかなり技術非効率性を抱えており、そのこ
とは、利用可能な技術や資源の利用により効率性を改善することを通じて、生産性を高める測
り知れない潜在力が存在することを示している。また、本研究では、家畜所有、信用サービス、
改良種子(品質や配給の適時性の問題により過大に強調することはできないが・・・)がテフ
生産の効率性を高めるうえで積極的な役割を備えていることの証拠を提示した。
他方、農業生産における労働のジェンダー領域に関わる分析からは、女性世帯主は男性世帯
主と比較して、家事や農業活動において約 50%多い時間を費やしていることが明らかになった。
対象地域においては、女性世帯主は作物生産、家畜生産や経営活動で重要な役割を果たしてい
る。しかし、作物・家畜生産に対する女性の重要な役割にも拘わらず、男性世帯主は 70.7%が
普及サービスの利用者であったのに対して、女性世帯主はわずか 15.8%だけが普及サービスの
利用者であった。生活のすべての側面で性間の平等性を強力に促進するエチオピア政府の唱導
にもかかわらず、本研究は男性優位の普及サービスの存在を示した。また、女性の資源に対す
る貧弱なアクセスと結びついて、資源を豊富に有する農業者を対象とするように普及員を仕向
けさせるように普及員に課された割り当て制度は、普及サービスにおいて女性を顧客とする精
神を否定する最も重要な要因である。
将来的に農業普及サービスへの参入障壁を排除することによって、あまり資源を持たない
農業者に普及プログラムを拡張するという極みから考えると、本研究の結果は、多様で良質な
農業投入物に対するアクセス改善と明確に規定された助言サービスが普及活動の参加者にとっ
てきわめて重要である、という価値ある政策的眼識を提供するものである。改良された多様で
良質な農業投入物の産出と改変にとって、研究と普及の間の連携の確立と強化は非常に重要な
ものである。くわえて、農業者の技術スキルや経営管理能力、需要主導型の畜産普及サービス
に対するアクセス、信用サービス、品質改良種子の利用可能性を改善する政策や戦略は、小規
模農業者の技術効率性を高めるのに役立つであろう。農業普及サービスの性間ギャップを減少
させるため、特に普及員に対して、またコミュニティ全体に対して、性に対応した訓練を提供
することにより、農業普及活動への女性参加を促進することは非常に重要なことである。さら
に、農業普及員の成果評価に使用される基準や普及サービス対象者を定める仕組みの改善は、
普及プログラムの目的と衝突するかも知れない量的目標の最小化に対する注意を必要とする。
くわえて、生産用資産の観点から男性と女性の間に存在する格差の捕獲が、性に対応したサー
ビスをデザインするうえで大いに強調されるべきである。
結論として、普及プログラムの信頼性や対応性を維持することと同様、土地生産性や利用可
能な技術・資源の有効利用の観点から期待される成果を獲得するために、普及システムの洗練
化が探求されるべきである。そのような洗練化は、政治活動、トップダウン、供給主導やパッ
ケージ的接近から普及システムを解き放す必要があるだろう。しかしながら、そのような変革
がなければ、エチオピアの農業普及システムは、小農生産システムが求めるニーズとは無関係
のものとなってしまう。

128
List of Publications
Asres Elias, Makoto Nohmi, Kumi Yasunobu & Akira Ishida (2013). Effect of Agricultural
Extension Program on Smallholders’ Farm Productivity: Evidence from Three Peasant
Associations in the Highlands of Ethiopia. Journal of Agricultural Science; Vol. 5, No. 8; 163-
181 (DOI:10.5539/jas.v5n8p163)
This article covers chapter 4.
Asres Elias, Makoto Nohmi, Kumi Yasunobu, Akira Ishida and Arega.D. Alene (2014). THE
EFFECT OF AGRICULTURAL EXTENSION SERVICE ON THE TECHNICAL
EFFICIENCY OF TEFF (ERAGROSTISTEF) PRODUCERS IN ETHIOPIA. American Journal
of Applied Sciences 11 (2): 223-239 (DOI:10.3844/ajassp.2014.223.239)
This article covers chapter 5.
Asres Elias, Makoto Nohmi, Kumi Yasunobu & Akira Ishida (2015). Does Gender Division of
Labour Matters for the Differences in Access to Agricultural Extension Services? A Case Study
in North West Ethiopia. Journal of Agricultural Science; Vol. 7, No. 1; 138-147
(DOI:10.5539/jas.v7n1p138)
This article covers chapter 6.