Embed Size (px)
DESCRIPTION
EFFECT OF AGGREGATION METHODS ON ECOLOGICAL ASSESSMENT. Paul Latour Ministry of Transport, Public Works and Water Management. CIS WORKSHOP ON NATIONAL CLASSIFICATION SYSTEMS FOR THE ASSESSMENT OF THE ECOLOGICAL STATUS OF SURFACE WATERS Paris, 11-12 June 2007. WATER MANAGEMENT. - PowerPoint PPT Presentation
Citation preview
EFFECT OF AGGREGATION METHODS ON ECOLOGICAL ASSESSMENT
Paul LatourMinistry of Transport, Public Works and Water Management
CIS WORKSHOP ON NATIONAL CLASSIFICATION SYSTEMS FOR THE ASSESSMENT OF THE ECOLOGICAL STATUS OF SURFACE WATERSParis, 11-12 June 2007
INFORMATIONNEEDS
INFORMATIONNEEDS
MONITORING STRATEGY AND
DESIGN
MONITORING STRATEGY AND
DESIGN
DATA COLLECTION/STORAGE
DATA COLLECTION/STORAGE
DATA ANALYSISDATA ANALYSIS
INFORMATIONUTILISATION AND
REPORTING
INFORMATIONUTILISATION AND
REPORTING
WATER MANAGEMENT
WATER MANAGEMENT
WFD
WFD-format
Annual water quality questionnaire
Database-structures
AQUO data standardized format
Monitoring programs, guidelines
Assessment systems
Annual report to ParliamentWFD reporting Regional and thematic reports
WFD-geo portal
THE MONITORING CYCLE
National water policy

Data analysis, assessment and reporting• Standard format for data storage / data
exchange• Harmonised metrics / objectives (e.g.
intercalibration) • Standard assessment tools • Harmonisation of calculation methods in
‘preprocessing’ of monitoring data ?
Does aggregation method influence assessment result?
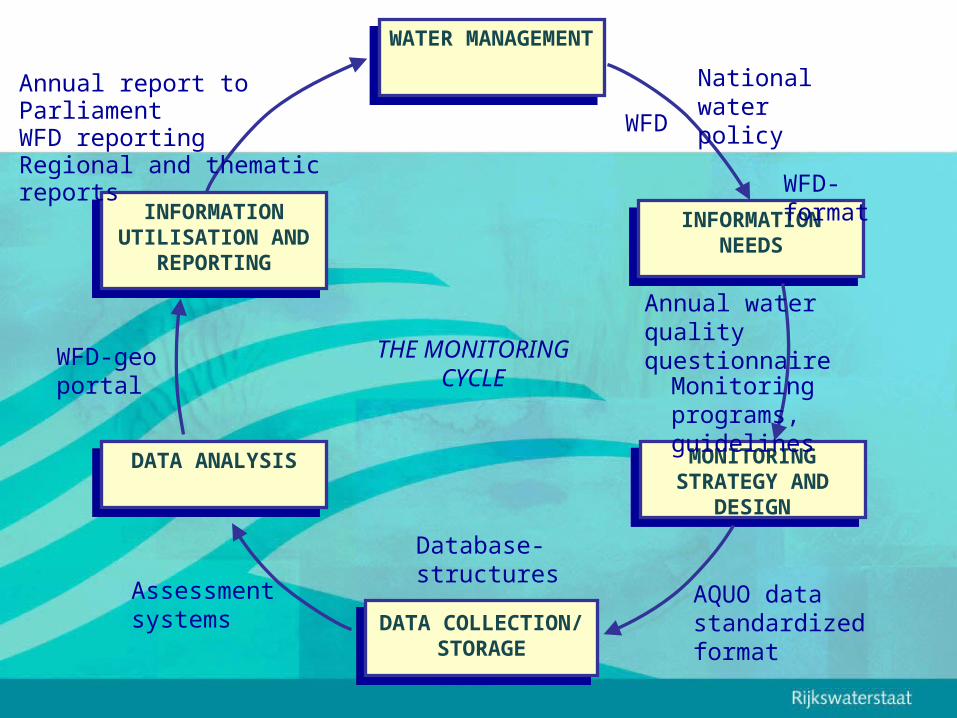
Examples of how indicative parameters may be combined to estimate the condition of the biological elements
Averaging: how and what
?
Results for individual parameters (metrics) of the element
macroinvertebrates, grouped according to the pressure to
which they are sensitive
Acidification
Changes to hydrology
Organic enrichment
Results for each group of macroinvertebrate
parameters responsive to a different type of pressure
Result for the element macroinvertebrates
On
e-ou
t, a
ll-ou
t
Combine parameters (e.g. by averaging)
Combine parameters (e.g. by averaging)
Result for water body
On
e-ou
t, a
ll-ou
t
Results for the element phytobenthos
Combine parameters (e.g. by averaging)
Results for individual parameters of the element phytobenthos that
have a general sensitivity to a range of pressures
Element LevelParameter Level Status classification
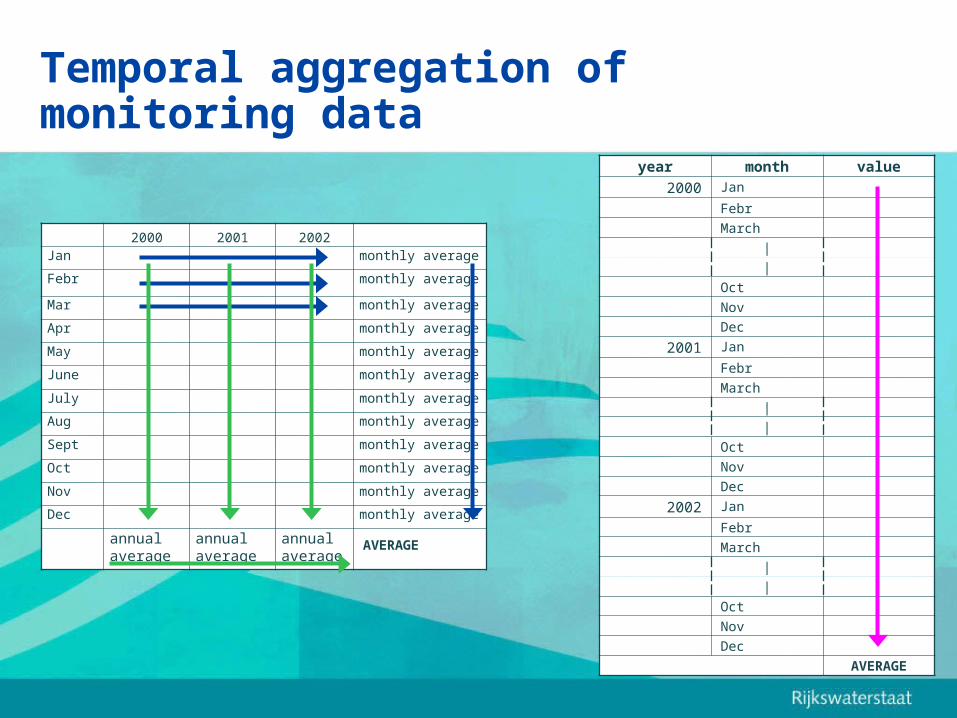
Temporal aggregation of monitoring data
year month value
2000 Jan
Febr
March
|
|
Oct
Nov
Dec
2001 Jan
Febr
March
|
|
Oct
Nov
Dec
2002 Jan
Febr
March
|
|
Oct
Nov
Dec
AVERAGE
2000 2001 2002Jan monthly average
Febr monthly average
Mar monthly average
Apr monthly average
May monthly average
June monthly average
July monthly average
Aug monthly average
Sept monthly average
Oct monthly average
Nov monthly average
Dec monthly average
annual average
annual average
annual average
AVERAGE
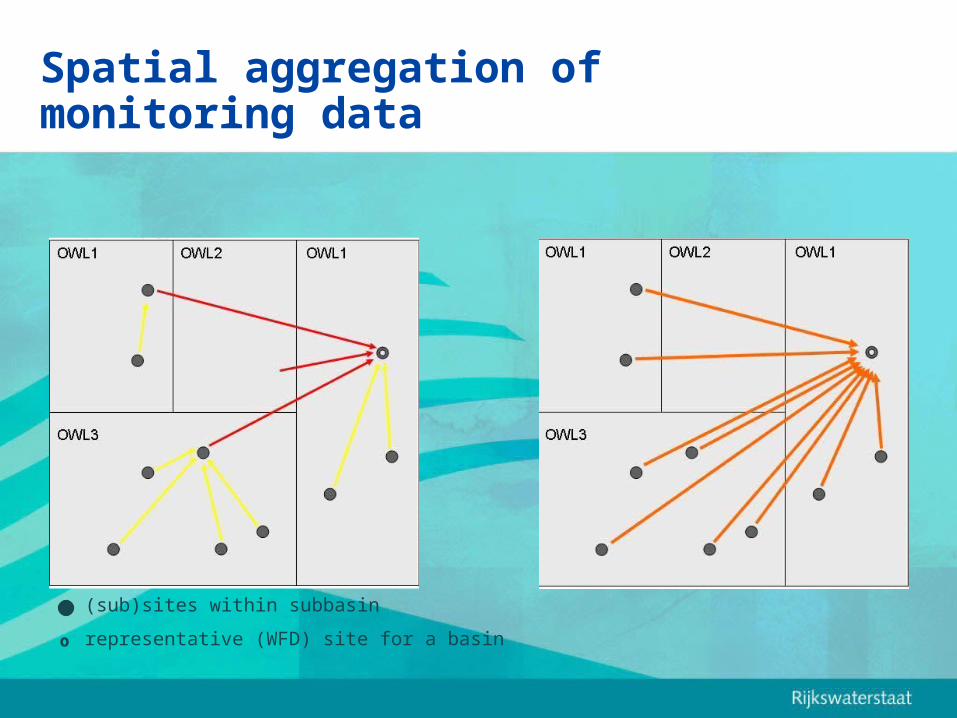
Spatial aggregation of monitoring data
(sub)sites within subbasin
º representative (WFD) site for a basin

Scenarios for aggregation
• Temporal aggregation in two ( ) or one ( ) calculation(s)
• Spatial aggregation: two alternatives ( )
• Temporal and spatial aggregation in different order
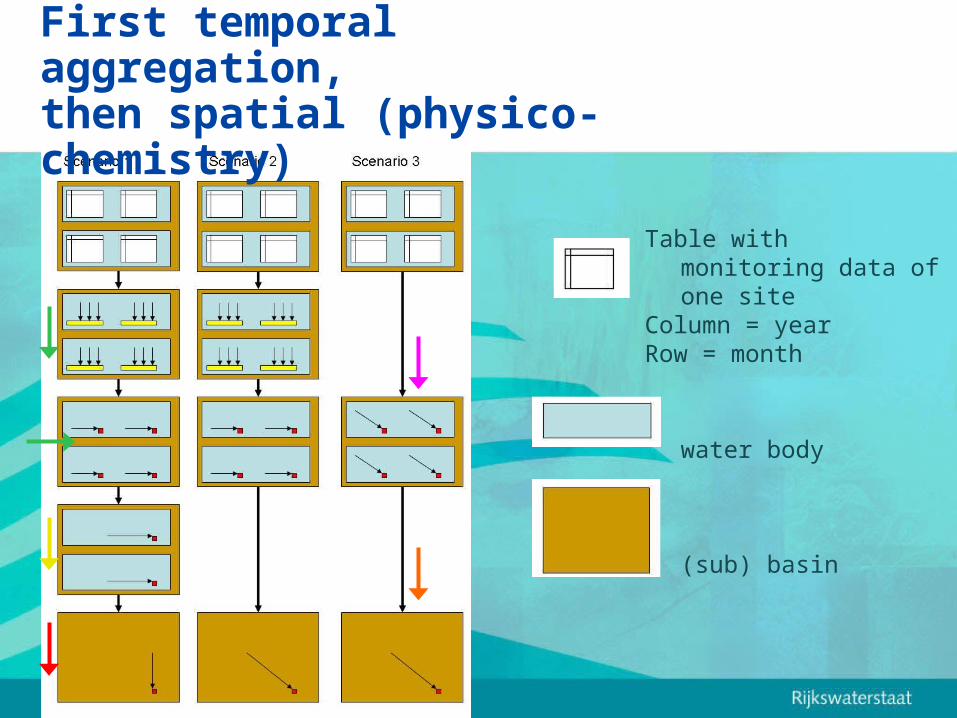
First temporal aggregation, then spatial (physico-chemistry)
Table with monitoring data of one site
Column = yearRow = month
water body
(sub) basin

First spatial aggregation, then temporal (physico- chemistry)
Table with monitoring data, average values of several sites
Table combining monitoring data of several sites

Temporal and spatial aggregation in one step (physico-chemistry)
9 out of 20 possibilities in case study

Water bodies in province of Flevoland
Water body types: mainly small canals and very shallow lakes

Monitoring sites WFD
WFD-sites assumed to be representative for underlying monitoring network
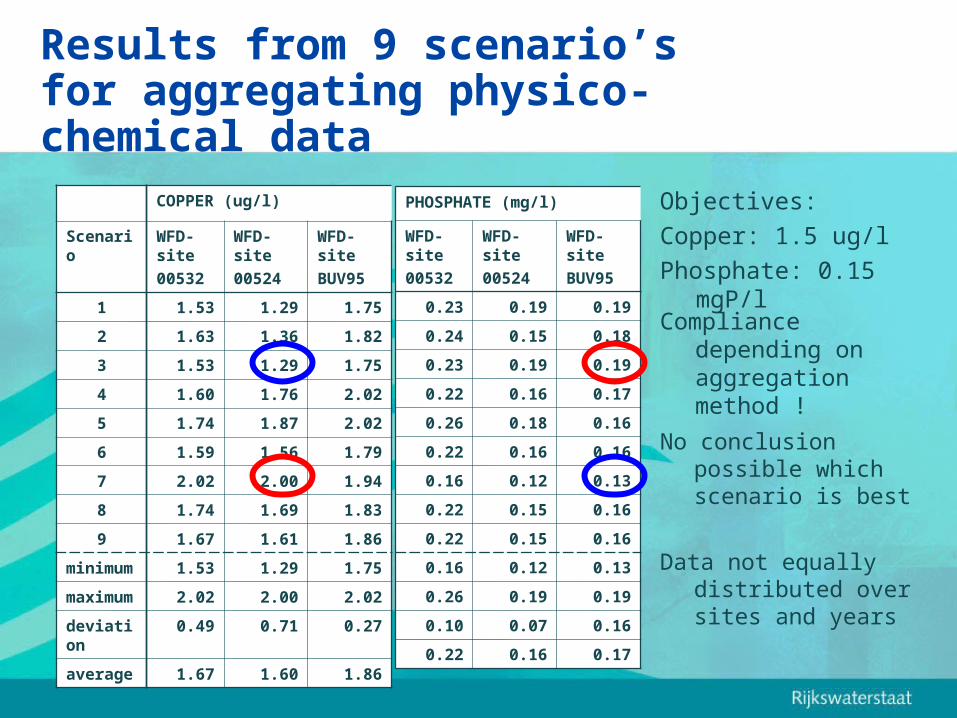
Results from 9 scenario’s for aggregating physico-chemical data
COPPER (ug/l)
Scenario
WFD-site00532
WFD-site00524
WFD-siteBUV95
1 1.53 1.29 1.75
2 1.63 1.36 1.82
3 1.53 1.29 1.75
4 1.60 1.76 2.02
5 1.74 1.87 2.02
6 1.59 1.56 1.79
7 2.02 2.00 1.94
8 1.74 1.69 1.83
9 1.67 1.61 1.86
minimum
1.53 1.29 1.75
maximum
2.02 2.00 2.02
deviation
0.49 0.71 0.27
average
1.67 1.60 1.86
PHOSPHATE (mg/l)
WFD-site00532
WFD-site00524
WFD-siteBUV95
0.23 0.19 0.19
0.24 0.15 0.18
0.23 0.19 0.19
0.22 0.16 0.17
0.26 0.18 0.16
0.22 0.16 0.16
0.16 0.12 0.13
0.22 0.15 0.16
0.22 0.15 0.16
0.16 0.12 0.13
0.26 0.19 0.19
0.10 0.07 0.16
0.22 0.16 0.17
Objectives: Copper: 1.5 ug/lPhosphate: 0.15
mgP/l
No conclusion possible which scenario is best
Data not equally distributed over sites and years
Compliance depending on aggregation method !

Consequence of unequal data-distibution: Effect of variation in time of monitoring results
Site A
Site B
average
Jan 9 9.0
Febr
8 8.0
Mar 6 6.0
Apr 4 1 2.5
May
1 1 1.0
June
0 0 0.0
July 1 2 1.5
Aug 2 2 2.0
Sept
3 3.0
Oct 6 6.0
Nov 8 8.0
Dec 9 9.0
4.8 1.2 4.7
3.0
If variation in time of data is high: spatial aggregation first
Site B: little data in period with high concentrations
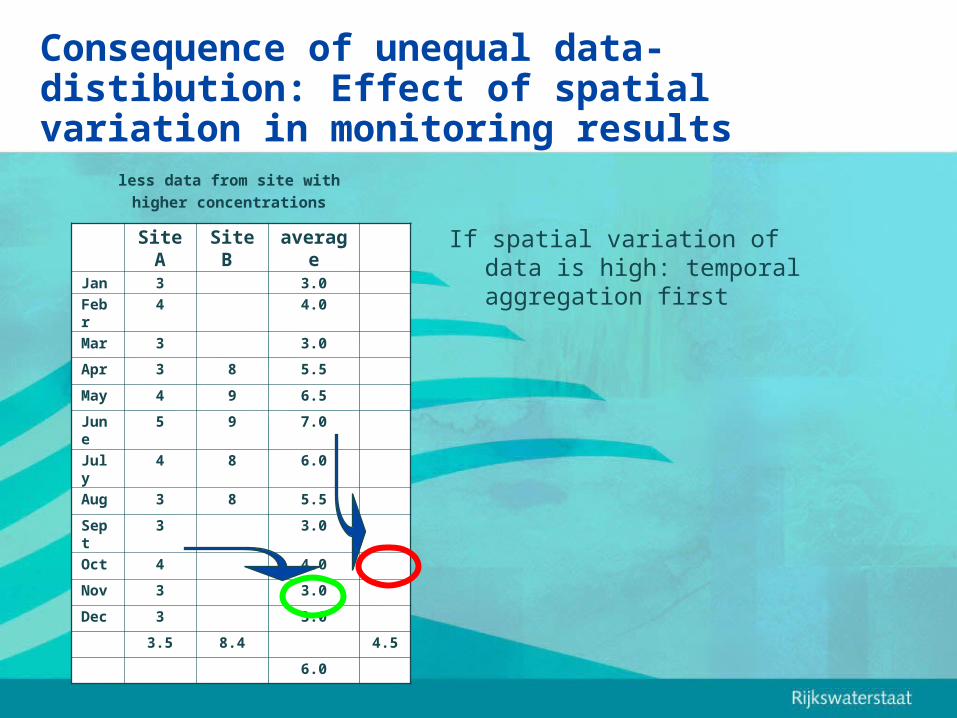
Consequence of unequal data-distibution: Effect of spatial variation in monitoring results
Site A
Site B
average
Jan 3 3.0
Febr
4 4.0
Mar 3 3.0
Apr 3 8 5.5
May
4 9 6.5
June
5 9 7.0
July 4 8 6.0
Aug 3 8 5.5
Sept
3 3.0
Oct 4 4.0
Nov 3 3.0
Dec 3 3.0
3.5 8.4 4.5
6.0
If spatial variation of data is high: temporal aggregation first
less data from site with
higher concentrations

Calculate EQR first, then temporal and/or spatial aggregation (biology)
Table with monitoring data of one site
Column = yearRow = species
water body
(sub) basin
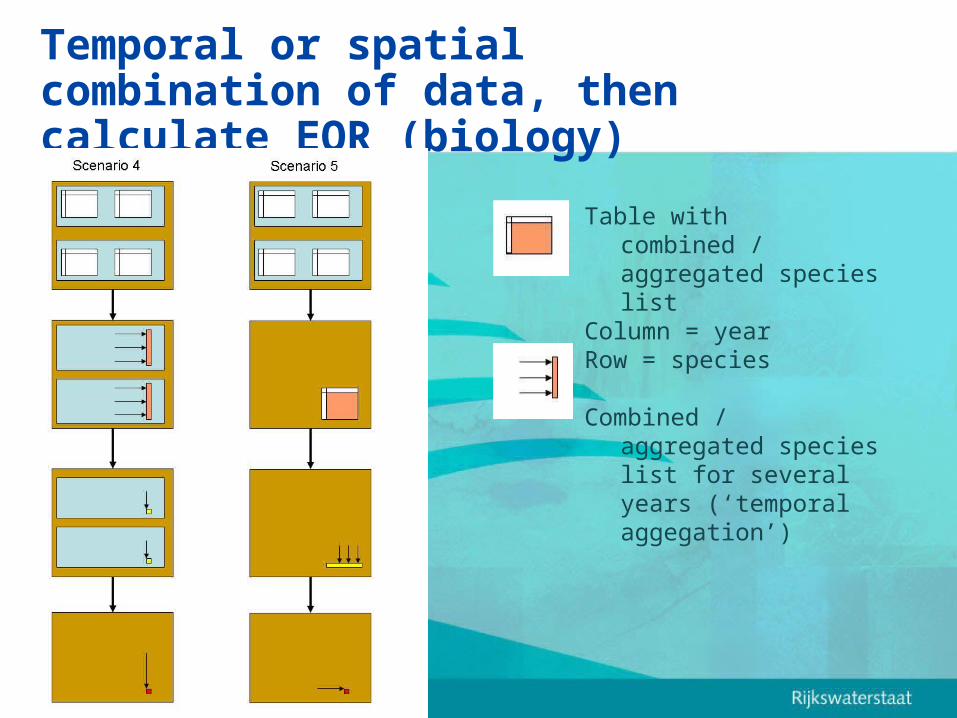
Temporal or spatial combination of data, then calculate EQR (biology)
Table with combined / aggregated species list
Column = yearRow = species
Combined / aggregated species list for several years (‘temporal aggegation’)

Results from 5 scenario’s for aggregating biological data
Scenario Large ditches (tochten)
Small canals (vaarten)
Lakes
Macrophytes EQR
1 0.014 0.067 0.059
2 0.013 0.078 -
3 0.136 0.077 0.039
4 0.478 0.293 0.038
5 0.573 0.203 -
Macro-invertebrates EQR
1 0.420 0.366 0.390
2 0.415 0.356 0.390
3 0.419 0.366 0.390
4 0.504 0.416 0.390
5 0.520 0.414 0.390
Dutch metric for assessing macrophytes: at the level of water body (scenario 1,2 and 3 not permitted)
Dutch metric for assessing macro-invertebrates is validated according to scenario 1/2/3 (EQR at site level)
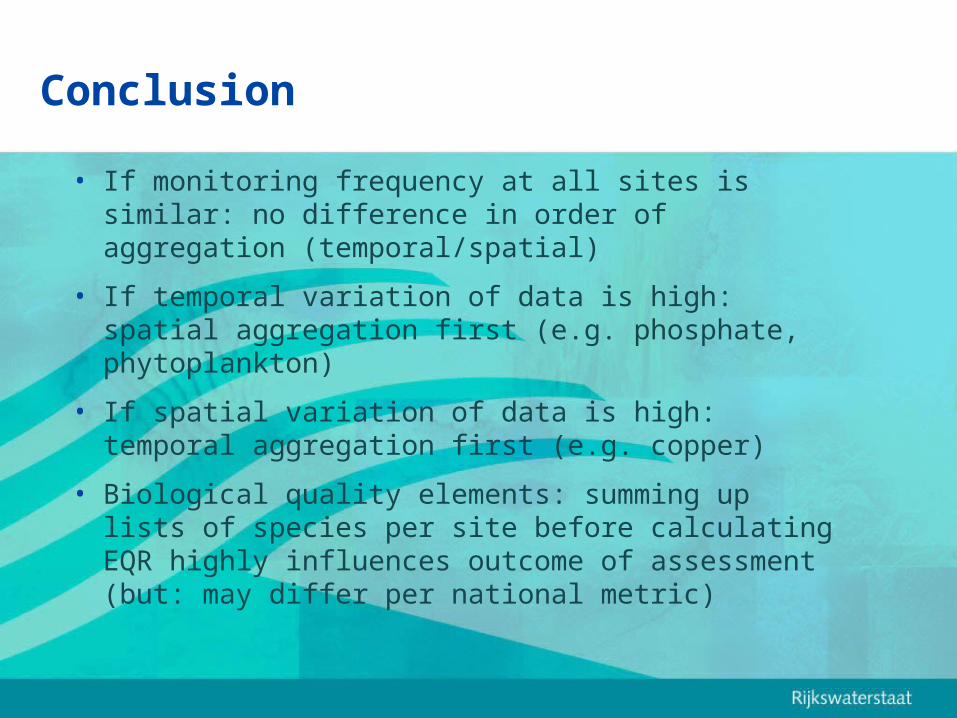
Conclusion
• If monitoring frequency at all sites is similar: no difference in order of aggregation (temporal/spatial)
• If temporal variation of data is high: spatial aggregation first (e.g. phosphate, phytoplankton)
• If spatial variation of data is high: temporal aggregation first (e.g. copper)
• Biological quality elements: summing up lists of species per site before calculating EQR highly influences outcome of assessment (but: may differ per national metric)


![BEHAVIORAL ECOLOGY THE EFFECT€¦ · 1976] Aspey--BehavioralEcologyin Schizocosa 43 the edge effect posesinterestingconsiderations. Forexample, pos- sible ecological and behavioral](https://img.dokumen.tips/doc/110x75/5fc9e36542449c547531b1bd/behavioral-ecology-the-effect-1976-aspey-behavioralecologyin-schizocosa-43-the.jpg)