Embed Size (px)
Citation preview

1
Effect of a Gurney flap on the performance of an axial fan 1
Chen Liu, Haijun Xie, Jun Xu, Chen Jian*, Ren Dai 2
School of Energy and Power Engineering, University of Shanghai for Science and Technology 3
E-mail: [email protected] 4
Abstract: 5
The Gurney flap (GF) is a miniature lift-enhancement device and is usually mounted at the trailing 6
edge of an airfoil. The GF and has been successfully applied to isolated airfoils, multi-element 7
airfoils, and aircraft wings as well as helicopter rotor due to its attractive features of simplicity, cost-8
effective and separation control. The GF also has aroused the attention of researchers in the 9
turbomachinery industry. However, limited studies are currently available on the application of a 10
GF to an axial fan. 11
Hence, in this paper, we conduct a wind tunnel and computational fluid dynamic (CFD) 12
investigation on an axial fan profiled with a NACA 65-(12)10 airfoil to evaluate the effect of the GF 13
on the performance of the fan. We also present the detailed flow features of the fan with and 14
without the GF after validating the simulation results with the experimental results. The 15
experimental results show that as the GF is installed higher on the fan blade, it can produce a higher 16
total pressure rise accompanied with a greater loss of efficiency. The installation of the GF also 17
enlarges the work capacity of the fan. Detailed flow field analysis, including the surface pressure 18
distribution, vorticity distribution at the trailing edge and streamline distribution of the fan, is 19
carried out to understand the mechanisms of the effect of the GF on the performance of the fan. 20
Keywords: Axial fan; Gurney flaps; wind tunnel testing; CFD investigation; pressure rise coefficient; 21
Preprints (www.preprints.org) | NOT PEER-REVIEWED | Posted: 11 December 2017 doi:10.20944/preprints201712.0065.v1
© 2017 by the author(s). Distributed under a Creative Commons CC BY license.

2
1 Introduction 22
The Gurney flap (GF), invented by a race car driver Dan Gurney in 1960, is a small lift-enhancement 23
device and is usually mounted at the trailing edge of an airfoil. A Gurney flap with a height of 2% 24
of the airfoil chord (2%C) can increase the maximum lift coefficient by 21% and lift-to-drag ratio by 25
35% on a NACA0012 airfoil [1]. The lift enhancement mechanism stated by Liebeck is that the 26
existence of the Gurney flap generates a pair of counter-rotating vortices downstream of the 27
Gurney flap and creates a region of low pressure. This region contributes to the positive lift-28
element distribution on the upper suction side of the airfoil and negative lift-element distribution 29
on the lower pressure surface of the airfoil. 30
Because of its structural simplicity, ease of manufacture and cost-effectiveness [2], the GF has 31
attracted much attention from researchers in many areas. Most of the previous researchers have 32
focused on the utilization of a Gurney flap on isolated airfoils, multi-element airfoils and aircraft 33
wings. 34
Wang J., et al[3] studied the influence of the mounting location of the GF on the performance of a 35
NACA0012 airfoil. Four different mounting locations (S = 0%C, 2%C, 4%C and 6%C) were studied. 36
The results showed that the increment of the lift coefficient decreased when the GF was moved 37
forward to the leading edge. The mounting angle was also studied by Traub L.W., et al[4]. They 38
found that a perpendicular GF generated the lowest lift-to-drag ratio. GFs at 45°and 60° produced 39
the maximum lift-to-drag ratio. Kobayashi T., et al[5] came to a similar conclusion. The 40
configuration of the GF was investigated by Dan and Vijgen, P.M., et al [6, 7] using a sawtoothed 41
GF for an isolated airfoil. They indicated that the sawtoothed GF improved the lift coefficient and 42
Preprints (www.preprints.org) | NOT PEER-REVIEWED | Posted: 11 December 2017 doi:10.20944/preprints201712.0065.v1

3
reduced the drag coefficient. This was attributed to a reduction in the effective windward area. 43
A large number of researchers have used GFs on dual or multi-element airfoils or wings for aircraft 44
applications. Storms B.L, et al[8, 9] utilized a 0.5% chord GF and a 1% chord GF on a NACA632-45
215(B) airfoil to increase the maximum lift coefficient by 10.3% when the deflection angle of the 46
slotted flap was 42 degrees. Myose R et al[10, 11]mounted a 1% chord GF at the trailing edge of 47
the main and flap elements on a two-element GA(W)-2 airfoil. It was found that the “Flap GF” and 48
“Flap main GF” can enhance the lift coefficient, but the “main GF” reduces the lift coefficient 49
compared to a “clean” airfoil. An investigation of the effect of a GF on multi-element airfoils can 50
also be found in references [12]. Traub, L. W, et al[13]performed a wind tunnel investigation to 51
examine the dependence of the Gurney flap on various geometric descriptive parameters, and the 52
data suggested that the lift augmentation of the Gurney flap varied linearly with the flap height, 53
porosity and projected height of the flap normal to the surface. Li et al[14] tested four traditional 54
plain GFs with heights ranging from 0.01C to 0.05C as well as four 0.05C serrated GFs with different 55
serration heights ranging from 0.01C to 0.05 C on a cropped nonslender delta wing. They found 56
that a proper GF can provide a significant improvement in performance. Zhan and Ji Wang[15]also 57
tested a delta wing with GFs and apex flaps. The experimental results indicated that the lift 58
coefficient was improved for different angles of attack (AOA) for a delta wing with GFs and apex 59
flaps. Albertani, R [16] used a simple GF to improve the aerodynamic characteristics of a micro 60
aerial vehicle wing. With GFs, the maximum lift coefficient was increased by 26.5% in comparison 61
with clean wings. Additional applications of the GF on wings can be found in [17, 18]. 62
Successful applications of GFs on an isolated airfoil, multi-element airfoil or wings as well as the 63
Preprints (www.preprints.org) | NOT PEER-REVIEWED | Posted: 11 December 2017 doi:10.20944/preprints201712.0065.v1

4
appealing features of the simplicity, lift enhancement and separation control of the GF have also 64
given rise to the attention of experts in other fields, especially in the turbomachinery industry. 65
Janus, J. M.,[19]conducted numerical and experimental analyses of the size effect of the GF on the 66
performance of a cascade configuration derived from a single rotating fan with six blades. Two 67
baseline geometries with varied GFs were tested; one had a sharp trailing edge, and the other had 68
a round trailing edge. The results suggested that the flap size should be limited to between 1%~1.5% 69
of the chord. Byerley, A. R., et al[20] experimentally investigated the influence of the Gurney flap 70
on the location and size of the laminar separation bubble on turbine blades in a linear cascade. The 71
testing data showed that the lift generated by the blade was increased and that the Gurney flap 72
also produced a larger wake. It was suggested that Gurney flaps might possibly be implemented in 73
a semi-passive manner. They could be deployed for low a Reynolds-number operation and then 74
retracted at high Reynolds numbers when separation is not present. Large GFs with heights of 0.1C, 75
0.2C and 0.3C [21] were tested at a fan facility. It was found that blades with GFs produce higher 76
pressures than those without GFs. A GF of 30% of the chord created large volumetric flowrates and 77
reduced the sound pressure level by 4 dB. A GF of 10% of the chord increased the static efficiency 78
by 18%. The effect of GFs on the performance of a centrifugal fan was investigated by Thomas, M. 79
K. D et al [22] at low Reynolds numbers. The height of the GFs was 3.175 mm, which was 15.9% of 80
the blade exit height. They observed that the GF improved the performance of the fan considerably 81
at low Reynolds numbers and marginally at higher Reynolds number. 82
As indicated by the above-mentioned literature survey, there have been a large number of studies 83
on the effect of GFs on one-element airfoils, multi-element airfoils and wings. However, there have 84
Preprints (www.preprints.org) | NOT PEER-REVIEWED | Posted: 11 December 2017 doi:10.20944/preprints201712.0065.v1
5
been few studies of the application of GFs to fans, especially with regard to axial fans. The 85
application of GFs seems to be a promising approach to improve the performance of axial fans. 86
Thus, the purpose of this paper is to investigate the performance of an axial fan with GFs by 87
experimental measurement. Flow features were interrogated by the CFD (Computational Fluid 88
Dynamics) code to comprehensively understand the physics involved in the GF. The pressure 89
coefficient, total pressure efficiency and static pressure efficiency of the clean fan and axial fans 90
with varied plate GFs were tested first. Then, the simulation results were compared with the tested 91
results to validate the computational strategies. In the end, we analyzed and visualized the flow 92
features of a fan with GFs. The latter work offers a theoretical foundation for further optimization 93
of axial fans. 94
2 Experimental set up 95
2.1 Testing Facility 96
Axial fan testing was performed in the Energy and Power Engineering Department of the University 97
of Shanghai for Science and Technology. The testing rig shown in Figure 1 was built in compliance 98
with the Chinese national standard for fan measurement (GB/T1236-2000). The flow quality of the 99
plenum is guaranteed. Beyond a velocity of 10 m/s, the variation in the total pressure and static 100
pressure field is less than 0.1% and 0.3%, respectively, while the maximum deflection of the flow 101
angle is below ±0.2 degree, and the turbulence intensity is less than 0.5% at the test section. 102
The flow plenum is divided into four parts (long entrance duct, diffusion nozzle, plenum and 103
exhaust duct). The lengths of these four parts are approximately 3580 mm, 587 mm, 1600 mm and 104
Preprints (www.preprints.org) | NOT PEER-REVIEWED | Posted: 11 December 2017 doi:10.20944/preprints201712.0065.v1

6
370 mm, respectively. The diameter of the long duct is approximately 498 mm, and the diameter 105
of the inlet chamber is approximately 1240 mm. Upstream of the long entrance duct, there is a 106
flow nozzle, where several additional taped holes are mounted. Circumferential tapes are used to 107
measure the static pressure difference across the flow nozzle to calculate the volumetric flowrate 108
mq . A flow regulating valve (position 3) is installed 2145 mm downstream of the plenum inlet to 109
adjust the volumetric flowrate of incoming air. An auxiliary fan (position 4) is located 985 mm 110
downstream of the regulating valve to adjust the flow rate through a frequency converter to 111
provide sufficient pressure at the desired airflow and overcome the upstream pressure resistance. 112
An airflow honeycomb (position 5) is installed 1637 mm downstream of the auxiliary fan to 113
uniformly straighten the incoming flow. 114
115
116
1-Flow Nozzle, 2- Measurement point of flow rate, 3- Flowrate regulating valve 117
4-Auxiliary Fan, 5- Airflow honeycomb, 6- Measurement point of inlet static pressure to the fan 118
7- Testing Fan, 8- Motor 119
Preprints (www.preprints.org) | NOT PEER-REVIEWED | Posted: 11 December 2017 doi:10.20944/preprints201712.0065.v1

7
120
Figure 1 Testing rig for the fan 121
The testing fan is installed inside the exhaust duct, as shown in Figure 2. The exhaust duct consists 122
of four parts (inlet collector, hub fairing, fan and motor cartridge). Using this design, the tested 123
axial fans are the only variable feature. We only need one inlet collector, one hub fairing, one motor 124
cartridge and one of four optional fans. The fan is the only component that must be changed for 125
each prototype. The exhaust duct was manufactured using a computerized numerical control (CNC) 126
machine. For ease of manufacturing and to achieve a high mechanical strength, acrylonitrile-127
butadiene-styrene (ABS) was chosen as the material for the exhaust duct. 128
129
Plenum
Exhaust duct
DC Power supply
Tachometer
Long entrance
duct
Diffusion duct
Pressure
transmitter
Airflow
Inlet collector Hub fairing Fan Motor cartridge
Preprints (www.preprints.org) | NOT PEER-REVIEWED | Posted: 11 December 2017 doi:10.20944/preprints201712.0065.v1

8
Figure 2 Simulated duct 130
2.2 Fan Models 131
One prototype fan and three fans with GFs are tested in this paper. They are axial fans with 19 132
straight blades and have a low aspect ratio. This type of fan is commonly used for room ventilation 133
and air-conditioning systems. Generally, fans with GFs have the same geometrical sizes as the 134
prototype fan. The mean section airfoil of the fan blades is a NACA 65-(12)10 airfoil with a height 135
of 49 mm and a chord length of 41 mm. The diameter of the shroud and hub is Dt=300mm and 136
Dh=200mm, respectively. The tip clearance is 1 mm, and the designed rotational speed is 1450 RPM. 137
More information about these axial fans can be found in Table 1. 138
Table 1 The design parameters of the fan 139
Rotational speed (rpm) 1450 Shroud Diameter (mm) 300
Rated flowrate (m3/h) 2191 Hub ratio 0.667
Design pressure rise (Pa) 98 Hub Diameter (mm) 200
Blade stagger angle (°) 45.8 Incidence (°) 14.2
Efficiency 50% Blade number 19
We add the GF directly to the trailing edge of the blade of the prototype fan to form an axial fan 140
with a GF. Three flaps with different heights 1.25%, 2.5% and 5% of chord length are studied, which 141
means that the height of the GFs are only 0.51 mm, 1.03 mm and 2.05 mm. This is too small of a 142
dimension to be fabricated by a CNC. Thus, during testing, a special type of tape was adopted to 143
form the GFs. Figure 3 presents the real models of axial fans with and without GFs. The special 144
black tape has different thicknesses, and we can choose an appropriate thickness to form the GFs. 145
Preprints (www.preprints.org) | NOT PEER-REVIEWED | Posted: 11 December 2017 doi:10.20944/preprints201712.0065.v1

9
146
147
Prototype Fan GF Fan 148
Figure 3 Prototype Fan and GF-Fan 149
2.3 Data acquisition devices and reduction 150
2.3.1 Data acquisition 151
The data acquisition devices used are mainly a pressure transmitter, thermometer, hygrometer 152
tachometer, and torquemeter. First, the pressure, temperature and humidity of the surrounding 153
environment ( aP , aT and h ) are recorded. Second, one pressure transmitter with an accuracy of 154
± 0.2% placed at point 2 in Figure 1 is used to measure the static pressure ( 2p ) at the wind tunnel 155
entrance to calculate the volumetric flowrate ( mq ). The total inlet pressure ( intP , ) of the fan is 156
measured by a second pressure transmitter at point 6 in Figure 1. The static pressure in the plenum 157
can be regarded as the total pressure since the airflow speed is controlled to less than 1 m/s. The 158
rotational speed of the fan ( N ) is gained by a tachometer with an accuracy of 0.1% ± 1 significant 159
digit. The power ( eP ) to the motor is obtained through the torquemeter. Table 2 presents detailed 160
information about the data acquisition devices, including the name, range and accuracy. 161
Preprints (www.preprints.org) | NOT PEER-REVIEWED | Posted: 11 December 2017 doi:10.20944/preprints201712.0065.v1

10
Table 2 Detailed information about the data acquisition devices 162
Name Measured parameters Range Accuracy
Pressure transmitter
Inlet duct static pressure 0~1500 Pa ± 0.2%
Chamber static pressure 0~1500 Pa ± 0.2%
Torquemeter Power of Motor 0~500 W ± 0.5%
Tachometer Motor Rotational speed 30~9999 rpm
0.1% ± 1 significant
digit
Thermometer Ambient Temperature -40~60℃ ±0.6℃
Hygrometer Ambient Humidity 0~100%RH
±3%RH (0~90%RH)
±5%RH (0~100%RH)
2.3.2 Data reduction 163
The purpose of fan testing is to obtain a performance map of the fan, including the pressure rise, 164
efficiency, and shaft power as a function of the flowrate or rotational speed. Through the above 165
data acquisition system, we can easily obtain values for aP , aT ,h , 2p , 6p , intP , , N and eP . 166
The static pressure through the inlet nozzle is given by 167
2PPp a 168
The mass flow rate can be calculated by the following formula using elementary mass conservation 169
and Bernoulli’s law 170
2
24
inm a
dq p
171
where is a constant to account for the nozzle discharge coefficient and can be obtained from the 172
Preprints (www.preprints.org) | NOT PEER-REVIEWED | Posted: 11 December 2017 doi:10.20944/preprints201712.0065.v1

11
Chinese national standard of fan measurement (GB/T1236-2000); is the expansion coefficient 173
of the nozzle, a
a
P
T55.01 ; aT is the atmospheric temperature; aP is the atmospheric 174
pressure; ind is the flowmeter differential pressure measurement section diameter;and a is 175
the air density in the ambient environment. 176
The total pressure rise of the fan can be expressed in this form: 177
6,,, PPPPP outtintoutt 178
where outtP , is defined by 179
, ,t out a d outP P P 180
and outdP , is the dynamic pressure of the exhaust airflow of the fan. Considering the balance of 181
mass flowrate, outdP , is given by 182
2
22
2,2
1
A
qP moutd
183
where mq is the mass flowrate of the air, 2A is the outlet area, 2 is the density of the outlet air, 184
and a 2 due to the incompressibility assumption for the low velocity. 185
The static pressure rise of the fan can be expressed in the form: 186
6PPPPp aina 187
The total pressure rise coefficient (TPRC) tpC . , static pressure rise coefficient (SPRC) spC . , flow 188
coefficient q , total pressure efficiency (TPE) t and static pressure efficiency(SPE) s are 189
calculated as follows 190
2,u
PC tP
191
Preprints (www.preprints.org) | NOT PEER-REVIEWED | Posted: 11 December 2017 doi:10.20944/preprints201712.0065.v1

12
2,u
pC sP
192
uA
qq m
193
e
t
q
e
v
P
P 194
ee
v
P
qp
s 195
where vq is the volume flowrate and e is the efficiency of the motor. 196
2.4 Uncertainty analysis 197
According to error theory, measurement error is composed of system error, random error and gross 198
error. The experimental data in this paper is mainly obtained by the data acquisition devices. The 199
measurements of all of the working conditions are repeated several times by different people. This 200
may effectively eliminate the random errors and systematic errors in personnel readings. The gross 201
error may be eliminated by hand checking. Thus, the experimental error is focused on the system 202
instrument error. 203
Assume that the directly measured quantities are1x ,
2x …,mx and the indirectly measured 204
quantity is y. The functional relation between them is: 205
),...,,,( 321 mxxxxfy 206
If the direct measurement errors are mxxx ,...,, 21, they have affected the indirectly 207
measured values, so: 208
m
ii
i
m
m
xx
fx
x
fx
x
fx
x
f
12
2
1
1
...y
209
Preprints (www.preprints.org) | NOT PEER-REVIEWED | Posted: 11 December 2017 doi:10.20944/preprints201712.0065.v1

13
Comprehensive error can be expressed as: 210
m
ii
i
xx
fL
1
22 )( 211
1. Gas constant 212
a
u
P
PhR
378.0
1
287
213
aP is the atmospheric pressure and h is the relative humidity. uP is the saturation steam 214
pressure. 215
4147.6
78.239
438.17exp
a
au
T
TP
216
aT is the atmospheric temperature. 217
The error of the gas constant can be calculated by the following formula: 218
222 )()()( u
u
a
a
R PP
RP
P
Rh
h
RL
219
2. Atmospheric density 220
)15.273( a
aa
TR
P
221
The error of the atmospheric density can be calculated by the following formula: 222
222 )()()( a
a
aaa
a
a Tt
RR
PP
L
223
3. Volumetric flow rate 224
aa
mv
dq
q
p24
2in
225
The error of the volume flow can be calculated by the following formula: 226
Preprints (www.preprints.org) | NOT PEER-REVIEWED | Posted: 11 December 2017 doi:10.20944/preprints201712.0065.v1

14
22 )()( a
a
vvq
qP
P
qL
227
4. Exhaust airflow density 228
)15.273( 2
2tR
Pa
229
pav
ea
cq
PTt
e2 230
pc is the specific heat. 231
The error of the exhaust airflow density can be calculated by the following formula: 232
22
2
22222 )()()(L2
tt
RR
PP
aa
233
5. Total pressure of airflow 234
pPP
A
qP
PPP
PPP
aint
voutd
outdaoutt
intoutt
,
2
2
2,
,,
,,
)(2
1
235
outtP , is the exit total pressure. intP , is the inlet total pressure, and outdP , is the exit dynamic 236
pressure. 237
The error of the exhaust airflow density can be calculated by the following formula: 238
2,
,
2,
,
)()( int
int
outt
outt
P PP
PP
P
PL
239
6. Efficiency of the fan 240
e
t
e
v
P
Pq 241
The error of the efficiency of the fan can be calculated by the following formula: 242
Preprints (www.preprints.org) | NOT PEER-REVIEWED | Posted: 11 December 2017 doi:10.20944/preprints201712.0065.v1

15
222 )()()( PP
PP
L rv
v
re
e
rr
243
The final results are shown in Table 3. 244
Table 3 Error range of the calculation parameters 245
Measurement parameters Comprehensive accuracy
1 Gas constant ±0.796
2 Atmospheric density ±0.3%
3 Volume flow ±0.42%
4 Fan outlet air density ±0.03%
5 Fan total pressure ±4.69Pa
6 Fan efficiency ±1.6%
3 Numerical method 246
3.1 Computational domain modeling 247
It is recommended that the computational domain be the image of the actual tested conditions. 248
Hence, we created the computational domain including the upstream domain (plenum), axial fan 249
and downstream domain (ambient environment). The upstream and downstream domains are 250
extended six times the diameter of the fan for better steadiness of flow. The whole computational 251
domain can be found in Figure 4. The GF size, especially the height, is relatively smaller than the 252
size of the other parts. It is difficult to resolve this small feature in a large computational domain 253
to achieve a high quality mesh. Popular ICEM software is adopted to generate the unstructured 254
Preprints (www.preprints.org) | NOT PEER-REVIEWED | Posted: 11 December 2017 doi:10.20944/preprints201712.0065.v1

16
tetrahedral mesh. Boundary layers are paved on the solid wall surfaces of the blades, hub and 255
shroud to ensure that y-plus is less than 1 to resolve the near-wall flow properly. The mesh size is 256
also refined in the areas that are close to the axial fan to properly adapt to the large gradient 257
variation of the pressure and velocity. The detailed mesh around the fan blade is shown in Figure 258
4. 259
260
261
Figure 4 Detailed mesh around the fan blade. 262
3.2 Governing equations and simulation strategies 263
The flow through fan is taken as turbulent incompressible flow and is governed by the 264
Reynolds-averaged Navier-Stokes (RANS) equations, 265
0i
i
u
x
(1) 266
where iu is the averaged velocity component in the ith-direction. 267
Preprints (www.preprints.org) | NOT PEER-REVIEWED | Posted: 11 December 2017 doi:10.20944/preprints201712.0065.v1

17
2_____( )i ii j i
j i j j
u upu u F
t x x x x
(2) 268
where denotes the density, _____
i ju u is the Reynolds stress, p is the averaged pressure, 269
denotes the stress tensor and iF is the average external force component. 270
The Reynolds stress, _____
i ju u , is modeled by the Boussinesq approximation, 271
_____ 2
3
ji ii j t ij t
j i j
uu uu u k
x x x
(3) 272
where t denotes eddy viscosity and k is the turbulent kinetic energy and is defined as [5]: 273
_____1
2i jk u u (4) 274
The above equations need turbulence closure for resolution. The RNG k-ε turbulence model and 275
SIMPLE algorithm were applied to the steady simulation calculation of the flow field in the small 276
axial flow fan [23-25]. The shear-stress-transport (SST) turbulent model was adopted by Kim to 277
calculate the flow field of a tunnel ventilation jet fan[26]. This turbulence model is sensitive to 278
adverse pressure gradients and boundary layer separation, which are more common when an axial 279
fan is under a state of rotational periodicity. Generally, in the case of shear-stress-transport (SST) 280
turbulent models or k-ω turbulent models, using the wall function is known to be valid when the 281
y-plus values are not higher than 300 [7]. The shear-stress-transport (SST) turbulent model, which 282
has the advantages of both k-ω and k-ε, employs the k-ω model at the near-wall and the k-ε model 283
in the bulk-flow region, a blending function that ensures a smooth transition between the two 284
models [27]. Since the SST model showed better predictions of flow separation along smooth 285
surfaces [27], it was adopted for use in this paper. 286
The finite volume method is used to discretize the governing equations. The second-order upwind 287
Preprints (www.preprints.org) | NOT PEER-REVIEWED | Posted: 11 December 2017 doi:10.20944/preprints201712.0065.v1
18
interpolation schemes are applied for the pressure and momentum equation, respectively. The 288
SIMPLE algorithm is adopted to handle the pressure-velocity coupling. The frozen rotor method is 289
utilized to address the data transform between the rotational and stationary zone interface. A 290
convergence criterion is prescribed to obtain a periodic variation of the torque of the fan as well 291
as a maximum residual less than 1.0x10⁻⁵. 292
4 Results and Discussion 293
4.1 Performance of the Fan 294
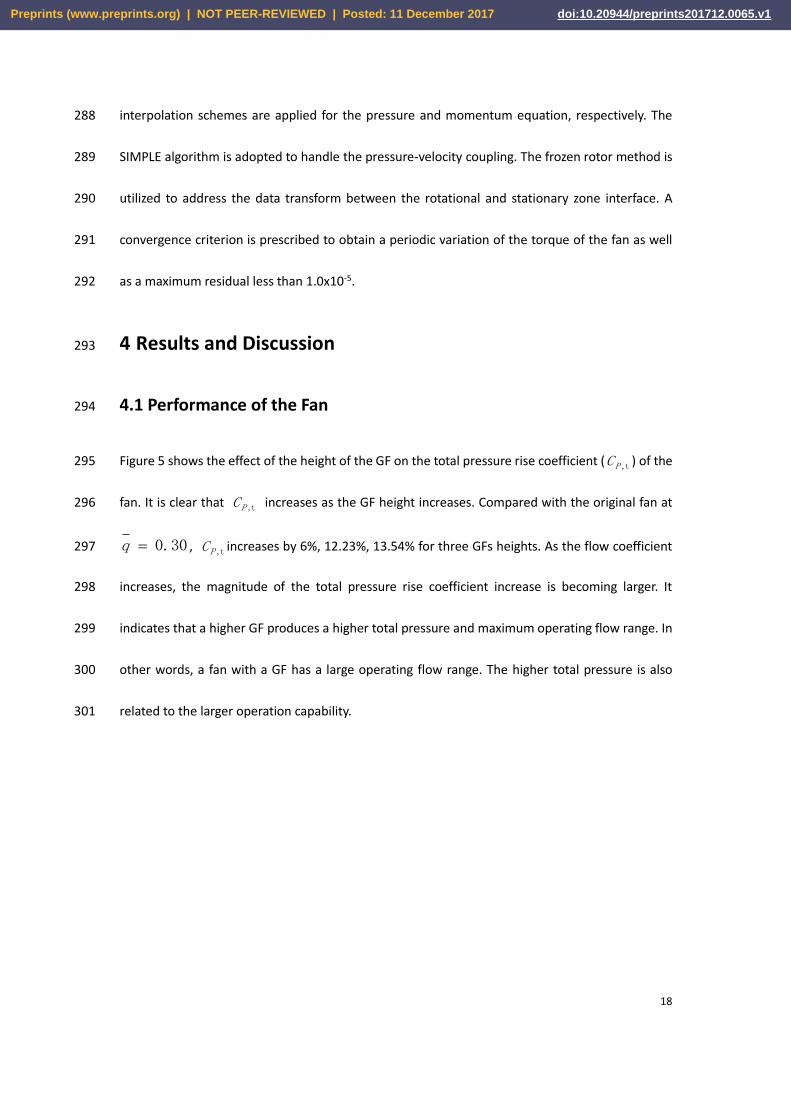
Figure 5 shows the effect of the height of the GF on the total pressure rise coefficient ( t,PC ) of the 295
fan. It is clear that t,PC increases as the GF height increases. Compared with the original fan at296
30.0q , t,PC increases by 6%, 12.23%, 13.54% for three GFs heights. As the flow coefficient 297
increases, the magnitude of the total pressure rise coefficient increase is becoming larger. It 298
indicates that a higher GF produces a higher total pressure and maximum operating flow range. In 299
other words, a fan with a GF has a large operating flow range. The higher total pressure is also 300
related to the larger operation capability. 301
Preprints (www.preprints.org) | NOT PEER-REVIEWED | Posted: 11 December 2017 doi:10.20944/preprints201712.0065.v1

19
302
Figure 5 Effects of GF height on the total pressure rise coefficient 303
Figure 6 shows the effects of the height of the GF on the total pressure efficiency ( t ) at different 304
flow coefficients. It is found that the total pressure efficiencies of fans with GFs are always lower 305
than that of the original. The difference between the total pressure efficiency curves is not obvious 306
in the flow coefficient range from 0.14 to 0.27 for fans with 1.25% and 2.5% chord GFs. As the flow 307
coefficient increases to 0.39, the difference among the four curves is increased. The total pressure 308
efficiencies at 30.0q for 1.25%, 2.5%, 5% chord GFs are 1.76%, 4.6%, and 6.7% lower than 309
that of the original fan, respectively. All of the above observations indicate that GFs with 1.25% and 310
2.5% chords have very small effects on the total pressure efficiency at low flow coefficients. As the 311
flow coefficient reaches a certain value, the influence of the height of the GF on the total pressure 312
efficiency is remarkable. 313
Preprints (www.preprints.org) | NOT PEER-REVIEWED | Posted: 11 December 2017 doi:10.20944/preprints201712.0065.v1

20
314
Figure 6 Effects of the GF height on the total pressure efficiency 315
The effect of the GF height on the static pressure efficiency ( s ) is presented in Figure 7. It 316
decreases with the increasing height of the GF in the flow coefficient range from 0.12 to 0.27. The 317
difference among the four curves of the static pressure efficiency is clear when the flow coefficient 318
varies from 0.12 to 0.27. This result is different from the conclusion determined from total pressure 319
efficiency. The maximum static pressure efficiencies of fans with 1.25%, 2.5%, 5% chord GFs are 320
1.04%, 1.65%, and 3.05% lower than that of the original fan, respectively. One possible reason for 321
the efficiency reduction may be the vortex formed by the GF at the trailing edge of the airfoil, 322
producing the loss. Another reason may be that the increased pressure difference between two 323
blade surfaces leads to an increase in clearance leakage. However, when the flow coefficient 324
becomes greater than 0.27, the opposite behavior is observed, in that the efficiency difference 325
becomes negligible with an increase in the height of the GF. Similar observations are found in the 326
studies of Manish et al [28]. 327
In some application circumstances of cooling, ventilation, vacuuming, dust removal and inflating, 328
0.15 0.20 0.25 0.30 0.35 0.40
20
30
40
50
60
70
ηt
(%)
q
0% GF
1.25%C
2.5%C
5%C
Preprints (www.preprints.org) | NOT PEER-REVIEWED | Posted: 11 December 2017 doi:10.20944/preprints201712.0065.v1

21
we need to increase the pressure ratio of the fan without a large efficiency loss due to a limitation 329
on space. The size of the fan is highly limited in a confined space. One potential solution for the 330
improvement of the work capability is through this simple modification of adding a GF. 331
332
Figure 7 Effects of the GF height on the static pressure efficiency 333
4.2 Validation of the simulation results 334
The simulation results were validated through a comparison of the tested pressure rise coefficients 335
with the computed values. Total pressure rise coefficients from simulations of the original fan and 336
fan with a 1.25% chord GF were compared with the corresponding results from the same fan. This 337
comparison is presented in Figure 8. The lines present the simulation results. The symbols are the 338
experimental results. It is evident that the computed values of the total pressure rise coefficient 339
agree well with the experimental results over the majority of the range. This proves that the chosen 340
simulation strategies are reliable. It also provides a solid foundation for the flow field analysis in 341
the following paragraphs. 342
0.12 0.18 0.24 0.30 0.36 0.42
0
5
10
15
20
25
30
35
ηs(%
)
q
0% GF
1.25%C
2.5%C
5%C
Preprints (www.preprints.org) | NOT PEER-REVIEWED | Posted: 11 December 2017 doi:10.20944/preprints201712.0065.v1

22
343
Figure 8 Comparison of the experimental and simulation results 344
4.3 Flow analysis of a fan with a GF 345
The following numerical simulation was carried out under the condition that the mass flow q is 346
0.028 kg/s. Figure 9 shows the distribution of vorticity, which is generated by the Q-criterion at the 347
trailing edge of the airfoil, colored by the static pressure. It is found that the airflow over the 348
original fan is separated from the trailing edge on the suction surface and that a shedding vortex is 349
generated downstream of the trailing edge. When GFs with different heights are added at the 350
trailing edge of the airfoil, it is observed that a low-pressure vortex area is formed to reduce the 351
adverse pressure gradient in the flow channel and accelerate the flow of air. This is a possible 352
reason for the enhancement of the adsorption force at the trailing edge of the suction surface. 353
Thus, the blade load is improved significantly as well as the outlet total pressure. 354
Preprints (www.preprints.org) | NOT PEER-REVIEWED | Posted: 11 December 2017 doi:10.20944/preprints201712.0065.v1
23
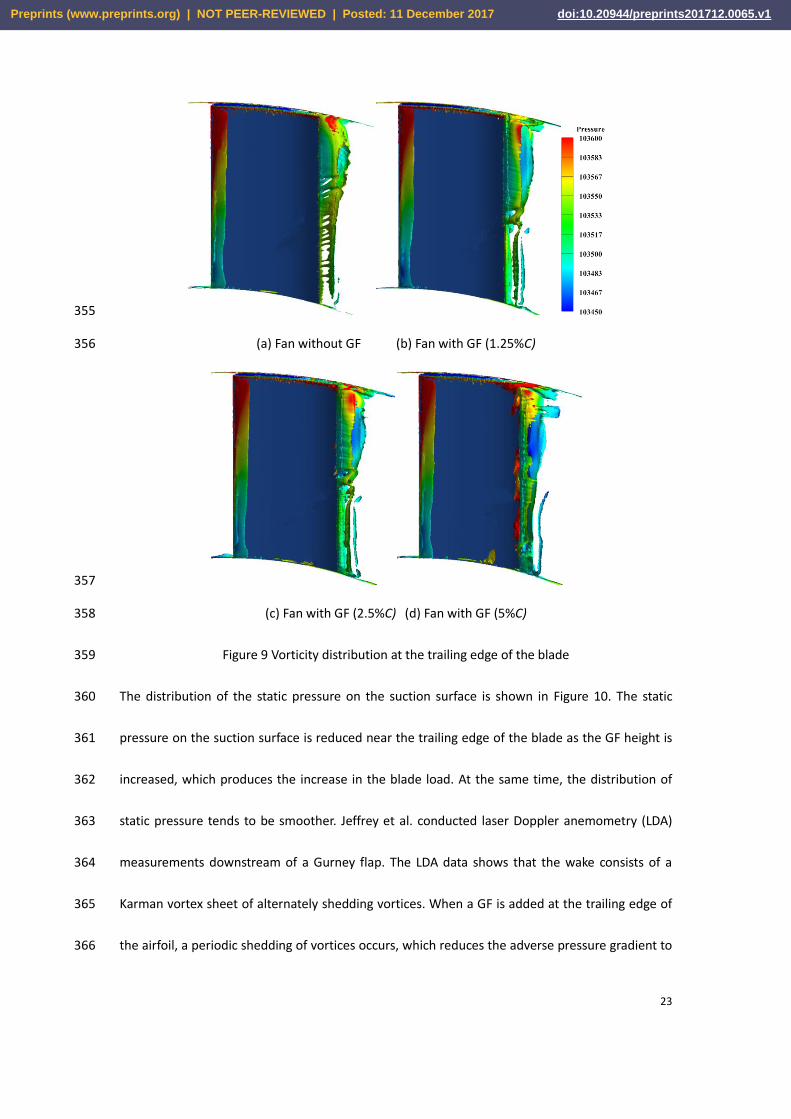
355
(a) Fan without GF (b) Fan with GF (1.25%C) 356
357
(c) Fan with GF (2.5%C) (d) Fan with GF (5%C) 358
Figure 9 Vorticity distribution at the trailing edge of the blade 359
The distribution of the static pressure on the suction surface is shown in Figure 10. The static 360
pressure on the suction surface is reduced near the trailing edge of the blade as the GF height is 361
increased, which produces the increase in the blade load. At the same time, the distribution of 362
static pressure tends to be smoother. Jeffrey et al. conducted laser Doppler anemometry (LDA) 363
measurements downstream of a Gurney flap. The LDA data shows that the wake consists of a 364
Karman vortex sheet of alternately shedding vortices. When a GF is added at the trailing edge of 365
the airfoil, a periodic shedding of vortices occurs, which reduces the adverse pressure gradient to 366
Preprints (www.preprints.org) | NOT PEER-REVIEWED | Posted: 11 December 2017 doi:10.20944/preprints201712.0065.v1

24
a certain extent and accelerates the flow over the trailing edge. This results in a decrease in the 367
flow separation and pressure of the suction surface trailing edge. This reduction of flow separation 368
is depicted more intuitively in Figure 12 369
370
371
(a) Fan without GF (b) Fan with GF (1.25%C) 372
373
(c) Fan with GF (2.5%C) (d) Fan with GF (5%C) 374
Figure 10 Static pressure distribution on the suction surface 375
Figure 11 shows the variation in the total pressure coefficient along the flow direction at the blade 376
midspan. A higher total pressure coefficient is obtained with a higher flap. 33.33% more total 377
Preprints (www.preprints.org) | NOT PEER-REVIEWED | Posted: 11 December 2017 doi:10.20944/preprints201712.0065.v1

25
pressure coefficient can be obtained with the GF height of 5%C than the original fan. Since a GF is 378
so limited in size, an obvious difference in the total pressure coefficient between fans with and 379
without GFs can only be found on the near airfoil and trailing edge of the blade. 380
381
Figure 11 Midspan axial variation of the total pressure rise. 382
Figure 12 depicts the streamline distribution on the S1 stream flow surface. It is observed that 383
separation occurs earlier on the original fan than on a fan with a GF. This indicates that the flow 384
separation at the suction surface will be suppressed when the GF is installed. 385
(a) original fan (b) GF of 1.25%C height
0 3 6 9 12 15 18 21 24 27 30
velocity
Preprints (www.preprints.org) | NOT PEER-REVIEWED | Posted: 11 December 2017 doi:10.20944/preprints201712.0065.v1

26
(c) GF of 2.5%C height (d) GF of 5%C height
Figure 12 Streamline distribution on the S1 stream flow surface
Distribution of static pressure at 10%, 50%, and 90% height of the blade is shown in Figure 13 386
respectively. The dimensionless static pressure is defined as: 387
inint
inl
PP
PPp
,
388
where lP is the local static pressure on the blade surface. With a GF, the static pressure on the blade 389
suction surface is decreased and the static pressure of the pressure surface is increased, which is 390
visualized clearly close to the blade trailing edge. As presented in Figure 9, shedding vortices with 391
high turbulence intensities are clearly visible in the GF wakes. In addition to those vortices in the 392
wake, an additional vortex region is created in front of the flap. These vortices are responsible for 393
the increase in suction on the upper surface and increased pressure on the lower surface, which 394
enhances the blade lift capability. As the height of the Gurney flap increases, these vortices are 395
strengthened. A larger deflection of the exit flow at the trailing edge is pushed towards the GF, 396
which also causes an increase in the effective downwash and, then, the work capability of the fan. 397
Similar results are also reported in studies conducted by Jain[29]. 398
Preprints (www.preprints.org) | NOT PEER-REVIEWED | Posted: 11 December 2017 doi:10.20944/preprints201712.0065.v1

27
(a)10% height of the blade
(b)50% height of the blade
0 10 20 30 40 50 60 70 80 90 100-2
-1
0
1
2
3
4
p
X/C (%)
0% GF
1.25%C
2.5%C
5%C
pressure side
suction side
0 10 20 30 40 50 60 70 80 90 100-3
-2
-1
0
1
2
3
4
5
p
X/C (%)
0% GF
1.25%C
2.5%C
5%C
pressure side
suction side
Preprints (www.preprints.org) | NOT PEER-REVIEWED | Posted: 11 December 2017 doi:10.20944/preprints201712.0065.v1
28
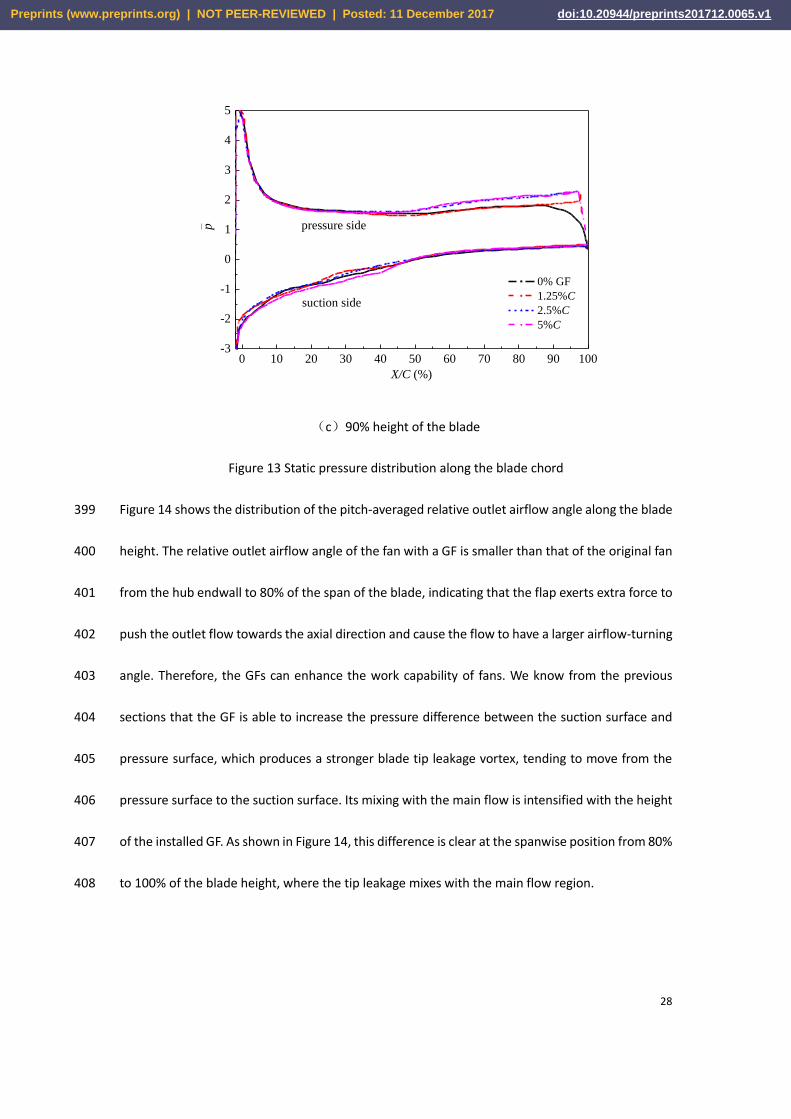
(c)90% height of the blade
Figure 13 Static pressure distribution along the blade chord
Figure 14 shows the distribution of the pitch-averaged relative outlet airflow angle along the blade 399
height. The relative outlet airflow angle of the fan with a GF is smaller than that of the original fan 400
from the hub endwall to 80% of the span of the blade, indicating that the flap exerts extra force to 401
push the outlet flow towards the axial direction and cause the flow to have a larger airflow-turning 402
angle. Therefore, the GFs can enhance the work capability of fans. We know from the previous 403
sections that the GF is able to increase the pressure difference between the suction surface and 404
pressure surface, which produces a stronger blade tip leakage vortex, tending to move from the 405
pressure surface to the suction surface. Its mixing with the main flow is intensified with the height 406
of the installed GF. As shown in Figure 14, this difference is clear at the spanwise position from 80% 407
to 100% of the blade height, where the tip leakage mixes with the main flow region. 408
0 10 20 30 40 50 60 70 80 90 100-3
-2
-1
0
1
2
3
4
5
p
X/C (%)
0% GF
1.25%C
2.5%C
5%C
pressure side
suction side
Preprints (www.preprints.org) | NOT PEER-REVIEWED | Posted: 11 December 2017 doi:10.20944/preprints201712.0065.v1

29
Figure 14 Relative outlet airflow angle along the span
Figure 15 shows the variation in the total radial pressure rise at the positions of 0%, 20%, 40%, 60%, 409
80%, and100% of the axial chord. Compared with the original fan, there is no obvious difference in 410
the pressure distribution before 20% of the axial chord. When the flow comes to a position of 411
approximately 40% of the axial chord, the difference in the total pressure at the blade tip becomes 412
obvious due to the strengthened tip leakage caused by the GF. This phenomenon can be clearly 413
found when the flow runs over the blade surface near 60% of the chord. At positions of 60%, 80%, 414
and 100% of the axial chord, the total pressure of a fan with a GF is always higher than that of the 415
original fan for the entire blade span. Approaching the blade trailing edge, larger differences in 416
pressure appear. In addition, this difference will be more obvious when the height of the GF is 417
increased. 418
0 10 20 30 40 50 60 70 80 900.0
0.2
0.4
0.6
0.8
1.0
Sp
anw
ise
(°)
0% GF
1.25%C
2.5%C
5%C
Preprints (www.preprints.org) | NOT PEER-REVIEWED | Posted: 11 December 2017 doi:10.20944/preprints201712.0065.v1

30
(a) 0% axial chord (b) 20% axial chord
(c) 40% axial chord (d) 60% axial chord
(e ) 80% axial chord (f) 100% axial chord
Figure 15 Comparison of the total pressure rise at different axial positions with various GF
-60 -50 -40 -30 -20 -10 0 100.0
0.2
0.4
0.6
0.8
1.0
span
wis
e
origin fan
flap height-1.25%C
flap height-2.5%C
flap height-5%C
ΔP (Pa)
-60 -40 -20 0 20 40 600.0
0.2
0.4
0.6
0.8
1.0
span
wis
e
origin fan
flap height-1.25%C
flap height-2.5%C
flap height-5%C
ΔP (Pa)
0 30 60 90 120 150 1800.0
0.2
0.4
0.6
0.8
1.0
span
wis
e
origin fan
flap height-1.25%C
flap height-2.5%C
flap height-5%C
ΔP (Pa)
60 90 120 150 180 210 240 270 3000.0
0.2
0.4
0.6
0.8
1.0
span
wis
e
origin fan
flap height-1.25%C
flap height-2.5%C
flap height-5%C
ΔP (Pa)
60 90 120 150 180 210 240 270 3000.0
0.2
0.4
0.6
0.8
1.0
span
wis
e
origin fan
flap height-1.25%C
flap height-2.5%C
flap height-5%C
ΔP (Pa)
60 90 120 150 180 210 240 270 3000.0
0.2
0.4
0.6
0.8
1.0
span
wis
e
origin fan
flap height-1.25%C
flap height-2.5%C
flap height-5%C
ΔP (Pa)
Preprints (www.preprints.org) | NOT PEER-REVIEWED | Posted: 11 December 2017 doi:10.20944/preprints201712.0065.v1

31
heights.
Figure 16 shows the streamlines inside the blade row of a fan with a GF. Because the flap produces 419
an increased blade pressure difference between the pressure surface and suction surface, one 420
leakage flow is driven through the tip clearance from the pressure side to the suction side in the 421
form of a leakage vortex. From the previous section, it is found that a fan with a GF increases the 422
intensity of the trailing edge vortex, produces a high-pressure vortex zone in front of the flap, 423
accelerates the fluid flow on the suction surface and reduces the static pressure on the rear suction 424
surface. This is the reason for the increase in loss and decrease in efficiency of a fan with a GF. It is 425
also demonstrated by the flow pattern visualized in Figure 17. 426
Figure 16 Streamlines inside the blade row of a flapped fan
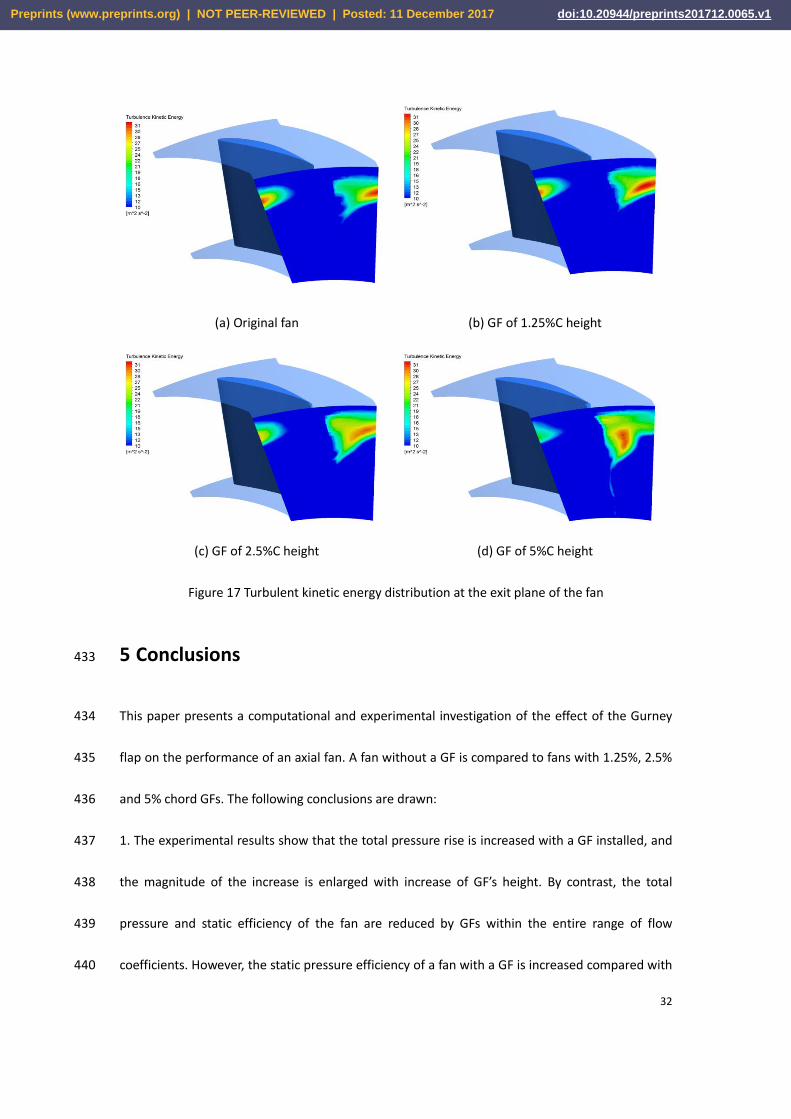
Figure 17 presents the turbulent kinetic energy distribution on the cross-flow section at the trailing 427
edge of the blade. The turbulent kinetic energy is clearly increased at the outlet area by adding a 428
GF, especially in the area of the blade tip. The location of the tip clearance vortex is changed, 429
moving toward the pressure surface. These colored contours more intuitively demonstrate the 430
conclusions that the static pressure of the suction surface of the blade is decreased and the static 431
pressure of the pressure surface is increased when a GF is installed. 432
Preprints (www.preprints.org) | NOT PEER-REVIEWED | Posted: 11 December 2017 doi:10.20944/preprints201712.0065.v1
32
(a) Original fan (b) GF of 1.25%C height
(c) GF of 2.5%C height (d) GF of 5%C height
Figure 17 Turbulent kinetic energy distribution at the exit plane of the fan
5 Conclusions 433
This paper presents a computational and experimental investigation of the effect of the Gurney 434
flap on the performance of an axial fan. A fan without a GF is compared to fans with 1.25%, 2.5% 435
and 5% chord GFs. The following conclusions are drawn: 436
1. The experimental results show that the total pressure rise is increased with a GF installed, and 437
the magnitude of the increase is enlarged with increase of GF’s height. By contrast, the total 438
pressure and static efficiency of the fan are reduced by GFs within the entire range of flow 439
coefficients. However, the static pressure efficiency of a fan with a GF is increased compared with 440
Preprints (www.preprints.org) | NOT PEER-REVIEWED | Posted: 11 December 2017 doi:10.20944/preprints201712.0065.v1

33
the original fan when the flow coefficient is 20% larger than the design value. 441
2. The computed pressure rise of the original fan and that of a fan with a 1.25% chord GF are 442
compared with the experimental data. The presented computational results agree reasonably well 443
with the available experimental data. This verifies that the CFD strategies chosen are reliable. 444
3. Through a numerical investigation, it is found that a fan with a GF can accelerate the flow and 445
reduce the adverse pressure gradient in the blade row, which suppresses the flow separation at 446
the suction surface. The exit flow of the fan tends to be made axial by the GF. This indicates that a 447
fan with a GF produces a larger airflow-turning angle. Shedding vortices with high turbulence 448
intensities are clearly visible in the GF wake. An additional vortex region is created in front of the 449
GF. These vortices are responsible for the increased suction on the upper surface and increased 450
pressure on the low surface. All of the above phenomena result in an increasing work capability of 451
the fan. The tip leakage vortex is strengthened by the increased suction on the suction surface, and 452
the increased pressure on the pressure surface is the main reason for the decrease in efficiency. 453
6 Acknowledgment 454
The work described in this paper was supported by the Chinese National Natural Science Funds 455
(No. 51276116) . 456
7 Nomenclature 457
tD diameter of the shroud
hD diameter of the hub
C chord length
Preprints (www.preprints.org) | NOT PEER-REVIEWED | Posted: 11 December 2017 doi:10.20944/preprints201712.0065.v1

34
aP environment pressure
aT environment temperature
h environment humidity
2P static pressure of the wind tunnel
mq mass flow
vq volumetric flow
q flow coefficient
N rotational speed of fan
inP ,t inlet total pressure
eP motor power
p static pressure rise
P total pressure rise
ind flowmeter differential pressure measurement section diameter
a density of air
outtP , outlet total pressure
outdP , outlet dynamic pressure
2A outlet area
2 density of the outlet air
t total pressure efficiency
s static pressure efficiency
e motor efficiency
R gas constant
uP saturation steam pressure
pc specific heat
CP total pressure rise coefficient
Preprints (www.preprints.org) | NOT PEER-REVIEWED | Posted: 11 December 2017 doi:10.20944/preprints201712.0065.v1

35
pC static pressure rise coefficient
6P Inlet total pressure of the test fan
p static pressure rise of the flow nozzle
p static pressure coefficient
8 References 458
1. Liebeck, R.H., Design of Subsonic Airfoils for High Lift. Journal of Aircraft, 1978. 15(9): p. 547-459
561. 460
2. Wang, J.J., Y.C. Li, and K.S. Choi, Gurney flap—Lift enhancement, mechanisms and applications. 461
Progress in Aerospace Sciences, 2008. 44(1): p. 22-47. 462
3. Wang, J., Y. Li, and P. Zhang, Influences of Mounting Angles and Locations on the Effects of 463
Gurney Flaps. Journal of Aircraft, 2003. 40(3): p. 494-498. 464
4. Traub, L.W., A. Miller, and O. Rediniotis, Preliminary Parametric Study of Gurney Flap 465
Dependencies. Journal of Aircraft, 2006. 43(43): p. 1242-1244. 466
5. Kobayashi, T., M. Takagi, and Y. Takkakura. Effects of Gurney Flaps for Aerodynamic 467
Characteristics of an Airfoil. in NCTAM papers, National Congress of Theoretical and Applied 468
Mechanics, Japan. 2012. 469
6. Dam, C.P.V., D.T. Yen, and P.M.H.W. Vijgen, Gurney Flap Experiments on Airfoil and Wings. 470
Journal of Aircraft, 1999. 36(2): p. 484-486. 471
7. Dan,, H., Pendergraft,, and C. Odis, A water tunnel study of Gurney flaps. 1988, NASA 472
8. Storms, B.L. and C.S. Jang, Lift enhancement of an airfoil using a Gurney flap and vortex 473
generators. Journal of Aircraft, 1993. 31(3): p. 542-547. 474
Preprints (www.preprints.org) | NOT PEER-REVIEWED | Posted: 11 December 2017 doi:10.20944/preprints201712.0065.v1

36
9. Ross, J.C., B.L. Storms, and P.G. Carrannanto, Lift-enhancing tabs on multielement airfoils. 475
Journal of Aircraft, 1995. 32(3): p. 649--655. 476
10. Myose, R., M. Papadakis, and I. Heron, Gurney Flap Experiments on Airfoils, Wings, and 477
Reflection Plane Model. Journal of Aircraft, 2012. 35(35): p. 206-211. 478
11. Papadakis, M., R. Myose, I. Heron, and B. Johnson. An experimental investigation of Gurney 479
flaps on a GA(W)-2 airfoil with 25 percent slotted flap. in Applied Aerodynamics Conference. 1996. 480
12. Ashby, D.L., Experimental and Computational Investigation of Lift-Enhancing Tabs on a Multi-481
Element Airfoil. 1997. 482
13. Traub, L.W. and S.F. Galls, Effects of Leading- and Trailing-Edge Gurney Flaps on a Delta Wing. 483
Journal of Aircraft, 1999. 36(4): p. 651-658. 484
14. Li, Y.C., J.J. Wang, G.K. Tan, and P.F. Zhang, Effects of Gurney flaps on the lift enhancement of 485
a cropped nonslender delta wing. Experiments in Fluids, 2002. 32(1): p. 99-105. 486
15. Zhan, J.X. and J.J. Wang, Experimental Study on Gurney Flap and Apex Flap on Delta Wing. 487
Journal of Aircraft, 2004. 41(6): p. 1379-1383. 488
16. Albertani, R., Wind-Tunnel Study of Gurney Flaps Applied to Micro Aerial Vehicle Wing. Aiaa 489
Journal, 2008. 46(6): p. 1560-1562. 490
17. Cavanaugh, M., P. Robertson, and W. Mason, Wind Tunnel Test of Gurney Flaps and T-Strips on 491
an NACA 23012 Wing. Aiaa Journal, 2006. 492
18. Buchholz, M.D. and T. Jin, Lift Augmentation on Delta Wing with Leading-Edge Fences and 493
Gurney Flap. Journal of Aircraft, 2000. 37(6): p. 1050-1057. 494
19. J.M., J., Analysis of Industrial Design with Gurney Flaps, in 38th Aerospace Sciences Meeting 495
Preprints (www.preprints.org) | NOT PEER-REVIEWED | Posted: 11 December 2017 doi:10.20944/preprints201712.0065.v1

37
& Exhibit. 2000, AIAA paper: Reno. NV. 496
20. Byerley, A.R., O. StoRmer, J.W. Baughn, T.W. Simon, K.W.V. Treuren, and J.R. List, Using Gurney 497
Flaps To Control Laminar Separation On Linear Cascade Blades. Journal of Turbomachinery, 2002. 498
125(1): p. 1191-1199. 499
21. Greenblatt, D., Application of Large Gurney Flaps on Low Reynolds Number Fan Blades. Journal 500
of Fluids Engineering, 2011. 133(2): p. 352-361. 501
22. Thomas, M.K.D., N. Sitaram, and M. Suresh, Application of Gurney Flaps on a Centrifugal Fan 502
Impeller. International Journal of Fluid Machinery & Systems, 2012. 5(2): p. 65-71. 503
23. Vijgen, P.M.H.W., C.P.V. Dam, B.J. Holmes, and F.G. Howard, Wind-Tunnel Investigations of 504
Wings with Serrated Sharp Trailing Edges. 1989: Springer Berlin Heidelberg. 295-313. 505
24. Zhang, L., Y. Jin, H. Dou, and Y. Jin, Numerical and Experimental Investigation on Aerodynamic 506
Performance of Small Axial Flow Fan with Hollow Blade Root. Journal of Thermal Science, 2013. 507
22(5): p. 424-432. 508
25. Ye, X., P. Li, C. Li, and X. Ding, Numerical investigation of blade tip grooving effect on 509
performance and dynamics of an axial flow fan. Energy, 2015. 82: p. 556–569. 510
26. Kim, J.H., J.H. Kim, K.Y. Kim, J.Y. Yoon, S.H. Yang, and Y.S. Choi, High-efficiency design of a tunnel 511
ventilation jet fan through numerical optimization techniques. Journal of Mechanical Science & 512
Technology, 2012. 26(6): p. 1793-1800. 513
27. Kim, J.H., J.H. Choi, A. Husain, and K.Y. Kim, Performance enhancement of axial fan blade 514
through multi-objective optimization techniques. Journal of Mechanical Science & Technology, 515
2010. 24(10): p. 2059-2066. 516
Preprints (www.preprints.org) | NOT PEER-REVIEWED | Posted: 11 December 2017 doi:10.20944/preprints201712.0065.v1

38
28. Singh, M.K., K. Dhanalakshmi, and S.K. Chakrabartty, Navier-Stokes Analysis of Airfoils with 517
Gurney Flap. Journal of Aircraft, 1971. 44(5): p. 1487-1493. 518
29. Jain, S., N. Sitaram, and S. Krishnaswamy, Computational Investigations on the Effects of 519
Gurney Flap on Airfoil Aerodynamics. International Scholarly Research Notices, 2015. 2015(5): p. 520
1-11. 521
522
523
Preprints (www.preprints.org) | NOT PEER-REVIEWED | Posted: 11 December 2017 doi:10.20944/preprints201712.0065.v1


