Embed Size (px)
Citation preview

DNV GL © 28 January 2021 SAFER, SMARTER, GREENERDNV GL ©
28 January 2021
Jason Stefanatos
EEXI requirements and Insights on Emissions
1
DNV GL Press conference

DNV GL © 28 January 2021
IMO strategy on GHG reductions – vision and ambitions
2

DNV GL © 28 January 2021
What is the difference between EEXI and CII?
EEXI: Design indicator CII: Operational indicator
3
DNV GL © 28 January 2021
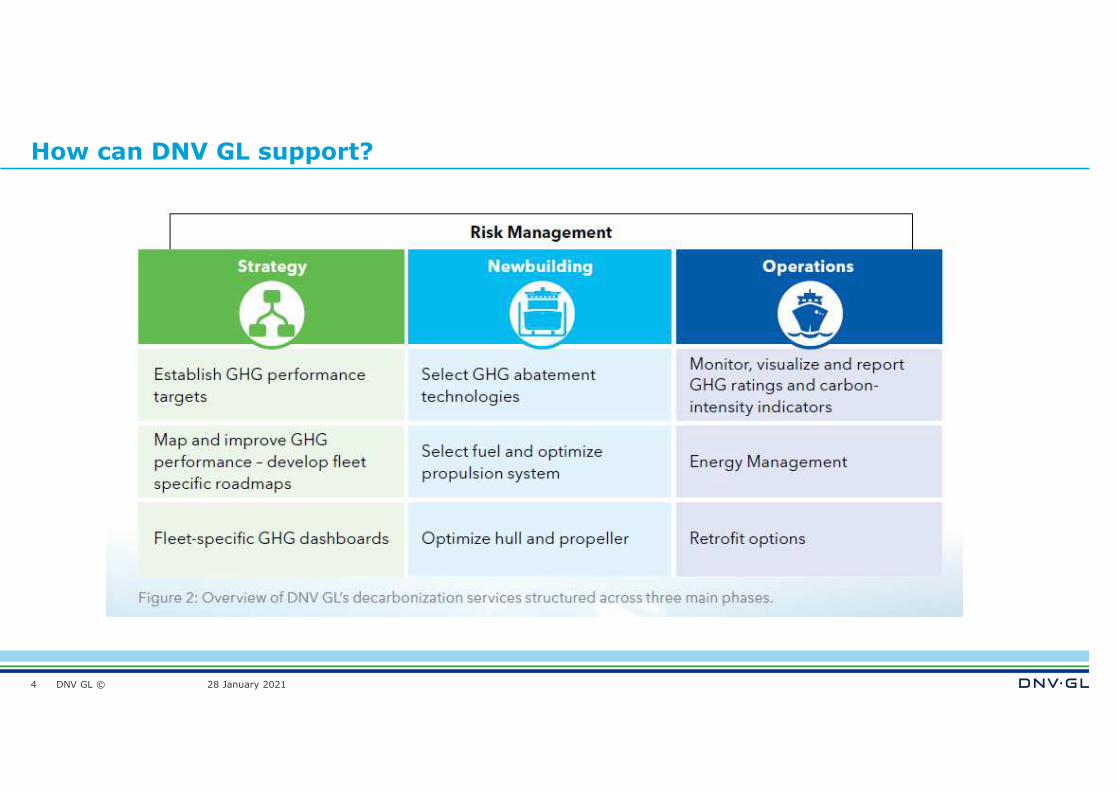
How can DNV GL support?
4

DNV GL © 28 January 2021
New decarbonization brochure
5
Brochure introducing our service
portfolio in more detail compared
to the webpage
Setting our services in context of
customers’ main decarbonization
challenges
Available as download from the
new webpage

DNV GL © 28 January 2021
How to meet the EEXI requirements
6

DNV GL © 28 January 2021
Maritime Advisory services will support along the way to vessel compliance
7
EEXI Consultancy(EEXI calculation of individual ships or fleet assessment based on ISWG-7-2-7)
EEXI Improvement Assessment(improvement estimation on potential saving devise installation or power
limitation)
Hydrodynamic improvement consultancy(e.g. payback time scenarios, retrofit measures)
EEXI reference speed(determine the reference speed (Vref) at a certain draught of the vessel)
EEXI Technical File (issuance of the EEXI Technical File based on submitted documents for all classed
vessel)
Supported services: Vibration pre-check
(vibration check before installing an power limitation)
EEXI Statement of Compliance
(voluntary statement to show compliance already before 2023)
EEXI Service Portfolio

DNV GL © 28 January 2021
99.8% compliance within
deadlines
7,800 vessels verified in 2020
Positive feedback from owners
Digital and Streamlined MRV and DCS verification
Source: https://www.dnvgl.com/expert-story/maritime-impact/Digital-MRV-and-DCS-reporting-streamlines-the-verification-process.html
8

DNV GL © 28 January 2021
Focus on Emissions from various stakeholders
9
Some of the Signatories
Banks assessments
Some of the Signatories
IMO Ambitions
Carbon rating and EEXI
Cargo owners, charterers

DNV GL © 28 January 2021
Environmental performance and reporting is part of the new agenda
10
IMO DCS

DNV GL © 28 January 2021
Emissions Insights
11
Real time feedback on vessels CII
Owners/manager may improve throughout
the year
Fleet benchmark against the industry
Support for multiple stakeholders
requirements

DNV GL © 28 January 2021
Emissions Insights
Information available on our web pages
12

DNV GL © 28 January 2021
SAFER, SMARTER, GREENER
www.dnvgl.com
The trademarks DNV GL®, DNV®, the Horizon Graphic and Det Norske Veritas®
are the properties of companies in the Det Norske Veritas group. All rights reserved.
DNV GL
13
Jason StefanatosBusiness Development Manager – Senior Engineer
Maritime R&D and AdvisoryRegion South East Europe, Middle East & Africa
E-mail: [email protected]: +30 6975 10 4485 | Phone: +30 2104100200

DNV GL © 28 January 202114
Impact:
Average power reduction
20% of MCR.
Most common limitation
10% to 30% of MCR.
About 6% of vessels
need to reduce MRC
more than 40%.
Impact on average
speed in 2019 is low
due to slow speeding
(about 3% from 12.8 to
12.4 knots)
Ship segmentMore than
40%31-40% 21-30% 11-20% 1-10%
No change
TOTAL
Bulk carrier 82 616 3805 3986 1955 323 10767
Tanker and comb. carrier
283 892 2906 3063 1280 829 9253
Container ship 653 1451 1295 587 374 241 4601
Gas/LNG carrier 92 281 433 256 58 30 1150
General cargo ship
975 1117 1449 1118 547 1077 6283
Refrigerated cargo carrier
3 6 61 84 110 205 469
Ro-ro cargo, vehicle
3 18 71 223 241 102 658
Total 2091 4381 10020 9317 4565 2807 33181
Number of ships per range of power reduction
Technical measure: Energy Efficiency Existing Ship Index (EEXI)
WB2

Slide 14
WB2 again maybe highlight Container - do we have a quick overview where MSC is in avarage?Witt, Benjamin, 16/06/2020