Embed Size (px)
Citation preview

EEP 101/ECON 125EEP 101/ECON 125Lecture 15:Lecture 15:
Natural Resources (NR)Natural Resources (NR)
David ZilbermanDavid Zilberman
UC BerkeleyUC Berkeley

Review of Renewable Vs. Non RenewableReview of Renewable Vs. Non Renewable Nonrenewable resourcesNonrenewable resources (mineral, fossil water, (mineral, fossil water,
remnants of ancient civilizations, old growth remnants of ancient civilizations, old growth forest, “dead things”).forest, “dead things”).
Renewable resourcesRenewable resources (fisheries, forests, grasslands, (fisheries, forests, grasslands, water systems, “living things”).water systems, “living things”).
Many renewable resources and most nonrenewable Many renewable resources and most nonrenewable ones are exhaustible.ones are exhaustible.

Analysis of dynamic systemsAnalysis of dynamic systems Natural resource management is Natural resource management is control and direction of dynamic control and direction of dynamic
systemssystems. Policies affect the evolution of populations and/or resource . Policies affect the evolution of populations and/or resource inventoriesinventories
The indicators of the situation of dynamic systems are The indicators of the situation of dynamic systems are state state variables-variables- Number of fish in a lake at a moment of timeNumber of fish in a lake at a moment of time Volume of water in an aquiferVolume of water in an aquifer
Policy makers affect Policy makers affect control variablescontrol variables Size of harvestSize of harvest Price of waterPrice of water
Systems are affected by random shocksSystems are affected by random shocks WeatherWeather Pest infestationsPest infestations
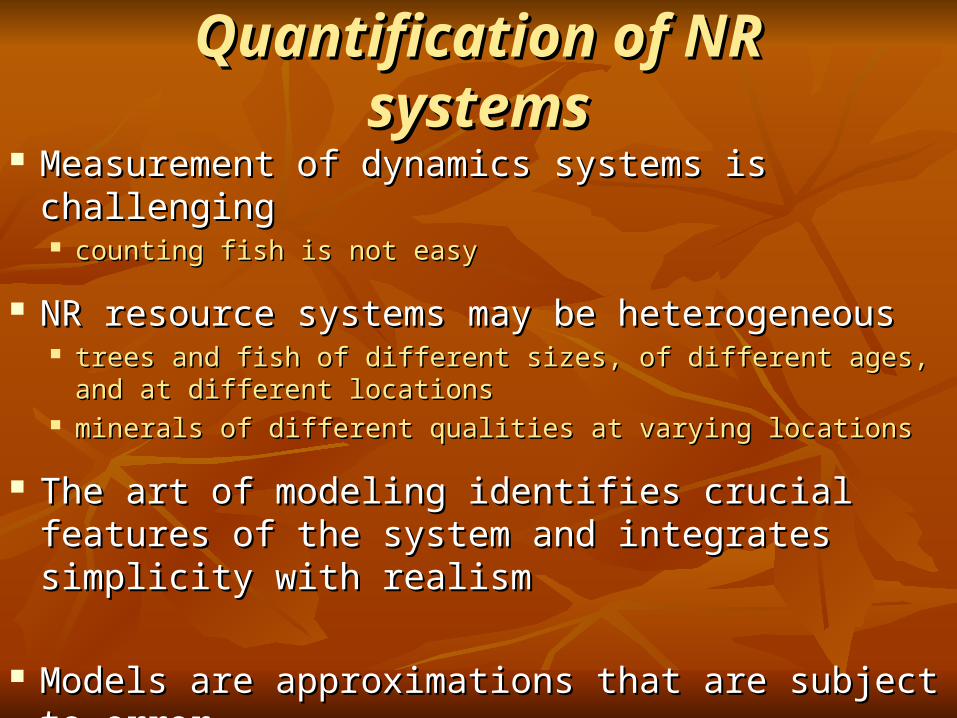
Quantification of NR systemsQuantification of NR systems Measurement of dynamics systems is challenging Measurement of dynamics systems is challenging
counting fish is not easycounting fish is not easy
NR resource systems may be heterogeneousNR resource systems may be heterogeneous trees and fish of different sizes, of different ages, and at different trees and fish of different sizes, of different ages, and at different
locationslocations minerals of different qualities at varying locationsminerals of different qualities at varying locations
The art of modeling identifies crucial features of the The art of modeling identifies crucial features of the system and integrates simplicity with realismsystem and integrates simplicity with realism
Models are approximations that are subject to error Models are approximations that are subject to error

Equations of motionEquations of motion Depict the evolution of state variables over timeDepict the evolution of state variables over time
How the stock of oil or number of fish changeHow the stock of oil or number of fish change
Stock size today isStock size today isthe resource stock of tomorrow is the resource stock of tomorrow is
EQUAL TOEQUAL TO
today’s stock today’s stock
MINUSMINUS
today’s harvest (or mining) today’s harvest (or mining)
PLUS PLUS
resource stock growth (for renewable resource) resource stock growth (for renewable resource)
PLUS PLUS
new discoveries new discoveries
PLUSPLUS
recyclingrecycling

Applying Our Knowledge of Applying Our Knowledge of Interest RatesInterest Rates
Higher interest rates lead to increased mining or Higher interest rates lead to increased mining or harvesting harvesting
Resource owners that have to pay high interest for funds Resource owners that have to pay high interest for funds are more likely to mine resources & sell them than are more likely to mine resources & sell them than resource owners who face low interest rates resource owners who face low interest rates
Poor individuals with heavy credit constraints are more Poor individuals with heavy credit constraints are more likely to mine their resourceslikely to mine their resources
Income & credit support for the poor reduce NR miningIncome & credit support for the poor reduce NR mining

Non renewable resourcesNon renewable resources The The actualactual stock of non renewable resources is stock of non renewable resources is decliningdeclining over over
time, but time, but known reservesknown reserves may may increaseincrease because of discoveries because of discoveries
Perceived shortages and improved discovery technologies Perceived shortages and improved discovery technologies trigger searches and lead to discoveriestrigger searches and lead to discoveries
Known oil reserves are estimated to last 40-80 years, the same Known oil reserves are estimated to last 40-80 years, the same estimate was given in the 1940sestimate was given in the 1940s
Still oil and natural gas reserves may run outStill oil and natural gas reserves may run out
Non renewable resources are rarely depleted, but may become Non renewable resources are rarely depleted, but may become too expensive to mine too expensive to mine

Factor determining extraction: demandFactor determining extraction: demand
Demand is reflecting marginal value of resource in applications (value Demand is reflecting marginal value of resource in applications (value of oil in transportation and heating)of oil in transportation and heating)
Higher incomes and lower prices increase demandHigher incomes and lower prices increase demand
Demand increases with increased population Demand increases with increased population
It may be reduced by introduction and adoption of It may be reduced by introduction and adoption of resource resource conserving technologiesconserving technologies (fuel efficient cars) (fuel efficient cars)
It is reduced by back stop technologies (solar energy)It is reduced by back stop technologies (solar energy)
Demand can be reduced byDemand can be reduced by Taxes Taxes Population policies Population policies R&DR&D

Other factors determining extractionOther factors determining extraction Extraction cost-Extraction cost- reduced mining or harvesting cost or improved reduced mining or harvesting cost or improved
infrastructure (roads) increase extraction infrastructure (roads) increase extraction
Recycling-Recycling- alternative supply sources reduce extraction alternative supply sources reduce extraction
Known ReservesKnown Reserves (more reserves increase extraction) (more reserves increase extraction)
Market structureMarket structure Cartels extract less than competitive producersCartels extract less than competitive producers Open access result in excessive miningOpen access result in excessive mining
Regulation and policiesRegulation and policies Technology control (restriction on use of explosives)Technology control (restriction on use of explosives) Zoning ( do not drill in Alaska)Zoning ( do not drill in Alaska)

Generic ModelGeneric Model Marginal Mining cost.Marginal Mining cost. MNC(x) . MNC(x) .
Marginal future cost (User costs).Marginal future cost (User costs). MFC(x). The future cost MFC(x). The future cost represents loss of future opportunities by present extraction.represents loss of future opportunities by present extraction.
Externality costExternality cost.. MEC MECC =Optimal allocation
A=Allocation under open access
B=Allocation without considering externality costs

Alternative AllocationsAlternative Allocations Open accessOpen access and no regulation will result in excessive and no regulation will result in excessive
resource use (A- Pollution & future ignored) resource use (A- Pollution & future ignored)
Competitive supplyCompetitive supply by firms with well defined by firms with well defined resources, ownership rights resources, ownership rights without pollution controlwithout pollution control still result in excessive mining (B) still result in excessive mining (B)
Competitive supply when ownership is well defined and Competitive supply when ownership is well defined and pollution is taxed results in optimum (C)pollution is taxed results in optimum (C)
Cartel may under provide resources (if price under Cartel may under provide resources (if price under monopoly is greater than at C) or under provide if monopoly is greater than at C) or under provide if pollution cost great than the cartel’s price increase.pollution cost great than the cartel’s price increase.

Elements of a Resource PolicyElements of a Resource Policy (1) (1) Establishing private prosperity for the resourceEstablishing private prosperity for the resource. This prevents the open . This prevents the open
access problem and moves from point A to point B in Figure 1.access problem and moves from point A to point B in Figure 1.
(2) (2) Externality controlExternality control. Including . Including tax on the resourcetax on the resource (leading to a transition (leading to a transition from B to C). Gasoline tax in U.S. canfrom B to C). Gasoline tax in U.S. can affect Climate change dynamicsaffect Climate change dynamics reduce air pollution reduce air pollution
Resource taxes also lead to Resource taxes also lead to adoption of resource efficient technologies adoption of resource efficient technologies emergence of emergence of backstop technologiesbackstop technologies (recycling when appropriate) (recycling when appropriate)
(3) (3) Support to Backstop researchSupport to Backstop research
(4) (4) SubsidySubsidy for adoption of resource efficient technologies( fuel efficient for adoption of resource efficient technologies( fuel efficient cars,public transport)cars,public transport)

Renewable resourcesRenewable resources Growth provides a base for harvest without ultimate Growth provides a base for harvest without ultimate
depletion.depletion.
Change of stock = Growth Change of stock = Growth minusminus harvest harvest
At a Steady state (sustainable solution) At a Steady state (sustainable solution) Growth = HarvestGrowth = Harvest
There are many sustainable solutions, the one that There are many sustainable solutions, the one that maximizes discounted net benefits is optimalmaximizes discounted net benefits is optimal

Resource dynamicsResource dynamics St=resource stock time tSt=resource stock time t Xt=extractionXt=extraction g(St)=growth. Growth formulas varyg(St)=growth. Growth formulas vary
Proportional growth g(St)=Proportional growth g(St)=StSt Fixed growth g(St)=ConstantFixed growth g(St)=Constant With non renewable resources g(St)=0 once all the stock has With non renewable resources g(St)=0 once all the stock has
discovered. discovered. Equation of motionEquation of motion
Change in stock StChange in stock St+1+1--St =g(St) St =g(St) --XtXt
Steady State StSteady State St+1+1--St=0 harvesting equals growth St=0 harvesting equals growth

Not all steady states are alikeNot all steady states are alike Steady states outcomes are sustainable- but some Steady states outcomes are sustainable- but some
sustain low stock levels and other largfe stockssustain low stock levels and other largfe stocks Steady states analysis aims to stabilize outcomes Steady states analysis aims to stabilize outcomes
providing the same levels of output or resoruces providing the same levels of output or resoruces over long periods of time.But things change, evolve.over long periods of time.But things change, evolve.
It is useful to investigate when steady states will It is useful to investigate when steady states will persist and study how chagens of conditions affect persist and study how chagens of conditions affect steady states. steady states.

Fishery dynamics-fast growth=.1Fishery dynamics-fast growth=.1growth = 0.1
times stock
Harvesting cost=n/S n= 5 price=
year stock growth harvest cost profits1.00 40.00 -1.00 5.00 0.63 4.382.00 39.00 -1.10 5.00 0.64 4.363.00 37.90 -1.21 5.00 0.66 4.344.00 36.69 -1.33 5.00 0.68 4.325.00 35.36 -1.46 5.00 0.71 4.296.00 33.89 -1.61 5.00 0.74 4.267.00 32.28 -1.77 5.00 0.77 4.238.00 30.51 -1.95 5.00 0.82 4.189.00 28.56 -2.14 5.00 0.88 4.12
10.00 26.42 -2.36 5.00 0.95 4.0511.00 24.06 -2.59 5.00 1.04 3.9612.00 21.47 -2.85 5.00 1.16 3.8413.00 18.62 -3.14 5.00 1.34 3.6614.00 15.48 -3.45 5.00 1.62 3.3815.00 12.03 -3.80 5.00 2.08 2.9216.00 8.23 -4.18 5.00 3.04 1.96
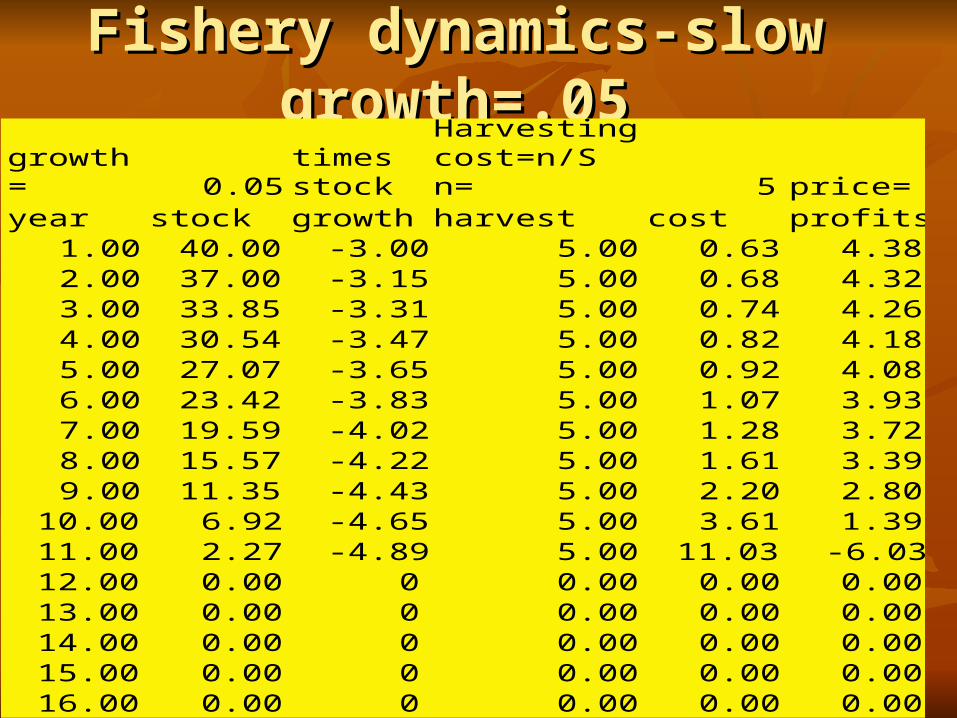
Fishery dynamics-slow growth=.05Fishery dynamics-slow growth=.05growth = 0.05
times stock
Harvesting cost=n/S n= 5 price=
year stock growth harvest cost profits1.00 40.00 -3.00 5.00 0.63 4.382.00 37.00 -3.15 5.00 0.68 4.323.00 33.85 -3.31 5.00 0.74 4.264.00 30.54 -3.47 5.00 0.82 4.185.00 27.07 -3.65 5.00 0.92 4.086.00 23.42 -3.83 5.00 1.07 3.937.00 19.59 -4.02 5.00 1.28 3.728.00 15.57 -4.22 5.00 1.61 3.399.00 11.35 -4.43 5.00 2.20 2.80
10.00 6.92 -4.65 5.00 3.61 1.3911.00 2.27 -4.89 5.00 11.03 -6.0312.00 0.00 0 0.00 0.00 0.0013.00 0.00 0 0.00 0.00 0.0014.00 0.00 0 0.00 0.00 0.0015.00 0.00 0 0.00 0.00 0.0016.00 0.00 0 0.00 0.00 0.00

Steady state-fast Steady state-fast growth=.1growth=.1
growth = 0.1
times stock
Harvesting cost=n/S n= 5 price=
year stock growth harvest cost profits1.00 40.00 0.00 4.00 0.50 3.502.00 40.00 0.00 4.00 0.50 3.503.00 40.00 0.00 4.00 0.50 3.504.00 40.00 0.00 4.00 0.50 3.505.00 40.00 0.00 4.00 0.50 3.506.00 40.00 0.00 4.00 0.50 3.507.00 40.00 0.00 4.00 0.50 3.508.00 40.00 0.00 4.00 0.50 3.509.00 40.00 0.00 4.00 0.50 3.50
10.00 40.00 0.00 4.00 0.50 3.5011.00 40.00 0.00 4.00 0.50 3.5012.00 40.00 0.00 4.00 0.50 3.5013.00 40.00 0.00 4.00 0.50 3.5014.00 40.00 0.00 4.00 0.50 3.5015.00 40.00 0.00 4.00 0.50 3.5016.00 40.00 0.00 4.00 0.50 3.50

Wait and growWait and grow
growth = 0.1
times stock
Harvesting cost=n/S n= 5 price=
year stock growth harvest cost profits1.00 40.00 4.00 0.00 0.00 0.002.00 44.00 4.40 0.00 0.00 0.003.00 48.40 4.84 0.00 0.00 0.004.00 53.24 0.00 5.32 0.50 4.825.00 53.24 0.00 5.32 0.50 4.826.00 53.25 0.00 5.32 0.50 4.827.00 53.25 0.01 5.32 0.50 4.828.00 53.26 0.01 5.32 0.50 4.829.00 53.26 0.01 5.32 0.50 4.82
10.00 53.27 0.01 5.32 0.50 4.8211.00 53.28 0.01 5.32 0.50 4.8212.00 53.29 0.01 5.32 0.50 4.8213.00 53.29 0.01 5.32 0.50 4.8214.00 53.30 0.01 5.32 0.50 4.8215.00 53.31 0.01 5.32 0.50 4.8216.00 53.33 0.01 5.32 0.50 4.82

Alternative strategiesAlternative strategies There are variable strategies of resource There are variable strategies of resource
management-and many steady states management-and many steady states Optimal one depends on Optimal one depends on
objective function objective function interest rate and outpur prices interest rate and outpur prices growth equationgrowth equation Extraction costExtraction cost
If Objective to maximize net present value higher If Objective to maximize net present value higher interest rate lead to higher extractioninterest rate lead to higher extraction
In extraction cost decline with stock-optimal steady In extraction cost decline with stock-optimal steady state has larger stockstate has larger stock
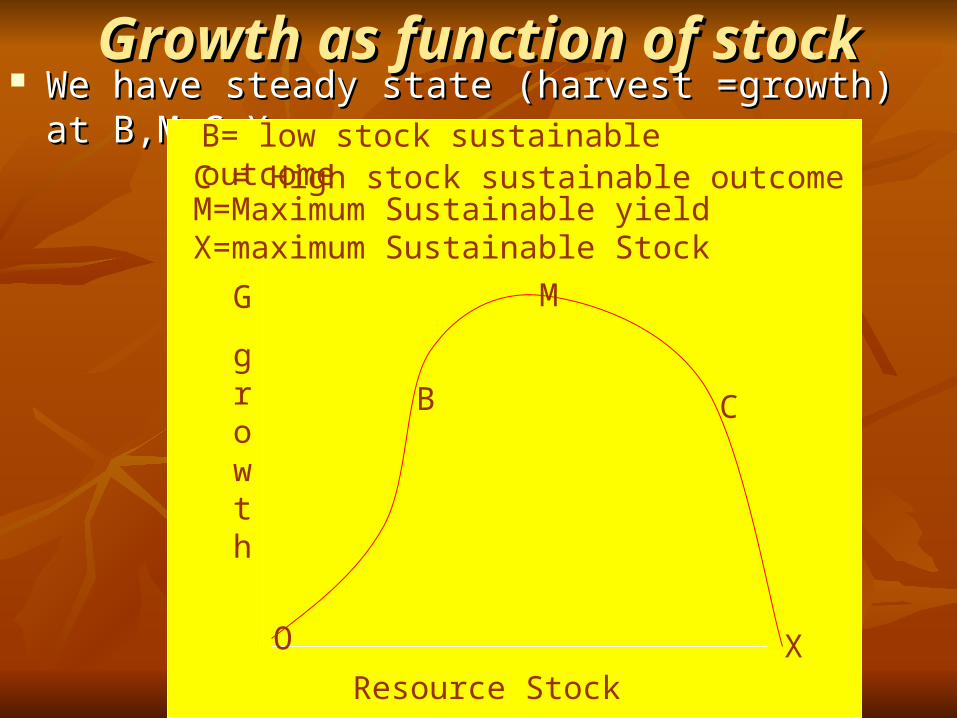
Growth as function of stockGrowth as function of stock We have steady state (harvest =growth) at B,M,C,XWe have steady state (harvest =growth) at B,M,C,X
G
growth
Resource Stock
M=Maximum Sustainable yieldX=maximum Sustainable Stock
M
X
B C
B= low stock sustainable outcomeC = High stock sustainable outcome
O

Alternative Sustainable OutcomesAlternative Sustainable Outcomes Extinction- no stock on growthExtinction- no stock on growth
X=maximum Sustainable Stock (All food goes for consumption not X=maximum Sustainable Stock (All food goes for consumption not growth)growth)
M=Maximum Sustainable yield (M=Maximum Sustainable yield (Between O and XBetween O and X))
B= low stock sustainable outcome (B= low stock sustainable outcome (Between O & M)Between O & M)
C = High stock sustainable outcome (C = High stock sustainable outcome (Between M &X)Between M &X)
Maximum Sustainable yield is not necessarily optimalMaximum Sustainable yield is not necessarily optimal
Higher stocks reduce harvesting costsHigher stocks reduce harvesting costs
Lower stocks allow more extractionLower stocks allow more extraction

Alternative extraction strategiesAlternative extraction strategies Extract first sustain laterExtract first sustain later The story U.S &EuropeThe story U.S &Europe
Conserve first sustain laterConserve first sustain later Occurs in fisheries Occurs in fisheries
which are near extinctionwhich are near extinction Or in restoration effortsOr in restoration efforts
Time
Time
Extraction
Extraction

Open access may lead to over Open access may lead to over extractionextraction
Competition and open access lead to over Competition and open access lead to over extraction- the tragedy of the commonsextraction- the tragedy of the commons
Therefore extraction needs to be regulatedTherefore extraction needs to be regulated Many polices are used to regualte harvesting Many polices are used to regualte harvesting
some are better than otherssome are better than others Optimal regulation is by incentive or tradable Optimal regulation is by incentive or tradable
trading that leads to maximize net present value trading that leads to maximize net present value subject to constraintsubject to constraint
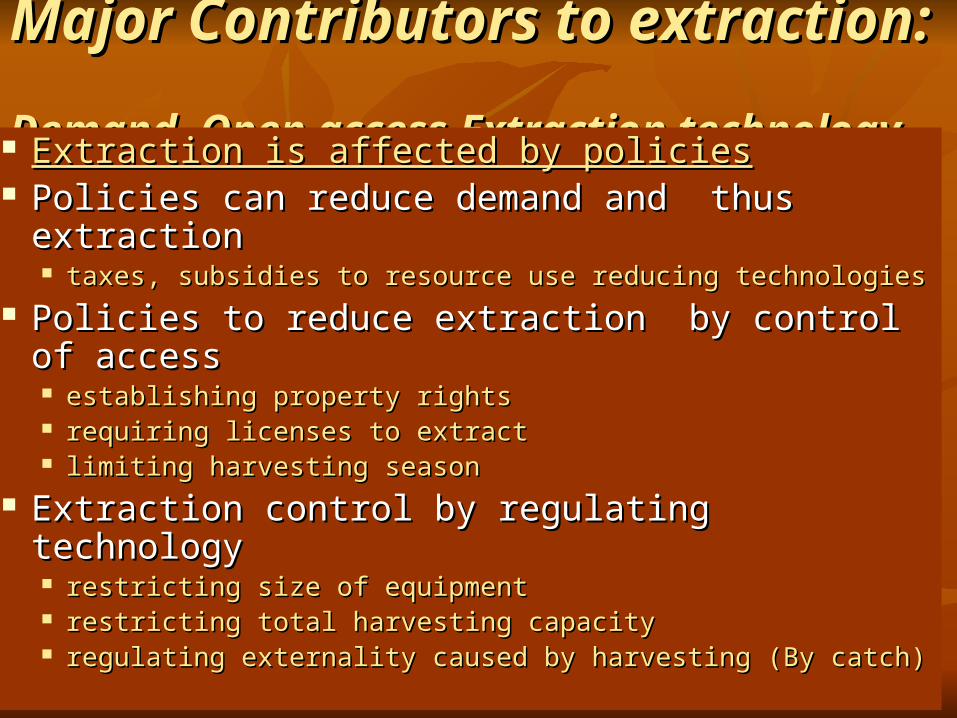
Major Contributors to extraction: Major Contributors to extraction: Demand, Open access,Extraction technologyDemand, Open access,Extraction technology
Extraction is affected by policiesExtraction is affected by policies Policies can reduce demand and thus extractionPolicies can reduce demand and thus extraction
taxes, subsidies to resource use reducing technologiestaxes, subsidies to resource use reducing technologies Policies to reduce extraction by control of accessPolicies to reduce extraction by control of access
establishing property rightsestablishing property rights requiring licenses to extractrequiring licenses to extract limiting harvesting seasonlimiting harvesting season
Extraction control by regulating technology Extraction control by regulating technology restricting size of equipment restricting size of equipment restricting total harvesting capacityrestricting total harvesting capacity regulating externality caused by harvesting (By catch)regulating externality caused by harvesting (By catch)

Multiple benefits of resourcesMultiple benefits of resources Resources (forests, wetlands, etc.) provide multiple services Resources (forests, wetlands, etc.) provide multiple services
(recreation, bio-diversity, etc.)(recreation, bio-diversity, etc.)
Harvesting reduces alternative environmental benefitsHarvesting reduces alternative environmental benefits
One solution: taxation of harvested resourcesOne solution: taxation of harvested resources
Alternatives: subsidies for conservation (not harvesting), debt Alternatives: subsidies for conservation (not harvesting), debt for nature, payment for environmental services for nature, payment for environmental services
Marketing of environmental amenities (Ecotourism, bio-Marketing of environmental amenities (Ecotourism, bio-prospecting, tropical nuts )prospecting, tropical nuts )

Intensification and conservationIntensification and conservation Agricultural intensifications (fertilizers,chemicals)- Agricultural intensifications (fertilizers,chemicals)-
increases yield per acre and reduces utilized land and increases yield per acre and reduces utilized land and deforestationdeforestation
Aquaculture provides substitutes for fishing, but has its Aquaculture provides substitutes for fishing, but has its own environmental side effects (to be controlled)own environmental side effects (to be controlled)
Forest plantation reduces pressure on natural forestForest plantation reduces pressure on natural forest
Husbandry of animals (rhinos) would reduce pressure for Husbandry of animals (rhinos) would reduce pressure for tasks and other features of wild animalstasks and other features of wild animals

Fishery IssuesFishery Issues International waterInternational water.. There are international agreements and There are international agreements and
evolving “laws of the sea,” yet, open access problems continueevolving “laws of the sea,” yet, open access problems continue
Monitoring problemsMonitoring problems.. Countries establish transferable fishing Countries establish transferable fishing permits. Monitoring and enforcement may limit their effectivenesspermits. Monitoring and enforcement may limit their effectiveness
Regulation of timingRegulation of timing. . The size, number of boats and duration of The size, number of boats and duration of fishing may be regulated. Limitations:fishing may be regulated. Limitations:
(i) It leads to overinvestment in equipment.(i) It leads to overinvestment in equipment.
(ii) Frozen fish are inferior to fresh ones.(ii) Frozen fish are inferior to fresh ones.
Technology controlsTechnology controls.. Some techniques (use of explosive, fishing Some techniques (use of explosive, fishing with fine mesh nets) have future and externality costswith fine mesh nets) have future and externality costs
Aquaculture and marine cultureAquaculture and marine culture.. Provide alternative sources of Provide alternative sources of fish, but have externality costsfish, but have externality costs

Non renewable resource pricesNon renewable resource prices Prices are indicators of scarcityPrices are indicators of scarcity
Prices of non renewable resources decline when known Prices of non renewable resources decline when known resources grow faster than useresources grow faster than use
Prices of most non renewable resources has declinePrices of most non renewable resources has decline
Higher interest rates lead to lower prices at present and Higher interest rates lead to lower prices at present and higher future prices (they increase present mining) higher future prices (they increase present mining)
Higher mining cost increases prices but reduces price Higher mining cost increases prices but reduces price changes over timechanges over time
P0

Optimal price of resource over time Optimal price of resource over time with zero extraction cost with zero extraction cost
Higher interest ratereduces initial price
BUT
Increased rate of price changes when stock is constant
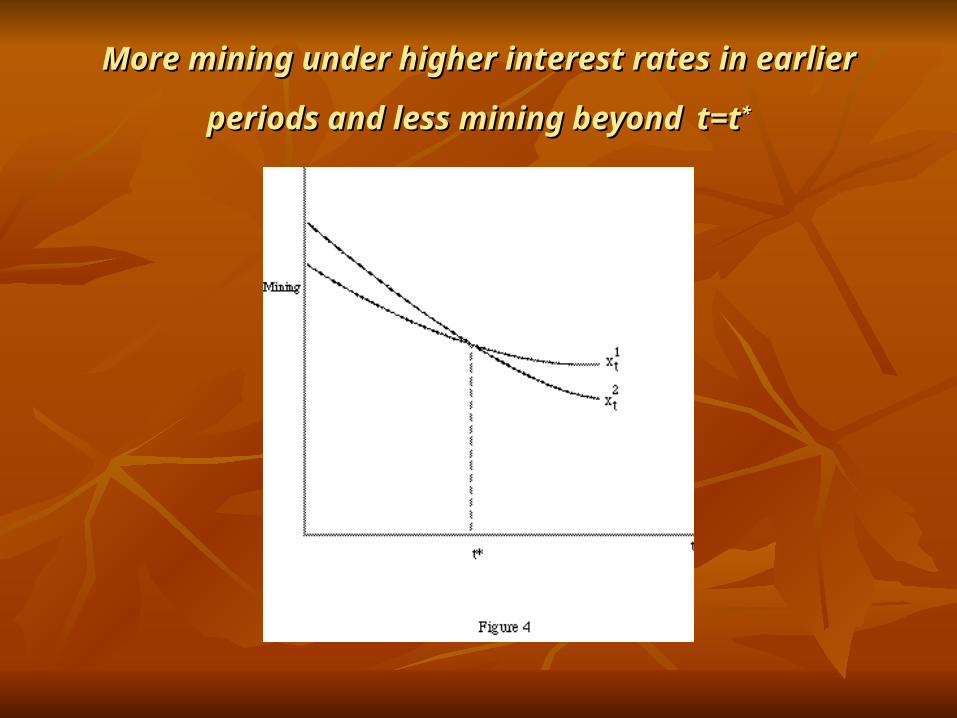
More mining under higher interest rates in earlier periods and More mining under higher interest rates in earlier periods and
less mining beyondless mining beyond t=tt=t**

Price Dynamics of Renewable ResourcesPrice Dynamics of Renewable Resources
The rate of the price change is affected by:The rate of the price change is affected by: The discount rate tends to increase price over time.The discount rate tends to increase price over time. Rate of resource population growth tends to reduce price over time Rate of resource population growth tends to reduce price over time
(as supply increases)(as supply increases) Extraction cost factor dampens the other twoExtraction cost factor dampens the other two
Demand growth increases pricesDemand growth increases prices
New resource sources tend to reduce pricesNew resource sources tend to reduce prices
Prices of most renewable resources have decline over timePrices of most renewable resources have decline over time

Stock pollutionStock pollution Some pollution problems are dynamic in natureSome pollution problems are dynamic in nature
Climate changeClimate change Ground water qualityGround water quality
The stock may be provide negative valueThe stock may be provide negative value Without intervention competitive market leads to accumulation of Without intervention competitive market leads to accumulation of
pollutionpollution Polices can affect dynamicsPolices can affect dynamics
Reduce build up of stock of pollutionReduce build up of stock of pollution Lead to more desirable steady stateLead to more desirable steady state
Policies may affect prices of outputs and inputs and distribution Policies may affect prices of outputs and inputs and distribution between groups and generationsbetween groups and generations
Market structure and interest rate will affect optimal policyMarket structure and interest rate will affect optimal policy