Embed Size (px)
Citation preview
EMSD
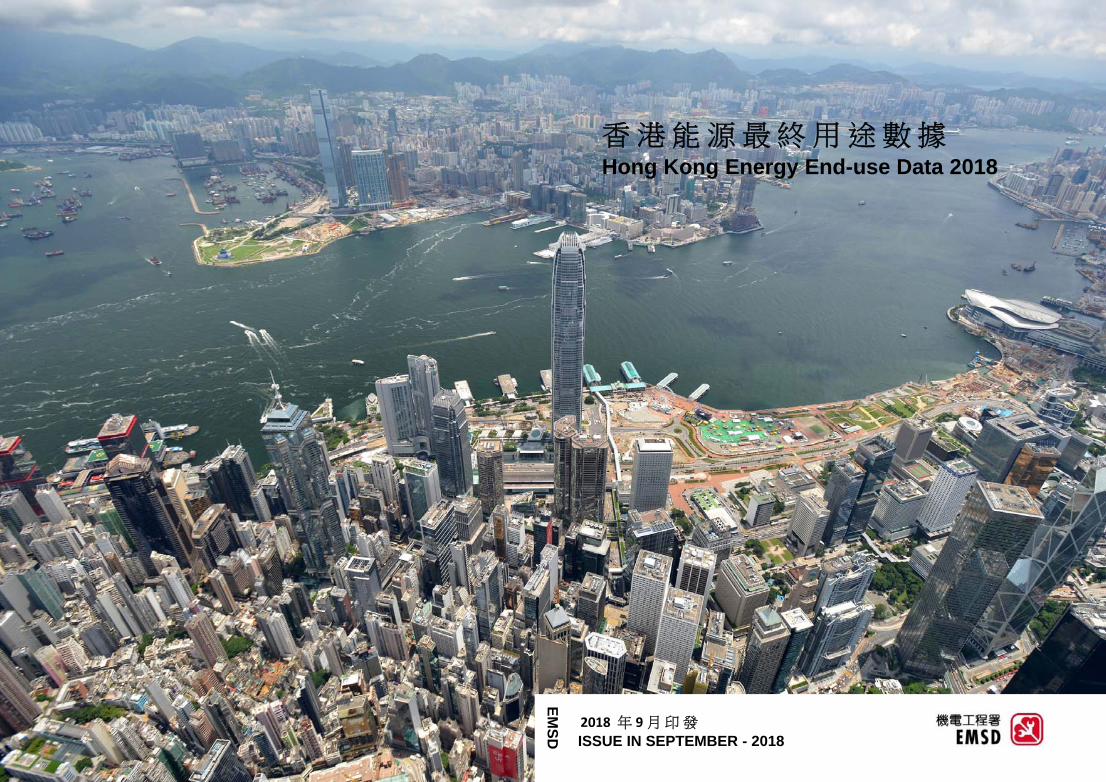
2018 年 9月印發
ISSUE IN SEPTEMBER - 2018
香港能源最終用途數據Hong Kong Energy End-use Data 2018
Disclaimer
香 港 能 源 最 終 用 途 數 據
2018Hong Kong Energy End-use Data
2018
有關本刊物的查詢請聯絡
機電工程署 能源效益事務處
地址香港九龍灣啟成街3號7樓
圖文傳真(852) 2890 6081電郵energydataemsdgovhk
Enquiries about this publication can be directed to The Energy Efficiency Office
Electrical amp Mechanical Services DepartmentAddress 7F 3 Kai Shing Street Kowloon Bay Hong Kong
Fax No (852) 2890 6081E-mail energydataemsdgovhk
機電工程署網站 Website of Electrical amp Mechanical Services Departmenthttpwwwemsdgovhk
聲明
雖然香港特別行政區政府機電工程署在擬備此套能源最終用途數據時
已盡力確保資料準確完備但不論數據使用者以何種形式應用此套數據
如因此而引致任何損失或損害機電工程署概不承擔任何責任
Although every care has been exercised to prepare this set of energy end-use data the Electrical amp Mechanical Services Department of theGovernment of the Hong Kong Special Administrative Region shall notaccept any liability for loss or damage occurring as a consequence ofreliance by the data user in whatever form on this set of data
21 All Energy Consumption By Sectors P2321 所有能源使用按類別劃分 P23
目錄
Table of Contents
Table of Contents目錄
Table of Contents P01目錄 P01
Introduction P03引言 P03
Overview P05概觀 P05
24 Town Gas amp LPG Consumption By Sectors P2624 煤氣及石油氣使用按類別劃分 P26
3By End-uses amp Segments P273按最終用途及組別劃分 P27
1Key Energy End-use Related Data P191主要最終能源使用有關數據 P19
22 Electricity Consumption By Sectors P2422 電力使用按類別劃分 P2423 Oil amp Coal Products Consumption By Sectors P2523 油及煤產品使用按類別劃分 P25
2By Sectors amp Fuels P232按類別及燃料劃分 P23
33 All Energy Consumption By End-uses In Commercial Segments P3533 商業類別所有能源使用按最終用途劃分 P3534 Electricity Consumption By End-uses In Commercial Segments P4134 商業類別電力使用按最終用途劃分 P41
31 All Energy Consumption By End-uses In Residential Segments P2731 住宅組別所有能源使用按最終用途劃分 P2732 Electricity Consumption By End-uses In Residential Segments P3132 住宅組別電力使用按最終用途劃分 P31
37 All Energy Consumption By End-uses In Transport Segments P5737 運輸類別所有能源使用按最終用途劃分 P57
4By Fuels amp Sectors P604按燃料及類別劃分 P60
35 All Energy Consumption By End-uses In Industrial Segments P4735 工業類別所有能源使用按最終用途劃分 P4736 Electricity Consumption By End-uses In Industrial Segments P5236 工業類別電力使用按最終用途劃分 P52
43 Commercial Sector By Fuels P6243 商業組別按燃料劃分 P6244 Industrial Sector By Fuels P6344 工業組別按燃料劃分 P63
41 All Energy Consumption By Fuels P6041 所有能源使用按燃料劃分 P6042 Residential Sector By Fuels P6142 住宅組別按燃料劃分 P61
54 煤氣及石油氣使用按最終用途劃分
45 Transport Sector By Fuels P6445 運輸組別按燃料劃分 P64
5By End-uses amp Fuels P655按最終用途及燃料劃分 P6551 All Energy Consumption By End-uses P65P6552 Electricity Consumption By End-uses P69P69
51 所有能源使用按最終用途劃分
52 電力使用按最終用途劃分
53 油及煤產品使用按最終用途劃分 53 Oil amp Coal Products Consumption By End-uses P69P6954 Town Gas amp Liquefied Petroleum Gas Consumption By End-uses P71P71
01 02
8Units of Measurement P788計量單位 P78
6Notes P736註釋 P73
7Chronology of Major Revisions P747主要修訂年表 P74
1 1 1 1 1 11 11 11 11 1
111
「香港能源最終用途數據」二十載
HKEEUD 20th Anniversary
03 04
今年是《香港能源最終用途數據》20周年其間全球經濟發展帶動能源需求持續增
長自1998年起機電工程署發布《香港能源最終用途數據》數據內容包括不同
能源的消耗量及其用途如用於空氣調節照明及煮食等資料數據讓市民學術
界及業界清晰了解本地能源的消耗模式及用途之餘並提高各界對未來能源發展的
認識數據每年更新為政府提供參考資料以制定及檢討能源效益方面的政策
香港政府發報的《香港都市節能藍圖2015~2025+》設定了以2005年為基年於 2025
年之前達致香港能源強度減少40的目標根據這最新的《香港能源最終用途數
據》在2005年至2016年的十一年間香港的能源強度已減少了28取得這初步成
績全賴市民和社會各界過去的共同努力未來我們仍需不懈努力以達長遠節能
目標
This year marks the 20th anniversary of the Hong Kong Energy End-use Data (HKEEUD) duringwhich the global economic development led to continued growth in energy demand Since 1998EMSD has published the HKEEUD which covers energy consumption data of the different fuel typesand the specific purposes for which they are consumed eg air-conditioning lighting cooking etcThe data provides an understanding of the energy consumption patterns and usages and arousespublic academia and the private sectors interest and concern over the future development of energyin Hong Kong The data is updated annually it serves as a reference for the Government to formulateand evaluate energy efficiency policies
The Energy Saving Plan For Hong Kongrsquos Built Environment 2015~2025+ issued by the Governmentsets the Hong Kong target by 2025 for reducing energy intensity by 40 with 2005 as the base yearAccording to the latest HKEEUD Hong Kongs energy intensity has decreased by 28 during the 11years from 2005 to 2016 The award of this initial achievement depends on the joint efforts of thepublic and different sectors In the future we still need to make unremitting efforts to achieve long-term energy conservation goals
1998 2004 2012 2013 2015 2018
香港能源最終數據已上載於
機電工程署網頁
The end-use data got on-line in EMSD website
能源最終用途數據包括可再
生能源數據
Renewable energy data were added to the energy end-use data
「商業」及「工業」類別的分
類已經根據香港標準行業分類
20版作出修訂
The ldquoCommercialrdquo and ldquoIndustrialldquo Sectors were re-categorized to align with the Hong Kong Standard Industrial Classification (HSIC) Version 20
能源最終用途於「資料一線
通」以電腦可讀格式發布
The energy end-use data was published in machine-readable format in DATAGOVHK
第一本香港能源最終數據
於1998年出版
The first version of Hong Kong Energy End-useData was issued in 1998
香港能源最終數據 20週年
版本發布
The 20th anniversaries of the book publishing
1 1 1 1 1 11 11 11 11 11 11 11 11 11 11 11 11 11 11 11 11 11 11 11 11 11 11 11 11 11 11 11 11 11 11 11 11 11 11 11 11 11 11 11 11 11 11 11 11 11 11 11 11 11 11 11 11 11 11 11 11 11 11 11 11 11 11 11 11 11 11 11 11 11 11 11 11 11 11 11 11 11 11 11 11 11 11 11 11 11 11 11 11 11 11 11 11 11 11 11 11 11 11 11 11 11 11 11 11 11 11 11 11 1111
11111111111111111111111111111111111111111111111111111111111111111111111
111111111111111 11 11 11 11 11 11 11 11 11 11 11 11 11 11 11 11 11 11 11 11 11 11 11 11 11 11 11111111111111111
概觀
The graph below shows the relationshipbetween the distribution of energy end-use by fuel type and by sector
能 源 數 據3
可 按 燃 料 劃 分 為 三 個 類 別
(「電力」4
「煤氣及石油氣」5
與
「油及煤產品」6 )
A basic energy end-use data set for HongKong from 2006 to 2016 is provided inthis booklet ldquoHong Kong Energy End-useData 2018rdquo
The energy data are also classified intofour sectors - namely ResidentialCommercial Industrial and TransportSector In each sector the data are furtherclassified into different segments Generalenergy end-use data are presented in eachsegment7 8
「能源最終用途數據」是指能源最終的特
定 用 途1 在 2016 年 間 該 能 源 總 量為
289219太焦耳2
ldquoHong Kong Energy End-use Datardquo refers tothe energy finally consumed for specificpurposes1 In 2016 the amount was289219 TJ2
下圖顯示能源最終用途數據按各類別與各
類燃料分配的關係
Overview
這本「香港能源最終用途數據2018」冊子
記錄香港在2006年至2016年間能源最終用
途的基本數據
能源數據亦可劃分為四個類別 (即住宅商
業工業及運輸) 而每一類別亦可再分為
多個小類別稱為組別 一般的基本能源
最終用途數據會在每個組別列出7 8
The energy data3 are classified into threefuel types - ldquo Electricity rdquo 4 ldquo Town Gasand Liquefied Petroleum Gasrdquo5 and ldquoOiland Coal Productsrdquo6
1 「能源最終用途」的例子有空氣調節照明及煮食等 Air conditioning lighting and cooking are examples ofldquoenergy end-userdquo
2 1太焦耳相等於「1 x 10¹²焦耳(J)」
1 Terajoule (TJ) equals to 1 x 10¹² joule (J)
3 能源數據主要是以調查及從政府部門公用事業機構及一些私人公司和組織等多個資料來源收集所得資料作為計算估計的依據The energy data are derived estimated mainly based on survey results and information gathered from various sources such asgovernment departments public utilities private companies and organisations
7 「能源最終用途數據集」涵蓋本港內部民用的「能源最終用途」數據並不包括出口能源本港與其他經濟體之間的運輸用能源
以及軍事所用能源The energy end-use data set covers internal civilian energy end-uses in Hong Kong It does not include energy exported energyused for transportation purposes between Hong Kong and other economies and energy used for military
4 「電力」包括燃煤天然氣風能及太陽能所產生的電能 ldquoElectricityrdquoincludes the electricity generated from coal natural gas wind and solar power
5 「煤氣及石油氣」包括煤氣石油氣及生物氣體ldquoTown Gas and Liquefied Petroleum Gasrdquo include town gas liquefied petroleum gas (LPG) and bio-gas
8 由於四捨五入關係統計表內個別項目的數字加起來可能與總數略有出入There may be a slight discrepancy between the sum of individual items and the total as shown in the tables in the booklet owing torounding
6 「油及煤產品」 包括汽油柴油煤油航空燃料木炭無煙煤焦煤半焦煤及生物柴油ldquoOil and Coal Productsrdquo include gasoline diesel kerosene aviation fuel charcoal anthracite coking coal semi-coking coal and bio-diesel
05 06
損耗
Loss
1749 374 TJ
2881 184 TJ
55158 662 TJ
2161 439 TJ
43123 969 TJ
513 992 TJ
3189 819 TJ
37 30 2 30+ + +
lt1 6 5 89
+ + +
27 65 5 2+ + +
=
=
=
=
=
=
=
+ +30 lt1 70
12 4 84
+ +
8 29 62+ +
17 80 3
+
住宅
Resi
dent
ial
商業
Com
mer
cial
工業
Indu
stria
l運
輸
Tran
spor
t
商業
Com
mer
cial
煤氣
及石
油氣
Tow
n G
as amp
Liqu
efie
d Pe
trol
eum
Gas
油及
煤產
品
Oil
ampC
oal
Prod
uct
電力
Elec
tric
ity
電力
Elec
tric
ity
油及
煤產
品
Oil
ampC
oal
Prod
uct
住宅
Resi
dent
ial
工業
Indu
stria
l
運輸
Tran
spor
t
年份 Year 2016 按燃料劃分的能源最終用途Energy End‐use By Fuels 按類別劃分的能源最終用途Energy End‐use By Sectors
煤氣
及石
油氣
Tow
n G
as amp
Liqu
efie
d Pe
trol
eum
Gas
100289 219 TJ
100289 219 TJ
電力
Electricity55
油及煤產品
Oil amp Coal Products28
煤氣及石油氣
Town Gas amp LPG17
商業
Commercial43
運輸
Transport31
住宅
Residential21
工業
Industrial5
1 1 1 1 1 1 1 11 11 11 11 11 11 11 11 11 11 11 11 11 11 11 11 11 11 11 11 11 11 11 11 11 11 11 11 11 11 11 11 11 11 11 11 11 11 11 11 11 11 11 11 11 11 11 11 11 11 11 11 11 11 11 11 11 11 11 11 11 11 11 11 11 11 11 11 11 11 11 11 11 11 11 11 11 11 11 11 11 11 11 11 11 11 11 11 11 11 11 11 11 11 11 11 11 11 11 11 11 11 11 11 11 11 11 11 11 11 11 1
1 11 11 11 11 11 11 11 11 11 11 11 11 11 11 11 11 11 11 11 11 11 11 11 11 11 11 11 11 11 11 11 11 11 11 11 11 11 11 11 11 11 11 11 11 11 11 11 11 11 11 11 11 11 11 11 11 11 11 11 11 11 11 11 11 11 11 11 11 11 11 11 11 11 11 11 11 11 11 11 11 11 11 11 11 11 11 11 11 11 11 11 11 11 11 11 11 11 11 11 11 11 11 11 11 11 11 11 11 11 11 11 1111111111
111
概觀
9 一次能源供應總量是指能源進口量(減去轉口及出口量)加上貯存量的調整再加上本地生產的能源數量Total Primary Energy Supply (TPES) refers to the amount of import energy (less re-export and export) adjusted by stock change andincludes the indigenous amount
Overview
「能源最終用途」是從一次能源供應總
量9
中直接取得及由其轉化為二次能源10
後所提供的能源
The ldquoenergy end-userdquo is directly drawnfrom the Total Primary Energy Supply(TPES)9 and after transformation assecondary energy10
11 每一千兆焦耳(GJ) 相等於1 x 10⁹ 焦耳 (J) 或相等於ldquo1x10 -3 太焦耳 (TJ)rdquo
Each Giga Joule (GJ) equals to 1 x 10⁹ joule (J) or equals to ldquo1x10 -3 Terajoule (TJ)rdquo10 二次能源是指由一次能源轉化並減去轉化損耗後所得的能源
Secondary energy refers to the energy transformed from primary energy supply less the transformation loss
在2016年平均每一香港人所用的能源最終
用途量為394千兆焦耳11在2006至2016
年 間 下 降 了 39 ( 平 均 按 年 下 降 率 是
04)
下示的能源流程圖描述了能源在香港如
何流動 在2016年間香港的一次能源供
應總量為602827太焦耳其中的289219
太焦耳作為「能源最終用途」而使用於
香港
The Energy Flow Diagram below depictsthe flow of energy in Hong Kong In2016 the amount of Total PrimaryEnergy Supply was 602827 TJ out ofwhich 289219 TJ was consumed asldquoenergy end-userdquo within Hong Kong
The energy consumption per capita in2016 was 394 GJ per capita11 For theperiod from 2006 - 2016 the energyconsumption per capita was reduced by39 (Decreased at an average annualrate of 04)
07 08
千兆焦耳人GJCapita
能源最終用途
End‐use Energy
出口
Export可再生能源
一次能源供應
Total Primary Energy Supply(本地生產+進口‐出口plusmn貯存量) 損耗 Loss
油及氣體
產品
Oil amp Gas Products
儲存調整
Stock Change
煤產品
Coal Products
儲存調整
Stock Change
電力
Electricity
氣體能源產品
油及煤產品
Oil and Coal
電力
Electricity
損耗及自用
Loss and Own
能源留港使用
Energy Retainedfor Consumption in
Hong Kong
394
1 1 1 1 1 1 1 11 11 11 11 11 11 11 11 11 11 11 11 11 11 11 11 11 11 11 11 11 11 11 11 11 11 11 11 11 11 11 11 11 11 11 11 11 11 11 11 11 11 11 11 11 11 11 11 11 11 11 11 11 11 11 11 11 11 11 11 11 11 11 11 11 11 11 1
1111111111
主111111111111111111111111111111111111111
1 1 1 1 1 11 1 1 1 1 11 1 1 1 1 11 1 1 1 1 11 1 1 1 1 1
111111111111111
1111111111111111 11 11 11 111 11 11 11 11 11 111111 11 11 11 11 1111111111111111111111111111111111111111111111111111111111111
在2016年間289219 太焦耳作為「能源
最終用途」使用於香港而從經濟角度
來看「本地生產總值」約為 24908 億
港元
In 2016 289219 TJ was consumed asldquoenergy end-userdquo in Hong Kong On aneconomy-wide perspective the GDPwas about 2491 billion HK dollar
能源最終用途 (太焦耳)本地生產總值 (十億港元)Energy End-use (TJ) GDP (HK$ billion)
In 2016 the ldquoEnergy Intensityrdquo was 116TJ per billion HK dollar in 2016 For theperiod from 2006 to 2016 the EnergyIntensity of Hong Kong was reduced by231 (Decreased at an average annualrate of 26)
在2016年間「能源強度」每十億港元
是116 太焦耳在2006年至2016年間香
港的「能源強度」已下降了231 (平均
按年下降率是26)
概觀
Overview
Greenhouse Gas (GHG) Emissions「能源強度」
12是用來衡量一個經濟體
系如何有效地使用能源來製造經濟輸出
(即「本地生產總值」)
ldquo Energy Intensity rdquo 12 is used to gaugethe efficient use of energy in producingeconomic output of an economy interms of ldquoGDPrdquo
根據環境保護署公佈的温室氣體排放數據GHG emission figures as published by Environmental Protection Department
12 「能源強度」是「能源最終用途」和「本地生產總值」的比例 (即每生產一單位「本地生產總值」時所使用的「能源最終用途」
量)ldquoEnergy Intensityrdquo is represented by the ratio of ldquoenergy end-userdquo to ldquoGDPrdquo (ie the amount of ldquoenergy end-userdquo consumed in
producing a unit of ldquoGDPrdquo)
13
In 2016 the Residential Sector of HongKong consumed 61439 TJ of energywith 43120 TJ being electricity Theenergy and electricity increased by138 and 217 for the period 2006- 2016 respectively (Increased at anaverage annual rate of 13 and 20respectively)
在2016年間香港的住宅類別一共使用
了61439太焦耳而其中43120太焦耳
是由電力提供 在2006至2016年間住
宅類別總能耗和電力能耗分別上升138
及217 (即平均按年增長率是13和
20)
住宅類別 Residential Sector
能 源 的 使 用 產 生 了 大 量 的 溫 室 氣 體
(GHG)在2016年間香港的溫室氣體排
放總量一共為 41900 千公噸二氧化碳當
量13
而其中約 90 源自能源的使用
The consumption of energy generates alarge amount of greenhouse gas (GHG)emissions in Hong Kong In 2016 thetotal GHG emissions in Hong Kong was41900 kilotonnes CO2-e
13 around90 of which originated from theconsumption of energy
09 10
110
120
130
140
150
160
2006 2007 2008 2009 2010 2011 2012 2013 2014 2015 2016
‐ 231
非能源產品 Non‐Energy Product
能源產品 Energy Product
41900 kilotonnes CO2‐e Greenhouse gas emissions
溫室氣體排放量
(千公噸二氧化碳當量)
1 1 1 1 1 1 1 11 11 11 11 11 11111111111111111111111111111111111111111111111111111111111111111111111111111111111111111111111111
1111111111111111111111111111111111
111111111
1 11 11 11 11 11 11 11 11 11 11 11 11 11 11 11 11 11 11 11 1111111111111
概觀
Overview
隨著香港人口14
和家庭住户15
數目的增
長住宅類 別的 能耗 均有 所同 步增
長
在2016年間住宅電力的使用上香港的
個人平均用電量為59千兆焦耳(1632千
瓦小時)16 在2006至2016年間個人平
均用電量的平均按年增長率是13
The average amount of electricityconsumed in the Residential Sector ofHong Kong by each capita in 2016 wasabout 59 GJ (1632 kWh)16 For theperiod 2006 ndash 2016 the electricityconsumption per capita increased at anaverage annual rate of 13
在2016年間在住宅類別內每個人平
均 總 能 耗 為 84 千兆 焦耳 在 2006至
2016年間個人平均總能耗的平均按
年增長率是06
Within the Residential Sector theenergy consumed by each capita was84 GJ in 2016 For the period 2006 ndash2016 it increased at an average annualrate of 06
在住宅類別中所使用的主要燃料為「電
力」和「煤氣及石油氣」 而「油及煤
產品」所佔份額很少
The types of fuel consumed by theResidential Sector were mainlyldquo Electricity rdquo and ldquo Town Gas andLiquefied Petroleum Gasrdquo while ldquoOil andCoal Products rdquo constituted only anegligible share
在住宅類別中能源最終用途主要使
用在「空氣調節」「煮食」和「熱
水」上
In the Residential Sector the ldquo AirConditioning rdquo ldquo Cooking rdquo and ldquo HotWater rdquo were major energy consumingend-use
14 根據政府統計處公佈的人口统計數字Population number as published by the Census and Statistic Department
16 每人月均耗電量約為135度Electricity consumption consumed by each capita roughly equals to 135 kWh per month
15 根據政府統計處公佈的家庭住戶數目Household number as published by the Census and Statistic Department
The increase in consumption in theResidential Sector was accompanied byan increase in both the population14
and household number in Hong Kong15
1211
煤氣及石油氣
Town Gas amp LPG30
油及煤產品Oil and Coal Productslt1
電力
Electricity70
空氣調節
Air Conditioning
25
煮食
Cooking 24
熱水
Hot Water 18
其他
Others33
千兆焦耳人GJCapita
84
1 1 1 111111111 1 1 1 1 1 1 1 1 1 1 1 1 1 1 1 1 1 1 1 1 1 1 1 1 11 2 2 2 2 2 2 2 2 2 2 2 2 2 2 2 2 2 2 2 2 2 2 2 2 211111111 2 2 2 2 21 2 2 2 2 21 2 2 2 2 21 2 2 2 2 21 2 2 2 2 21 2 2 2 2 21 2 2 2 2 21 2 2 2 2 21 2 2 2 2 21 2 2 2 2 21 2 2 2 2 21 2 2 2 2 21 2 2 2 2 21 2 2 2 2 21 2 2 2 2 21 2 2 2 2 21 2 2 2 2 21 2 2 2 2 21 2 2 2 2 21 2 2 2 2 21 2 2 2 2 21 2 2 2 2 21 2 2 2 2 21 2 2 2 2 21 2 2 2 2 21 2 2 2 2 21 2 2 2 2 21 2 2 2 2 21111111111111111111111111111111111111111111111111111111111111111 2 21 2 21 2 21 2 2
2 21 2 21 2 21 2 21 2 21 2 21 2 21 2 21 2 21 2 21 2 21 2 21 2 21 2 21 2 21 2 21 2 21 2 21 2 21 2 2 2 21 2 2 2 21 2 2 2 21 2 2 2 21 2 2 2 21 2 2 2 21 2 2 2 21 2 2 2 21 2 2 2 21 2 2 2 21 2 2 2 21 2 2 2 21 2 2 2 21 2 2 2 21 2 2 2 21 2 2 2 21 2 2 2 21 2 2 2 21 2 2 2 21 2 2 2 21 2 2 2 21 2 2 2 21 2 2 2 21 2 2 2 21 2 2 2 21 2 2 2 21 2 2 2 21 2 2 2 21 2 2 2 21 2 2 2 21 2 2 2 21 2 2 2 21 2 2 2 21 2 2 2 21 2 2 2 21 2 2 2 21 2 2 2 21 2 2 2 2 21 2 2 2 2 21 2 2 2 2 21 2 2 2 2 21 2 2 2 2 21 2 2 2 2 21 2 2 2 2 21 2 2 2 2 21 2 2 2 2 21 2 2 2 2 21 2 2 2 2 21 2 2 2 2 21 2 2 2 2 21 2 2 2 2 21 2 2 2 2 21 2 2 2 2 21 2 2 2 2 21 2 2 2 2 21 2 2 2 2 21 2 2 2 2 21 2 2 2 2 21 2 2 2 2 21 2 2 2 2 21 2 2 2 2 21 2 2 2 2 21 2 2 2 2 21 2 2 2 2 21 2 2 2 2 21 2 2 2 2 21 2 2 2 2 21 2 2 2 2 21 2 2 2 2 21 2 2 2 2 21 2 2 2 2 21 2 2 2 2 21 2 2 2 2 21 2 2 2 2 21 2 2 2 2 21 2 2 2 2 21 2 2 2 2 21 2 2 2 2 21 2 2 2 2 21 2 2 2 2 21 2 2 2 2 21 2 2 2 2 21 2 2 2 2 21 2 2 2 2 21 2 2 2 2 21 2 2 2 2 21 2 2 2 2 21 2 2 2 2 21 2 2 2 2 21 2 2 2 2 21 2 2 2 2 21 2 2 2 2 21 2 2 2 2 21 2 2 2 2 21 2 2 2 2 21 2 2 2 2 21 2 2 2 2 21 2 2 2 2 211111111
概觀
Overview
商業類別 Commercial Sector 運輸類別 Transport Sector
在2016年間香港的商業類別一共使用了
123969太焦耳而其中約838或103881
太焦耳是由電力提供在2006至2016年間
商業類別總能耗和電力能耗分別上升
108及113 (即平均按年增長率是1和
11)
In 2016 the Commercial Sector of HongKong consumed 123969 TJ around838 or 103881 TJ of which waselectricity The energy and electricityincreased by 108 and 113 for theperiod 2006 - 2016 respectively (Increasedat an average annual rate of 1 and11 respectively)
在2016年間香港的運輸類別一共使用了
89819太焦耳而其中「貨運」和「客
運 」 子 類 別 分 別 使 用 27682 太 焦 耳 和
62136太焦耳
In 2016 the Transport Sector of HongKong consumed 89819 TJ with theldquo Freight rdquo and ldquo Passenger rdquo Sub-sectorsconsuming 27682 TJ and 62136 TJrespectively
在2006至2016年間運輸類別總能耗下降
68 (即平均按年下降率是07) 在同
期間「貨運」子類別能耗下降293
(即平均按年下降率是34)而「客運」
子類別能耗上升85 (即平均按年增長率
是08)
For the period 2006 ndash 2016 the energyconsumption by the Transport Sectordecreased 68 (Decreased at an averageannual rate of 07) Within the ldquoFreightrdquoSub-sector the energy consumptiondecreased 293 (Decreased at an averageannual rate of 34) Within theldquo Passenger rdquo Sub-sector the energyconsumption increased 85 (Increased atan average annual rate of 08)
在商業組別中 「食肆」為主要的能源
使用者佔總量的17 其次為是「零
售」(14)「住宿」(13)和「辦
公室」(11)
In the Commercial Sector theldquo Restaurant rdquo Segment consumed mostof the energy accounted for 17 ofoverall consumption followed by ldquoRetailrdquo (14) ldquoAccommodationrdquo (13) andldquoOfficerdquo(11)
在「客運」子類別中「汽車及電單車」
為主要的能源使用者一共使用了23343
太焦耳(376) 其次為是「巴士」
18918太焦耳(304)「的士」12288
太焦耳(198)及「鐵路」2951太焦耳
(47)在商業類別中能源最終用途主要使用
在「空氣調節」一共使用了24其次
用在「煮食」(14)「照明」
(12)和「熱水及冷凍」 (12)
In the Commercial Sector the ldquo AirConditioning rdquo was the largest end-useconsuming 24 of the total energyfollowed by rdquoCookingrdquo (14) ldquoLightingrdquo (12) and ldquoHot Water amp Refrigerationrdquo (12)
13 14
In the ldquoPassengerrdquo Sub-sector the ldquoCaramp Motorcyclerdquo Segment consumed mostof the energy 23343 TJ (376)followed by the ldquo Bus rdquo of 18918 TJ(304) the ldquo Taxi rdquo of 12288 TJ(198) and the ldquo Rail rdquo of 2951 TJ(47)
其他
Others
鐵路
Rail
的士
Taxi
巴士
Bus
汽車及
電單車
Car amp Motorcycle
4636
2951
12288
18918
23343
太焦耳TJ
食肆
Restaurant17
零售
Retail14
住宿
Accommodation13
辨公室
Office11
其他
Others45
空氣調節
Air Conditioning
24
煮食
Cooking 14照明
Lighting12
熱水及冷凍
Hot Water amp Refrigeration
12
其他
Others38
15 16
The main type of fuel for the TransportSector was ldquo Oil amp Coal Products rdquoconstituting 80 of the totalconsumption followed by ldquoTown Gas ampLiquefied Petroleum Gas rdquo (17) andldquoElectricityrdquo (3)
工業類別 Industrial Sector
在2016年間香港的工業類別一共使用了
13992 太焦耳而其中的622或8709太
焦耳是由電力提供 2006至2016年間工
業類別總能耗和電力能耗分別下降261
及 379 ( 即 平 均 按 年 下 降 率 是 30 和
46)
In 2016 the Inductrial Sector of HongKong consumed 13992 TJ around622 or 8709 TJ of which waselectricity The energy and electricitydecreased by 261 and 379 for theperiod 2006 - 2016 respectively(Decreased at an average annual rate of30 and 46 respectively)
17 根據國際能源機構可再生能源工作小組定義As defined by the Renewable Energy Working Party of the International Energy Agency
18 在堆填區所產生的生物氣體部分用於生產煤氣這部分的生物氣體因不是直接作為能源最終用途所以不被記錄在這能源最終用途
數據冊子內A portion of the biogas from landfill sites is used for producing Town Gas This amount of biogas is not directly consumed by end-users and hence not recorded in this energy end-use dataset
Overview
可再生能源 Renewable Energy
概觀
運輸類別所使用的主要燃料為「油及煤
產品」佔總量的80其次為「煤氣和
石油氣」(17) 及「電力」(3)
可再生能源泛指「由天然過程產生並可
不斷補充的能源」17
Renewable energy generally refers to ldquoenergythat is derived from natural processes that arereplenished constantly 17ldquo
每年香港 境內 都出 產少 量的 可再 生能
源 主要的可再生能源為太陽能風
能生物氣體和生物柴油
A small amount of renewable energy isproduced within Hong Kong as indigenousproduction The major types of renewableenergy available in Hong Kong are solar energywind energy biogas and biodiesel
太陽能普遍被用作通過太陽能光伏板來發電或給水加熱風
能通過風力發電機組產生電力 生物氣體是由堆填區和污水
處理廠的垃圾和污泥所產生 除了部分用作發電外生物氣
體會供堆填區處理滲濾污水18 和處理污水處理廠的污泥生物
柴油大部分產自回收廢油並通常用作為車輛燃料
Solar energy is commonly used to generate electricity usingphotovoltaic panels and heat water Wind energy is harnessedby wind turbines to generate electricity Biogas is produced atlandfill sites and sewage treatment plants from landfill wasteand sewage sludge The gas besides being partly used togenerate electricity is also used for leachate treatment atlandfills18 and sewage sludge at sewage treatment plantsBiodiesel is primarily made from re-cycled oil and is typicallyused by vehicles
油及煤產品
Oil amp CoalProducts80
煤氣及石油氣
Town Gas amp LPG17
電力
Electricity3
200618934 TJ
2016
13992TJ
-9-8
燃料類別Type of Fuels
可再生能源類別Type of Renewable Energy
lt 單位太焦耳 Unit Terajoule gt
總計 Total 1 913
158
37
9
1 709
可再生能源Renewable Energy
所佔比例Percentage
894
lt1
19
82
1000
燃料佔所有能源用途的比重Weighting of Fuelsin Energy End-uses
可再生能源在所屬燃料類別的比重Weighting of Renewable Energy
in Respective Fuel Type
281
549
171
81 184
158 662
49 374
158
188
1 567
概觀
Overview
表 R1 Table R1
表 R2 Table R2
香港的可再生能源 Renewable Energy in Hong Kong
在2016年間香港本地生產了約1913太焦耳
的各類可再生能源並用在能源最終用途
上
In 2016 around 1913 TJ of renewable energyof various types were produced and consumedby end-uses in Hong Kong
生物柴油 Bio-diesel
太陽能 Solar Energy
風能及水能 Wind Energy amp Hydropower
生物氣體 Biogas
可再生能源 - 煤氣及石油氣 Renewable Energy - Town Gas amp LPG可再生的氣態能源數量佔「煤氣及石油氣」的使用量約32(包括堆填區和污水處理廠所
產生的氣體)The amount of gaseous renewable energy accounts for roughly 32 of theldquoTown Gas ampLPGrdquo consumption (Includes biogas from landfill site and sewage treatment plants)
可再生能源 - 油及煤產品 Renewable Energy - Oil amp Coal Products可再生的油性能源數量佔「油及煤產品」的使用量約02(包括車輛使用的生物柴油)The amount of oil type renewable energy accounts for roughly 02 of theldquoOil amp CoalProductsrdquo consumption (Includes bio-diesel used by vehicles)
可再生能源在所屬燃料類別的比重Weighting of Renewable Energy in Respective Fuel Type
18
可再生能源 - 電力 Renewable Energy - Electricity可再生的電力能源數量佔「電力」使用量約01(包括用於為水加熱的太陽能和光伏板
所產生的電力)The amount of renewable electricity accounts for roughly 01 of the Electricityconsumption (Includes solar energy used to heat water and electricity generated by PVpanels)
17
02
01
32
油及煤產品 Oil amp Coal Products
電力 Electricity
煤氣及石油氣 Town Gas amp LPG
07lt 單位太焦耳 Unit Terajoule gt
總計 Total 1000 289 219 1 913
煤氣及石油氣
Town Gas amp LPG17
油及煤產品
Oil amp Coal Products
28
電力
Electricity55
32
02
01 太陽能
Solar Energy19
風能及水能
Wind Energy ampHydropower
lt 1
生物氣體
Biogas894
生物柴油
Bio-diesel82
2 381 184 289 338
20
圖 3 Graph 3
表 1 Table 1
2136 2 317 174 284 391
4000
4002
4011
3998
3961
2126 1 982 339 282 440
2 024 522 281 438
2 247 469 286 048
4101 2118 1 861 966 281 204 6 857 151
1主要最終能源使用有關數據
1Key Energy End-use Related Data
圖 2 Graph 2
19
圖 1 Graph 1
3950 2171 2 438 043 287 986
按人口平均計算的電力 (千兆焦耳)Electricity Capita (GJ)
3942 2163 2 490 776 289 219
能源最終用途 (太焦耳) 本地生產總值 (十億港元)Energy End-use (TJ) GDP (HK$ billion)
7 337
2015
2016 116
按人口平均計算
的能源最終用途
(千兆焦耳)Energy End-use
Capita (GJ)圖2 Graph 2
按人口平均
計算的電力
(千兆焦耳)Electricity Capita (GJ)
圖3 Graph 3
本地生產總值
按2016年環比物量計算
(百萬港元)8
GDP in chained2016 dollars
(HK$ million)8
圖5 Graph 5
能源最終用途
(太焦耳)Energy End-use
(TJ)圖6 Graph 6
人口(千人)Population
(000)圖4 Graph 4
2144
2169
2188
2 209 894
4084
2118
4001
4045
282 890
2142 1 974 738 278 799
2148 2 108 382
年份Year
能源最終用途
(太焦耳) 本地生產總值
(十億港元)Energy End-use (TJ) GDP (HK$ billion)
圖1 Graph 1
千兆焦耳
Gigajoule
按人口平均計算的能源最終用途 (千兆焦耳)Energy End-use Capita (GJ)
2006
2007
2008
2009
2010 281 729
2011
2012
2013
2014
太焦耳 十億港元
TJ HK$ billion千兆焦耳Gigajoule
142
139
141
134
128
127
123
122
118
6 916
6 958
6 973
7 024
7 072
7 150
7 179
7 230
7 291 380
385
390
395
400
405
410
415
2006 2007 2008 2009 2010 2011 2012 2013 2014 2015 2016
110
115
120
125
130
135
140
145
150
155
2006 2007 2008 2009 2010 2011 2012 2013 2014 2015 2016180
185
190
195
200
205
210
215
220
2006 2007 2008 2009 2010 2011 2012 2013 2014 2015 2016
1主要最終能源使用有關數據
1Key Energy End-use Related Data
數據來源 政府統計處Data Source Census and Statistics Department
人口(千人)
Population (000)
21 22
太焦耳
Terajoule
香港本地生產總值按2016年環比物量計算 (百萬港元)GDP in Hong Kong in chained 2016 HK dollars (HK$ million) 圖 5 Graph 5
百萬港元
HK$ million
數據來源 政府統計處Data Source Census and Statistics Department
人口(千人)Population (000) 圖 6 Graph 6
能源最終用途 (太焦耳)Energy End-use (TJ)圖 4 Graph 4
1 000 0001 100 0001 200 0001 300 0001 400 0001 500 0001 600 0001 700 0001 800 0001 900 0002 000 0002 100 0002 200 0002 300 0002 400 000
2006 2007 2008 2009 2010 2011 2012 2013 2014 2015 2016
6 500
6 600
6 700
6 800
6 900
7 000
7 100
7 200
7 300
7 400
2006 2007 2008 2009 2010 2011 2012 2013 2014 2015 2016 272 000
274 000
276 000
278 000
280 000
282 000
284 000
286 000
288 000
290 000
2006 2007 2008 2009 2010 2011 2012 2013 2014 2015 2016
2按類別及燃料劃分
43 415 27
lt 單位太焦耳 Unit Terajoule gt
2 972 2 158 275
2 875
9 242 6
2
23 24
lt 單位太焦耳 Unit Terajoule gt
2016
289 338
287 986
65
66
282 890
286 048
2016 61 439 21 123 969 43
100
100
100
100
2013 58 394 21 121 215 43 14 583
13 992 5 89 819 31 289 219
2012 59 932 21 120 970 42 14 723 5
26 101 4805 90 198 32 2013 39 941
2012 41 189100
24 93 317 64 14 015 10 2 444 2
25
2 796 2666
2 495 2
26 99 594 66 2 609 2
100
100
100
100
100
100
2008 37 100
2007 36 422
2006 35 428
2011 39 872
278 799
281 729 2010 39 344 26 97 894 65
26 96 7282009 38 972 65
43 120
2015 42 368 103 693
2014
95 051 65 13 104 9
6
9 144
27 101 813 66 9 356 6
27 103 881
102 627
27
9 530
2 9518 709 5
9 230 6
265
25 95 543 65 12 182 8 2 520 2
11 082 7 2 540 2
2 722 2
11 143 7 2 523 2
282 440
281 438
6
2015 60 214 21 123 674 43 14 853 5 89 245 31
284 391
2014 61 910 21 122 711 42 14 718 5 89 999 31
90 423 32
2011 58 826 21 118 558 42 14 732 5 90 774 32
2010 58 396 21 116 391 41 16 053 6 90 889 32
2009 57 731 21 114 297 41 16 129 6 90 643 33
2008 55 849 20 113 753 40 17 332 6 94 504 34
96 165 342007 54 717 19 113 914 40 17 645
7 96 404 34 281 2042006 53 982 19 111 884 40 18 934
2By Sectors amp Fuels
圖 7 Graph 7
22 電力使用按類別劃分
Electricity Consumption By Sectors
表 3 Table 3
年份Year
住宅Residential
商業Commercial
工業Industrial
運輸Transport
總計Total
年份Year
住宅Residential
商業Commercial
表 2 Table 2
太焦耳Terajoule
太焦耳Terajoule
工業Industrial
運輸Transport
總計Total
圖 8 Graph 8
21 所有能源使用按類別劃分 All Energy Consumption By Sectors
147 072
147 345
158 147
100
100
100
100
100
100
100
100
100
100
100
145 204
149 366
150 859
151 605
155 079
153 362
158 662
0
50 000
100 000
150 000
200 000
250 000
300 000
2006 2007 2008 2009 2010 2011 2012 2013 2014 2015 2016
住宅
Residential商業
Commercial工業
Industrial運輸
Transport
0
20 000
40 000
60 000
80 000
100 000
120 000
140 000
160 000
2006 2007 2008 2009 2010 2011 2012 2013 2014 2015 2016
住宅
Residential商業
Commercial工業
Industrial運輸
Transport
100
100
100
100
100
100
100
100
100
100
100
100
100
100
100
100
100
100
100
100
25 26
30 49 374lt 單位太焦耳 Unit Terajoule gt lt 單位太焦耳 Unit Terajoule gt
37 14 9240 5 164 2 14 9675 71 900 89
「總熱值」是使用於計算各種氣體燃料的熱含量 Gross caloricfic values are used in calculating the respective heat contents of the gaseous products
2014 8
6 4 112
30 1 272
30 1 1712016 8 81 184 2016 18 311
2015 8 0 88 80 757 2015 17 838 36 14 795
0 5 156
5 186 6 4 339 5 71 225
18 487 32
3 15 048 31
6 4 244 5 70 939 88 80 347 2014 2 16 185
48 954
14 709 2 15 348 3130 1 220
36 14 928 29 1 244
49 723
50 844
89 81 352 2012 18 736
18 446 372013 8 0 5 026 6 4 218 89 81 306 20135 72 054
2011 18 946 38 14 161
49 084
2012 8 0 4 769 6 4 259 31 49 61614 388 29 1 108 2 15 384
2010 13
29
385 72 317
33 49 73213 471 27 927 2 16 627
47 239
31 49 5682011 8 0 4 803 6 4 246 5 72 659
0 4 526 6 4 035 5 73 213
89 81 716
18 736 40 12 815 2 14 765 3127 923
39 13 971 28 937 31
15 506
2 15 13790
956 2
81 786 2010 19 038
2008 41 0 4 739 6 4 223
5 73 355
385 75 358 89 84 361 2008 18 708
2009 23 0 4 753 6 4 063 89 82 194 2009
9265 78 510 90 87 518
2007 18 238 37 13 888100
282006 79
29 917 2
3 994
年份Year
2006
總計Total
2007 57 0 4 975 6 3 623
住宅Residential
商業Commercial
工業Industrial
年份Year
住宅Residential
商業Commercial
工業Industrial
運輸Transport
100
2By Sectors amp Fuels
23 油及煤產品使用按類別劃分
Oil amp Coal Products Consumption By Sectors24 煤氣及石油氣使用按類別劃分 Town Gas amp LPG Consumption By Sectors圖 9 Graph 9 圖 10 Graph 10
表 4 Table 4 表 5 Table 5
太焦耳Terajoule
太焦耳Terajoule
2按類別及燃料劃分
總計Total
0 4 936 6
32 48 72190 86 647
運輸Transport
32 48 4822 15 45018 476
15 6784 77 992
38 13 631
0
10 000
20 000
30 000
40 000
50 000
60 000
70 000
80 000
90 000
2006 2007 2008 2009 2010 2011 2012 2013 2014 2015 2016
住宅
Residential商業
Commercial工業
Industrial運輸
Transport
0
5 000
10 000
15 000
20 000
25 000
30 000
35 000
40 000
45 000
50 000
2006 2007 2008 2009 2010 2011 2012 2013 2014 2015 2016住宅
Residential商業
Commercial工業
Industrial運輸
Transport
3按最終用途及組別劃分
3By End-uses amp Segments
所有住宅組別 All Residential Segments
31 住宅組別所有能源使用按最終用途劃分 All Energy Consumption By End-uses In Residential Segments
27
17 052 29 125 9 711
2016
2010
2009
2012
2011 16 418
10 028
28
所有住宅能源最終用途 All Residential Energy End-uses圖 11 Graph 11 圖 12 Graph 12
其他房屋 3
Other Housing 3
4 038
年份 Year 2016
表 6 Table 6
年份 Year 2006
太焦耳Terajoule
年份Year
公共房屋Public
Housing
私人房屋Private
Housing
房委會
資助出售單位 2
HA SubsidizedSale Flats 2
2007
61 910
57 731
53 982
58 396
58 826
59 932
58 394
lt 單位太焦耳 Unit Terajoule gt
61 439
2015 60 214
3 904
17 364 30 4802014
2013 16 614 28 407 9 470
29 117 9 662 3 629
16 844 29 268 9 804 4 016
2006
總計Total
2008
54 717
55 849
15 489 26 211 9 478 2 805
15 521 26 733 9 664 2 799
4 326
17 395 30 284 9 682 4 078
3 430
15 451 27 701 10 082 2 616
15 915
16 152
28 544 10 153 3 119
28 730 10 084
0
10 000
20 000
30 000
40 000
50 000
60 000
70 000
2006 2007 2008 2009 2010 2011 2012 2013 2014 2015 2016公共房屋
Public Housing私人房屋
Private Housing房委會資助出售單位
HA Subsidized Sale Flats 其他房屋
Other Housing
煮食
Cooking 26
空氣調節
Air Conditioning 22
熱水
Hot Water 20
照明
Lighting8
冷凍
Refrigeration 11
辦公室設備
Office Equipment9
其他
Others4
煮食
Cooking 24
空氣調節
Air Conditioning 25
熱水
Hot Water 18
照明
Lighting6冷凍
Refrigeration 9
辦公室設備
Office Equipment11
其他
Others7
1 408 529 318 375 272
1 012 561 284 343 171
1 412 527 307
364
1 159 557
1 128 554 311 347 210
3按最終用途及組別劃分
3By End-uses amp Segments
公共房屋組別 Public Housing Segment
31 住宅組別所有能源使用按最終用途劃分 All Energy Consumption By End-uses In Residential Segments
329
698 493 193
765 532 226
2 288 1 902 495 838
2 428 1 961 506 864
700 915
841
3 544
空氣調節Air
Conditioning
3 629
356
3 119
4 078
1 517
1 291 565 347 359 266 4 016 337
544 331 412 283 4 326
277 3 904
246
365 263 4 038
296
104 2 799
285 101 2 616 212
217 298
3 430 270
137
693 9 6821 133
791 545 249 294 102 2 805 211
熱水Hot
Water
照明Lighting
冷凍Refrigeration
辦公室
設備Office
Equipment
其他 1
Others 1總計Total
lt 單位太焦耳 Unit Terajoule gt
708 10 028
1 172
2 354 1 886 488 873 682 9 7111 115
1 014
519 10 084
2 163 1 949
1 896 1 954 513 816 717 9 470
585 857 567 9 6621 025
2 162 1 978 561 838 678 9 8041 127
2 302
401 9 664 909
2 216 1 992 673 940 418 10 082 977
2 190 1 927
冷凍Refrigeration
辦公室
設備Office
Equipment
其他 1
Others 1總計Total
2 157 1 976 725 886 385 9 478 844
熱水Hot
Water
563
2009
2 504
年份Year
煮食Cooking
1 977
589
照明Lighting
671
599 2008
2006
15 451
15 915
2007
2 761
2 867
2 621
676
2016 2 333
1 158
1 029
2011 2 515
2010 2 685 2 285 1 995 645 926
2012 2 459
955 468 10 153
873
1 811
2 403 945 1 777 1 044
925 1 822 1 022
959 1 788 1 878lt 單位太焦耳 Unit Terajoule gt
2015
723
1 851
1 059
照明Lighting
冷凍Refrigeration
辦公室
設備Office
Equipment
其他 1
Others 1
2012 8513 099
995
4 677
2013 4 800
2012 4 787 3 029 970 1 725
1 058
3 415 3 544
3 374
1 8762 691 3 552 958 1 679 16 614
17 364
17 052
29 117
3 421
2016 6 642
2 815
2016 4 809
3 101 1 002 27 7012 646
6 686
3 344 3 558
2015 6 341 3 048
7 201 5 256
2012 6 744
8 425 5 108 2 084
2015
2 764
6 176 5 104
2008
17 395
總計Total
2010 7 172
2009
2 148 898 2006
煮食Cooking
空氣調節Air
Conditioning
熱水Hot
Water
26 7332 4692 100 2 962 948
6 240 5 323 2 055
875
2014 4 789
5 094 2 107 8263 229 20162 848 2 167 30 284
2 155 28 407
7 364 5 101 2 208 2 743 2 008 29 268
2 204
2014
2007 6 974
2010
29 30
房委會資助出售單位組別 2
Housing Authority Subsidized Sale Flats Segment 2
年份Year
350lt 單位太焦耳 Unit Terajoule gt lt 單位太焦耳 Unit Terajoule gt
8 197
323 3583 212 20132013 6 676 6 507 5 094 2 097 2 665
3383 193 2014 827
2007
2 841 2 143 30 480
8 076 4 782 1 990 2 842 2 046 29 125
1 606
886 547 2502009 7 232
2011 7822011 7 014
6 740 5 344 2 167 3 134 1 164
6 949 5 279 2 178 3 003 1 333 28 730
28 544
2 9452 891
790
16 4182 931 3 564 942
6342008 7 334
657
2 314
2014
2013 2 402
61426 2112006 6 828 2 311
年份Year
煮食Cooking
6 122 5 074 2 830
2015
16 844
表 7 Table 7
2006
1 505
2010 4 661
2 620 3 567 952
2 849
2 870 3 557 947 1 818 742
冷凍Refrigeration
辦公室
設備Office
Equipment
其他 1
Others 1總計Total
1 825
1 367 15 489
16 152
15 521
煮食Cooking
空氣調節Air
Conditioning
熱水Hot
Water
照明Lighting
1 6421 763
1 558
1 794
2 773 3 509
2 801 3 566
3 5094 396 1 035 1 770
1 009 1 826
963 1 863
表 9 Table 9
私人房屋組別 Private Housing Segment 其他房屋組別 3 Other Housing Segment 3表 8 Table 8 表 10 Table 10
年份Year
空氣調節Air
Conditioning
1 421
2009 4 546
1 414
2008 4 467
2007 4 402
2011 4 735
fz234
太焦耳Terajoule
所有住宅能源最終用途 All Residential Energy End-uses圖 13 Graph 13
3按最終用途及組別劃分
3By End-uses amp Segments
所有住宅組別 All Residential Segments
32 住宅組別電力使用按最終用途劃分 Electricity Consumption By End-uses In Residential Segments
圖 14 Graph 14
年份 Year 2016
表 11 Table 11
35 428
總計Total
年份 Year 2006
2006
年份Year
公共房屋
PublicHousing
私人房屋Private
Housing
房委會
資助出售單位 2
HA SubsidizedSale Flats 2
其他房屋 3
Other Housing 3
9 442 5 73318 016
38 972
2010 39 344
2009
9 615
9 514
9 979
36 422
2008 37 100
2007 18 615
19 277
20 160
20 28210 100
39 872
2012 41 189
2011 5 932 2 932
6 068 3 253
20 739
21 195
10 269
10 674
39 941
2014 43 415
2013 5 810 3 159
6 351 3 334
20 500
22 522
10 473
11 209
lt 單位太焦耳 Unit Terajoule gt
31 32
11 036
11 220
21 575
22 393
6 168 3 588
6 117 3 390
42 368
2016
2015
43 120
6 333 2 500
6 234 2 727
2 236
5 972 2 220
6 222 2 088
0
5 000
10 000
15 000
20 000
25 000
30 000
35 000
40 000
45 000
2006 2007 2008 2009 2010 2011 2012 2013 2014 2015 2016
公共房屋
Public Housing私人房屋
Private Housing房委會資助出售單位
HA Subsidized Sale Flats 其他房屋
Other Housing
煮食Cooking
9
空氣調節Air Conditioning
35
熱水Hot Water
8 照明Lighting
9
冷凍Refrigeration
14
辦公室設備Office
Equipment15
其他Others10
煮食Cooking
9
空氣調節Air Conditioning
34
熱水Hot Water
11 照明Lighting
12
冷凍Refrigeration
16辦公室設備Office
Equipment13
其他Others
5
3按最終用途及組別劃分
3By End-uses amp Segments
公共房屋組別 Public Housing Segment
32 住宅組別電力使用按最終用途劃分 Electricity Consumption By End-uses In Residential Segments
350 272 3 3902016 1 882 8 197 1 965 2 107 2 848 3 229 2 166 22 393
2014 1 861 8 425 1 976 2 084 2 841
2015 1 777 8 076 1 797
lt 單位太焦耳 Unit Terajoule gt lt 單位太焦耳 Unit Terajoule gt
33 34
3 048 2 045 21 575 2015 323 1 517 359 331 412 364 283 3 588
2016 311 1 408 357 318 375
1 990 2 842
338 263 3 3343 193 2 142 22 522 2014 300 1 412 350 307 365
3 212 2 155 20 500 2013 316 1 159 370 323 358 356 277 3 159
347 3592012 1 847 7 364 1 925 2 208 2 743
2013 1 872 6 507 1 993 2 097 2 665
337 266 3 2533 099 2 007 21 195 2012 304 1 291 349
2 945 1 604 20 739 2011 267 1 128 373 311 347 296 210 2 932
284 3432010 1 779 6 949 2 228 2 178 3 003
2011 1 808 7 201 2 086 2 204 2 891
270 171 2 7272 815 1 330 20 282 2010 243 1 012 406
2 764 1 158 20 160 2009 221 886 430 250 329 246 137 2 500
193 2852008 1 812 6 240 2 431 2 055 3 101
2009 1 807 6 740 2 389 2 167 3 134
212 101 2 0882 646 992 19 277 2008 189 698 410
2 469 939 18 615 2007 180 765 431 226 298 217 104 2 220
249 2942006 1 592 6 122 2 123 2 148 2 830
2007 1 698 6 176 2 271 2 100 2 962
211 102 2 2362 311 890 18 016 2006 162 791 428
辦公室
設備Office
Equipment
其他 1
Others 1總計Total
年份Year
煮食Cooking
空氣調節Air
Conditioning
熱水Hot
Water
照明Lighting
冷凍Refrigeration
辦公室
設備Office
Equipment
其他 1
Others 1總計Total
lt 單位太焦耳 Unit Terajoule gt lt 單位太焦耳 Unit Terajoule gt
私人房屋組別 Private Housing Segment 其他房屋組別 3 Other Housing Segment 3表 13 Table 13 表 15 Table 15
年份Year
煮食Cooking
空氣調節Air
Conditioning
熱水Hot
Water
照明Lighting
冷凍Refrigeration
1 878 1 038 11 220 2016 576 2 288 102 495 838 1 133 684 6 117
488 8732015 1 115 3 374 987 925 1 822
2016 1 157 3 344 1 056 959 1 788
1 115 674 6 1681 811 1 002 11 036 2015 568 2 354 97
1 851 1 023 11 209 2014 589 2 428 106 506 864 1 158 699 6 351
513 8162013 1 155 2 691 1 076 958 1 679
2014 1 140 3 415 1 059 945 1 777
1 172 708 5 8101 876 1 037 10 473 2013 597 1 896 108
1 794 974 10 674 2012 605 2 162 105 561 838 1 127 669 6 068
585 8572011 1 055 2 931 1 118 942 1 763
2012 1 120 3 029 1 062 970 1 725
1 025 556 5 9321 642 817 10 269 2011 613 2 163 133
1 558 717 10 100 2010 667 2 285 178 645 926 1 029 504 6 234
676 9552009 951 2 801 1 252 963 1 863
2010 1 004 2 870 1 187 947 1 818
1 014 450 6 3331 505 644
1 414 563
9 979 2009 709 2 302 227
1 421 570 9 514 2008 744 2 216 277
其他 1
Others 1總計Total
2006 587 2 157 171
673 940 977
380 5 972
照明Lighting
2 773 1 181 1 009 1 826
2008 862 2 620 1 264 952 1 825
表 14 Table 14
總計Total
年份Year
煮食Cooking
空氣調節Air
Conditioning
熱水Hot
Water
5 733
冷凍Refrigeration
房委會資助出售單位組別 2
Housing Authority Subsidized Sale Flats Segment 2表 12 Table 12
725 886 844 364
395 6 222
700 915 909
辦公室
設備Office
Equipment
年份Year
2006
辦公室
設備Office
Equipment
其他 1
Others 1
9 615 2007 659 2 190 218
1 367 539 9 442
煮食Cooking
空氣調節Air
Conditioning
熱水Hot
Water
照明Lighting
冷凍Refrigeration
813 2 849 1 070 1 035 1 770
2007 850
3按最終用途及組別劃分
3By End-uses amp Segments
所有商業組別 All Commercial Segments
33 商業類別所有能源使用按最終用途劃分 All Energy Consumption By End-uses In Commercial Segments
12 570 - - -
-
太焦耳Terajoule
63 251
46 037
21 340 17 942 12 791 15 799
21 290 17 928 12 915 16 331 5 887 3 286
67 577
5 753
21 316 17 506
21 165 17 332
46 632
45 816
12 484 - -
3 270
12 663 14 017 5 563 3 273
118 558
121 2153 215 45 328
2012 120 970
61 790
23 397 16 213 13 190 - -
23 299 15 9602009 11 788 - -
24 185 15 711 12 195 - - - 64 300
22 929 16 624
-
2013
13 182 16 453 5 968 3 324 46 536
21 397 17 612 12 544 15 539 5 581
35 36
年份 Year 2016
年份 Year 2006
24 157
123 674
113 914
2008 113 75315 686 11 894
2007
- - - 62 015
2011
114 297
2010 116 391
2016 123 969lt 單位太焦耳 Unit Terajoule gt
圖 16 Graph 16所有商業能源最終用途 All Commercial Energy End-uses圖 15 Graph 15
總計Total
2006 111 884
表 16 Table 16
年份Year
- 59 084
食肆Restaurant
零售Retail
辦公室Office
住宿Accomodation
醫療HumanHealth
教育Education
其他商業Other
Commercial
21 163 17 343
2015
2014 122 711
0
20 000
40 000
60 000
80 000
100 000
120 000
140 000
2006 2007 2008 2009 2010 2011 2012 2013 2014 2015 2016
食肆
Restaurant零售
Retail辦公室
Office住宿
Accomodation醫療
Health教育
Education其他商業
Other Commercial
煮食
Cooking14
空氣調節
Air Conditioning 24
照明
Lighting12
熱水及冷凍
Hot water amp Refrigeration
12
辦公室設備
Office Equipment5
其他
Others33
煮食
Cooking15
空氣調節
Air Conditioning 27
照明
Lighting15
熱水及冷凍
Hot water amp Refrigeration
8
辦公室設備
Office Equipment5
其他
Others30
3按最終用途及組別劃分
3By End-uses amp Segments
食肆組別 Restaurant Segment
33 商業類別所有能源使用按最終用途劃分 All Energy Consumption By End-uses In Commercial Segments
11 788
1 743 1 543 2 352 12 195
14 166
表 19 Table 19
2010
2009
年份Year
1 7002008 24 157
22 929 20071 761 7092007 6 971
923
885
1 954 905
總計Total
511
23 299 2009
6 557
總計Total
1 829 13 190
2008 6 395
2 517 13 182
1 599 2 446 12 663
1 806 1 596 2 441
2 416 12 791
1 809
1 571
12 544
2 479 12 915
5 401 2 054 810
785
2016 1 862 1 6467 158
525
2013
2015
2014
2 055 821 532 21 397
2 054 819
21 165 1 577
6 983
6 701
1 784
689
17 343 2016
4 1835 625 -2011
6 338
7 523
5 701 4 177 7 628
5 583 4 250
5 754 4 310
7 901
1 773
5 706
5 805
1 833 1 620 525
12 528
lt 單位太焦耳 Unit Terajoule gt
零售組別 Retail Segment 表 18 Table 18
總計Total
4 115
2009
2014 21 340
其他 1
Others 1
21 163
照明Lighting
811
807 524
21 2902 081
2 085
530
2007
年份Year
4 1192006
2008
-
6 809
lt 單位太焦耳 Unit Terajoule gt lt 單位太焦耳 Unit Terajoule gt
2013
14 0173 273 4 5551 384 4 21917 506 20122012
7 779 15 5393 623 5 0341 550
1 645 4 931 6975 582 4 189 7 572
辦公室設備Office
Equipment
6 711
4 67517 612 2013
7 864
lt 單位太焦耳 Unit Terajoule gt
住宿組別 Accommodation Segment 表 20 Table 20
總計Total
空氣調節Air
Conditioning
熱水及冷凍4
Hot Water ampRefrigeration4
照明Lighting
其他 1
Others 1年份Year
-- -- -17 332
7 031
- -
2013
2016
2015 12 389 5 483
12 358 5 402
5 398
5 498
15 711 20102010 -5 7154 122
5 799
5 875
663
2011
586
657
37 38
16 4533 855 5 325
15 7993 762 5 0951 565 4 71417 942 20144 241
16 3313 890 5 2511 627 4 87217 928 20152015
2014
2016
-
-- -- -
--5 865 -15 686 2008
4 187
- -
15 960 2009 -
-
6 793
5 968
13 507 5 960
-- -- -16 624 20076 689 4 890 5 045 -
-- -- -16 213 20065 300
空氣調節Air
Conditioning
12 591
12 426
14 049 5 525
6 082 1 991
照明Lighting
辦公室設備Office
Equipment
其他 1
Others 1
2 019
2012
20112011 12 622 5 237 2 009
973
21 316 2012
24 185 201013 404 6 594 2 1181 001 1 069
辦公室組別 Office Segment表 17 Table 17
23 397 2006 7 187
1 802 1 777 12 570
2 412 12 484
1 505 2 294 11 894
1 684 1 491 2 274
995
- -
2006
年份Year
煮食Cooking
空氣調節Air
Conditioning
熱水及冷凍4
Hot Water ampRefrigeration4
照明Lighting
其他 1
Others 1
2 026 2 14914 215 584
空氣調節Air
Conditioning
5 863 1 7251 011
5 596 1 486
5 561 5 518 1 478 1 918
46 536
31 341 45 816
5 587 5 571 1 486 1 911 31 482 46 037
5 430
34 746 64 300
11 225 7 603 2 684 8 396 37 669 67 577
32 327 46 6325 402 5 516
9 672 7 207 3 092 8 255
1 527 1 860
10 154 7 586 3 156 8 659
45 328
10 572 7 766
130
- - -
-
61 790
131 538
33 790 62 015
9 860 7 321 3 087 8 231 34 751 63 251
2010
- 2009
- 2008
- - -
- - -
59 084
-
其他 1
Others 1
lt 單位太焦耳 Unit Terajoule gt
5 968 2016 1 845 32 179
5 581 2013
5 563 2012
-
-
- 2011
-
5 486
3 273
照明Lighting
辦公室設備Office
Equipment
熱水及冷凍4
Hot Water ampRefrigeration4
其他 1
Others 1
546
542
-
31 558
-
533
1 475 1 832 31 132
- 2007
5 402
2 573 6 616
10 348 7 527 2 881 7 714 33 321
39 40
2016 3 324
2015 3 2861 606
lt 單位太焦耳 Unit Terajoule gt
3 270
1 613 681 337 138 556
1 603
666 330 137
661 327 137
- -
2014
2013 1 563
2012
2011 -
1 602
- - -
-
- -
-
671 332
- -
3 215 661 327
2006 -
-
2010 -
2009 --
lt 單位太焦耳 Unit Terajoule gt
教育組別 Education Segment 表 22 Table 22
2008 -
2007 -- -
年份Year
總計Total
空氣調節Air
Conditioning
照明Lighting
辦公室設備Office
Equipment
熱水及冷凍4
Hot Water ampRefrigeration4
-
2016 1 257 303 298 2 218 1 892
5 887 2015
5 753 20142014 1 237 289 285 2 126 1 817
2015 1 261 297 292 2 176 1 862
2012 1 189 283 279 2 057 1 754
2013 1 178 284 280 2 071 1 768
2010 - - - - -
2011 - - - - -
2008 - - - - -
2009 - - - - -
20062006 - - - - -
2007 - - - - -
3按最終用途及組別劃分
3By End-uses amp Segments
醫療組別 Human Health Segment
33 商業類別所有能源使用按最終用途劃分 All Energy Consumption By End-uses In Commercial Segments
其他商業組別 Other Commercial Segments表 21 Table 21 表 23 Table 23
年份Year
空氣調節Air
Conditioning
照明Lighting
辦公室設備Office
Equipment
熱水及冷凍4
Hot Water ampRefrigeration4
其他 1
Others 1總計Total
年份Year
空氣調節Air
Conditioning
總計Total
12 106 3 537 3 198
12 381 16 826 12 915 12 043 3 489 3 158 42 881 103 693
lt 單位太焦耳 Unit Terajoule gt
41 42
101 480
2014 12 379 16 742 12 791 11 615 3 412 3 144 42 544 102 627
2016 12 330 16 306 13 182 43 223 103 881
2015
43 748 101 813
2013 12 336 16 435 12 544 11 386 3 317 3 102 42 361
2012 12 265 16 442 12 663 10 211 3 321 3 164
2011 11 894 16 339 12 484 - - - 58 877 99 594
2010 14 372 15 711 12 195 - - - 55 616 97 894
2009 12 990 15 960 11 788 - - - 55 991 96 728
2008 13 257 15 686 11 894 - - - 54 706 95 543
2007 11 681 16 624 12 570 - - - 54 176 95 051
所有商業能源最終用途 All Commercial Energy End-uses圖 17 Graph 17 圖 18 Graph 18
年份 Year 2016太焦耳Terajoule
3按最終用途及組別劃分
3By End-uses amp Segments
所有商業組別 All Commercial Segments
34 商業類別電力使用按最終用途劃分 Electricity Consumption By End-uses In Commercial Segments
年份 Year 2006
2006 12 136
表 24 Table 24
年份Year
食肆Restaurant
零售Retail
辦公室Office
住宿Accomodation
醫療HumanHealth
教育Education
其他商業Other
Commercial
總計Total
16 213 13 190 - - - 51 779 93 317
0
20 000
40 000
60 000
80 000
100 000
120 000
2006 2007 2008 2009 2010 2011 2012 2013 2014 2015 2016
食肆
Restaurant零售
Retail辦公室
Office住宿
Accomodation醫療
Health教育
Education其他商業
Other Commercial
煮食
Cooking7
空氣調節
Air Conditioning 29
照明
Lighting15
熱水及冷凍
Hot Water amp Refrigeration
8
辦公室設備
Office Equipment6
其他
Others35
煮食
Cooking6
空氣調節
Air Conditioning 33
照明
Lighting17
熱水及冷凍
Hot Water amp Refrigeration
5
辦公室設備
Office Equipment6
其他
Others33
1 527 4 381 12 106lt 單位太焦耳 Unit Terajoule gt lt 單位太焦耳 Unit Terajoule gt
43 44
2016 5 582 4 189 6 535 16 306 2016 3 855 1 645
3按最終用途及組別劃分
3By End-uses amp Segments
食肆組別 Restaurant Segment
34 商業類別電力使用按最終用途劃分 Electricity Consumption By End-uses In Commercial Segments
2013 3 623
697
1 502 4 334 12 043
2014 5 799 4 241 6 701 16 742 2014 3 762 1 565 663 1 459 4 167 11 615
2015 5 754 4 310 6 762 16 826 2015 3 890
2011 -
1 627 689
1 429 4 127 11 386
2012 5 701 4 177 6 565 16 442 2012 3 273 1 384 586 1 282 3 686 10 211
2013 5 583 4 250 6 601 16 435
2009 -
1 550 657
- - -
2010 5 875 4 122 5 715 15 711 2010 - - - - - -
2011 5 625 4 183 6 530 16 339
2007 -
- -
- - -
2008 5 865 4 115 5 706 15 686 2008 - - - - - -
2009 5 968 4 187 5 805 15 960
年份Year
空氣調節Air
Conditioning
照明Lighting
其他 1
Others 1總計Total
年份Year
- -
-
2006 6 793 5 300 4 119 16 213 2006 - - - -
2007 6 689 4 890 5 045 16 624
空氣調節Air
Conditioning
照明Lighting
辦公室設備Office
Equipment
熱水及冷凍4
Hot Water ampRefrigeration4
其他 1
Others 1
13 182
- -
總計Total
- -
- -
零售組別 Retail Segment 住宿組別 Accommodation Segment表 26 Table 26 表 28 Table 28
12 330 2016 7 158 1 862 1 646 2 517
2 479 12 915
2016 4 039 5 402 819 1 595 474lt 單位太焦耳 Unit Terajoule gt lt 單位太焦耳 Unit Terajoule gt
1 773 1 571 2 416 12 791
2015 3 998 5 483 811 1 620 469 12 381 2015 6 983
2014 3 981 5 498 807 1 625 467 12 379 2014 7 031
1 833 1 620
1 809 1 599 2 446 12 663
2013 4 048 5 398 821 1 594 475 12 336 2013 6 701 1 806 1 596 2 441 12 544
2012 3 991 5 401 810 1 595 469 12 265 2012 6 809
1 743 1 543 2 352 12 195
2011 3 870 5 237 785 1 547 454 11 894 2011 6 711 1 784 1 577 2 412 12 484
2010 4 120 6 594 1 001 1 647
11 894
2009 3 724 5 960 905 1 488 913 12 990 2009 6 338 1 684 1 491 2 274 11 788
2008 3 801 6 082 923 1 519
1 829
1 777 2 019
1 010 14 372 2010 6 557
1 700 1 505 2 294
1 802
932 13 257 2008 6 395
2 026 2 1491 241 519 12 136 2006 7 187
3 352 5 525 885 1 275 644 11 681 2007 6 971
辦公室組別 Office Segment表 25 Table 25 表 27 Table 27
年份Year
煮食Cooking
空氣調節Air
Conditioning
照明Lighting
熱水及冷凍4
Hot Water ampRefrigeration4
其他 1
Others 1總計Total
年份Year
空氣調節Air
Conditioning
照明Lighting
辦公室設備Office
Equipment
其他 1
Others 1總計Total
13 190
2007 12 570
2006 3 502 5 863 1 011
3按最終用途及組別劃分
3By End-uses amp Segments
醫療組別 Human Health Segment
34 商業類別電力使用按最終用途劃分 Electricity Consumption By End-uses In Commercial Segments
1 257 303 298 316 1 363 3 537
1 613 681 337 95 472 3 198lt 單位太焦耳 Unit Terajoule gt
45 46
3 158
3 102
-
3 164
- - - -
2012 1 602 671 332 94 465
2011 -
458 3 1442014 1 603 661 327 94
2013 1 563 661 327 92 458
2016
1 606 666 330 94 4622015
2009 - - - - - -
2010 - - - - - -
2008 - - - - - -
2007 -
2006 - - - - - -
- - - - -
5 596 1 486 1 807 28 904 43 223lt 單位太焦耳 Unit Terajoule gt lt 單位太焦耳 Unit Terajoule gt
其他 1
Others 1總計Total
年份Year
空氣調節Air
Conditioning
照明Lighting
辦公室設備Office
Equipment
熱水及冷凍4
Hot Water ampRefrigeration4
1 335 3 489
2016 5 4302016
1 261 297 292 305
教育組別 Education Segment 表 30 Table 30
1 478 1 847 28 140 42 544
2015 2015 5 587 5 571 1 486 1 850 28 388 42 881
2013 5 402 5 486 1 475 1 780 28 218 42 361
2014 1 237 289 285 301 1 301 3 412 2014 5 561
2013 1 178 284 280 295 1 280 3 317
5 518
2 684 3 408 33 957 58 877
2012 1 189 283 279 294 1 275 3 321 2012 5 402 5 516 1 527 1 810 29 492 43 748
2010 10 154 7 586 3 156 3 886 30 835 55 616
2011 - - - - - - 2011 11 225
2010 - - - - - -
7 603
31 079 54 706
2009 - - - - - - 2009 9 860 7 321 3 087 3 676 32 047 55 991
7 207 3 0922008 - - - - - - 2008 9 672
2007 10 348 7 527 2 881 2 863
3 657
30 558 54 1762007 - - - - - -
- - 2006 10 572 7 766 2 573 2 069 28 800 51 779
其他商業組別 Other Commercial Segments表 29 Table 29 表 31 Table 31
年份Year
空氣調節Air
Conditioning
照明Lighting
辦公室設備Office
Equipment
熱水及冷凍4
Hot Water ampRefrigeration4
其他 1
Others 1總計Total
年份Year
空氣調節Air
Conditioning
照明Lighting
辦公室設備Office
Equipment
熱水及冷凍4
Hot Water ampRefrigeration4
其他 1
Others 1總計Total
2006 - - - -
3按最終用途及組別劃分
3By End-uses amp Segments
所有工業組別 All Industrial Segments
35 工業類別所有能源使用按最終用途劃分 All Energy Consumption By End-uses In Industrial Segments
圖 20 Graph 20
年份 Year 2016
年份 Year 2006
所有工業能源最終用途 All Industrial Energy End-uses
695 5 188 2 770 3 344 2 585 14 5832013
5 166 2 659 3 377 2 732 14 7232012 789
494 5 549 3 010 3 395 2 404 14 8532015
5 334 2 967 3 337 2 501 14 7182014 579
47 48
5 080 2 906 3 312 2 292 13 992lt 單位太焦耳 Unit Terajoule gt
2016 402
864 4 938 2 450 3 504 2 976 14 7322011
4 135 2 718 3 888 4 095 16 0532010 1 217
1 373 3 829 2 695 4 036 4 196 16 1292009
4 009 2 804 4 255 4 454 17 3322008 1 809
3 086 3 815 4 788 17 6452007 2 019 3 935
4 209 4 985 18 9342006 2 249 4 629 2 863
圖 19 Graph 19
太焦耳
Terajoule
其他工業 7
OtherIndustries 7
總計Total
年份Year
紡織及服裝製品Textile amp
Wearing Apparel
非製造業 6
Non-manufacturing 6
食品及飲品Food amp
Beverage
金屬及機械Metal amp
Machinery
表 32 Table 32
0
2 000
4 000
6 000
8 000
10 000
12 000
14 000
16 000
18 000
20 000
2006 2007 2008 2009 2010 2011 2012 2013 2014 2015 2016
紡織及服裝製品
Textile ampWearing Apparel
非製造業
Non‐manufacturing
食品及飲品
Food ampBeverage
金屬及機械
Metal ampMachinery
其他工業
OtherIndustries
工業生產設備
Industrial ProcessEquipment
54
照明
Lighting6
空氣調節
Air Conditioning17
其他
Others23
工業生產設備
Industrial ProcessEquipment
53
照明
Lighting7
空氣調節
Air Conditioning22
其他
Others18
3按最終用途及組別劃分
3By End-uses amp Segments
紡織及服裝製品組別 Textile amp Wearing Apparel Segment
35 工業類別所有能源使用按最終用途劃分 All Energy Consumption By End-uses In Industrial Segments
食品及飲品組別 Food amp Beverage Segment表 33 Table 33 表 35 Table 35
年份Year
工業生產設備 5
Industrial ProcessEquipment 5
照明Lighting
空氣調節Air
Conditioning
其他1
Others1總計Total
年份Year
工業生產設備 5
Industrial ProcessEquipment 5
照明Lighting
空氣調節Air
Conditioning
其他1
Others1總計Total
466 455 2 863
2007 880 194 685 260 3 0862 019 2007 1 922 159 509 497
2006 997 210 757 284 2 249 2006 1 797 146
430 425 2 804
2009 637 123 446 167 1 373 2009 1 775 125 399 397 2 695
2008 834 163 592 221 1 809 2008 1 815 134
2010 574 106 391 145 2 718
2011 446 68 256 94 864 2011 1 743 95
1 217 2010 1 793 125 400 399
303 310 2 450
311 318 2 659
2013 367 53 203 74 2 770 695 2013 2 047 97 309 317
2012 416 59 230 83 789 2012 1 934 97
340 344 2 967
2015 262 36 145 51 494 2015 2 218 106 342 345 3 010
2014 303 44 171 61 579 2014 2 177 106
2016 210 31 118 43 2 906lt 單位太焦耳 Unit Terajoule gt lt 單位太焦耳 Unit Terajoule gt
非製造業組別 6 Non-manufacturing Segment6金屬及機械組別 Metal amp Machinery Segment表 34 Table 34 表 36 Table 36
402 2016 2 117 106 337 346
年份Year
工業生產設備 5
Industrial ProcessEquipment 5
照明Lighting
空氣調節Air
Conditioning
其他1
Others1總計Total
年份Year
工業生產設備 5
Industrial ProcessEquipment 5
照明Lighting
空氣調節Air
Conditioning
其他1
Others1總計Total
2006 1 794 114 925 1 376 4 2092006 2 013 588 992 1 035 4 629
2007 1 626 103 837 1 249 3 8152007 1 711 500 850 873 3 935
2008 1 819 105 857 1 475 4 2552008 1 823 488 810 888 4 009
2009 1 729 97 791 1 419 4 0362009 1 764 460 762 843 3 829
2010 1 665 94 761 1 367 3 8882010 1 907 496 819 913 4 135
2011 1 513 65 565 1 360 3 5042011 2 143 509 940 1 346 4 938
2012 1 460 63 544 1 309 3 3772012 2 272 540 985 1 370 5 166
2013 1 452 62 534 1 296 3 3442013 2 246 536 969 1 437 5 188
2014 1 445 62 541 1 290 3 3372014 2 295 547 1 003 1 490 5 334
2015 1 470 63 551 1 312 3 3952015 2 401 571 1 041 1 536 5 549
2016 1 440 61 529 1 282 3 3122016 2 179 522 949 1 430 5 080lt 單位太焦耳 Unit Terajoule gt lt 單位太焦耳 Unit Terajoule gt
49 50
2015 346 4 024 1 349 1 217 2 307 9 242
1 226 1 192 2 476 9 144
3 880 1 344 1 195 2 402 9 2302014 409
14 015
2007 1 682 3 032 2 012 1 882 4 496 13 104
1 232 1 208 2 616 9 356
12 182
1 200 1 255 2 844 9 5302011 619 3 613
2009 1 089 2 799 1 579 1 779 3 896 11 143
2010
2012 553 3 747
2013 489 3 761
951 3 023 1 585 1 714 3 808 11 082
2007 3 295 277 980 236 4 788
1 701 1 926 4 140
1 842 2 080 4 670
2008 1 443 2 971
2006 1 851 3 572
2008 3 051 257 915 231 4 454
35 工業類別所有能源使用按最終用途劃分 All Energy Consumption By End-uses In Industrial Segments
所有工業組別 All Industrial Segments
36 工業類別電力使用按最終用途劃分 Electricity Consumption By End-uses In Industrial Segments
3按最終用途及組別劃分
3By End-uses amp Segments
2006 3 415 290 1 029 251 4 985
圖 21 Graph 21
年份
Year
工業生產設備 5
Industrial ProcessEquipment 5
照明Lighting
空氣調節Air
Conditioning
其他1
Others1總計Total
太焦耳
Terajoule
表 37 Table 37其他工業組別 7 Other Industrial Segments 7
2010 2 800 237 844 213 4 095
2009 2 865 242 863 225 4 196
2012 1 872 166 568 125 2 732
2011 2 030 180 627 140 2 976
2014 1 711 154 520 116 2 501
2013 1 781 158 528 119 2 585
2016 1 568 144 471 110 2 292
2015 1 635 149 502 118 2 404
表 38 Table 38
年份Year
紡織及服裝製品Textile amp
Wearing Apparel
非製造業 6
Non-manufacturing 6
食品及飲品Food amp
Beverage
金屬及機械Metal amp
Machinery
其他工業 7
OtherIndustries 7
總計Total
lt 單位太焦耳 Unit Terajoule gt
2 206 8 709
51 52
lt 單位太焦耳 Unit Terajoule gt
2016 286 3 699 1 339 1 179
0
2 000
4 000
6 000
8 000
10 000
12 000
14 000
16 000
2006 2007 2008 2009 2010 2011 2012 2013 2014 2015 2016
紡織及服裝製品
Textile ampWearing Apparel
非製造業
Non‐manufacturing
食品及飲品
Food ampBeverage
金屬及機械
Metal ampMachinery
其他工業
OtherIndustries
圖 22 Graph 22 紡織及服裝製品組別 Textile amp Wearing Apparel Segment 表 39 Table 39
年份 Year 2016
所有工業能源最終用途 All Industrial Energy End-uses
36 工業類別電力使用按最終用途劃分 Electricity Consumption By End-uses In Industrial Segments
3按最終用途及組別劃分
3By End-uses amp Segments
年份 Year 2006
53
年份Year
工業生產設備 5
Industrial ProcessEquipment 5
照明Lighting
空氣調節Air
Conditioning
其他1
Others1總計Total
2006 604 210 757 279 1 851
2007 547 194 685 255 1 682
1 443
2009 356 123 446 164 1 089
2008 472 163 592 217
951
2011 203 68 256 92 619
2010 312 106 391 142
553
2013 162 53 203 72 489
2012 182 59 230 81
409
2015 114 36 145 50 346
2014 134 44 171 60
286lt 單位太焦耳 Unit Terajoule gt
非製造業組別 6 Non-manufacturing Segment 6 表 40 Table 40
年份Year
工業生產設備 5
Industrial ProcessEquipment 5
照明Lighting
空氣調節Air
Conditioning
其他1
Others1總計Total
2016 94 31 118 42
3 572
2007 893 500 850 788 3 032
2006 1 057 588 992 934
2 971
2009 836 460 762 742 2 799
2008 886 488 810 787
3 023
2011 949 509 940 1 215 3 613
2010 904 496 819 804
3 747
2013 962 536 969 1 295 3 761
2012 993 540 985 1 230
3 880
2015 1 028 571 1 041 1 384 4 024
2014 986 547 1 003 1 345
3 699lt 單位太焦耳 Unit Terajoule gt
54
2016 936 522 949 1 292
工業生產設備
Industrial ProcessEquipment
41 照明
Lighting10
空氣調節
Air Conditioning27
其他
Others22
工業生產設備
Industrial ProcessEquipment
46
照明
Lighting9
空氣調節
Air Conditioning30
其他
Others15
其他工業組別 7 Other Industrial Segments 7表 41 Table 41 表 43 Table 43
年份Year
工業生產設備 5
Industrial ProcessEquipment 5
照明Lighting
空氣調節Air
Conditioning
其他1
Others1總計Total
年份Year
工業生產設備 5
Industrial ProcessEquipment 5
照明Lighting
空氣調節Air
Conditioning
其他1
Others1總計Total
1 029 216 4 670
2007 883 159 509 462 4 4962 012 2007 3 030 277 980 208
2006 808 146 466 423 1 842 2006 3 135 290
915 191 4 140
2009 693 125 399 363 1 579 2009 2 610 242 863 181 3 896
2008 746 134 430 390 1 701 2008 2 777 257
2010 695 125 400 365 3 808
2011 526 95 303 277 1 200 2011 1 904 180
1 585 2010 2 548 237 844 178
627 133 2 844
568 123 2 616
2013 536 97 309 284 2 4761 226 2013 1 674 158 528 116
2012 540 97 311 284 1 232 2012
金屬及機械組別 Metal amp Machinery Segment 表 42 Table 42
1 339 2016 1 484 144 471 108
1 759 166
520 114
2015 592 106 342 309 1 349 2015 1 544 149 502 112
2014
2016 585 106 337 310
1 614 154
2 206lt 單位太焦耳 Unit Terajoule gt lt 單位太焦耳 Unit Terajoule gt
2 402
2 307
590 106 340 308 1 344 2014
2006 810 114 925 231 2 080
年份Year
工業生產設備 5
Industrial ProcessEquipment 5
照明Lighting
空氣調節Air
Conditioning
其他1
Others1總計Total
2008 751 105 857 214 1 926
2007 733 103 837 209 1 882
2010 668 94 761 190 1 714
2009 694 97 791 198 1 779
2012 466 63 544 136 1 208
2011 484 65 565 141 1 255
2014 459 62 541 134 1 195
2013 461 62 534 134 1 192
3按最終用途及組別劃分
3By End-uses amp Segments
食品及飲品組別 Food amp Beverage Segment
36 工業類別電力使用按最終用途劃分 Electricity Consumption By End-uses In Industrial Segments
55 56
lt 單位太焦耳 Unit Terajoule gt
2016 456 61 529 133 1 179
2015 467 63 551 136 1 217
表 45 Table 45
太焦耳Terajoule
年份Year
貨車Goods Vehicle
其他
Others 總計Total
貨運組別 Freight Segments圖 23 Graph 23
3按最終用途及組別劃分
3By End-uses amp Segments
所有運輸組別 All Transport Segments
37 運輸類別所有能源使用按最終用途劃分 All Energy Consumption By End-uses In Transport Segments
32 551 6 601 39 152 0
2007
2006
31 771 6 411 38 182 0
0
2009 28 501 5 424 33 925 0
2008 30 438 5 929 36 367
0
2011 28 010 4 134 32 144 0
2010 28 585 4 744 33 329
0
2013 25 534 3 305 28 839 0
2012 26 941 3 826 30 767
0
2015
0
lt 單位太焦耳 Unit Terajoule gt
2014 25 009 3 264 28 273
24 782 3 269 28 051 0
2016
總計Total
年份Year
貨運Freight
客運Passenger
總計Total
年份Year
巴士Bus
24 721 2 961 27 682
客運組別 Passenger Segments表 44 Table 44 表 46 Table 46
41 57 251 59 96 404
的士Taxi
汽車Car
電單車Motorcycle
鐵路Rail
其他
Others
14 102 17 118 463 2 495 3 973 57 983
4 017 57 251
2007 38 182 40 57 983 60 96 165 2007 19 832
2006 20 301 13 797 16 267 426 2 4442006 39 152
56 718
3 965 58 137
2009 33 925 37 56 718 63 90 643 2009 19 150
2008 18 971 15 142 17 059 480 2 5202008 36 367 38 58 137 62 94 504
37 57 560 63 90 889
13 131 17 449 465 2 523 4 000
13 593 18 879 424 2 609 4 213 58 630
4 124 57 560
2011 32 144 35 58 630 65 90 774 2011 18 911
2010 18 842 13 373 18 247 436 2 5402010 33 329
61 359
4 354 59 656
2013 28 839 32 61 359 68 90 198 2013 19 144
2012 19 128 13 469 19 561 423 2 7222012 30 767 34 59 656 66 90 423
31 61 725 69 89 999
13 319 21 158 406 2 796 4 536
13 039 21 764 448 2 972 4 631 61 195
4 547 61 725
2015 28 051 31 61 195 69 89 245 2015 18 341
2014 18 659 14 133 21 085 426 2 8752014 28 273
57 58
4 636 62 136lt 單位太焦耳 Unit Terajoule gt lt 單位太焦耳 Unit Terajoule gt
此項之最終用途包括船隻及香港內部的航空運輸能源的使用等 End-uses under this heading include marine and internal air transportation energy uses etc
2016 18 918 12 288 22 881 463 2 9512016 27 682 31 62 136 69 89 819
0
10 000
20 000
30 000
40 000
50 000
60 000
70 000
80 000
90 000
100 000
2006 2007 2008 2009 2010 2011 2012 2013 2014 2015 2016
貨運
Freight客運
Passenger
4按燃料及類別劃分
4By Fuels amp Sectors
41 所有能源使用按燃料劃分
All Energy Consumption By Fuels圖 24 Graph 24 圖 25 Graph 25
3按最終用途及組別劃分
3By End-uses amp Segments
所有運輸能源最終用途 All Transport Energy End-uses
37 運輸類別所有能源使用按最終用途劃分 All Energy Consumption By End-uses In Transport Segments
年份 Year 2016 太焦耳Terajoule
表 47 Table 47
年份 Year 2006 年份Year
煤氣及石油氣Town Gas amp
Liquefied Petroleum Gas
油及煤產品Oil amp CoalProducts
電力Electricity
總計Total
2006 48 482 17 87 518 31 145 204 52 281 204 100
2007 48 721 17 86 647 31 147 072 52 282 440 100
52 281 438 100
2009 47 239 17 82 194 29 149 366 54
2008 49 732 18 84 361 30 147 345
278 799 100
2010 49 084 17 81 786 29 150 859 54 281 729 100
2011 49 568 18 81 716 29 151 606 54 282 890 100
54 286 048 100
2013 49 723 17 81 306 29 153 362 54
2012 49 616 17 81 352 28 155 079
284 391 100
2014 50 844 18 80 347 28 158 147 55 289 338 100
2015 48 954 17 80 757 28 158 275 55 287 986 100
59 60
55 289 219 100
lt 單位太焦耳 Unit Terajoule gt
「總熱值」是使用於計算各種氣體燃料的熱含量 Gross caloricfic values are used in calculating the respective heat contents of the gaseous products
2016 49 374 17 81 184 28 158 662
巴士
Bus 21
的士
Taxi14
汽車及電單車
Car amp Motorcycle26
貨車
Goods Vehicle28
鐵路及其他
Rail amp Others12
巴士
Bus 21
的士
Taxi14
汽車及電單車
Car amp Motorcycle17
貨車
Goods Vehicle34
鐵路及其他
Rail amp Others14
0
50 000
100 000
150 000
200 000
250 000
300 000
2006 2007 2008 2009 2010 2011 2012 2013 2014 2015 2016
煤氣及石油氣Town Gas amp Liquefied Petroleum Gas
油及煤產品
Oil amp Coal Products 電力
Electricity
太焦耳Terajoule
太焦耳Terajoule
表 48 Table 48 表 49 Table 49
4按燃料及類別劃分
4By Fuels amp Sectors
43 商業類別按燃料劃分
Commercial Sector By Fuels42 住宅類別按燃料劃分
Residential Sector By Fuels 圖 26 Graph 26 圖 27 Graph 27
煤氣及石油氣Town Gas amp
Liquefied Petroleum Gas
油及煤產品Oil amp CoalProducts
電力Electricity
總計Total
2006 18 476 34 79 0 35 428
年份Year
煤氣及石油氣Town Gas amp
Liquefied Petroleum Gas
油及煤產品Oil amp CoalProducts
電力Electricity
總計Total
年份Year
4 936 4 93 317 83 111 884 10066 53 982 100 2006 13 631 12
83 113 914 10067 54 717 100 2007 13 888 12
2008 18 708 33 41 0 37 100
4 975 4 95 0512007 18 238 33 57 0 36 422
4 739 4 95 543 84 113 753 10066 55 849 100 2008 13 471 12
85 114 297 10068 57 731 100 2009 12 815 11
2010 19 038 33 13 0 39 344
4 753 4 96 7282009 18 736 32 23 0 38 972
4 526 4 97 894 84 116 391 10067 58 396 100 2010 13 971 12
84 118 558 10068 58 826 100 2011 14 161 12
2012 18 736 31 8 0 41 189
4 803 4 99 5942011 18 946 32 8 0 39 872
4 769 4 101 813 84 120 970 10069 59 932 100 2012 14 388 12
84 121 215 10068 58 394 100 2013 14 709 12
2014 18 487 30 8 0 43 415
5 026 4 101 4802013 18 446 32 8 0 39 941
5 156 4 102 627 84 122 711 10070 61 910 100 2014 14 928 12
84 123 674 10070 60 214 100 2015 14 795 12
2016 18 311 30 8 0 43 120
5 186 4 103 6932015 17 838 30 8 0 42 368
5 164 4 103 881 84 123 969 10070 61 439 100 2016 14 924 12lt 單位太焦耳 Unit Terajoule gt lt 單位太焦耳 Unit Terajoule gt
「總熱值」是使用於計算各種氣體燃料的熱含量 Gross caloricfic values are used in calculating the respective heat contents of the gaseous products
「總熱值」是使用於計算各種氣體燃料的熱含量 Gross caloricfic values are used in calculating the respective heat contents of the gaseous products
61 62
0
10 000
20 000
30 000
40 000
50 000
60 000
70 000
2006 2007 2008 2009 2010 2011 2012 2013 2014 2015 2016
煤氣及石油氣Town Gas amp Liquefied Petroleum Gas
油及煤產品
Oil amp Coal Products 電力
Electricity
0
20 000
40 000
60 000
80 000
100 000
120 000
140 000
2006 2007 2008 2009 2010 2011 2012 2013 2014 2015 2016煤氣及石油氣Town Gas amp Liquefied Petroleum Gas
油及煤產品
Oil amp Coal Products 電力
Electricity
太焦耳Terajoule
太焦耳Terajoule
表 50 Table 50 表 51 Table 51
4按燃料及類別劃分
4By Fuels amp Sectors
45 運輸類別按燃料劃分
Transport Sector By Fuels44 工業類別按燃料劃分
Industrial Sector By Fuels 圖 28 Graph 28 圖 29 Graph 29
煤氣及石油氣Town Gas amp
Liquefied Petroleum Gas
油及煤產品Oil amp CoalProducts
電力Electricity
總計Total
2006 926 5 3 994 21 14 015
年份Year
煤氣及石油氣Town Gas amp
Liquefied Petroleum Gas
油及煤產品Oil amp CoalProducts
電力Electricity
總計Total
年份Year
78 510 81 2 444 3 96 404 10074 18 934 100 2006 15 450 16
3 96 165 10074 17 645 100 2007 15 678 16
2008 927 5 4 223 24 12 182
77 992 81 2 4952007 917 5 3 623 21 13 104
75 358 80 2 520 3 94 504 10070 17 332 100 2008 16 627 18
3 90 643 10069 16 129 100 2009 14 765 16
2010 937 6 4 035 25 11 082
73 355 81 2 5232009 923 6 4 063 25 11 143
73 213 81 2 540 3 90 889 10069 16 053 100 2010 15 137 17
3 90 774 10065 14 732 100 2011 15 506 17
2012 1 108 8 4 259 29 9 356
72 659 80 2 6092011 956 6 4 246 29 9 530
72 317 80 2 722 3 90 423 10064 14 723 100 2012 15 384 17
3 90 198 10063 14 583 100 2013 15 348 17
2014 1 244 8 4 244 29 9 230
72 054 80 2 7962013 1 220 8 4 218 29 9 144
70 939 79 2 875 3 89 999 10063 14 718 100 2014 16 185 18
3 89 245 10062 14 853 100 2015 15 048 17
2016 1 171 8 4 112 29 8 709
71 225 80 2 9722015 1 272 9 4 339 29 9 242
71 900 80 2 951 3 89 819 10062 13 992 100 2016 14 967 17lt 單位太焦耳 Unit Terajoule gt lt 單位太焦耳 Unit Terajoule gt
「總熱值」是使用於計算各種氣體燃料的熱含量 Gross caloricfic values are used in calculating the respective heat contents of the gaseous products
「總熱值」是使用於計算各種氣體燃料的熱含量 Gross caloricfic values are used in calculating the respective heat contents of the gaseous products
63 64
0
2 000
4 000
6 000
8 000
10 000
12 000
14 000
16 000
18 000
20 000
2006 2007 2008 2009 2010 2011 2012 2013 2014 2015 2016煤氣及石油氣Town Gas amp Liquefied Petroleum Gas
油及煤產品
Oil amp Coal Products電力
Electricity
0
10 000
20 000
30 000
40 000
50 000
60 000
70 000
80 000
90 000
100 000
2006 2007 2008 2009 2010 2011 2012 2013 2014 2015 2016煤氣及石油氣Town Gas amp Liquefied Petroleum Gas
油及煤產品
Oil amp Coal Products電力
Electricity
47 890 281 204
2007
20 301 13 797 16 267 426
2 506 10 158 49 197 282 440 14 102
46 5022006
19 832
16 465
17 071
5按最終用途及燃料劃分
5By End-uses amp Fuels
51 所有能源使用按最終用途劃分
All Energy Consumption By End-uses
2 454 10 413
15 142 17 059 480
2 529 9 228
7 918 31 836 12 776 32 551 21 608
51 487 278 799 13 131
17 118 463
17 449 465
2008
8 672 52 019 281 729
19 150
2 527 9 680 50 117 281 438
2009
18 971
8 496
9 121
9 244 19 199
2011
18 842 13 373 18 247 436
2 609 8 245 56 161 282 890 13 593 18 879 31 989 14 187 28 010
2012
2013
19 128
2 542
2 722 8 077 58 650 286 048 13 469 19 561 423
424
2010
18 911
19 144
9 213
8 536
8 319
8 199
19 563
19 314
19 662
19 655 44 243 14 181
14 197
13 708
2 796 7 739 58 100 284 391 13 319 21 158 406
2 875 7 705 58 273 289 338
25 534
2015
18 659 14 133 21 085 426
2 972 7 792 58 218 287 986 13 039 21 764 448
2014 25 009
24 782
8 607
8 717
19 609
19 774
48 746
48 466 18 341
2 951 7 474 59 374 289 219
51 所有能源使用按最終用途劃分 All Energy Consumption By End-uses 圖 30 Graph 30
18 918 12 288 22 881 4632016lt 單位太焦耳 Unit Terajoule gt
14 227 24 721 8 562 17 798 47 938 31 785 19 839
年份 Year 2016 年份 Year 2006
65 66
31 989
31 837
31 402
17 734
17 173
17 413
17 117
17 352
17 927
18 177
18 565
14 111 26 941
45 298
43 392
44 117
45 511
44 914
45 861
20 372
18 965
32 885
34 023
33 302
33 379
13 172
13 788
13 824
13 936
31 771
30 438
28 501
28 585
31 772
表 52 Table 52
年份Year
空氣調節Air
Conditioning
工業生產設備5
IndustrialProcessEquipment5
照明Lighting
冷凍Refrigeration
巴士Bus
的士Taxi
汽車Car
電單車Motorcycle
鐵路Rail
船隻Marine
其他1
Others1總計Total
貨車GoodsVehicle
煮食Cooking
熱水Hot Water
空氣調節
AirConditioning
17
煮食
Cooking11
工業生產設備
Industrial ProcessEquipment
6照明
Lighting7
冷凍
Refrigeration3
熱水
Hot Water 5
貨車
GoodsVehicle
9
巴士
Bus 6
的士
Taxi4
汽車及電單車
Car amp Motorcycle8
鐵路
Rail1
船隻
Marine 3
其他
Others20
空氣調節
AirConditioning
17
煮食
Cooking11
工業生產設備
Industrial ProcessEquipment
6照明
Lighting8
冷凍
Refrigeration3
熱水
Hot Water 4貨車
GoodsVehicle12
巴士
Bus 7
的士
Taxi5
汽車及電單車
Car amp Motorcycle6
鐵路
Rail1
船隻
Marine 4
其他
Others17
2006 46 502 21 608 7 918
5按最終用途及燃料劃分
5By End-uses amp Fuels
52 電力使用按最終用途劃分
Electricity Consumption By End-uses 表 53 Table 53
4 191 11 105 2 444 33 317 145 204
年份Year
空氣調節Air Conditioning
照明Lighting
冷凍Refrigeration
熱水Hot Water
辦公室設備Office Equipment
鐵路Rail
工業生產設備5
IndustrialProcessEquipment5
其他1
Others1總計Total
煮食Cooking
2007 45 298 20 372 8 496
5 373 11 246 2 520 35 477 147 345
4 809 11 171 2 495 34 776 147 072
2010 45 511 19 563 9 213
2009 44 117 19 199 9 244
2008 43 392 18 965 9 121
11 0612012 45 861 19 662 8 319
2011 44 914 19 314 8 536 9 201
9 131
10 738
4 715 13 200 2 722 40 408 155 079
4 945 12 615 2 609 38 732 151 606
11 412
11 3312014 48 746 19 609 8 607
2013 44 243 19 655 8 199 9 280
9 415 4 854 13 344 2 875 39 367 158 147
4 904 13 407 2 796 39 466 153 362
2016 47 938 19 839 8 562
2015 48 466 19 774 8 717 11 344 9 553
13 513 2 951 40 363 158 662 11 528 9 044
4 624 13 212 2 972 39 615 158 275
35 815
67 68
150 859
36 644 149 366
9 048
9 722
10 320
9 926
lt 單位太焦耳 Unit Terajoule gt
52 電力使用按最終用途劃分 Electricity Consumption By End-uses 圖 31 Graph 31
年份 Year 2016 年份 Year 2006
4 923
10 016
9 073
9 934
10 929
10 959
11 430 5 015 11 758 2 540
5 274 11 480 2 523
空氣調節Air
Conditioning 30
照明Lighting
13
冷凍Refrigeration
5
工業生產設備Industrial Process
Equipment6
煮食Cooking
7
熱水Hot Water
3辦公室設備
Office Equipment9
鐵路Rail2
其他Others25
空氣調節Air
Conditioning 32
照明Lighting
15
冷凍Refrigeration
5
工業生產設備Industrial Process
Equipment6
煮食Cooking
6
熱水Hot Water
3辦公室設備
Office Equipment8
鐵路Rail2
其他Others23
年份Year
貨車Goods Vehicle
巴士Bus
的士Taxi
5按最終用途及燃料劃分
5By End-uses amp Fuels
53 油及煤產品使用按最終用途劃分
Oil amp Coal Products Consumption By End-uses 表 54 Table 54
汽車Car
電單車Motorcycle
工業生產設備5
Industrial ProcessEquipment5
船隻Marine
其他1
Others1總計Total
87 518
2007 31 770 18 254 2 17 117 463 6 448 10 158 2 434 86 647
2006 32 551 18 647 2 16 266 426 6 508 10 413 2 705
84 361
2009 28 501 17 514 2 17 448 465 6 341 9 228 2 695 82 194
2008 30 438 17 485 2 17 059 480 6 503 9 680 2 713
81 786
2011 28 010 16 997 1 18 879 424 6 926 8 245 2 234 81 716
2010 28 585 17 077 1 18 247 436 6 423 8 672 2 346
81 352
2013 25 534 17 114 1 21 158 406 7 386 7 739 1 969 81 306
2012 26 941 17 212 1 19 560 423 7 074 8 077 2 064
80 347
2015 24 782 16 331 1 21 764 448
7 553 7 474 1 854 81 184
2014 25 009 16 607 1 21 085 426 7 458 7 705 2 056
lt 單位太焦耳 Unit Terajoule gt
53 油及煤產品使用按最終用途劃分
Oil amp Coal Products Consumption By End-uses 圖 32 Graph 32
7 688 7 792 1 953 80 757
2016 24 721 16 239 lt1 22 881 463
年份 Year 2016 年份 Year 2006
69 70
貨車GoodsVehicle31
巴士及的士Bus amp Taxi
20
汽車及電單車Car amp Motorcycle
29
工業生產設備Industrial Process
Equipment9
船隻Marine
9其他
Others2
貨車GoodsVehicle37
巴士及的士Bus amp Taxi
21
汽車及電單車Car amp Motorcycle
19
工業生產設備Industrial Process
Equipment8
船隻Marine
12其他
Others3
年份Year
煮食Cooking
熱水Hot Water
運輸Transport
其他1
Others1總計Total
5按最終用途及燃料劃分
5By End-uses amp Fuels
54 煤氣及石油氣使用按最終用途劃分
Town Gas amp Liquefied Petroleum Gas Consumption By End-uses 表 55 Table 55
2007 22 021 8 363 15 678 2 659 48 721
2006 21 741 8 585 15 450 2 706 48 482
2009 21 390 8 550 14 765 2 534 47 239
2008 22 220 8 415 16 627 2 472 49 732
2011 20 749 9 242 15 506 4 072 49 568
2010 21 244 8 921 15 137 3 782 49 084
2013 20 222 9 277 15 348 4 876 49 723
2012 20 330 9 396 15 384 4 506 49 616
2015 19 767 9 085 15 048 5 054 48 954
2014 20 194 9 342 16 185 5 123 50 844
lt 單位太焦耳 Unit Terajoule gt
54 煤氣及石油氣使用按最終用途劃分 Town Gas amp Liquefied Petroleum Gas Consumption By End-uses 圖 33 Graph 33
年份 Year 2016 年份 Year 2006
2016 19 990 9 304 14 967 5 113 49 374
「總熱值」是使用於計算各種氣體燃料的熱含量 Gross caloricfic values are used in calculating the respective heat contents of the gaseous products
71 72
煮食Cooking
41
熱水Hot Water
19
運輸Transport
30
其他Others10
煮食Cooking
45
熱水Hot Water
18運輸
Transport32
其他Others
5
6 根據已更新的可再生能源數據相關的2010年至2011年能源最終用途數據已在
2013年版中作出修訂[2013年版修訂]The energy end-use data from 2010 to 2011 were revised in the 2013 Edition basedon the latest update of the renewable energy data (Revised in 2013 Edition)
3 根據運輸能源消耗調查所得的數據有關2008年至2012年的能源最終用途數據已
在2015年版中作出修訂[2015年版修訂]The energy end-use data from year 2008 to 2012 were revised in the 2015 Editionbased on the findings of energy consumption survey on the Transport Sector(Revised in 2015 Edition)
4 自2014年版起新的「住宿」「醫療」和「教育」組別已由「其他商業」組別
分拆出來「其他商業」組別因而相應地縮小[2014年版修訂]The Accommodation Human Health and Education Segments weresegregated from the Other Commercial Segment as new segments in the 2014Edition Hence the size of the Other Commercial Segment is accordingly reduced(Revised in 2014 Edition)
5 自2014年版起燃料的熱含量均以「總熱值」計算因而自2002年後的能源數據
均已採用「總熱值」作出計算[2014年版修訂]Since the 2014 Edition Gross Calorific Values are used for calculating the heatcontents of fuels Gross Calorific Values are hence used in computing energy datafrom 2002 onwards (Revised in 2014 Edition)
1 由於資料所限能源數據不能再分拆成其他最終用途數據「其他」的最終用途包
括沒有被列在表上的最終用途
2 自2013年後「空氣調節」「冷凍」「工業生產設備」及「熱水」的能源最終
用途數據已採用「氣溫因素」作出修訂[2017年版修訂]The energy end-use data of Air Conditioning Refrigeration IndustrialProcessEquipment and Hot Water are revised by Temperature Factor fromyear 2013 onwards (Revised in 2017 Edition)
Due to data limitations energy data could not further be broken down into other end-uses The ldquoOthersrdquo end-use includes the end-uses not elsewhere listed in the table
2 「房委會資助出售單位」組別前稱為「居屋計劃」組別
1 根據零售組別能源消耗調查所得的數據有關2011年至2014年的能源最終用途數
據已在2017年版中作出修訂[2017年版修訂]The energy end-use data from year 2011 to 2014 were revised in the 2017 Editionbased on the findings of energy consumption survey on the Retail Segment(Revised in 2017 Edition)
6Notes 7Chronology of Major Revisions7主要修訂年表6註釋
3 「其他房屋」組別包括別墅平房及類似屋宇
The ldquoOther Housingrdquo Segment includes villas bungalows and the like
4 「熱水及冷凍」的最終用途包括鍋爐器材及其他生產加熱和冷凍的設備
The ldquo Non-manufacturing rdquo Segment includes construction and other miscellaneousnon-manufacturing industrial activities
The ldquoHousing Authority Subsidized Sale Flatsrdquo Segment was previously called ldquoHomeOwnershiprdquo Segment
The ldquo Hot Water amp Refrigeration rdquo end-use includes boiling equipments and otherprocess heating and cooling facilities
「工業生產設備」的最終用途包括鍋爐設備及其他生產加熱和冷凍設備的使用
The ldquoOther Industrialrdquo Segment includes electronics paper printing plastic and othermiscellaneous industrial activities
73
The ldquo GDP in chained dollars rdquo were revised based on latest data published by theCensus and Statisics Department
8 ldquo本地生產總值環比物量計算rdquo己根據政府統計處最新數據作出修訂
74
7 「其他工業」組別包括電子紙張印刷塑膠及其他雜項工業活動
The ldquo Industrial ProcessEquipment rdquo end-use includes boiler plants and other processheating and cooling facilities
6 「非製造業」組別包括建造及其他非製造業之雜項工業活動
5
7主要修訂年表
13 自2010年起「電力」包括燃煤天然氣風能及太陽能所產生的電能[2012年版修訂]ldquoElectricityrdquoincludes the electricity generated from coal natural gas wind and solarpower since 2010 (Revised in 2012 Edition)
14 根據工業能源消耗調查所得的數據有關2000年至2010年的能源最終用途數據已
在2012年版中作出修訂[2012年版修訂]The energy end-use data from year 2000 to 2010 were revised in the 2012 Editionbased on the findings of energy consumption survey on the Industrial Sector(Revised in 2012 Edition)
自2013年版起「煮食」之能源最終用途除已包括煮食爐及飯煲外再加上在廚房
普遍用作製造及準備食物的器具例如煮食用水加熱設備電焗爐及微波爐等
自2001年後的「煮食」之能源最終用途數據均作出修訂[2013年版修訂]The ldquo Cooking rdquo energy end-use was revised in the 2013 Edition to include foodmaking and preparation appliances normally found in kitchens in addition to stovesand rice cookers Examples of the appliances are hot water for cooking purposeselectric ovens and microwave ovens etc The ldquoCookingrdquo energy end-use data since2001 were hence updated (Revised in 2013 Edition)
自2011年「商業」及「工業」類別的分類已經根據香港標準行業分類20版作出
修訂這修訂包括將個人服務活動(例如夜總會卡拉OK電腦及通訊設施維
修家居用品維修車輛維修服務藝術表演或創作活動及出版服務)由以往的
「食肆」「其他商業」組別或「工業」類別重置到現時的「零售」組別其同
時涵蓋零售及個人服務活動[2013年版修訂]The ldquoCommercialrdquo and ldquoIndustrialldquo Sectors were re-categorized in 2011 to alignwith the Hong Kong Standard Industrial Classification (HSIC) Version 20Examples of such changes are the relocations of personal service activities (such asnight clubs karaokes computer and communication repair household goodsrepair motor vehicle repair services art performance or creation activities andpublishing services etc) from the previous ldquo Restaurant ldquo Other CommercialSegments or the rdquoIndustrialrdquo Sector to the present ldquoRetailrdquo Segment which nowembraces both retail and personal service activities (Revised in 2013 Edition)
12 自2010年的能源最終用途數據包括可再生能源數據[2012年版修訂]The energy end-use data from 2010 includes renewable energy data(Revised in 2012 Edition)
11
75 76
7Chronology of Major Revisions
8 自2013年版起「空氣調節」之能源最終用途除已包括冷氣設備及暖氣機外再加
上風扇空氣清新或淨化器及抽濕機 自2001年後的「空氣調節」之能源最終用
途數據均作出修訂[2013年版修訂]The ldquoAir Conditioningrdquo energy end-use was revised in the 2013 Edition to includefans air cleanerpurifiers and dehumidifiers in addition to air conditioning unitsand heaters The ldquoAir Conditioningrdquo energy end-use data since 2001 were henceupdated (Revised in 2013 Edition)
9 自2013年版起「辦公室設備」之能源最終用途除已包括電腦及影印機外再加上
視聽器材碎紙機傳真及收銀機自2001年後的「辦公室設備」之能源最終用
途數據均作出修訂[2013年版修訂]The ldquoOffice Equipmentrdquo energy end-use was revised in the 2013 Edition to includeaudio visual equipments shredders fax and cashier machines etc in addition tocomputers and photocopiers The ldquoOffice Equipmentrdquo energy end-use data since2001 were hence updated (Revised in 2013 Edition)
10 根據住宅能源消耗調查所得的數據有關2009年至2011年的能源最終用途數據已
在2013年版中作出修訂[2013年版修訂]The energy end-use data from year 2009 to 2011 were revised in the 2013 Editionbased on the findings of energy consumption survey on the Residential Sector(Revised in 2013 Edition)
15 根據政府統計處公佈的人口及家庭住戶統計修訂數字有關2007至2010年的能源
最終用途數據己在2012年版中作出相應的修訂[2012年版修訂]The energy end-use data from years 2007 to 2010 were revised in the 2012 Editionbased on the revised population and domestic household data published by theCensus and Statistics Department (Revised in 2012 Edition)
7
17 根據政府統計處公佈的家庭住戶統計修訂數字有關2001至2006年的能源最終用
途數據己在2009年版中作出修訂[2009年版修訂]The energy end-use data from years 2001 to 2006 were revised in the 2009 Editionbased on the revised domestic household data published by the Census and StatisticsDepartment (Revised in 2009 Edition)
18 自2006年起「鐵路」之能源最終用途再不包括鐵路車站等建築物使用的電量
[2008年版修訂]The ldquoRailrdquo energy end-use do not include electricity consumption at railway stationsfrom 2006 onwards (Revised in 2008 Edition)
16 根據商業及運輸能源消耗調查所得的數據有關2003年至2007年的能源最終用途
數據已在2010年版中作出修訂[2010年版修訂]The energy end-use data from year 2003 to 2007 were revised in the 2010 Editionbased on the findings of energy consumption survey on the Commercial andTransport Sectors (Revised in 2010 Edition)
7Chronology of Major Revisions 8Units of Measurement7主要修訂年表 8計量單位
1 太焦耳 = 1012 焦耳 1 terajoule (TJ) = 1012 joules
1 千兆焦耳 = 109 焦耳 1 gigajoule (GJ) = 109 joules
1 百萬焦耳 = 106 焦耳 1 megajoule (MJ) = 106 joules
77 78
1 千兆瓦小時 = 36 x 1012 焦耳 1 gigawatt hour (GWh) = 36 x 1012 joules
1 兆瓦小時 = 36 x 109 焦耳 1 megawatt hour (MWh) = 36 x 109 joules
1 千瓦小時 = 36 x 106 焦耳 1 kilowatt hour (kWh) = 36 x 106 joules
網址 httpwwwemsdgovhk電郵 energydataemsdgovhk
79 80
Enquiries about this publication can be directed to
The Energy Efficiency OfficeElectrical amp Mechanical Services Department
7F 3 Kai Shing Street Kowloon Bay Hong Kong
Tel No (852) 2808 3465Fax No (852) 2890 6081
Homepage httpwwwemsdgovhkE-mail energydataemsdgovhk
Set of Hong Kong Energy End-use Data can be downloadedfrom EMSD website
httpswwwemsdgovhkenenergy_efficiencyenergy_end_use_data_and_consumption_indicatorshong_kong_energy_end_use_datadataindexhtml
有關本刊物的查詢請聯絡
機電工程署
香港九龍灣啟成街3號7樓
能源效益事務處 httpswwwemsdgovhktcenergy_efficiencyenergy_end_use_data_and_consumption_indicatorshong_kong_energy_end_use_datadataindexhtml
香港能源最終用途數據收錄之數據可在機電工程署網站下載
電話(852) 2808 3465圖文傳真(852) 2890 6081
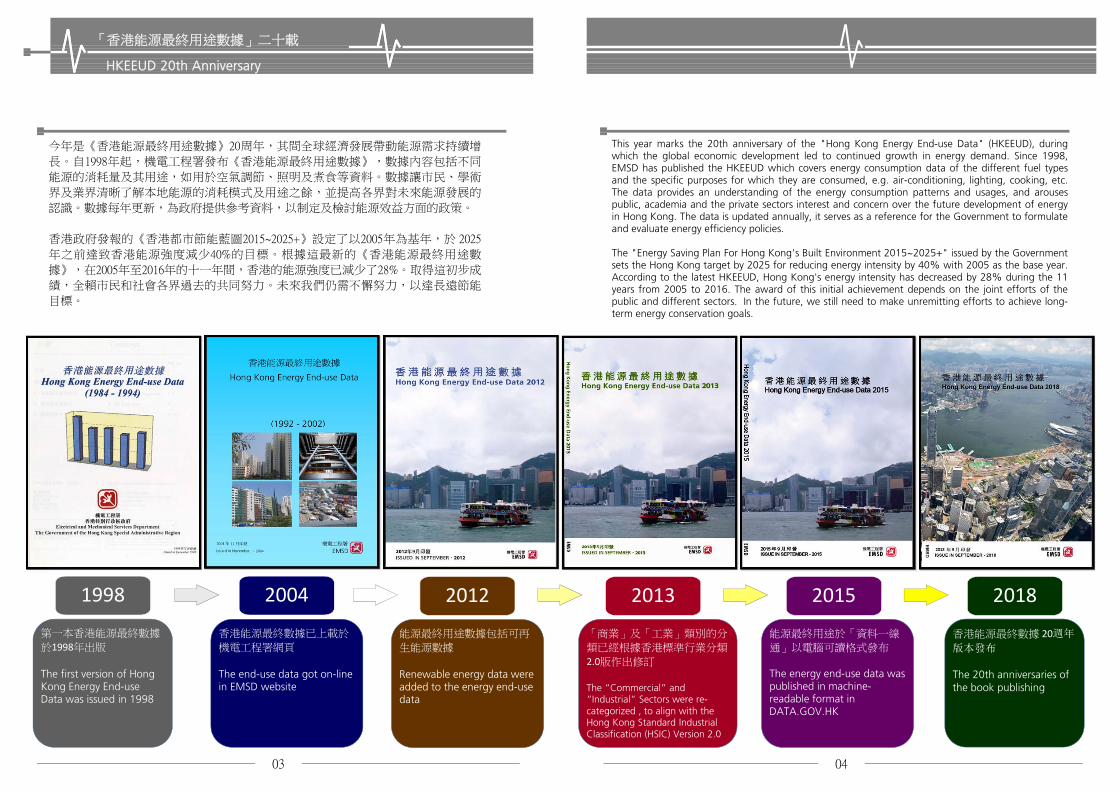
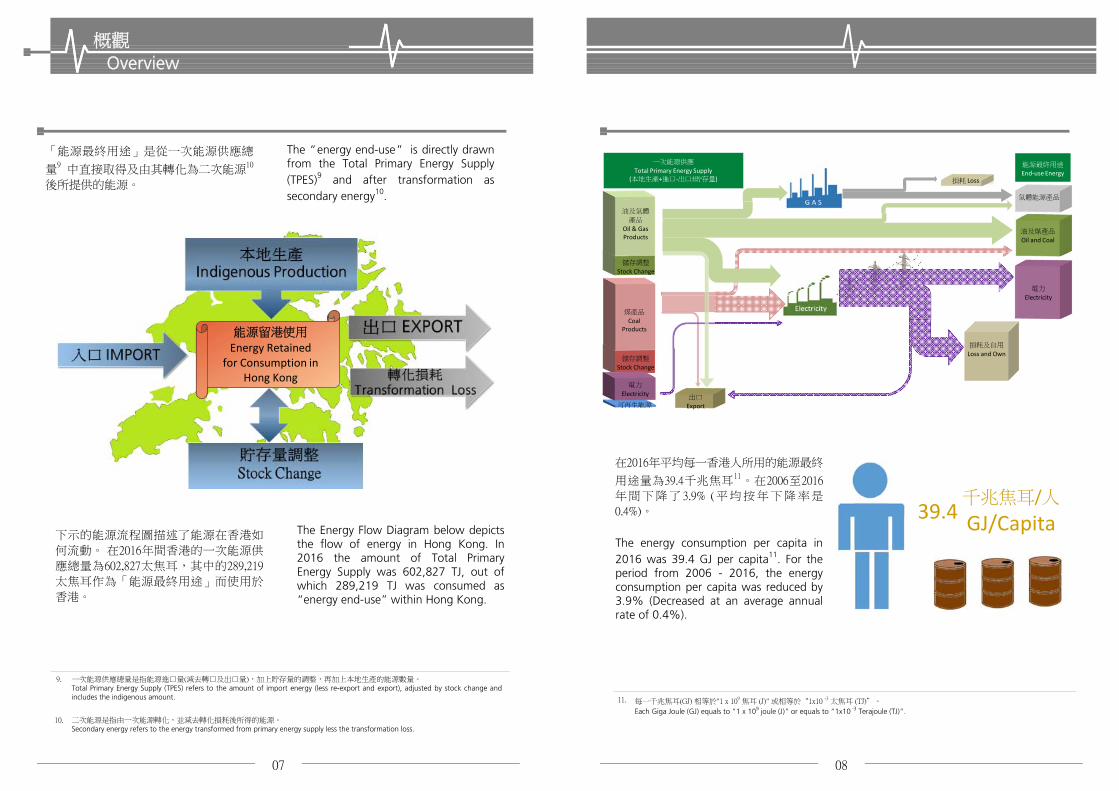
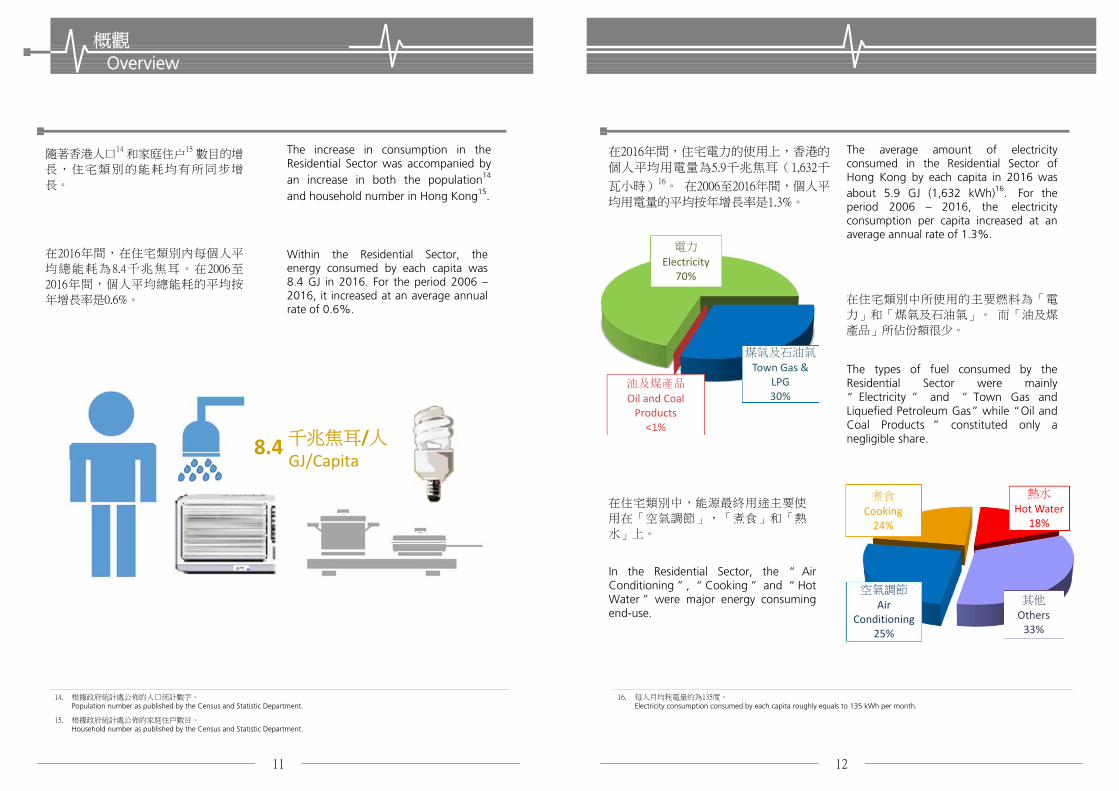
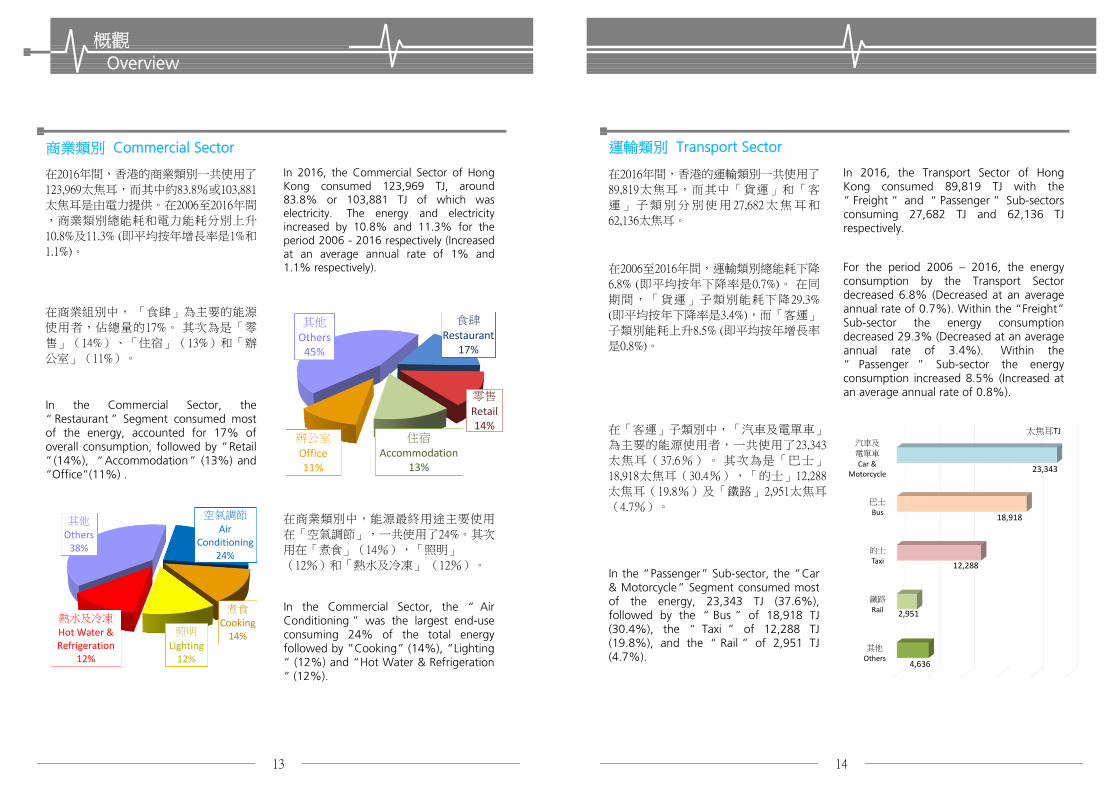
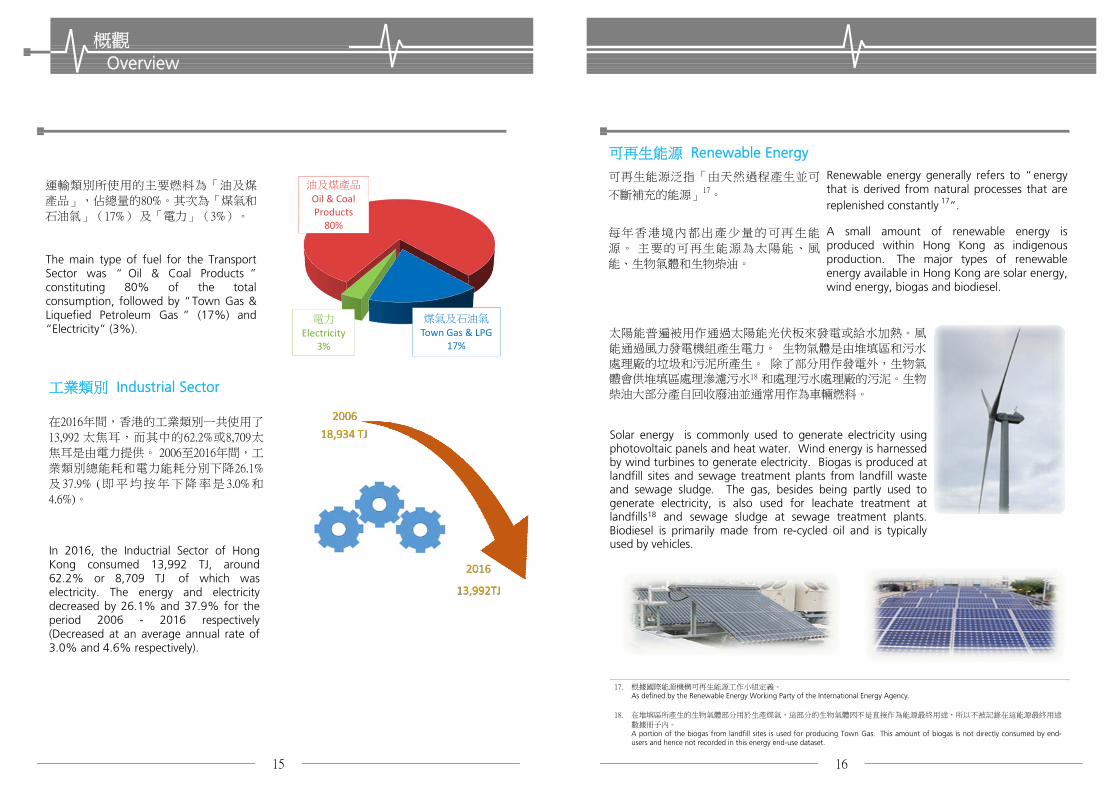
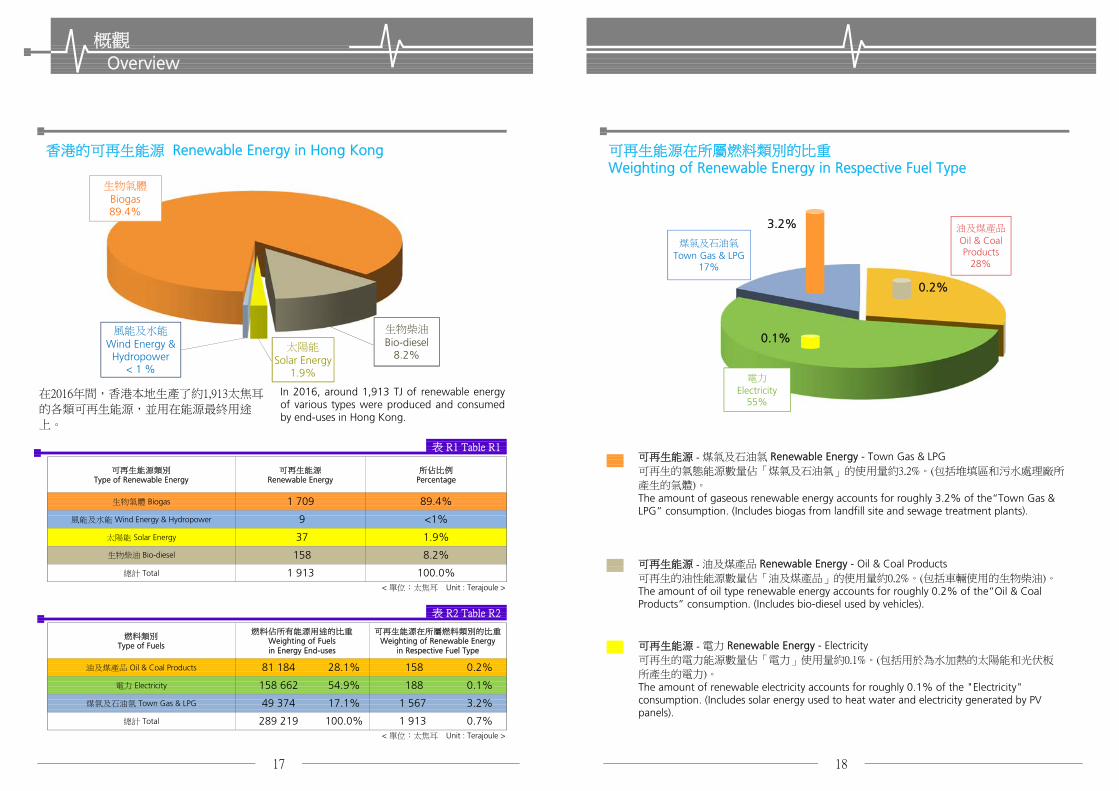
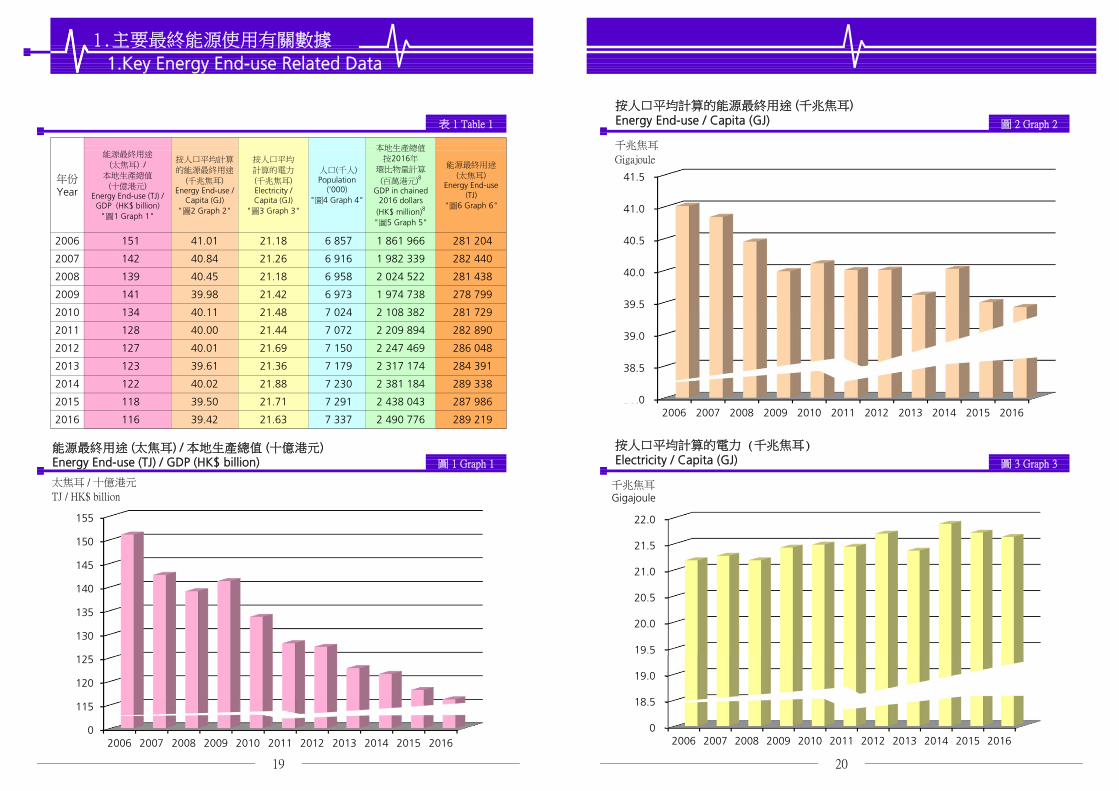
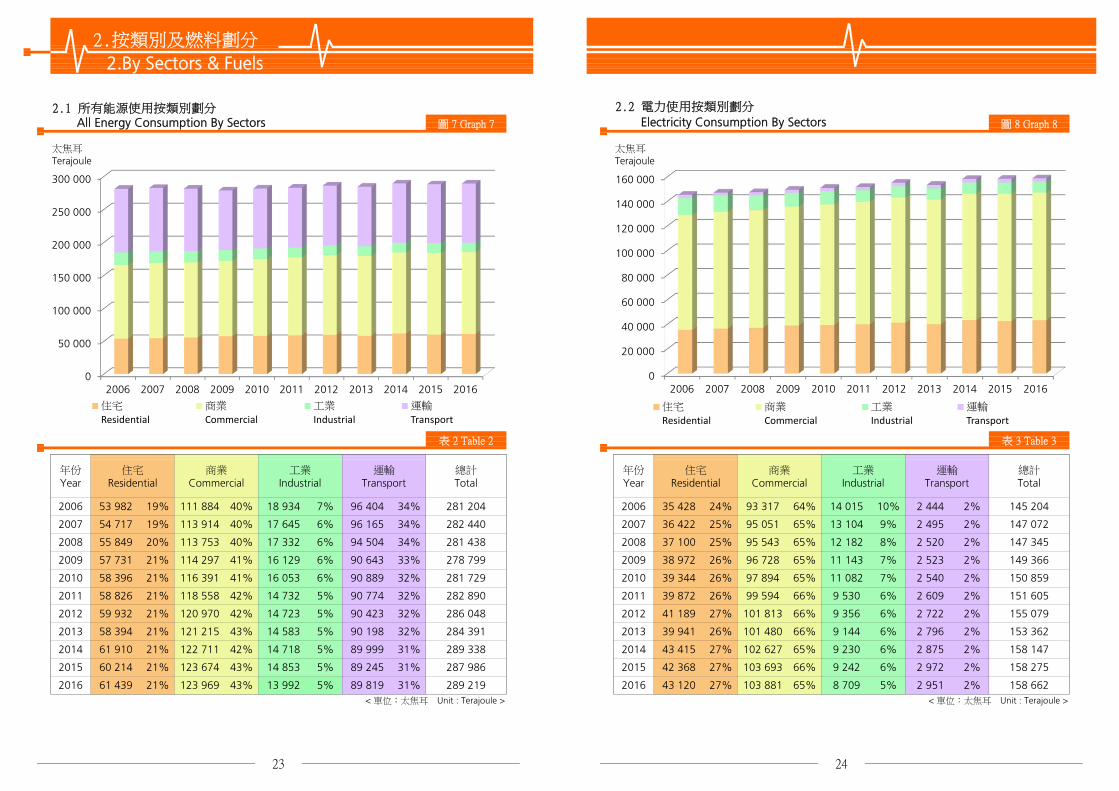
2按類別及燃料劃分
43 415 27
lt 單位太焦耳 Unit Terajoule gt
2 972 2 158 275
2 875
9 242 6
2
23 24
lt 單位太焦耳 Unit Terajoule gt
2016
289 338
287 986
65
66
282 890
286 048
2016 61 439 21 123 969 43
100
100
100
100
2013 58 394 21 121 215 43 14 583
13 992 5 89 819 31 289 219
2012 59 932 21 120 970 42 14 723 5
26 101 4805 90 198 32 2013 39 941
2012 41 189100
24 93 317 64 14 015 10 2 444 2
25
2 796 2666
2 495 2
26 99 594 66 2 609 2
100
100
100
100
100
100
2008 37 100
2007 36 422
2006 35 428
2011 39 872
278 799
281 729 2010 39 344 26 97 894 65
26 96 7282009 38 972 65
43 120
2015 42 368 103 693
2014
95 051 65 13 104 9
6
9 144
27 101 813 66 9 356 6
27 103 881
102 627
27
9 530
2 9518 709 5
9 230 6
265
25 95 543 65 12 182 8 2 520 2
11 082 7 2 540 2
2 722 2
11 143 7 2 523 2
282 440
281 438
6
2015 60 214 21 123 674 43 14 853 5 89 245 31
284 391
2014 61 910 21 122 711 42 14 718 5 89 999 31
90 423 32
2011 58 826 21 118 558 42 14 732 5 90 774 32
2010 58 396 21 116 391 41 16 053 6 90 889 32
2009 57 731 21 114 297 41 16 129 6 90 643 33
2008 55 849 20 113 753 40 17 332 6 94 504 34
96 165 342007 54 717 19 113 914 40 17 645
7 96 404 34 281 2042006 53 982 19 111 884 40 18 934
2By Sectors amp Fuels
圖 7 Graph 7
22 電力使用按類別劃分
Electricity Consumption By Sectors
表 3 Table 3
年份Year
住宅Residential
商業Commercial
工業Industrial
運輸Transport
總計Total
年份Year
住宅Residential
商業Commercial
表 2 Table 2
太焦耳Terajoule
太焦耳Terajoule
工業Industrial
運輸Transport
總計Total
圖 8 Graph 8
21 所有能源使用按類別劃分 All Energy Consumption By Sectors
147 072
147 345
158 147
100
100
100
100
100
100
100
100
100
100
100
145 204
149 366
150 859
151 605
155 079
153 362
158 662
0
50 000
100 000
150 000
200 000
250 000
300 000
2006 2007 2008 2009 2010 2011 2012 2013 2014 2015 2016
住宅
Residential商業
Commercial工業
Industrial運輸
Transport
0
20 000
40 000
60 000
80 000
100 000
120 000
140 000
160 000
2006 2007 2008 2009 2010 2011 2012 2013 2014 2015 2016
住宅
Residential商業
Commercial工業
Industrial運輸
Transport
100
100
100
100
100
100
100
100
100
100
100
100
100
100
100
100
100
100
100
100
25 26
30 49 374lt 單位太焦耳 Unit Terajoule gt lt 單位太焦耳 Unit Terajoule gt
37 14 9240 5 164 2 14 9675 71 900 89
「總熱值」是使用於計算各種氣體燃料的熱含量 Gross caloricfic values are used in calculating the respective heat contents of the gaseous products
2014 8
6 4 112
30 1 272
30 1 1712016 8 81 184 2016 18 311
2015 8 0 88 80 757 2015 17 838 36 14 795
0 5 156
5 186 6 4 339 5 71 225
18 487 32
3 15 048 31
6 4 244 5 70 939 88 80 347 2014 2 16 185
48 954
14 709 2 15 348 3130 1 220
36 14 928 29 1 244
49 723
50 844
89 81 352 2012 18 736
18 446 372013 8 0 5 026 6 4 218 89 81 306 20135 72 054
2011 18 946 38 14 161
49 084
2012 8 0 4 769 6 4 259 31 49 61614 388 29 1 108 2 15 384
2010 13
29
385 72 317
33 49 73213 471 27 927 2 16 627
47 239
31 49 5682011 8 0 4 803 6 4 246 5 72 659
0 4 526 6 4 035 5 73 213
89 81 716
18 736 40 12 815 2 14 765 3127 923
39 13 971 28 937 31
15 506
2 15 13790
956 2
81 786 2010 19 038
2008 41 0 4 739 6 4 223
5 73 355
385 75 358 89 84 361 2008 18 708
2009 23 0 4 753 6 4 063 89 82 194 2009
9265 78 510 90 87 518
2007 18 238 37 13 888100
282006 79
29 917 2
3 994
年份Year
2006
總計Total
2007 57 0 4 975 6 3 623
住宅Residential
商業Commercial
工業Industrial
年份Year
住宅Residential
商業Commercial
工業Industrial
運輸Transport
100
2By Sectors amp Fuels
23 油及煤產品使用按類別劃分
Oil amp Coal Products Consumption By Sectors24 煤氣及石油氣使用按類別劃分 Town Gas amp LPG Consumption By Sectors圖 9 Graph 9 圖 10 Graph 10
表 4 Table 4 表 5 Table 5
太焦耳Terajoule
太焦耳Terajoule
2按類別及燃料劃分
總計Total
0 4 936 6
32 48 72190 86 647
運輸Transport
32 48 4822 15 45018 476
15 6784 77 992
38 13 631
0
10 000
20 000
30 000
40 000
50 000
60 000
70 000
80 000
90 000
2006 2007 2008 2009 2010 2011 2012 2013 2014 2015 2016
住宅
Residential商業
Commercial工業
Industrial運輸
Transport
0
5 000
10 000
15 000
20 000
25 000
30 000
35 000
40 000
45 000
50 000
2006 2007 2008 2009 2010 2011 2012 2013 2014 2015 2016住宅
Residential商業
Commercial工業
Industrial運輸
Transport
3按最終用途及組別劃分
3By End-uses amp Segments
所有住宅組別 All Residential Segments
31 住宅組別所有能源使用按最終用途劃分 All Energy Consumption By End-uses In Residential Segments
27
17 052 29 125 9 711
2016
2010
2009
2012
2011 16 418
10 028
28
所有住宅能源最終用途 All Residential Energy End-uses圖 11 Graph 11 圖 12 Graph 12
其他房屋 3
Other Housing 3
4 038
年份 Year 2016
表 6 Table 6
年份 Year 2006
太焦耳Terajoule
年份Year
公共房屋Public
Housing
私人房屋Private
Housing
房委會
資助出售單位 2
HA SubsidizedSale Flats 2
2007
61 910
57 731
53 982
58 396
58 826
59 932
58 394
lt 單位太焦耳 Unit Terajoule gt
61 439
2015 60 214
3 904
17 364 30 4802014
2013 16 614 28 407 9 470
29 117 9 662 3 629
16 844 29 268 9 804 4 016
2006
總計Total
2008
54 717
55 849
15 489 26 211 9 478 2 805
15 521 26 733 9 664 2 799
4 326
17 395 30 284 9 682 4 078
3 430
15 451 27 701 10 082 2 616
15 915
16 152
28 544 10 153 3 119
28 730 10 084
0
10 000
20 000
30 000
40 000
50 000
60 000
70 000
2006 2007 2008 2009 2010 2011 2012 2013 2014 2015 2016公共房屋
Public Housing私人房屋
Private Housing房委會資助出售單位
HA Subsidized Sale Flats 其他房屋
Other Housing
煮食
Cooking 26
空氣調節
Air Conditioning 22
熱水
Hot Water 20
照明
Lighting8
冷凍
Refrigeration 11
辦公室設備
Office Equipment9
其他
Others4
煮食
Cooking 24
空氣調節
Air Conditioning 25
熱水
Hot Water 18
照明
Lighting6冷凍
Refrigeration 9
辦公室設備
Office Equipment11
其他
Others7
1 408 529 318 375 272
1 012 561 284 343 171
1 412 527 307
364
1 159 557
1 128 554 311 347 210
3按最終用途及組別劃分
3By End-uses amp Segments
公共房屋組別 Public Housing Segment
31 住宅組別所有能源使用按最終用途劃分 All Energy Consumption By End-uses In Residential Segments
329
698 493 193
765 532 226
2 288 1 902 495 838
2 428 1 961 506 864
700 915
841
3 544
空氣調節Air
Conditioning
3 629
356
3 119
4 078
1 517
1 291 565 347 359 266 4 016 337
544 331 412 283 4 326
277 3 904
246
365 263 4 038
296
104 2 799
285 101 2 616 212
217 298
3 430 270
137
693 9 6821 133
791 545 249 294 102 2 805 211
熱水Hot
Water
照明Lighting
冷凍Refrigeration
辦公室
設備Office
Equipment
其他 1
Others 1總計Total
lt 單位太焦耳 Unit Terajoule gt
708 10 028
1 172
2 354 1 886 488 873 682 9 7111 115
1 014
519 10 084
2 163 1 949
1 896 1 954 513 816 717 9 470
585 857 567 9 6621 025
2 162 1 978 561 838 678 9 8041 127
2 302
401 9 664 909
2 216 1 992 673 940 418 10 082 977
2 190 1 927
冷凍Refrigeration
辦公室
設備Office
Equipment
其他 1
Others 1總計Total
2 157 1 976 725 886 385 9 478 844
熱水Hot
Water
563
2009
2 504
年份Year
煮食Cooking
1 977
589
照明Lighting
671
599 2008
2006
15 451
15 915
2007
2 761
2 867
2 621
676
2016 2 333
1 158
1 029
2011 2 515
2010 2 685 2 285 1 995 645 926
2012 2 459
955 468 10 153
873
1 811
2 403 945 1 777 1 044
925 1 822 1 022
959 1 788 1 878lt 單位太焦耳 Unit Terajoule gt
2015
723
1 851
1 059
照明Lighting
冷凍Refrigeration
辦公室
設備Office
Equipment
其他 1
Others 1
2012 8513 099
995
4 677
2013 4 800
2012 4 787 3 029 970 1 725
1 058
3 415 3 544
3 374
1 8762 691 3 552 958 1 679 16 614
17 364
17 052
29 117
3 421
2016 6 642
2 815
2016 4 809
3 101 1 002 27 7012 646
6 686
3 344 3 558
2015 6 341 3 048
7 201 5 256
2012 6 744
8 425 5 108 2 084
2015
2 764
6 176 5 104
2008
17 395
總計Total
2010 7 172
2009
2 148 898 2006
煮食Cooking
空氣調節Air
Conditioning
熱水Hot
Water
26 7332 4692 100 2 962 948
6 240 5 323 2 055
875
2014 4 789
5 094 2 107 8263 229 20162 848 2 167 30 284
2 155 28 407
7 364 5 101 2 208 2 743 2 008 29 268
2 204
2014
2007 6 974
2010
29 30
房委會資助出售單位組別 2
Housing Authority Subsidized Sale Flats Segment 2
年份Year
350lt 單位太焦耳 Unit Terajoule gt lt 單位太焦耳 Unit Terajoule gt
8 197
323 3583 212 20132013 6 676 6 507 5 094 2 097 2 665
3383 193 2014 827
2007
2 841 2 143 30 480
8 076 4 782 1 990 2 842 2 046 29 125
1 606
886 547 2502009 7 232
2011 7822011 7 014
6 740 5 344 2 167 3 134 1 164
6 949 5 279 2 178 3 003 1 333 28 730
28 544
2 9452 891
790
16 4182 931 3 564 942
6342008 7 334
657
2 314
2014
2013 2 402
61426 2112006 6 828 2 311
年份Year
煮食Cooking
6 122 5 074 2 830
2015
16 844
表 7 Table 7
2006
1 505
2010 4 661
2 620 3 567 952
2 849
2 870 3 557 947 1 818 742
冷凍Refrigeration
辦公室
設備Office
Equipment
其他 1
Others 1總計Total
1 825
1 367 15 489
16 152
15 521
煮食Cooking
空氣調節Air
Conditioning
熱水Hot
Water
照明Lighting
1 6421 763
1 558
1 794
2 773 3 509
2 801 3 566
3 5094 396 1 035 1 770
1 009 1 826
963 1 863
表 9 Table 9
私人房屋組別 Private Housing Segment 其他房屋組別 3 Other Housing Segment 3表 8 Table 8 表 10 Table 10
年份Year
空氣調節Air
Conditioning
1 421
2009 4 546
1 414
2008 4 467
2007 4 402
2011 4 735
fz234
太焦耳Terajoule
所有住宅能源最終用途 All Residential Energy End-uses圖 13 Graph 13
3按最終用途及組別劃分
3By End-uses amp Segments
所有住宅組別 All Residential Segments
32 住宅組別電力使用按最終用途劃分 Electricity Consumption By End-uses In Residential Segments
圖 14 Graph 14
年份 Year 2016
表 11 Table 11
35 428
總計Total
年份 Year 2006
2006
年份Year
公共房屋
PublicHousing
私人房屋Private
Housing
房委會
資助出售單位 2
HA SubsidizedSale Flats 2
其他房屋 3
Other Housing 3
9 442 5 73318 016
38 972
2010 39 344
2009
9 615
9 514
9 979
36 422
2008 37 100
2007 18 615
19 277
20 160
20 28210 100
39 872
2012 41 189
2011 5 932 2 932
6 068 3 253
20 739
21 195
10 269
10 674
39 941
2014 43 415
2013 5 810 3 159
6 351 3 334
20 500
22 522
10 473
11 209
lt 單位太焦耳 Unit Terajoule gt
31 32
11 036
11 220
21 575
22 393
6 168 3 588
6 117 3 390
42 368
2016
2015
43 120
6 333 2 500
6 234 2 727
2 236
5 972 2 220
6 222 2 088
0
5 000
10 000
15 000
20 000
25 000
30 000
35 000
40 000
45 000
2006 2007 2008 2009 2010 2011 2012 2013 2014 2015 2016
公共房屋
Public Housing私人房屋
Private Housing房委會資助出售單位
HA Subsidized Sale Flats 其他房屋
Other Housing
煮食Cooking
9
空氣調節Air Conditioning
35
熱水Hot Water
8 照明Lighting
9
冷凍Refrigeration
14
辦公室設備Office
Equipment15
其他Others10
煮食Cooking
9
空氣調節Air Conditioning
34
熱水Hot Water
11 照明Lighting
12
冷凍Refrigeration
16辦公室設備Office
Equipment13
其他Others
5
3按最終用途及組別劃分
3By End-uses amp Segments
公共房屋組別 Public Housing Segment
32 住宅組別電力使用按最終用途劃分 Electricity Consumption By End-uses In Residential Segments
350 272 3 3902016 1 882 8 197 1 965 2 107 2 848 3 229 2 166 22 393
2014 1 861 8 425 1 976 2 084 2 841
2015 1 777 8 076 1 797
lt 單位太焦耳 Unit Terajoule gt lt 單位太焦耳 Unit Terajoule gt
33 34
3 048 2 045 21 575 2015 323 1 517 359 331 412 364 283 3 588
2016 311 1 408 357 318 375
1 990 2 842
338 263 3 3343 193 2 142 22 522 2014 300 1 412 350 307 365
3 212 2 155 20 500 2013 316 1 159 370 323 358 356 277 3 159
347 3592012 1 847 7 364 1 925 2 208 2 743
2013 1 872 6 507 1 993 2 097 2 665
337 266 3 2533 099 2 007 21 195 2012 304 1 291 349
2 945 1 604 20 739 2011 267 1 128 373 311 347 296 210 2 932
284 3432010 1 779 6 949 2 228 2 178 3 003
2011 1 808 7 201 2 086 2 204 2 891
270 171 2 7272 815 1 330 20 282 2010 243 1 012 406
2 764 1 158 20 160 2009 221 886 430 250 329 246 137 2 500
193 2852008 1 812 6 240 2 431 2 055 3 101
2009 1 807 6 740 2 389 2 167 3 134
212 101 2 0882 646 992 19 277 2008 189 698 410
2 469 939 18 615 2007 180 765 431 226 298 217 104 2 220
249 2942006 1 592 6 122 2 123 2 148 2 830
2007 1 698 6 176 2 271 2 100 2 962
211 102 2 2362 311 890 18 016 2006 162 791 428
辦公室
設備Office
Equipment
其他 1
Others 1總計Total
年份Year
煮食Cooking
空氣調節Air
Conditioning
熱水Hot
Water
照明Lighting
冷凍Refrigeration
辦公室
設備Office
Equipment
其他 1
Others 1總計Total
lt 單位太焦耳 Unit Terajoule gt lt 單位太焦耳 Unit Terajoule gt
私人房屋組別 Private Housing Segment 其他房屋組別 3 Other Housing Segment 3表 13 Table 13 表 15 Table 15
年份Year
煮食Cooking
空氣調節Air
Conditioning
熱水Hot
Water
照明Lighting
冷凍Refrigeration
1 878 1 038 11 220 2016 576 2 288 102 495 838 1 133 684 6 117
488 8732015 1 115 3 374 987 925 1 822
2016 1 157 3 344 1 056 959 1 788
1 115 674 6 1681 811 1 002 11 036 2015 568 2 354 97
1 851 1 023 11 209 2014 589 2 428 106 506 864 1 158 699 6 351
513 8162013 1 155 2 691 1 076 958 1 679
2014 1 140 3 415 1 059 945 1 777
1 172 708 5 8101 876 1 037 10 473 2013 597 1 896 108
1 794 974 10 674 2012 605 2 162 105 561 838 1 127 669 6 068
585 8572011 1 055 2 931 1 118 942 1 763
2012 1 120 3 029 1 062 970 1 725
1 025 556 5 9321 642 817 10 269 2011 613 2 163 133
1 558 717 10 100 2010 667 2 285 178 645 926 1 029 504 6 234
676 9552009 951 2 801 1 252 963 1 863
2010 1 004 2 870 1 187 947 1 818
1 014 450 6 3331 505 644
1 414 563
9 979 2009 709 2 302 227
1 421 570 9 514 2008 744 2 216 277
其他 1
Others 1總計Total
2006 587 2 157 171
673 940 977
380 5 972
照明Lighting
2 773 1 181 1 009 1 826
2008 862 2 620 1 264 952 1 825
表 14 Table 14
總計Total
年份Year
煮食Cooking
空氣調節Air
Conditioning
熱水Hot
Water
5 733
冷凍Refrigeration
房委會資助出售單位組別 2
Housing Authority Subsidized Sale Flats Segment 2表 12 Table 12
725 886 844 364
395 6 222
700 915 909
辦公室
設備Office
Equipment
年份Year
2006
辦公室
設備Office
Equipment
其他 1
Others 1
9 615 2007 659 2 190 218
1 367 539 9 442
煮食Cooking
空氣調節Air
Conditioning
熱水Hot
Water
照明Lighting
冷凍Refrigeration
813 2 849 1 070 1 035 1 770
2007 850
3按最終用途及組別劃分
3By End-uses amp Segments
所有商業組別 All Commercial Segments
33 商業類別所有能源使用按最終用途劃分 All Energy Consumption By End-uses In Commercial Segments
12 570 - - -
-
太焦耳Terajoule
63 251
46 037
21 340 17 942 12 791 15 799
21 290 17 928 12 915 16 331 5 887 3 286
67 577
5 753
21 316 17 506
21 165 17 332
46 632
45 816
12 484 - -
3 270
12 663 14 017 5 563 3 273
118 558
121 2153 215 45 328
2012 120 970
61 790
23 397 16 213 13 190 - -
23 299 15 9602009 11 788 - -
24 185 15 711 12 195 - - - 64 300
22 929 16 624
-
2013
13 182 16 453 5 968 3 324 46 536
21 397 17 612 12 544 15 539 5 581
35 36
年份 Year 2016
年份 Year 2006
24 157
123 674
113 914
2008 113 75315 686 11 894
2007
- - - 62 015
2011
114 297
2010 116 391
2016 123 969lt 單位太焦耳 Unit Terajoule gt
圖 16 Graph 16所有商業能源最終用途 All Commercial Energy End-uses圖 15 Graph 15
總計Total
2006 111 884
表 16 Table 16
年份Year
- 59 084
食肆Restaurant
零售Retail
辦公室Office
住宿Accomodation
醫療HumanHealth
教育Education
其他商業Other
Commercial
21 163 17 343
2015
2014 122 711
0
20 000
40 000
60 000
80 000
100 000
120 000
140 000
2006 2007 2008 2009 2010 2011 2012 2013 2014 2015 2016
食肆
Restaurant零售
Retail辦公室
Office住宿
Accomodation醫療
Health教育
Education其他商業
Other Commercial
煮食
Cooking14
空氣調節
Air Conditioning 24
照明
Lighting12
熱水及冷凍
Hot water amp Refrigeration
12
辦公室設備
Office Equipment5
其他
Others33
煮食
Cooking15
空氣調節
Air Conditioning 27
照明
Lighting15
熱水及冷凍
Hot water amp Refrigeration
8
辦公室設備
Office Equipment5
其他
Others30
3按最終用途及組別劃分
3By End-uses amp Segments
食肆組別 Restaurant Segment
33 商業類別所有能源使用按最終用途劃分 All Energy Consumption By End-uses In Commercial Segments
11 788
1 743 1 543 2 352 12 195
14 166
表 19 Table 19
2010
2009
年份Year
1 7002008 24 157
22 929 20071 761 7092007 6 971
923
885
1 954 905
總計Total
511
23 299 2009
6 557
總計Total
1 829 13 190
2008 6 395
2 517 13 182
1 599 2 446 12 663
1 806 1 596 2 441
2 416 12 791
1 809
1 571
12 544
2 479 12 915
5 401 2 054 810
785
2016 1 862 1 6467 158
525
2013
2015
2014
2 055 821 532 21 397
2 054 819
21 165 1 577
6 983
6 701
1 784
689
17 343 2016
4 1835 625 -2011
6 338
7 523
5 701 4 177 7 628
5 583 4 250
5 754 4 310
7 901
1 773
5 706
5 805
1 833 1 620 525
12 528
lt 單位太焦耳 Unit Terajoule gt
零售組別 Retail Segment 表 18 Table 18
總計Total
4 115
2009
2014 21 340
其他 1
Others 1
21 163
照明Lighting
811
807 524
21 2902 081
2 085
530
2007
年份Year
4 1192006
2008
-
6 809
lt 單位太焦耳 Unit Terajoule gt lt 單位太焦耳 Unit Terajoule gt
2013
14 0173 273 4 5551 384 4 21917 506 20122012
7 779 15 5393 623 5 0341 550
1 645 4 931 6975 582 4 189 7 572
辦公室設備Office
Equipment
6 711
4 67517 612 2013
7 864
lt 單位太焦耳 Unit Terajoule gt
住宿組別 Accommodation Segment 表 20 Table 20
總計Total
空氣調節Air
Conditioning
熱水及冷凍4
Hot Water ampRefrigeration4
照明Lighting
其他 1
Others 1年份Year
-- -- -17 332
7 031
- -
2013
2016
2015 12 389 5 483
12 358 5 402
5 398
5 498
15 711 20102010 -5 7154 122
5 799
5 875
663
2011
586
657
37 38
16 4533 855 5 325
15 7993 762 5 0951 565 4 71417 942 20144 241
16 3313 890 5 2511 627 4 87217 928 20152015
2014
2016
-
-- -- -
--5 865 -15 686 2008
4 187
- -
15 960 2009 -
-
6 793
5 968
13 507 5 960
-- -- -16 624 20076 689 4 890 5 045 -
-- -- -16 213 20065 300
空氣調節Air
Conditioning
12 591
12 426
14 049 5 525
6 082 1 991
照明Lighting
辦公室設備Office
Equipment
其他 1
Others 1
2 019
2012
20112011 12 622 5 237 2 009
973
21 316 2012
24 185 201013 404 6 594 2 1181 001 1 069
辦公室組別 Office Segment表 17 Table 17
23 397 2006 7 187
1 802 1 777 12 570
2 412 12 484
1 505 2 294 11 894
1 684 1 491 2 274
995
- -
2006
年份Year
煮食Cooking
空氣調節Air
Conditioning
熱水及冷凍4
Hot Water ampRefrigeration4
照明Lighting
其他 1
Others 1
2 026 2 14914 215 584
空氣調節Air
Conditioning
5 863 1 7251 011
5 596 1 486
5 561 5 518 1 478 1 918
46 536
31 341 45 816
5 587 5 571 1 486 1 911 31 482 46 037
5 430
34 746 64 300
11 225 7 603 2 684 8 396 37 669 67 577
32 327 46 6325 402 5 516
9 672 7 207 3 092 8 255
1 527 1 860
10 154 7 586 3 156 8 659
45 328
10 572 7 766
130
- - -
-
61 790
131 538
33 790 62 015
9 860 7 321 3 087 8 231 34 751 63 251
2010
- 2009
- 2008
- - -
- - -
59 084
-
其他 1
Others 1
lt 單位太焦耳 Unit Terajoule gt
5 968 2016 1 845 32 179
5 581 2013
5 563 2012
-
-
- 2011
-
5 486
3 273
照明Lighting
辦公室設備Office
Equipment
熱水及冷凍4
Hot Water ampRefrigeration4
其他 1
Others 1
546
542
-
31 558
-
533
1 475 1 832 31 132
- 2007
5 402
2 573 6 616
10 348 7 527 2 881 7 714 33 321
39 40
2016 3 324
2015 3 2861 606
lt 單位太焦耳 Unit Terajoule gt
3 270
1 613 681 337 138 556
1 603
666 330 137
661 327 137
- -
2014
2013 1 563
2012
2011 -
1 602
- - -
-
- -
-
671 332
- -
3 215 661 327
2006 -
-
2010 -
2009 --
lt 單位太焦耳 Unit Terajoule gt
教育組別 Education Segment 表 22 Table 22
2008 -
2007 -- -
年份Year
總計Total
空氣調節Air
Conditioning
照明Lighting
辦公室設備Office
Equipment
熱水及冷凍4
Hot Water ampRefrigeration4
-
2016 1 257 303 298 2 218 1 892
5 887 2015
5 753 20142014 1 237 289 285 2 126 1 817
2015 1 261 297 292 2 176 1 862
2012 1 189 283 279 2 057 1 754
2013 1 178 284 280 2 071 1 768
2010 - - - - -
2011 - - - - -
2008 - - - - -
2009 - - - - -
20062006 - - - - -
2007 - - - - -
3按最終用途及組別劃分
3By End-uses amp Segments
醫療組別 Human Health Segment
33 商業類別所有能源使用按最終用途劃分 All Energy Consumption By End-uses In Commercial Segments
其他商業組別 Other Commercial Segments表 21 Table 21 表 23 Table 23
年份Year
空氣調節Air
Conditioning
照明Lighting
辦公室設備Office
Equipment
熱水及冷凍4
Hot Water ampRefrigeration4
其他 1
Others 1總計Total
年份Year
空氣調節Air
Conditioning
總計Total
12 106 3 537 3 198
12 381 16 826 12 915 12 043 3 489 3 158 42 881 103 693
lt 單位太焦耳 Unit Terajoule gt
41 42
101 480
2014 12 379 16 742 12 791 11 615 3 412 3 144 42 544 102 627
2016 12 330 16 306 13 182 43 223 103 881
2015
43 748 101 813
2013 12 336 16 435 12 544 11 386 3 317 3 102 42 361
2012 12 265 16 442 12 663 10 211 3 321 3 164
2011 11 894 16 339 12 484 - - - 58 877 99 594
2010 14 372 15 711 12 195 - - - 55 616 97 894
2009 12 990 15 960 11 788 - - - 55 991 96 728
2008 13 257 15 686 11 894 - - - 54 706 95 543
2007 11 681 16 624 12 570 - - - 54 176 95 051
所有商業能源最終用途 All Commercial Energy End-uses圖 17 Graph 17 圖 18 Graph 18
年份 Year 2016太焦耳Terajoule
3按最終用途及組別劃分
3By End-uses amp Segments
所有商業組別 All Commercial Segments
34 商業類別電力使用按最終用途劃分 Electricity Consumption By End-uses In Commercial Segments
年份 Year 2006
2006 12 136
表 24 Table 24
年份Year
食肆Restaurant
零售Retail
辦公室Office
住宿Accomodation
醫療HumanHealth
教育Education
其他商業Other
Commercial
總計Total
16 213 13 190 - - - 51 779 93 317
0
20 000
40 000
60 000
80 000
100 000
120 000
2006 2007 2008 2009 2010 2011 2012 2013 2014 2015 2016
食肆
Restaurant零售
Retail辦公室
Office住宿
Accomodation醫療
Health教育
Education其他商業
Other Commercial
煮食
Cooking7
空氣調節
Air Conditioning 29
照明
Lighting15
熱水及冷凍
Hot Water amp Refrigeration
8
辦公室設備
Office Equipment6
其他
Others35
煮食
Cooking6
空氣調節
Air Conditioning 33
照明
Lighting17
熱水及冷凍
Hot Water amp Refrigeration
5
辦公室設備
Office Equipment6
其他
Others33
1 527 4 381 12 106lt 單位太焦耳 Unit Terajoule gt lt 單位太焦耳 Unit Terajoule gt
43 44
2016 5 582 4 189 6 535 16 306 2016 3 855 1 645
3按最終用途及組別劃分
3By End-uses amp Segments
食肆組別 Restaurant Segment
34 商業類別電力使用按最終用途劃分 Electricity Consumption By End-uses In Commercial Segments
2013 3 623
697
1 502 4 334 12 043
2014 5 799 4 241 6 701 16 742 2014 3 762 1 565 663 1 459 4 167 11 615
2015 5 754 4 310 6 762 16 826 2015 3 890
2011 -
1 627 689
1 429 4 127 11 386
2012 5 701 4 177 6 565 16 442 2012 3 273 1 384 586 1 282 3 686 10 211
2013 5 583 4 250 6 601 16 435
2009 -
1 550 657
- - -
2010 5 875 4 122 5 715 15 711 2010 - - - - - -
2011 5 625 4 183 6 530 16 339
2007 -
- -
- - -
2008 5 865 4 115 5 706 15 686 2008 - - - - - -
2009 5 968 4 187 5 805 15 960
年份Year
空氣調節Air
Conditioning
照明Lighting
其他 1
Others 1總計Total
年份Year
- -
-
2006 6 793 5 300 4 119 16 213 2006 - - - -
2007 6 689 4 890 5 045 16 624
空氣調節Air
Conditioning
照明Lighting
辦公室設備Office
Equipment
熱水及冷凍4
Hot Water ampRefrigeration4
其他 1
Others 1
13 182
- -
總計Total
- -
- -
零售組別 Retail Segment 住宿組別 Accommodation Segment表 26 Table 26 表 28 Table 28
12 330 2016 7 158 1 862 1 646 2 517
2 479 12 915
2016 4 039 5 402 819 1 595 474lt 單位太焦耳 Unit Terajoule gt lt 單位太焦耳 Unit Terajoule gt
1 773 1 571 2 416 12 791
2015 3 998 5 483 811 1 620 469 12 381 2015 6 983
2014 3 981 5 498 807 1 625 467 12 379 2014 7 031
1 833 1 620
1 809 1 599 2 446 12 663
2013 4 048 5 398 821 1 594 475 12 336 2013 6 701 1 806 1 596 2 441 12 544
2012 3 991 5 401 810 1 595 469 12 265 2012 6 809
1 743 1 543 2 352 12 195
2011 3 870 5 237 785 1 547 454 11 894 2011 6 711 1 784 1 577 2 412 12 484
2010 4 120 6 594 1 001 1 647
11 894
2009 3 724 5 960 905 1 488 913 12 990 2009 6 338 1 684 1 491 2 274 11 788
2008 3 801 6 082 923 1 519
1 829
1 777 2 019
1 010 14 372 2010 6 557
1 700 1 505 2 294
1 802
932 13 257 2008 6 395
2 026 2 1491 241 519 12 136 2006 7 187
3 352 5 525 885 1 275 644 11 681 2007 6 971
辦公室組別 Office Segment表 25 Table 25 表 27 Table 27
年份Year
煮食Cooking
空氣調節Air
Conditioning
照明Lighting
熱水及冷凍4
Hot Water ampRefrigeration4
其他 1
Others 1總計Total
年份Year
空氣調節Air
Conditioning
照明Lighting
辦公室設備Office
Equipment
其他 1
Others 1總計Total
13 190
2007 12 570
2006 3 502 5 863 1 011
3按最終用途及組別劃分
3By End-uses amp Segments
醫療組別 Human Health Segment
34 商業類別電力使用按最終用途劃分 Electricity Consumption By End-uses In Commercial Segments
1 257 303 298 316 1 363 3 537
1 613 681 337 95 472 3 198lt 單位太焦耳 Unit Terajoule gt
45 46
3 158
3 102
-
3 164
- - - -
2012 1 602 671 332 94 465
2011 -
458 3 1442014 1 603 661 327 94
2013 1 563 661 327 92 458
2016
1 606 666 330 94 4622015
2009 - - - - - -
2010 - - - - - -
2008 - - - - - -
2007 -
2006 - - - - - -
- - - - -
5 596 1 486 1 807 28 904 43 223lt 單位太焦耳 Unit Terajoule gt lt 單位太焦耳 Unit Terajoule gt
其他 1
Others 1總計Total
年份Year
空氣調節Air
Conditioning
照明Lighting
辦公室設備Office
Equipment
熱水及冷凍4
Hot Water ampRefrigeration4
1 335 3 489
2016 5 4302016
1 261 297 292 305
教育組別 Education Segment 表 30 Table 30
1 478 1 847 28 140 42 544
2015 2015 5 587 5 571 1 486 1 850 28 388 42 881
2013 5 402 5 486 1 475 1 780 28 218 42 361
2014 1 237 289 285 301 1 301 3 412 2014 5 561
2013 1 178 284 280 295 1 280 3 317
5 518
2 684 3 408 33 957 58 877
2012 1 189 283 279 294 1 275 3 321 2012 5 402 5 516 1 527 1 810 29 492 43 748
2010 10 154 7 586 3 156 3 886 30 835 55 616
2011 - - - - - - 2011 11 225
2010 - - - - - -
7 603
31 079 54 706
2009 - - - - - - 2009 9 860 7 321 3 087 3 676 32 047 55 991
7 207 3 0922008 - - - - - - 2008 9 672
2007 10 348 7 527 2 881 2 863
3 657
30 558 54 1762007 - - - - - -
- - 2006 10 572 7 766 2 573 2 069 28 800 51 779
其他商業組別 Other Commercial Segments表 29 Table 29 表 31 Table 31
年份Year
空氣調節Air
Conditioning
照明Lighting
辦公室設備Office
Equipment
熱水及冷凍4
Hot Water ampRefrigeration4
其他 1
Others 1總計Total
年份Year
空氣調節Air
Conditioning
照明Lighting
辦公室設備Office
Equipment
熱水及冷凍4
Hot Water ampRefrigeration4
其他 1
Others 1總計Total
2006 - - - -
3按最終用途及組別劃分
3By End-uses amp Segments
所有工業組別 All Industrial Segments
35 工業類別所有能源使用按最終用途劃分 All Energy Consumption By End-uses In Industrial Segments
圖 20 Graph 20
年份 Year 2016
年份 Year 2006
所有工業能源最終用途 All Industrial Energy End-uses
695 5 188 2 770 3 344 2 585 14 5832013
5 166 2 659 3 377 2 732 14 7232012 789
494 5 549 3 010 3 395 2 404 14 8532015
5 334 2 967 3 337 2 501 14 7182014 579
47 48
5 080 2 906 3 312 2 292 13 992lt 單位太焦耳 Unit Terajoule gt
2016 402
864 4 938 2 450 3 504 2 976 14 7322011
4 135 2 718 3 888 4 095 16 0532010 1 217
1 373 3 829 2 695 4 036 4 196 16 1292009
4 009 2 804 4 255 4 454 17 3322008 1 809
3 086 3 815 4 788 17 6452007 2 019 3 935
4 209 4 985 18 9342006 2 249 4 629 2 863
圖 19 Graph 19
太焦耳
Terajoule
其他工業 7
OtherIndustries 7
總計Total
年份Year
紡織及服裝製品Textile amp
Wearing Apparel
非製造業 6
Non-manufacturing 6
食品及飲品Food amp
Beverage
金屬及機械Metal amp
Machinery
表 32 Table 32
0
2 000
4 000
6 000
8 000
10 000
12 000
14 000
16 000
18 000
20 000
2006 2007 2008 2009 2010 2011 2012 2013 2014 2015 2016
紡織及服裝製品
Textile ampWearing Apparel
非製造業
Non‐manufacturing
食品及飲品
Food ampBeverage
金屬及機械
Metal ampMachinery
其他工業
OtherIndustries
工業生產設備
Industrial ProcessEquipment
54
照明
Lighting6
空氣調節
Air Conditioning17
其他
Others23
工業生產設備
Industrial ProcessEquipment
53
照明
Lighting7
空氣調節
Air Conditioning22
其他
Others18
3按最終用途及組別劃分
3By End-uses amp Segments
紡織及服裝製品組別 Textile amp Wearing Apparel Segment
35 工業類別所有能源使用按最終用途劃分 All Energy Consumption By End-uses In Industrial Segments
食品及飲品組別 Food amp Beverage Segment表 33 Table 33 表 35 Table 35
年份Year
工業生產設備 5
Industrial ProcessEquipment 5
照明Lighting
空氣調節Air
Conditioning
其他1
Others1總計Total
年份Year
工業生產設備 5
Industrial ProcessEquipment 5
照明Lighting
空氣調節Air
Conditioning
其他1
Others1總計Total
466 455 2 863
2007 880 194 685 260 3 0862 019 2007 1 922 159 509 497
2006 997 210 757 284 2 249 2006 1 797 146
430 425 2 804
2009 637 123 446 167 1 373 2009 1 775 125 399 397 2 695
2008 834 163 592 221 1 809 2008 1 815 134
2010 574 106 391 145 2 718
2011 446 68 256 94 864 2011 1 743 95
1 217 2010 1 793 125 400 399
303 310 2 450
311 318 2 659
2013 367 53 203 74 2 770 695 2013 2 047 97 309 317
2012 416 59 230 83 789 2012 1 934 97
340 344 2 967
2015 262 36 145 51 494 2015 2 218 106 342 345 3 010
2014 303 44 171 61 579 2014 2 177 106
2016 210 31 118 43 2 906lt 單位太焦耳 Unit Terajoule gt lt 單位太焦耳 Unit Terajoule gt
非製造業組別 6 Non-manufacturing Segment6金屬及機械組別 Metal amp Machinery Segment表 34 Table 34 表 36 Table 36
402 2016 2 117 106 337 346
年份Year
工業生產設備 5
Industrial ProcessEquipment 5
照明Lighting
空氣調節Air
Conditioning
其他1
Others1總計Total
年份Year
工業生產設備 5
Industrial ProcessEquipment 5
照明Lighting
空氣調節Air
Conditioning
其他1
Others1總計Total
2006 1 794 114 925 1 376 4 2092006 2 013 588 992 1 035 4 629
2007 1 626 103 837 1 249 3 8152007 1 711 500 850 873 3 935
2008 1 819 105 857 1 475 4 2552008 1 823 488 810 888 4 009
2009 1 729 97 791 1 419 4 0362009 1 764 460 762 843 3 829
2010 1 665 94 761 1 367 3 8882010 1 907 496 819 913 4 135
2011 1 513 65 565 1 360 3 5042011 2 143 509 940 1 346 4 938
2012 1 460 63 544 1 309 3 3772012 2 272 540 985 1 370 5 166
2013 1 452 62 534 1 296 3 3442013 2 246 536 969 1 437 5 188
2014 1 445 62 541 1 290 3 3372014 2 295 547 1 003 1 490 5 334
2015 1 470 63 551 1 312 3 3952015 2 401 571 1 041 1 536 5 549
2016 1 440 61 529 1 282 3 3122016 2 179 522 949 1 430 5 080lt 單位太焦耳 Unit Terajoule gt lt 單位太焦耳 Unit Terajoule gt
49 50
2015 346 4 024 1 349 1 217 2 307 9 242
1 226 1 192 2 476 9 144
3 880 1 344 1 195 2 402 9 2302014 409
14 015
2007 1 682 3 032 2 012 1 882 4 496 13 104
1 232 1 208 2 616 9 356
12 182
1 200 1 255 2 844 9 5302011 619 3 613
2009 1 089 2 799 1 579 1 779 3 896 11 143
2010
2012 553 3 747
2013 489 3 761
951 3 023 1 585 1 714 3 808 11 082
2007 3 295 277 980 236 4 788
1 701 1 926 4 140
1 842 2 080 4 670
2008 1 443 2 971
2006 1 851 3 572
2008 3 051 257 915 231 4 454
35 工業類別所有能源使用按最終用途劃分 All Energy Consumption By End-uses In Industrial Segments
所有工業組別 All Industrial Segments
36 工業類別電力使用按最終用途劃分 Electricity Consumption By End-uses In Industrial Segments
3按最終用途及組別劃分
3By End-uses amp Segments
2006 3 415 290 1 029 251 4 985
圖 21 Graph 21
年份
Year
工業生產設備 5
Industrial ProcessEquipment 5
照明Lighting
空氣調節Air
Conditioning
其他1
Others1總計Total
太焦耳
Terajoule
表 37 Table 37其他工業組別 7 Other Industrial Segments 7
2010 2 800 237 844 213 4 095
2009 2 865 242 863 225 4 196
2012 1 872 166 568 125 2 732
2011 2 030 180 627 140 2 976
2014 1 711 154 520 116 2 501
2013 1 781 158 528 119 2 585
2016 1 568 144 471 110 2 292
2015 1 635 149 502 118 2 404
表 38 Table 38
年份Year
紡織及服裝製品Textile amp
Wearing Apparel
非製造業 6
Non-manufacturing 6
食品及飲品Food amp
Beverage
金屬及機械Metal amp
Machinery
其他工業 7
OtherIndustries 7
總計Total
lt 單位太焦耳 Unit Terajoule gt
2 206 8 709
51 52
lt 單位太焦耳 Unit Terajoule gt
2016 286 3 699 1 339 1 179
0
2 000
4 000
6 000
8 000
10 000
12 000
14 000
16 000
2006 2007 2008 2009 2010 2011 2012 2013 2014 2015 2016
紡織及服裝製品
Textile ampWearing Apparel
非製造業
Non‐manufacturing
食品及飲品
Food ampBeverage
金屬及機械
Metal ampMachinery
其他工業
OtherIndustries
圖 22 Graph 22 紡織及服裝製品組別 Textile amp Wearing Apparel Segment 表 39 Table 39
年份 Year 2016
所有工業能源最終用途 All Industrial Energy End-uses
36 工業類別電力使用按最終用途劃分 Electricity Consumption By End-uses In Industrial Segments
3按最終用途及組別劃分
3By End-uses amp Segments
年份 Year 2006
53
年份Year
工業生產設備 5
Industrial ProcessEquipment 5
照明Lighting
空氣調節Air
Conditioning
其他1
Others1總計Total
2006 604 210 757 279 1 851
2007 547 194 685 255 1 682
1 443
2009 356 123 446 164 1 089
2008 472 163 592 217
951
2011 203 68 256 92 619
2010 312 106 391 142
553
2013 162 53 203 72 489
2012 182 59 230 81
409
2015 114 36 145 50 346
2014 134 44 171 60
286lt 單位太焦耳 Unit Terajoule gt
非製造業組別 6 Non-manufacturing Segment 6 表 40 Table 40
年份Year
工業生產設備 5
Industrial ProcessEquipment 5
照明Lighting
空氣調節Air
Conditioning
其他1
Others1總計Total
2016 94 31 118 42
3 572
2007 893 500 850 788 3 032
2006 1 057 588 992 934
2 971
2009 836 460 762 742 2 799
2008 886 488 810 787
3 023
2011 949 509 940 1 215 3 613
2010 904 496 819 804
3 747
2013 962 536 969 1 295 3 761
2012 993 540 985 1 230
3 880
2015 1 028 571 1 041 1 384 4 024
2014 986 547 1 003 1 345
3 699lt 單位太焦耳 Unit Terajoule gt
54
2016 936 522 949 1 292
工業生產設備
Industrial ProcessEquipment
41 照明
Lighting10
空氣調節
Air Conditioning27
其他
Others22
工業生產設備
Industrial ProcessEquipment
46
照明
Lighting9
空氣調節
Air Conditioning30
其他
Others15
其他工業組別 7 Other Industrial Segments 7表 41 Table 41 表 43 Table 43
年份Year
工業生產設備 5
Industrial ProcessEquipment 5
照明Lighting
空氣調節Air
Conditioning
其他1
Others1總計Total
年份Year
工業生產設備 5
Industrial ProcessEquipment 5
照明Lighting
空氣調節Air
Conditioning
其他1
Others1總計Total
1 029 216 4 670
2007 883 159 509 462 4 4962 012 2007 3 030 277 980 208
2006 808 146 466 423 1 842 2006 3 135 290
915 191 4 140
2009 693 125 399 363 1 579 2009 2 610 242 863 181 3 896
2008 746 134 430 390 1 701 2008 2 777 257
2010 695 125 400 365 3 808
2011 526 95 303 277 1 200 2011 1 904 180
1 585 2010 2 548 237 844 178
627 133 2 844
568 123 2 616
2013 536 97 309 284 2 4761 226 2013 1 674 158 528 116
2012 540 97 311 284 1 232 2012
金屬及機械組別 Metal amp Machinery Segment 表 42 Table 42
1 339 2016 1 484 144 471 108
1 759 166
520 114
2015 592 106 342 309 1 349 2015 1 544 149 502 112
2014
2016 585 106 337 310
1 614 154
2 206lt 單位太焦耳 Unit Terajoule gt lt 單位太焦耳 Unit Terajoule gt
2 402
2 307
590 106 340 308 1 344 2014
2006 810 114 925 231 2 080
年份Year
工業生產設備 5
Industrial ProcessEquipment 5
照明Lighting
空氣調節Air
Conditioning
其他1
Others1總計Total
2008 751 105 857 214 1 926
2007 733 103 837 209 1 882
2010 668 94 761 190 1 714
2009 694 97 791 198 1 779
2012 466 63 544 136 1 208
2011 484 65 565 141 1 255
2014 459 62 541 134 1 195
2013 461 62 534 134 1 192
3按最終用途及組別劃分
3By End-uses amp Segments
食品及飲品組別 Food amp Beverage Segment
36 工業類別電力使用按最終用途劃分 Electricity Consumption By End-uses In Industrial Segments
55 56
lt 單位太焦耳 Unit Terajoule gt
2016 456 61 529 133 1 179
2015 467 63 551 136 1 217
表 45 Table 45
太焦耳Terajoule
年份Year
貨車Goods Vehicle
其他
Others 總計Total
貨運組別 Freight Segments圖 23 Graph 23
3按最終用途及組別劃分
3By End-uses amp Segments
所有運輸組別 All Transport Segments
37 運輸類別所有能源使用按最終用途劃分 All Energy Consumption By End-uses In Transport Segments
32 551 6 601 39 152 0
2007
2006
31 771 6 411 38 182 0
0
2009 28 501 5 424 33 925 0
2008 30 438 5 929 36 367
0
2011 28 010 4 134 32 144 0
2010 28 585 4 744 33 329
0
2013 25 534 3 305 28 839 0
2012 26 941 3 826 30 767
0
2015
0
lt 單位太焦耳 Unit Terajoule gt
2014 25 009 3 264 28 273
24 782 3 269 28 051 0
2016
總計Total
年份Year
貨運Freight
客運Passenger
總計Total
年份Year
巴士Bus
24 721 2 961 27 682
客運組別 Passenger Segments表 44 Table 44 表 46 Table 46
41 57 251 59 96 404
的士Taxi
汽車Car
電單車Motorcycle
鐵路Rail
其他
Others
14 102 17 118 463 2 495 3 973 57 983
4 017 57 251
2007 38 182 40 57 983 60 96 165 2007 19 832
2006 20 301 13 797 16 267 426 2 4442006 39 152
56 718
3 965 58 137
2009 33 925 37 56 718 63 90 643 2009 19 150
2008 18 971 15 142 17 059 480 2 5202008 36 367 38 58 137 62 94 504
37 57 560 63 90 889
13 131 17 449 465 2 523 4 000
13 593 18 879 424 2 609 4 213 58 630
4 124 57 560
2011 32 144 35 58 630 65 90 774 2011 18 911
2010 18 842 13 373 18 247 436 2 5402010 33 329
61 359
4 354 59 656
2013 28 839 32 61 359 68 90 198 2013 19 144
2012 19 128 13 469 19 561 423 2 7222012 30 767 34 59 656 66 90 423
31 61 725 69 89 999
13 319 21 158 406 2 796 4 536
13 039 21 764 448 2 972 4 631 61 195
4 547 61 725
2015 28 051 31 61 195 69 89 245 2015 18 341
2014 18 659 14 133 21 085 426 2 8752014 28 273
57 58
4 636 62 136lt 單位太焦耳 Unit Terajoule gt lt 單位太焦耳 Unit Terajoule gt
此項之最終用途包括船隻及香港內部的航空運輸能源的使用等 End-uses under this heading include marine and internal air transportation energy uses etc
2016 18 918 12 288 22 881 463 2 9512016 27 682 31 62 136 69 89 819
0
10 000
20 000
30 000
40 000
50 000
60 000
70 000
80 000
90 000
100 000
2006 2007 2008 2009 2010 2011 2012 2013 2014 2015 2016
貨運
Freight客運
Passenger
4按燃料及類別劃分
4By Fuels amp Sectors
41 所有能源使用按燃料劃分
All Energy Consumption By Fuels圖 24 Graph 24 圖 25 Graph 25
3按最終用途及組別劃分
3By End-uses amp Segments
所有運輸能源最終用途 All Transport Energy End-uses
37 運輸類別所有能源使用按最終用途劃分 All Energy Consumption By End-uses In Transport Segments
年份 Year 2016 太焦耳Terajoule
表 47 Table 47
年份 Year 2006 年份Year
煤氣及石油氣Town Gas amp
Liquefied Petroleum Gas
油及煤產品Oil amp CoalProducts
電力Electricity
總計Total
2006 48 482 17 87 518 31 145 204 52 281 204 100
2007 48 721 17 86 647 31 147 072 52 282 440 100
52 281 438 100
2009 47 239 17 82 194 29 149 366 54
2008 49 732 18 84 361 30 147 345
278 799 100
2010 49 084 17 81 786 29 150 859 54 281 729 100
2011 49 568 18 81 716 29 151 606 54 282 890 100
54 286 048 100
2013 49 723 17 81 306 29 153 362 54
2012 49 616 17 81 352 28 155 079
284 391 100
2014 50 844 18 80 347 28 158 147 55 289 338 100
2015 48 954 17 80 757 28 158 275 55 287 986 100
59 60
55 289 219 100
lt 單位太焦耳 Unit Terajoule gt
「總熱值」是使用於計算各種氣體燃料的熱含量 Gross caloricfic values are used in calculating the respective heat contents of the gaseous products
2016 49 374 17 81 184 28 158 662
巴士
Bus 21
的士
Taxi14
汽車及電單車
Car amp Motorcycle26
貨車
Goods Vehicle28
鐵路及其他
Rail amp Others12
巴士
Bus 21
的士
Taxi14
汽車及電單車
Car amp Motorcycle17
貨車
Goods Vehicle34
鐵路及其他
Rail amp Others14
0
50 000
100 000
150 000
200 000
250 000
300 000
2006 2007 2008 2009 2010 2011 2012 2013 2014 2015 2016
煤氣及石油氣Town Gas amp Liquefied Petroleum Gas
油及煤產品
Oil amp Coal Products 電力
Electricity
太焦耳Terajoule
太焦耳Terajoule
表 48 Table 48 表 49 Table 49
4按燃料及類別劃分
4By Fuels amp Sectors
43 商業類別按燃料劃分
Commercial Sector By Fuels42 住宅類別按燃料劃分
Residential Sector By Fuels 圖 26 Graph 26 圖 27 Graph 27
煤氣及石油氣Town Gas amp
Liquefied Petroleum Gas
油及煤產品Oil amp CoalProducts
電力Electricity
總計Total
2006 18 476 34 79 0 35 428
年份Year
煤氣及石油氣Town Gas amp
Liquefied Petroleum Gas
油及煤產品Oil amp CoalProducts
電力Electricity
總計Total
年份Year
4 936 4 93 317 83 111 884 10066 53 982 100 2006 13 631 12
83 113 914 10067 54 717 100 2007 13 888 12
2008 18 708 33 41 0 37 100
4 975 4 95 0512007 18 238 33 57 0 36 422
4 739 4 95 543 84 113 753 10066 55 849 100 2008 13 471 12
85 114 297 10068 57 731 100 2009 12 815 11
2010 19 038 33 13 0 39 344
4 753 4 96 7282009 18 736 32 23 0 38 972
4 526 4 97 894 84 116 391 10067 58 396 100 2010 13 971 12
84 118 558 10068 58 826 100 2011 14 161 12
2012 18 736 31 8 0 41 189
4 803 4 99 5942011 18 946 32 8 0 39 872
4 769 4 101 813 84 120 970 10069 59 932 100 2012 14 388 12
84 121 215 10068 58 394 100 2013 14 709 12
2014 18 487 30 8 0 43 415
5 026 4 101 4802013 18 446 32 8 0 39 941
5 156 4 102 627 84 122 711 10070 61 910 100 2014 14 928 12
84 123 674 10070 60 214 100 2015 14 795 12
2016 18 311 30 8 0 43 120
5 186 4 103 6932015 17 838 30 8 0 42 368
5 164 4 103 881 84 123 969 10070 61 439 100 2016 14 924 12lt 單位太焦耳 Unit Terajoule gt lt 單位太焦耳 Unit Terajoule gt
「總熱值」是使用於計算各種氣體燃料的熱含量 Gross caloricfic values are used in calculating the respective heat contents of the gaseous products
「總熱值」是使用於計算各種氣體燃料的熱含量 Gross caloricfic values are used in calculating the respective heat contents of the gaseous products
61 62
0
10 000
20 000
30 000
40 000
50 000
60 000
70 000
2006 2007 2008 2009 2010 2011 2012 2013 2014 2015 2016
煤氣及石油氣Town Gas amp Liquefied Petroleum Gas
油及煤產品
Oil amp Coal Products 電力
Electricity
0
20 000
40 000
60 000
80 000
100 000
120 000
140 000
2006 2007 2008 2009 2010 2011 2012 2013 2014 2015 2016煤氣及石油氣Town Gas amp Liquefied Petroleum Gas
油及煤產品
Oil amp Coal Products 電力
Electricity
太焦耳Terajoule
太焦耳Terajoule
表 50 Table 50 表 51 Table 51
4按燃料及類別劃分
4By Fuels amp Sectors
45 運輸類別按燃料劃分
Transport Sector By Fuels44 工業類別按燃料劃分
Industrial Sector By Fuels 圖 28 Graph 28 圖 29 Graph 29
煤氣及石油氣Town Gas amp
Liquefied Petroleum Gas
油及煤產品Oil amp CoalProducts
電力Electricity
總計Total
2006 926 5 3 994 21 14 015
年份Year
煤氣及石油氣Town Gas amp
Liquefied Petroleum Gas
油及煤產品Oil amp CoalProducts
電力Electricity
總計Total
年份Year
78 510 81 2 444 3 96 404 10074 18 934 100 2006 15 450 16
3 96 165 10074 17 645 100 2007 15 678 16
2008 927 5 4 223 24 12 182
77 992 81 2 4952007 917 5 3 623 21 13 104
75 358 80 2 520 3 94 504 10070 17 332 100 2008 16 627 18
3 90 643 10069 16 129 100 2009 14 765 16
2010 937 6 4 035 25 11 082
73 355 81 2 5232009 923 6 4 063 25 11 143
73 213 81 2 540 3 90 889 10069 16 053 100 2010 15 137 17
3 90 774 10065 14 732 100 2011 15 506 17
2012 1 108 8 4 259 29 9 356
72 659 80 2 6092011 956 6 4 246 29 9 530
72 317 80 2 722 3 90 423 10064 14 723 100 2012 15 384 17
3 90 198 10063 14 583 100 2013 15 348 17
2014 1 244 8 4 244 29 9 230
72 054 80 2 7962013 1 220 8 4 218 29 9 144
70 939 79 2 875 3 89 999 10063 14 718 100 2014 16 185 18
3 89 245 10062 14 853 100 2015 15 048 17
2016 1 171 8 4 112 29 8 709
71 225 80 2 9722015 1 272 9 4 339 29 9 242
71 900 80 2 951 3 89 819 10062 13 992 100 2016 14 967 17lt 單位太焦耳 Unit Terajoule gt lt 單位太焦耳 Unit Terajoule gt
「總熱值」是使用於計算各種氣體燃料的熱含量 Gross caloricfic values are used in calculating the respective heat contents of the gaseous products
「總熱值」是使用於計算各種氣體燃料的熱含量 Gross caloricfic values are used in calculating the respective heat contents of the gaseous products
63 64
0
2 000
4 000
6 000
8 000
10 000
12 000
14 000
16 000
18 000
20 000
2006 2007 2008 2009 2010 2011 2012 2013 2014 2015 2016煤氣及石油氣Town Gas amp Liquefied Petroleum Gas
油及煤產品
Oil amp Coal Products電力
Electricity
0
10 000
20 000
30 000
40 000
50 000
60 000
70 000
80 000
90 000
100 000
2006 2007 2008 2009 2010 2011 2012 2013 2014 2015 2016煤氣及石油氣Town Gas amp Liquefied Petroleum Gas
油及煤產品
Oil amp Coal Products電力
Electricity
47 890 281 204
2007
20 301 13 797 16 267 426
2 506 10 158 49 197 282 440 14 102
46 5022006
19 832
16 465
17 071
5按最終用途及燃料劃分
5By End-uses amp Fuels
51 所有能源使用按最終用途劃分
All Energy Consumption By End-uses
2 454 10 413
15 142 17 059 480
2 529 9 228
7 918 31 836 12 776 32 551 21 608
51 487 278 799 13 131
17 118 463
17 449 465
2008
8 672 52 019 281 729
19 150
2 527 9 680 50 117 281 438
2009
18 971
8 496
9 121
9 244 19 199
2011
18 842 13 373 18 247 436
2 609 8 245 56 161 282 890 13 593 18 879 31 989 14 187 28 010
2012
2013
19 128
2 542
2 722 8 077 58 650 286 048 13 469 19 561 423
424
2010
18 911
19 144
9 213
8 536
8 319
8 199
19 563
19 314
19 662
19 655 44 243 14 181
14 197
13 708
2 796 7 739 58 100 284 391 13 319 21 158 406
2 875 7 705 58 273 289 338
25 534
2015
18 659 14 133 21 085 426
2 972 7 792 58 218 287 986 13 039 21 764 448
2014 25 009
24 782
8 607
8 717
19 609
19 774
48 746
48 466 18 341
2 951 7 474 59 374 289 219
51 所有能源使用按最終用途劃分 All Energy Consumption By End-uses 圖 30 Graph 30
18 918 12 288 22 881 4632016lt 單位太焦耳 Unit Terajoule gt
14 227 24 721 8 562 17 798 47 938 31 785 19 839
年份 Year 2016 年份 Year 2006
65 66
31 989
31 837
31 402
17 734
17 173
17 413
17 117
17 352
17 927
18 177
18 565
14 111 26 941
45 298
43 392
44 117
45 511
44 914
45 861
20 372
18 965
32 885
34 023
33 302
33 379
13 172
13 788
13 824
13 936
31 771
30 438
28 501
28 585
31 772
表 52 Table 52
年份Year
空氣調節Air
Conditioning
工業生產設備5
IndustrialProcessEquipment5
照明Lighting
冷凍Refrigeration
巴士Bus
的士Taxi
汽車Car
電單車Motorcycle
鐵路Rail
船隻Marine
其他1
Others1總計Total
貨車GoodsVehicle
煮食Cooking
熱水Hot Water
空氣調節
AirConditioning
17
煮食
Cooking11
工業生產設備
Industrial ProcessEquipment
6照明
Lighting7
冷凍
Refrigeration3
熱水
Hot Water 5
貨車
GoodsVehicle
9
巴士
Bus 6
的士
Taxi4
汽車及電單車
Car amp Motorcycle8
鐵路
Rail1
船隻
Marine 3
其他
Others20
空氣調節
AirConditioning
17
煮食
Cooking11
工業生產設備
Industrial ProcessEquipment
6照明
Lighting8
冷凍
Refrigeration3
熱水
Hot Water 4貨車
GoodsVehicle12
巴士
Bus 7
的士
Taxi5
汽車及電單車
Car amp Motorcycle6
鐵路
Rail1
船隻
Marine 4
其他
Others17
2006 46 502 21 608 7 918
5按最終用途及燃料劃分
5By End-uses amp Fuels
52 電力使用按最終用途劃分
Electricity Consumption By End-uses 表 53 Table 53
4 191 11 105 2 444 33 317 145 204
年份Year
空氣調節Air Conditioning
照明Lighting
冷凍Refrigeration
熱水Hot Water
辦公室設備Office Equipment
鐵路Rail
工業生產設備5
IndustrialProcessEquipment5
其他1
Others1總計Total
煮食Cooking
2007 45 298 20 372 8 496
5 373 11 246 2 520 35 477 147 345
4 809 11 171 2 495 34 776 147 072
2010 45 511 19 563 9 213
2009 44 117 19 199 9 244
2008 43 392 18 965 9 121
11 0612012 45 861 19 662 8 319
2011 44 914 19 314 8 536 9 201
9 131
10 738
4 715 13 200 2 722 40 408 155 079
4 945 12 615 2 609 38 732 151 606
11 412
11 3312014 48 746 19 609 8 607
2013 44 243 19 655 8 199 9 280
9 415 4 854 13 344 2 875 39 367 158 147
4 904 13 407 2 796 39 466 153 362
2016 47 938 19 839 8 562
2015 48 466 19 774 8 717 11 344 9 553
13 513 2 951 40 363 158 662 11 528 9 044
4 624 13 212 2 972 39 615 158 275
35 815
67 68
150 859
36 644 149 366
9 048
9 722
10 320
9 926
lt 單位太焦耳 Unit Terajoule gt
52 電力使用按最終用途劃分 Electricity Consumption By End-uses 圖 31 Graph 31
年份 Year 2016 年份 Year 2006
4 923
10 016
9 073
9 934
10 929
10 959
11 430 5 015 11 758 2 540
5 274 11 480 2 523
空氣調節Air
Conditioning 30
照明Lighting
13
冷凍Refrigeration
5
工業生產設備Industrial Process
Equipment6
煮食Cooking
7
熱水Hot Water
3辦公室設備
Office Equipment9
鐵路Rail2
其他Others25
空氣調節Air
Conditioning 32
照明Lighting
15
冷凍Refrigeration
5
工業生產設備Industrial Process
Equipment6
煮食Cooking
6
熱水Hot Water
3辦公室設備
Office Equipment8
鐵路Rail2
其他Others23
年份Year
貨車Goods Vehicle
巴士Bus
的士Taxi
5按最終用途及燃料劃分
5By End-uses amp Fuels
53 油及煤產品使用按最終用途劃分
Oil amp Coal Products Consumption By End-uses 表 54 Table 54
汽車Car
電單車Motorcycle
工業生產設備5
Industrial ProcessEquipment5
船隻Marine
其他1
Others1總計Total
87 518
2007 31 770 18 254 2 17 117 463 6 448 10 158 2 434 86 647
2006 32 551 18 647 2 16 266 426 6 508 10 413 2 705
84 361
2009 28 501 17 514 2 17 448 465 6 341 9 228 2 695 82 194
2008 30 438 17 485 2 17 059 480 6 503 9 680 2 713
81 786
2011 28 010 16 997 1 18 879 424 6 926 8 245 2 234 81 716
2010 28 585 17 077 1 18 247 436 6 423 8 672 2 346
81 352
2013 25 534 17 114 1 21 158 406 7 386 7 739 1 969 81 306
2012 26 941 17 212 1 19 560 423 7 074 8 077 2 064
80 347
2015 24 782 16 331 1 21 764 448
7 553 7 474 1 854 81 184
2014 25 009 16 607 1 21 085 426 7 458 7 705 2 056
lt 單位太焦耳 Unit Terajoule gt
53 油及煤產品使用按最終用途劃分
Oil amp Coal Products Consumption By End-uses 圖 32 Graph 32
7 688 7 792 1 953 80 757
2016 24 721 16 239 lt1 22 881 463
年份 Year 2016 年份 Year 2006
69 70
貨車GoodsVehicle31
巴士及的士Bus amp Taxi
20
汽車及電單車Car amp Motorcycle
29
工業生產設備Industrial Process
Equipment9
船隻Marine
9其他
Others2
貨車GoodsVehicle37
巴士及的士Bus amp Taxi
21
汽車及電單車Car amp Motorcycle
19
工業生產設備Industrial Process
Equipment8
船隻Marine
12其他
Others3
年份Year
煮食Cooking
熱水Hot Water
運輸Transport
其他1
Others1總計Total
5按最終用途及燃料劃分
5By End-uses amp Fuels
54 煤氣及石油氣使用按最終用途劃分
Town Gas amp Liquefied Petroleum Gas Consumption By End-uses 表 55 Table 55
2007 22 021 8 363 15 678 2 659 48 721
2006 21 741 8 585 15 450 2 706 48 482
2009 21 390 8 550 14 765 2 534 47 239
2008 22 220 8 415 16 627 2 472 49 732
2011 20 749 9 242 15 506 4 072 49 568
2010 21 244 8 921 15 137 3 782 49 084
2013 20 222 9 277 15 348 4 876 49 723
2012 20 330 9 396 15 384 4 506 49 616
2015 19 767 9 085 15 048 5 054 48 954
2014 20 194 9 342 16 185 5 123 50 844
lt 單位太焦耳 Unit Terajoule gt
54 煤氣及石油氣使用按最終用途劃分 Town Gas amp Liquefied Petroleum Gas Consumption By End-uses 圖 33 Graph 33
年份 Year 2016 年份 Year 2006
2016 19 990 9 304 14 967 5 113 49 374
「總熱值」是使用於計算各種氣體燃料的熱含量 Gross caloricfic values are used in calculating the respective heat contents of the gaseous products
71 72
煮食Cooking
41
熱水Hot Water
19
運輸Transport
30
其他Others10
煮食Cooking
45
熱水Hot Water
18運輸
Transport32
其他Others
5
6 根據已更新的可再生能源數據相關的2010年至2011年能源最終用途數據已在
2013年版中作出修訂[2013年版修訂]The energy end-use data from 2010 to 2011 were revised in the 2013 Edition basedon the latest update of the renewable energy data (Revised in 2013 Edition)
3 根據運輸能源消耗調查所得的數據有關2008年至2012年的能源最終用途數據已
在2015年版中作出修訂[2015年版修訂]The energy end-use data from year 2008 to 2012 were revised in the 2015 Editionbased on the findings of energy consumption survey on the Transport Sector(Revised in 2015 Edition)
4 自2014年版起新的「住宿」「醫療」和「教育」組別已由「其他商業」組別
分拆出來「其他商業」組別因而相應地縮小[2014年版修訂]The Accommodation Human Health and Education Segments weresegregated from the Other Commercial Segment as new segments in the 2014Edition Hence the size of the Other Commercial Segment is accordingly reduced(Revised in 2014 Edition)
5 自2014年版起燃料的熱含量均以「總熱值」計算因而自2002年後的能源數據
均已採用「總熱值」作出計算[2014年版修訂]Since the 2014 Edition Gross Calorific Values are used for calculating the heatcontents of fuels Gross Calorific Values are hence used in computing energy datafrom 2002 onwards (Revised in 2014 Edition)
1 由於資料所限能源數據不能再分拆成其他最終用途數據「其他」的最終用途包
括沒有被列在表上的最終用途
2 自2013年後「空氣調節」「冷凍」「工業生產設備」及「熱水」的能源最終
用途數據已採用「氣溫因素」作出修訂[2017年版修訂]The energy end-use data of Air Conditioning Refrigeration IndustrialProcessEquipment and Hot Water are revised by Temperature Factor fromyear 2013 onwards (Revised in 2017 Edition)
Due to data limitations energy data could not further be broken down into other end-uses The ldquoOthersrdquo end-use includes the end-uses not elsewhere listed in the table
2 「房委會資助出售單位」組別前稱為「居屋計劃」組別
1 根據零售組別能源消耗調查所得的數據有關2011年至2014年的能源最終用途數
據已在2017年版中作出修訂[2017年版修訂]The energy end-use data from year 2011 to 2014 were revised in the 2017 Editionbased on the findings of energy consumption survey on the Retail Segment(Revised in 2017 Edition)
6Notes 7Chronology of Major Revisions7主要修訂年表6註釋
3 「其他房屋」組別包括別墅平房及類似屋宇
The ldquoOther Housingrdquo Segment includes villas bungalows and the like
4 「熱水及冷凍」的最終用途包括鍋爐器材及其他生產加熱和冷凍的設備
The ldquo Non-manufacturing rdquo Segment includes construction and other miscellaneousnon-manufacturing industrial activities
The ldquoHousing Authority Subsidized Sale Flatsrdquo Segment was previously called ldquoHomeOwnershiprdquo Segment
The ldquo Hot Water amp Refrigeration rdquo end-use includes boiling equipments and otherprocess heating and cooling facilities
「工業生產設備」的最終用途包括鍋爐設備及其他生產加熱和冷凍設備的使用
The ldquoOther Industrialrdquo Segment includes electronics paper printing plastic and othermiscellaneous industrial activities
73
The ldquo GDP in chained dollars rdquo were revised based on latest data published by theCensus and Statisics Department
8 ldquo本地生產總值環比物量計算rdquo己根據政府統計處最新數據作出修訂
74
7 「其他工業」組別包括電子紙張印刷塑膠及其他雜項工業活動
The ldquo Industrial ProcessEquipment rdquo end-use includes boiler plants and other processheating and cooling facilities
6 「非製造業」組別包括建造及其他非製造業之雜項工業活動
5
7主要修訂年表
13 自2010年起「電力」包括燃煤天然氣風能及太陽能所產生的電能[2012年版修訂]ldquoElectricityrdquoincludes the electricity generated from coal natural gas wind and solarpower since 2010 (Revised in 2012 Edition)
14 根據工業能源消耗調查所得的數據有關2000年至2010年的能源最終用途數據已
在2012年版中作出修訂[2012年版修訂]The energy end-use data from year 2000 to 2010 were revised in the 2012 Editionbased on the findings of energy consumption survey on the Industrial Sector(Revised in 2012 Edition)
自2013年版起「煮食」之能源最終用途除已包括煮食爐及飯煲外再加上在廚房
普遍用作製造及準備食物的器具例如煮食用水加熱設備電焗爐及微波爐等
自2001年後的「煮食」之能源最終用途數據均作出修訂[2013年版修訂]The ldquo Cooking rdquo energy end-use was revised in the 2013 Edition to include foodmaking and preparation appliances normally found in kitchens in addition to stovesand rice cookers Examples of the appliances are hot water for cooking purposeselectric ovens and microwave ovens etc The ldquoCookingrdquo energy end-use data since2001 were hence updated (Revised in 2013 Edition)
自2011年「商業」及「工業」類別的分類已經根據香港標準行業分類20版作出
修訂這修訂包括將個人服務活動(例如夜總會卡拉OK電腦及通訊設施維
修家居用品維修車輛維修服務藝術表演或創作活動及出版服務)由以往的
「食肆」「其他商業」組別或「工業」類別重置到現時的「零售」組別其同
時涵蓋零售及個人服務活動[2013年版修訂]The ldquoCommercialrdquo and ldquoIndustrialldquo Sectors were re-categorized in 2011 to alignwith the Hong Kong Standard Industrial Classification (HSIC) Version 20Examples of such changes are the relocations of personal service activities (such asnight clubs karaokes computer and communication repair household goodsrepair motor vehicle repair services art performance or creation activities andpublishing services etc) from the previous ldquo Restaurant ldquo Other CommercialSegments or the rdquoIndustrialrdquo Sector to the present ldquoRetailrdquo Segment which nowembraces both retail and personal service activities (Revised in 2013 Edition)
12 自2010年的能源最終用途數據包括可再生能源數據[2012年版修訂]The energy end-use data from 2010 includes renewable energy data(Revised in 2012 Edition)
11
75 76
7Chronology of Major Revisions
8 自2013年版起「空氣調節」之能源最終用途除已包括冷氣設備及暖氣機外再加
上風扇空氣清新或淨化器及抽濕機 自2001年後的「空氣調節」之能源最終用
途數據均作出修訂[2013年版修訂]The ldquoAir Conditioningrdquo energy end-use was revised in the 2013 Edition to includefans air cleanerpurifiers and dehumidifiers in addition to air conditioning unitsand heaters The ldquoAir Conditioningrdquo energy end-use data since 2001 were henceupdated (Revised in 2013 Edition)
9 自2013年版起「辦公室設備」之能源最終用途除已包括電腦及影印機外再加上
視聽器材碎紙機傳真及收銀機自2001年後的「辦公室設備」之能源最終用
途數據均作出修訂[2013年版修訂]The ldquoOffice Equipmentrdquo energy end-use was revised in the 2013 Edition to includeaudio visual equipments shredders fax and cashier machines etc in addition tocomputers and photocopiers The ldquoOffice Equipmentrdquo energy end-use data since2001 were hence updated (Revised in 2013 Edition)
10 根據住宅能源消耗調查所得的數據有關2009年至2011年的能源最終用途數據已
在2013年版中作出修訂[2013年版修訂]The energy end-use data from year 2009 to 2011 were revised in the 2013 Editionbased on the findings of energy consumption survey on the Residential Sector(Revised in 2013 Edition)
15 根據政府統計處公佈的人口及家庭住戶統計修訂數字有關2007至2010年的能源
最終用途數據己在2012年版中作出相應的修訂[2012年版修訂]The energy end-use data from years 2007 to 2010 were revised in the 2012 Editionbased on the revised population and domestic household data published by theCensus and Statistics Department (Revised in 2012 Edition)
7
17 根據政府統計處公佈的家庭住戶統計修訂數字有關2001至2006年的能源最終用
途數據己在2009年版中作出修訂[2009年版修訂]The energy end-use data from years 2001 to 2006 were revised in the 2009 Editionbased on the revised domestic household data published by the Census and StatisticsDepartment (Revised in 2009 Edition)
18 自2006年起「鐵路」之能源最終用途再不包括鐵路車站等建築物使用的電量
[2008年版修訂]The ldquoRailrdquo energy end-use do not include electricity consumption at railway stationsfrom 2006 onwards (Revised in 2008 Edition)
16 根據商業及運輸能源消耗調查所得的數據有關2003年至2007年的能源最終用途
數據已在2010年版中作出修訂[2010年版修訂]The energy end-use data from year 2003 to 2007 were revised in the 2010 Editionbased on the findings of energy consumption survey on the Commercial andTransport Sectors (Revised in 2010 Edition)
7Chronology of Major Revisions 8Units of Measurement7主要修訂年表 8計量單位
1 太焦耳 = 1012 焦耳 1 terajoule (TJ) = 1012 joules
1 千兆焦耳 = 109 焦耳 1 gigajoule (GJ) = 109 joules
1 百萬焦耳 = 106 焦耳 1 megajoule (MJ) = 106 joules
77 78
1 千兆瓦小時 = 36 x 1012 焦耳 1 gigawatt hour (GWh) = 36 x 1012 joules
1 兆瓦小時 = 36 x 109 焦耳 1 megawatt hour (MWh) = 36 x 109 joules
1 千瓦小時 = 36 x 106 焦耳 1 kilowatt hour (kWh) = 36 x 106 joules
網址 httpwwwemsdgovhk電郵 energydataemsdgovhk
79 80
Enquiries about this publication can be directed to
The Energy Efficiency OfficeElectrical amp Mechanical Services Department
7F 3 Kai Shing Street Kowloon Bay Hong Kong
Tel No (852) 2808 3465Fax No (852) 2890 6081
Homepage httpwwwemsdgovhkE-mail energydataemsdgovhk
Set of Hong Kong Energy End-use Data can be downloadedfrom EMSD website
httpswwwemsdgovhkenenergy_efficiencyenergy_end_use_data_and_consumption_indicatorshong_kong_energy_end_use_datadataindexhtml
有關本刊物的查詢請聯絡
機電工程署
香港九龍灣啟成街3號7樓
能源效益事務處 httpswwwemsdgovhktcenergy_efficiencyenergy_end_use_data_and_consumption_indicatorshong_kong_energy_end_use_datadataindexhtml
香港能源最終用途數據收錄之數據可在機電工程署網站下載
電話(852) 2808 3465圖文傳真(852) 2890 6081

100
100
100
100
100
100
100
100
100
100
100
100
100
100
100
100
100
100
100
100
25 26
30 49 374lt 單位太焦耳 Unit Terajoule gt lt 單位太焦耳 Unit Terajoule gt
37 14 9240 5 164 2 14 9675 71 900 89
「總熱值」是使用於計算各種氣體燃料的熱含量 Gross caloricfic values are used in calculating the respective heat contents of the gaseous products
2014 8
6 4 112
30 1 272
30 1 1712016 8 81 184 2016 18 311
2015 8 0 88 80 757 2015 17 838 36 14 795
0 5 156
5 186 6 4 339 5 71 225
18 487 32
3 15 048 31
6 4 244 5 70 939 88 80 347 2014 2 16 185
48 954
14 709 2 15 348 3130 1 220
36 14 928 29 1 244
49 723
50 844
89 81 352 2012 18 736
18 446 372013 8 0 5 026 6 4 218 89 81 306 20135 72 054
2011 18 946 38 14 161
49 084
2012 8 0 4 769 6 4 259 31 49 61614 388 29 1 108 2 15 384
2010 13
29
385 72 317
33 49 73213 471 27 927 2 16 627
47 239
31 49 5682011 8 0 4 803 6 4 246 5 72 659
0 4 526 6 4 035 5 73 213
89 81 716
18 736 40 12 815 2 14 765 3127 923
39 13 971 28 937 31
15 506
2 15 13790
956 2
81 786 2010 19 038
2008 41 0 4 739 6 4 223
5 73 355
385 75 358 89 84 361 2008 18 708
2009 23 0 4 753 6 4 063 89 82 194 2009
9265 78 510 90 87 518
2007 18 238 37 13 888100
282006 79
29 917 2
3 994
年份Year
2006
總計Total
2007 57 0 4 975 6 3 623
住宅Residential
商業Commercial
工業Industrial
年份Year
住宅Residential
商業Commercial
工業Industrial
運輸Transport
100
2By Sectors amp Fuels
23 油及煤產品使用按類別劃分
Oil amp Coal Products Consumption By Sectors24 煤氣及石油氣使用按類別劃分 Town Gas amp LPG Consumption By Sectors圖 9 Graph 9 圖 10 Graph 10
表 4 Table 4 表 5 Table 5
太焦耳Terajoule
太焦耳Terajoule
2按類別及燃料劃分
總計Total
0 4 936 6
32 48 72190 86 647
運輸Transport
32 48 4822 15 45018 476
15 6784 77 992
38 13 631
0
10 000
20 000
30 000
40 000
50 000
60 000
70 000
80 000
90 000
2006 2007 2008 2009 2010 2011 2012 2013 2014 2015 2016
住宅
Residential商業
Commercial工業
Industrial運輸
Transport
0
5 000
10 000
15 000
20 000
25 000
30 000
35 000
40 000
45 000
50 000
2006 2007 2008 2009 2010 2011 2012 2013 2014 2015 2016住宅
Residential商業
Commercial工業
Industrial運輸
Transport
3按最終用途及組別劃分
3By End-uses amp Segments
所有住宅組別 All Residential Segments
31 住宅組別所有能源使用按最終用途劃分 All Energy Consumption By End-uses In Residential Segments
27
17 052 29 125 9 711
2016
2010
2009
2012
2011 16 418
10 028
28
所有住宅能源最終用途 All Residential Energy End-uses圖 11 Graph 11 圖 12 Graph 12
其他房屋 3
Other Housing 3
4 038
年份 Year 2016
表 6 Table 6
年份 Year 2006
太焦耳Terajoule
年份Year
公共房屋Public
Housing
私人房屋Private
Housing
房委會
資助出售單位 2
HA SubsidizedSale Flats 2
2007
61 910
57 731
53 982
58 396
58 826
59 932
58 394
lt 單位太焦耳 Unit Terajoule gt
61 439
2015 60 214
3 904
17 364 30 4802014
2013 16 614 28 407 9 470
29 117 9 662 3 629
16 844 29 268 9 804 4 016
2006
總計Total
2008
54 717
55 849
15 489 26 211 9 478 2 805
15 521 26 733 9 664 2 799
4 326
17 395 30 284 9 682 4 078
3 430
15 451 27 701 10 082 2 616
15 915
16 152
28 544 10 153 3 119
28 730 10 084
0
10 000
20 000
30 000
40 000
50 000
60 000
70 000
2006 2007 2008 2009 2010 2011 2012 2013 2014 2015 2016公共房屋
Public Housing私人房屋
Private Housing房委會資助出售單位
HA Subsidized Sale Flats 其他房屋
Other Housing
煮食
Cooking 26
空氣調節
Air Conditioning 22
熱水
Hot Water 20
照明
Lighting8
冷凍
Refrigeration 11
辦公室設備
Office Equipment9
其他
Others4
煮食
Cooking 24
空氣調節
Air Conditioning 25
熱水
Hot Water 18
照明
Lighting6冷凍
Refrigeration 9
辦公室設備
Office Equipment11
其他
Others7
1 408 529 318 375 272
1 012 561 284 343 171
1 412 527 307
364
1 159 557
1 128 554 311 347 210
3按最終用途及組別劃分
3By End-uses amp Segments
公共房屋組別 Public Housing Segment
31 住宅組別所有能源使用按最終用途劃分 All Energy Consumption By End-uses In Residential Segments
329
698 493 193
765 532 226
2 288 1 902 495 838
2 428 1 961 506 864
700 915
841
3 544
空氣調節Air
Conditioning
3 629
356
3 119
4 078
1 517
1 291 565 347 359 266 4 016 337
544 331 412 283 4 326
277 3 904
246
365 263 4 038
296
104 2 799
285 101 2 616 212
217 298
3 430 270
137
693 9 6821 133
791 545 249 294 102 2 805 211
熱水Hot
Water
照明Lighting
冷凍Refrigeration
辦公室
設備Office
Equipment
其他 1
Others 1總計Total
lt 單位太焦耳 Unit Terajoule gt
708 10 028
1 172
2 354 1 886 488 873 682 9 7111 115
1 014
519 10 084
2 163 1 949
1 896 1 954 513 816 717 9 470
585 857 567 9 6621 025
2 162 1 978 561 838 678 9 8041 127
2 302
401 9 664 909
2 216 1 992 673 940 418 10 082 977
2 190 1 927
冷凍Refrigeration
辦公室
設備Office
Equipment
其他 1
Others 1總計Total
2 157 1 976 725 886 385 9 478 844
熱水Hot
Water
563
2009
2 504
年份Year
煮食Cooking
1 977
589
照明Lighting
671
599 2008
2006
15 451
15 915
2007
2 761
2 867
2 621
676
2016 2 333
1 158
1 029
2011 2 515
2010 2 685 2 285 1 995 645 926
2012 2 459
955 468 10 153
873
1 811
2 403 945 1 777 1 044
925 1 822 1 022
959 1 788 1 878lt 單位太焦耳 Unit Terajoule gt
2015
723
1 851
1 059
照明Lighting
冷凍Refrigeration
辦公室
設備Office
Equipment
其他 1
Others 1
2012 8513 099
995
4 677
2013 4 800
2012 4 787 3 029 970 1 725
1 058
3 415 3 544
3 374
1 8762 691 3 552 958 1 679 16 614
17 364
17 052
29 117
3 421
2016 6 642
2 815
2016 4 809
3 101 1 002 27 7012 646
6 686
3 344 3 558
2015 6 341 3 048
7 201 5 256
2012 6 744
8 425 5 108 2 084
2015
2 764
6 176 5 104
2008
17 395
總計Total
2010 7 172
2009
2 148 898 2006
煮食Cooking
空氣調節Air
Conditioning
熱水Hot
Water
26 7332 4692 100 2 962 948
6 240 5 323 2 055
875
2014 4 789
5 094 2 107 8263 229 20162 848 2 167 30 284
2 155 28 407
7 364 5 101 2 208 2 743 2 008 29 268
2 204
2014
2007 6 974
2010
29 30
房委會資助出售單位組別 2
Housing Authority Subsidized Sale Flats Segment 2
年份Year
350lt 單位太焦耳 Unit Terajoule gt lt 單位太焦耳 Unit Terajoule gt
8 197
323 3583 212 20132013 6 676 6 507 5 094 2 097 2 665
3383 193 2014 827
2007
2 841 2 143 30 480
8 076 4 782 1 990 2 842 2 046 29 125
1 606
886 547 2502009 7 232
2011 7822011 7 014
6 740 5 344 2 167 3 134 1 164
6 949 5 279 2 178 3 003 1 333 28 730
28 544
2 9452 891
790
16 4182 931 3 564 942
6342008 7 334
657
2 314
2014
2013 2 402
61426 2112006 6 828 2 311
年份Year
煮食Cooking
6 122 5 074 2 830
2015
16 844
表 7 Table 7
2006
1 505
2010 4 661
2 620 3 567 952
2 849
2 870 3 557 947 1 818 742
冷凍Refrigeration
辦公室
設備Office
Equipment
其他 1
Others 1總計Total
1 825
1 367 15 489
16 152
15 521
煮食Cooking
空氣調節Air
Conditioning
熱水Hot
Water
照明Lighting
1 6421 763
1 558
1 794
2 773 3 509
2 801 3 566
3 5094 396 1 035 1 770
1 009 1 826
963 1 863
表 9 Table 9
私人房屋組別 Private Housing Segment 其他房屋組別 3 Other Housing Segment 3表 8 Table 8 表 10 Table 10
年份Year
空氣調節Air
Conditioning
1 421
2009 4 546
1 414
2008 4 467
2007 4 402
2011 4 735
fz234
太焦耳Terajoule
所有住宅能源最終用途 All Residential Energy End-uses圖 13 Graph 13
3按最終用途及組別劃分
3By End-uses amp Segments
所有住宅組別 All Residential Segments
32 住宅組別電力使用按最終用途劃分 Electricity Consumption By End-uses In Residential Segments
圖 14 Graph 14
年份 Year 2016
表 11 Table 11
35 428
總計Total
年份 Year 2006
2006
年份Year
公共房屋
PublicHousing
私人房屋Private
Housing
房委會
資助出售單位 2
HA SubsidizedSale Flats 2
其他房屋 3
Other Housing 3
9 442 5 73318 016
38 972
2010 39 344
2009
9 615
9 514
9 979
36 422
2008 37 100
2007 18 615
19 277
20 160
20 28210 100
39 872
2012 41 189
2011 5 932 2 932
6 068 3 253
20 739
21 195
10 269
10 674
39 941
2014 43 415
2013 5 810 3 159
6 351 3 334
20 500
22 522
10 473
11 209
lt 單位太焦耳 Unit Terajoule gt
31 32
11 036
11 220
21 575
22 393
6 168 3 588
6 117 3 390
42 368
2016
2015
43 120
6 333 2 500
6 234 2 727
2 236
5 972 2 220
6 222 2 088
0
5 000
10 000
15 000
20 000
25 000
30 000
35 000
40 000
45 000
2006 2007 2008 2009 2010 2011 2012 2013 2014 2015 2016
公共房屋
Public Housing私人房屋
Private Housing房委會資助出售單位
HA Subsidized Sale Flats 其他房屋
Other Housing
煮食Cooking
9
空氣調節Air Conditioning
35
熱水Hot Water
8 照明Lighting
9
冷凍Refrigeration
14
辦公室設備Office
Equipment15
其他Others10
煮食Cooking
9
空氣調節Air Conditioning
34
熱水Hot Water
11 照明Lighting
12
冷凍Refrigeration
16辦公室設備Office
Equipment13
其他Others
5
3按最終用途及組別劃分
3By End-uses amp Segments
公共房屋組別 Public Housing Segment
32 住宅組別電力使用按最終用途劃分 Electricity Consumption By End-uses In Residential Segments
350 272 3 3902016 1 882 8 197 1 965 2 107 2 848 3 229 2 166 22 393
2014 1 861 8 425 1 976 2 084 2 841
2015 1 777 8 076 1 797
lt 單位太焦耳 Unit Terajoule gt lt 單位太焦耳 Unit Terajoule gt
33 34
3 048 2 045 21 575 2015 323 1 517 359 331 412 364 283 3 588
2016 311 1 408 357 318 375
1 990 2 842
338 263 3 3343 193 2 142 22 522 2014 300 1 412 350 307 365
3 212 2 155 20 500 2013 316 1 159 370 323 358 356 277 3 159
347 3592012 1 847 7 364 1 925 2 208 2 743
2013 1 872 6 507 1 993 2 097 2 665
337 266 3 2533 099 2 007 21 195 2012 304 1 291 349
2 945 1 604 20 739 2011 267 1 128 373 311 347 296 210 2 932
284 3432010 1 779 6 949 2 228 2 178 3 003
2011 1 808 7 201 2 086 2 204 2 891
270 171 2 7272 815 1 330 20 282 2010 243 1 012 406
2 764 1 158 20 160 2009 221 886 430 250 329 246 137 2 500
193 2852008 1 812 6 240 2 431 2 055 3 101
2009 1 807 6 740 2 389 2 167 3 134
212 101 2 0882 646 992 19 277 2008 189 698 410
2 469 939 18 615 2007 180 765 431 226 298 217 104 2 220
249 2942006 1 592 6 122 2 123 2 148 2 830
2007 1 698 6 176 2 271 2 100 2 962
211 102 2 2362 311 890 18 016 2006 162 791 428
辦公室
設備Office
Equipment
其他 1
Others 1總計Total
年份Year
煮食Cooking
空氣調節Air
Conditioning
熱水Hot
Water
照明Lighting
冷凍Refrigeration
辦公室
設備Office
Equipment
其他 1
Others 1總計Total
lt 單位太焦耳 Unit Terajoule gt lt 單位太焦耳 Unit Terajoule gt
私人房屋組別 Private Housing Segment 其他房屋組別 3 Other Housing Segment 3表 13 Table 13 表 15 Table 15
年份Year
煮食Cooking
空氣調節Air
Conditioning
熱水Hot
Water
照明Lighting
冷凍Refrigeration
1 878 1 038 11 220 2016 576 2 288 102 495 838 1 133 684 6 117
488 8732015 1 115 3 374 987 925 1 822
2016 1 157 3 344 1 056 959 1 788
1 115 674 6 1681 811 1 002 11 036 2015 568 2 354 97
1 851 1 023 11 209 2014 589 2 428 106 506 864 1 158 699 6 351
513 8162013 1 155 2 691 1 076 958 1 679
2014 1 140 3 415 1 059 945 1 777
1 172 708 5 8101 876 1 037 10 473 2013 597 1 896 108
1 794 974 10 674 2012 605 2 162 105 561 838 1 127 669 6 068
585 8572011 1 055 2 931 1 118 942 1 763
2012 1 120 3 029 1 062 970 1 725
1 025 556 5 9321 642 817 10 269 2011 613 2 163 133
1 558 717 10 100 2010 667 2 285 178 645 926 1 029 504 6 234
676 9552009 951 2 801 1 252 963 1 863
2010 1 004 2 870 1 187 947 1 818
1 014 450 6 3331 505 644
1 414 563
9 979 2009 709 2 302 227
1 421 570 9 514 2008 744 2 216 277
其他 1
Others 1總計Total
2006 587 2 157 171
673 940 977
380 5 972
照明Lighting
2 773 1 181 1 009 1 826
2008 862 2 620 1 264 952 1 825
表 14 Table 14
總計Total
年份Year
煮食Cooking
空氣調節Air
Conditioning
熱水Hot
Water
5 733
冷凍Refrigeration
房委會資助出售單位組別 2
Housing Authority Subsidized Sale Flats Segment 2表 12 Table 12
725 886 844 364
395 6 222
700 915 909
辦公室
設備Office
Equipment
年份Year
2006
辦公室
設備Office
Equipment
其他 1
Others 1
9 615 2007 659 2 190 218
1 367 539 9 442
煮食Cooking
空氣調節Air
Conditioning
熱水Hot
Water
照明Lighting
冷凍Refrigeration
813 2 849 1 070 1 035 1 770
2007 850
3按最終用途及組別劃分
3By End-uses amp Segments
所有商業組別 All Commercial Segments
33 商業類別所有能源使用按最終用途劃分 All Energy Consumption By End-uses In Commercial Segments
12 570 - - -
-
太焦耳Terajoule
63 251
46 037
21 340 17 942 12 791 15 799
21 290 17 928 12 915 16 331 5 887 3 286
67 577
5 753
21 316 17 506
21 165 17 332
46 632
45 816
12 484 - -
3 270
12 663 14 017 5 563 3 273
118 558
121 2153 215 45 328
2012 120 970
61 790
23 397 16 213 13 190 - -
23 299 15 9602009 11 788 - -
24 185 15 711 12 195 - - - 64 300
22 929 16 624
-
2013
13 182 16 453 5 968 3 324 46 536
21 397 17 612 12 544 15 539 5 581
35 36
年份 Year 2016
年份 Year 2006
24 157
123 674
113 914
2008 113 75315 686 11 894
2007
- - - 62 015
2011
114 297
2010 116 391
2016 123 969lt 單位太焦耳 Unit Terajoule gt
圖 16 Graph 16所有商業能源最終用途 All Commercial Energy End-uses圖 15 Graph 15
總計Total
2006 111 884
表 16 Table 16
年份Year
- 59 084
食肆Restaurant
零售Retail
辦公室Office
住宿Accomodation
醫療HumanHealth
教育Education
其他商業Other
Commercial
21 163 17 343
2015
2014 122 711
0
20 000
40 000
60 000
80 000
100 000
120 000
140 000
2006 2007 2008 2009 2010 2011 2012 2013 2014 2015 2016
食肆
Restaurant零售
Retail辦公室
Office住宿
Accomodation醫療
Health教育
Education其他商業
Other Commercial
煮食
Cooking14
空氣調節
Air Conditioning 24
照明
Lighting12
熱水及冷凍
Hot water amp Refrigeration
12
辦公室設備
Office Equipment5
其他
Others33
煮食
Cooking15
空氣調節
Air Conditioning 27
照明
Lighting15
熱水及冷凍
Hot water amp Refrigeration
8
辦公室設備
Office Equipment5
其他
Others30
3按最終用途及組別劃分
3By End-uses amp Segments
食肆組別 Restaurant Segment
33 商業類別所有能源使用按最終用途劃分 All Energy Consumption By End-uses In Commercial Segments
11 788
1 743 1 543 2 352 12 195
14 166
表 19 Table 19
2010
2009
年份Year
1 7002008 24 157
22 929 20071 761 7092007 6 971
923
885
1 954 905
總計Total
511
23 299 2009
6 557
總計Total
1 829 13 190
2008 6 395
2 517 13 182
1 599 2 446 12 663
1 806 1 596 2 441
2 416 12 791
1 809
1 571
12 544
2 479 12 915
5 401 2 054 810
785
2016 1 862 1 6467 158
525
2013
2015
2014
2 055 821 532 21 397
2 054 819
21 165 1 577
6 983
6 701
1 784
689
17 343 2016
4 1835 625 -2011
6 338
7 523
5 701 4 177 7 628
5 583 4 250
5 754 4 310
7 901
1 773
5 706
5 805
1 833 1 620 525
12 528
lt 單位太焦耳 Unit Terajoule gt
零售組別 Retail Segment 表 18 Table 18
總計Total
4 115
2009
2014 21 340
其他 1
Others 1
21 163
照明Lighting
811
807 524
21 2902 081
2 085
530
2007
年份Year
4 1192006
2008
-
6 809
lt 單位太焦耳 Unit Terajoule gt lt 單位太焦耳 Unit Terajoule gt
2013
14 0173 273 4 5551 384 4 21917 506 20122012
7 779 15 5393 623 5 0341 550
1 645 4 931 6975 582 4 189 7 572
辦公室設備Office
Equipment
6 711
4 67517 612 2013
7 864
lt 單位太焦耳 Unit Terajoule gt
住宿組別 Accommodation Segment 表 20 Table 20
總計Total
空氣調節Air
Conditioning
熱水及冷凍4
Hot Water ampRefrigeration4
照明Lighting
其他 1
Others 1年份Year
-- -- -17 332
7 031
- -
2013
2016
2015 12 389 5 483
12 358 5 402
5 398
5 498
15 711 20102010 -5 7154 122
5 799
5 875
663
2011
586
657
37 38
16 4533 855 5 325
15 7993 762 5 0951 565 4 71417 942 20144 241
16 3313 890 5 2511 627 4 87217 928 20152015
2014
2016
-
-- -- -
--5 865 -15 686 2008
4 187
- -
15 960 2009 -
-
6 793
5 968
13 507 5 960
-- -- -16 624 20076 689 4 890 5 045 -
-- -- -16 213 20065 300
空氣調節Air
Conditioning
12 591
12 426
14 049 5 525
6 082 1 991
照明Lighting
辦公室設備Office
Equipment
其他 1
Others 1
2 019
2012
20112011 12 622 5 237 2 009
973
21 316 2012
24 185 201013 404 6 594 2 1181 001 1 069
辦公室組別 Office Segment表 17 Table 17
23 397 2006 7 187
1 802 1 777 12 570
2 412 12 484
1 505 2 294 11 894
1 684 1 491 2 274
995
- -
2006
年份Year
煮食Cooking
空氣調節Air
Conditioning
熱水及冷凍4
Hot Water ampRefrigeration4
照明Lighting
其他 1
Others 1
2 026 2 14914 215 584
空氣調節Air
Conditioning
5 863 1 7251 011
5 596 1 486
5 561 5 518 1 478 1 918
46 536
31 341 45 816
5 587 5 571 1 486 1 911 31 482 46 037
5 430
34 746 64 300
11 225 7 603 2 684 8 396 37 669 67 577
32 327 46 6325 402 5 516
9 672 7 207 3 092 8 255
1 527 1 860
10 154 7 586 3 156 8 659
45 328
10 572 7 766
130
- - -
-
61 790
131 538
33 790 62 015
9 860 7 321 3 087 8 231 34 751 63 251
2010
- 2009
- 2008
- - -
- - -
59 084
-
其他 1
Others 1
lt 單位太焦耳 Unit Terajoule gt
5 968 2016 1 845 32 179
5 581 2013
5 563 2012
-
-
- 2011
-
5 486
3 273
照明Lighting
辦公室設備Office
Equipment
熱水及冷凍4
Hot Water ampRefrigeration4
其他 1
Others 1
546
542
-
31 558
-
533
1 475 1 832 31 132
- 2007
5 402
2 573 6 616
10 348 7 527 2 881 7 714 33 321
39 40
2016 3 324
2015 3 2861 606
lt 單位太焦耳 Unit Terajoule gt
3 270
1 613 681 337 138 556
1 603
666 330 137
661 327 137
- -
2014
2013 1 563
2012
2011 -
1 602
- - -
-
- -
-
671 332
- -
3 215 661 327
2006 -
-
2010 -
2009 --
lt 單位太焦耳 Unit Terajoule gt
教育組別 Education Segment 表 22 Table 22
2008 -
2007 -- -
年份Year
總計Total
空氣調節Air
Conditioning
照明Lighting
辦公室設備Office
Equipment
熱水及冷凍4
Hot Water ampRefrigeration4
-
2016 1 257 303 298 2 218 1 892
5 887 2015
5 753 20142014 1 237 289 285 2 126 1 817
2015 1 261 297 292 2 176 1 862
2012 1 189 283 279 2 057 1 754
2013 1 178 284 280 2 071 1 768
2010 - - - - -
2011 - - - - -
2008 - - - - -
2009 - - - - -
20062006 - - - - -
2007 - - - - -
3按最終用途及組別劃分
3By End-uses amp Segments
醫療組別 Human Health Segment
33 商業類別所有能源使用按最終用途劃分 All Energy Consumption By End-uses In Commercial Segments
其他商業組別 Other Commercial Segments表 21 Table 21 表 23 Table 23
年份Year
空氣調節Air
Conditioning
照明Lighting
辦公室設備Office
Equipment
熱水及冷凍4
Hot Water ampRefrigeration4
其他 1
Others 1總計Total
年份Year
空氣調節Air
Conditioning
總計Total
12 106 3 537 3 198
12 381 16 826 12 915 12 043 3 489 3 158 42 881 103 693
lt 單位太焦耳 Unit Terajoule gt
41 42
101 480
2014 12 379 16 742 12 791 11 615 3 412 3 144 42 544 102 627
2016 12 330 16 306 13 182 43 223 103 881
2015
43 748 101 813
2013 12 336 16 435 12 544 11 386 3 317 3 102 42 361
2012 12 265 16 442 12 663 10 211 3 321 3 164
2011 11 894 16 339 12 484 - - - 58 877 99 594
2010 14 372 15 711 12 195 - - - 55 616 97 894
2009 12 990 15 960 11 788 - - - 55 991 96 728
2008 13 257 15 686 11 894 - - - 54 706 95 543
2007 11 681 16 624 12 570 - - - 54 176 95 051
所有商業能源最終用途 All Commercial Energy End-uses圖 17 Graph 17 圖 18 Graph 18
年份 Year 2016太焦耳Terajoule
3按最終用途及組別劃分
3By End-uses amp Segments
所有商業組別 All Commercial Segments
34 商業類別電力使用按最終用途劃分 Electricity Consumption By End-uses In Commercial Segments
年份 Year 2006
2006 12 136
表 24 Table 24
年份Year
食肆Restaurant
零售Retail
辦公室Office
住宿Accomodation
醫療HumanHealth
教育Education
其他商業Other
Commercial
總計Total
16 213 13 190 - - - 51 779 93 317
0
20 000
40 000
60 000
80 000
100 000
120 000
2006 2007 2008 2009 2010 2011 2012 2013 2014 2015 2016
食肆
Restaurant零售
Retail辦公室
Office住宿
Accomodation醫療
Health教育
Education其他商業
Other Commercial
煮食
Cooking7
空氣調節
Air Conditioning 29
照明
Lighting15
熱水及冷凍
Hot Water amp Refrigeration
8
辦公室設備
Office Equipment6
其他
Others35
煮食
Cooking6
空氣調節
Air Conditioning 33
照明
Lighting17
熱水及冷凍
Hot Water amp Refrigeration
5
辦公室設備
Office Equipment6
其他
Others33
1 527 4 381 12 106lt 單位太焦耳 Unit Terajoule gt lt 單位太焦耳 Unit Terajoule gt
43 44
2016 5 582 4 189 6 535 16 306 2016 3 855 1 645
3按最終用途及組別劃分
3By End-uses amp Segments
食肆組別 Restaurant Segment
34 商業類別電力使用按最終用途劃分 Electricity Consumption By End-uses In Commercial Segments
2013 3 623
697
1 502 4 334 12 043
2014 5 799 4 241 6 701 16 742 2014 3 762 1 565 663 1 459 4 167 11 615
2015 5 754 4 310 6 762 16 826 2015 3 890
2011 -
1 627 689
1 429 4 127 11 386
2012 5 701 4 177 6 565 16 442 2012 3 273 1 384 586 1 282 3 686 10 211
2013 5 583 4 250 6 601 16 435
2009 -
1 550 657
- - -
2010 5 875 4 122 5 715 15 711 2010 - - - - - -
2011 5 625 4 183 6 530 16 339
2007 -
- -
- - -
2008 5 865 4 115 5 706 15 686 2008 - - - - - -
2009 5 968 4 187 5 805 15 960
年份Year
空氣調節Air
Conditioning
照明Lighting
其他 1
Others 1總計Total
年份Year
- -
-
2006 6 793 5 300 4 119 16 213 2006 - - - -
2007 6 689 4 890 5 045 16 624
空氣調節Air
Conditioning
照明Lighting
辦公室設備Office
Equipment
熱水及冷凍4
Hot Water ampRefrigeration4
其他 1
Others 1
13 182
- -
總計Total
- -
- -
零售組別 Retail Segment 住宿組別 Accommodation Segment表 26 Table 26 表 28 Table 28
12 330 2016 7 158 1 862 1 646 2 517
2 479 12 915
2016 4 039 5 402 819 1 595 474lt 單位太焦耳 Unit Terajoule gt lt 單位太焦耳 Unit Terajoule gt
1 773 1 571 2 416 12 791
2015 3 998 5 483 811 1 620 469 12 381 2015 6 983
2014 3 981 5 498 807 1 625 467 12 379 2014 7 031
1 833 1 620
1 809 1 599 2 446 12 663
2013 4 048 5 398 821 1 594 475 12 336 2013 6 701 1 806 1 596 2 441 12 544
2012 3 991 5 401 810 1 595 469 12 265 2012 6 809
1 743 1 543 2 352 12 195
2011 3 870 5 237 785 1 547 454 11 894 2011 6 711 1 784 1 577 2 412 12 484
2010 4 120 6 594 1 001 1 647
11 894
2009 3 724 5 960 905 1 488 913 12 990 2009 6 338 1 684 1 491 2 274 11 788
2008 3 801 6 082 923 1 519
1 829
1 777 2 019
1 010 14 372 2010 6 557
1 700 1 505 2 294
1 802
932 13 257 2008 6 395
2 026 2 1491 241 519 12 136 2006 7 187
3 352 5 525 885 1 275 644 11 681 2007 6 971
辦公室組別 Office Segment表 25 Table 25 表 27 Table 27
年份Year
煮食Cooking
空氣調節Air
Conditioning
照明Lighting
熱水及冷凍4
Hot Water ampRefrigeration4
其他 1
Others 1總計Total
年份Year
空氣調節Air
Conditioning
照明Lighting
辦公室設備Office
Equipment
其他 1
Others 1總計Total
13 190
2007 12 570
2006 3 502 5 863 1 011
3按最終用途及組別劃分
3By End-uses amp Segments
醫療組別 Human Health Segment
34 商業類別電力使用按最終用途劃分 Electricity Consumption By End-uses In Commercial Segments
1 257 303 298 316 1 363 3 537
1 613 681 337 95 472 3 198lt 單位太焦耳 Unit Terajoule gt
45 46
3 158
3 102
-
3 164
- - - -
2012 1 602 671 332 94 465
2011 -
458 3 1442014 1 603 661 327 94
2013 1 563 661 327 92 458
2016
1 606 666 330 94 4622015
2009 - - - - - -
2010 - - - - - -
2008 - - - - - -
2007 -
2006 - - - - - -
- - - - -
5 596 1 486 1 807 28 904 43 223lt 單位太焦耳 Unit Terajoule gt lt 單位太焦耳 Unit Terajoule gt
其他 1
Others 1總計Total
年份Year
空氣調節Air
Conditioning
照明Lighting
辦公室設備Office
Equipment
熱水及冷凍4
Hot Water ampRefrigeration4
1 335 3 489
2016 5 4302016
1 261 297 292 305
教育組別 Education Segment 表 30 Table 30
1 478 1 847 28 140 42 544
2015 2015 5 587 5 571 1 486 1 850 28 388 42 881
2013 5 402 5 486 1 475 1 780 28 218 42 361
2014 1 237 289 285 301 1 301 3 412 2014 5 561
2013 1 178 284 280 295 1 280 3 317
5 518
2 684 3 408 33 957 58 877
2012 1 189 283 279 294 1 275 3 321 2012 5 402 5 516 1 527 1 810 29 492 43 748
2010 10 154 7 586 3 156 3 886 30 835 55 616
2011 - - - - - - 2011 11 225
2010 - - - - - -
7 603
31 079 54 706
2009 - - - - - - 2009 9 860 7 321 3 087 3 676 32 047 55 991
7 207 3 0922008 - - - - - - 2008 9 672
2007 10 348 7 527 2 881 2 863
3 657
30 558 54 1762007 - - - - - -
- - 2006 10 572 7 766 2 573 2 069 28 800 51 779
其他商業組別 Other Commercial Segments表 29 Table 29 表 31 Table 31
年份Year
空氣調節Air
Conditioning
照明Lighting
辦公室設備Office
Equipment
熱水及冷凍4
Hot Water ampRefrigeration4
其他 1
Others 1總計Total
年份Year
空氣調節Air
Conditioning
照明Lighting
辦公室設備Office
Equipment
熱水及冷凍4
Hot Water ampRefrigeration4
其他 1
Others 1總計Total
2006 - - - -
3按最終用途及組別劃分
3By End-uses amp Segments
所有工業組別 All Industrial Segments
35 工業類別所有能源使用按最終用途劃分 All Energy Consumption By End-uses In Industrial Segments
圖 20 Graph 20
年份 Year 2016
年份 Year 2006
所有工業能源最終用途 All Industrial Energy End-uses
695 5 188 2 770 3 344 2 585 14 5832013
5 166 2 659 3 377 2 732 14 7232012 789
494 5 549 3 010 3 395 2 404 14 8532015
5 334 2 967 3 337 2 501 14 7182014 579
47 48
5 080 2 906 3 312 2 292 13 992lt 單位太焦耳 Unit Terajoule gt
2016 402
864 4 938 2 450 3 504 2 976 14 7322011
4 135 2 718 3 888 4 095 16 0532010 1 217
1 373 3 829 2 695 4 036 4 196 16 1292009
4 009 2 804 4 255 4 454 17 3322008 1 809
3 086 3 815 4 788 17 6452007 2 019 3 935
4 209 4 985 18 9342006 2 249 4 629 2 863
圖 19 Graph 19
太焦耳
Terajoule
其他工業 7
OtherIndustries 7
總計Total
年份Year
紡織及服裝製品Textile amp
Wearing Apparel
非製造業 6
Non-manufacturing 6
食品及飲品Food amp
Beverage
金屬及機械Metal amp
Machinery
表 32 Table 32
0
2 000
4 000
6 000
8 000
10 000
12 000
14 000
16 000
18 000
20 000
2006 2007 2008 2009 2010 2011 2012 2013 2014 2015 2016
紡織及服裝製品
Textile ampWearing Apparel
非製造業
Non‐manufacturing
食品及飲品
Food ampBeverage
金屬及機械
Metal ampMachinery
其他工業
OtherIndustries
工業生產設備
Industrial ProcessEquipment
54
照明
Lighting6
空氣調節
Air Conditioning17
其他
Others23
工業生產設備
Industrial ProcessEquipment
53
照明
Lighting7
空氣調節
Air Conditioning22
其他
Others18
3按最終用途及組別劃分
3By End-uses amp Segments
紡織及服裝製品組別 Textile amp Wearing Apparel Segment
35 工業類別所有能源使用按最終用途劃分 All Energy Consumption By End-uses In Industrial Segments
食品及飲品組別 Food amp Beverage Segment表 33 Table 33 表 35 Table 35
年份Year
工業生產設備 5
Industrial ProcessEquipment 5
照明Lighting
空氣調節Air
Conditioning
其他1
Others1總計Total
年份Year
工業生產設備 5
Industrial ProcessEquipment 5
照明Lighting
空氣調節Air
Conditioning
其他1
Others1總計Total
466 455 2 863
2007 880 194 685 260 3 0862 019 2007 1 922 159 509 497
2006 997 210 757 284 2 249 2006 1 797 146
430 425 2 804
2009 637 123 446 167 1 373 2009 1 775 125 399 397 2 695
2008 834 163 592 221 1 809 2008 1 815 134
2010 574 106 391 145 2 718
2011 446 68 256 94 864 2011 1 743 95
1 217 2010 1 793 125 400 399
303 310 2 450
311 318 2 659
2013 367 53 203 74 2 770 695 2013 2 047 97 309 317
2012 416 59 230 83 789 2012 1 934 97
340 344 2 967
2015 262 36 145 51 494 2015 2 218 106 342 345 3 010
2014 303 44 171 61 579 2014 2 177 106
2016 210 31 118 43 2 906lt 單位太焦耳 Unit Terajoule gt lt 單位太焦耳 Unit Terajoule gt
非製造業組別 6 Non-manufacturing Segment6金屬及機械組別 Metal amp Machinery Segment表 34 Table 34 表 36 Table 36
402 2016 2 117 106 337 346
年份Year
工業生產設備 5
Industrial ProcessEquipment 5
照明Lighting
空氣調節Air
Conditioning
其他1
Others1總計Total
年份Year
工業生產設備 5
Industrial ProcessEquipment 5
照明Lighting
空氣調節Air
Conditioning
其他1
Others1總計Total
2006 1 794 114 925 1 376 4 2092006 2 013 588 992 1 035 4 629
2007 1 626 103 837 1 249 3 8152007 1 711 500 850 873 3 935
2008 1 819 105 857 1 475 4 2552008 1 823 488 810 888 4 009
2009 1 729 97 791 1 419 4 0362009 1 764 460 762 843 3 829
2010 1 665 94 761 1 367 3 8882010 1 907 496 819 913 4 135
2011 1 513 65 565 1 360 3 5042011 2 143 509 940 1 346 4 938
2012 1 460 63 544 1 309 3 3772012 2 272 540 985 1 370 5 166
2013 1 452 62 534 1 296 3 3442013 2 246 536 969 1 437 5 188
2014 1 445 62 541 1 290 3 3372014 2 295 547 1 003 1 490 5 334
2015 1 470 63 551 1 312 3 3952015 2 401 571 1 041 1 536 5 549
2016 1 440 61 529 1 282 3 3122016 2 179 522 949 1 430 5 080lt 單位太焦耳 Unit Terajoule gt lt 單位太焦耳 Unit Terajoule gt
49 50
2015 346 4 024 1 349 1 217 2 307 9 242
1 226 1 192 2 476 9 144
3 880 1 344 1 195 2 402 9 2302014 409
14 015
2007 1 682 3 032 2 012 1 882 4 496 13 104
1 232 1 208 2 616 9 356
12 182
1 200 1 255 2 844 9 5302011 619 3 613
2009 1 089 2 799 1 579 1 779 3 896 11 143
2010
2012 553 3 747
2013 489 3 761
951 3 023 1 585 1 714 3 808 11 082
2007 3 295 277 980 236 4 788
1 701 1 926 4 140
1 842 2 080 4 670
2008 1 443 2 971
2006 1 851 3 572
2008 3 051 257 915 231 4 454
35 工業類別所有能源使用按最終用途劃分 All Energy Consumption By End-uses In Industrial Segments
所有工業組別 All Industrial Segments
36 工業類別電力使用按最終用途劃分 Electricity Consumption By End-uses In Industrial Segments
3按最終用途及組別劃分
3By End-uses amp Segments
2006 3 415 290 1 029 251 4 985
圖 21 Graph 21
年份
Year
工業生產設備 5
Industrial ProcessEquipment 5
照明Lighting
空氣調節Air
Conditioning
其他1
Others1總計Total
太焦耳
Terajoule
表 37 Table 37其他工業組別 7 Other Industrial Segments 7
2010 2 800 237 844 213 4 095
2009 2 865 242 863 225 4 196
2012 1 872 166 568 125 2 732
2011 2 030 180 627 140 2 976
2014 1 711 154 520 116 2 501
2013 1 781 158 528 119 2 585
2016 1 568 144 471 110 2 292
2015 1 635 149 502 118 2 404
表 38 Table 38
年份Year
紡織及服裝製品Textile amp
Wearing Apparel
非製造業 6
Non-manufacturing 6
食品及飲品Food amp
Beverage
金屬及機械Metal amp
Machinery
其他工業 7
OtherIndustries 7
總計Total
lt 單位太焦耳 Unit Terajoule gt
2 206 8 709
51 52
lt 單位太焦耳 Unit Terajoule gt
2016 286 3 699 1 339 1 179
0
2 000
4 000
6 000
8 000
10 000
12 000
14 000
16 000
2006 2007 2008 2009 2010 2011 2012 2013 2014 2015 2016
紡織及服裝製品
Textile ampWearing Apparel
非製造業
Non‐manufacturing
食品及飲品
Food ampBeverage
金屬及機械
Metal ampMachinery
其他工業
OtherIndustries
圖 22 Graph 22 紡織及服裝製品組別 Textile amp Wearing Apparel Segment 表 39 Table 39
年份 Year 2016
所有工業能源最終用途 All Industrial Energy End-uses
36 工業類別電力使用按最終用途劃分 Electricity Consumption By End-uses In Industrial Segments
3按最終用途及組別劃分
3By End-uses amp Segments
年份 Year 2006
53
年份Year
工業生產設備 5
Industrial ProcessEquipment 5
照明Lighting
空氣調節Air
Conditioning
其他1
Others1總計Total
2006 604 210 757 279 1 851
2007 547 194 685 255 1 682
1 443
2009 356 123 446 164 1 089
2008 472 163 592 217
951
2011 203 68 256 92 619
2010 312 106 391 142
553
2013 162 53 203 72 489
2012 182 59 230 81
409
2015 114 36 145 50 346
2014 134 44 171 60
286lt 單位太焦耳 Unit Terajoule gt
非製造業組別 6 Non-manufacturing Segment 6 表 40 Table 40
年份Year
工業生產設備 5
Industrial ProcessEquipment 5
照明Lighting
空氣調節Air
Conditioning
其他1
Others1總計Total
2016 94 31 118 42
3 572
2007 893 500 850 788 3 032
2006 1 057 588 992 934
2 971
2009 836 460 762 742 2 799
2008 886 488 810 787
3 023
2011 949 509 940 1 215 3 613
2010 904 496 819 804
3 747
2013 962 536 969 1 295 3 761
2012 993 540 985 1 230
3 880
2015 1 028 571 1 041 1 384 4 024
2014 986 547 1 003 1 345
3 699lt 單位太焦耳 Unit Terajoule gt
54
2016 936 522 949 1 292
工業生產設備
Industrial ProcessEquipment
41 照明
Lighting10
空氣調節
Air Conditioning27
其他
Others22
工業生產設備
Industrial ProcessEquipment
46
照明
Lighting9
空氣調節
Air Conditioning30
其他
Others15
其他工業組別 7 Other Industrial Segments 7表 41 Table 41 表 43 Table 43
年份Year
工業生產設備 5
Industrial ProcessEquipment 5
照明Lighting
空氣調節Air
Conditioning
其他1
Others1總計Total
年份Year
工業生產設備 5
Industrial ProcessEquipment 5
照明Lighting
空氣調節Air
Conditioning
其他1
Others1總計Total
1 029 216 4 670
2007 883 159 509 462 4 4962 012 2007 3 030 277 980 208
2006 808 146 466 423 1 842 2006 3 135 290
915 191 4 140
2009 693 125 399 363 1 579 2009 2 610 242 863 181 3 896
2008 746 134 430 390 1 701 2008 2 777 257
2010 695 125 400 365 3 808
2011 526 95 303 277 1 200 2011 1 904 180
1 585 2010 2 548 237 844 178
627 133 2 844
568 123 2 616
2013 536 97 309 284 2 4761 226 2013 1 674 158 528 116
2012 540 97 311 284 1 232 2012
金屬及機械組別 Metal amp Machinery Segment 表 42 Table 42
1 339 2016 1 484 144 471 108
1 759 166
520 114
2015 592 106 342 309 1 349 2015 1 544 149 502 112
2014
2016 585 106 337 310
1 614 154
2 206lt 單位太焦耳 Unit Terajoule gt lt 單位太焦耳 Unit Terajoule gt
2 402
2 307
590 106 340 308 1 344 2014
2006 810 114 925 231 2 080
年份Year
工業生產設備 5
Industrial ProcessEquipment 5
照明Lighting
空氣調節Air
Conditioning
其他1
Others1總計Total
2008 751 105 857 214 1 926
2007 733 103 837 209 1 882
2010 668 94 761 190 1 714
2009 694 97 791 198 1 779
2012 466 63 544 136 1 208
2011 484 65 565 141 1 255
2014 459 62 541 134 1 195
2013 461 62 534 134 1 192
3按最終用途及組別劃分
3By End-uses amp Segments
食品及飲品組別 Food amp Beverage Segment
36 工業類別電力使用按最終用途劃分 Electricity Consumption By End-uses In Industrial Segments
55 56
lt 單位太焦耳 Unit Terajoule gt
2016 456 61 529 133 1 179
2015 467 63 551 136 1 217
表 45 Table 45
太焦耳Terajoule
年份Year
貨車Goods Vehicle
其他
Others 總計Total
貨運組別 Freight Segments圖 23 Graph 23
3按最終用途及組別劃分
3By End-uses amp Segments
所有運輸組別 All Transport Segments
37 運輸類別所有能源使用按最終用途劃分 All Energy Consumption By End-uses In Transport Segments
32 551 6 601 39 152 0
2007
2006
31 771 6 411 38 182 0
0
2009 28 501 5 424 33 925 0
2008 30 438 5 929 36 367
0
2011 28 010 4 134 32 144 0
2010 28 585 4 744 33 329
0
2013 25 534 3 305 28 839 0
2012 26 941 3 826 30 767
0
2015
0
lt 單位太焦耳 Unit Terajoule gt
2014 25 009 3 264 28 273
24 782 3 269 28 051 0
2016
總計Total
年份Year
貨運Freight
客運Passenger
總計Total
年份Year
巴士Bus
24 721 2 961 27 682
客運組別 Passenger Segments表 44 Table 44 表 46 Table 46
41 57 251 59 96 404
的士Taxi
汽車Car
電單車Motorcycle
鐵路Rail
其他
Others
14 102 17 118 463 2 495 3 973 57 983
4 017 57 251
2007 38 182 40 57 983 60 96 165 2007 19 832
2006 20 301 13 797 16 267 426 2 4442006 39 152
56 718
3 965 58 137
2009 33 925 37 56 718 63 90 643 2009 19 150
2008 18 971 15 142 17 059 480 2 5202008 36 367 38 58 137 62 94 504
37 57 560 63 90 889
13 131 17 449 465 2 523 4 000
13 593 18 879 424 2 609 4 213 58 630
4 124 57 560
2011 32 144 35 58 630 65 90 774 2011 18 911
2010 18 842 13 373 18 247 436 2 5402010 33 329
61 359
4 354 59 656
2013 28 839 32 61 359 68 90 198 2013 19 144
2012 19 128 13 469 19 561 423 2 7222012 30 767 34 59 656 66 90 423
31 61 725 69 89 999
13 319 21 158 406 2 796 4 536
13 039 21 764 448 2 972 4 631 61 195
4 547 61 725
2015 28 051 31 61 195 69 89 245 2015 18 341
2014 18 659 14 133 21 085 426 2 8752014 28 273
57 58
4 636 62 136lt 單位太焦耳 Unit Terajoule gt lt 單位太焦耳 Unit Terajoule gt
此項之最終用途包括船隻及香港內部的航空運輸能源的使用等 End-uses under this heading include marine and internal air transportation energy uses etc
2016 18 918 12 288 22 881 463 2 9512016 27 682 31 62 136 69 89 819
0
10 000
20 000
30 000
40 000
50 000
60 000
70 000
80 000
90 000
100 000
2006 2007 2008 2009 2010 2011 2012 2013 2014 2015 2016
貨運
Freight客運
Passenger
4按燃料及類別劃分
4By Fuels amp Sectors
41 所有能源使用按燃料劃分
All Energy Consumption By Fuels圖 24 Graph 24 圖 25 Graph 25
3按最終用途及組別劃分
3By End-uses amp Segments
所有運輸能源最終用途 All Transport Energy End-uses
37 運輸類別所有能源使用按最終用途劃分 All Energy Consumption By End-uses In Transport Segments
年份 Year 2016 太焦耳Terajoule
表 47 Table 47
年份 Year 2006 年份Year
煤氣及石油氣Town Gas amp
Liquefied Petroleum Gas
油及煤產品Oil amp CoalProducts
電力Electricity
總計Total
2006 48 482 17 87 518 31 145 204 52 281 204 100
2007 48 721 17 86 647 31 147 072 52 282 440 100
52 281 438 100
2009 47 239 17 82 194 29 149 366 54
2008 49 732 18 84 361 30 147 345
278 799 100
2010 49 084 17 81 786 29 150 859 54 281 729 100
2011 49 568 18 81 716 29 151 606 54 282 890 100
54 286 048 100
2013 49 723 17 81 306 29 153 362 54
2012 49 616 17 81 352 28 155 079
284 391 100
2014 50 844 18 80 347 28 158 147 55 289 338 100
2015 48 954 17 80 757 28 158 275 55 287 986 100
59 60
55 289 219 100
lt 單位太焦耳 Unit Terajoule gt
「總熱值」是使用於計算各種氣體燃料的熱含量 Gross caloricfic values are used in calculating the respective heat contents of the gaseous products
2016 49 374 17 81 184 28 158 662
巴士
Bus 21
的士
Taxi14
汽車及電單車
Car amp Motorcycle26
貨車
Goods Vehicle28
鐵路及其他
Rail amp Others12
巴士
Bus 21
的士
Taxi14
汽車及電單車
Car amp Motorcycle17
貨車
Goods Vehicle34
鐵路及其他
Rail amp Others14
0
50 000
100 000
150 000
200 000
250 000
300 000
2006 2007 2008 2009 2010 2011 2012 2013 2014 2015 2016
煤氣及石油氣Town Gas amp Liquefied Petroleum Gas
油及煤產品
Oil amp Coal Products 電力
Electricity
太焦耳Terajoule
太焦耳Terajoule
表 48 Table 48 表 49 Table 49
4按燃料及類別劃分
4By Fuels amp Sectors
43 商業類別按燃料劃分
Commercial Sector By Fuels42 住宅類別按燃料劃分
Residential Sector By Fuels 圖 26 Graph 26 圖 27 Graph 27
煤氣及石油氣Town Gas amp
Liquefied Petroleum Gas
油及煤產品Oil amp CoalProducts
電力Electricity
總計Total
2006 18 476 34 79 0 35 428
年份Year
煤氣及石油氣Town Gas amp
Liquefied Petroleum Gas
油及煤產品Oil amp CoalProducts
電力Electricity
總計Total
年份Year
4 936 4 93 317 83 111 884 10066 53 982 100 2006 13 631 12
83 113 914 10067 54 717 100 2007 13 888 12
2008 18 708 33 41 0 37 100
4 975 4 95 0512007 18 238 33 57 0 36 422
4 739 4 95 543 84 113 753 10066 55 849 100 2008 13 471 12
85 114 297 10068 57 731 100 2009 12 815 11
2010 19 038 33 13 0 39 344
4 753 4 96 7282009 18 736 32 23 0 38 972
4 526 4 97 894 84 116 391 10067 58 396 100 2010 13 971 12
84 118 558 10068 58 826 100 2011 14 161 12
2012 18 736 31 8 0 41 189
4 803 4 99 5942011 18 946 32 8 0 39 872
4 769 4 101 813 84 120 970 10069 59 932 100 2012 14 388 12
84 121 215 10068 58 394 100 2013 14 709 12
2014 18 487 30 8 0 43 415
5 026 4 101 4802013 18 446 32 8 0 39 941
5 156 4 102 627 84 122 711 10070 61 910 100 2014 14 928 12
84 123 674 10070 60 214 100 2015 14 795 12
2016 18 311 30 8 0 43 120
5 186 4 103 6932015 17 838 30 8 0 42 368
5 164 4 103 881 84 123 969 10070 61 439 100 2016 14 924 12lt 單位太焦耳 Unit Terajoule gt lt 單位太焦耳 Unit Terajoule gt
「總熱值」是使用於計算各種氣體燃料的熱含量 Gross caloricfic values are used in calculating the respective heat contents of the gaseous products
「總熱值」是使用於計算各種氣體燃料的熱含量 Gross caloricfic values are used in calculating the respective heat contents of the gaseous products
61 62
0
10 000
20 000
30 000
40 000
50 000
60 000
70 000
2006 2007 2008 2009 2010 2011 2012 2013 2014 2015 2016
煤氣及石油氣Town Gas amp Liquefied Petroleum Gas
油及煤產品
Oil amp Coal Products 電力
Electricity
0
20 000
40 000
60 000
80 000
100 000
120 000
140 000
2006 2007 2008 2009 2010 2011 2012 2013 2014 2015 2016煤氣及石油氣Town Gas amp Liquefied Petroleum Gas
油及煤產品
Oil amp Coal Products 電力
Electricity
太焦耳Terajoule
太焦耳Terajoule
表 50 Table 50 表 51 Table 51
4按燃料及類別劃分
4By Fuels amp Sectors
45 運輸類別按燃料劃分
Transport Sector By Fuels44 工業類別按燃料劃分
Industrial Sector By Fuels 圖 28 Graph 28 圖 29 Graph 29
煤氣及石油氣Town Gas amp
Liquefied Petroleum Gas
油及煤產品Oil amp CoalProducts
電力Electricity
總計Total
2006 926 5 3 994 21 14 015
年份Year
煤氣及石油氣Town Gas amp
Liquefied Petroleum Gas
油及煤產品Oil amp CoalProducts
電力Electricity
總計Total
年份Year
78 510 81 2 444 3 96 404 10074 18 934 100 2006 15 450 16
3 96 165 10074 17 645 100 2007 15 678 16
2008 927 5 4 223 24 12 182
77 992 81 2 4952007 917 5 3 623 21 13 104
75 358 80 2 520 3 94 504 10070 17 332 100 2008 16 627 18
3 90 643 10069 16 129 100 2009 14 765 16
2010 937 6 4 035 25 11 082
73 355 81 2 5232009 923 6 4 063 25 11 143
73 213 81 2 540 3 90 889 10069 16 053 100 2010 15 137 17
3 90 774 10065 14 732 100 2011 15 506 17
2012 1 108 8 4 259 29 9 356
72 659 80 2 6092011 956 6 4 246 29 9 530
72 317 80 2 722 3 90 423 10064 14 723 100 2012 15 384 17
3 90 198 10063 14 583 100 2013 15 348 17
2014 1 244 8 4 244 29 9 230
72 054 80 2 7962013 1 220 8 4 218 29 9 144
70 939 79 2 875 3 89 999 10063 14 718 100 2014 16 185 18
3 89 245 10062 14 853 100 2015 15 048 17
2016 1 171 8 4 112 29 8 709
71 225 80 2 9722015 1 272 9 4 339 29 9 242
71 900 80 2 951 3 89 819 10062 13 992 100 2016 14 967 17lt 單位太焦耳 Unit Terajoule gt lt 單位太焦耳 Unit Terajoule gt
「總熱值」是使用於計算各種氣體燃料的熱含量 Gross caloricfic values are used in calculating the respective heat contents of the gaseous products
「總熱值」是使用於計算各種氣體燃料的熱含量 Gross caloricfic values are used in calculating the respective heat contents of the gaseous products
63 64
0
2 000
4 000
6 000
8 000
10 000
12 000
14 000
16 000
18 000
20 000
2006 2007 2008 2009 2010 2011 2012 2013 2014 2015 2016煤氣及石油氣Town Gas amp Liquefied Petroleum Gas
油及煤產品
Oil amp Coal Products電力
Electricity
0
10 000
20 000
30 000
40 000
50 000
60 000
70 000
80 000
90 000
100 000
2006 2007 2008 2009 2010 2011 2012 2013 2014 2015 2016煤氣及石油氣Town Gas amp Liquefied Petroleum Gas
油及煤產品
Oil amp Coal Products電力
Electricity
47 890 281 204
2007
20 301 13 797 16 267 426
2 506 10 158 49 197 282 440 14 102
46 5022006
19 832
16 465
17 071
5按最終用途及燃料劃分
5By End-uses amp Fuels
51 所有能源使用按最終用途劃分
All Energy Consumption By End-uses
2 454 10 413
15 142 17 059 480
2 529 9 228
7 918 31 836 12 776 32 551 21 608
51 487 278 799 13 131
17 118 463
17 449 465
2008
8 672 52 019 281 729
19 150
2 527 9 680 50 117 281 438
2009
18 971
8 496
9 121
9 244 19 199
2011
18 842 13 373 18 247 436
2 609 8 245 56 161 282 890 13 593 18 879 31 989 14 187 28 010
2012
2013
19 128
2 542
2 722 8 077 58 650 286 048 13 469 19 561 423
424
2010
18 911
19 144
9 213
8 536
8 319
8 199
19 563
19 314
19 662
19 655 44 243 14 181
14 197
13 708
2 796 7 739 58 100 284 391 13 319 21 158 406
2 875 7 705 58 273 289 338
25 534
2015
18 659 14 133 21 085 426
2 972 7 792 58 218 287 986 13 039 21 764 448
2014 25 009
24 782
8 607
8 717
19 609
19 774
48 746
48 466 18 341
2 951 7 474 59 374 289 219
51 所有能源使用按最終用途劃分 All Energy Consumption By End-uses 圖 30 Graph 30
18 918 12 288 22 881 4632016lt 單位太焦耳 Unit Terajoule gt
14 227 24 721 8 562 17 798 47 938 31 785 19 839
年份 Year 2016 年份 Year 2006
65 66
31 989
31 837
31 402
17 734
17 173
17 413
17 117
17 352
17 927
18 177
18 565
14 111 26 941
45 298
43 392
44 117
45 511
44 914
45 861
20 372
18 965
32 885
34 023
33 302
33 379
13 172
13 788
13 824
13 936
31 771
30 438
28 501
28 585
31 772
表 52 Table 52
年份Year
空氣調節Air
Conditioning
工業生產設備5
IndustrialProcessEquipment5
照明Lighting
冷凍Refrigeration
巴士Bus
的士Taxi
汽車Car
電單車Motorcycle
鐵路Rail
船隻Marine
其他1
Others1總計Total
貨車GoodsVehicle
煮食Cooking
熱水Hot Water
空氣調節
AirConditioning
17
煮食
Cooking11
工業生產設備
Industrial ProcessEquipment
6照明
Lighting7
冷凍
Refrigeration3
熱水
Hot Water 5
貨車
GoodsVehicle
9
巴士
Bus 6
的士
Taxi4
汽車及電單車
Car amp Motorcycle8
鐵路
Rail1
船隻
Marine 3
其他
Others20
空氣調節
AirConditioning
17
煮食
Cooking11
工業生產設備
Industrial ProcessEquipment
6照明
Lighting8
冷凍
Refrigeration3
熱水
Hot Water 4貨車
GoodsVehicle12
巴士
Bus 7
的士
Taxi5
汽車及電單車
Car amp Motorcycle6
鐵路
Rail1
船隻
Marine 4
其他
Others17
2006 46 502 21 608 7 918
5按最終用途及燃料劃分
5By End-uses amp Fuels
52 電力使用按最終用途劃分
Electricity Consumption By End-uses 表 53 Table 53
4 191 11 105 2 444 33 317 145 204
年份Year
空氣調節Air Conditioning
照明Lighting
冷凍Refrigeration
熱水Hot Water
辦公室設備Office Equipment
鐵路Rail
工業生產設備5
IndustrialProcessEquipment5
其他1
Others1總計Total
煮食Cooking
2007 45 298 20 372 8 496
5 373 11 246 2 520 35 477 147 345
4 809 11 171 2 495 34 776 147 072
2010 45 511 19 563 9 213
2009 44 117 19 199 9 244
2008 43 392 18 965 9 121
11 0612012 45 861 19 662 8 319
2011 44 914 19 314 8 536 9 201
9 131
10 738
4 715 13 200 2 722 40 408 155 079
4 945 12 615 2 609 38 732 151 606
11 412
11 3312014 48 746 19 609 8 607
2013 44 243 19 655 8 199 9 280
9 415 4 854 13 344 2 875 39 367 158 147
4 904 13 407 2 796 39 466 153 362
2016 47 938 19 839 8 562
2015 48 466 19 774 8 717 11 344 9 553
13 513 2 951 40 363 158 662 11 528 9 044
4 624 13 212 2 972 39 615 158 275
35 815
67 68
150 859
36 644 149 366
9 048
9 722
10 320
9 926
lt 單位太焦耳 Unit Terajoule gt
52 電力使用按最終用途劃分 Electricity Consumption By End-uses 圖 31 Graph 31
年份 Year 2016 年份 Year 2006
4 923
10 016
9 073
9 934
10 929
10 959
11 430 5 015 11 758 2 540
5 274 11 480 2 523
空氣調節Air
Conditioning 30
照明Lighting
13
冷凍Refrigeration
5
工業生產設備Industrial Process
Equipment6
煮食Cooking
7
熱水Hot Water
3辦公室設備
Office Equipment9
鐵路Rail2
其他Others25
空氣調節Air
Conditioning 32
照明Lighting
15
冷凍Refrigeration
5
工業生產設備Industrial Process
Equipment6
煮食Cooking
6
熱水Hot Water
3辦公室設備
Office Equipment8
鐵路Rail2
其他Others23
年份Year
貨車Goods Vehicle
巴士Bus
的士Taxi
5按最終用途及燃料劃分
5By End-uses amp Fuels
53 油及煤產品使用按最終用途劃分
Oil amp Coal Products Consumption By End-uses 表 54 Table 54
汽車Car
電單車Motorcycle
工業生產設備5
Industrial ProcessEquipment5
船隻Marine
其他1
Others1總計Total
87 518
2007 31 770 18 254 2 17 117 463 6 448 10 158 2 434 86 647
2006 32 551 18 647 2 16 266 426 6 508 10 413 2 705
84 361
2009 28 501 17 514 2 17 448 465 6 341 9 228 2 695 82 194
2008 30 438 17 485 2 17 059 480 6 503 9 680 2 713
81 786
2011 28 010 16 997 1 18 879 424 6 926 8 245 2 234 81 716
2010 28 585 17 077 1 18 247 436 6 423 8 672 2 346
81 352
2013 25 534 17 114 1 21 158 406 7 386 7 739 1 969 81 306
2012 26 941 17 212 1 19 560 423 7 074 8 077 2 064
80 347
2015 24 782 16 331 1 21 764 448
7 553 7 474 1 854 81 184
2014 25 009 16 607 1 21 085 426 7 458 7 705 2 056
lt 單位太焦耳 Unit Terajoule gt
53 油及煤產品使用按最終用途劃分
Oil amp Coal Products Consumption By End-uses 圖 32 Graph 32
7 688 7 792 1 953 80 757
2016 24 721 16 239 lt1 22 881 463
年份 Year 2016 年份 Year 2006
69 70
貨車GoodsVehicle31
巴士及的士Bus amp Taxi
20
汽車及電單車Car amp Motorcycle
29
工業生產設備Industrial Process
Equipment9
船隻Marine
9其他
Others2
貨車GoodsVehicle37
巴士及的士Bus amp Taxi
21
汽車及電單車Car amp Motorcycle
19
工業生產設備Industrial Process
Equipment8
船隻Marine
12其他
Others3
年份Year
煮食Cooking
熱水Hot Water
運輸Transport
其他1
Others1總計Total
5按最終用途及燃料劃分
5By End-uses amp Fuels
54 煤氣及石油氣使用按最終用途劃分
Town Gas amp Liquefied Petroleum Gas Consumption By End-uses 表 55 Table 55
2007 22 021 8 363 15 678 2 659 48 721
2006 21 741 8 585 15 450 2 706 48 482
2009 21 390 8 550 14 765 2 534 47 239
2008 22 220 8 415 16 627 2 472 49 732
2011 20 749 9 242 15 506 4 072 49 568
2010 21 244 8 921 15 137 3 782 49 084
2013 20 222 9 277 15 348 4 876 49 723
2012 20 330 9 396 15 384 4 506 49 616
2015 19 767 9 085 15 048 5 054 48 954
2014 20 194 9 342 16 185 5 123 50 844
lt 單位太焦耳 Unit Terajoule gt
54 煤氣及石油氣使用按最終用途劃分 Town Gas amp Liquefied Petroleum Gas Consumption By End-uses 圖 33 Graph 33
年份 Year 2016 年份 Year 2006
2016 19 990 9 304 14 967 5 113 49 374
「總熱值」是使用於計算各種氣體燃料的熱含量 Gross caloricfic values are used in calculating the respective heat contents of the gaseous products
71 72
煮食Cooking
41
熱水Hot Water
19
運輸Transport
30
其他Others10
煮食Cooking
45
熱水Hot Water
18運輸
Transport32
其他Others
5
6 根據已更新的可再生能源數據相關的2010年至2011年能源最終用途數據已在
2013年版中作出修訂[2013年版修訂]The energy end-use data from 2010 to 2011 were revised in the 2013 Edition basedon the latest update of the renewable energy data (Revised in 2013 Edition)
3 根據運輸能源消耗調查所得的數據有關2008年至2012年的能源最終用途數據已
在2015年版中作出修訂[2015年版修訂]The energy end-use data from year 2008 to 2012 were revised in the 2015 Editionbased on the findings of energy consumption survey on the Transport Sector(Revised in 2015 Edition)
4 自2014年版起新的「住宿」「醫療」和「教育」組別已由「其他商業」組別
分拆出來「其他商業」組別因而相應地縮小[2014年版修訂]The Accommodation Human Health and Education Segments weresegregated from the Other Commercial Segment as new segments in the 2014Edition Hence the size of the Other Commercial Segment is accordingly reduced(Revised in 2014 Edition)
5 自2014年版起燃料的熱含量均以「總熱值」計算因而自2002年後的能源數據
均已採用「總熱值」作出計算[2014年版修訂]Since the 2014 Edition Gross Calorific Values are used for calculating the heatcontents of fuels Gross Calorific Values are hence used in computing energy datafrom 2002 onwards (Revised in 2014 Edition)
1 由於資料所限能源數據不能再分拆成其他最終用途數據「其他」的最終用途包
括沒有被列在表上的最終用途
2 自2013年後「空氣調節」「冷凍」「工業生產設備」及「熱水」的能源最終
用途數據已採用「氣溫因素」作出修訂[2017年版修訂]The energy end-use data of Air Conditioning Refrigeration IndustrialProcessEquipment and Hot Water are revised by Temperature Factor fromyear 2013 onwards (Revised in 2017 Edition)
Due to data limitations energy data could not further be broken down into other end-uses The ldquoOthersrdquo end-use includes the end-uses not elsewhere listed in the table
2 「房委會資助出售單位」組別前稱為「居屋計劃」組別
1 根據零售組別能源消耗調查所得的數據有關2011年至2014年的能源最終用途數
據已在2017年版中作出修訂[2017年版修訂]The energy end-use data from year 2011 to 2014 were revised in the 2017 Editionbased on the findings of energy consumption survey on the Retail Segment(Revised in 2017 Edition)
6Notes 7Chronology of Major Revisions7主要修訂年表6註釋
3 「其他房屋」組別包括別墅平房及類似屋宇
The ldquoOther Housingrdquo Segment includes villas bungalows and the like
4 「熱水及冷凍」的最終用途包括鍋爐器材及其他生產加熱和冷凍的設備
The ldquo Non-manufacturing rdquo Segment includes construction and other miscellaneousnon-manufacturing industrial activities
The ldquoHousing Authority Subsidized Sale Flatsrdquo Segment was previously called ldquoHomeOwnershiprdquo Segment
The ldquo Hot Water amp Refrigeration rdquo end-use includes boiling equipments and otherprocess heating and cooling facilities
「工業生產設備」的最終用途包括鍋爐設備及其他生產加熱和冷凍設備的使用
The ldquoOther Industrialrdquo Segment includes electronics paper printing plastic and othermiscellaneous industrial activities
73
The ldquo GDP in chained dollars rdquo were revised based on latest data published by theCensus and Statisics Department
8 ldquo本地生產總值環比物量計算rdquo己根據政府統計處最新數據作出修訂
74
7 「其他工業」組別包括電子紙張印刷塑膠及其他雜項工業活動
The ldquo Industrial ProcessEquipment rdquo end-use includes boiler plants and other processheating and cooling facilities
6 「非製造業」組別包括建造及其他非製造業之雜項工業活動
5
7主要修訂年表
13 自2010年起「電力」包括燃煤天然氣風能及太陽能所產生的電能[2012年版修訂]ldquoElectricityrdquoincludes the electricity generated from coal natural gas wind and solarpower since 2010 (Revised in 2012 Edition)
14 根據工業能源消耗調查所得的數據有關2000年至2010年的能源最終用途數據已
在2012年版中作出修訂[2012年版修訂]The energy end-use data from year 2000 to 2010 were revised in the 2012 Editionbased on the findings of energy consumption survey on the Industrial Sector(Revised in 2012 Edition)
自2013年版起「煮食」之能源最終用途除已包括煮食爐及飯煲外再加上在廚房
普遍用作製造及準備食物的器具例如煮食用水加熱設備電焗爐及微波爐等
自2001年後的「煮食」之能源最終用途數據均作出修訂[2013年版修訂]The ldquo Cooking rdquo energy end-use was revised in the 2013 Edition to include foodmaking and preparation appliances normally found in kitchens in addition to stovesand rice cookers Examples of the appliances are hot water for cooking purposeselectric ovens and microwave ovens etc The ldquoCookingrdquo energy end-use data since2001 were hence updated (Revised in 2013 Edition)
自2011年「商業」及「工業」類別的分類已經根據香港標準行業分類20版作出
修訂這修訂包括將個人服務活動(例如夜總會卡拉OK電腦及通訊設施維
修家居用品維修車輛維修服務藝術表演或創作活動及出版服務)由以往的
「食肆」「其他商業」組別或「工業」類別重置到現時的「零售」組別其同
時涵蓋零售及個人服務活動[2013年版修訂]The ldquoCommercialrdquo and ldquoIndustrialldquo Sectors were re-categorized in 2011 to alignwith the Hong Kong Standard Industrial Classification (HSIC) Version 20Examples of such changes are the relocations of personal service activities (such asnight clubs karaokes computer and communication repair household goodsrepair motor vehicle repair services art performance or creation activities andpublishing services etc) from the previous ldquo Restaurant ldquo Other CommercialSegments or the rdquoIndustrialrdquo Sector to the present ldquoRetailrdquo Segment which nowembraces both retail and personal service activities (Revised in 2013 Edition)
12 自2010年的能源最終用途數據包括可再生能源數據[2012年版修訂]The energy end-use data from 2010 includes renewable energy data(Revised in 2012 Edition)
11
75 76
7Chronology of Major Revisions
8 自2013年版起「空氣調節」之能源最終用途除已包括冷氣設備及暖氣機外再加
上風扇空氣清新或淨化器及抽濕機 自2001年後的「空氣調節」之能源最終用
途數據均作出修訂[2013年版修訂]The ldquoAir Conditioningrdquo energy end-use was revised in the 2013 Edition to includefans air cleanerpurifiers and dehumidifiers in addition to air conditioning unitsand heaters The ldquoAir Conditioningrdquo energy end-use data since 2001 were henceupdated (Revised in 2013 Edition)
9 自2013年版起「辦公室設備」之能源最終用途除已包括電腦及影印機外再加上
視聽器材碎紙機傳真及收銀機自2001年後的「辦公室設備」之能源最終用
途數據均作出修訂[2013年版修訂]The ldquoOffice Equipmentrdquo energy end-use was revised in the 2013 Edition to includeaudio visual equipments shredders fax and cashier machines etc in addition tocomputers and photocopiers The ldquoOffice Equipmentrdquo energy end-use data since2001 were hence updated (Revised in 2013 Edition)
10 根據住宅能源消耗調查所得的數據有關2009年至2011年的能源最終用途數據已
在2013年版中作出修訂[2013年版修訂]The energy end-use data from year 2009 to 2011 were revised in the 2013 Editionbased on the findings of energy consumption survey on the Residential Sector(Revised in 2013 Edition)
15 根據政府統計處公佈的人口及家庭住戶統計修訂數字有關2007至2010年的能源
最終用途數據己在2012年版中作出相應的修訂[2012年版修訂]The energy end-use data from years 2007 to 2010 were revised in the 2012 Editionbased on the revised population and domestic household data published by theCensus and Statistics Department (Revised in 2012 Edition)
7
17 根據政府統計處公佈的家庭住戶統計修訂數字有關2001至2006年的能源最終用
途數據己在2009年版中作出修訂[2009年版修訂]The energy end-use data from years 2001 to 2006 were revised in the 2009 Editionbased on the revised domestic household data published by the Census and StatisticsDepartment (Revised in 2009 Edition)
18 自2006年起「鐵路」之能源最終用途再不包括鐵路車站等建築物使用的電量
[2008年版修訂]The ldquoRailrdquo energy end-use do not include electricity consumption at railway stationsfrom 2006 onwards (Revised in 2008 Edition)
16 根據商業及運輸能源消耗調查所得的數據有關2003年至2007年的能源最終用途
數據已在2010年版中作出修訂[2010年版修訂]The energy end-use data from year 2003 to 2007 were revised in the 2010 Editionbased on the findings of energy consumption survey on the Commercial andTransport Sectors (Revised in 2010 Edition)
7Chronology of Major Revisions 8Units of Measurement7主要修訂年表 8計量單位
1 太焦耳 = 1012 焦耳 1 terajoule (TJ) = 1012 joules
1 千兆焦耳 = 109 焦耳 1 gigajoule (GJ) = 109 joules
1 百萬焦耳 = 106 焦耳 1 megajoule (MJ) = 106 joules
77 78
1 千兆瓦小時 = 36 x 1012 焦耳 1 gigawatt hour (GWh) = 36 x 1012 joules
1 兆瓦小時 = 36 x 109 焦耳 1 megawatt hour (MWh) = 36 x 109 joules
1 千瓦小時 = 36 x 106 焦耳 1 kilowatt hour (kWh) = 36 x 106 joules
網址 httpwwwemsdgovhk電郵 energydataemsdgovhk
79 80
Enquiries about this publication can be directed to
The Energy Efficiency OfficeElectrical amp Mechanical Services Department
7F 3 Kai Shing Street Kowloon Bay Hong Kong
Tel No (852) 2808 3465Fax No (852) 2890 6081
Homepage httpwwwemsdgovhkE-mail energydataemsdgovhk
Set of Hong Kong Energy End-use Data can be downloadedfrom EMSD website
httpswwwemsdgovhkenenergy_efficiencyenergy_end_use_data_and_consumption_indicatorshong_kong_energy_end_use_datadataindexhtml
有關本刊物的查詢請聯絡
機電工程署
香港九龍灣啟成街3號7樓
能源效益事務處 httpswwwemsdgovhktcenergy_efficiencyenergy_end_use_data_and_consumption_indicatorshong_kong_energy_end_use_datadataindexhtml
香港能源最終用途數據收錄之數據可在機電工程署網站下載
電話(852) 2808 3465圖文傳真(852) 2890 6081
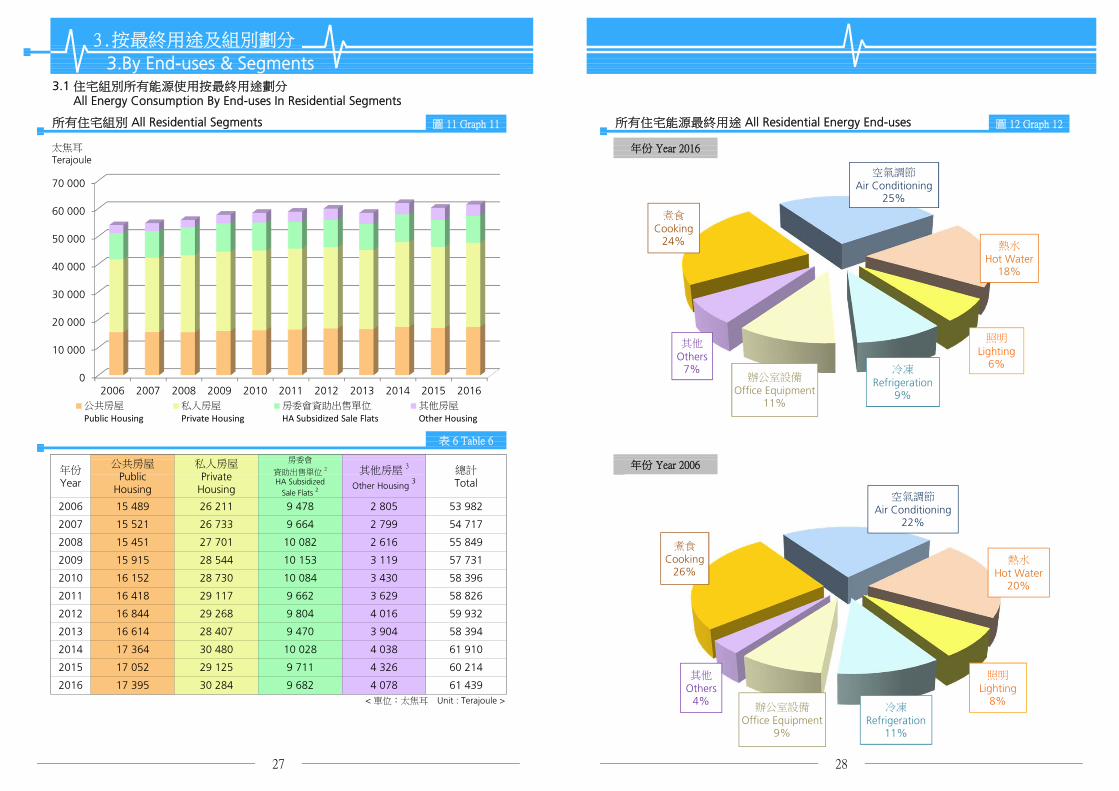
3按最終用途及組別劃分
3By End-uses amp Segments
所有住宅組別 All Residential Segments
31 住宅組別所有能源使用按最終用途劃分 All Energy Consumption By End-uses In Residential Segments
27
17 052 29 125 9 711
2016
2010
2009
2012
2011 16 418
10 028
28
所有住宅能源最終用途 All Residential Energy End-uses圖 11 Graph 11 圖 12 Graph 12
其他房屋 3
Other Housing 3
4 038
年份 Year 2016
表 6 Table 6
年份 Year 2006
太焦耳Terajoule
年份Year
公共房屋Public
Housing
私人房屋Private
Housing
房委會
資助出售單位 2
HA SubsidizedSale Flats 2
2007
61 910
57 731
53 982
58 396
58 826
59 932
58 394
lt 單位太焦耳 Unit Terajoule gt
61 439
2015 60 214
3 904
17 364 30 4802014
2013 16 614 28 407 9 470
29 117 9 662 3 629
16 844 29 268 9 804 4 016
2006
總計Total
2008
54 717
55 849
15 489 26 211 9 478 2 805
15 521 26 733 9 664 2 799
4 326
17 395 30 284 9 682 4 078
3 430
15 451 27 701 10 082 2 616
15 915
16 152
28 544 10 153 3 119
28 730 10 084
0
10 000
20 000
30 000
40 000
50 000
60 000
70 000
2006 2007 2008 2009 2010 2011 2012 2013 2014 2015 2016公共房屋
Public Housing私人房屋
Private Housing房委會資助出售單位
HA Subsidized Sale Flats 其他房屋
Other Housing
煮食
Cooking 26
空氣調節
Air Conditioning 22
熱水
Hot Water 20
照明
Lighting8
冷凍
Refrigeration 11
辦公室設備
Office Equipment9
其他
Others4
煮食
Cooking 24
空氣調節
Air Conditioning 25
熱水
Hot Water 18
照明
Lighting6冷凍
Refrigeration 9
辦公室設備
Office Equipment11
其他
Others7
1 408 529 318 375 272
1 012 561 284 343 171
1 412 527 307
364
1 159 557
1 128 554 311 347 210
3按最終用途及組別劃分
3By End-uses amp Segments
公共房屋組別 Public Housing Segment
31 住宅組別所有能源使用按最終用途劃分 All Energy Consumption By End-uses In Residential Segments
329
698 493 193
765 532 226
2 288 1 902 495 838
2 428 1 961 506 864
700 915
841
3 544
空氣調節Air
Conditioning
3 629
356
3 119
4 078
1 517
1 291 565 347 359 266 4 016 337
544 331 412 283 4 326
277 3 904
246
365 263 4 038
296
104 2 799
285 101 2 616 212
217 298
3 430 270
137
693 9 6821 133
791 545 249 294 102 2 805 211
熱水Hot
Water
照明Lighting
冷凍Refrigeration
辦公室
設備Office
Equipment
其他 1
Others 1總計Total
lt 單位太焦耳 Unit Terajoule gt
708 10 028
1 172
2 354 1 886 488 873 682 9 7111 115
1 014
519 10 084
2 163 1 949
1 896 1 954 513 816 717 9 470
585 857 567 9 6621 025
2 162 1 978 561 838 678 9 8041 127
2 302
401 9 664 909
2 216 1 992 673 940 418 10 082 977
2 190 1 927
冷凍Refrigeration
辦公室
設備Office
Equipment
其他 1
Others 1總計Total
2 157 1 976 725 886 385 9 478 844
熱水Hot
Water
563
2009
2 504
年份Year
煮食Cooking
1 977
589
照明Lighting
671
599 2008
2006
15 451
15 915
2007
2 761
2 867
2 621
676
2016 2 333
1 158
1 029
2011 2 515
2010 2 685 2 285 1 995 645 926
2012 2 459
955 468 10 153
873
1 811
2 403 945 1 777 1 044
925 1 822 1 022
959 1 788 1 878lt 單位太焦耳 Unit Terajoule gt
2015
723
1 851
1 059
照明Lighting
冷凍Refrigeration
辦公室
設備Office
Equipment
其他 1
Others 1
2012 8513 099
995
4 677
2013 4 800
2012 4 787 3 029 970 1 725
1 058
3 415 3 544
3 374
1 8762 691 3 552 958 1 679 16 614
17 364
17 052
29 117
3 421
2016 6 642
2 815
2016 4 809
3 101 1 002 27 7012 646
6 686
3 344 3 558
2015 6 341 3 048
7 201 5 256
2012 6 744
8 425 5 108 2 084
2015
2 764
6 176 5 104
2008
17 395
總計Total
2010 7 172
2009
2 148 898 2006
煮食Cooking
空氣調節Air
Conditioning
熱水Hot
Water
26 7332 4692 100 2 962 948
6 240 5 323 2 055
875
2014 4 789
5 094 2 107 8263 229 20162 848 2 167 30 284
2 155 28 407
7 364 5 101 2 208 2 743 2 008 29 268
2 204
2014
2007 6 974
2010
29 30
房委會資助出售單位組別 2
Housing Authority Subsidized Sale Flats Segment 2
年份Year
350lt 單位太焦耳 Unit Terajoule gt lt 單位太焦耳 Unit Terajoule gt
8 197
323 3583 212 20132013 6 676 6 507 5 094 2 097 2 665
3383 193 2014 827
2007
2 841 2 143 30 480
8 076 4 782 1 990 2 842 2 046 29 125
1 606
886 547 2502009 7 232
2011 7822011 7 014
6 740 5 344 2 167 3 134 1 164
6 949 5 279 2 178 3 003 1 333 28 730
28 544
2 9452 891
790
16 4182 931 3 564 942
6342008 7 334
657
2 314
2014
2013 2 402
61426 2112006 6 828 2 311
年份Year
煮食Cooking
6 122 5 074 2 830
2015
16 844
表 7 Table 7
2006
1 505
2010 4 661
2 620 3 567 952
2 849
2 870 3 557 947 1 818 742
冷凍Refrigeration
辦公室
設備Office
Equipment
其他 1
Others 1總計Total
1 825
1 367 15 489
16 152
15 521
煮食Cooking
空氣調節Air
Conditioning
熱水Hot
Water
照明Lighting
1 6421 763
1 558
1 794
2 773 3 509
2 801 3 566
3 5094 396 1 035 1 770
1 009 1 826
963 1 863
表 9 Table 9
私人房屋組別 Private Housing Segment 其他房屋組別 3 Other Housing Segment 3表 8 Table 8 表 10 Table 10
年份Year
空氣調節Air
Conditioning
1 421
2009 4 546
1 414
2008 4 467
2007 4 402
2011 4 735
fz234
太焦耳Terajoule
所有住宅能源最終用途 All Residential Energy End-uses圖 13 Graph 13
3按最終用途及組別劃分
3By End-uses amp Segments
所有住宅組別 All Residential Segments
32 住宅組別電力使用按最終用途劃分 Electricity Consumption By End-uses In Residential Segments
圖 14 Graph 14
年份 Year 2016
表 11 Table 11
35 428
總計Total
年份 Year 2006
2006
年份Year
公共房屋
PublicHousing
私人房屋Private
Housing
房委會
資助出售單位 2
HA SubsidizedSale Flats 2
其他房屋 3
Other Housing 3
9 442 5 73318 016
38 972
2010 39 344
2009
9 615
9 514
9 979
36 422
2008 37 100
2007 18 615
19 277
20 160
20 28210 100
39 872
2012 41 189
2011 5 932 2 932
6 068 3 253
20 739
21 195
10 269
10 674
39 941
2014 43 415
2013 5 810 3 159
6 351 3 334
20 500
22 522
10 473
11 209
lt 單位太焦耳 Unit Terajoule gt
31 32
11 036
11 220
21 575
22 393
6 168 3 588
6 117 3 390
42 368
2016
2015
43 120
6 333 2 500
6 234 2 727
2 236
5 972 2 220
6 222 2 088
0
5 000
10 000
15 000
20 000
25 000
30 000
35 000
40 000
45 000
2006 2007 2008 2009 2010 2011 2012 2013 2014 2015 2016
公共房屋
Public Housing私人房屋
Private Housing房委會資助出售單位
HA Subsidized Sale Flats 其他房屋
Other Housing
煮食Cooking
9
空氣調節Air Conditioning
35
熱水Hot Water
8 照明Lighting
9
冷凍Refrigeration
14
辦公室設備Office
Equipment15
其他Others10
煮食Cooking
9
空氣調節Air Conditioning
34
熱水Hot Water
11 照明Lighting
12
冷凍Refrigeration
16辦公室設備Office
Equipment13
其他Others
5
3按最終用途及組別劃分
3By End-uses amp Segments
公共房屋組別 Public Housing Segment
32 住宅組別電力使用按最終用途劃分 Electricity Consumption By End-uses In Residential Segments
350 272 3 3902016 1 882 8 197 1 965 2 107 2 848 3 229 2 166 22 393
2014 1 861 8 425 1 976 2 084 2 841
2015 1 777 8 076 1 797
lt 單位太焦耳 Unit Terajoule gt lt 單位太焦耳 Unit Terajoule gt
33 34
3 048 2 045 21 575 2015 323 1 517 359 331 412 364 283 3 588
2016 311 1 408 357 318 375
1 990 2 842
338 263 3 3343 193 2 142 22 522 2014 300 1 412 350 307 365
3 212 2 155 20 500 2013 316 1 159 370 323 358 356 277 3 159
347 3592012 1 847 7 364 1 925 2 208 2 743
2013 1 872 6 507 1 993 2 097 2 665
337 266 3 2533 099 2 007 21 195 2012 304 1 291 349
2 945 1 604 20 739 2011 267 1 128 373 311 347 296 210 2 932
284 3432010 1 779 6 949 2 228 2 178 3 003
2011 1 808 7 201 2 086 2 204 2 891
270 171 2 7272 815 1 330 20 282 2010 243 1 012 406
2 764 1 158 20 160 2009 221 886 430 250 329 246 137 2 500
193 2852008 1 812 6 240 2 431 2 055 3 101
2009 1 807 6 740 2 389 2 167 3 134
212 101 2 0882 646 992 19 277 2008 189 698 410
2 469 939 18 615 2007 180 765 431 226 298 217 104 2 220
249 2942006 1 592 6 122 2 123 2 148 2 830
2007 1 698 6 176 2 271 2 100 2 962
211 102 2 2362 311 890 18 016 2006 162 791 428
辦公室
設備Office
Equipment
其他 1
Others 1總計Total
年份Year
煮食Cooking
空氣調節Air
Conditioning
熱水Hot
Water
照明Lighting
冷凍Refrigeration
辦公室
設備Office
Equipment
其他 1
Others 1總計Total
lt 單位太焦耳 Unit Terajoule gt lt 單位太焦耳 Unit Terajoule gt
私人房屋組別 Private Housing Segment 其他房屋組別 3 Other Housing Segment 3表 13 Table 13 表 15 Table 15
年份Year
煮食Cooking
空氣調節Air
Conditioning
熱水Hot
Water
照明Lighting
冷凍Refrigeration
1 878 1 038 11 220 2016 576 2 288 102 495 838 1 133 684 6 117
488 8732015 1 115 3 374 987 925 1 822
2016 1 157 3 344 1 056 959 1 788
1 115 674 6 1681 811 1 002 11 036 2015 568 2 354 97
1 851 1 023 11 209 2014 589 2 428 106 506 864 1 158 699 6 351
513 8162013 1 155 2 691 1 076 958 1 679
2014 1 140 3 415 1 059 945 1 777
1 172 708 5 8101 876 1 037 10 473 2013 597 1 896 108
1 794 974 10 674 2012 605 2 162 105 561 838 1 127 669 6 068
585 8572011 1 055 2 931 1 118 942 1 763
2012 1 120 3 029 1 062 970 1 725
1 025 556 5 9321 642 817 10 269 2011 613 2 163 133
1 558 717 10 100 2010 667 2 285 178 645 926 1 029 504 6 234
676 9552009 951 2 801 1 252 963 1 863
2010 1 004 2 870 1 187 947 1 818
1 014 450 6 3331 505 644
1 414 563
9 979 2009 709 2 302 227
1 421 570 9 514 2008 744 2 216 277
其他 1
Others 1總計Total
2006 587 2 157 171
673 940 977
380 5 972
照明Lighting
2 773 1 181 1 009 1 826
2008 862 2 620 1 264 952 1 825
表 14 Table 14
總計Total
年份Year
煮食Cooking
空氣調節Air
Conditioning
熱水Hot
Water
5 733
冷凍Refrigeration
房委會資助出售單位組別 2
Housing Authority Subsidized Sale Flats Segment 2表 12 Table 12
725 886 844 364
395 6 222
700 915 909
辦公室
設備Office
Equipment
年份Year
2006
辦公室
設備Office
Equipment
其他 1
Others 1
9 615 2007 659 2 190 218
1 367 539 9 442
煮食Cooking
空氣調節Air
Conditioning
熱水Hot
Water
照明Lighting
冷凍Refrigeration
813 2 849 1 070 1 035 1 770
2007 850
3按最終用途及組別劃分
3By End-uses amp Segments
所有商業組別 All Commercial Segments
33 商業類別所有能源使用按最終用途劃分 All Energy Consumption By End-uses In Commercial Segments
12 570 - - -
-
太焦耳Terajoule
63 251
46 037
21 340 17 942 12 791 15 799
21 290 17 928 12 915 16 331 5 887 3 286
67 577
5 753
21 316 17 506
21 165 17 332
46 632
45 816
12 484 - -
3 270
12 663 14 017 5 563 3 273
118 558
121 2153 215 45 328
2012 120 970
61 790
23 397 16 213 13 190 - -
23 299 15 9602009 11 788 - -
24 185 15 711 12 195 - - - 64 300
22 929 16 624
-
2013
13 182 16 453 5 968 3 324 46 536
21 397 17 612 12 544 15 539 5 581
35 36
年份 Year 2016
年份 Year 2006
24 157
123 674
113 914
2008 113 75315 686 11 894
2007
- - - 62 015
2011
114 297
2010 116 391
2016 123 969lt 單位太焦耳 Unit Terajoule gt
圖 16 Graph 16所有商業能源最終用途 All Commercial Energy End-uses圖 15 Graph 15
總計Total
2006 111 884
表 16 Table 16
年份Year
- 59 084
食肆Restaurant
零售Retail
辦公室Office
住宿Accomodation
醫療HumanHealth
教育Education
其他商業Other
Commercial
21 163 17 343
2015
2014 122 711
0
20 000
40 000
60 000
80 000
100 000
120 000
140 000
2006 2007 2008 2009 2010 2011 2012 2013 2014 2015 2016
食肆
Restaurant零售
Retail辦公室
Office住宿
Accomodation醫療
Health教育
Education其他商業
Other Commercial
煮食
Cooking14
空氣調節
Air Conditioning 24
照明
Lighting12
熱水及冷凍
Hot water amp Refrigeration
12
辦公室設備
Office Equipment5
其他
Others33
煮食
Cooking15
空氣調節
Air Conditioning 27
照明
Lighting15
熱水及冷凍
Hot water amp Refrigeration
8
辦公室設備
Office Equipment5
其他
Others30
3按最終用途及組別劃分
3By End-uses amp Segments
食肆組別 Restaurant Segment
33 商業類別所有能源使用按最終用途劃分 All Energy Consumption By End-uses In Commercial Segments
11 788
1 743 1 543 2 352 12 195
14 166
表 19 Table 19
2010
2009
年份Year
1 7002008 24 157
22 929 20071 761 7092007 6 971
923
885
1 954 905
總計Total
511
23 299 2009
6 557
總計Total
1 829 13 190
2008 6 395
2 517 13 182
1 599 2 446 12 663
1 806 1 596 2 441
2 416 12 791
1 809
1 571
12 544
2 479 12 915
5 401 2 054 810
785
2016 1 862 1 6467 158
525
2013
2015
2014
2 055 821 532 21 397
2 054 819
21 165 1 577
6 983
6 701
1 784
689
17 343 2016
4 1835 625 -2011
6 338
7 523
5 701 4 177 7 628
5 583 4 250
5 754 4 310
7 901
1 773
5 706
5 805
1 833 1 620 525
12 528
lt 單位太焦耳 Unit Terajoule gt
零售組別 Retail Segment 表 18 Table 18
總計Total
4 115
2009
2014 21 340
其他 1
Others 1
21 163
照明Lighting
811
807 524
21 2902 081
2 085
530
2007
年份Year
4 1192006
2008
-
6 809
lt 單位太焦耳 Unit Terajoule gt lt 單位太焦耳 Unit Terajoule gt
2013
14 0173 273 4 5551 384 4 21917 506 20122012
7 779 15 5393 623 5 0341 550
1 645 4 931 6975 582 4 189 7 572
辦公室設備Office
Equipment
6 711
4 67517 612 2013
7 864
lt 單位太焦耳 Unit Terajoule gt
住宿組別 Accommodation Segment 表 20 Table 20
總計Total
空氣調節Air
Conditioning
熱水及冷凍4
Hot Water ampRefrigeration4
照明Lighting
其他 1
Others 1年份Year
-- -- -17 332
7 031
- -
2013
2016
2015 12 389 5 483
12 358 5 402
5 398
5 498
15 711 20102010 -5 7154 122
5 799
5 875
663
2011
586
657
37 38
16 4533 855 5 325
15 7993 762 5 0951 565 4 71417 942 20144 241
16 3313 890 5 2511 627 4 87217 928 20152015
2014
2016
-
-- -- -
--5 865 -15 686 2008
4 187
- -
15 960 2009 -
-
6 793
5 968
13 507 5 960
-- -- -16 624 20076 689 4 890 5 045 -
-- -- -16 213 20065 300
空氣調節Air
Conditioning
12 591
12 426
14 049 5 525
6 082 1 991
照明Lighting
辦公室設備Office
Equipment
其他 1
Others 1
2 019
2012
20112011 12 622 5 237 2 009
973
21 316 2012
24 185 201013 404 6 594 2 1181 001 1 069
辦公室組別 Office Segment表 17 Table 17
23 397 2006 7 187
1 802 1 777 12 570
2 412 12 484
1 505 2 294 11 894
1 684 1 491 2 274
995
- -
2006
年份Year
煮食Cooking
空氣調節Air
Conditioning
熱水及冷凍4
Hot Water ampRefrigeration4
照明Lighting
其他 1
Others 1
2 026 2 14914 215 584
空氣調節Air
Conditioning
5 863 1 7251 011
5 596 1 486
5 561 5 518 1 478 1 918
46 536
31 341 45 816
5 587 5 571 1 486 1 911 31 482 46 037
5 430
34 746 64 300
11 225 7 603 2 684 8 396 37 669 67 577
32 327 46 6325 402 5 516
9 672 7 207 3 092 8 255
1 527 1 860
10 154 7 586 3 156 8 659
45 328
10 572 7 766
130
- - -
-
61 790
131 538
33 790 62 015
9 860 7 321 3 087 8 231 34 751 63 251
2010
- 2009
- 2008
- - -
- - -
59 084
-
其他 1
Others 1
lt 單位太焦耳 Unit Terajoule gt
5 968 2016 1 845 32 179
5 581 2013
5 563 2012
-
-
- 2011
-
5 486
3 273
照明Lighting
辦公室設備Office
Equipment
熱水及冷凍4
Hot Water ampRefrigeration4
其他 1
Others 1
546
542
-
31 558
-
533
1 475 1 832 31 132
- 2007
5 402
2 573 6 616
10 348 7 527 2 881 7 714 33 321
39 40
2016 3 324
2015 3 2861 606
lt 單位太焦耳 Unit Terajoule gt
3 270
1 613 681 337 138 556
1 603
666 330 137
661 327 137
- -
2014
2013 1 563
2012
2011 -
1 602
- - -
-
- -
-
671 332
- -
3 215 661 327
2006 -
-
2010 -
2009 --
lt 單位太焦耳 Unit Terajoule gt
教育組別 Education Segment 表 22 Table 22
2008 -
2007 -- -
年份Year
總計Total
空氣調節Air
Conditioning
照明Lighting
辦公室設備Office
Equipment
熱水及冷凍4
Hot Water ampRefrigeration4
-
2016 1 257 303 298 2 218 1 892
5 887 2015
5 753 20142014 1 237 289 285 2 126 1 817
2015 1 261 297 292 2 176 1 862
2012 1 189 283 279 2 057 1 754
2013 1 178 284 280 2 071 1 768
2010 - - - - -
2011 - - - - -
2008 - - - - -
2009 - - - - -
20062006 - - - - -
2007 - - - - -
3按最終用途及組別劃分
3By End-uses amp Segments
醫療組別 Human Health Segment
33 商業類別所有能源使用按最終用途劃分 All Energy Consumption By End-uses In Commercial Segments
其他商業組別 Other Commercial Segments表 21 Table 21 表 23 Table 23
年份Year
空氣調節Air
Conditioning
照明Lighting
辦公室設備Office
Equipment
熱水及冷凍4
Hot Water ampRefrigeration4
其他 1
Others 1總計Total
年份Year
空氣調節Air
Conditioning
總計Total
12 106 3 537 3 198
12 381 16 826 12 915 12 043 3 489 3 158 42 881 103 693
lt 單位太焦耳 Unit Terajoule gt
41 42
101 480
2014 12 379 16 742 12 791 11 615 3 412 3 144 42 544 102 627
2016 12 330 16 306 13 182 43 223 103 881
2015
43 748 101 813
2013 12 336 16 435 12 544 11 386 3 317 3 102 42 361
2012 12 265 16 442 12 663 10 211 3 321 3 164
2011 11 894 16 339 12 484 - - - 58 877 99 594
2010 14 372 15 711 12 195 - - - 55 616 97 894
2009 12 990 15 960 11 788 - - - 55 991 96 728
2008 13 257 15 686 11 894 - - - 54 706 95 543
2007 11 681 16 624 12 570 - - - 54 176 95 051
所有商業能源最終用途 All Commercial Energy End-uses圖 17 Graph 17 圖 18 Graph 18
年份 Year 2016太焦耳Terajoule
3按最終用途及組別劃分
3By End-uses amp Segments
所有商業組別 All Commercial Segments
34 商業類別電力使用按最終用途劃分 Electricity Consumption By End-uses In Commercial Segments
年份 Year 2006
2006 12 136
表 24 Table 24
年份Year
食肆Restaurant
零售Retail
辦公室Office
住宿Accomodation
醫療HumanHealth
教育Education
其他商業Other
Commercial
總計Total
16 213 13 190 - - - 51 779 93 317
0
20 000
40 000
60 000
80 000
100 000
120 000
2006 2007 2008 2009 2010 2011 2012 2013 2014 2015 2016
食肆
Restaurant零售
Retail辦公室
Office住宿
Accomodation醫療
Health教育
Education其他商業
Other Commercial
煮食
Cooking7
空氣調節
Air Conditioning 29
照明
Lighting15
熱水及冷凍
Hot Water amp Refrigeration
8
辦公室設備
Office Equipment6
其他
Others35
煮食
Cooking6
空氣調節
Air Conditioning 33
照明
Lighting17
熱水及冷凍
Hot Water amp Refrigeration
5
辦公室設備
Office Equipment6
其他
Others33
1 527 4 381 12 106lt 單位太焦耳 Unit Terajoule gt lt 單位太焦耳 Unit Terajoule gt
43 44
2016 5 582 4 189 6 535 16 306 2016 3 855 1 645
3按最終用途及組別劃分
3By End-uses amp Segments
食肆組別 Restaurant Segment
34 商業類別電力使用按最終用途劃分 Electricity Consumption By End-uses In Commercial Segments
2013 3 623
697
1 502 4 334 12 043
2014 5 799 4 241 6 701 16 742 2014 3 762 1 565 663 1 459 4 167 11 615
2015 5 754 4 310 6 762 16 826 2015 3 890
2011 -
1 627 689
1 429 4 127 11 386
2012 5 701 4 177 6 565 16 442 2012 3 273 1 384 586 1 282 3 686 10 211
2013 5 583 4 250 6 601 16 435
2009 -
1 550 657
- - -
2010 5 875 4 122 5 715 15 711 2010 - - - - - -
2011 5 625 4 183 6 530 16 339
2007 -
- -
- - -
2008 5 865 4 115 5 706 15 686 2008 - - - - - -
2009 5 968 4 187 5 805 15 960
年份Year
空氣調節Air
Conditioning
照明Lighting
其他 1
Others 1總計Total
年份Year
- -
-
2006 6 793 5 300 4 119 16 213 2006 - - - -
2007 6 689 4 890 5 045 16 624
空氣調節Air
Conditioning
照明Lighting
辦公室設備Office
Equipment
熱水及冷凍4
Hot Water ampRefrigeration4
其他 1
Others 1
13 182
- -
總計Total
- -
- -
零售組別 Retail Segment 住宿組別 Accommodation Segment表 26 Table 26 表 28 Table 28
12 330 2016 7 158 1 862 1 646 2 517
2 479 12 915
2016 4 039 5 402 819 1 595 474lt 單位太焦耳 Unit Terajoule gt lt 單位太焦耳 Unit Terajoule gt
1 773 1 571 2 416 12 791
2015 3 998 5 483 811 1 620 469 12 381 2015 6 983
2014 3 981 5 498 807 1 625 467 12 379 2014 7 031
1 833 1 620
1 809 1 599 2 446 12 663
2013 4 048 5 398 821 1 594 475 12 336 2013 6 701 1 806 1 596 2 441 12 544
2012 3 991 5 401 810 1 595 469 12 265 2012 6 809
1 743 1 543 2 352 12 195
2011 3 870 5 237 785 1 547 454 11 894 2011 6 711 1 784 1 577 2 412 12 484
2010 4 120 6 594 1 001 1 647
11 894
2009 3 724 5 960 905 1 488 913 12 990 2009 6 338 1 684 1 491 2 274 11 788
2008 3 801 6 082 923 1 519
1 829
1 777 2 019
1 010 14 372 2010 6 557
1 700 1 505 2 294
1 802
932 13 257 2008 6 395
2 026 2 1491 241 519 12 136 2006 7 187
3 352 5 525 885 1 275 644 11 681 2007 6 971
辦公室組別 Office Segment表 25 Table 25 表 27 Table 27
年份Year
煮食Cooking
空氣調節Air
Conditioning
照明Lighting
熱水及冷凍4
Hot Water ampRefrigeration4
其他 1
Others 1總計Total
年份Year
空氣調節Air
Conditioning
照明Lighting
辦公室設備Office
Equipment
其他 1
Others 1總計Total
13 190
2007 12 570
2006 3 502 5 863 1 011
3按最終用途及組別劃分
3By End-uses amp Segments
醫療組別 Human Health Segment
34 商業類別電力使用按最終用途劃分 Electricity Consumption By End-uses In Commercial Segments
1 257 303 298 316 1 363 3 537
1 613 681 337 95 472 3 198lt 單位太焦耳 Unit Terajoule gt
45 46
3 158
3 102
-
3 164
- - - -
2012 1 602 671 332 94 465
2011 -
458 3 1442014 1 603 661 327 94
2013 1 563 661 327 92 458
2016
1 606 666 330 94 4622015
2009 - - - - - -
2010 - - - - - -
2008 - - - - - -
2007 -
2006 - - - - - -
- - - - -
5 596 1 486 1 807 28 904 43 223lt 單位太焦耳 Unit Terajoule gt lt 單位太焦耳 Unit Terajoule gt
其他 1
Others 1總計Total
年份Year
空氣調節Air
Conditioning
照明Lighting
辦公室設備Office
Equipment
熱水及冷凍4
Hot Water ampRefrigeration4
1 335 3 489
2016 5 4302016
1 261 297 292 305
教育組別 Education Segment 表 30 Table 30
1 478 1 847 28 140 42 544
2015 2015 5 587 5 571 1 486 1 850 28 388 42 881
2013 5 402 5 486 1 475 1 780 28 218 42 361
2014 1 237 289 285 301 1 301 3 412 2014 5 561
2013 1 178 284 280 295 1 280 3 317
5 518
2 684 3 408 33 957 58 877
2012 1 189 283 279 294 1 275 3 321 2012 5 402 5 516 1 527 1 810 29 492 43 748
2010 10 154 7 586 3 156 3 886 30 835 55 616
2011 - - - - - - 2011 11 225
2010 - - - - - -
7 603
31 079 54 706
2009 - - - - - - 2009 9 860 7 321 3 087 3 676 32 047 55 991
7 207 3 0922008 - - - - - - 2008 9 672
2007 10 348 7 527 2 881 2 863
3 657
30 558 54 1762007 - - - - - -
- - 2006 10 572 7 766 2 573 2 069 28 800 51 779
其他商業組別 Other Commercial Segments表 29 Table 29 表 31 Table 31
年份Year
空氣調節Air
Conditioning
照明Lighting
辦公室設備Office
Equipment
熱水及冷凍4
Hot Water ampRefrigeration4
其他 1
Others 1總計Total
年份Year
空氣調節Air
Conditioning
照明Lighting
辦公室設備Office
Equipment
熱水及冷凍4
Hot Water ampRefrigeration4
其他 1
Others 1總計Total
2006 - - - -
3按最終用途及組別劃分
3By End-uses amp Segments
所有工業組別 All Industrial Segments
35 工業類別所有能源使用按最終用途劃分 All Energy Consumption By End-uses In Industrial Segments
圖 20 Graph 20
年份 Year 2016
年份 Year 2006
所有工業能源最終用途 All Industrial Energy End-uses
695 5 188 2 770 3 344 2 585 14 5832013
5 166 2 659 3 377 2 732 14 7232012 789
494 5 549 3 010 3 395 2 404 14 8532015
5 334 2 967 3 337 2 501 14 7182014 579
47 48
5 080 2 906 3 312 2 292 13 992lt 單位太焦耳 Unit Terajoule gt
2016 402
864 4 938 2 450 3 504 2 976 14 7322011
4 135 2 718 3 888 4 095 16 0532010 1 217
1 373 3 829 2 695 4 036 4 196 16 1292009
4 009 2 804 4 255 4 454 17 3322008 1 809
3 086 3 815 4 788 17 6452007 2 019 3 935
4 209 4 985 18 9342006 2 249 4 629 2 863
圖 19 Graph 19
太焦耳
Terajoule
其他工業 7
OtherIndustries 7
總計Total
年份Year
紡織及服裝製品Textile amp
Wearing Apparel
非製造業 6
Non-manufacturing 6
食品及飲品Food amp
Beverage
金屬及機械Metal amp
Machinery
表 32 Table 32
0
2 000
4 000
6 000
8 000
10 000
12 000
14 000
16 000
18 000
20 000
2006 2007 2008 2009 2010 2011 2012 2013 2014 2015 2016
紡織及服裝製品
Textile ampWearing Apparel
非製造業
Non‐manufacturing
食品及飲品
Food ampBeverage
金屬及機械
Metal ampMachinery
其他工業
OtherIndustries
工業生產設備
Industrial ProcessEquipment
54
照明
Lighting6
空氣調節
Air Conditioning17
其他
Others23
工業生產設備
Industrial ProcessEquipment
53
照明
Lighting7
空氣調節
Air Conditioning22
其他
Others18
3按最終用途及組別劃分
3By End-uses amp Segments
紡織及服裝製品組別 Textile amp Wearing Apparel Segment
35 工業類別所有能源使用按最終用途劃分 All Energy Consumption By End-uses In Industrial Segments
食品及飲品組別 Food amp Beverage Segment表 33 Table 33 表 35 Table 35
年份Year
工業生產設備 5
Industrial ProcessEquipment 5
照明Lighting
空氣調節Air
Conditioning
其他1
Others1總計Total
年份Year
工業生產設備 5
Industrial ProcessEquipment 5
照明Lighting
空氣調節Air
Conditioning
其他1
Others1總計Total
466 455 2 863
2007 880 194 685 260 3 0862 019 2007 1 922 159 509 497
2006 997 210 757 284 2 249 2006 1 797 146
430 425 2 804
2009 637 123 446 167 1 373 2009 1 775 125 399 397 2 695
2008 834 163 592 221 1 809 2008 1 815 134
2010 574 106 391 145 2 718
2011 446 68 256 94 864 2011 1 743 95
1 217 2010 1 793 125 400 399
303 310 2 450
311 318 2 659
2013 367 53 203 74 2 770 695 2013 2 047 97 309 317
2012 416 59 230 83 789 2012 1 934 97
340 344 2 967
2015 262 36 145 51 494 2015 2 218 106 342 345 3 010
2014 303 44 171 61 579 2014 2 177 106
2016 210 31 118 43 2 906lt 單位太焦耳 Unit Terajoule gt lt 單位太焦耳 Unit Terajoule gt
非製造業組別 6 Non-manufacturing Segment6金屬及機械組別 Metal amp Machinery Segment表 34 Table 34 表 36 Table 36
402 2016 2 117 106 337 346
年份Year
工業生產設備 5
Industrial ProcessEquipment 5
照明Lighting
空氣調節Air
Conditioning
其他1
Others1總計Total
年份Year
工業生產設備 5
Industrial ProcessEquipment 5
照明Lighting
空氣調節Air
Conditioning
其他1
Others1總計Total
2006 1 794 114 925 1 376 4 2092006 2 013 588 992 1 035 4 629
2007 1 626 103 837 1 249 3 8152007 1 711 500 850 873 3 935
2008 1 819 105 857 1 475 4 2552008 1 823 488 810 888 4 009
2009 1 729 97 791 1 419 4 0362009 1 764 460 762 843 3 829
2010 1 665 94 761 1 367 3 8882010 1 907 496 819 913 4 135
2011 1 513 65 565 1 360 3 5042011 2 143 509 940 1 346 4 938
2012 1 460 63 544 1 309 3 3772012 2 272 540 985 1 370 5 166
2013 1 452 62 534 1 296 3 3442013 2 246 536 969 1 437 5 188
2014 1 445 62 541 1 290 3 3372014 2 295 547 1 003 1 490 5 334
2015 1 470 63 551 1 312 3 3952015 2 401 571 1 041 1 536 5 549
2016 1 440 61 529 1 282 3 3122016 2 179 522 949 1 430 5 080lt 單位太焦耳 Unit Terajoule gt lt 單位太焦耳 Unit Terajoule gt
49 50
2015 346 4 024 1 349 1 217 2 307 9 242
1 226 1 192 2 476 9 144
3 880 1 344 1 195 2 402 9 2302014 409
14 015
2007 1 682 3 032 2 012 1 882 4 496 13 104
1 232 1 208 2 616 9 356
12 182
1 200 1 255 2 844 9 5302011 619 3 613
2009 1 089 2 799 1 579 1 779 3 896 11 143
2010
2012 553 3 747
2013 489 3 761
951 3 023 1 585 1 714 3 808 11 082
2007 3 295 277 980 236 4 788
1 701 1 926 4 140
1 842 2 080 4 670
2008 1 443 2 971
2006 1 851 3 572
2008 3 051 257 915 231 4 454
35 工業類別所有能源使用按最終用途劃分 All Energy Consumption By End-uses In Industrial Segments
所有工業組別 All Industrial Segments
36 工業類別電力使用按最終用途劃分 Electricity Consumption By End-uses In Industrial Segments
3按最終用途及組別劃分
3By End-uses amp Segments
2006 3 415 290 1 029 251 4 985
圖 21 Graph 21
年份
Year
工業生產設備 5
Industrial ProcessEquipment 5
照明Lighting
空氣調節Air
Conditioning
其他1
Others1總計Total
太焦耳
Terajoule
表 37 Table 37其他工業組別 7 Other Industrial Segments 7
2010 2 800 237 844 213 4 095
2009 2 865 242 863 225 4 196
2012 1 872 166 568 125 2 732
2011 2 030 180 627 140 2 976
2014 1 711 154 520 116 2 501
2013 1 781 158 528 119 2 585
2016 1 568 144 471 110 2 292
2015 1 635 149 502 118 2 404
表 38 Table 38
年份Year
紡織及服裝製品Textile amp
Wearing Apparel
非製造業 6
Non-manufacturing 6
食品及飲品Food amp
Beverage
金屬及機械Metal amp
Machinery
其他工業 7
OtherIndustries 7
總計Total
lt 單位太焦耳 Unit Terajoule gt
2 206 8 709
51 52
lt 單位太焦耳 Unit Terajoule gt
2016 286 3 699 1 339 1 179
0
2 000
4 000
6 000
8 000
10 000
12 000
14 000
16 000
2006 2007 2008 2009 2010 2011 2012 2013 2014 2015 2016
紡織及服裝製品
Textile ampWearing Apparel
非製造業
Non‐manufacturing
食品及飲品
Food ampBeverage
金屬及機械
Metal ampMachinery
其他工業
OtherIndustries
圖 22 Graph 22 紡織及服裝製品組別 Textile amp Wearing Apparel Segment 表 39 Table 39
年份 Year 2016
所有工業能源最終用途 All Industrial Energy End-uses
36 工業類別電力使用按最終用途劃分 Electricity Consumption By End-uses In Industrial Segments
3按最終用途及組別劃分
3By End-uses amp Segments
年份 Year 2006
53
年份Year
工業生產設備 5
Industrial ProcessEquipment 5
照明Lighting
空氣調節Air
Conditioning
其他1
Others1總計Total
2006 604 210 757 279 1 851
2007 547 194 685 255 1 682
1 443
2009 356 123 446 164 1 089
2008 472 163 592 217
951
2011 203 68 256 92 619
2010 312 106 391 142
553
2013 162 53 203 72 489
2012 182 59 230 81
409
2015 114 36 145 50 346
2014 134 44 171 60
286lt 單位太焦耳 Unit Terajoule gt
非製造業組別 6 Non-manufacturing Segment 6 表 40 Table 40
年份Year
工業生產設備 5
Industrial ProcessEquipment 5
照明Lighting
空氣調節Air
Conditioning
其他1
Others1總計Total
2016 94 31 118 42
3 572
2007 893 500 850 788 3 032
2006 1 057 588 992 934
2 971
2009 836 460 762 742 2 799
2008 886 488 810 787
3 023
2011 949 509 940 1 215 3 613
2010 904 496 819 804
3 747
2013 962 536 969 1 295 3 761
2012 993 540 985 1 230
3 880
2015 1 028 571 1 041 1 384 4 024
2014 986 547 1 003 1 345
3 699lt 單位太焦耳 Unit Terajoule gt
54
2016 936 522 949 1 292
工業生產設備
Industrial ProcessEquipment
41 照明
Lighting10
空氣調節
Air Conditioning27
其他
Others22
工業生產設備
Industrial ProcessEquipment
46
照明
Lighting9
空氣調節
Air Conditioning30
其他
Others15
其他工業組別 7 Other Industrial Segments 7表 41 Table 41 表 43 Table 43
年份Year
工業生產設備 5
Industrial ProcessEquipment 5
照明Lighting
空氣調節Air
Conditioning
其他1
Others1總計Total
年份Year
工業生產設備 5
Industrial ProcessEquipment 5
照明Lighting
空氣調節Air
Conditioning
其他1
Others1總計Total
1 029 216 4 670
2007 883 159 509 462 4 4962 012 2007 3 030 277 980 208
2006 808 146 466 423 1 842 2006 3 135 290
915 191 4 140
2009 693 125 399 363 1 579 2009 2 610 242 863 181 3 896
2008 746 134 430 390 1 701 2008 2 777 257
2010 695 125 400 365 3 808
2011 526 95 303 277 1 200 2011 1 904 180
1 585 2010 2 548 237 844 178
627 133 2 844
568 123 2 616
2013 536 97 309 284 2 4761 226 2013 1 674 158 528 116
2012 540 97 311 284 1 232 2012
金屬及機械組別 Metal amp Machinery Segment 表 42 Table 42
1 339 2016 1 484 144 471 108
1 759 166
520 114
2015 592 106 342 309 1 349 2015 1 544 149 502 112
2014
2016 585 106 337 310
1 614 154
2 206lt 單位太焦耳 Unit Terajoule gt lt 單位太焦耳 Unit Terajoule gt
2 402
2 307
590 106 340 308 1 344 2014
2006 810 114 925 231 2 080
年份Year
工業生產設備 5
Industrial ProcessEquipment 5
照明Lighting
空氣調節Air
Conditioning
其他1
Others1總計Total
2008 751 105 857 214 1 926
2007 733 103 837 209 1 882
2010 668 94 761 190 1 714
2009 694 97 791 198 1 779
2012 466 63 544 136 1 208
2011 484 65 565 141 1 255
2014 459 62 541 134 1 195
2013 461 62 534 134 1 192
3按最終用途及組別劃分
3By End-uses amp Segments
食品及飲品組別 Food amp Beverage Segment
36 工業類別電力使用按最終用途劃分 Electricity Consumption By End-uses In Industrial Segments
55 56
lt 單位太焦耳 Unit Terajoule gt
2016 456 61 529 133 1 179
2015 467 63 551 136 1 217
表 45 Table 45
太焦耳Terajoule
年份Year
貨車Goods Vehicle
其他
Others 總計Total
貨運組別 Freight Segments圖 23 Graph 23
3按最終用途及組別劃分
3By End-uses amp Segments
所有運輸組別 All Transport Segments
37 運輸類別所有能源使用按最終用途劃分 All Energy Consumption By End-uses In Transport Segments
32 551 6 601 39 152 0
2007
2006
31 771 6 411 38 182 0
0
2009 28 501 5 424 33 925 0
2008 30 438 5 929 36 367
0
2011 28 010 4 134 32 144 0
2010 28 585 4 744 33 329
0
2013 25 534 3 305 28 839 0
2012 26 941 3 826 30 767
0
2015
0
lt 單位太焦耳 Unit Terajoule gt
2014 25 009 3 264 28 273
24 782 3 269 28 051 0
2016
總計Total
年份Year
貨運Freight
客運Passenger
總計Total
年份Year
巴士Bus
24 721 2 961 27 682
客運組別 Passenger Segments表 44 Table 44 表 46 Table 46
41 57 251 59 96 404
的士Taxi
汽車Car
電單車Motorcycle
鐵路Rail
其他
Others
14 102 17 118 463 2 495 3 973 57 983
4 017 57 251
2007 38 182 40 57 983 60 96 165 2007 19 832
2006 20 301 13 797 16 267 426 2 4442006 39 152
56 718
3 965 58 137
2009 33 925 37 56 718 63 90 643 2009 19 150
2008 18 971 15 142 17 059 480 2 5202008 36 367 38 58 137 62 94 504
37 57 560 63 90 889
13 131 17 449 465 2 523 4 000
13 593 18 879 424 2 609 4 213 58 630
4 124 57 560
2011 32 144 35 58 630 65 90 774 2011 18 911
2010 18 842 13 373 18 247 436 2 5402010 33 329
61 359
4 354 59 656
2013 28 839 32 61 359 68 90 198 2013 19 144
2012 19 128 13 469 19 561 423 2 7222012 30 767 34 59 656 66 90 423
31 61 725 69 89 999
13 319 21 158 406 2 796 4 536
13 039 21 764 448 2 972 4 631 61 195
4 547 61 725
2015 28 051 31 61 195 69 89 245 2015 18 341
2014 18 659 14 133 21 085 426 2 8752014 28 273
57 58
4 636 62 136lt 單位太焦耳 Unit Terajoule gt lt 單位太焦耳 Unit Terajoule gt
此項之最終用途包括船隻及香港內部的航空運輸能源的使用等 End-uses under this heading include marine and internal air transportation energy uses etc
2016 18 918 12 288 22 881 463 2 9512016 27 682 31 62 136 69 89 819
0
10 000
20 000
30 000
40 000
50 000
60 000
70 000
80 000
90 000
100 000
2006 2007 2008 2009 2010 2011 2012 2013 2014 2015 2016
貨運
Freight客運
Passenger
4按燃料及類別劃分
4By Fuels amp Sectors
41 所有能源使用按燃料劃分
All Energy Consumption By Fuels圖 24 Graph 24 圖 25 Graph 25
3按最終用途及組別劃分
3By End-uses amp Segments
所有運輸能源最終用途 All Transport Energy End-uses
37 運輸類別所有能源使用按最終用途劃分 All Energy Consumption By End-uses In Transport Segments
年份 Year 2016 太焦耳Terajoule
表 47 Table 47
年份 Year 2006 年份Year
煤氣及石油氣Town Gas amp
Liquefied Petroleum Gas
油及煤產品Oil amp CoalProducts
電力Electricity
總計Total
2006 48 482 17 87 518 31 145 204 52 281 204 100
2007 48 721 17 86 647 31 147 072 52 282 440 100
52 281 438 100
2009 47 239 17 82 194 29 149 366 54
2008 49 732 18 84 361 30 147 345
278 799 100
2010 49 084 17 81 786 29 150 859 54 281 729 100
2011 49 568 18 81 716 29 151 606 54 282 890 100
54 286 048 100
2013 49 723 17 81 306 29 153 362 54
2012 49 616 17 81 352 28 155 079
284 391 100
2014 50 844 18 80 347 28 158 147 55 289 338 100
2015 48 954 17 80 757 28 158 275 55 287 986 100
59 60
55 289 219 100
lt 單位太焦耳 Unit Terajoule gt
「總熱值」是使用於計算各種氣體燃料的熱含量 Gross caloricfic values are used in calculating the respective heat contents of the gaseous products
2016 49 374 17 81 184 28 158 662
巴士
Bus 21
的士
Taxi14
汽車及電單車
Car amp Motorcycle26
貨車
Goods Vehicle28
鐵路及其他
Rail amp Others12
巴士
Bus 21
的士
Taxi14
汽車及電單車
Car amp Motorcycle17
貨車
Goods Vehicle34
鐵路及其他
Rail amp Others14
0
50 000
100 000
150 000
200 000
250 000
300 000
2006 2007 2008 2009 2010 2011 2012 2013 2014 2015 2016
煤氣及石油氣Town Gas amp Liquefied Petroleum Gas
油及煤產品
Oil amp Coal Products 電力
Electricity
太焦耳Terajoule
太焦耳Terajoule
表 48 Table 48 表 49 Table 49
4按燃料及類別劃分
4By Fuels amp Sectors
43 商業類別按燃料劃分
Commercial Sector By Fuels42 住宅類別按燃料劃分
Residential Sector By Fuels 圖 26 Graph 26 圖 27 Graph 27
煤氣及石油氣Town Gas amp
Liquefied Petroleum Gas
油及煤產品Oil amp CoalProducts
電力Electricity
總計Total
2006 18 476 34 79 0 35 428
年份Year
煤氣及石油氣Town Gas amp
Liquefied Petroleum Gas
油及煤產品Oil amp CoalProducts
電力Electricity
總計Total
年份Year
4 936 4 93 317 83 111 884 10066 53 982 100 2006 13 631 12
83 113 914 10067 54 717 100 2007 13 888 12
2008 18 708 33 41 0 37 100
4 975 4 95 0512007 18 238 33 57 0 36 422
4 739 4 95 543 84 113 753 10066 55 849 100 2008 13 471 12
85 114 297 10068 57 731 100 2009 12 815 11
2010 19 038 33 13 0 39 344
4 753 4 96 7282009 18 736 32 23 0 38 972
4 526 4 97 894 84 116 391 10067 58 396 100 2010 13 971 12
84 118 558 10068 58 826 100 2011 14 161 12
2012 18 736 31 8 0 41 189
4 803 4 99 5942011 18 946 32 8 0 39 872
4 769 4 101 813 84 120 970 10069 59 932 100 2012 14 388 12
84 121 215 10068 58 394 100 2013 14 709 12
2014 18 487 30 8 0 43 415
5 026 4 101 4802013 18 446 32 8 0 39 941
5 156 4 102 627 84 122 711 10070 61 910 100 2014 14 928 12
84 123 674 10070 60 214 100 2015 14 795 12
2016 18 311 30 8 0 43 120
5 186 4 103 6932015 17 838 30 8 0 42 368
5 164 4 103 881 84 123 969 10070 61 439 100 2016 14 924 12lt 單位太焦耳 Unit Terajoule gt lt 單位太焦耳 Unit Terajoule gt
「總熱值」是使用於計算各種氣體燃料的熱含量 Gross caloricfic values are used in calculating the respective heat contents of the gaseous products
「總熱值」是使用於計算各種氣體燃料的熱含量 Gross caloricfic values are used in calculating the respective heat contents of the gaseous products
61 62
0
10 000
20 000
30 000
40 000
50 000
60 000
70 000
2006 2007 2008 2009 2010 2011 2012 2013 2014 2015 2016
煤氣及石油氣Town Gas amp Liquefied Petroleum Gas
油及煤產品
Oil amp Coal Products 電力
Electricity
0
20 000
40 000
60 000
80 000
100 000
120 000
140 000
2006 2007 2008 2009 2010 2011 2012 2013 2014 2015 2016煤氣及石油氣Town Gas amp Liquefied Petroleum Gas
油及煤產品
Oil amp Coal Products 電力
Electricity
太焦耳Terajoule
太焦耳Terajoule
表 50 Table 50 表 51 Table 51
4按燃料及類別劃分
4By Fuels amp Sectors
45 運輸類別按燃料劃分
Transport Sector By Fuels44 工業類別按燃料劃分
Industrial Sector By Fuels 圖 28 Graph 28 圖 29 Graph 29
煤氣及石油氣Town Gas amp
Liquefied Petroleum Gas
油及煤產品Oil amp CoalProducts
電力Electricity
總計Total
2006 926 5 3 994 21 14 015
年份Year
煤氣及石油氣Town Gas amp
Liquefied Petroleum Gas
油及煤產品Oil amp CoalProducts
電力Electricity
總計Total
年份Year
78 510 81 2 444 3 96 404 10074 18 934 100 2006 15 450 16
3 96 165 10074 17 645 100 2007 15 678 16
2008 927 5 4 223 24 12 182
77 992 81 2 4952007 917 5 3 623 21 13 104
75 358 80 2 520 3 94 504 10070 17 332 100 2008 16 627 18
3 90 643 10069 16 129 100 2009 14 765 16
2010 937 6 4 035 25 11 082
73 355 81 2 5232009 923 6 4 063 25 11 143
73 213 81 2 540 3 90 889 10069 16 053 100 2010 15 137 17
3 90 774 10065 14 732 100 2011 15 506 17
2012 1 108 8 4 259 29 9 356
72 659 80 2 6092011 956 6 4 246 29 9 530
72 317 80 2 722 3 90 423 10064 14 723 100 2012 15 384 17
3 90 198 10063 14 583 100 2013 15 348 17
2014 1 244 8 4 244 29 9 230
72 054 80 2 7962013 1 220 8 4 218 29 9 144
70 939 79 2 875 3 89 999 10063 14 718 100 2014 16 185 18
3 89 245 10062 14 853 100 2015 15 048 17
2016 1 171 8 4 112 29 8 709
71 225 80 2 9722015 1 272 9 4 339 29 9 242
71 900 80 2 951 3 89 819 10062 13 992 100 2016 14 967 17lt 單位太焦耳 Unit Terajoule gt lt 單位太焦耳 Unit Terajoule gt
「總熱值」是使用於計算各種氣體燃料的熱含量 Gross caloricfic values are used in calculating the respective heat contents of the gaseous products
「總熱值」是使用於計算各種氣體燃料的熱含量 Gross caloricfic values are used in calculating the respective heat contents of the gaseous products
63 64
0
2 000
4 000
6 000
8 000
10 000
12 000
14 000
16 000
18 000
20 000
2006 2007 2008 2009 2010 2011 2012 2013 2014 2015 2016煤氣及石油氣Town Gas amp Liquefied Petroleum Gas
油及煤產品
Oil amp Coal Products電力
Electricity
0
10 000
20 000
30 000
40 000
50 000
60 000
70 000
80 000
90 000
100 000
2006 2007 2008 2009 2010 2011 2012 2013 2014 2015 2016煤氣及石油氣Town Gas amp Liquefied Petroleum Gas
油及煤產品
Oil amp Coal Products電力
Electricity
47 890 281 204
2007
20 301 13 797 16 267 426
2 506 10 158 49 197 282 440 14 102
46 5022006
19 832
16 465
17 071
5按最終用途及燃料劃分
5By End-uses amp Fuels
51 所有能源使用按最終用途劃分
All Energy Consumption By End-uses
2 454 10 413
15 142 17 059 480
2 529 9 228
7 918 31 836 12 776 32 551 21 608
51 487 278 799 13 131
17 118 463
17 449 465
2008
8 672 52 019 281 729
19 150
2 527 9 680 50 117 281 438
2009
18 971
8 496
9 121
9 244 19 199
2011
18 842 13 373 18 247 436
2 609 8 245 56 161 282 890 13 593 18 879 31 989 14 187 28 010
2012
2013
19 128
2 542
2 722 8 077 58 650 286 048 13 469 19 561 423
424
2010
18 911
19 144
9 213
8 536
8 319
8 199
19 563
19 314
19 662
19 655 44 243 14 181
14 197
13 708
2 796 7 739 58 100 284 391 13 319 21 158 406
2 875 7 705 58 273 289 338
25 534
2015
18 659 14 133 21 085 426
2 972 7 792 58 218 287 986 13 039 21 764 448
2014 25 009
24 782
8 607
8 717
19 609
19 774
48 746
48 466 18 341
2 951 7 474 59 374 289 219
51 所有能源使用按最終用途劃分 All Energy Consumption By End-uses 圖 30 Graph 30
18 918 12 288 22 881 4632016lt 單位太焦耳 Unit Terajoule gt
14 227 24 721 8 562 17 798 47 938 31 785 19 839
年份 Year 2016 年份 Year 2006
65 66
31 989
31 837
31 402
17 734
17 173
17 413
17 117
17 352
17 927
18 177
18 565
14 111 26 941
45 298
43 392
44 117
45 511
44 914
45 861
20 372
18 965
32 885
34 023
33 302
33 379
13 172
13 788
13 824
13 936
31 771
30 438
28 501
28 585
31 772
表 52 Table 52
年份Year
空氣調節Air
Conditioning
工業生產設備5
IndustrialProcessEquipment5
照明Lighting
冷凍Refrigeration
巴士Bus
的士Taxi
汽車Car
電單車Motorcycle
鐵路Rail
船隻Marine
其他1
Others1總計Total
貨車GoodsVehicle
煮食Cooking
熱水Hot Water
空氣調節
AirConditioning
17
煮食
Cooking11
工業生產設備
Industrial ProcessEquipment
6照明
Lighting7
冷凍
Refrigeration3
熱水
Hot Water 5
貨車
GoodsVehicle
9
巴士
Bus 6
的士
Taxi4
汽車及電單車
Car amp Motorcycle8
鐵路
Rail1
船隻
Marine 3
其他
Others20
空氣調節
AirConditioning
17
煮食
Cooking11
工業生產設備
Industrial ProcessEquipment
6照明
Lighting8
冷凍
Refrigeration3
熱水
Hot Water 4貨車
GoodsVehicle12
巴士
Bus 7
的士
Taxi5
汽車及電單車
Car amp Motorcycle6
鐵路
Rail1
船隻
Marine 4
其他
Others17
2006 46 502 21 608 7 918
5按最終用途及燃料劃分
5By End-uses amp Fuels
52 電力使用按最終用途劃分
Electricity Consumption By End-uses 表 53 Table 53
4 191 11 105 2 444 33 317 145 204
年份Year
空氣調節Air Conditioning
照明Lighting
冷凍Refrigeration
熱水Hot Water
辦公室設備Office Equipment
鐵路Rail
工業生產設備5
IndustrialProcessEquipment5
其他1
Others1總計Total
煮食Cooking
2007 45 298 20 372 8 496
5 373 11 246 2 520 35 477 147 345
4 809 11 171 2 495 34 776 147 072
2010 45 511 19 563 9 213
2009 44 117 19 199 9 244
2008 43 392 18 965 9 121
11 0612012 45 861 19 662 8 319
2011 44 914 19 314 8 536 9 201
9 131
10 738
4 715 13 200 2 722 40 408 155 079
4 945 12 615 2 609 38 732 151 606
11 412
11 3312014 48 746 19 609 8 607
2013 44 243 19 655 8 199 9 280
9 415 4 854 13 344 2 875 39 367 158 147
4 904 13 407 2 796 39 466 153 362
2016 47 938 19 839 8 562
2015 48 466 19 774 8 717 11 344 9 553
13 513 2 951 40 363 158 662 11 528 9 044
4 624 13 212 2 972 39 615 158 275
35 815
67 68
150 859
36 644 149 366
9 048
9 722
10 320
9 926
lt 單位太焦耳 Unit Terajoule gt
52 電力使用按最終用途劃分 Electricity Consumption By End-uses 圖 31 Graph 31
年份 Year 2016 年份 Year 2006
4 923
10 016
9 073
9 934
10 929
10 959
11 430 5 015 11 758 2 540
5 274 11 480 2 523
空氣調節Air
Conditioning 30
照明Lighting
13
冷凍Refrigeration
5
工業生產設備Industrial Process
Equipment6
煮食Cooking
7
熱水Hot Water
3辦公室設備
Office Equipment9
鐵路Rail2
其他Others25
空氣調節Air
Conditioning 32
照明Lighting
15
冷凍Refrigeration
5
工業生產設備Industrial Process
Equipment6
煮食Cooking
6
熱水Hot Water
3辦公室設備
Office Equipment8
鐵路Rail2
其他Others23
年份Year
貨車Goods Vehicle
巴士Bus
的士Taxi
5按最終用途及燃料劃分
5By End-uses amp Fuels
53 油及煤產品使用按最終用途劃分
Oil amp Coal Products Consumption By End-uses 表 54 Table 54
汽車Car
電單車Motorcycle
工業生產設備5
Industrial ProcessEquipment5
船隻Marine
其他1
Others1總計Total
87 518
2007 31 770 18 254 2 17 117 463 6 448 10 158 2 434 86 647
2006 32 551 18 647 2 16 266 426 6 508 10 413 2 705
84 361
2009 28 501 17 514 2 17 448 465 6 341 9 228 2 695 82 194
2008 30 438 17 485 2 17 059 480 6 503 9 680 2 713
81 786
2011 28 010 16 997 1 18 879 424 6 926 8 245 2 234 81 716
2010 28 585 17 077 1 18 247 436 6 423 8 672 2 346
81 352
2013 25 534 17 114 1 21 158 406 7 386 7 739 1 969 81 306
2012 26 941 17 212 1 19 560 423 7 074 8 077 2 064
80 347
2015 24 782 16 331 1 21 764 448
7 553 7 474 1 854 81 184
2014 25 009 16 607 1 21 085 426 7 458 7 705 2 056
lt 單位太焦耳 Unit Terajoule gt
53 油及煤產品使用按最終用途劃分
Oil amp Coal Products Consumption By End-uses 圖 32 Graph 32
7 688 7 792 1 953 80 757
2016 24 721 16 239 lt1 22 881 463
年份 Year 2016 年份 Year 2006
69 70
貨車GoodsVehicle31
巴士及的士Bus amp Taxi
20
汽車及電單車Car amp Motorcycle
29
工業生產設備Industrial Process
Equipment9
船隻Marine
9其他
Others2
貨車GoodsVehicle37
巴士及的士Bus amp Taxi
21
汽車及電單車Car amp Motorcycle
19
工業生產設備Industrial Process
Equipment8
船隻Marine
12其他
Others3
年份Year
煮食Cooking
熱水Hot Water
運輸Transport
其他1
Others1總計Total
5按最終用途及燃料劃分
5By End-uses amp Fuels
54 煤氣及石油氣使用按最終用途劃分
Town Gas amp Liquefied Petroleum Gas Consumption By End-uses 表 55 Table 55
2007 22 021 8 363 15 678 2 659 48 721
2006 21 741 8 585 15 450 2 706 48 482
2009 21 390 8 550 14 765 2 534 47 239
2008 22 220 8 415 16 627 2 472 49 732
2011 20 749 9 242 15 506 4 072 49 568
2010 21 244 8 921 15 137 3 782 49 084
2013 20 222 9 277 15 348 4 876 49 723
2012 20 330 9 396 15 384 4 506 49 616
2015 19 767 9 085 15 048 5 054 48 954
2014 20 194 9 342 16 185 5 123 50 844
lt 單位太焦耳 Unit Terajoule gt
54 煤氣及石油氣使用按最終用途劃分 Town Gas amp Liquefied Petroleum Gas Consumption By End-uses 圖 33 Graph 33
年份 Year 2016 年份 Year 2006
2016 19 990 9 304 14 967 5 113 49 374
「總熱值」是使用於計算各種氣體燃料的熱含量 Gross caloricfic values are used in calculating the respective heat contents of the gaseous products
71 72
煮食Cooking
41
熱水Hot Water
19
運輸Transport
30
其他Others10
煮食Cooking
45
熱水Hot Water
18運輸
Transport32
其他Others
5
6 根據已更新的可再生能源數據相關的2010年至2011年能源最終用途數據已在
2013年版中作出修訂[2013年版修訂]The energy end-use data from 2010 to 2011 were revised in the 2013 Edition basedon the latest update of the renewable energy data (Revised in 2013 Edition)
3 根據運輸能源消耗調查所得的數據有關2008年至2012年的能源最終用途數據已
在2015年版中作出修訂[2015年版修訂]The energy end-use data from year 2008 to 2012 were revised in the 2015 Editionbased on the findings of energy consumption survey on the Transport Sector(Revised in 2015 Edition)
4 自2014年版起新的「住宿」「醫療」和「教育」組別已由「其他商業」組別
分拆出來「其他商業」組別因而相應地縮小[2014年版修訂]The Accommodation Human Health and Education Segments weresegregated from the Other Commercial Segment as new segments in the 2014Edition Hence the size of the Other Commercial Segment is accordingly reduced(Revised in 2014 Edition)
5 自2014年版起燃料的熱含量均以「總熱值」計算因而自2002年後的能源數據
均已採用「總熱值」作出計算[2014年版修訂]Since the 2014 Edition Gross Calorific Values are used for calculating the heatcontents of fuels Gross Calorific Values are hence used in computing energy datafrom 2002 onwards (Revised in 2014 Edition)
1 由於資料所限能源數據不能再分拆成其他最終用途數據「其他」的最終用途包
括沒有被列在表上的最終用途
2 自2013年後「空氣調節」「冷凍」「工業生產設備」及「熱水」的能源最終
用途數據已採用「氣溫因素」作出修訂[2017年版修訂]The energy end-use data of Air Conditioning Refrigeration IndustrialProcessEquipment and Hot Water are revised by Temperature Factor fromyear 2013 onwards (Revised in 2017 Edition)
Due to data limitations energy data could not further be broken down into other end-uses The ldquoOthersrdquo end-use includes the end-uses not elsewhere listed in the table
2 「房委會資助出售單位」組別前稱為「居屋計劃」組別
1 根據零售組別能源消耗調查所得的數據有關2011年至2014年的能源最終用途數
據已在2017年版中作出修訂[2017年版修訂]The energy end-use data from year 2011 to 2014 were revised in the 2017 Editionbased on the findings of energy consumption survey on the Retail Segment(Revised in 2017 Edition)
6Notes 7Chronology of Major Revisions7主要修訂年表6註釋
3 「其他房屋」組別包括別墅平房及類似屋宇
The ldquoOther Housingrdquo Segment includes villas bungalows and the like
4 「熱水及冷凍」的最終用途包括鍋爐器材及其他生產加熱和冷凍的設備
The ldquo Non-manufacturing rdquo Segment includes construction and other miscellaneousnon-manufacturing industrial activities
The ldquoHousing Authority Subsidized Sale Flatsrdquo Segment was previously called ldquoHomeOwnershiprdquo Segment
The ldquo Hot Water amp Refrigeration rdquo end-use includes boiling equipments and otherprocess heating and cooling facilities
「工業生產設備」的最終用途包括鍋爐設備及其他生產加熱和冷凍設備的使用
The ldquoOther Industrialrdquo Segment includes electronics paper printing plastic and othermiscellaneous industrial activities
73
The ldquo GDP in chained dollars rdquo were revised based on latest data published by theCensus and Statisics Department
8 ldquo本地生產總值環比物量計算rdquo己根據政府統計處最新數據作出修訂
74
7 「其他工業」組別包括電子紙張印刷塑膠及其他雜項工業活動
The ldquo Industrial ProcessEquipment rdquo end-use includes boiler plants and other processheating and cooling facilities
6 「非製造業」組別包括建造及其他非製造業之雜項工業活動
5
7主要修訂年表
13 自2010年起「電力」包括燃煤天然氣風能及太陽能所產生的電能[2012年版修訂]ldquoElectricityrdquoincludes the electricity generated from coal natural gas wind and solarpower since 2010 (Revised in 2012 Edition)
14 根據工業能源消耗調查所得的數據有關2000年至2010年的能源最終用途數據已
在2012年版中作出修訂[2012年版修訂]The energy end-use data from year 2000 to 2010 were revised in the 2012 Editionbased on the findings of energy consumption survey on the Industrial Sector(Revised in 2012 Edition)
自2013年版起「煮食」之能源最終用途除已包括煮食爐及飯煲外再加上在廚房
普遍用作製造及準備食物的器具例如煮食用水加熱設備電焗爐及微波爐等
自2001年後的「煮食」之能源最終用途數據均作出修訂[2013年版修訂]The ldquo Cooking rdquo energy end-use was revised in the 2013 Edition to include foodmaking and preparation appliances normally found in kitchens in addition to stovesand rice cookers Examples of the appliances are hot water for cooking purposeselectric ovens and microwave ovens etc The ldquoCookingrdquo energy end-use data since2001 were hence updated (Revised in 2013 Edition)
自2011年「商業」及「工業」類別的分類已經根據香港標準行業分類20版作出
修訂這修訂包括將個人服務活動(例如夜總會卡拉OK電腦及通訊設施維
修家居用品維修車輛維修服務藝術表演或創作活動及出版服務)由以往的
「食肆」「其他商業」組別或「工業」類別重置到現時的「零售」組別其同
時涵蓋零售及個人服務活動[2013年版修訂]The ldquoCommercialrdquo and ldquoIndustrialldquo Sectors were re-categorized in 2011 to alignwith the Hong Kong Standard Industrial Classification (HSIC) Version 20Examples of such changes are the relocations of personal service activities (such asnight clubs karaokes computer and communication repair household goodsrepair motor vehicle repair services art performance or creation activities andpublishing services etc) from the previous ldquo Restaurant ldquo Other CommercialSegments or the rdquoIndustrialrdquo Sector to the present ldquoRetailrdquo Segment which nowembraces both retail and personal service activities (Revised in 2013 Edition)
12 自2010年的能源最終用途數據包括可再生能源數據[2012年版修訂]The energy end-use data from 2010 includes renewable energy data(Revised in 2012 Edition)
11
75 76
7Chronology of Major Revisions
8 自2013年版起「空氣調節」之能源最終用途除已包括冷氣設備及暖氣機外再加
上風扇空氣清新或淨化器及抽濕機 自2001年後的「空氣調節」之能源最終用
途數據均作出修訂[2013年版修訂]The ldquoAir Conditioningrdquo energy end-use was revised in the 2013 Edition to includefans air cleanerpurifiers and dehumidifiers in addition to air conditioning unitsand heaters The ldquoAir Conditioningrdquo energy end-use data since 2001 were henceupdated (Revised in 2013 Edition)
9 自2013年版起「辦公室設備」之能源最終用途除已包括電腦及影印機外再加上
視聽器材碎紙機傳真及收銀機自2001年後的「辦公室設備」之能源最終用
途數據均作出修訂[2013年版修訂]The ldquoOffice Equipmentrdquo energy end-use was revised in the 2013 Edition to includeaudio visual equipments shredders fax and cashier machines etc in addition tocomputers and photocopiers The ldquoOffice Equipmentrdquo energy end-use data since2001 were hence updated (Revised in 2013 Edition)
10 根據住宅能源消耗調查所得的數據有關2009年至2011年的能源最終用途數據已
在2013年版中作出修訂[2013年版修訂]The energy end-use data from year 2009 to 2011 were revised in the 2013 Editionbased on the findings of energy consumption survey on the Residential Sector(Revised in 2013 Edition)
15 根據政府統計處公佈的人口及家庭住戶統計修訂數字有關2007至2010年的能源
最終用途數據己在2012年版中作出相應的修訂[2012年版修訂]The energy end-use data from years 2007 to 2010 were revised in the 2012 Editionbased on the revised population and domestic household data published by theCensus and Statistics Department (Revised in 2012 Edition)
7
17 根據政府統計處公佈的家庭住戶統計修訂數字有關2001至2006年的能源最終用
途數據己在2009年版中作出修訂[2009年版修訂]The energy end-use data from years 2001 to 2006 were revised in the 2009 Editionbased on the revised domestic household data published by the Census and StatisticsDepartment (Revised in 2009 Edition)
18 自2006年起「鐵路」之能源最終用途再不包括鐵路車站等建築物使用的電量
[2008年版修訂]The ldquoRailrdquo energy end-use do not include electricity consumption at railway stationsfrom 2006 onwards (Revised in 2008 Edition)
16 根據商業及運輸能源消耗調查所得的數據有關2003年至2007年的能源最終用途
數據已在2010年版中作出修訂[2010年版修訂]The energy end-use data from year 2003 to 2007 were revised in the 2010 Editionbased on the findings of energy consumption survey on the Commercial andTransport Sectors (Revised in 2010 Edition)
7Chronology of Major Revisions 8Units of Measurement7主要修訂年表 8計量單位
1 太焦耳 = 1012 焦耳 1 terajoule (TJ) = 1012 joules
1 千兆焦耳 = 109 焦耳 1 gigajoule (GJ) = 109 joules
1 百萬焦耳 = 106 焦耳 1 megajoule (MJ) = 106 joules
77 78
1 千兆瓦小時 = 36 x 1012 焦耳 1 gigawatt hour (GWh) = 36 x 1012 joules
1 兆瓦小時 = 36 x 109 焦耳 1 megawatt hour (MWh) = 36 x 109 joules
1 千瓦小時 = 36 x 106 焦耳 1 kilowatt hour (kWh) = 36 x 106 joules
網址 httpwwwemsdgovhk電郵 energydataemsdgovhk
79 80
Enquiries about this publication can be directed to
The Energy Efficiency OfficeElectrical amp Mechanical Services Department
7F 3 Kai Shing Street Kowloon Bay Hong Kong
Tel No (852) 2808 3465Fax No (852) 2890 6081
Homepage httpwwwemsdgovhkE-mail energydataemsdgovhk
Set of Hong Kong Energy End-use Data can be downloadedfrom EMSD website
httpswwwemsdgovhkenenergy_efficiencyenergy_end_use_data_and_consumption_indicatorshong_kong_energy_end_use_datadataindexhtml
有關本刊物的查詢請聯絡
機電工程署
香港九龍灣啟成街3號7樓
能源效益事務處 httpswwwemsdgovhktcenergy_efficiencyenergy_end_use_data_and_consumption_indicatorshong_kong_energy_end_use_datadataindexhtml
香港能源最終用途數據收錄之數據可在機電工程署網站下載
電話(852) 2808 3465圖文傳真(852) 2890 6081
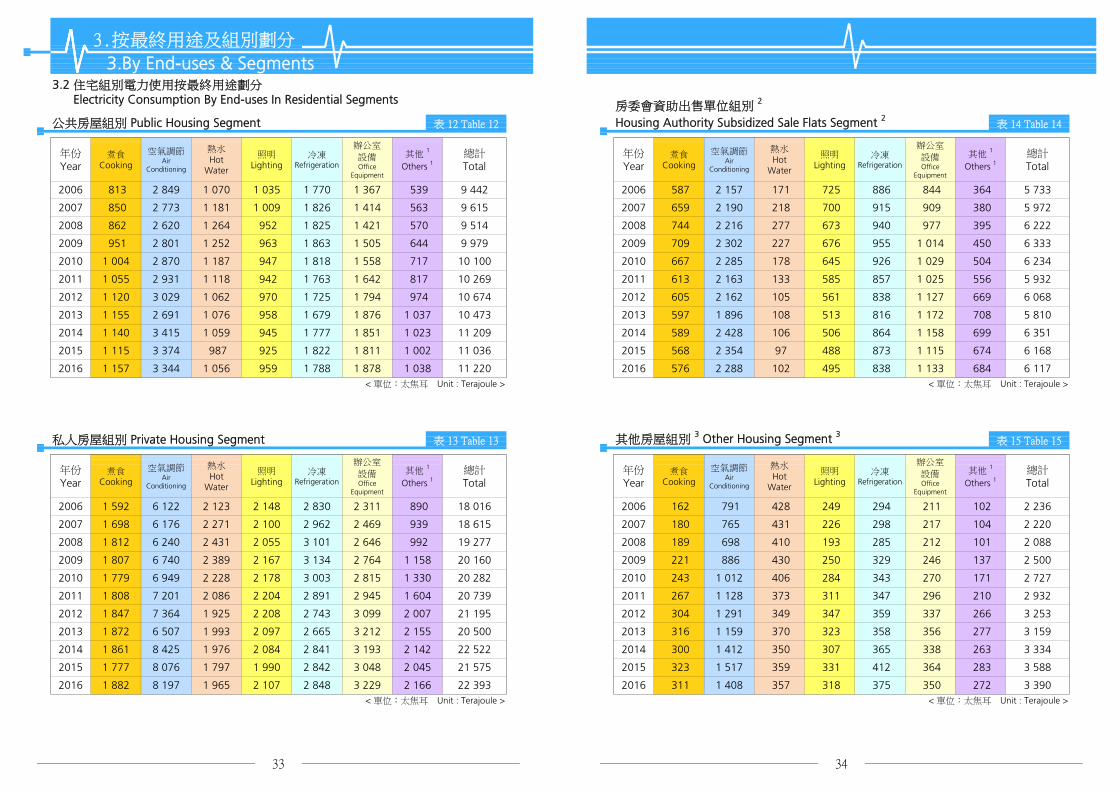
3按最終用途及組別劃分
3By End-uses amp Segments
所有商業組別 All Commercial Segments
33 商業類別所有能源使用按最終用途劃分 All Energy Consumption By End-uses In Commercial Segments
12 570 - - -
-
太焦耳Terajoule
63 251
46 037
21 340 17 942 12 791 15 799
21 290 17 928 12 915 16 331 5 887 3 286
67 577
5 753
21 316 17 506
21 165 17 332
46 632
45 816
12 484 - -
3 270
12 663 14 017 5 563 3 273
118 558
121 2153 215 45 328
2012 120 970
61 790
23 397 16 213 13 190 - -
23 299 15 9602009 11 788 - -
24 185 15 711 12 195 - - - 64 300
22 929 16 624
-
2013
13 182 16 453 5 968 3 324 46 536
21 397 17 612 12 544 15 539 5 581
35 36
年份 Year 2016
年份 Year 2006
24 157
123 674
113 914
2008 113 75315 686 11 894
2007
- - - 62 015
2011
114 297
2010 116 391
2016 123 969lt 單位太焦耳 Unit Terajoule gt
圖 16 Graph 16所有商業能源最終用途 All Commercial Energy End-uses圖 15 Graph 15
總計Total
2006 111 884
表 16 Table 16
年份Year
- 59 084
食肆Restaurant
零售Retail
辦公室Office
住宿Accomodation
醫療HumanHealth
教育Education
其他商業Other
Commercial
21 163 17 343
2015
2014 122 711
0
20 000
40 000
60 000
80 000
100 000
120 000
140 000
2006 2007 2008 2009 2010 2011 2012 2013 2014 2015 2016
食肆
Restaurant零售
Retail辦公室
Office住宿
Accomodation醫療
Health教育
Education其他商業
Other Commercial
煮食
Cooking14
空氣調節
Air Conditioning 24
照明
Lighting12
熱水及冷凍
Hot water amp Refrigeration
12
辦公室設備
Office Equipment5
其他
Others33
煮食
Cooking15
空氣調節
Air Conditioning 27
照明
Lighting15
熱水及冷凍
Hot water amp Refrigeration
8
辦公室設備
Office Equipment5
其他
Others30
3按最終用途及組別劃分
3By End-uses amp Segments
食肆組別 Restaurant Segment
33 商業類別所有能源使用按最終用途劃分 All Energy Consumption By End-uses In Commercial Segments
11 788
1 743 1 543 2 352 12 195
14 166
表 19 Table 19
2010
2009
年份Year
1 7002008 24 157
22 929 20071 761 7092007 6 971
923
885
1 954 905
總計Total
511
23 299 2009
6 557
總計Total
1 829 13 190
2008 6 395
2 517 13 182
1 599 2 446 12 663
1 806 1 596 2 441
2 416 12 791
1 809
1 571
12 544
2 479 12 915
5 401 2 054 810
785
2016 1 862 1 6467 158
525
2013
2015
2014
2 055 821 532 21 397
2 054 819
21 165 1 577
6 983
6 701
1 784
689
17 343 2016
4 1835 625 -2011
6 338
7 523
5 701 4 177 7 628
5 583 4 250
5 754 4 310
7 901
1 773
5 706
5 805
1 833 1 620 525
12 528
lt 單位太焦耳 Unit Terajoule gt
零售組別 Retail Segment 表 18 Table 18
總計Total
4 115
2009
2014 21 340
其他 1
Others 1
21 163
照明Lighting
811
807 524
21 2902 081
2 085
530
2007
年份Year
4 1192006
2008
-
6 809
lt 單位太焦耳 Unit Terajoule gt lt 單位太焦耳 Unit Terajoule gt
2013
14 0173 273 4 5551 384 4 21917 506 20122012
7 779 15 5393 623 5 0341 550
1 645 4 931 6975 582 4 189 7 572
辦公室設備Office
Equipment
6 711
4 67517 612 2013
7 864
lt 單位太焦耳 Unit Terajoule gt
住宿組別 Accommodation Segment 表 20 Table 20
總計Total
空氣調節Air
Conditioning
熱水及冷凍4
Hot Water ampRefrigeration4
照明Lighting
其他 1
Others 1年份Year
-- -- -17 332
7 031
- -
2013
2016
2015 12 389 5 483
12 358 5 402
5 398
5 498
15 711 20102010 -5 7154 122
5 799
5 875
663
2011
586
657
37 38
16 4533 855 5 325
15 7993 762 5 0951 565 4 71417 942 20144 241
16 3313 890 5 2511 627 4 87217 928 20152015
2014
2016
-
-- -- -
--5 865 -15 686 2008
4 187
- -
15 960 2009 -
-
6 793
5 968
13 507 5 960
-- -- -16 624 20076 689 4 890 5 045 -
-- -- -16 213 20065 300
空氣調節Air
Conditioning
12 591
12 426
14 049 5 525
6 082 1 991
照明Lighting
辦公室設備Office
Equipment
其他 1
Others 1
2 019
2012
20112011 12 622 5 237 2 009
973
21 316 2012
24 185 201013 404 6 594 2 1181 001 1 069
辦公室組別 Office Segment表 17 Table 17
23 397 2006 7 187
1 802 1 777 12 570
2 412 12 484
1 505 2 294 11 894
1 684 1 491 2 274
995
- -
2006
年份Year
煮食Cooking
空氣調節Air
Conditioning
熱水及冷凍4
Hot Water ampRefrigeration4
照明Lighting
其他 1
Others 1
2 026 2 14914 215 584
空氣調節Air
Conditioning
5 863 1 7251 011
5 596 1 486
5 561 5 518 1 478 1 918
46 536
31 341 45 816
5 587 5 571 1 486 1 911 31 482 46 037
5 430
34 746 64 300
11 225 7 603 2 684 8 396 37 669 67 577
32 327 46 6325 402 5 516
9 672 7 207 3 092 8 255
1 527 1 860
10 154 7 586 3 156 8 659
45 328
10 572 7 766
130
- - -
-
61 790
131 538
33 790 62 015
9 860 7 321 3 087 8 231 34 751 63 251
2010
- 2009
- 2008
- - -
- - -
59 084
-
其他 1
Others 1
lt 單位太焦耳 Unit Terajoule gt
5 968 2016 1 845 32 179
5 581 2013
5 563 2012
-
-
- 2011
-
5 486
3 273
照明Lighting
辦公室設備Office
Equipment
熱水及冷凍4
Hot Water ampRefrigeration4
其他 1
Others 1
546
542
-
31 558
-
533
1 475 1 832 31 132
- 2007
5 402
2 573 6 616
10 348 7 527 2 881 7 714 33 321
39 40
2016 3 324
2015 3 2861 606
lt 單位太焦耳 Unit Terajoule gt
3 270
1 613 681 337 138 556
1 603
666 330 137
661 327 137
- -
2014
2013 1 563
2012
2011 -
1 602
- - -
-
- -
-
671 332
- -
3 215 661 327
2006 -
-
2010 -
2009 --
lt 單位太焦耳 Unit Terajoule gt
教育組別 Education Segment 表 22 Table 22
2008 -
2007 -- -
年份Year
總計Total
空氣調節Air
Conditioning
照明Lighting
辦公室設備Office
Equipment
熱水及冷凍4
Hot Water ampRefrigeration4
-
2016 1 257 303 298 2 218 1 892
5 887 2015
5 753 20142014 1 237 289 285 2 126 1 817
2015 1 261 297 292 2 176 1 862
2012 1 189 283 279 2 057 1 754
2013 1 178 284 280 2 071 1 768
2010 - - - - -
2011 - - - - -
2008 - - - - -
2009 - - - - -
20062006 - - - - -
2007 - - - - -
3按最終用途及組別劃分
3By End-uses amp Segments
醫療組別 Human Health Segment
33 商業類別所有能源使用按最終用途劃分 All Energy Consumption By End-uses In Commercial Segments
其他商業組別 Other Commercial Segments表 21 Table 21 表 23 Table 23
年份Year
空氣調節Air
Conditioning
照明Lighting
辦公室設備Office
Equipment
熱水及冷凍4
Hot Water ampRefrigeration4
其他 1
Others 1總計Total
年份Year
空氣調節Air
Conditioning
總計Total
12 106 3 537 3 198
12 381 16 826 12 915 12 043 3 489 3 158 42 881 103 693
lt 單位太焦耳 Unit Terajoule gt
41 42
101 480
2014 12 379 16 742 12 791 11 615 3 412 3 144 42 544 102 627
2016 12 330 16 306 13 182 43 223 103 881
2015
43 748 101 813
2013 12 336 16 435 12 544 11 386 3 317 3 102 42 361
2012 12 265 16 442 12 663 10 211 3 321 3 164
2011 11 894 16 339 12 484 - - - 58 877 99 594
2010 14 372 15 711 12 195 - - - 55 616 97 894
2009 12 990 15 960 11 788 - - - 55 991 96 728
2008 13 257 15 686 11 894 - - - 54 706 95 543
2007 11 681 16 624 12 570 - - - 54 176 95 051
所有商業能源最終用途 All Commercial Energy End-uses圖 17 Graph 17 圖 18 Graph 18
年份 Year 2016太焦耳Terajoule
3按最終用途及組別劃分
3By End-uses amp Segments
所有商業組別 All Commercial Segments
34 商業類別電力使用按最終用途劃分 Electricity Consumption By End-uses In Commercial Segments
年份 Year 2006
2006 12 136
表 24 Table 24
年份Year
食肆Restaurant
零售Retail
辦公室Office
住宿Accomodation
醫療HumanHealth
教育Education
其他商業Other
Commercial
總計Total
16 213 13 190 - - - 51 779 93 317
0
20 000
40 000
60 000
80 000
100 000
120 000
2006 2007 2008 2009 2010 2011 2012 2013 2014 2015 2016
食肆
Restaurant零售
Retail辦公室
Office住宿
Accomodation醫療
Health教育
Education其他商業
Other Commercial
煮食
Cooking7
空氣調節
Air Conditioning 29
照明
Lighting15
熱水及冷凍
Hot Water amp Refrigeration
8
辦公室設備
Office Equipment6
其他
Others35
煮食
Cooking6
空氣調節
Air Conditioning 33
照明
Lighting17
熱水及冷凍
Hot Water amp Refrigeration
5
辦公室設備
Office Equipment6
其他
Others33
1 527 4 381 12 106lt 單位太焦耳 Unit Terajoule gt lt 單位太焦耳 Unit Terajoule gt
43 44
2016 5 582 4 189 6 535 16 306 2016 3 855 1 645
3按最終用途及組別劃分
3By End-uses amp Segments
食肆組別 Restaurant Segment
34 商業類別電力使用按最終用途劃分 Electricity Consumption By End-uses In Commercial Segments
2013 3 623
697
1 502 4 334 12 043
2014 5 799 4 241 6 701 16 742 2014 3 762 1 565 663 1 459 4 167 11 615
2015 5 754 4 310 6 762 16 826 2015 3 890
2011 -
1 627 689
1 429 4 127 11 386
2012 5 701 4 177 6 565 16 442 2012 3 273 1 384 586 1 282 3 686 10 211
2013 5 583 4 250 6 601 16 435
2009 -
1 550 657
- - -
2010 5 875 4 122 5 715 15 711 2010 - - - - - -
2011 5 625 4 183 6 530 16 339
2007 -
- -
- - -
2008 5 865 4 115 5 706 15 686 2008 - - - - - -
2009 5 968 4 187 5 805 15 960
年份Year
空氣調節Air
Conditioning
照明Lighting
其他 1
Others 1總計Total
年份Year
- -
-
2006 6 793 5 300 4 119 16 213 2006 - - - -
2007 6 689 4 890 5 045 16 624
空氣調節Air
Conditioning
照明Lighting
辦公室設備Office
Equipment
熱水及冷凍4
Hot Water ampRefrigeration4
其他 1
Others 1
13 182
- -
總計Total
- -
- -
零售組別 Retail Segment 住宿組別 Accommodation Segment表 26 Table 26 表 28 Table 28
12 330 2016 7 158 1 862 1 646 2 517
2 479 12 915
2016 4 039 5 402 819 1 595 474lt 單位太焦耳 Unit Terajoule gt lt 單位太焦耳 Unit Terajoule gt
1 773 1 571 2 416 12 791
2015 3 998 5 483 811 1 620 469 12 381 2015 6 983
2014 3 981 5 498 807 1 625 467 12 379 2014 7 031
1 833 1 620
1 809 1 599 2 446 12 663
2013 4 048 5 398 821 1 594 475 12 336 2013 6 701 1 806 1 596 2 441 12 544
2012 3 991 5 401 810 1 595 469 12 265 2012 6 809
1 743 1 543 2 352 12 195
2011 3 870 5 237 785 1 547 454 11 894 2011 6 711 1 784 1 577 2 412 12 484
2010 4 120 6 594 1 001 1 647
11 894
2009 3 724 5 960 905 1 488 913 12 990 2009 6 338 1 684 1 491 2 274 11 788
2008 3 801 6 082 923 1 519
1 829
1 777 2 019
1 010 14 372 2010 6 557
1 700 1 505 2 294
1 802
932 13 257 2008 6 395
2 026 2 1491 241 519 12 136 2006 7 187
3 352 5 525 885 1 275 644 11 681 2007 6 971
辦公室組別 Office Segment表 25 Table 25 表 27 Table 27
年份Year
煮食Cooking
空氣調節Air
Conditioning
照明Lighting
熱水及冷凍4
Hot Water ampRefrigeration4
其他 1
Others 1總計Total
年份Year
空氣調節Air
Conditioning
照明Lighting
辦公室設備Office
Equipment
其他 1
Others 1總計Total
13 190
2007 12 570
2006 3 502 5 863 1 011
3按最終用途及組別劃分
3By End-uses amp Segments
醫療組別 Human Health Segment
34 商業類別電力使用按最終用途劃分 Electricity Consumption By End-uses In Commercial Segments
1 257 303 298 316 1 363 3 537
1 613 681 337 95 472 3 198lt 單位太焦耳 Unit Terajoule gt
45 46
3 158
3 102
-
3 164
- - - -
2012 1 602 671 332 94 465
2011 -
458 3 1442014 1 603 661 327 94
2013 1 563 661 327 92 458
2016
1 606 666 330 94 4622015
2009 - - - - - -
2010 - - - - - -
2008 - - - - - -
2007 -
2006 - - - - - -
- - - - -
5 596 1 486 1 807 28 904 43 223lt 單位太焦耳 Unit Terajoule gt lt 單位太焦耳 Unit Terajoule gt
其他 1
Others 1總計Total
年份Year
空氣調節Air
Conditioning
照明Lighting
辦公室設備Office
Equipment
熱水及冷凍4
Hot Water ampRefrigeration4
1 335 3 489
2016 5 4302016
1 261 297 292 305
教育組別 Education Segment 表 30 Table 30
1 478 1 847 28 140 42 544
2015 2015 5 587 5 571 1 486 1 850 28 388 42 881
2013 5 402 5 486 1 475 1 780 28 218 42 361
2014 1 237 289 285 301 1 301 3 412 2014 5 561
2013 1 178 284 280 295 1 280 3 317
5 518
2 684 3 408 33 957 58 877
2012 1 189 283 279 294 1 275 3 321 2012 5 402 5 516 1 527 1 810 29 492 43 748
2010 10 154 7 586 3 156 3 886 30 835 55 616
2011 - - - - - - 2011 11 225
2010 - - - - - -
7 603
31 079 54 706
2009 - - - - - - 2009 9 860 7 321 3 087 3 676 32 047 55 991
7 207 3 0922008 - - - - - - 2008 9 672
2007 10 348 7 527 2 881 2 863
3 657
30 558 54 1762007 - - - - - -
- - 2006 10 572 7 766 2 573 2 069 28 800 51 779
其他商業組別 Other Commercial Segments表 29 Table 29 表 31 Table 31
年份Year
空氣調節Air
Conditioning
照明Lighting
辦公室設備Office
Equipment
熱水及冷凍4
Hot Water ampRefrigeration4
其他 1
Others 1總計Total
年份Year
空氣調節Air
Conditioning
照明Lighting
辦公室設備Office
Equipment
熱水及冷凍4
Hot Water ampRefrigeration4
其他 1
Others 1總計Total
2006 - - - -
3按最終用途及組別劃分
3By End-uses amp Segments
所有工業組別 All Industrial Segments
35 工業類別所有能源使用按最終用途劃分 All Energy Consumption By End-uses In Industrial Segments
圖 20 Graph 20
年份 Year 2016
年份 Year 2006
所有工業能源最終用途 All Industrial Energy End-uses
695 5 188 2 770 3 344 2 585 14 5832013
5 166 2 659 3 377 2 732 14 7232012 789
494 5 549 3 010 3 395 2 404 14 8532015
5 334 2 967 3 337 2 501 14 7182014 579
47 48
5 080 2 906 3 312 2 292 13 992lt 單位太焦耳 Unit Terajoule gt
2016 402
864 4 938 2 450 3 504 2 976 14 7322011
4 135 2 718 3 888 4 095 16 0532010 1 217
1 373 3 829 2 695 4 036 4 196 16 1292009
4 009 2 804 4 255 4 454 17 3322008 1 809
3 086 3 815 4 788 17 6452007 2 019 3 935
4 209 4 985 18 9342006 2 249 4 629 2 863
圖 19 Graph 19
太焦耳
Terajoule
其他工業 7
OtherIndustries 7
總計Total
年份Year
紡織及服裝製品Textile amp
Wearing Apparel
非製造業 6
Non-manufacturing 6
食品及飲品Food amp
Beverage
金屬及機械Metal amp
Machinery
表 32 Table 32
0
2 000
4 000
6 000
8 000
10 000
12 000
14 000
16 000
18 000
20 000
2006 2007 2008 2009 2010 2011 2012 2013 2014 2015 2016
紡織及服裝製品
Textile ampWearing Apparel
非製造業
Non‐manufacturing
食品及飲品
Food ampBeverage
金屬及機械
Metal ampMachinery
其他工業
OtherIndustries
工業生產設備
Industrial ProcessEquipment
54
照明
Lighting6
空氣調節
Air Conditioning17
其他
Others23
工業生產設備
Industrial ProcessEquipment
53
照明
Lighting7
空氣調節
Air Conditioning22
其他
Others18
3按最終用途及組別劃分
3By End-uses amp Segments
紡織及服裝製品組別 Textile amp Wearing Apparel Segment
35 工業類別所有能源使用按最終用途劃分 All Energy Consumption By End-uses In Industrial Segments
食品及飲品組別 Food amp Beverage Segment表 33 Table 33 表 35 Table 35
年份Year
工業生產設備 5
Industrial ProcessEquipment 5
照明Lighting
空氣調節Air
Conditioning
其他1
Others1總計Total
年份Year
工業生產設備 5
Industrial ProcessEquipment 5
照明Lighting
空氣調節Air
Conditioning
其他1
Others1總計Total
466 455 2 863
2007 880 194 685 260 3 0862 019 2007 1 922 159 509 497
2006 997 210 757 284 2 249 2006 1 797 146
430 425 2 804
2009 637 123 446 167 1 373 2009 1 775 125 399 397 2 695
2008 834 163 592 221 1 809 2008 1 815 134
2010 574 106 391 145 2 718
2011 446 68 256 94 864 2011 1 743 95
1 217 2010 1 793 125 400 399
303 310 2 450
311 318 2 659
2013 367 53 203 74 2 770 695 2013 2 047 97 309 317
2012 416 59 230 83 789 2012 1 934 97
340 344 2 967
2015 262 36 145 51 494 2015 2 218 106 342 345 3 010
2014 303 44 171 61 579 2014 2 177 106
2016 210 31 118 43 2 906lt 單位太焦耳 Unit Terajoule gt lt 單位太焦耳 Unit Terajoule gt
非製造業組別 6 Non-manufacturing Segment6金屬及機械組別 Metal amp Machinery Segment表 34 Table 34 表 36 Table 36
402 2016 2 117 106 337 346
年份Year
工業生產設備 5
Industrial ProcessEquipment 5
照明Lighting
空氣調節Air
Conditioning
其他1
Others1總計Total
年份Year
工業生產設備 5
Industrial ProcessEquipment 5
照明Lighting
空氣調節Air
Conditioning
其他1
Others1總計Total
2006 1 794 114 925 1 376 4 2092006 2 013 588 992 1 035 4 629
2007 1 626 103 837 1 249 3 8152007 1 711 500 850 873 3 935
2008 1 819 105 857 1 475 4 2552008 1 823 488 810 888 4 009
2009 1 729 97 791 1 419 4 0362009 1 764 460 762 843 3 829
2010 1 665 94 761 1 367 3 8882010 1 907 496 819 913 4 135
2011 1 513 65 565 1 360 3 5042011 2 143 509 940 1 346 4 938
2012 1 460 63 544 1 309 3 3772012 2 272 540 985 1 370 5 166
2013 1 452 62 534 1 296 3 3442013 2 246 536 969 1 437 5 188
2014 1 445 62 541 1 290 3 3372014 2 295 547 1 003 1 490 5 334
2015 1 470 63 551 1 312 3 3952015 2 401 571 1 041 1 536 5 549
2016 1 440 61 529 1 282 3 3122016 2 179 522 949 1 430 5 080lt 單位太焦耳 Unit Terajoule gt lt 單位太焦耳 Unit Terajoule gt
49 50
2015 346 4 024 1 349 1 217 2 307 9 242
1 226 1 192 2 476 9 144
3 880 1 344 1 195 2 402 9 2302014 409
14 015
2007 1 682 3 032 2 012 1 882 4 496 13 104
1 232 1 208 2 616 9 356
12 182
1 200 1 255 2 844 9 5302011 619 3 613
2009 1 089 2 799 1 579 1 779 3 896 11 143
2010
2012 553 3 747
2013 489 3 761
951 3 023 1 585 1 714 3 808 11 082
2007 3 295 277 980 236 4 788
1 701 1 926 4 140
1 842 2 080 4 670
2008 1 443 2 971
2006 1 851 3 572
2008 3 051 257 915 231 4 454
35 工業類別所有能源使用按最終用途劃分 All Energy Consumption By End-uses In Industrial Segments
所有工業組別 All Industrial Segments
36 工業類別電力使用按最終用途劃分 Electricity Consumption By End-uses In Industrial Segments
3按最終用途及組別劃分
3By End-uses amp Segments
2006 3 415 290 1 029 251 4 985
圖 21 Graph 21
年份
Year
工業生產設備 5
Industrial ProcessEquipment 5
照明Lighting
空氣調節Air
Conditioning
其他1
Others1總計Total
太焦耳
Terajoule
表 37 Table 37其他工業組別 7 Other Industrial Segments 7
2010 2 800 237 844 213 4 095
2009 2 865 242 863 225 4 196
2012 1 872 166 568 125 2 732
2011 2 030 180 627 140 2 976
2014 1 711 154 520 116 2 501
2013 1 781 158 528 119 2 585
2016 1 568 144 471 110 2 292
2015 1 635 149 502 118 2 404
表 38 Table 38
年份Year
紡織及服裝製品Textile amp
Wearing Apparel
非製造業 6
Non-manufacturing 6
食品及飲品Food amp
Beverage
金屬及機械Metal amp
Machinery
其他工業 7
OtherIndustries 7
總計Total
lt 單位太焦耳 Unit Terajoule gt
2 206 8 709
51 52
lt 單位太焦耳 Unit Terajoule gt
2016 286 3 699 1 339 1 179
0
2 000
4 000
6 000
8 000
10 000
12 000
14 000
16 000
2006 2007 2008 2009 2010 2011 2012 2013 2014 2015 2016
紡織及服裝製品
Textile ampWearing Apparel
非製造業
Non‐manufacturing
食品及飲品
Food ampBeverage
金屬及機械
Metal ampMachinery
其他工業
OtherIndustries
圖 22 Graph 22 紡織及服裝製品組別 Textile amp Wearing Apparel Segment 表 39 Table 39
年份 Year 2016
所有工業能源最終用途 All Industrial Energy End-uses
36 工業類別電力使用按最終用途劃分 Electricity Consumption By End-uses In Industrial Segments
3按最終用途及組別劃分
3By End-uses amp Segments
年份 Year 2006
53
年份Year
工業生產設備 5
Industrial ProcessEquipment 5
照明Lighting
空氣調節Air
Conditioning
其他1
Others1總計Total
2006 604 210 757 279 1 851
2007 547 194 685 255 1 682
1 443
2009 356 123 446 164 1 089
2008 472 163 592 217
951
2011 203 68 256 92 619
2010 312 106 391 142
553
2013 162 53 203 72 489
2012 182 59 230 81
409
2015 114 36 145 50 346
2014 134 44 171 60
286lt 單位太焦耳 Unit Terajoule gt
非製造業組別 6 Non-manufacturing Segment 6 表 40 Table 40
年份Year
工業生產設備 5
Industrial ProcessEquipment 5
照明Lighting
空氣調節Air
Conditioning
其他1
Others1總計Total
2016 94 31 118 42
3 572
2007 893 500 850 788 3 032
2006 1 057 588 992 934
2 971
2009 836 460 762 742 2 799
2008 886 488 810 787
3 023
2011 949 509 940 1 215 3 613
2010 904 496 819 804
3 747
2013 962 536 969 1 295 3 761
2012 993 540 985 1 230
3 880
2015 1 028 571 1 041 1 384 4 024
2014 986 547 1 003 1 345
3 699lt 單位太焦耳 Unit Terajoule gt
54
2016 936 522 949 1 292
工業生產設備
Industrial ProcessEquipment
41 照明
Lighting10
空氣調節
Air Conditioning27
其他
Others22
工業生產設備
Industrial ProcessEquipment
46
照明
Lighting9
空氣調節
Air Conditioning30
其他
Others15
其他工業組別 7 Other Industrial Segments 7表 41 Table 41 表 43 Table 43
年份Year
工業生產設備 5
Industrial ProcessEquipment 5
照明Lighting
空氣調節Air
Conditioning
其他1
Others1總計Total
年份Year
工業生產設備 5
Industrial ProcessEquipment 5
照明Lighting
空氣調節Air
Conditioning
其他1
Others1總計Total
1 029 216 4 670
2007 883 159 509 462 4 4962 012 2007 3 030 277 980 208
2006 808 146 466 423 1 842 2006 3 135 290
915 191 4 140
2009 693 125 399 363 1 579 2009 2 610 242 863 181 3 896
2008 746 134 430 390 1 701 2008 2 777 257
2010 695 125 400 365 3 808
2011 526 95 303 277 1 200 2011 1 904 180
1 585 2010 2 548 237 844 178
627 133 2 844
568 123 2 616
2013 536 97 309 284 2 4761 226 2013 1 674 158 528 116
2012 540 97 311 284 1 232 2012
金屬及機械組別 Metal amp Machinery Segment 表 42 Table 42
1 339 2016 1 484 144 471 108
1 759 166
520 114
2015 592 106 342 309 1 349 2015 1 544 149 502 112
2014
2016 585 106 337 310
1 614 154
2 206lt 單位太焦耳 Unit Terajoule gt lt 單位太焦耳 Unit Terajoule gt
2 402
2 307
590 106 340 308 1 344 2014
2006 810 114 925 231 2 080
年份Year
工業生產設備 5
Industrial ProcessEquipment 5
照明Lighting
空氣調節Air
Conditioning
其他1
Others1總計Total
2008 751 105 857 214 1 926
2007 733 103 837 209 1 882
2010 668 94 761 190 1 714
2009 694 97 791 198 1 779
2012 466 63 544 136 1 208
2011 484 65 565 141 1 255
2014 459 62 541 134 1 195
2013 461 62 534 134 1 192
3按最終用途及組別劃分
3By End-uses amp Segments
食品及飲品組別 Food amp Beverage Segment
36 工業類別電力使用按最終用途劃分 Electricity Consumption By End-uses In Industrial Segments
55 56
lt 單位太焦耳 Unit Terajoule gt
2016 456 61 529 133 1 179
2015 467 63 551 136 1 217
表 45 Table 45
太焦耳Terajoule
年份Year
貨車Goods Vehicle
其他
Others 總計Total
貨運組別 Freight Segments圖 23 Graph 23
3按最終用途及組別劃分
3By End-uses amp Segments
所有運輸組別 All Transport Segments
37 運輸類別所有能源使用按最終用途劃分 All Energy Consumption By End-uses In Transport Segments
32 551 6 601 39 152 0
2007
2006
31 771 6 411 38 182 0
0
2009 28 501 5 424 33 925 0
2008 30 438 5 929 36 367
0
2011 28 010 4 134 32 144 0
2010 28 585 4 744 33 329
0
2013 25 534 3 305 28 839 0
2012 26 941 3 826 30 767
0
2015
0
lt 單位太焦耳 Unit Terajoule gt
2014 25 009 3 264 28 273
24 782 3 269 28 051 0
2016
總計Total
年份Year
貨運Freight
客運Passenger
總計Total
年份Year
巴士Bus
24 721 2 961 27 682
客運組別 Passenger Segments表 44 Table 44 表 46 Table 46
41 57 251 59 96 404
的士Taxi
汽車Car
電單車Motorcycle
鐵路Rail
其他
Others
14 102 17 118 463 2 495 3 973 57 983
4 017 57 251
2007 38 182 40 57 983 60 96 165 2007 19 832
2006 20 301 13 797 16 267 426 2 4442006 39 152
56 718
3 965 58 137
2009 33 925 37 56 718 63 90 643 2009 19 150
2008 18 971 15 142 17 059 480 2 5202008 36 367 38 58 137 62 94 504
37 57 560 63 90 889
13 131 17 449 465 2 523 4 000
13 593 18 879 424 2 609 4 213 58 630
4 124 57 560
2011 32 144 35 58 630 65 90 774 2011 18 911
2010 18 842 13 373 18 247 436 2 5402010 33 329
61 359
4 354 59 656
2013 28 839 32 61 359 68 90 198 2013 19 144
2012 19 128 13 469 19 561 423 2 7222012 30 767 34 59 656 66 90 423
31 61 725 69 89 999
13 319 21 158 406 2 796 4 536
13 039 21 764 448 2 972 4 631 61 195
4 547 61 725
2015 28 051 31 61 195 69 89 245 2015 18 341
2014 18 659 14 133 21 085 426 2 8752014 28 273
57 58
4 636 62 136lt 單位太焦耳 Unit Terajoule gt lt 單位太焦耳 Unit Terajoule gt
此項之最終用途包括船隻及香港內部的航空運輸能源的使用等 End-uses under this heading include marine and internal air transportation energy uses etc
2016 18 918 12 288 22 881 463 2 9512016 27 682 31 62 136 69 89 819
0
10 000
20 000
30 000
40 000
50 000
60 000
70 000
80 000
90 000
100 000
2006 2007 2008 2009 2010 2011 2012 2013 2014 2015 2016
貨運
Freight客運
Passenger
4按燃料及類別劃分
4By Fuels amp Sectors
41 所有能源使用按燃料劃分
All Energy Consumption By Fuels圖 24 Graph 24 圖 25 Graph 25
3按最終用途及組別劃分
3By End-uses amp Segments
所有運輸能源最終用途 All Transport Energy End-uses
37 運輸類別所有能源使用按最終用途劃分 All Energy Consumption By End-uses In Transport Segments
年份 Year 2016 太焦耳Terajoule
表 47 Table 47
年份 Year 2006 年份Year
煤氣及石油氣Town Gas amp
Liquefied Petroleum Gas
油及煤產品Oil amp CoalProducts
電力Electricity
總計Total
2006 48 482 17 87 518 31 145 204 52 281 204 100
2007 48 721 17 86 647 31 147 072 52 282 440 100
52 281 438 100
2009 47 239 17 82 194 29 149 366 54
2008 49 732 18 84 361 30 147 345
278 799 100
2010 49 084 17 81 786 29 150 859 54 281 729 100
2011 49 568 18 81 716 29 151 606 54 282 890 100
54 286 048 100
2013 49 723 17 81 306 29 153 362 54
2012 49 616 17 81 352 28 155 079
284 391 100
2014 50 844 18 80 347 28 158 147 55 289 338 100
2015 48 954 17 80 757 28 158 275 55 287 986 100
59 60
55 289 219 100
lt 單位太焦耳 Unit Terajoule gt
「總熱值」是使用於計算各種氣體燃料的熱含量 Gross caloricfic values are used in calculating the respective heat contents of the gaseous products
2016 49 374 17 81 184 28 158 662
巴士
Bus 21
的士
Taxi14
汽車及電單車
Car amp Motorcycle26
貨車
Goods Vehicle28
鐵路及其他
Rail amp Others12
巴士
Bus 21
的士
Taxi14
汽車及電單車
Car amp Motorcycle17
貨車
Goods Vehicle34
鐵路及其他
Rail amp Others14
0
50 000
100 000
150 000
200 000
250 000
300 000
2006 2007 2008 2009 2010 2011 2012 2013 2014 2015 2016
煤氣及石油氣Town Gas amp Liquefied Petroleum Gas
油及煤產品
Oil amp Coal Products 電力
Electricity
太焦耳Terajoule
太焦耳Terajoule
表 48 Table 48 表 49 Table 49
4按燃料及類別劃分
4By Fuels amp Sectors
43 商業類別按燃料劃分
Commercial Sector By Fuels42 住宅類別按燃料劃分
Residential Sector By Fuels 圖 26 Graph 26 圖 27 Graph 27
煤氣及石油氣Town Gas amp
Liquefied Petroleum Gas
油及煤產品Oil amp CoalProducts
電力Electricity
總計Total
2006 18 476 34 79 0 35 428
年份Year
煤氣及石油氣Town Gas amp
Liquefied Petroleum Gas
油及煤產品Oil amp CoalProducts
電力Electricity
總計Total
年份Year
4 936 4 93 317 83 111 884 10066 53 982 100 2006 13 631 12
83 113 914 10067 54 717 100 2007 13 888 12
2008 18 708 33 41 0 37 100
4 975 4 95 0512007 18 238 33 57 0 36 422
4 739 4 95 543 84 113 753 10066 55 849 100 2008 13 471 12
85 114 297 10068 57 731 100 2009 12 815 11
2010 19 038 33 13 0 39 344
4 753 4 96 7282009 18 736 32 23 0 38 972
4 526 4 97 894 84 116 391 10067 58 396 100 2010 13 971 12
84 118 558 10068 58 826 100 2011 14 161 12
2012 18 736 31 8 0 41 189
4 803 4 99 5942011 18 946 32 8 0 39 872
4 769 4 101 813 84 120 970 10069 59 932 100 2012 14 388 12
84 121 215 10068 58 394 100 2013 14 709 12
2014 18 487 30 8 0 43 415
5 026 4 101 4802013 18 446 32 8 0 39 941
5 156 4 102 627 84 122 711 10070 61 910 100 2014 14 928 12
84 123 674 10070 60 214 100 2015 14 795 12
2016 18 311 30 8 0 43 120
5 186 4 103 6932015 17 838 30 8 0 42 368
5 164 4 103 881 84 123 969 10070 61 439 100 2016 14 924 12lt 單位太焦耳 Unit Terajoule gt lt 單位太焦耳 Unit Terajoule gt
「總熱值」是使用於計算各種氣體燃料的熱含量 Gross caloricfic values are used in calculating the respective heat contents of the gaseous products
「總熱值」是使用於計算各種氣體燃料的熱含量 Gross caloricfic values are used in calculating the respective heat contents of the gaseous products
61 62
0
10 000
20 000
30 000
40 000
50 000
60 000
70 000
2006 2007 2008 2009 2010 2011 2012 2013 2014 2015 2016
煤氣及石油氣Town Gas amp Liquefied Petroleum Gas
油及煤產品
Oil amp Coal Products 電力
Electricity
0
20 000
40 000
60 000
80 000
100 000
120 000
140 000
2006 2007 2008 2009 2010 2011 2012 2013 2014 2015 2016煤氣及石油氣Town Gas amp Liquefied Petroleum Gas
油及煤產品
Oil amp Coal Products 電力
Electricity
太焦耳Terajoule
太焦耳Terajoule
表 50 Table 50 表 51 Table 51
4按燃料及類別劃分
4By Fuels amp Sectors
45 運輸類別按燃料劃分
Transport Sector By Fuels44 工業類別按燃料劃分
Industrial Sector By Fuels 圖 28 Graph 28 圖 29 Graph 29
煤氣及石油氣Town Gas amp
Liquefied Petroleum Gas
油及煤產品Oil amp CoalProducts
電力Electricity
總計Total
2006 926 5 3 994 21 14 015
年份Year
煤氣及石油氣Town Gas amp
Liquefied Petroleum Gas
油及煤產品Oil amp CoalProducts
電力Electricity
總計Total
年份Year
78 510 81 2 444 3 96 404 10074 18 934 100 2006 15 450 16
3 96 165 10074 17 645 100 2007 15 678 16
2008 927 5 4 223 24 12 182
77 992 81 2 4952007 917 5 3 623 21 13 104
75 358 80 2 520 3 94 504 10070 17 332 100 2008 16 627 18
3 90 643 10069 16 129 100 2009 14 765 16
2010 937 6 4 035 25 11 082
73 355 81 2 5232009 923 6 4 063 25 11 143
73 213 81 2 540 3 90 889 10069 16 053 100 2010 15 137 17
3 90 774 10065 14 732 100 2011 15 506 17
2012 1 108 8 4 259 29 9 356
72 659 80 2 6092011 956 6 4 246 29 9 530
72 317 80 2 722 3 90 423 10064 14 723 100 2012 15 384 17
3 90 198 10063 14 583 100 2013 15 348 17
2014 1 244 8 4 244 29 9 230
72 054 80 2 7962013 1 220 8 4 218 29 9 144
70 939 79 2 875 3 89 999 10063 14 718 100 2014 16 185 18
3 89 245 10062 14 853 100 2015 15 048 17
2016 1 171 8 4 112 29 8 709
71 225 80 2 9722015 1 272 9 4 339 29 9 242
71 900 80 2 951 3 89 819 10062 13 992 100 2016 14 967 17lt 單位太焦耳 Unit Terajoule gt lt 單位太焦耳 Unit Terajoule gt
「總熱值」是使用於計算各種氣體燃料的熱含量 Gross caloricfic values are used in calculating the respective heat contents of the gaseous products
「總熱值」是使用於計算各種氣體燃料的熱含量 Gross caloricfic values are used in calculating the respective heat contents of the gaseous products
63 64
0
2 000
4 000
6 000
8 000
10 000
12 000
14 000
16 000
18 000
20 000
2006 2007 2008 2009 2010 2011 2012 2013 2014 2015 2016煤氣及石油氣Town Gas amp Liquefied Petroleum Gas
油及煤產品
Oil amp Coal Products電力
Electricity
0
10 000
20 000
30 000
40 000
50 000
60 000
70 000
80 000
90 000
100 000
2006 2007 2008 2009 2010 2011 2012 2013 2014 2015 2016煤氣及石油氣Town Gas amp Liquefied Petroleum Gas
油及煤產品
Oil amp Coal Products電力
Electricity
47 890 281 204
2007
20 301 13 797 16 267 426
2 506 10 158 49 197 282 440 14 102
46 5022006
19 832
16 465
17 071
5按最終用途及燃料劃分
5By End-uses amp Fuels
51 所有能源使用按最終用途劃分
All Energy Consumption By End-uses
2 454 10 413
15 142 17 059 480
2 529 9 228
7 918 31 836 12 776 32 551 21 608
51 487 278 799 13 131
17 118 463
17 449 465
2008
8 672 52 019 281 729
19 150
2 527 9 680 50 117 281 438
2009
18 971
8 496
9 121
9 244 19 199
2011
18 842 13 373 18 247 436
2 609 8 245 56 161 282 890 13 593 18 879 31 989 14 187 28 010
2012
2013
19 128
2 542
2 722 8 077 58 650 286 048 13 469 19 561 423
424
2010
18 911
19 144
9 213
8 536
8 319
8 199
19 563
19 314
19 662
19 655 44 243 14 181
14 197
13 708
2 796 7 739 58 100 284 391 13 319 21 158 406
2 875 7 705 58 273 289 338
25 534
2015
18 659 14 133 21 085 426
2 972 7 792 58 218 287 986 13 039 21 764 448
2014 25 009
24 782
8 607
8 717
19 609
19 774
48 746
48 466 18 341
2 951 7 474 59 374 289 219
51 所有能源使用按最終用途劃分 All Energy Consumption By End-uses 圖 30 Graph 30
18 918 12 288 22 881 4632016lt 單位太焦耳 Unit Terajoule gt
14 227 24 721 8 562 17 798 47 938 31 785 19 839
年份 Year 2016 年份 Year 2006
65 66
31 989
31 837
31 402
17 734
17 173
17 413
17 117
17 352
17 927
18 177
18 565
14 111 26 941
45 298
43 392
44 117
45 511
44 914
45 861
20 372
18 965
32 885
34 023
33 302
33 379
13 172
13 788
13 824
13 936
31 771
30 438
28 501
28 585
31 772
表 52 Table 52
年份Year
空氣調節Air
Conditioning
工業生產設備5
IndustrialProcessEquipment5
照明Lighting
冷凍Refrigeration
巴士Bus
的士Taxi
汽車Car
電單車Motorcycle
鐵路Rail
船隻Marine
其他1
Others1總計Total
貨車GoodsVehicle
煮食Cooking
熱水Hot Water
空氣調節
AirConditioning
17
煮食
Cooking11
工業生產設備
Industrial ProcessEquipment
6照明
Lighting7
冷凍
Refrigeration3
熱水
Hot Water 5
貨車
GoodsVehicle
9
巴士
Bus 6
的士
Taxi4
汽車及電單車
Car amp Motorcycle8
鐵路
Rail1
船隻
Marine 3
其他
Others20
空氣調節
AirConditioning
17
煮食
Cooking11
工業生產設備
Industrial ProcessEquipment
6照明
Lighting8
冷凍
Refrigeration3
熱水
Hot Water 4貨車
GoodsVehicle12
巴士
Bus 7
的士
Taxi5
汽車及電單車
Car amp Motorcycle6
鐵路
Rail1
船隻
Marine 4
其他
Others17
2006 46 502 21 608 7 918
5按最終用途及燃料劃分
5By End-uses amp Fuels
52 電力使用按最終用途劃分
Electricity Consumption By End-uses 表 53 Table 53
4 191 11 105 2 444 33 317 145 204
年份Year
空氣調節Air Conditioning
照明Lighting
冷凍Refrigeration
熱水Hot Water
辦公室設備Office Equipment
鐵路Rail
工業生產設備5
IndustrialProcessEquipment5
其他1
Others1總計Total
煮食Cooking
2007 45 298 20 372 8 496
5 373 11 246 2 520 35 477 147 345
4 809 11 171 2 495 34 776 147 072
2010 45 511 19 563 9 213
2009 44 117 19 199 9 244
2008 43 392 18 965 9 121
11 0612012 45 861 19 662 8 319
2011 44 914 19 314 8 536 9 201
9 131
10 738
4 715 13 200 2 722 40 408 155 079
4 945 12 615 2 609 38 732 151 606
11 412
11 3312014 48 746 19 609 8 607
2013 44 243 19 655 8 199 9 280
9 415 4 854 13 344 2 875 39 367 158 147
4 904 13 407 2 796 39 466 153 362
2016 47 938 19 839 8 562
2015 48 466 19 774 8 717 11 344 9 553
13 513 2 951 40 363 158 662 11 528 9 044
4 624 13 212 2 972 39 615 158 275
35 815
67 68
150 859
36 644 149 366
9 048
9 722
10 320
9 926
lt 單位太焦耳 Unit Terajoule gt
52 電力使用按最終用途劃分 Electricity Consumption By End-uses 圖 31 Graph 31
年份 Year 2016 年份 Year 2006
4 923
10 016
9 073
9 934
10 929
10 959
11 430 5 015 11 758 2 540
5 274 11 480 2 523
空氣調節Air
Conditioning 30
照明Lighting
13
冷凍Refrigeration
5
工業生產設備Industrial Process
Equipment6
煮食Cooking
7
熱水Hot Water
3辦公室設備
Office Equipment9
鐵路Rail2
其他Others25
空氣調節Air
Conditioning 32
照明Lighting
15
冷凍Refrigeration
5
工業生產設備Industrial Process
Equipment6
煮食Cooking
6
熱水Hot Water
3辦公室設備
Office Equipment8
鐵路Rail2
其他Others23
年份Year
貨車Goods Vehicle
巴士Bus
的士Taxi
5按最終用途及燃料劃分
5By End-uses amp Fuels
53 油及煤產品使用按最終用途劃分
Oil amp Coal Products Consumption By End-uses 表 54 Table 54
汽車Car
電單車Motorcycle
工業生產設備5
Industrial ProcessEquipment5
船隻Marine
其他1
Others1總計Total
87 518
2007 31 770 18 254 2 17 117 463 6 448 10 158 2 434 86 647
2006 32 551 18 647 2 16 266 426 6 508 10 413 2 705
84 361
2009 28 501 17 514 2 17 448 465 6 341 9 228 2 695 82 194
2008 30 438 17 485 2 17 059 480 6 503 9 680 2 713
81 786
2011 28 010 16 997 1 18 879 424 6 926 8 245 2 234 81 716
2010 28 585 17 077 1 18 247 436 6 423 8 672 2 346
81 352
2013 25 534 17 114 1 21 158 406 7 386 7 739 1 969 81 306
2012 26 941 17 212 1 19 560 423 7 074 8 077 2 064
80 347
2015 24 782 16 331 1 21 764 448
7 553 7 474 1 854 81 184
2014 25 009 16 607 1 21 085 426 7 458 7 705 2 056
lt 單位太焦耳 Unit Terajoule gt
53 油及煤產品使用按最終用途劃分
Oil amp Coal Products Consumption By End-uses 圖 32 Graph 32
7 688 7 792 1 953 80 757
2016 24 721 16 239 lt1 22 881 463
年份 Year 2016 年份 Year 2006
69 70
貨車GoodsVehicle31
巴士及的士Bus amp Taxi
20
汽車及電單車Car amp Motorcycle
29
工業生產設備Industrial Process
Equipment9
船隻Marine
9其他
Others2
貨車GoodsVehicle37
巴士及的士Bus amp Taxi
21
汽車及電單車Car amp Motorcycle
19
工業生產設備Industrial Process
Equipment8
船隻Marine
12其他
Others3
年份Year
煮食Cooking
熱水Hot Water
運輸Transport
其他1
Others1總計Total
5按最終用途及燃料劃分
5By End-uses amp Fuels
54 煤氣及石油氣使用按最終用途劃分
Town Gas amp Liquefied Petroleum Gas Consumption By End-uses 表 55 Table 55
2007 22 021 8 363 15 678 2 659 48 721
2006 21 741 8 585 15 450 2 706 48 482
2009 21 390 8 550 14 765 2 534 47 239
2008 22 220 8 415 16 627 2 472 49 732
2011 20 749 9 242 15 506 4 072 49 568
2010 21 244 8 921 15 137 3 782 49 084
2013 20 222 9 277 15 348 4 876 49 723
2012 20 330 9 396 15 384 4 506 49 616
2015 19 767 9 085 15 048 5 054 48 954
2014 20 194 9 342 16 185 5 123 50 844
lt 單位太焦耳 Unit Terajoule gt
54 煤氣及石油氣使用按最終用途劃分 Town Gas amp Liquefied Petroleum Gas Consumption By End-uses 圖 33 Graph 33
年份 Year 2016 年份 Year 2006
2016 19 990 9 304 14 967 5 113 49 374
「總熱值」是使用於計算各種氣體燃料的熱含量 Gross caloricfic values are used in calculating the respective heat contents of the gaseous products
71 72
煮食Cooking
41
熱水Hot Water
19
運輸Transport
30
其他Others10
煮食Cooking
45
熱水Hot Water
18運輸
Transport32
其他Others
5
6 根據已更新的可再生能源數據相關的2010年至2011年能源最終用途數據已在
2013年版中作出修訂[2013年版修訂]The energy end-use data from 2010 to 2011 were revised in the 2013 Edition basedon the latest update of the renewable energy data (Revised in 2013 Edition)
3 根據運輸能源消耗調查所得的數據有關2008年至2012年的能源最終用途數據已
在2015年版中作出修訂[2015年版修訂]The energy end-use data from year 2008 to 2012 were revised in the 2015 Editionbased on the findings of energy consumption survey on the Transport Sector(Revised in 2015 Edition)
4 自2014年版起新的「住宿」「醫療」和「教育」組別已由「其他商業」組別
分拆出來「其他商業」組別因而相應地縮小[2014年版修訂]The Accommodation Human Health and Education Segments weresegregated from the Other Commercial Segment as new segments in the 2014Edition Hence the size of the Other Commercial Segment is accordingly reduced(Revised in 2014 Edition)
5 自2014年版起燃料的熱含量均以「總熱值」計算因而自2002年後的能源數據
均已採用「總熱值」作出計算[2014年版修訂]Since the 2014 Edition Gross Calorific Values are used for calculating the heatcontents of fuels Gross Calorific Values are hence used in computing energy datafrom 2002 onwards (Revised in 2014 Edition)
1 由於資料所限能源數據不能再分拆成其他最終用途數據「其他」的最終用途包
括沒有被列在表上的最終用途
2 自2013年後「空氣調節」「冷凍」「工業生產設備」及「熱水」的能源最終
用途數據已採用「氣溫因素」作出修訂[2017年版修訂]The energy end-use data of Air Conditioning Refrigeration IndustrialProcessEquipment and Hot Water are revised by Temperature Factor fromyear 2013 onwards (Revised in 2017 Edition)
Due to data limitations energy data could not further be broken down into other end-uses The ldquoOthersrdquo end-use includes the end-uses not elsewhere listed in the table
2 「房委會資助出售單位」組別前稱為「居屋計劃」組別
1 根據零售組別能源消耗調查所得的數據有關2011年至2014年的能源最終用途數
據已在2017年版中作出修訂[2017年版修訂]The energy end-use data from year 2011 to 2014 were revised in the 2017 Editionbased on the findings of energy consumption survey on the Retail Segment(Revised in 2017 Edition)
6Notes 7Chronology of Major Revisions7主要修訂年表6註釋
3 「其他房屋」組別包括別墅平房及類似屋宇
The ldquoOther Housingrdquo Segment includes villas bungalows and the like
4 「熱水及冷凍」的最終用途包括鍋爐器材及其他生產加熱和冷凍的設備
The ldquo Non-manufacturing rdquo Segment includes construction and other miscellaneousnon-manufacturing industrial activities
The ldquoHousing Authority Subsidized Sale Flatsrdquo Segment was previously called ldquoHomeOwnershiprdquo Segment
The ldquo Hot Water amp Refrigeration rdquo end-use includes boiling equipments and otherprocess heating and cooling facilities
「工業生產設備」的最終用途包括鍋爐設備及其他生產加熱和冷凍設備的使用
The ldquoOther Industrialrdquo Segment includes electronics paper printing plastic and othermiscellaneous industrial activities
73
The ldquo GDP in chained dollars rdquo were revised based on latest data published by theCensus and Statisics Department
8 ldquo本地生產總值環比物量計算rdquo己根據政府統計處最新數據作出修訂
74
7 「其他工業」組別包括電子紙張印刷塑膠及其他雜項工業活動
The ldquo Industrial ProcessEquipment rdquo end-use includes boiler plants and other processheating and cooling facilities
6 「非製造業」組別包括建造及其他非製造業之雜項工業活動
5
7主要修訂年表
13 自2010年起「電力」包括燃煤天然氣風能及太陽能所產生的電能[2012年版修訂]ldquoElectricityrdquoincludes the electricity generated from coal natural gas wind and solarpower since 2010 (Revised in 2012 Edition)
14 根據工業能源消耗調查所得的數據有關2000年至2010年的能源最終用途數據已
在2012年版中作出修訂[2012年版修訂]The energy end-use data from year 2000 to 2010 were revised in the 2012 Editionbased on the findings of energy consumption survey on the Industrial Sector(Revised in 2012 Edition)
自2013年版起「煮食」之能源最終用途除已包括煮食爐及飯煲外再加上在廚房
普遍用作製造及準備食物的器具例如煮食用水加熱設備電焗爐及微波爐等
自2001年後的「煮食」之能源最終用途數據均作出修訂[2013年版修訂]The ldquo Cooking rdquo energy end-use was revised in the 2013 Edition to include foodmaking and preparation appliances normally found in kitchens in addition to stovesand rice cookers Examples of the appliances are hot water for cooking purposeselectric ovens and microwave ovens etc The ldquoCookingrdquo energy end-use data since2001 were hence updated (Revised in 2013 Edition)
自2011年「商業」及「工業」類別的分類已經根據香港標準行業分類20版作出
修訂這修訂包括將個人服務活動(例如夜總會卡拉OK電腦及通訊設施維
修家居用品維修車輛維修服務藝術表演或創作活動及出版服務)由以往的
「食肆」「其他商業」組別或「工業」類別重置到現時的「零售」組別其同
時涵蓋零售及個人服務活動[2013年版修訂]The ldquoCommercialrdquo and ldquoIndustrialldquo Sectors were re-categorized in 2011 to alignwith the Hong Kong Standard Industrial Classification (HSIC) Version 20Examples of such changes are the relocations of personal service activities (such asnight clubs karaokes computer and communication repair household goodsrepair motor vehicle repair services art performance or creation activities andpublishing services etc) from the previous ldquo Restaurant ldquo Other CommercialSegments or the rdquoIndustrialrdquo Sector to the present ldquoRetailrdquo Segment which nowembraces both retail and personal service activities (Revised in 2013 Edition)
12 自2010年的能源最終用途數據包括可再生能源數據[2012年版修訂]The energy end-use data from 2010 includes renewable energy data(Revised in 2012 Edition)
11
75 76
7Chronology of Major Revisions
8 自2013年版起「空氣調節」之能源最終用途除已包括冷氣設備及暖氣機外再加
上風扇空氣清新或淨化器及抽濕機 自2001年後的「空氣調節」之能源最終用
途數據均作出修訂[2013年版修訂]The ldquoAir Conditioningrdquo energy end-use was revised in the 2013 Edition to includefans air cleanerpurifiers and dehumidifiers in addition to air conditioning unitsand heaters The ldquoAir Conditioningrdquo energy end-use data since 2001 were henceupdated (Revised in 2013 Edition)
9 自2013年版起「辦公室設備」之能源最終用途除已包括電腦及影印機外再加上
視聽器材碎紙機傳真及收銀機自2001年後的「辦公室設備」之能源最終用
途數據均作出修訂[2013年版修訂]The ldquoOffice Equipmentrdquo energy end-use was revised in the 2013 Edition to includeaudio visual equipments shredders fax and cashier machines etc in addition tocomputers and photocopiers The ldquoOffice Equipmentrdquo energy end-use data since2001 were hence updated (Revised in 2013 Edition)
10 根據住宅能源消耗調查所得的數據有關2009年至2011年的能源最終用途數據已
在2013年版中作出修訂[2013年版修訂]The energy end-use data from year 2009 to 2011 were revised in the 2013 Editionbased on the findings of energy consumption survey on the Residential Sector(Revised in 2013 Edition)
15 根據政府統計處公佈的人口及家庭住戶統計修訂數字有關2007至2010年的能源
最終用途數據己在2012年版中作出相應的修訂[2012年版修訂]The energy end-use data from years 2007 to 2010 were revised in the 2012 Editionbased on the revised population and domestic household data published by theCensus and Statistics Department (Revised in 2012 Edition)
7
17 根據政府統計處公佈的家庭住戶統計修訂數字有關2001至2006年的能源最終用
途數據己在2009年版中作出修訂[2009年版修訂]The energy end-use data from years 2001 to 2006 were revised in the 2009 Editionbased on the revised domestic household data published by the Census and StatisticsDepartment (Revised in 2009 Edition)
18 自2006年起「鐵路」之能源最終用途再不包括鐵路車站等建築物使用的電量
[2008年版修訂]The ldquoRailrdquo energy end-use do not include electricity consumption at railway stationsfrom 2006 onwards (Revised in 2008 Edition)
16 根據商業及運輸能源消耗調查所得的數據有關2003年至2007年的能源最終用途
數據已在2010年版中作出修訂[2010年版修訂]The energy end-use data from year 2003 to 2007 were revised in the 2010 Editionbased on the findings of energy consumption survey on the Commercial andTransport Sectors (Revised in 2010 Edition)
7Chronology of Major Revisions 8Units of Measurement7主要修訂年表 8計量單位
1 太焦耳 = 1012 焦耳 1 terajoule (TJ) = 1012 joules
1 千兆焦耳 = 109 焦耳 1 gigajoule (GJ) = 109 joules
1 百萬焦耳 = 106 焦耳 1 megajoule (MJ) = 106 joules
77 78
1 千兆瓦小時 = 36 x 1012 焦耳 1 gigawatt hour (GWh) = 36 x 1012 joules
1 兆瓦小時 = 36 x 109 焦耳 1 megawatt hour (MWh) = 36 x 109 joules
1 千瓦小時 = 36 x 106 焦耳 1 kilowatt hour (kWh) = 36 x 106 joules
網址 httpwwwemsdgovhk電郵 energydataemsdgovhk
79 80
Enquiries about this publication can be directed to
The Energy Efficiency OfficeElectrical amp Mechanical Services Department
7F 3 Kai Shing Street Kowloon Bay Hong Kong
Tel No (852) 2808 3465Fax No (852) 2890 6081
Homepage httpwwwemsdgovhkE-mail energydataemsdgovhk
Set of Hong Kong Energy End-use Data can be downloadedfrom EMSD website
httpswwwemsdgovhkenenergy_efficiencyenergy_end_use_data_and_consumption_indicatorshong_kong_energy_end_use_datadataindexhtml
有關本刊物的查詢請聯絡
機電工程署
香港九龍灣啟成街3號7樓
能源效益事務處 httpswwwemsdgovhktcenergy_efficiencyenergy_end_use_data_and_consumption_indicatorshong_kong_energy_end_use_datadataindexhtml
香港能源最終用途數據收錄之數據可在機電工程署網站下載
電話(852) 2808 3465圖文傳真(852) 2890 6081
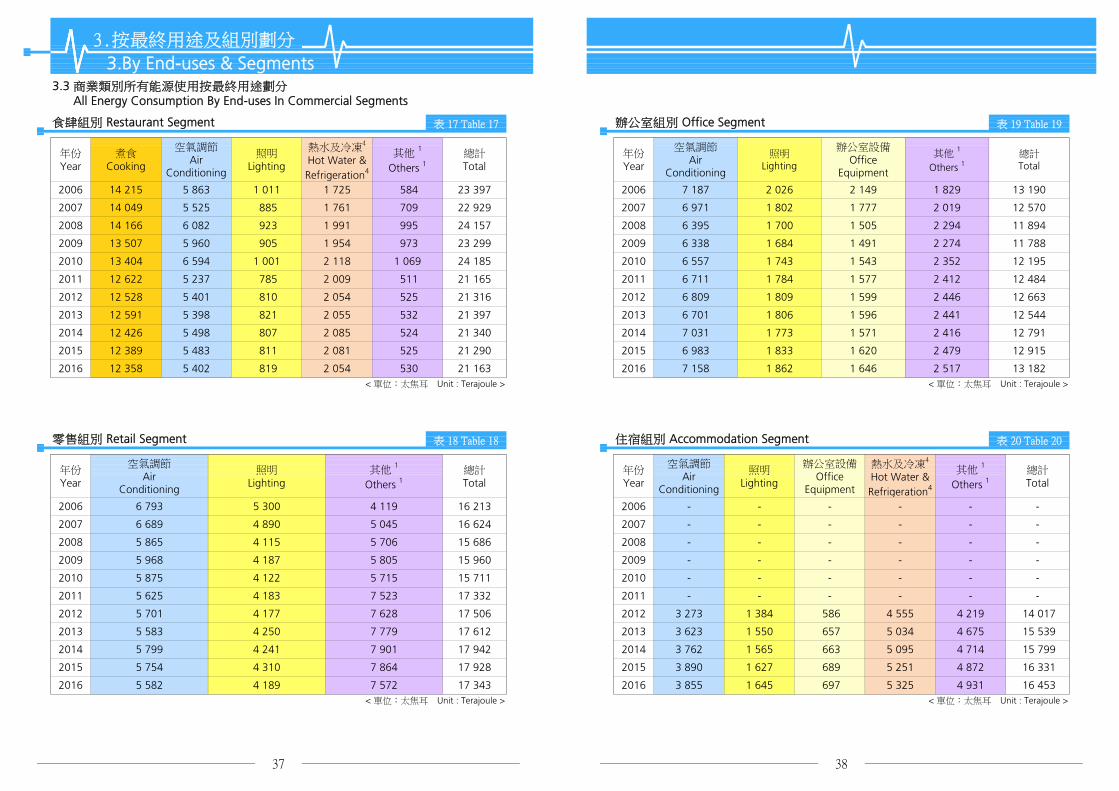
3按最終用途及組別劃分
3By End-uses amp Segments
食肆組別 Restaurant Segment
33 商業類別所有能源使用按最終用途劃分 All Energy Consumption By End-uses In Commercial Segments
11 788
1 743 1 543 2 352 12 195
14 166
表 19 Table 19
2010
2009
年份Year
1 7002008 24 157
22 929 20071 761 7092007 6 971
923
885
1 954 905
總計Total
511
23 299 2009
6 557
總計Total
1 829 13 190
2008 6 395
2 517 13 182
1 599 2 446 12 663
1 806 1 596 2 441
2 416 12 791
1 809
1 571
12 544
2 479 12 915
5 401 2 054 810
785
2016 1 862 1 6467 158
525
2013
2015
2014
2 055 821 532 21 397
2 054 819
21 165 1 577
6 983
6 701
1 784
689
17 343 2016
4 1835 625 -2011
6 338
7 523
5 701 4 177 7 628
5 583 4 250
5 754 4 310
7 901
1 773
5 706
5 805
1 833 1 620 525
12 528
lt 單位太焦耳 Unit Terajoule gt
零售組別 Retail Segment 表 18 Table 18
總計Total
4 115
2009
2014 21 340
其他 1
Others 1
21 163
照明Lighting
811
807 524
21 2902 081
2 085
530
2007
年份Year
4 1192006
2008
-
6 809
lt 單位太焦耳 Unit Terajoule gt lt 單位太焦耳 Unit Terajoule gt
2013
14 0173 273 4 5551 384 4 21917 506 20122012
7 779 15 5393 623 5 0341 550
1 645 4 931 6975 582 4 189 7 572
辦公室設備Office
Equipment
6 711
4 67517 612 2013
7 864
lt 單位太焦耳 Unit Terajoule gt
住宿組別 Accommodation Segment 表 20 Table 20
總計Total
空氣調節Air
Conditioning
熱水及冷凍4
Hot Water ampRefrigeration4
照明Lighting
其他 1
Others 1年份Year
-- -- -17 332
7 031
- -
2013
2016
2015 12 389 5 483
12 358 5 402
5 398
5 498
15 711 20102010 -5 7154 122
5 799
5 875
663
2011
586
657
37 38
16 4533 855 5 325
15 7993 762 5 0951 565 4 71417 942 20144 241
16 3313 890 5 2511 627 4 87217 928 20152015
2014
2016
-
-- -- -
--5 865 -15 686 2008
4 187
- -
15 960 2009 -
-
6 793
5 968
13 507 5 960
-- -- -16 624 20076 689 4 890 5 045 -
-- -- -16 213 20065 300
空氣調節Air
Conditioning
12 591
12 426
14 049 5 525
6 082 1 991
照明Lighting
辦公室設備Office
Equipment
其他 1
Others 1
2 019
2012
20112011 12 622 5 237 2 009
973
21 316 2012
24 185 201013 404 6 594 2 1181 001 1 069
辦公室組別 Office Segment表 17 Table 17
23 397 2006 7 187
1 802 1 777 12 570
2 412 12 484
1 505 2 294 11 894
1 684 1 491 2 274
995
- -
2006
年份Year
煮食Cooking
空氣調節Air
Conditioning
熱水及冷凍4
Hot Water ampRefrigeration4
照明Lighting
其他 1
Others 1
2 026 2 14914 215 584
空氣調節Air
Conditioning
5 863 1 7251 011
5 596 1 486
5 561 5 518 1 478 1 918
46 536
31 341 45 816
5 587 5 571 1 486 1 911 31 482 46 037
5 430
34 746 64 300
11 225 7 603 2 684 8 396 37 669 67 577
32 327 46 6325 402 5 516
9 672 7 207 3 092 8 255
1 527 1 860
10 154 7 586 3 156 8 659
45 328
10 572 7 766
130
- - -
-
61 790
131 538
33 790 62 015
9 860 7 321 3 087 8 231 34 751 63 251
2010
- 2009
- 2008
- - -
- - -
59 084
-
其他 1
Others 1
lt 單位太焦耳 Unit Terajoule gt
5 968 2016 1 845 32 179
5 581 2013
5 563 2012
-
-
- 2011
-
5 486
3 273
照明Lighting
辦公室設備Office
Equipment
熱水及冷凍4
Hot Water ampRefrigeration4
其他 1
Others 1
546
542
-
31 558
-
533
1 475 1 832 31 132
- 2007
5 402
2 573 6 616
10 348 7 527 2 881 7 714 33 321
39 40
2016 3 324
2015 3 2861 606
lt 單位太焦耳 Unit Terajoule gt
3 270
1 613 681 337 138 556
1 603
666 330 137
661 327 137
- -
2014
2013 1 563
2012
2011 -
1 602
- - -
-
- -
-
671 332
- -
3 215 661 327
2006 -
-
2010 -
2009 --
lt 單位太焦耳 Unit Terajoule gt
教育組別 Education Segment 表 22 Table 22
2008 -
2007 -- -
年份Year
總計Total
空氣調節Air
Conditioning
照明Lighting
辦公室設備Office
Equipment
熱水及冷凍4
Hot Water ampRefrigeration4
-
2016 1 257 303 298 2 218 1 892
5 887 2015
5 753 20142014 1 237 289 285 2 126 1 817
2015 1 261 297 292 2 176 1 862
2012 1 189 283 279 2 057 1 754
2013 1 178 284 280 2 071 1 768
2010 - - - - -
2011 - - - - -
2008 - - - - -
2009 - - - - -
20062006 - - - - -
2007 - - - - -
3按最終用途及組別劃分
3By End-uses amp Segments
醫療組別 Human Health Segment
33 商業類別所有能源使用按最終用途劃分 All Energy Consumption By End-uses In Commercial Segments
其他商業組別 Other Commercial Segments表 21 Table 21 表 23 Table 23
年份Year
空氣調節Air
Conditioning
照明Lighting
辦公室設備Office
Equipment
熱水及冷凍4
Hot Water ampRefrigeration4
其他 1
Others 1總計Total
年份Year
空氣調節Air
Conditioning
總計Total
12 106 3 537 3 198
12 381 16 826 12 915 12 043 3 489 3 158 42 881 103 693
lt 單位太焦耳 Unit Terajoule gt
41 42
101 480
2014 12 379 16 742 12 791 11 615 3 412 3 144 42 544 102 627
2016 12 330 16 306 13 182 43 223 103 881
2015
43 748 101 813
2013 12 336 16 435 12 544 11 386 3 317 3 102 42 361
2012 12 265 16 442 12 663 10 211 3 321 3 164
2011 11 894 16 339 12 484 - - - 58 877 99 594
2010 14 372 15 711 12 195 - - - 55 616 97 894
2009 12 990 15 960 11 788 - - - 55 991 96 728
2008 13 257 15 686 11 894 - - - 54 706 95 543
2007 11 681 16 624 12 570 - - - 54 176 95 051
所有商業能源最終用途 All Commercial Energy End-uses圖 17 Graph 17 圖 18 Graph 18
年份 Year 2016太焦耳Terajoule
3按最終用途及組別劃分
3By End-uses amp Segments
所有商業組別 All Commercial Segments
34 商業類別電力使用按最終用途劃分 Electricity Consumption By End-uses In Commercial Segments
年份 Year 2006
2006 12 136
表 24 Table 24
年份Year
食肆Restaurant
零售Retail
辦公室Office
住宿Accomodation
醫療HumanHealth
教育Education
其他商業Other
Commercial
總計Total
16 213 13 190 - - - 51 779 93 317
0
20 000
40 000
60 000
80 000
100 000
120 000
2006 2007 2008 2009 2010 2011 2012 2013 2014 2015 2016
食肆
Restaurant零售
Retail辦公室
Office住宿
Accomodation醫療
Health教育
Education其他商業
Other Commercial
煮食
Cooking7
空氣調節
Air Conditioning 29
照明
Lighting15
熱水及冷凍
Hot Water amp Refrigeration
8
辦公室設備
Office Equipment6
其他
Others35
煮食
Cooking6
空氣調節
Air Conditioning 33
照明
Lighting17
熱水及冷凍
Hot Water amp Refrigeration
5
辦公室設備
Office Equipment6
其他
Others33
1 527 4 381 12 106lt 單位太焦耳 Unit Terajoule gt lt 單位太焦耳 Unit Terajoule gt
43 44
2016 5 582 4 189 6 535 16 306 2016 3 855 1 645
3按最終用途及組別劃分
3By End-uses amp Segments
食肆組別 Restaurant Segment
34 商業類別電力使用按最終用途劃分 Electricity Consumption By End-uses In Commercial Segments
2013 3 623
697
1 502 4 334 12 043
2014 5 799 4 241 6 701 16 742 2014 3 762 1 565 663 1 459 4 167 11 615
2015 5 754 4 310 6 762 16 826 2015 3 890
2011 -
1 627 689
1 429 4 127 11 386
2012 5 701 4 177 6 565 16 442 2012 3 273 1 384 586 1 282 3 686 10 211
2013 5 583 4 250 6 601 16 435
2009 -
1 550 657
- - -
2010 5 875 4 122 5 715 15 711 2010 - - - - - -
2011 5 625 4 183 6 530 16 339
2007 -
- -
- - -
2008 5 865 4 115 5 706 15 686 2008 - - - - - -
2009 5 968 4 187 5 805 15 960
年份Year
空氣調節Air
Conditioning
照明Lighting
其他 1
Others 1總計Total
年份Year
- -
-
2006 6 793 5 300 4 119 16 213 2006 - - - -
2007 6 689 4 890 5 045 16 624
空氣調節Air
Conditioning
照明Lighting
辦公室設備Office
Equipment
熱水及冷凍4
Hot Water ampRefrigeration4
其他 1
Others 1
13 182
- -
總計Total
- -
- -
零售組別 Retail Segment 住宿組別 Accommodation Segment表 26 Table 26 表 28 Table 28
12 330 2016 7 158 1 862 1 646 2 517
2 479 12 915
2016 4 039 5 402 819 1 595 474lt 單位太焦耳 Unit Terajoule gt lt 單位太焦耳 Unit Terajoule gt
1 773 1 571 2 416 12 791
2015 3 998 5 483 811 1 620 469 12 381 2015 6 983
2014 3 981 5 498 807 1 625 467 12 379 2014 7 031
1 833 1 620
1 809 1 599 2 446 12 663
2013 4 048 5 398 821 1 594 475 12 336 2013 6 701 1 806 1 596 2 441 12 544
2012 3 991 5 401 810 1 595 469 12 265 2012 6 809
1 743 1 543 2 352 12 195
2011 3 870 5 237 785 1 547 454 11 894 2011 6 711 1 784 1 577 2 412 12 484
2010 4 120 6 594 1 001 1 647
11 894
2009 3 724 5 960 905 1 488 913 12 990 2009 6 338 1 684 1 491 2 274 11 788
2008 3 801 6 082 923 1 519
1 829
1 777 2 019
1 010 14 372 2010 6 557
1 700 1 505 2 294
1 802
932 13 257 2008 6 395
2 026 2 1491 241 519 12 136 2006 7 187
3 352 5 525 885 1 275 644 11 681 2007 6 971
辦公室組別 Office Segment表 25 Table 25 表 27 Table 27
年份Year
煮食Cooking
空氣調節Air
Conditioning
照明Lighting
熱水及冷凍4
Hot Water ampRefrigeration4
其他 1
Others 1總計Total
年份Year
空氣調節Air
Conditioning
照明Lighting
辦公室設備Office
Equipment
其他 1
Others 1總計Total
13 190
2007 12 570
2006 3 502 5 863 1 011
3按最終用途及組別劃分
3By End-uses amp Segments
醫療組別 Human Health Segment
34 商業類別電力使用按最終用途劃分 Electricity Consumption By End-uses In Commercial Segments
1 257 303 298 316 1 363 3 537
1 613 681 337 95 472 3 198lt 單位太焦耳 Unit Terajoule gt
45 46
3 158
3 102
-
3 164
- - - -
2012 1 602 671 332 94 465
2011 -
458 3 1442014 1 603 661 327 94
2013 1 563 661 327 92 458
2016
1 606 666 330 94 4622015
2009 - - - - - -
2010 - - - - - -
2008 - - - - - -
2007 -
2006 - - - - - -
- - - - -
5 596 1 486 1 807 28 904 43 223lt 單位太焦耳 Unit Terajoule gt lt 單位太焦耳 Unit Terajoule gt
其他 1
Others 1總計Total
年份Year
空氣調節Air
Conditioning
照明Lighting
辦公室設備Office
Equipment
熱水及冷凍4
Hot Water ampRefrigeration4
1 335 3 489
2016 5 4302016
1 261 297 292 305
教育組別 Education Segment 表 30 Table 30
1 478 1 847 28 140 42 544
2015 2015 5 587 5 571 1 486 1 850 28 388 42 881
2013 5 402 5 486 1 475 1 780 28 218 42 361
2014 1 237 289 285 301 1 301 3 412 2014 5 561
2013 1 178 284 280 295 1 280 3 317
5 518
2 684 3 408 33 957 58 877
2012 1 189 283 279 294 1 275 3 321 2012 5 402 5 516 1 527 1 810 29 492 43 748
2010 10 154 7 586 3 156 3 886 30 835 55 616
2011 - - - - - - 2011 11 225
2010 - - - - - -
7 603
31 079 54 706
2009 - - - - - - 2009 9 860 7 321 3 087 3 676 32 047 55 991
7 207 3 0922008 - - - - - - 2008 9 672
2007 10 348 7 527 2 881 2 863
3 657
30 558 54 1762007 - - - - - -
- - 2006 10 572 7 766 2 573 2 069 28 800 51 779
其他商業組別 Other Commercial Segments表 29 Table 29 表 31 Table 31
年份Year
空氣調節Air
Conditioning
照明Lighting
辦公室設備Office
Equipment
熱水及冷凍4
Hot Water ampRefrigeration4
其他 1
Others 1總計Total
年份Year
空氣調節Air
Conditioning
照明Lighting
辦公室設備Office
Equipment
熱水及冷凍4
Hot Water ampRefrigeration4
其他 1
Others 1總計Total
2006 - - - -
3按最終用途及組別劃分
3By End-uses amp Segments
所有工業組別 All Industrial Segments
35 工業類別所有能源使用按最終用途劃分 All Energy Consumption By End-uses In Industrial Segments
圖 20 Graph 20
年份 Year 2016
年份 Year 2006
所有工業能源最終用途 All Industrial Energy End-uses
695 5 188 2 770 3 344 2 585 14 5832013
5 166 2 659 3 377 2 732 14 7232012 789
494 5 549 3 010 3 395 2 404 14 8532015
5 334 2 967 3 337 2 501 14 7182014 579
47 48
5 080 2 906 3 312 2 292 13 992lt 單位太焦耳 Unit Terajoule gt
2016 402
864 4 938 2 450 3 504 2 976 14 7322011
4 135 2 718 3 888 4 095 16 0532010 1 217
1 373 3 829 2 695 4 036 4 196 16 1292009
4 009 2 804 4 255 4 454 17 3322008 1 809
3 086 3 815 4 788 17 6452007 2 019 3 935
4 209 4 985 18 9342006 2 249 4 629 2 863
圖 19 Graph 19
太焦耳
Terajoule
其他工業 7
OtherIndustries 7
總計Total
年份Year
紡織及服裝製品Textile amp
Wearing Apparel
非製造業 6
Non-manufacturing 6
食品及飲品Food amp
Beverage
金屬及機械Metal amp
Machinery
表 32 Table 32
0
2 000
4 000
6 000
8 000
10 000
12 000
14 000
16 000
18 000
20 000
2006 2007 2008 2009 2010 2011 2012 2013 2014 2015 2016
紡織及服裝製品
Textile ampWearing Apparel
非製造業
Non‐manufacturing
食品及飲品
Food ampBeverage
金屬及機械
Metal ampMachinery
其他工業
OtherIndustries
工業生產設備
Industrial ProcessEquipment
54
照明
Lighting6
空氣調節
Air Conditioning17
其他
Others23
工業生產設備
Industrial ProcessEquipment
53
照明
Lighting7
空氣調節
Air Conditioning22
其他
Others18
3按最終用途及組別劃分
3By End-uses amp Segments
紡織及服裝製品組別 Textile amp Wearing Apparel Segment
35 工業類別所有能源使用按最終用途劃分 All Energy Consumption By End-uses In Industrial Segments
食品及飲品組別 Food amp Beverage Segment表 33 Table 33 表 35 Table 35
年份Year
工業生產設備 5
Industrial ProcessEquipment 5
照明Lighting
空氣調節Air
Conditioning
其他1
Others1總計Total
年份Year
工業生產設備 5
Industrial ProcessEquipment 5
照明Lighting
空氣調節Air
Conditioning
其他1
Others1總計Total
466 455 2 863
2007 880 194 685 260 3 0862 019 2007 1 922 159 509 497
2006 997 210 757 284 2 249 2006 1 797 146
430 425 2 804
2009 637 123 446 167 1 373 2009 1 775 125 399 397 2 695
2008 834 163 592 221 1 809 2008 1 815 134
2010 574 106 391 145 2 718
2011 446 68 256 94 864 2011 1 743 95
1 217 2010 1 793 125 400 399
303 310 2 450
311 318 2 659
2013 367 53 203 74 2 770 695 2013 2 047 97 309 317
2012 416 59 230 83 789 2012 1 934 97
340 344 2 967
2015 262 36 145 51 494 2015 2 218 106 342 345 3 010
2014 303 44 171 61 579 2014 2 177 106
2016 210 31 118 43 2 906lt 單位太焦耳 Unit Terajoule gt lt 單位太焦耳 Unit Terajoule gt
非製造業組別 6 Non-manufacturing Segment6金屬及機械組別 Metal amp Machinery Segment表 34 Table 34 表 36 Table 36
402 2016 2 117 106 337 346
年份Year
工業生產設備 5
Industrial ProcessEquipment 5
照明Lighting
空氣調節Air
Conditioning
其他1
Others1總計Total
年份Year
工業生產設備 5
Industrial ProcessEquipment 5
照明Lighting
空氣調節Air
Conditioning
其他1
Others1總計Total
2006 1 794 114 925 1 376 4 2092006 2 013 588 992 1 035 4 629
2007 1 626 103 837 1 249 3 8152007 1 711 500 850 873 3 935
2008 1 819 105 857 1 475 4 2552008 1 823 488 810 888 4 009
2009 1 729 97 791 1 419 4 0362009 1 764 460 762 843 3 829
2010 1 665 94 761 1 367 3 8882010 1 907 496 819 913 4 135
2011 1 513 65 565 1 360 3 5042011 2 143 509 940 1 346 4 938
2012 1 460 63 544 1 309 3 3772012 2 272 540 985 1 370 5 166
2013 1 452 62 534 1 296 3 3442013 2 246 536 969 1 437 5 188
2014 1 445 62 541 1 290 3 3372014 2 295 547 1 003 1 490 5 334
2015 1 470 63 551 1 312 3 3952015 2 401 571 1 041 1 536 5 549
2016 1 440 61 529 1 282 3 3122016 2 179 522 949 1 430 5 080lt 單位太焦耳 Unit Terajoule gt lt 單位太焦耳 Unit Terajoule gt
49 50
2015 346 4 024 1 349 1 217 2 307 9 242
1 226 1 192 2 476 9 144
3 880 1 344 1 195 2 402 9 2302014 409
14 015
2007 1 682 3 032 2 012 1 882 4 496 13 104
1 232 1 208 2 616 9 356
12 182
1 200 1 255 2 844 9 5302011 619 3 613
2009 1 089 2 799 1 579 1 779 3 896 11 143
2010
2012 553 3 747
2013 489 3 761
951 3 023 1 585 1 714 3 808 11 082
2007 3 295 277 980 236 4 788
1 701 1 926 4 140
1 842 2 080 4 670
2008 1 443 2 971
2006 1 851 3 572
2008 3 051 257 915 231 4 454
35 工業類別所有能源使用按最終用途劃分 All Energy Consumption By End-uses In Industrial Segments
所有工業組別 All Industrial Segments
36 工業類別電力使用按最終用途劃分 Electricity Consumption By End-uses In Industrial Segments
3按最終用途及組別劃分
3By End-uses amp Segments
2006 3 415 290 1 029 251 4 985
圖 21 Graph 21
年份
Year
工業生產設備 5
Industrial ProcessEquipment 5
照明Lighting
空氣調節Air
Conditioning
其他1
Others1總計Total
太焦耳
Terajoule
表 37 Table 37其他工業組別 7 Other Industrial Segments 7
2010 2 800 237 844 213 4 095
2009 2 865 242 863 225 4 196
2012 1 872 166 568 125 2 732
2011 2 030 180 627 140 2 976
2014 1 711 154 520 116 2 501
2013 1 781 158 528 119 2 585
2016 1 568 144 471 110 2 292
2015 1 635 149 502 118 2 404
表 38 Table 38
年份Year
紡織及服裝製品Textile amp
Wearing Apparel
非製造業 6
Non-manufacturing 6
食品及飲品Food amp
Beverage
金屬及機械Metal amp
Machinery
其他工業 7
OtherIndustries 7
總計Total
lt 單位太焦耳 Unit Terajoule gt
2 206 8 709
51 52
lt 單位太焦耳 Unit Terajoule gt
2016 286 3 699 1 339 1 179
0
2 000
4 000
6 000
8 000
10 000
12 000
14 000
16 000
2006 2007 2008 2009 2010 2011 2012 2013 2014 2015 2016
紡織及服裝製品
Textile ampWearing Apparel
非製造業
Non‐manufacturing
食品及飲品
Food ampBeverage
金屬及機械
Metal ampMachinery
其他工業
OtherIndustries
圖 22 Graph 22 紡織及服裝製品組別 Textile amp Wearing Apparel Segment 表 39 Table 39
年份 Year 2016
所有工業能源最終用途 All Industrial Energy End-uses
36 工業類別電力使用按最終用途劃分 Electricity Consumption By End-uses In Industrial Segments
3按最終用途及組別劃分
3By End-uses amp Segments
年份 Year 2006
53
年份Year
工業生產設備 5
Industrial ProcessEquipment 5
照明Lighting
空氣調節Air
Conditioning
其他1
Others1總計Total
2006 604 210 757 279 1 851
2007 547 194 685 255 1 682
1 443
2009 356 123 446 164 1 089
2008 472 163 592 217
951
2011 203 68 256 92 619
2010 312 106 391 142
553
2013 162 53 203 72 489
2012 182 59 230 81
409
2015 114 36 145 50 346
2014 134 44 171 60
286lt 單位太焦耳 Unit Terajoule gt
非製造業組別 6 Non-manufacturing Segment 6 表 40 Table 40
年份Year
工業生產設備 5
Industrial ProcessEquipment 5
照明Lighting
空氣調節Air
Conditioning
其他1
Others1總計Total
2016 94 31 118 42
3 572
2007 893 500 850 788 3 032
2006 1 057 588 992 934
2 971
2009 836 460 762 742 2 799
2008 886 488 810 787
3 023
2011 949 509 940 1 215 3 613
2010 904 496 819 804
3 747
2013 962 536 969 1 295 3 761
2012 993 540 985 1 230
3 880
2015 1 028 571 1 041 1 384 4 024
2014 986 547 1 003 1 345
3 699lt 單位太焦耳 Unit Terajoule gt
54
2016 936 522 949 1 292
工業生產設備
Industrial ProcessEquipment
41 照明
Lighting10
空氣調節
Air Conditioning27
其他
Others22
工業生產設備
Industrial ProcessEquipment
46
照明
Lighting9
空氣調節
Air Conditioning30
其他
Others15
其他工業組別 7 Other Industrial Segments 7表 41 Table 41 表 43 Table 43
年份Year
工業生產設備 5
Industrial ProcessEquipment 5
照明Lighting
空氣調節Air
Conditioning
其他1
Others1總計Total
年份Year
工業生產設備 5
Industrial ProcessEquipment 5
照明Lighting
空氣調節Air
Conditioning
其他1
Others1總計Total
1 029 216 4 670
2007 883 159 509 462 4 4962 012 2007 3 030 277 980 208
2006 808 146 466 423 1 842 2006 3 135 290
915 191 4 140
2009 693 125 399 363 1 579 2009 2 610 242 863 181 3 896
2008 746 134 430 390 1 701 2008 2 777 257
2010 695 125 400 365 3 808
2011 526 95 303 277 1 200 2011 1 904 180
1 585 2010 2 548 237 844 178
627 133 2 844
568 123 2 616
2013 536 97 309 284 2 4761 226 2013 1 674 158 528 116
2012 540 97 311 284 1 232 2012
金屬及機械組別 Metal amp Machinery Segment 表 42 Table 42
1 339 2016 1 484 144 471 108
1 759 166
520 114
2015 592 106 342 309 1 349 2015 1 544 149 502 112
2014
2016 585 106 337 310
1 614 154
2 206lt 單位太焦耳 Unit Terajoule gt lt 單位太焦耳 Unit Terajoule gt
2 402
2 307
590 106 340 308 1 344 2014
2006 810 114 925 231 2 080
年份Year
工業生產設備 5
Industrial ProcessEquipment 5
照明Lighting
空氣調節Air
Conditioning
其他1
Others1總計Total
2008 751 105 857 214 1 926
2007 733 103 837 209 1 882
2010 668 94 761 190 1 714
2009 694 97 791 198 1 779
2012 466 63 544 136 1 208
2011 484 65 565 141 1 255
2014 459 62 541 134 1 195
2013 461 62 534 134 1 192
3按最終用途及組別劃分
3By End-uses amp Segments
食品及飲品組別 Food amp Beverage Segment
36 工業類別電力使用按最終用途劃分 Electricity Consumption By End-uses In Industrial Segments
55 56
lt 單位太焦耳 Unit Terajoule gt
2016 456 61 529 133 1 179
2015 467 63 551 136 1 217
表 45 Table 45
太焦耳Terajoule
年份Year
貨車Goods Vehicle
其他
Others 總計Total
貨運組別 Freight Segments圖 23 Graph 23
3按最終用途及組別劃分
3By End-uses amp Segments
所有運輸組別 All Transport Segments
37 運輸類別所有能源使用按最終用途劃分 All Energy Consumption By End-uses In Transport Segments
32 551 6 601 39 152 0
2007
2006
31 771 6 411 38 182 0
0
2009 28 501 5 424 33 925 0
2008 30 438 5 929 36 367
0
2011 28 010 4 134 32 144 0
2010 28 585 4 744 33 329
0
2013 25 534 3 305 28 839 0
2012 26 941 3 826 30 767
0
2015
0
lt 單位太焦耳 Unit Terajoule gt
2014 25 009 3 264 28 273
24 782 3 269 28 051 0
2016
總計Total
年份Year
貨運Freight
客運Passenger
總計Total
年份Year
巴士Bus
24 721 2 961 27 682
客運組別 Passenger Segments表 44 Table 44 表 46 Table 46
41 57 251 59 96 404
的士Taxi
汽車Car
電單車Motorcycle
鐵路Rail
其他
Others
14 102 17 118 463 2 495 3 973 57 983
4 017 57 251
2007 38 182 40 57 983 60 96 165 2007 19 832
2006 20 301 13 797 16 267 426 2 4442006 39 152
56 718
3 965 58 137
2009 33 925 37 56 718 63 90 643 2009 19 150
2008 18 971 15 142 17 059 480 2 5202008 36 367 38 58 137 62 94 504
37 57 560 63 90 889
13 131 17 449 465 2 523 4 000
13 593 18 879 424 2 609 4 213 58 630
4 124 57 560
2011 32 144 35 58 630 65 90 774 2011 18 911
2010 18 842 13 373 18 247 436 2 5402010 33 329
61 359
4 354 59 656
2013 28 839 32 61 359 68 90 198 2013 19 144
2012 19 128 13 469 19 561 423 2 7222012 30 767 34 59 656 66 90 423
31 61 725 69 89 999
13 319 21 158 406 2 796 4 536
13 039 21 764 448 2 972 4 631 61 195
4 547 61 725
2015 28 051 31 61 195 69 89 245 2015 18 341
2014 18 659 14 133 21 085 426 2 8752014 28 273
57 58
4 636 62 136lt 單位太焦耳 Unit Terajoule gt lt 單位太焦耳 Unit Terajoule gt
此項之最終用途包括船隻及香港內部的航空運輸能源的使用等 End-uses under this heading include marine and internal air transportation energy uses etc
2016 18 918 12 288 22 881 463 2 9512016 27 682 31 62 136 69 89 819
0
10 000
20 000
30 000
40 000
50 000
60 000
70 000
80 000
90 000
100 000
2006 2007 2008 2009 2010 2011 2012 2013 2014 2015 2016
貨運
Freight客運
Passenger
4按燃料及類別劃分
4By Fuels amp Sectors
41 所有能源使用按燃料劃分
All Energy Consumption By Fuels圖 24 Graph 24 圖 25 Graph 25
3按最終用途及組別劃分
3By End-uses amp Segments
所有運輸能源最終用途 All Transport Energy End-uses
37 運輸類別所有能源使用按最終用途劃分 All Energy Consumption By End-uses In Transport Segments
年份 Year 2016 太焦耳Terajoule
表 47 Table 47
年份 Year 2006 年份Year
煤氣及石油氣Town Gas amp
Liquefied Petroleum Gas
油及煤產品Oil amp CoalProducts
電力Electricity
總計Total
2006 48 482 17 87 518 31 145 204 52 281 204 100
2007 48 721 17 86 647 31 147 072 52 282 440 100
52 281 438 100
2009 47 239 17 82 194 29 149 366 54
2008 49 732 18 84 361 30 147 345
278 799 100
2010 49 084 17 81 786 29 150 859 54 281 729 100
2011 49 568 18 81 716 29 151 606 54 282 890 100
54 286 048 100
2013 49 723 17 81 306 29 153 362 54
2012 49 616 17 81 352 28 155 079
284 391 100
2014 50 844 18 80 347 28 158 147 55 289 338 100
2015 48 954 17 80 757 28 158 275 55 287 986 100
59 60
55 289 219 100
lt 單位太焦耳 Unit Terajoule gt
「總熱值」是使用於計算各種氣體燃料的熱含量 Gross caloricfic values are used in calculating the respective heat contents of the gaseous products
2016 49 374 17 81 184 28 158 662
巴士
Bus 21
的士
Taxi14
汽車及電單車
Car amp Motorcycle26
貨車
Goods Vehicle28
鐵路及其他
Rail amp Others12
巴士
Bus 21
的士
Taxi14
汽車及電單車
Car amp Motorcycle17
貨車
Goods Vehicle34
鐵路及其他
Rail amp Others14
0
50 000
100 000
150 000
200 000
250 000
300 000
2006 2007 2008 2009 2010 2011 2012 2013 2014 2015 2016
煤氣及石油氣Town Gas amp Liquefied Petroleum Gas
油及煤產品
Oil amp Coal Products 電力
Electricity
太焦耳Terajoule
太焦耳Terajoule
表 48 Table 48 表 49 Table 49
4按燃料及類別劃分
4By Fuels amp Sectors
43 商業類別按燃料劃分
Commercial Sector By Fuels42 住宅類別按燃料劃分
Residential Sector By Fuels 圖 26 Graph 26 圖 27 Graph 27
煤氣及石油氣Town Gas amp
Liquefied Petroleum Gas
油及煤產品Oil amp CoalProducts
電力Electricity
總計Total
2006 18 476 34 79 0 35 428
年份Year
煤氣及石油氣Town Gas amp
Liquefied Petroleum Gas
油及煤產品Oil amp CoalProducts
電力Electricity
總計Total
年份Year
4 936 4 93 317 83 111 884 10066 53 982 100 2006 13 631 12
83 113 914 10067 54 717 100 2007 13 888 12
2008 18 708 33 41 0 37 100
4 975 4 95 0512007 18 238 33 57 0 36 422
4 739 4 95 543 84 113 753 10066 55 849 100 2008 13 471 12
85 114 297 10068 57 731 100 2009 12 815 11
2010 19 038 33 13 0 39 344
4 753 4 96 7282009 18 736 32 23 0 38 972
4 526 4 97 894 84 116 391 10067 58 396 100 2010 13 971 12
84 118 558 10068 58 826 100 2011 14 161 12
2012 18 736 31 8 0 41 189
4 803 4 99 5942011 18 946 32 8 0 39 872
4 769 4 101 813 84 120 970 10069 59 932 100 2012 14 388 12
84 121 215 10068 58 394 100 2013 14 709 12
2014 18 487 30 8 0 43 415
5 026 4 101 4802013 18 446 32 8 0 39 941
5 156 4 102 627 84 122 711 10070 61 910 100 2014 14 928 12
84 123 674 10070 60 214 100 2015 14 795 12
2016 18 311 30 8 0 43 120
5 186 4 103 6932015 17 838 30 8 0 42 368
5 164 4 103 881 84 123 969 10070 61 439 100 2016 14 924 12lt 單位太焦耳 Unit Terajoule gt lt 單位太焦耳 Unit Terajoule gt
「總熱值」是使用於計算各種氣體燃料的熱含量 Gross caloricfic values are used in calculating the respective heat contents of the gaseous products
「總熱值」是使用於計算各種氣體燃料的熱含量 Gross caloricfic values are used in calculating the respective heat contents of the gaseous products
61 62
0
10 000
20 000
30 000
40 000
50 000
60 000
70 000
2006 2007 2008 2009 2010 2011 2012 2013 2014 2015 2016
煤氣及石油氣Town Gas amp Liquefied Petroleum Gas
油及煤產品
Oil amp Coal Products 電力
Electricity
0
20 000
40 000
60 000
80 000
100 000
120 000
140 000
2006 2007 2008 2009 2010 2011 2012 2013 2014 2015 2016煤氣及石油氣Town Gas amp Liquefied Petroleum Gas
油及煤產品
Oil amp Coal Products 電力
Electricity
太焦耳Terajoule
太焦耳Terajoule
表 50 Table 50 表 51 Table 51
4按燃料及類別劃分
4By Fuels amp Sectors
45 運輸類別按燃料劃分
Transport Sector By Fuels44 工業類別按燃料劃分
Industrial Sector By Fuels 圖 28 Graph 28 圖 29 Graph 29
煤氣及石油氣Town Gas amp
Liquefied Petroleum Gas
油及煤產品Oil amp CoalProducts
電力Electricity
總計Total
2006 926 5 3 994 21 14 015
年份Year
煤氣及石油氣Town Gas amp
Liquefied Petroleum Gas
油及煤產品Oil amp CoalProducts
電力Electricity
總計Total
年份Year
78 510 81 2 444 3 96 404 10074 18 934 100 2006 15 450 16
3 96 165 10074 17 645 100 2007 15 678 16
2008 927 5 4 223 24 12 182
77 992 81 2 4952007 917 5 3 623 21 13 104
75 358 80 2 520 3 94 504 10070 17 332 100 2008 16 627 18
3 90 643 10069 16 129 100 2009 14 765 16
2010 937 6 4 035 25 11 082
73 355 81 2 5232009 923 6 4 063 25 11 143
73 213 81 2 540 3 90 889 10069 16 053 100 2010 15 137 17
3 90 774 10065 14 732 100 2011 15 506 17
2012 1 108 8 4 259 29 9 356
72 659 80 2 6092011 956 6 4 246 29 9 530
72 317 80 2 722 3 90 423 10064 14 723 100 2012 15 384 17
3 90 198 10063 14 583 100 2013 15 348 17
2014 1 244 8 4 244 29 9 230
72 054 80 2 7962013 1 220 8 4 218 29 9 144
70 939 79 2 875 3 89 999 10063 14 718 100 2014 16 185 18
3 89 245 10062 14 853 100 2015 15 048 17
2016 1 171 8 4 112 29 8 709
71 225 80 2 9722015 1 272 9 4 339 29 9 242
71 900 80 2 951 3 89 819 10062 13 992 100 2016 14 967 17lt 單位太焦耳 Unit Terajoule gt lt 單位太焦耳 Unit Terajoule gt
「總熱值」是使用於計算各種氣體燃料的熱含量 Gross caloricfic values are used in calculating the respective heat contents of the gaseous products
「總熱值」是使用於計算各種氣體燃料的熱含量 Gross caloricfic values are used in calculating the respective heat contents of the gaseous products
63 64
0
2 000
4 000
6 000
8 000
10 000
12 000
14 000
16 000
18 000
20 000
2006 2007 2008 2009 2010 2011 2012 2013 2014 2015 2016煤氣及石油氣Town Gas amp Liquefied Petroleum Gas
油及煤產品
Oil amp Coal Products電力
Electricity
0
10 000
20 000
30 000
40 000
50 000
60 000
70 000
80 000
90 000
100 000
2006 2007 2008 2009 2010 2011 2012 2013 2014 2015 2016煤氣及石油氣Town Gas amp Liquefied Petroleum Gas
油及煤產品
Oil amp Coal Products電力
Electricity
47 890 281 204
2007
20 301 13 797 16 267 426
2 506 10 158 49 197 282 440 14 102
46 5022006
19 832
16 465
17 071
5按最終用途及燃料劃分
5By End-uses amp Fuels
51 所有能源使用按最終用途劃分
All Energy Consumption By End-uses
2 454 10 413
15 142 17 059 480
2 529 9 228
7 918 31 836 12 776 32 551 21 608
51 487 278 799 13 131
17 118 463
17 449 465
2008
8 672 52 019 281 729
19 150
2 527 9 680 50 117 281 438
2009
18 971
8 496
9 121
9 244 19 199
2011
18 842 13 373 18 247 436
2 609 8 245 56 161 282 890 13 593 18 879 31 989 14 187 28 010
2012
2013
19 128
2 542
2 722 8 077 58 650 286 048 13 469 19 561 423
424
2010
18 911
19 144
9 213
8 536
8 319
8 199
19 563
19 314
19 662
19 655 44 243 14 181
14 197
13 708
2 796 7 739 58 100 284 391 13 319 21 158 406
2 875 7 705 58 273 289 338
25 534
2015
18 659 14 133 21 085 426
2 972 7 792 58 218 287 986 13 039 21 764 448
2014 25 009
24 782
8 607
8 717
19 609
19 774
48 746
48 466 18 341
2 951 7 474 59 374 289 219
51 所有能源使用按最終用途劃分 All Energy Consumption By End-uses 圖 30 Graph 30
18 918 12 288 22 881 4632016lt 單位太焦耳 Unit Terajoule gt
14 227 24 721 8 562 17 798 47 938 31 785 19 839
年份 Year 2016 年份 Year 2006
65 66
31 989
31 837
31 402
17 734
17 173
17 413
17 117
17 352
17 927
18 177
18 565
14 111 26 941
45 298
43 392
44 117
45 511
44 914
45 861
20 372
18 965
32 885
34 023
33 302
33 379
13 172
13 788
13 824
13 936
31 771
30 438
28 501
28 585
31 772
表 52 Table 52
年份Year
空氣調節Air
Conditioning
工業生產設備5
IndustrialProcessEquipment5
照明Lighting
冷凍Refrigeration
巴士Bus
的士Taxi
汽車Car
電單車Motorcycle
鐵路Rail
船隻Marine
其他1
Others1總計Total
貨車GoodsVehicle
煮食Cooking
熱水Hot Water
空氣調節
AirConditioning
17
煮食
Cooking11
工業生產設備
Industrial ProcessEquipment
6照明
Lighting7
冷凍
Refrigeration3
熱水
Hot Water 5
貨車
GoodsVehicle
9
巴士
Bus 6
的士
Taxi4
汽車及電單車
Car amp Motorcycle8
鐵路
Rail1
船隻
Marine 3
其他
Others20
空氣調節
AirConditioning
17
煮食
Cooking11
工業生產設備
Industrial ProcessEquipment
6照明
Lighting8
冷凍
Refrigeration3
熱水
Hot Water 4貨車
GoodsVehicle12
巴士
Bus 7
的士
Taxi5
汽車及電單車
Car amp Motorcycle6
鐵路
Rail1
船隻
Marine 4
其他
Others17
2006 46 502 21 608 7 918
5按最終用途及燃料劃分
5By End-uses amp Fuels
52 電力使用按最終用途劃分
Electricity Consumption By End-uses 表 53 Table 53
4 191 11 105 2 444 33 317 145 204
年份Year
空氣調節Air Conditioning
照明Lighting
冷凍Refrigeration
熱水Hot Water
辦公室設備Office Equipment
鐵路Rail
工業生產設備5
IndustrialProcessEquipment5
其他1
Others1總計Total
煮食Cooking
2007 45 298 20 372 8 496
5 373 11 246 2 520 35 477 147 345
4 809 11 171 2 495 34 776 147 072
2010 45 511 19 563 9 213
2009 44 117 19 199 9 244
2008 43 392 18 965 9 121
11 0612012 45 861 19 662 8 319
2011 44 914 19 314 8 536 9 201
9 131
10 738
4 715 13 200 2 722 40 408 155 079
4 945 12 615 2 609 38 732 151 606
11 412
11 3312014 48 746 19 609 8 607
2013 44 243 19 655 8 199 9 280
9 415 4 854 13 344 2 875 39 367 158 147
4 904 13 407 2 796 39 466 153 362
2016 47 938 19 839 8 562
2015 48 466 19 774 8 717 11 344 9 553
13 513 2 951 40 363 158 662 11 528 9 044
4 624 13 212 2 972 39 615 158 275
35 815
67 68
150 859
36 644 149 366
9 048
9 722
10 320
9 926
lt 單位太焦耳 Unit Terajoule gt
52 電力使用按最終用途劃分 Electricity Consumption By End-uses 圖 31 Graph 31
年份 Year 2016 年份 Year 2006
4 923
10 016
9 073
9 934
10 929
10 959
11 430 5 015 11 758 2 540
5 274 11 480 2 523
空氣調節Air
Conditioning 30
照明Lighting
13
冷凍Refrigeration
5
工業生產設備Industrial Process
Equipment6
煮食Cooking
7
熱水Hot Water
3辦公室設備
Office Equipment9
鐵路Rail2
其他Others25
空氣調節Air
Conditioning 32
照明Lighting
15
冷凍Refrigeration
5
工業生產設備Industrial Process
Equipment6
煮食Cooking
6
熱水Hot Water
3辦公室設備
Office Equipment8
鐵路Rail2
其他Others23
年份Year
貨車Goods Vehicle
巴士Bus
的士Taxi
5按最終用途及燃料劃分
5By End-uses amp Fuels
53 油及煤產品使用按最終用途劃分
Oil amp Coal Products Consumption By End-uses 表 54 Table 54
汽車Car
電單車Motorcycle
工業生產設備5
Industrial ProcessEquipment5
船隻Marine
其他1
Others1總計Total
87 518
2007 31 770 18 254 2 17 117 463 6 448 10 158 2 434 86 647
2006 32 551 18 647 2 16 266 426 6 508 10 413 2 705
84 361
2009 28 501 17 514 2 17 448 465 6 341 9 228 2 695 82 194
2008 30 438 17 485 2 17 059 480 6 503 9 680 2 713
81 786
2011 28 010 16 997 1 18 879 424 6 926 8 245 2 234 81 716
2010 28 585 17 077 1 18 247 436 6 423 8 672 2 346
81 352
2013 25 534 17 114 1 21 158 406 7 386 7 739 1 969 81 306
2012 26 941 17 212 1 19 560 423 7 074 8 077 2 064
80 347
2015 24 782 16 331 1 21 764 448
7 553 7 474 1 854 81 184
2014 25 009 16 607 1 21 085 426 7 458 7 705 2 056
lt 單位太焦耳 Unit Terajoule gt
53 油及煤產品使用按最終用途劃分
Oil amp Coal Products Consumption By End-uses 圖 32 Graph 32
7 688 7 792 1 953 80 757
2016 24 721 16 239 lt1 22 881 463
年份 Year 2016 年份 Year 2006
69 70
貨車GoodsVehicle31
巴士及的士Bus amp Taxi
20
汽車及電單車Car amp Motorcycle
29
工業生產設備Industrial Process
Equipment9
船隻Marine
9其他
Others2
貨車GoodsVehicle37
巴士及的士Bus amp Taxi
21
汽車及電單車Car amp Motorcycle
19
工業生產設備Industrial Process
Equipment8
船隻Marine
12其他
Others3
年份Year
煮食Cooking
熱水Hot Water
運輸Transport
其他1
Others1總計Total
5按最終用途及燃料劃分
5By End-uses amp Fuels
54 煤氣及石油氣使用按最終用途劃分
Town Gas amp Liquefied Petroleum Gas Consumption By End-uses 表 55 Table 55
2007 22 021 8 363 15 678 2 659 48 721
2006 21 741 8 585 15 450 2 706 48 482
2009 21 390 8 550 14 765 2 534 47 239
2008 22 220 8 415 16 627 2 472 49 732
2011 20 749 9 242 15 506 4 072 49 568
2010 21 244 8 921 15 137 3 782 49 084
2013 20 222 9 277 15 348 4 876 49 723
2012 20 330 9 396 15 384 4 506 49 616
2015 19 767 9 085 15 048 5 054 48 954
2014 20 194 9 342 16 185 5 123 50 844
lt 單位太焦耳 Unit Terajoule gt
54 煤氣及石油氣使用按最終用途劃分 Town Gas amp Liquefied Petroleum Gas Consumption By End-uses 圖 33 Graph 33
年份 Year 2016 年份 Year 2006
2016 19 990 9 304 14 967 5 113 49 374
「總熱值」是使用於計算各種氣體燃料的熱含量 Gross caloricfic values are used in calculating the respective heat contents of the gaseous products
71 72
煮食Cooking
41
熱水Hot Water
19
運輸Transport
30
其他Others10
煮食Cooking
45
熱水Hot Water
18運輸
Transport32
其他Others
5
6 根據已更新的可再生能源數據相關的2010年至2011年能源最終用途數據已在
2013年版中作出修訂[2013年版修訂]The energy end-use data from 2010 to 2011 were revised in the 2013 Edition basedon the latest update of the renewable energy data (Revised in 2013 Edition)
3 根據運輸能源消耗調查所得的數據有關2008年至2012年的能源最終用途數據已
在2015年版中作出修訂[2015年版修訂]The energy end-use data from year 2008 to 2012 were revised in the 2015 Editionbased on the findings of energy consumption survey on the Transport Sector(Revised in 2015 Edition)
4 自2014年版起新的「住宿」「醫療」和「教育」組別已由「其他商業」組別
分拆出來「其他商業」組別因而相應地縮小[2014年版修訂]The Accommodation Human Health and Education Segments weresegregated from the Other Commercial Segment as new segments in the 2014Edition Hence the size of the Other Commercial Segment is accordingly reduced(Revised in 2014 Edition)
5 自2014年版起燃料的熱含量均以「總熱值」計算因而自2002年後的能源數據
均已採用「總熱值」作出計算[2014年版修訂]Since the 2014 Edition Gross Calorific Values are used for calculating the heatcontents of fuels Gross Calorific Values are hence used in computing energy datafrom 2002 onwards (Revised in 2014 Edition)
1 由於資料所限能源數據不能再分拆成其他最終用途數據「其他」的最終用途包
括沒有被列在表上的最終用途
2 自2013年後「空氣調節」「冷凍」「工業生產設備」及「熱水」的能源最終
用途數據已採用「氣溫因素」作出修訂[2017年版修訂]The energy end-use data of Air Conditioning Refrigeration IndustrialProcessEquipment and Hot Water are revised by Temperature Factor fromyear 2013 onwards (Revised in 2017 Edition)
Due to data limitations energy data could not further be broken down into other end-uses The ldquoOthersrdquo end-use includes the end-uses not elsewhere listed in the table
2 「房委會資助出售單位」組別前稱為「居屋計劃」組別
1 根據零售組別能源消耗調查所得的數據有關2011年至2014年的能源最終用途數
據已在2017年版中作出修訂[2017年版修訂]The energy end-use data from year 2011 to 2014 were revised in the 2017 Editionbased on the findings of energy consumption survey on the Retail Segment(Revised in 2017 Edition)
6Notes 7Chronology of Major Revisions7主要修訂年表6註釋
3 「其他房屋」組別包括別墅平房及類似屋宇
The ldquoOther Housingrdquo Segment includes villas bungalows and the like
4 「熱水及冷凍」的最終用途包括鍋爐器材及其他生產加熱和冷凍的設備
The ldquo Non-manufacturing rdquo Segment includes construction and other miscellaneousnon-manufacturing industrial activities
The ldquoHousing Authority Subsidized Sale Flatsrdquo Segment was previously called ldquoHomeOwnershiprdquo Segment
The ldquo Hot Water amp Refrigeration rdquo end-use includes boiling equipments and otherprocess heating and cooling facilities
「工業生產設備」的最終用途包括鍋爐設備及其他生產加熱和冷凍設備的使用
The ldquoOther Industrialrdquo Segment includes electronics paper printing plastic and othermiscellaneous industrial activities
73
The ldquo GDP in chained dollars rdquo were revised based on latest data published by theCensus and Statisics Department
8 ldquo本地生產總值環比物量計算rdquo己根據政府統計處最新數據作出修訂
74
7 「其他工業」組別包括電子紙張印刷塑膠及其他雜項工業活動
The ldquo Industrial ProcessEquipment rdquo end-use includes boiler plants and other processheating and cooling facilities
6 「非製造業」組別包括建造及其他非製造業之雜項工業活動
5
7主要修訂年表
13 自2010年起「電力」包括燃煤天然氣風能及太陽能所產生的電能[2012年版修訂]ldquoElectricityrdquoincludes the electricity generated from coal natural gas wind and solarpower since 2010 (Revised in 2012 Edition)
14 根據工業能源消耗調查所得的數據有關2000年至2010年的能源最終用途數據已
在2012年版中作出修訂[2012年版修訂]The energy end-use data from year 2000 to 2010 were revised in the 2012 Editionbased on the findings of energy consumption survey on the Industrial Sector(Revised in 2012 Edition)
自2013年版起「煮食」之能源最終用途除已包括煮食爐及飯煲外再加上在廚房
普遍用作製造及準備食物的器具例如煮食用水加熱設備電焗爐及微波爐等
自2001年後的「煮食」之能源最終用途數據均作出修訂[2013年版修訂]The ldquo Cooking rdquo energy end-use was revised in the 2013 Edition to include foodmaking and preparation appliances normally found in kitchens in addition to stovesand rice cookers Examples of the appliances are hot water for cooking purposeselectric ovens and microwave ovens etc The ldquoCookingrdquo energy end-use data since2001 were hence updated (Revised in 2013 Edition)
自2011年「商業」及「工業」類別的分類已經根據香港標準行業分類20版作出
修訂這修訂包括將個人服務活動(例如夜總會卡拉OK電腦及通訊設施維
修家居用品維修車輛維修服務藝術表演或創作活動及出版服務)由以往的
「食肆」「其他商業」組別或「工業」類別重置到現時的「零售」組別其同
時涵蓋零售及個人服務活動[2013年版修訂]The ldquoCommercialrdquo and ldquoIndustrialldquo Sectors were re-categorized in 2011 to alignwith the Hong Kong Standard Industrial Classification (HSIC) Version 20Examples of such changes are the relocations of personal service activities (such asnight clubs karaokes computer and communication repair household goodsrepair motor vehicle repair services art performance or creation activities andpublishing services etc) from the previous ldquo Restaurant ldquo Other CommercialSegments or the rdquoIndustrialrdquo Sector to the present ldquoRetailrdquo Segment which nowembraces both retail and personal service activities (Revised in 2013 Edition)
12 自2010年的能源最終用途數據包括可再生能源數據[2012年版修訂]The energy end-use data from 2010 includes renewable energy data(Revised in 2012 Edition)
11
75 76
7Chronology of Major Revisions
8 自2013年版起「空氣調節」之能源最終用途除已包括冷氣設備及暖氣機外再加
上風扇空氣清新或淨化器及抽濕機 自2001年後的「空氣調節」之能源最終用
途數據均作出修訂[2013年版修訂]The ldquoAir Conditioningrdquo energy end-use was revised in the 2013 Edition to includefans air cleanerpurifiers and dehumidifiers in addition to air conditioning unitsand heaters The ldquoAir Conditioningrdquo energy end-use data since 2001 were henceupdated (Revised in 2013 Edition)
9 自2013年版起「辦公室設備」之能源最終用途除已包括電腦及影印機外再加上
視聽器材碎紙機傳真及收銀機自2001年後的「辦公室設備」之能源最終用
途數據均作出修訂[2013年版修訂]The ldquoOffice Equipmentrdquo energy end-use was revised in the 2013 Edition to includeaudio visual equipments shredders fax and cashier machines etc in addition tocomputers and photocopiers The ldquoOffice Equipmentrdquo energy end-use data since2001 were hence updated (Revised in 2013 Edition)
10 根據住宅能源消耗調查所得的數據有關2009年至2011年的能源最終用途數據已
在2013年版中作出修訂[2013年版修訂]The energy end-use data from year 2009 to 2011 were revised in the 2013 Editionbased on the findings of energy consumption survey on the Residential Sector(Revised in 2013 Edition)
15 根據政府統計處公佈的人口及家庭住戶統計修訂數字有關2007至2010年的能源
最終用途數據己在2012年版中作出相應的修訂[2012年版修訂]The energy end-use data from years 2007 to 2010 were revised in the 2012 Editionbased on the revised population and domestic household data published by theCensus and Statistics Department (Revised in 2012 Edition)
7
17 根據政府統計處公佈的家庭住戶統計修訂數字有關2001至2006年的能源最終用
途數據己在2009年版中作出修訂[2009年版修訂]The energy end-use data from years 2001 to 2006 were revised in the 2009 Editionbased on the revised domestic household data published by the Census and StatisticsDepartment (Revised in 2009 Edition)
18 自2006年起「鐵路」之能源最終用途再不包括鐵路車站等建築物使用的電量
[2008年版修訂]The ldquoRailrdquo energy end-use do not include electricity consumption at railway stationsfrom 2006 onwards (Revised in 2008 Edition)
16 根據商業及運輸能源消耗調查所得的數據有關2003年至2007年的能源最終用途
數據已在2010年版中作出修訂[2010年版修訂]The energy end-use data from year 2003 to 2007 were revised in the 2010 Editionbased on the findings of energy consumption survey on the Commercial andTransport Sectors (Revised in 2010 Edition)
7Chronology of Major Revisions 8Units of Measurement7主要修訂年表 8計量單位
1 太焦耳 = 1012 焦耳 1 terajoule (TJ) = 1012 joules
1 千兆焦耳 = 109 焦耳 1 gigajoule (GJ) = 109 joules
1 百萬焦耳 = 106 焦耳 1 megajoule (MJ) = 106 joules
77 78
1 千兆瓦小時 = 36 x 1012 焦耳 1 gigawatt hour (GWh) = 36 x 1012 joules
1 兆瓦小時 = 36 x 109 焦耳 1 megawatt hour (MWh) = 36 x 109 joules
1 千瓦小時 = 36 x 106 焦耳 1 kilowatt hour (kWh) = 36 x 106 joules
網址 httpwwwemsdgovhk電郵 energydataemsdgovhk
79 80
Enquiries about this publication can be directed to
The Energy Efficiency OfficeElectrical amp Mechanical Services Department
7F 3 Kai Shing Street Kowloon Bay Hong Kong
Tel No (852) 2808 3465Fax No (852) 2890 6081
Homepage httpwwwemsdgovhkE-mail energydataemsdgovhk
Set of Hong Kong Energy End-use Data can be downloadedfrom EMSD website
httpswwwemsdgovhkenenergy_efficiencyenergy_end_use_data_and_consumption_indicatorshong_kong_energy_end_use_datadataindexhtml
有關本刊物的查詢請聯絡
機電工程署
香港九龍灣啟成街3號7樓
能源效益事務處 httpswwwemsdgovhktcenergy_efficiencyenergy_end_use_data_and_consumption_indicatorshong_kong_energy_end_use_datadataindexhtml
香港能源最終用途數據收錄之數據可在機電工程署網站下載
電話(852) 2808 3465圖文傳真(852) 2890 6081
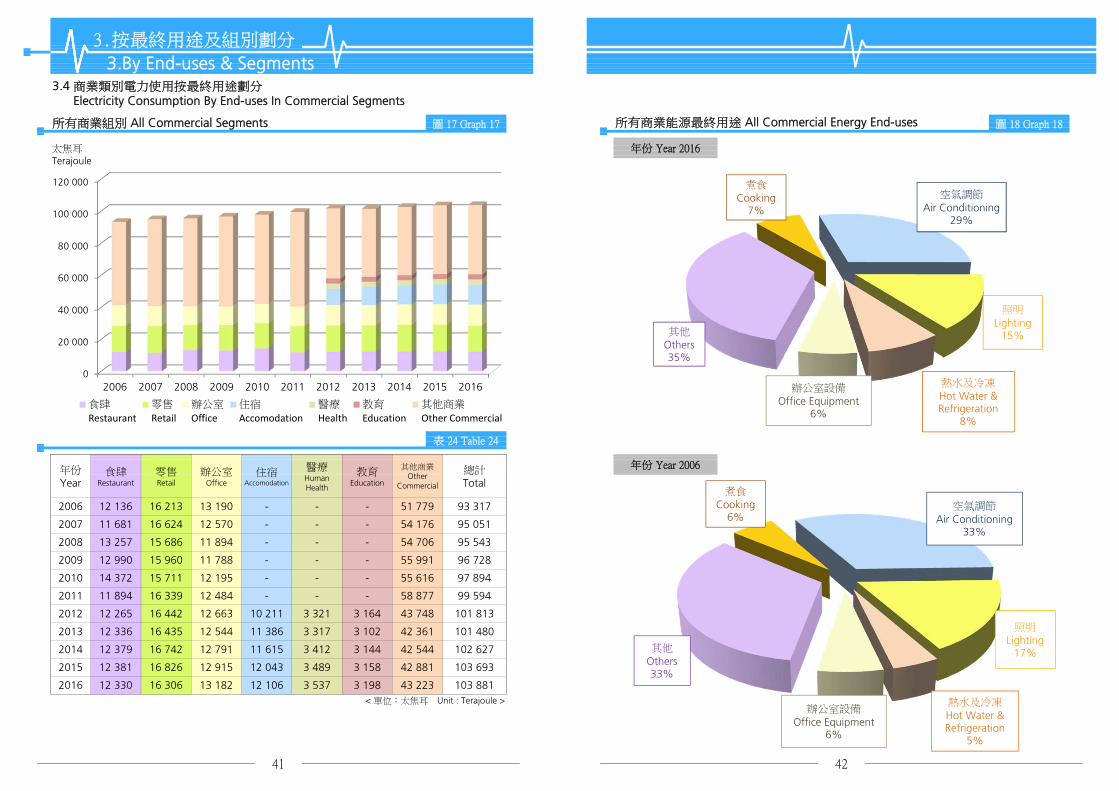
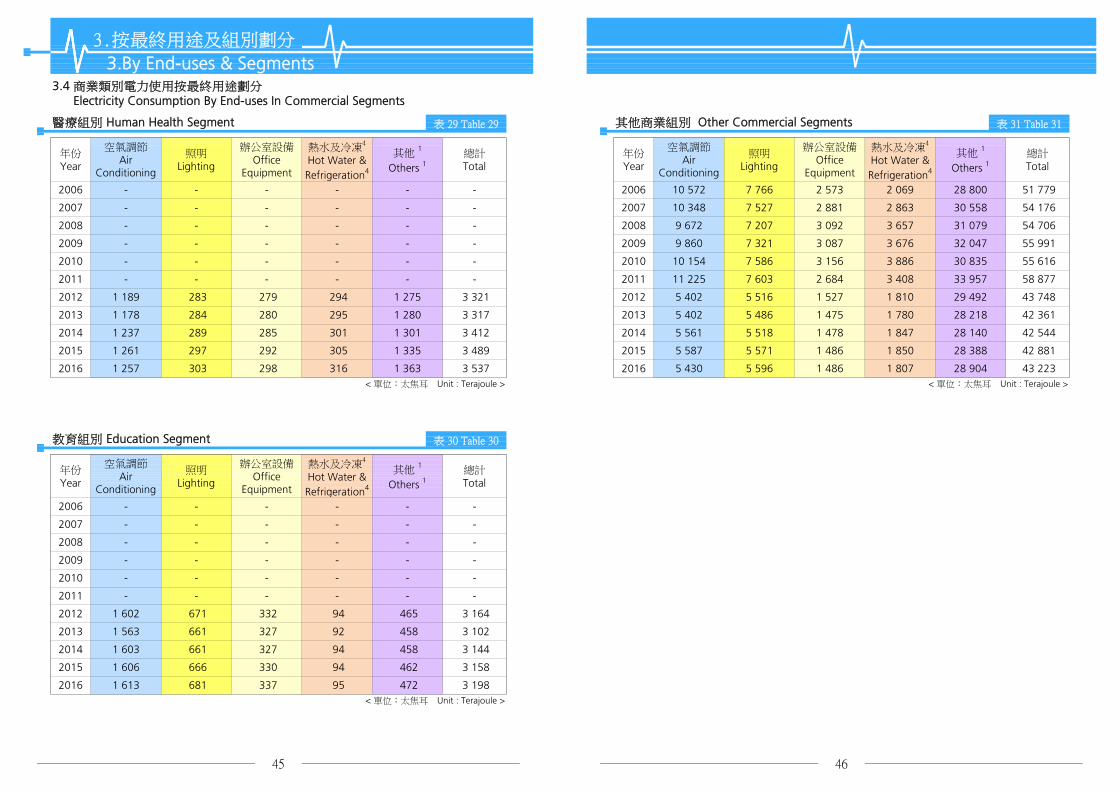
3按最終用途及組別劃分
3By End-uses amp Segments
醫療組別 Human Health Segment
34 商業類別電力使用按最終用途劃分 Electricity Consumption By End-uses In Commercial Segments
1 257 303 298 316 1 363 3 537
1 613 681 337 95 472 3 198lt 單位太焦耳 Unit Terajoule gt
45 46
3 158
3 102
-
3 164
- - - -
2012 1 602 671 332 94 465
2011 -
458 3 1442014 1 603 661 327 94
2013 1 563 661 327 92 458
2016
1 606 666 330 94 4622015
2009 - - - - - -
2010 - - - - - -
2008 - - - - - -
2007 -
2006 - - - - - -
- - - - -
5 596 1 486 1 807 28 904 43 223lt 單位太焦耳 Unit Terajoule gt lt 單位太焦耳 Unit Terajoule gt
其他 1
Others 1總計Total
年份Year
空氣調節Air
Conditioning
照明Lighting
辦公室設備Office
Equipment
熱水及冷凍4
Hot Water ampRefrigeration4
1 335 3 489
2016 5 4302016
1 261 297 292 305
教育組別 Education Segment 表 30 Table 30
1 478 1 847 28 140 42 544
2015 2015 5 587 5 571 1 486 1 850 28 388 42 881
2013 5 402 5 486 1 475 1 780 28 218 42 361
2014 1 237 289 285 301 1 301 3 412 2014 5 561
2013 1 178 284 280 295 1 280 3 317
5 518
2 684 3 408 33 957 58 877
2012 1 189 283 279 294 1 275 3 321 2012 5 402 5 516 1 527 1 810 29 492 43 748
2010 10 154 7 586 3 156 3 886 30 835 55 616
2011 - - - - - - 2011 11 225
2010 - - - - - -
7 603
31 079 54 706
2009 - - - - - - 2009 9 860 7 321 3 087 3 676 32 047 55 991
7 207 3 0922008 - - - - - - 2008 9 672
2007 10 348 7 527 2 881 2 863
3 657
30 558 54 1762007 - - - - - -
- - 2006 10 572 7 766 2 573 2 069 28 800 51 779
其他商業組別 Other Commercial Segments表 29 Table 29 表 31 Table 31
年份Year
空氣調節Air
Conditioning
照明Lighting
辦公室設備Office
Equipment
熱水及冷凍4
Hot Water ampRefrigeration4
其他 1
Others 1總計Total
年份Year
空氣調節Air
Conditioning
照明Lighting
辦公室設備Office
Equipment
熱水及冷凍4
Hot Water ampRefrigeration4
其他 1
Others 1總計Total
2006 - - - -
3按最終用途及組別劃分
3By End-uses amp Segments
所有工業組別 All Industrial Segments
35 工業類別所有能源使用按最終用途劃分 All Energy Consumption By End-uses In Industrial Segments
圖 20 Graph 20
年份 Year 2016
年份 Year 2006
所有工業能源最終用途 All Industrial Energy End-uses
695 5 188 2 770 3 344 2 585 14 5832013
5 166 2 659 3 377 2 732 14 7232012 789
494 5 549 3 010 3 395 2 404 14 8532015
5 334 2 967 3 337 2 501 14 7182014 579
47 48
5 080 2 906 3 312 2 292 13 992lt 單位太焦耳 Unit Terajoule gt
2016 402
864 4 938 2 450 3 504 2 976 14 7322011
4 135 2 718 3 888 4 095 16 0532010 1 217
1 373 3 829 2 695 4 036 4 196 16 1292009
4 009 2 804 4 255 4 454 17 3322008 1 809
3 086 3 815 4 788 17 6452007 2 019 3 935
4 209 4 985 18 9342006 2 249 4 629 2 863
圖 19 Graph 19
太焦耳
Terajoule
其他工業 7
OtherIndustries 7
總計Total
年份Year
紡織及服裝製品Textile amp
Wearing Apparel
非製造業 6
Non-manufacturing 6
食品及飲品Food amp
Beverage
金屬及機械Metal amp
Machinery
表 32 Table 32
0
2 000
4 000
6 000
8 000
10 000
12 000
14 000
16 000
18 000
20 000
2006 2007 2008 2009 2010 2011 2012 2013 2014 2015 2016
紡織及服裝製品
Textile ampWearing Apparel
非製造業
Non‐manufacturing
食品及飲品
Food ampBeverage
金屬及機械
Metal ampMachinery
其他工業
OtherIndustries
工業生產設備
Industrial ProcessEquipment
54
照明
Lighting6
空氣調節
Air Conditioning17
其他
Others23
工業生產設備
Industrial ProcessEquipment
53
照明
Lighting7
空氣調節
Air Conditioning22
其他
Others18
3按最終用途及組別劃分
3By End-uses amp Segments
紡織及服裝製品組別 Textile amp Wearing Apparel Segment
35 工業類別所有能源使用按最終用途劃分 All Energy Consumption By End-uses In Industrial Segments
食品及飲品組別 Food amp Beverage Segment表 33 Table 33 表 35 Table 35
年份Year
工業生產設備 5
Industrial ProcessEquipment 5
照明Lighting
空氣調節Air
Conditioning
其他1
Others1總計Total
年份Year
工業生產設備 5
Industrial ProcessEquipment 5
照明Lighting
空氣調節Air
Conditioning
其他1
Others1總計Total
466 455 2 863
2007 880 194 685 260 3 0862 019 2007 1 922 159 509 497
2006 997 210 757 284 2 249 2006 1 797 146
430 425 2 804
2009 637 123 446 167 1 373 2009 1 775 125 399 397 2 695
2008 834 163 592 221 1 809 2008 1 815 134
2010 574 106 391 145 2 718
2011 446 68 256 94 864 2011 1 743 95
1 217 2010 1 793 125 400 399
303 310 2 450
311 318 2 659
2013 367 53 203 74 2 770 695 2013 2 047 97 309 317
2012 416 59 230 83 789 2012 1 934 97
340 344 2 967
2015 262 36 145 51 494 2015 2 218 106 342 345 3 010
2014 303 44 171 61 579 2014 2 177 106
2016 210 31 118 43 2 906lt 單位太焦耳 Unit Terajoule gt lt 單位太焦耳 Unit Terajoule gt
非製造業組別 6 Non-manufacturing Segment6金屬及機械組別 Metal amp Machinery Segment表 34 Table 34 表 36 Table 36
402 2016 2 117 106 337 346
年份Year
工業生產設備 5
Industrial ProcessEquipment 5
照明Lighting
空氣調節Air
Conditioning
其他1
Others1總計Total
年份Year
工業生產設備 5
Industrial ProcessEquipment 5
照明Lighting
空氣調節Air
Conditioning
其他1
Others1總計Total
2006 1 794 114 925 1 376 4 2092006 2 013 588 992 1 035 4 629
2007 1 626 103 837 1 249 3 8152007 1 711 500 850 873 3 935
2008 1 819 105 857 1 475 4 2552008 1 823 488 810 888 4 009
2009 1 729 97 791 1 419 4 0362009 1 764 460 762 843 3 829
2010 1 665 94 761 1 367 3 8882010 1 907 496 819 913 4 135
2011 1 513 65 565 1 360 3 5042011 2 143 509 940 1 346 4 938
2012 1 460 63 544 1 309 3 3772012 2 272 540 985 1 370 5 166
2013 1 452 62 534 1 296 3 3442013 2 246 536 969 1 437 5 188
2014 1 445 62 541 1 290 3 3372014 2 295 547 1 003 1 490 5 334
2015 1 470 63 551 1 312 3 3952015 2 401 571 1 041 1 536 5 549
2016 1 440 61 529 1 282 3 3122016 2 179 522 949 1 430 5 080lt 單位太焦耳 Unit Terajoule gt lt 單位太焦耳 Unit Terajoule gt
49 50
2015 346 4 024 1 349 1 217 2 307 9 242
1 226 1 192 2 476 9 144
3 880 1 344 1 195 2 402 9 2302014 409
14 015
2007 1 682 3 032 2 012 1 882 4 496 13 104
1 232 1 208 2 616 9 356
12 182
1 200 1 255 2 844 9 5302011 619 3 613
2009 1 089 2 799 1 579 1 779 3 896 11 143
2010
2012 553 3 747
2013 489 3 761
951 3 023 1 585 1 714 3 808 11 082
2007 3 295 277 980 236 4 788
1 701 1 926 4 140
1 842 2 080 4 670
2008 1 443 2 971
2006 1 851 3 572
2008 3 051 257 915 231 4 454
35 工業類別所有能源使用按最終用途劃分 All Energy Consumption By End-uses In Industrial Segments
所有工業組別 All Industrial Segments
36 工業類別電力使用按最終用途劃分 Electricity Consumption By End-uses In Industrial Segments
3按最終用途及組別劃分
3By End-uses amp Segments
2006 3 415 290 1 029 251 4 985
圖 21 Graph 21
年份
Year
工業生產設備 5
Industrial ProcessEquipment 5
照明Lighting
空氣調節Air
Conditioning
其他1
Others1總計Total
太焦耳
Terajoule
表 37 Table 37其他工業組別 7 Other Industrial Segments 7
2010 2 800 237 844 213 4 095
2009 2 865 242 863 225 4 196
2012 1 872 166 568 125 2 732
2011 2 030 180 627 140 2 976
2014 1 711 154 520 116 2 501
2013 1 781 158 528 119 2 585
2016 1 568 144 471 110 2 292
2015 1 635 149 502 118 2 404
表 38 Table 38
年份Year
紡織及服裝製品Textile amp
Wearing Apparel
非製造業 6
Non-manufacturing 6
食品及飲品Food amp
Beverage
金屬及機械Metal amp
Machinery
其他工業 7
OtherIndustries 7
總計Total
lt 單位太焦耳 Unit Terajoule gt
2 206 8 709
51 52
lt 單位太焦耳 Unit Terajoule gt
2016 286 3 699 1 339 1 179
0
2 000
4 000
6 000
8 000
10 000
12 000
14 000
16 000
2006 2007 2008 2009 2010 2011 2012 2013 2014 2015 2016
紡織及服裝製品
Textile ampWearing Apparel
非製造業
Non‐manufacturing
食品及飲品
Food ampBeverage
金屬及機械
Metal ampMachinery
其他工業
OtherIndustries
圖 22 Graph 22 紡織及服裝製品組別 Textile amp Wearing Apparel Segment 表 39 Table 39
年份 Year 2016
所有工業能源最終用途 All Industrial Energy End-uses
36 工業類別電力使用按最終用途劃分 Electricity Consumption By End-uses In Industrial Segments
3按最終用途及組別劃分
3By End-uses amp Segments
年份 Year 2006
53
年份Year
工業生產設備 5
Industrial ProcessEquipment 5
照明Lighting
空氣調節Air
Conditioning
其他1
Others1總計Total
2006 604 210 757 279 1 851
2007 547 194 685 255 1 682
1 443
2009 356 123 446 164 1 089
2008 472 163 592 217
951
2011 203 68 256 92 619
2010 312 106 391 142
553
2013 162 53 203 72 489
2012 182 59 230 81
409
2015 114 36 145 50 346
2014 134 44 171 60
286lt 單位太焦耳 Unit Terajoule gt
非製造業組別 6 Non-manufacturing Segment 6 表 40 Table 40
年份Year
工業生產設備 5
Industrial ProcessEquipment 5
照明Lighting
空氣調節Air
Conditioning
其他1
Others1總計Total
2016 94 31 118 42
3 572
2007 893 500 850 788 3 032
2006 1 057 588 992 934
2 971
2009 836 460 762 742 2 799
2008 886 488 810 787
3 023
2011 949 509 940 1 215 3 613
2010 904 496 819 804
3 747
2013 962 536 969 1 295 3 761
2012 993 540 985 1 230
3 880
2015 1 028 571 1 041 1 384 4 024
2014 986 547 1 003 1 345
3 699lt 單位太焦耳 Unit Terajoule gt
54
2016 936 522 949 1 292
工業生產設備
Industrial ProcessEquipment
41 照明
Lighting10
空氣調節
Air Conditioning27
其他
Others22
工業生產設備
Industrial ProcessEquipment
46
照明
Lighting9
空氣調節
Air Conditioning30
其他
Others15
其他工業組別 7 Other Industrial Segments 7表 41 Table 41 表 43 Table 43
年份Year
工業生產設備 5
Industrial ProcessEquipment 5
照明Lighting
空氣調節Air
Conditioning
其他1
Others1總計Total
年份Year
工業生產設備 5
Industrial ProcessEquipment 5
照明Lighting
空氣調節Air
Conditioning
其他1
Others1總計Total
1 029 216 4 670
2007 883 159 509 462 4 4962 012 2007 3 030 277 980 208
2006 808 146 466 423 1 842 2006 3 135 290
915 191 4 140
2009 693 125 399 363 1 579 2009 2 610 242 863 181 3 896
2008 746 134 430 390 1 701 2008 2 777 257
2010 695 125 400 365 3 808
2011 526 95 303 277 1 200 2011 1 904 180
1 585 2010 2 548 237 844 178
627 133 2 844
568 123 2 616
2013 536 97 309 284 2 4761 226 2013 1 674 158 528 116
2012 540 97 311 284 1 232 2012
金屬及機械組別 Metal amp Machinery Segment 表 42 Table 42
1 339 2016 1 484 144 471 108
1 759 166
520 114
2015 592 106 342 309 1 349 2015 1 544 149 502 112
2014
2016 585 106 337 310
1 614 154
2 206lt 單位太焦耳 Unit Terajoule gt lt 單位太焦耳 Unit Terajoule gt
2 402
2 307
590 106 340 308 1 344 2014
2006 810 114 925 231 2 080
年份Year
工業生產設備 5
Industrial ProcessEquipment 5
照明Lighting
空氣調節Air
Conditioning
其他1
Others1總計Total
2008 751 105 857 214 1 926
2007 733 103 837 209 1 882
2010 668 94 761 190 1 714
2009 694 97 791 198 1 779
2012 466 63 544 136 1 208
2011 484 65 565 141 1 255
2014 459 62 541 134 1 195
2013 461 62 534 134 1 192
3按最終用途及組別劃分
3By End-uses amp Segments
食品及飲品組別 Food amp Beverage Segment
36 工業類別電力使用按最終用途劃分 Electricity Consumption By End-uses In Industrial Segments
55 56
lt 單位太焦耳 Unit Terajoule gt
2016 456 61 529 133 1 179
2015 467 63 551 136 1 217
表 45 Table 45
太焦耳Terajoule
年份Year
貨車Goods Vehicle
其他
Others 總計Total
貨運組別 Freight Segments圖 23 Graph 23
3按最終用途及組別劃分
3By End-uses amp Segments
所有運輸組別 All Transport Segments
37 運輸類別所有能源使用按最終用途劃分 All Energy Consumption By End-uses In Transport Segments
32 551 6 601 39 152 0
2007
2006
31 771 6 411 38 182 0
0
2009 28 501 5 424 33 925 0
2008 30 438 5 929 36 367
0
2011 28 010 4 134 32 144 0
2010 28 585 4 744 33 329
0
2013 25 534 3 305 28 839 0
2012 26 941 3 826 30 767
0
2015
0
lt 單位太焦耳 Unit Terajoule gt
2014 25 009 3 264 28 273
24 782 3 269 28 051 0
2016
總計Total
年份Year
貨運Freight
客運Passenger
總計Total
年份Year
巴士Bus
24 721 2 961 27 682
客運組別 Passenger Segments表 44 Table 44 表 46 Table 46
41 57 251 59 96 404
的士Taxi
汽車Car
電單車Motorcycle
鐵路Rail
其他
Others
14 102 17 118 463 2 495 3 973 57 983
4 017 57 251
2007 38 182 40 57 983 60 96 165 2007 19 832
2006 20 301 13 797 16 267 426 2 4442006 39 152
56 718
3 965 58 137
2009 33 925 37 56 718 63 90 643 2009 19 150
2008 18 971 15 142 17 059 480 2 5202008 36 367 38 58 137 62 94 504
37 57 560 63 90 889
13 131 17 449 465 2 523 4 000
13 593 18 879 424 2 609 4 213 58 630
4 124 57 560
2011 32 144 35 58 630 65 90 774 2011 18 911
2010 18 842 13 373 18 247 436 2 5402010 33 329
61 359
4 354 59 656
2013 28 839 32 61 359 68 90 198 2013 19 144
2012 19 128 13 469 19 561 423 2 7222012 30 767 34 59 656 66 90 423
31 61 725 69 89 999
13 319 21 158 406 2 796 4 536
13 039 21 764 448 2 972 4 631 61 195
4 547 61 725
2015 28 051 31 61 195 69 89 245 2015 18 341
2014 18 659 14 133 21 085 426 2 8752014 28 273
57 58
4 636 62 136lt 單位太焦耳 Unit Terajoule gt lt 單位太焦耳 Unit Terajoule gt
此項之最終用途包括船隻及香港內部的航空運輸能源的使用等 End-uses under this heading include marine and internal air transportation energy uses etc
2016 18 918 12 288 22 881 463 2 9512016 27 682 31 62 136 69 89 819
0
10 000
20 000
30 000
40 000
50 000
60 000
70 000
80 000
90 000
100 000
2006 2007 2008 2009 2010 2011 2012 2013 2014 2015 2016
貨運
Freight客運
Passenger
4按燃料及類別劃分
4By Fuels amp Sectors
41 所有能源使用按燃料劃分
All Energy Consumption By Fuels圖 24 Graph 24 圖 25 Graph 25
3按最終用途及組別劃分
3By End-uses amp Segments
所有運輸能源最終用途 All Transport Energy End-uses
37 運輸類別所有能源使用按最終用途劃分 All Energy Consumption By End-uses In Transport Segments
年份 Year 2016 太焦耳Terajoule
表 47 Table 47
年份 Year 2006 年份Year
煤氣及石油氣Town Gas amp
Liquefied Petroleum Gas
油及煤產品Oil amp CoalProducts
電力Electricity
總計Total
2006 48 482 17 87 518 31 145 204 52 281 204 100
2007 48 721 17 86 647 31 147 072 52 282 440 100
52 281 438 100
2009 47 239 17 82 194 29 149 366 54
2008 49 732 18 84 361 30 147 345
278 799 100
2010 49 084 17 81 786 29 150 859 54 281 729 100
2011 49 568 18 81 716 29 151 606 54 282 890 100
54 286 048 100
2013 49 723 17 81 306 29 153 362 54
2012 49 616 17 81 352 28 155 079
284 391 100
2014 50 844 18 80 347 28 158 147 55 289 338 100
2015 48 954 17 80 757 28 158 275 55 287 986 100
59 60
55 289 219 100
lt 單位太焦耳 Unit Terajoule gt
「總熱值」是使用於計算各種氣體燃料的熱含量 Gross caloricfic values are used in calculating the respective heat contents of the gaseous products
2016 49 374 17 81 184 28 158 662
巴士
Bus 21
的士
Taxi14
汽車及電單車
Car amp Motorcycle26
貨車
Goods Vehicle28
鐵路及其他
Rail amp Others12
巴士
Bus 21
的士
Taxi14
汽車及電單車
Car amp Motorcycle17
貨車
Goods Vehicle34
鐵路及其他
Rail amp Others14
0
50 000
100 000
150 000
200 000
250 000
300 000
2006 2007 2008 2009 2010 2011 2012 2013 2014 2015 2016
煤氣及石油氣Town Gas amp Liquefied Petroleum Gas
油及煤產品
Oil amp Coal Products 電力
Electricity
太焦耳Terajoule
太焦耳Terajoule
表 48 Table 48 表 49 Table 49
4按燃料及類別劃分
4By Fuels amp Sectors
43 商業類別按燃料劃分
Commercial Sector By Fuels42 住宅類別按燃料劃分
Residential Sector By Fuels 圖 26 Graph 26 圖 27 Graph 27
煤氣及石油氣Town Gas amp
Liquefied Petroleum Gas
油及煤產品Oil amp CoalProducts
電力Electricity
總計Total
2006 18 476 34 79 0 35 428
年份Year
煤氣及石油氣Town Gas amp
Liquefied Petroleum Gas
油及煤產品Oil amp CoalProducts
電力Electricity
總計Total
年份Year
4 936 4 93 317 83 111 884 10066 53 982 100 2006 13 631 12
83 113 914 10067 54 717 100 2007 13 888 12
2008 18 708 33 41 0 37 100
4 975 4 95 0512007 18 238 33 57 0 36 422
4 739 4 95 543 84 113 753 10066 55 849 100 2008 13 471 12
85 114 297 10068 57 731 100 2009 12 815 11
2010 19 038 33 13 0 39 344
4 753 4 96 7282009 18 736 32 23 0 38 972
4 526 4 97 894 84 116 391 10067 58 396 100 2010 13 971 12
84 118 558 10068 58 826 100 2011 14 161 12
2012 18 736 31 8 0 41 189
4 803 4 99 5942011 18 946 32 8 0 39 872
4 769 4 101 813 84 120 970 10069 59 932 100 2012 14 388 12
84 121 215 10068 58 394 100 2013 14 709 12
2014 18 487 30 8 0 43 415
5 026 4 101 4802013 18 446 32 8 0 39 941
5 156 4 102 627 84 122 711 10070 61 910 100 2014 14 928 12
84 123 674 10070 60 214 100 2015 14 795 12
2016 18 311 30 8 0 43 120
5 186 4 103 6932015 17 838 30 8 0 42 368
5 164 4 103 881 84 123 969 10070 61 439 100 2016 14 924 12lt 單位太焦耳 Unit Terajoule gt lt 單位太焦耳 Unit Terajoule gt
「總熱值」是使用於計算各種氣體燃料的熱含量 Gross caloricfic values are used in calculating the respective heat contents of the gaseous products
「總熱值」是使用於計算各種氣體燃料的熱含量 Gross caloricfic values are used in calculating the respective heat contents of the gaseous products
61 62
0
10 000
20 000
30 000
40 000
50 000
60 000
70 000
2006 2007 2008 2009 2010 2011 2012 2013 2014 2015 2016
煤氣及石油氣Town Gas amp Liquefied Petroleum Gas
油及煤產品
Oil amp Coal Products 電力
Electricity
0
20 000
40 000
60 000
80 000
100 000
120 000
140 000
2006 2007 2008 2009 2010 2011 2012 2013 2014 2015 2016煤氣及石油氣Town Gas amp Liquefied Petroleum Gas
油及煤產品
Oil amp Coal Products 電力
Electricity
太焦耳Terajoule
太焦耳Terajoule
表 50 Table 50 表 51 Table 51
4按燃料及類別劃分
4By Fuels amp Sectors
45 運輸類別按燃料劃分
Transport Sector By Fuels44 工業類別按燃料劃分
Industrial Sector By Fuels 圖 28 Graph 28 圖 29 Graph 29
煤氣及石油氣Town Gas amp
Liquefied Petroleum Gas
油及煤產品Oil amp CoalProducts
電力Electricity
總計Total
2006 926 5 3 994 21 14 015
年份Year
煤氣及石油氣Town Gas amp
Liquefied Petroleum Gas
油及煤產品Oil amp CoalProducts
電力Electricity
總計Total
年份Year
78 510 81 2 444 3 96 404 10074 18 934 100 2006 15 450 16
3 96 165 10074 17 645 100 2007 15 678 16
2008 927 5 4 223 24 12 182
77 992 81 2 4952007 917 5 3 623 21 13 104
75 358 80 2 520 3 94 504 10070 17 332 100 2008 16 627 18
3 90 643 10069 16 129 100 2009 14 765 16
2010 937 6 4 035 25 11 082
73 355 81 2 5232009 923 6 4 063 25 11 143
73 213 81 2 540 3 90 889 10069 16 053 100 2010 15 137 17
3 90 774 10065 14 732 100 2011 15 506 17
2012 1 108 8 4 259 29 9 356
72 659 80 2 6092011 956 6 4 246 29 9 530
72 317 80 2 722 3 90 423 10064 14 723 100 2012 15 384 17
3 90 198 10063 14 583 100 2013 15 348 17
2014 1 244 8 4 244 29 9 230
72 054 80 2 7962013 1 220 8 4 218 29 9 144
70 939 79 2 875 3 89 999 10063 14 718 100 2014 16 185 18
3 89 245 10062 14 853 100 2015 15 048 17
2016 1 171 8 4 112 29 8 709
71 225 80 2 9722015 1 272 9 4 339 29 9 242
71 900 80 2 951 3 89 819 10062 13 992 100 2016 14 967 17lt 單位太焦耳 Unit Terajoule gt lt 單位太焦耳 Unit Terajoule gt
「總熱值」是使用於計算各種氣體燃料的熱含量 Gross caloricfic values are used in calculating the respective heat contents of the gaseous products
「總熱值」是使用於計算各種氣體燃料的熱含量 Gross caloricfic values are used in calculating the respective heat contents of the gaseous products
63 64
0
2 000
4 000
6 000
8 000
10 000
12 000
14 000
16 000
18 000
20 000
2006 2007 2008 2009 2010 2011 2012 2013 2014 2015 2016煤氣及石油氣Town Gas amp Liquefied Petroleum Gas
油及煤產品
Oil amp Coal Products電力
Electricity
0
10 000
20 000
30 000
40 000
50 000
60 000
70 000
80 000
90 000
100 000
2006 2007 2008 2009 2010 2011 2012 2013 2014 2015 2016煤氣及石油氣Town Gas amp Liquefied Petroleum Gas
油及煤產品
Oil amp Coal Products電力
Electricity
47 890 281 204
2007
20 301 13 797 16 267 426
2 506 10 158 49 197 282 440 14 102
46 5022006
19 832
16 465
17 071
5按最終用途及燃料劃分
5By End-uses amp Fuels
51 所有能源使用按最終用途劃分
All Energy Consumption By End-uses
2 454 10 413
15 142 17 059 480
2 529 9 228
7 918 31 836 12 776 32 551 21 608
51 487 278 799 13 131
17 118 463
17 449 465
2008
8 672 52 019 281 729
19 150
2 527 9 680 50 117 281 438
2009
18 971
8 496
9 121
9 244 19 199
2011
18 842 13 373 18 247 436
2 609 8 245 56 161 282 890 13 593 18 879 31 989 14 187 28 010
2012
2013
19 128
2 542
2 722 8 077 58 650 286 048 13 469 19 561 423
424
2010
18 911
19 144
9 213
8 536
8 319
8 199
19 563
19 314
19 662
19 655 44 243 14 181
14 197
13 708
2 796 7 739 58 100 284 391 13 319 21 158 406
2 875 7 705 58 273 289 338
25 534
2015
18 659 14 133 21 085 426
2 972 7 792 58 218 287 986 13 039 21 764 448
2014 25 009
24 782
8 607
8 717
19 609
19 774
48 746
48 466 18 341
2 951 7 474 59 374 289 219
51 所有能源使用按最終用途劃分 All Energy Consumption By End-uses 圖 30 Graph 30
18 918 12 288 22 881 4632016lt 單位太焦耳 Unit Terajoule gt
14 227 24 721 8 562 17 798 47 938 31 785 19 839
年份 Year 2016 年份 Year 2006
65 66
31 989
31 837
31 402
17 734
17 173
17 413
17 117
17 352
17 927
18 177
18 565
14 111 26 941
45 298
43 392
44 117
45 511
44 914
45 861
20 372
18 965
32 885
34 023
33 302
33 379
13 172
13 788
13 824
13 936
31 771
30 438
28 501
28 585
31 772
表 52 Table 52
年份Year
空氣調節Air
Conditioning
工業生產設備5
IndustrialProcessEquipment5
照明Lighting
冷凍Refrigeration
巴士Bus
的士Taxi
汽車Car
電單車Motorcycle
鐵路Rail
船隻Marine
其他1
Others1總計Total
貨車GoodsVehicle
煮食Cooking
熱水Hot Water
空氣調節
AirConditioning
17
煮食
Cooking11
工業生產設備
Industrial ProcessEquipment
6照明
Lighting7
冷凍
Refrigeration3
熱水
Hot Water 5
貨車
GoodsVehicle
9
巴士
Bus 6
的士
Taxi4
汽車及電單車
Car amp Motorcycle8
鐵路
Rail1
船隻
Marine 3
其他
Others20
空氣調節
AirConditioning
17
煮食
Cooking11
工業生產設備
Industrial ProcessEquipment
6照明
Lighting8
冷凍
Refrigeration3
熱水
Hot Water 4貨車
GoodsVehicle12
巴士
Bus 7
的士
Taxi5
汽車及電單車
Car amp Motorcycle6
鐵路
Rail1
船隻
Marine 4
其他
Others17
2006 46 502 21 608 7 918
5按最終用途及燃料劃分
5By End-uses amp Fuels
52 電力使用按最終用途劃分
Electricity Consumption By End-uses 表 53 Table 53
4 191 11 105 2 444 33 317 145 204
年份Year
空氣調節Air Conditioning
照明Lighting
冷凍Refrigeration
熱水Hot Water
辦公室設備Office Equipment
鐵路Rail
工業生產設備5
IndustrialProcessEquipment5
其他1
Others1總計Total
煮食Cooking
2007 45 298 20 372 8 496
5 373 11 246 2 520 35 477 147 345
4 809 11 171 2 495 34 776 147 072
2010 45 511 19 563 9 213
2009 44 117 19 199 9 244
2008 43 392 18 965 9 121
11 0612012 45 861 19 662 8 319
2011 44 914 19 314 8 536 9 201
9 131
10 738
4 715 13 200 2 722 40 408 155 079
4 945 12 615 2 609 38 732 151 606
11 412
11 3312014 48 746 19 609 8 607
2013 44 243 19 655 8 199 9 280
9 415 4 854 13 344 2 875 39 367 158 147
4 904 13 407 2 796 39 466 153 362
2016 47 938 19 839 8 562
2015 48 466 19 774 8 717 11 344 9 553
13 513 2 951 40 363 158 662 11 528 9 044
4 624 13 212 2 972 39 615 158 275
35 815
67 68
150 859
36 644 149 366
9 048
9 722
10 320
9 926
lt 單位太焦耳 Unit Terajoule gt
52 電力使用按最終用途劃分 Electricity Consumption By End-uses 圖 31 Graph 31
年份 Year 2016 年份 Year 2006
4 923
10 016
9 073
9 934
10 929
10 959
11 430 5 015 11 758 2 540
5 274 11 480 2 523
空氣調節Air
Conditioning 30
照明Lighting
13
冷凍Refrigeration
5
工業生產設備Industrial Process
Equipment6
煮食Cooking
7
熱水Hot Water
3辦公室設備
Office Equipment9
鐵路Rail2
其他Others25
空氣調節Air
Conditioning 32
照明Lighting
15
冷凍Refrigeration
5
工業生產設備Industrial Process
Equipment6
煮食Cooking
6
熱水Hot Water
3辦公室設備
Office Equipment8
鐵路Rail2
其他Others23
年份Year
貨車Goods Vehicle
巴士Bus
的士Taxi
5按最終用途及燃料劃分
5By End-uses amp Fuels
53 油及煤產品使用按最終用途劃分
Oil amp Coal Products Consumption By End-uses 表 54 Table 54
汽車Car
電單車Motorcycle
工業生產設備5
Industrial ProcessEquipment5
船隻Marine
其他1
Others1總計Total
87 518
2007 31 770 18 254 2 17 117 463 6 448 10 158 2 434 86 647
2006 32 551 18 647 2 16 266 426 6 508 10 413 2 705
84 361
2009 28 501 17 514 2 17 448 465 6 341 9 228 2 695 82 194
2008 30 438 17 485 2 17 059 480 6 503 9 680 2 713
81 786
2011 28 010 16 997 1 18 879 424 6 926 8 245 2 234 81 716
2010 28 585 17 077 1 18 247 436 6 423 8 672 2 346
81 352
2013 25 534 17 114 1 21 158 406 7 386 7 739 1 969 81 306
2012 26 941 17 212 1 19 560 423 7 074 8 077 2 064
80 347
2015 24 782 16 331 1 21 764 448
7 553 7 474 1 854 81 184
2014 25 009 16 607 1 21 085 426 7 458 7 705 2 056
lt 單位太焦耳 Unit Terajoule gt
53 油及煤產品使用按最終用途劃分
Oil amp Coal Products Consumption By End-uses 圖 32 Graph 32
7 688 7 792 1 953 80 757
2016 24 721 16 239 lt1 22 881 463
年份 Year 2016 年份 Year 2006
69 70
貨車GoodsVehicle31
巴士及的士Bus amp Taxi
20
汽車及電單車Car amp Motorcycle
29
工業生產設備Industrial Process
Equipment9
船隻Marine
9其他
Others2
貨車GoodsVehicle37
巴士及的士Bus amp Taxi
21
汽車及電單車Car amp Motorcycle
19
工業生產設備Industrial Process
Equipment8
船隻Marine
12其他
Others3
年份Year
煮食Cooking
熱水Hot Water
運輸Transport
其他1
Others1總計Total
5按最終用途及燃料劃分
5By End-uses amp Fuels
54 煤氣及石油氣使用按最終用途劃分
Town Gas amp Liquefied Petroleum Gas Consumption By End-uses 表 55 Table 55
2007 22 021 8 363 15 678 2 659 48 721
2006 21 741 8 585 15 450 2 706 48 482
2009 21 390 8 550 14 765 2 534 47 239
2008 22 220 8 415 16 627 2 472 49 732
2011 20 749 9 242 15 506 4 072 49 568
2010 21 244 8 921 15 137 3 782 49 084
2013 20 222 9 277 15 348 4 876 49 723
2012 20 330 9 396 15 384 4 506 49 616
2015 19 767 9 085 15 048 5 054 48 954
2014 20 194 9 342 16 185 5 123 50 844
lt 單位太焦耳 Unit Terajoule gt
54 煤氣及石油氣使用按最終用途劃分 Town Gas amp Liquefied Petroleum Gas Consumption By End-uses 圖 33 Graph 33
年份 Year 2016 年份 Year 2006
2016 19 990 9 304 14 967 5 113 49 374
「總熱值」是使用於計算各種氣體燃料的熱含量 Gross caloricfic values are used in calculating the respective heat contents of the gaseous products
71 72
煮食Cooking
41
熱水Hot Water
19
運輸Transport
30
其他Others10
煮食Cooking
45
熱水Hot Water
18運輸
Transport32
其他Others
5
6 根據已更新的可再生能源數據相關的2010年至2011年能源最終用途數據已在
2013年版中作出修訂[2013年版修訂]The energy end-use data from 2010 to 2011 were revised in the 2013 Edition basedon the latest update of the renewable energy data (Revised in 2013 Edition)
3 根據運輸能源消耗調查所得的數據有關2008年至2012年的能源最終用途數據已
在2015年版中作出修訂[2015年版修訂]The energy end-use data from year 2008 to 2012 were revised in the 2015 Editionbased on the findings of energy consumption survey on the Transport Sector(Revised in 2015 Edition)
4 自2014年版起新的「住宿」「醫療」和「教育」組別已由「其他商業」組別
分拆出來「其他商業」組別因而相應地縮小[2014年版修訂]The Accommodation Human Health and Education Segments weresegregated from the Other Commercial Segment as new segments in the 2014Edition Hence the size of the Other Commercial Segment is accordingly reduced(Revised in 2014 Edition)
5 自2014年版起燃料的熱含量均以「總熱值」計算因而自2002年後的能源數據
均已採用「總熱值」作出計算[2014年版修訂]Since the 2014 Edition Gross Calorific Values are used for calculating the heatcontents of fuels Gross Calorific Values are hence used in computing energy datafrom 2002 onwards (Revised in 2014 Edition)
1 由於資料所限能源數據不能再分拆成其他最終用途數據「其他」的最終用途包
括沒有被列在表上的最終用途
2 自2013年後「空氣調節」「冷凍」「工業生產設備」及「熱水」的能源最終
用途數據已採用「氣溫因素」作出修訂[2017年版修訂]The energy end-use data of Air Conditioning Refrigeration IndustrialProcessEquipment and Hot Water are revised by Temperature Factor fromyear 2013 onwards (Revised in 2017 Edition)
Due to data limitations energy data could not further be broken down into other end-uses The ldquoOthersrdquo end-use includes the end-uses not elsewhere listed in the table
2 「房委會資助出售單位」組別前稱為「居屋計劃」組別
1 根據零售組別能源消耗調查所得的數據有關2011年至2014年的能源最終用途數
據已在2017年版中作出修訂[2017年版修訂]The energy end-use data from year 2011 to 2014 were revised in the 2017 Editionbased on the findings of energy consumption survey on the Retail Segment(Revised in 2017 Edition)
6Notes 7Chronology of Major Revisions7主要修訂年表6註釋
3 「其他房屋」組別包括別墅平房及類似屋宇
The ldquoOther Housingrdquo Segment includes villas bungalows and the like
4 「熱水及冷凍」的最終用途包括鍋爐器材及其他生產加熱和冷凍的設備
The ldquo Non-manufacturing rdquo Segment includes construction and other miscellaneousnon-manufacturing industrial activities
The ldquoHousing Authority Subsidized Sale Flatsrdquo Segment was previously called ldquoHomeOwnershiprdquo Segment
The ldquo Hot Water amp Refrigeration rdquo end-use includes boiling equipments and otherprocess heating and cooling facilities
「工業生產設備」的最終用途包括鍋爐設備及其他生產加熱和冷凍設備的使用
The ldquoOther Industrialrdquo Segment includes electronics paper printing plastic and othermiscellaneous industrial activities
73
The ldquo GDP in chained dollars rdquo were revised based on latest data published by theCensus and Statisics Department
8 ldquo本地生產總值環比物量計算rdquo己根據政府統計處最新數據作出修訂
74
7 「其他工業」組別包括電子紙張印刷塑膠及其他雜項工業活動
The ldquo Industrial ProcessEquipment rdquo end-use includes boiler plants and other processheating and cooling facilities
6 「非製造業」組別包括建造及其他非製造業之雜項工業活動
5
7主要修訂年表
13 自2010年起「電力」包括燃煤天然氣風能及太陽能所產生的電能[2012年版修訂]ldquoElectricityrdquoincludes the electricity generated from coal natural gas wind and solarpower since 2010 (Revised in 2012 Edition)
14 根據工業能源消耗調查所得的數據有關2000年至2010年的能源最終用途數據已
在2012年版中作出修訂[2012年版修訂]The energy end-use data from year 2000 to 2010 were revised in the 2012 Editionbased on the findings of energy consumption survey on the Industrial Sector(Revised in 2012 Edition)
自2013年版起「煮食」之能源最終用途除已包括煮食爐及飯煲外再加上在廚房
普遍用作製造及準備食物的器具例如煮食用水加熱設備電焗爐及微波爐等
自2001年後的「煮食」之能源最終用途數據均作出修訂[2013年版修訂]The ldquo Cooking rdquo energy end-use was revised in the 2013 Edition to include foodmaking and preparation appliances normally found in kitchens in addition to stovesand rice cookers Examples of the appliances are hot water for cooking purposeselectric ovens and microwave ovens etc The ldquoCookingrdquo energy end-use data since2001 were hence updated (Revised in 2013 Edition)
自2011年「商業」及「工業」類別的分類已經根據香港標準行業分類20版作出
修訂這修訂包括將個人服務活動(例如夜總會卡拉OK電腦及通訊設施維
修家居用品維修車輛維修服務藝術表演或創作活動及出版服務)由以往的
「食肆」「其他商業」組別或「工業」類別重置到現時的「零售」組別其同
時涵蓋零售及個人服務活動[2013年版修訂]The ldquoCommercialrdquo and ldquoIndustrialldquo Sectors were re-categorized in 2011 to alignwith the Hong Kong Standard Industrial Classification (HSIC) Version 20Examples of such changes are the relocations of personal service activities (such asnight clubs karaokes computer and communication repair household goodsrepair motor vehicle repair services art performance or creation activities andpublishing services etc) from the previous ldquo Restaurant ldquo Other CommercialSegments or the rdquoIndustrialrdquo Sector to the present ldquoRetailrdquo Segment which nowembraces both retail and personal service activities (Revised in 2013 Edition)
12 自2010年的能源最終用途數據包括可再生能源數據[2012年版修訂]The energy end-use data from 2010 includes renewable energy data(Revised in 2012 Edition)
11
75 76
7Chronology of Major Revisions
8 自2013年版起「空氣調節」之能源最終用途除已包括冷氣設備及暖氣機外再加
上風扇空氣清新或淨化器及抽濕機 自2001年後的「空氣調節」之能源最終用
途數據均作出修訂[2013年版修訂]The ldquoAir Conditioningrdquo energy end-use was revised in the 2013 Edition to includefans air cleanerpurifiers and dehumidifiers in addition to air conditioning unitsand heaters The ldquoAir Conditioningrdquo energy end-use data since 2001 were henceupdated (Revised in 2013 Edition)
9 自2013年版起「辦公室設備」之能源最終用途除已包括電腦及影印機外再加上
視聽器材碎紙機傳真及收銀機自2001年後的「辦公室設備」之能源最終用
途數據均作出修訂[2013年版修訂]The ldquoOffice Equipmentrdquo energy end-use was revised in the 2013 Edition to includeaudio visual equipments shredders fax and cashier machines etc in addition tocomputers and photocopiers The ldquoOffice Equipmentrdquo energy end-use data since2001 were hence updated (Revised in 2013 Edition)
10 根據住宅能源消耗調查所得的數據有關2009年至2011年的能源最終用途數據已
在2013年版中作出修訂[2013年版修訂]The energy end-use data from year 2009 to 2011 were revised in the 2013 Editionbased on the findings of energy consumption survey on the Residential Sector(Revised in 2013 Edition)
15 根據政府統計處公佈的人口及家庭住戶統計修訂數字有關2007至2010年的能源
最終用途數據己在2012年版中作出相應的修訂[2012年版修訂]The energy end-use data from years 2007 to 2010 were revised in the 2012 Editionbased on the revised population and domestic household data published by theCensus and Statistics Department (Revised in 2012 Edition)
7
17 根據政府統計處公佈的家庭住戶統計修訂數字有關2001至2006年的能源最終用
途數據己在2009年版中作出修訂[2009年版修訂]The energy end-use data from years 2001 to 2006 were revised in the 2009 Editionbased on the revised domestic household data published by the Census and StatisticsDepartment (Revised in 2009 Edition)
18 自2006年起「鐵路」之能源最終用途再不包括鐵路車站等建築物使用的電量
[2008年版修訂]The ldquoRailrdquo energy end-use do not include electricity consumption at railway stationsfrom 2006 onwards (Revised in 2008 Edition)
16 根據商業及運輸能源消耗調查所得的數據有關2003年至2007年的能源最終用途
數據已在2010年版中作出修訂[2010年版修訂]The energy end-use data from year 2003 to 2007 were revised in the 2010 Editionbased on the findings of energy consumption survey on the Commercial andTransport Sectors (Revised in 2010 Edition)
7Chronology of Major Revisions 8Units of Measurement7主要修訂年表 8計量單位
1 太焦耳 = 1012 焦耳 1 terajoule (TJ) = 1012 joules
1 千兆焦耳 = 109 焦耳 1 gigajoule (GJ) = 109 joules
1 百萬焦耳 = 106 焦耳 1 megajoule (MJ) = 106 joules
77 78
1 千兆瓦小時 = 36 x 1012 焦耳 1 gigawatt hour (GWh) = 36 x 1012 joules
1 兆瓦小時 = 36 x 109 焦耳 1 megawatt hour (MWh) = 36 x 109 joules
1 千瓦小時 = 36 x 106 焦耳 1 kilowatt hour (kWh) = 36 x 106 joules
網址 httpwwwemsdgovhk電郵 energydataemsdgovhk
79 80
Enquiries about this publication can be directed to
The Energy Efficiency OfficeElectrical amp Mechanical Services Department
7F 3 Kai Shing Street Kowloon Bay Hong Kong
Tel No (852) 2808 3465Fax No (852) 2890 6081
Homepage httpwwwemsdgovhkE-mail energydataemsdgovhk
Set of Hong Kong Energy End-use Data can be downloadedfrom EMSD website
httpswwwemsdgovhkenenergy_efficiencyenergy_end_use_data_and_consumption_indicatorshong_kong_energy_end_use_datadataindexhtml
有關本刊物的查詢請聯絡
機電工程署
香港九龍灣啟成街3號7樓
能源效益事務處 httpswwwemsdgovhktcenergy_efficiencyenergy_end_use_data_and_consumption_indicatorshong_kong_energy_end_use_datadataindexhtml
香港能源最終用途數據收錄之數據可在機電工程署網站下載
電話(852) 2808 3465圖文傳真(852) 2890 6081
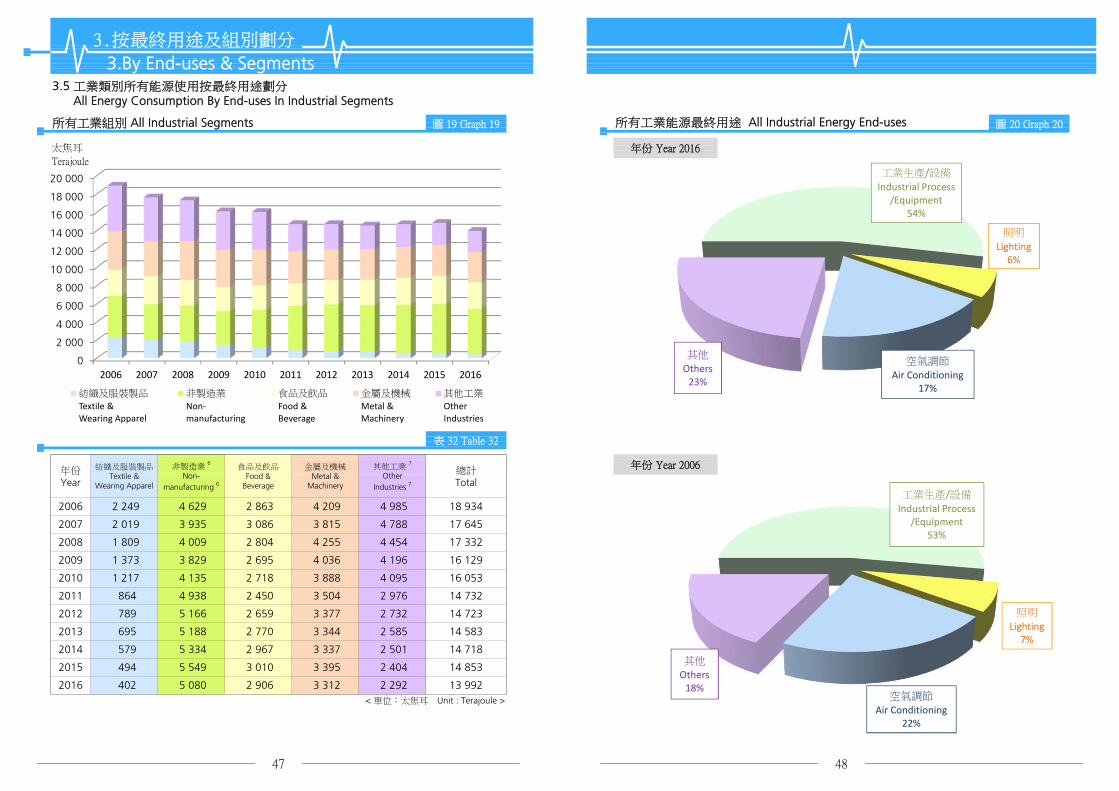
3按最終用途及組別劃分
3By End-uses amp Segments
所有工業組別 All Industrial Segments
35 工業類別所有能源使用按最終用途劃分 All Energy Consumption By End-uses In Industrial Segments
圖 20 Graph 20
年份 Year 2016
年份 Year 2006
所有工業能源最終用途 All Industrial Energy End-uses
695 5 188 2 770 3 344 2 585 14 5832013
5 166 2 659 3 377 2 732 14 7232012 789
494 5 549 3 010 3 395 2 404 14 8532015
5 334 2 967 3 337 2 501 14 7182014 579
47 48
5 080 2 906 3 312 2 292 13 992lt 單位太焦耳 Unit Terajoule gt
2016 402
864 4 938 2 450 3 504 2 976 14 7322011
4 135 2 718 3 888 4 095 16 0532010 1 217
1 373 3 829 2 695 4 036 4 196 16 1292009
4 009 2 804 4 255 4 454 17 3322008 1 809
3 086 3 815 4 788 17 6452007 2 019 3 935
4 209 4 985 18 9342006 2 249 4 629 2 863
圖 19 Graph 19
太焦耳
Terajoule
其他工業 7
OtherIndustries 7
總計Total
年份Year
紡織及服裝製品Textile amp
Wearing Apparel
非製造業 6
Non-manufacturing 6
食品及飲品Food amp
Beverage
金屬及機械Metal amp
Machinery
表 32 Table 32
0
2 000
4 000
6 000
8 000
10 000
12 000
14 000
16 000
18 000
20 000
2006 2007 2008 2009 2010 2011 2012 2013 2014 2015 2016
紡織及服裝製品
Textile ampWearing Apparel
非製造業
Non‐manufacturing
食品及飲品
Food ampBeverage
金屬及機械
Metal ampMachinery
其他工業
OtherIndustries
工業生產設備
Industrial ProcessEquipment
54
照明
Lighting6
空氣調節
Air Conditioning17
其他
Others23
工業生產設備
Industrial ProcessEquipment
53
照明
Lighting7
空氣調節
Air Conditioning22
其他
Others18
3按最終用途及組別劃分
3By End-uses amp Segments
紡織及服裝製品組別 Textile amp Wearing Apparel Segment
35 工業類別所有能源使用按最終用途劃分 All Energy Consumption By End-uses In Industrial Segments
食品及飲品組別 Food amp Beverage Segment表 33 Table 33 表 35 Table 35
年份Year
工業生產設備 5
Industrial ProcessEquipment 5
照明Lighting
空氣調節Air
Conditioning
其他1
Others1總計Total
年份Year
工業生產設備 5
Industrial ProcessEquipment 5
照明Lighting
空氣調節Air
Conditioning
其他1
Others1總計Total
466 455 2 863
2007 880 194 685 260 3 0862 019 2007 1 922 159 509 497
2006 997 210 757 284 2 249 2006 1 797 146
430 425 2 804
2009 637 123 446 167 1 373 2009 1 775 125 399 397 2 695
2008 834 163 592 221 1 809 2008 1 815 134
2010 574 106 391 145 2 718
2011 446 68 256 94 864 2011 1 743 95
1 217 2010 1 793 125 400 399
303 310 2 450
311 318 2 659
2013 367 53 203 74 2 770 695 2013 2 047 97 309 317
2012 416 59 230 83 789 2012 1 934 97
340 344 2 967
2015 262 36 145 51 494 2015 2 218 106 342 345 3 010
2014 303 44 171 61 579 2014 2 177 106
2016 210 31 118 43 2 906lt 單位太焦耳 Unit Terajoule gt lt 單位太焦耳 Unit Terajoule gt
非製造業組別 6 Non-manufacturing Segment6金屬及機械組別 Metal amp Machinery Segment表 34 Table 34 表 36 Table 36
402 2016 2 117 106 337 346
年份Year
工業生產設備 5
Industrial ProcessEquipment 5
照明Lighting
空氣調節Air
Conditioning
其他1
Others1總計Total
年份Year
工業生產設備 5
Industrial ProcessEquipment 5
照明Lighting
空氣調節Air
Conditioning
其他1
Others1總計Total
2006 1 794 114 925 1 376 4 2092006 2 013 588 992 1 035 4 629
2007 1 626 103 837 1 249 3 8152007 1 711 500 850 873 3 935
2008 1 819 105 857 1 475 4 2552008 1 823 488 810 888 4 009
2009 1 729 97 791 1 419 4 0362009 1 764 460 762 843 3 829
2010 1 665 94 761 1 367 3 8882010 1 907 496 819 913 4 135
2011 1 513 65 565 1 360 3 5042011 2 143 509 940 1 346 4 938
2012 1 460 63 544 1 309 3 3772012 2 272 540 985 1 370 5 166
2013 1 452 62 534 1 296 3 3442013 2 246 536 969 1 437 5 188
2014 1 445 62 541 1 290 3 3372014 2 295 547 1 003 1 490 5 334
2015 1 470 63 551 1 312 3 3952015 2 401 571 1 041 1 536 5 549
2016 1 440 61 529 1 282 3 3122016 2 179 522 949 1 430 5 080lt 單位太焦耳 Unit Terajoule gt lt 單位太焦耳 Unit Terajoule gt
49 50
2015 346 4 024 1 349 1 217 2 307 9 242
1 226 1 192 2 476 9 144
3 880 1 344 1 195 2 402 9 2302014 409
14 015
2007 1 682 3 032 2 012 1 882 4 496 13 104
1 232 1 208 2 616 9 356
12 182
1 200 1 255 2 844 9 5302011 619 3 613
2009 1 089 2 799 1 579 1 779 3 896 11 143
2010
2012 553 3 747
2013 489 3 761
951 3 023 1 585 1 714 3 808 11 082
2007 3 295 277 980 236 4 788
1 701 1 926 4 140
1 842 2 080 4 670
2008 1 443 2 971
2006 1 851 3 572
2008 3 051 257 915 231 4 454
35 工業類別所有能源使用按最終用途劃分 All Energy Consumption By End-uses In Industrial Segments
所有工業組別 All Industrial Segments
36 工業類別電力使用按最終用途劃分 Electricity Consumption By End-uses In Industrial Segments
3按最終用途及組別劃分
3By End-uses amp Segments
2006 3 415 290 1 029 251 4 985
圖 21 Graph 21
年份
Year
工業生產設備 5
Industrial ProcessEquipment 5
照明Lighting
空氣調節Air
Conditioning
其他1
Others1總計Total
太焦耳
Terajoule
表 37 Table 37其他工業組別 7 Other Industrial Segments 7
2010 2 800 237 844 213 4 095
2009 2 865 242 863 225 4 196
2012 1 872 166 568 125 2 732
2011 2 030 180 627 140 2 976
2014 1 711 154 520 116 2 501
2013 1 781 158 528 119 2 585
2016 1 568 144 471 110 2 292
2015 1 635 149 502 118 2 404
表 38 Table 38
年份Year
紡織及服裝製品Textile amp
Wearing Apparel
非製造業 6
Non-manufacturing 6
食品及飲品Food amp
Beverage
金屬及機械Metal amp
Machinery
其他工業 7
OtherIndustries 7
總計Total
lt 單位太焦耳 Unit Terajoule gt
2 206 8 709
51 52
lt 單位太焦耳 Unit Terajoule gt
2016 286 3 699 1 339 1 179
0
2 000
4 000
6 000
8 000
10 000
12 000
14 000
16 000
2006 2007 2008 2009 2010 2011 2012 2013 2014 2015 2016
紡織及服裝製品
Textile ampWearing Apparel
非製造業
Non‐manufacturing
食品及飲品
Food ampBeverage
金屬及機械
Metal ampMachinery
其他工業
OtherIndustries
圖 22 Graph 22 紡織及服裝製品組別 Textile amp Wearing Apparel Segment 表 39 Table 39
年份 Year 2016
所有工業能源最終用途 All Industrial Energy End-uses
36 工業類別電力使用按最終用途劃分 Electricity Consumption By End-uses In Industrial Segments
3按最終用途及組別劃分
3By End-uses amp Segments
年份 Year 2006
53
年份Year
工業生產設備 5
Industrial ProcessEquipment 5
照明Lighting
空氣調節Air
Conditioning
其他1
Others1總計Total
2006 604 210 757 279 1 851
2007 547 194 685 255 1 682
1 443
2009 356 123 446 164 1 089
2008 472 163 592 217
951
2011 203 68 256 92 619
2010 312 106 391 142
553
2013 162 53 203 72 489
2012 182 59 230 81
409
2015 114 36 145 50 346
2014 134 44 171 60
286lt 單位太焦耳 Unit Terajoule gt
非製造業組別 6 Non-manufacturing Segment 6 表 40 Table 40
年份Year
工業生產設備 5
Industrial ProcessEquipment 5
照明Lighting
空氣調節Air
Conditioning
其他1
Others1總計Total
2016 94 31 118 42
3 572
2007 893 500 850 788 3 032
2006 1 057 588 992 934
2 971
2009 836 460 762 742 2 799
2008 886 488 810 787
3 023
2011 949 509 940 1 215 3 613
2010 904 496 819 804
3 747
2013 962 536 969 1 295 3 761
2012 993 540 985 1 230
3 880
2015 1 028 571 1 041 1 384 4 024
2014 986 547 1 003 1 345
3 699lt 單位太焦耳 Unit Terajoule gt
54
2016 936 522 949 1 292
工業生產設備
Industrial ProcessEquipment
41 照明
Lighting10
空氣調節
Air Conditioning27
其他
Others22
工業生產設備
Industrial ProcessEquipment
46
照明
Lighting9
空氣調節
Air Conditioning30
其他
Others15
其他工業組別 7 Other Industrial Segments 7表 41 Table 41 表 43 Table 43
年份Year
工業生產設備 5
Industrial ProcessEquipment 5
照明Lighting
空氣調節Air
Conditioning
其他1
Others1總計Total
年份Year
工業生產設備 5
Industrial ProcessEquipment 5
照明Lighting
空氣調節Air
Conditioning
其他1
Others1總計Total
1 029 216 4 670
2007 883 159 509 462 4 4962 012 2007 3 030 277 980 208
2006 808 146 466 423 1 842 2006 3 135 290
915 191 4 140
2009 693 125 399 363 1 579 2009 2 610 242 863 181 3 896
2008 746 134 430 390 1 701 2008 2 777 257
2010 695 125 400 365 3 808
2011 526 95 303 277 1 200 2011 1 904 180
1 585 2010 2 548 237 844 178
627 133 2 844
568 123 2 616
2013 536 97 309 284 2 4761 226 2013 1 674 158 528 116
2012 540 97 311 284 1 232 2012
金屬及機械組別 Metal amp Machinery Segment 表 42 Table 42
1 339 2016 1 484 144 471 108
1 759 166
520 114
2015 592 106 342 309 1 349 2015 1 544 149 502 112
2014
2016 585 106 337 310
1 614 154
2 206lt 單位太焦耳 Unit Terajoule gt lt 單位太焦耳 Unit Terajoule gt
2 402
2 307
590 106 340 308 1 344 2014
2006 810 114 925 231 2 080
年份Year
工業生產設備 5
Industrial ProcessEquipment 5
照明Lighting
空氣調節Air
Conditioning
其他1
Others1總計Total
2008 751 105 857 214 1 926
2007 733 103 837 209 1 882
2010 668 94 761 190 1 714
2009 694 97 791 198 1 779
2012 466 63 544 136 1 208
2011 484 65 565 141 1 255
2014 459 62 541 134 1 195
2013 461 62 534 134 1 192
3按最終用途及組別劃分
3By End-uses amp Segments
食品及飲品組別 Food amp Beverage Segment
36 工業類別電力使用按最終用途劃分 Electricity Consumption By End-uses In Industrial Segments
55 56
lt 單位太焦耳 Unit Terajoule gt
2016 456 61 529 133 1 179
2015 467 63 551 136 1 217
表 45 Table 45
太焦耳Terajoule
年份Year
貨車Goods Vehicle
其他
Others 總計Total
貨運組別 Freight Segments圖 23 Graph 23
3按最終用途及組別劃分
3By End-uses amp Segments
所有運輸組別 All Transport Segments
37 運輸類別所有能源使用按最終用途劃分 All Energy Consumption By End-uses In Transport Segments
32 551 6 601 39 152 0
2007
2006
31 771 6 411 38 182 0
0
2009 28 501 5 424 33 925 0
2008 30 438 5 929 36 367
0
2011 28 010 4 134 32 144 0
2010 28 585 4 744 33 329
0
2013 25 534 3 305 28 839 0
2012 26 941 3 826 30 767
0
2015
0
lt 單位太焦耳 Unit Terajoule gt
2014 25 009 3 264 28 273
24 782 3 269 28 051 0
2016
總計Total
年份Year
貨運Freight
客運Passenger
總計Total
年份Year
巴士Bus
24 721 2 961 27 682
客運組別 Passenger Segments表 44 Table 44 表 46 Table 46
41 57 251 59 96 404
的士Taxi
汽車Car
電單車Motorcycle
鐵路Rail
其他
Others
14 102 17 118 463 2 495 3 973 57 983
4 017 57 251
2007 38 182 40 57 983 60 96 165 2007 19 832
2006 20 301 13 797 16 267 426 2 4442006 39 152
56 718
3 965 58 137
2009 33 925 37 56 718 63 90 643 2009 19 150
2008 18 971 15 142 17 059 480 2 5202008 36 367 38 58 137 62 94 504
37 57 560 63 90 889
13 131 17 449 465 2 523 4 000
13 593 18 879 424 2 609 4 213 58 630
4 124 57 560
2011 32 144 35 58 630 65 90 774 2011 18 911
2010 18 842 13 373 18 247 436 2 5402010 33 329
61 359
4 354 59 656
2013 28 839 32 61 359 68 90 198 2013 19 144
2012 19 128 13 469 19 561 423 2 7222012 30 767 34 59 656 66 90 423
31 61 725 69 89 999
13 319 21 158 406 2 796 4 536
13 039 21 764 448 2 972 4 631 61 195
4 547 61 725
2015 28 051 31 61 195 69 89 245 2015 18 341
2014 18 659 14 133 21 085 426 2 8752014 28 273
57 58
4 636 62 136lt 單位太焦耳 Unit Terajoule gt lt 單位太焦耳 Unit Terajoule gt
此項之最終用途包括船隻及香港內部的航空運輸能源的使用等 End-uses under this heading include marine and internal air transportation energy uses etc
2016 18 918 12 288 22 881 463 2 9512016 27 682 31 62 136 69 89 819
0
10 000
20 000
30 000
40 000
50 000
60 000
70 000
80 000
90 000
100 000
2006 2007 2008 2009 2010 2011 2012 2013 2014 2015 2016
貨運
Freight客運
Passenger
4按燃料及類別劃分
4By Fuels amp Sectors
41 所有能源使用按燃料劃分
All Energy Consumption By Fuels圖 24 Graph 24 圖 25 Graph 25
3按最終用途及組別劃分
3By End-uses amp Segments
所有運輸能源最終用途 All Transport Energy End-uses
37 運輸類別所有能源使用按最終用途劃分 All Energy Consumption By End-uses In Transport Segments
年份 Year 2016 太焦耳Terajoule
表 47 Table 47
年份 Year 2006 年份Year
煤氣及石油氣Town Gas amp
Liquefied Petroleum Gas
油及煤產品Oil amp CoalProducts
電力Electricity
總計Total
2006 48 482 17 87 518 31 145 204 52 281 204 100
2007 48 721 17 86 647 31 147 072 52 282 440 100
52 281 438 100
2009 47 239 17 82 194 29 149 366 54
2008 49 732 18 84 361 30 147 345
278 799 100
2010 49 084 17 81 786 29 150 859 54 281 729 100
2011 49 568 18 81 716 29 151 606 54 282 890 100
54 286 048 100
2013 49 723 17 81 306 29 153 362 54
2012 49 616 17 81 352 28 155 079
284 391 100
2014 50 844 18 80 347 28 158 147 55 289 338 100
2015 48 954 17 80 757 28 158 275 55 287 986 100
59 60
55 289 219 100
lt 單位太焦耳 Unit Terajoule gt
「總熱值」是使用於計算各種氣體燃料的熱含量 Gross caloricfic values are used in calculating the respective heat contents of the gaseous products
2016 49 374 17 81 184 28 158 662
巴士
Bus 21
的士
Taxi14
汽車及電單車
Car amp Motorcycle26
貨車
Goods Vehicle28
鐵路及其他
Rail amp Others12
巴士
Bus 21
的士
Taxi14
汽車及電單車
Car amp Motorcycle17
貨車
Goods Vehicle34
鐵路及其他
Rail amp Others14
0
50 000
100 000
150 000
200 000
250 000
300 000
2006 2007 2008 2009 2010 2011 2012 2013 2014 2015 2016
煤氣及石油氣Town Gas amp Liquefied Petroleum Gas
油及煤產品
Oil amp Coal Products 電力
Electricity
太焦耳Terajoule
太焦耳Terajoule
表 48 Table 48 表 49 Table 49
4按燃料及類別劃分
4By Fuels amp Sectors
43 商業類別按燃料劃分
Commercial Sector By Fuels42 住宅類別按燃料劃分
Residential Sector By Fuels 圖 26 Graph 26 圖 27 Graph 27
煤氣及石油氣Town Gas amp
Liquefied Petroleum Gas
油及煤產品Oil amp CoalProducts
電力Electricity
總計Total
2006 18 476 34 79 0 35 428
年份Year
煤氣及石油氣Town Gas amp
Liquefied Petroleum Gas
油及煤產品Oil amp CoalProducts
電力Electricity
總計Total
年份Year
4 936 4 93 317 83 111 884 10066 53 982 100 2006 13 631 12
83 113 914 10067 54 717 100 2007 13 888 12
2008 18 708 33 41 0 37 100
4 975 4 95 0512007 18 238 33 57 0 36 422
4 739 4 95 543 84 113 753 10066 55 849 100 2008 13 471 12
85 114 297 10068 57 731 100 2009 12 815 11
2010 19 038 33 13 0 39 344
4 753 4 96 7282009 18 736 32 23 0 38 972
4 526 4 97 894 84 116 391 10067 58 396 100 2010 13 971 12
84 118 558 10068 58 826 100 2011 14 161 12
2012 18 736 31 8 0 41 189
4 803 4 99 5942011 18 946 32 8 0 39 872
4 769 4 101 813 84 120 970 10069 59 932 100 2012 14 388 12
84 121 215 10068 58 394 100 2013 14 709 12
2014 18 487 30 8 0 43 415
5 026 4 101 4802013 18 446 32 8 0 39 941
5 156 4 102 627 84 122 711 10070 61 910 100 2014 14 928 12
84 123 674 10070 60 214 100 2015 14 795 12
2016 18 311 30 8 0 43 120
5 186 4 103 6932015 17 838 30 8 0 42 368
5 164 4 103 881 84 123 969 10070 61 439 100 2016 14 924 12lt 單位太焦耳 Unit Terajoule gt lt 單位太焦耳 Unit Terajoule gt
「總熱值」是使用於計算各種氣體燃料的熱含量 Gross caloricfic values are used in calculating the respective heat contents of the gaseous products
「總熱值」是使用於計算各種氣體燃料的熱含量 Gross caloricfic values are used in calculating the respective heat contents of the gaseous products
61 62
0
10 000
20 000
30 000
40 000
50 000
60 000
70 000
2006 2007 2008 2009 2010 2011 2012 2013 2014 2015 2016
煤氣及石油氣Town Gas amp Liquefied Petroleum Gas
油及煤產品
Oil amp Coal Products 電力
Electricity
0
20 000
40 000
60 000
80 000
100 000
120 000
140 000
2006 2007 2008 2009 2010 2011 2012 2013 2014 2015 2016煤氣及石油氣Town Gas amp Liquefied Petroleum Gas
油及煤產品
Oil amp Coal Products 電力
Electricity
太焦耳Terajoule
太焦耳Terajoule
表 50 Table 50 表 51 Table 51
4按燃料及類別劃分
4By Fuels amp Sectors
45 運輸類別按燃料劃分
Transport Sector By Fuels44 工業類別按燃料劃分
Industrial Sector By Fuels 圖 28 Graph 28 圖 29 Graph 29
煤氣及石油氣Town Gas amp
Liquefied Petroleum Gas
油及煤產品Oil amp CoalProducts
電力Electricity
總計Total
2006 926 5 3 994 21 14 015
年份Year
煤氣及石油氣Town Gas amp
Liquefied Petroleum Gas
油及煤產品Oil amp CoalProducts
電力Electricity
總計Total
年份Year
78 510 81 2 444 3 96 404 10074 18 934 100 2006 15 450 16
3 96 165 10074 17 645 100 2007 15 678 16
2008 927 5 4 223 24 12 182
77 992 81 2 4952007 917 5 3 623 21 13 104
75 358 80 2 520 3 94 504 10070 17 332 100 2008 16 627 18
3 90 643 10069 16 129 100 2009 14 765 16
2010 937 6 4 035 25 11 082
73 355 81 2 5232009 923 6 4 063 25 11 143
73 213 81 2 540 3 90 889 10069 16 053 100 2010 15 137 17
3 90 774 10065 14 732 100 2011 15 506 17
2012 1 108 8 4 259 29 9 356
72 659 80 2 6092011 956 6 4 246 29 9 530
72 317 80 2 722 3 90 423 10064 14 723 100 2012 15 384 17
3 90 198 10063 14 583 100 2013 15 348 17
2014 1 244 8 4 244 29 9 230
72 054 80 2 7962013 1 220 8 4 218 29 9 144
70 939 79 2 875 3 89 999 10063 14 718 100 2014 16 185 18
3 89 245 10062 14 853 100 2015 15 048 17
2016 1 171 8 4 112 29 8 709
71 225 80 2 9722015 1 272 9 4 339 29 9 242
71 900 80 2 951 3 89 819 10062 13 992 100 2016 14 967 17lt 單位太焦耳 Unit Terajoule gt lt 單位太焦耳 Unit Terajoule gt
「總熱值」是使用於計算各種氣體燃料的熱含量 Gross caloricfic values are used in calculating the respective heat contents of the gaseous products
「總熱值」是使用於計算各種氣體燃料的熱含量 Gross caloricfic values are used in calculating the respective heat contents of the gaseous products
63 64
0
2 000
4 000
6 000
8 000
10 000
12 000
14 000
16 000
18 000
20 000
2006 2007 2008 2009 2010 2011 2012 2013 2014 2015 2016煤氣及石油氣Town Gas amp Liquefied Petroleum Gas
油及煤產品
Oil amp Coal Products電力
Electricity
0
10 000
20 000
30 000
40 000
50 000
60 000
70 000
80 000
90 000
100 000
2006 2007 2008 2009 2010 2011 2012 2013 2014 2015 2016煤氣及石油氣Town Gas amp Liquefied Petroleum Gas
油及煤產品
Oil amp Coal Products電力
Electricity
47 890 281 204
2007
20 301 13 797 16 267 426
2 506 10 158 49 197 282 440 14 102
46 5022006
19 832
16 465
17 071
5按最終用途及燃料劃分
5By End-uses amp Fuels
51 所有能源使用按最終用途劃分
All Energy Consumption By End-uses
2 454 10 413
15 142 17 059 480
2 529 9 228
7 918 31 836 12 776 32 551 21 608
51 487 278 799 13 131
17 118 463
17 449 465
2008
8 672 52 019 281 729
19 150
2 527 9 680 50 117 281 438
2009
18 971
8 496
9 121
9 244 19 199
2011
18 842 13 373 18 247 436
2 609 8 245 56 161 282 890 13 593 18 879 31 989 14 187 28 010
2012
2013
19 128
2 542
2 722 8 077 58 650 286 048 13 469 19 561 423
424
2010
18 911
19 144
9 213
8 536
8 319
8 199
19 563
19 314
19 662
19 655 44 243 14 181
14 197
13 708
2 796 7 739 58 100 284 391 13 319 21 158 406
2 875 7 705 58 273 289 338
25 534
2015
18 659 14 133 21 085 426
2 972 7 792 58 218 287 986 13 039 21 764 448
2014 25 009
24 782
8 607
8 717
19 609
19 774
48 746
48 466 18 341
2 951 7 474 59 374 289 219
51 所有能源使用按最終用途劃分 All Energy Consumption By End-uses 圖 30 Graph 30
18 918 12 288 22 881 4632016lt 單位太焦耳 Unit Terajoule gt
14 227 24 721 8 562 17 798 47 938 31 785 19 839
年份 Year 2016 年份 Year 2006
65 66
31 989
31 837
31 402
17 734
17 173
17 413
17 117
17 352
17 927
18 177
18 565
14 111 26 941
45 298
43 392
44 117
45 511
44 914
45 861
20 372
18 965
32 885
34 023
33 302
33 379
13 172
13 788
13 824
13 936
31 771
30 438
28 501
28 585
31 772
表 52 Table 52
年份Year
空氣調節Air
Conditioning
工業生產設備5
IndustrialProcessEquipment5
照明Lighting
冷凍Refrigeration
巴士Bus
的士Taxi
汽車Car
電單車Motorcycle
鐵路Rail
船隻Marine
其他1
Others1總計Total
貨車GoodsVehicle
煮食Cooking
熱水Hot Water
空氣調節
AirConditioning
17
煮食
Cooking11
工業生產設備
Industrial ProcessEquipment
6照明
Lighting7
冷凍
Refrigeration3
熱水
Hot Water 5
貨車
GoodsVehicle
9
巴士
Bus 6
的士
Taxi4
汽車及電單車
Car amp Motorcycle8
鐵路
Rail1
船隻
Marine 3
其他
Others20
空氣調節
AirConditioning
17
煮食
Cooking11
工業生產設備
Industrial ProcessEquipment
6照明
Lighting8
冷凍
Refrigeration3
熱水
Hot Water 4貨車
GoodsVehicle12
巴士
Bus 7
的士
Taxi5
汽車及電單車
Car amp Motorcycle6
鐵路
Rail1
船隻
Marine 4
其他
Others17
2006 46 502 21 608 7 918
5按最終用途及燃料劃分
5By End-uses amp Fuels
52 電力使用按最終用途劃分
Electricity Consumption By End-uses 表 53 Table 53
4 191 11 105 2 444 33 317 145 204
年份Year
空氣調節Air Conditioning
照明Lighting
冷凍Refrigeration
熱水Hot Water
辦公室設備Office Equipment
鐵路Rail
工業生產設備5
IndustrialProcessEquipment5
其他1
Others1總計Total
煮食Cooking
2007 45 298 20 372 8 496
5 373 11 246 2 520 35 477 147 345
4 809 11 171 2 495 34 776 147 072
2010 45 511 19 563 9 213
2009 44 117 19 199 9 244
2008 43 392 18 965 9 121
11 0612012 45 861 19 662 8 319
2011 44 914 19 314 8 536 9 201
9 131
10 738
4 715 13 200 2 722 40 408 155 079
4 945 12 615 2 609 38 732 151 606
11 412
11 3312014 48 746 19 609 8 607
2013 44 243 19 655 8 199 9 280
9 415 4 854 13 344 2 875 39 367 158 147
4 904 13 407 2 796 39 466 153 362
2016 47 938 19 839 8 562
2015 48 466 19 774 8 717 11 344 9 553
13 513 2 951 40 363 158 662 11 528 9 044
4 624 13 212 2 972 39 615 158 275
35 815
67 68
150 859
36 644 149 366
9 048
9 722
10 320
9 926
lt 單位太焦耳 Unit Terajoule gt
52 電力使用按最終用途劃分 Electricity Consumption By End-uses 圖 31 Graph 31
年份 Year 2016 年份 Year 2006
4 923
10 016
9 073
9 934
10 929
10 959
11 430 5 015 11 758 2 540
5 274 11 480 2 523
空氣調節Air
Conditioning 30
照明Lighting
13
冷凍Refrigeration
5
工業生產設備Industrial Process
Equipment6
煮食Cooking
7
熱水Hot Water
3辦公室設備
Office Equipment9
鐵路Rail2
其他Others25
空氣調節Air
Conditioning 32
照明Lighting
15
冷凍Refrigeration
5
工業生產設備Industrial Process
Equipment6
煮食Cooking
6
熱水Hot Water
3辦公室設備
Office Equipment8
鐵路Rail2
其他Others23
年份Year
貨車Goods Vehicle
巴士Bus
的士Taxi
5按最終用途及燃料劃分
5By End-uses amp Fuels
53 油及煤產品使用按最終用途劃分
Oil amp Coal Products Consumption By End-uses 表 54 Table 54
汽車Car
電單車Motorcycle
工業生產設備5
Industrial ProcessEquipment5
船隻Marine
其他1
Others1總計Total
87 518
2007 31 770 18 254 2 17 117 463 6 448 10 158 2 434 86 647
2006 32 551 18 647 2 16 266 426 6 508 10 413 2 705
84 361
2009 28 501 17 514 2 17 448 465 6 341 9 228 2 695 82 194
2008 30 438 17 485 2 17 059 480 6 503 9 680 2 713
81 786
2011 28 010 16 997 1 18 879 424 6 926 8 245 2 234 81 716
2010 28 585 17 077 1 18 247 436 6 423 8 672 2 346
81 352
2013 25 534 17 114 1 21 158 406 7 386 7 739 1 969 81 306
2012 26 941 17 212 1 19 560 423 7 074 8 077 2 064
80 347
2015 24 782 16 331 1 21 764 448
7 553 7 474 1 854 81 184
2014 25 009 16 607 1 21 085 426 7 458 7 705 2 056
lt 單位太焦耳 Unit Terajoule gt
53 油及煤產品使用按最終用途劃分
Oil amp Coal Products Consumption By End-uses 圖 32 Graph 32
7 688 7 792 1 953 80 757
2016 24 721 16 239 lt1 22 881 463
年份 Year 2016 年份 Year 2006
69 70
貨車GoodsVehicle31
巴士及的士Bus amp Taxi
20
汽車及電單車Car amp Motorcycle
29
工業生產設備Industrial Process
Equipment9
船隻Marine
9其他
Others2
貨車GoodsVehicle37
巴士及的士Bus amp Taxi
21
汽車及電單車Car amp Motorcycle
19
工業生產設備Industrial Process
Equipment8
船隻Marine
12其他
Others3
年份Year
煮食Cooking
熱水Hot Water
運輸Transport
其他1
Others1總計Total
5按最終用途及燃料劃分
5By End-uses amp Fuels
54 煤氣及石油氣使用按最終用途劃分
Town Gas amp Liquefied Petroleum Gas Consumption By End-uses 表 55 Table 55
2007 22 021 8 363 15 678 2 659 48 721
2006 21 741 8 585 15 450 2 706 48 482
2009 21 390 8 550 14 765 2 534 47 239
2008 22 220 8 415 16 627 2 472 49 732
2011 20 749 9 242 15 506 4 072 49 568
2010 21 244 8 921 15 137 3 782 49 084
2013 20 222 9 277 15 348 4 876 49 723
2012 20 330 9 396 15 384 4 506 49 616
2015 19 767 9 085 15 048 5 054 48 954
2014 20 194 9 342 16 185 5 123 50 844
lt 單位太焦耳 Unit Terajoule gt
54 煤氣及石油氣使用按最終用途劃分 Town Gas amp Liquefied Petroleum Gas Consumption By End-uses 圖 33 Graph 33
年份 Year 2016 年份 Year 2006
2016 19 990 9 304 14 967 5 113 49 374
「總熱值」是使用於計算各種氣體燃料的熱含量 Gross caloricfic values are used in calculating the respective heat contents of the gaseous products
71 72
煮食Cooking
41
熱水Hot Water
19
運輸Transport
30
其他Others10
煮食Cooking
45
熱水Hot Water
18運輸
Transport32
其他Others
5
6 根據已更新的可再生能源數據相關的2010年至2011年能源最終用途數據已在
2013年版中作出修訂[2013年版修訂]The energy end-use data from 2010 to 2011 were revised in the 2013 Edition basedon the latest update of the renewable energy data (Revised in 2013 Edition)
3 根據運輸能源消耗調查所得的數據有關2008年至2012年的能源最終用途數據已
在2015年版中作出修訂[2015年版修訂]The energy end-use data from year 2008 to 2012 were revised in the 2015 Editionbased on the findings of energy consumption survey on the Transport Sector(Revised in 2015 Edition)
4 自2014年版起新的「住宿」「醫療」和「教育」組別已由「其他商業」組別
分拆出來「其他商業」組別因而相應地縮小[2014年版修訂]The Accommodation Human Health and Education Segments weresegregated from the Other Commercial Segment as new segments in the 2014Edition Hence the size of the Other Commercial Segment is accordingly reduced(Revised in 2014 Edition)
5 自2014年版起燃料的熱含量均以「總熱值」計算因而自2002年後的能源數據
均已採用「總熱值」作出計算[2014年版修訂]Since the 2014 Edition Gross Calorific Values are used for calculating the heatcontents of fuels Gross Calorific Values are hence used in computing energy datafrom 2002 onwards (Revised in 2014 Edition)
1 由於資料所限能源數據不能再分拆成其他最終用途數據「其他」的最終用途包
括沒有被列在表上的最終用途
2 自2013年後「空氣調節」「冷凍」「工業生產設備」及「熱水」的能源最終
用途數據已採用「氣溫因素」作出修訂[2017年版修訂]The energy end-use data of Air Conditioning Refrigeration IndustrialProcessEquipment and Hot Water are revised by Temperature Factor fromyear 2013 onwards (Revised in 2017 Edition)
Due to data limitations energy data could not further be broken down into other end-uses The ldquoOthersrdquo end-use includes the end-uses not elsewhere listed in the table
2 「房委會資助出售單位」組別前稱為「居屋計劃」組別
1 根據零售組別能源消耗調查所得的數據有關2011年至2014年的能源最終用途數
據已在2017年版中作出修訂[2017年版修訂]The energy end-use data from year 2011 to 2014 were revised in the 2017 Editionbased on the findings of energy consumption survey on the Retail Segment(Revised in 2017 Edition)
6Notes 7Chronology of Major Revisions7主要修訂年表6註釋
3 「其他房屋」組別包括別墅平房及類似屋宇
The ldquoOther Housingrdquo Segment includes villas bungalows and the like
4 「熱水及冷凍」的最終用途包括鍋爐器材及其他生產加熱和冷凍的設備
The ldquo Non-manufacturing rdquo Segment includes construction and other miscellaneousnon-manufacturing industrial activities
The ldquoHousing Authority Subsidized Sale Flatsrdquo Segment was previously called ldquoHomeOwnershiprdquo Segment
The ldquo Hot Water amp Refrigeration rdquo end-use includes boiling equipments and otherprocess heating and cooling facilities
「工業生產設備」的最終用途包括鍋爐設備及其他生產加熱和冷凍設備的使用
The ldquoOther Industrialrdquo Segment includes electronics paper printing plastic and othermiscellaneous industrial activities
73
The ldquo GDP in chained dollars rdquo were revised based on latest data published by theCensus and Statisics Department
8 ldquo本地生產總值環比物量計算rdquo己根據政府統計處最新數據作出修訂
74
7 「其他工業」組別包括電子紙張印刷塑膠及其他雜項工業活動
The ldquo Industrial ProcessEquipment rdquo end-use includes boiler plants and other processheating and cooling facilities
6 「非製造業」組別包括建造及其他非製造業之雜項工業活動
5
7主要修訂年表
13 自2010年起「電力」包括燃煤天然氣風能及太陽能所產生的電能[2012年版修訂]ldquoElectricityrdquoincludes the electricity generated from coal natural gas wind and solarpower since 2010 (Revised in 2012 Edition)
14 根據工業能源消耗調查所得的數據有關2000年至2010年的能源最終用途數據已
在2012年版中作出修訂[2012年版修訂]The energy end-use data from year 2000 to 2010 were revised in the 2012 Editionbased on the findings of energy consumption survey on the Industrial Sector(Revised in 2012 Edition)
自2013年版起「煮食」之能源最終用途除已包括煮食爐及飯煲外再加上在廚房
普遍用作製造及準備食物的器具例如煮食用水加熱設備電焗爐及微波爐等
自2001年後的「煮食」之能源最終用途數據均作出修訂[2013年版修訂]The ldquo Cooking rdquo energy end-use was revised in the 2013 Edition to include foodmaking and preparation appliances normally found in kitchens in addition to stovesand rice cookers Examples of the appliances are hot water for cooking purposeselectric ovens and microwave ovens etc The ldquoCookingrdquo energy end-use data since2001 were hence updated (Revised in 2013 Edition)
自2011年「商業」及「工業」類別的分類已經根據香港標準行業分類20版作出
修訂這修訂包括將個人服務活動(例如夜總會卡拉OK電腦及通訊設施維
修家居用品維修車輛維修服務藝術表演或創作活動及出版服務)由以往的
「食肆」「其他商業」組別或「工業」類別重置到現時的「零售」組別其同
時涵蓋零售及個人服務活動[2013年版修訂]The ldquoCommercialrdquo and ldquoIndustrialldquo Sectors were re-categorized in 2011 to alignwith the Hong Kong Standard Industrial Classification (HSIC) Version 20Examples of such changes are the relocations of personal service activities (such asnight clubs karaokes computer and communication repair household goodsrepair motor vehicle repair services art performance or creation activities andpublishing services etc) from the previous ldquo Restaurant ldquo Other CommercialSegments or the rdquoIndustrialrdquo Sector to the present ldquoRetailrdquo Segment which nowembraces both retail and personal service activities (Revised in 2013 Edition)
12 自2010年的能源最終用途數據包括可再生能源數據[2012年版修訂]The energy end-use data from 2010 includes renewable energy data(Revised in 2012 Edition)
11
75 76
7Chronology of Major Revisions
8 自2013年版起「空氣調節」之能源最終用途除已包括冷氣設備及暖氣機外再加
上風扇空氣清新或淨化器及抽濕機 自2001年後的「空氣調節」之能源最終用
途數據均作出修訂[2013年版修訂]The ldquoAir Conditioningrdquo energy end-use was revised in the 2013 Edition to includefans air cleanerpurifiers and dehumidifiers in addition to air conditioning unitsand heaters The ldquoAir Conditioningrdquo energy end-use data since 2001 were henceupdated (Revised in 2013 Edition)
9 自2013年版起「辦公室設備」之能源最終用途除已包括電腦及影印機外再加上
視聽器材碎紙機傳真及收銀機自2001年後的「辦公室設備」之能源最終用
途數據均作出修訂[2013年版修訂]The ldquoOffice Equipmentrdquo energy end-use was revised in the 2013 Edition to includeaudio visual equipments shredders fax and cashier machines etc in addition tocomputers and photocopiers The ldquoOffice Equipmentrdquo energy end-use data since2001 were hence updated (Revised in 2013 Edition)
10 根據住宅能源消耗調查所得的數據有關2009年至2011年的能源最終用途數據已
在2013年版中作出修訂[2013年版修訂]The energy end-use data from year 2009 to 2011 were revised in the 2013 Editionbased on the findings of energy consumption survey on the Residential Sector(Revised in 2013 Edition)
15 根據政府統計處公佈的人口及家庭住戶統計修訂數字有關2007至2010年的能源
最終用途數據己在2012年版中作出相應的修訂[2012年版修訂]The energy end-use data from years 2007 to 2010 were revised in the 2012 Editionbased on the revised population and domestic household data published by theCensus and Statistics Department (Revised in 2012 Edition)
7
17 根據政府統計處公佈的家庭住戶統計修訂數字有關2001至2006年的能源最終用
途數據己在2009年版中作出修訂[2009年版修訂]The energy end-use data from years 2001 to 2006 were revised in the 2009 Editionbased on the revised domestic household data published by the Census and StatisticsDepartment (Revised in 2009 Edition)
18 自2006年起「鐵路」之能源最終用途再不包括鐵路車站等建築物使用的電量
[2008年版修訂]The ldquoRailrdquo energy end-use do not include electricity consumption at railway stationsfrom 2006 onwards (Revised in 2008 Edition)
16 根據商業及運輸能源消耗調查所得的數據有關2003年至2007年的能源最終用途
數據已在2010年版中作出修訂[2010年版修訂]The energy end-use data from year 2003 to 2007 were revised in the 2010 Editionbased on the findings of energy consumption survey on the Commercial andTransport Sectors (Revised in 2010 Edition)
7Chronology of Major Revisions 8Units of Measurement7主要修訂年表 8計量單位
1 太焦耳 = 1012 焦耳 1 terajoule (TJ) = 1012 joules
1 千兆焦耳 = 109 焦耳 1 gigajoule (GJ) = 109 joules
1 百萬焦耳 = 106 焦耳 1 megajoule (MJ) = 106 joules
77 78
1 千兆瓦小時 = 36 x 1012 焦耳 1 gigawatt hour (GWh) = 36 x 1012 joules
1 兆瓦小時 = 36 x 109 焦耳 1 megawatt hour (MWh) = 36 x 109 joules
1 千瓦小時 = 36 x 106 焦耳 1 kilowatt hour (kWh) = 36 x 106 joules
網址 httpwwwemsdgovhk電郵 energydataemsdgovhk
79 80
Enquiries about this publication can be directed to
The Energy Efficiency OfficeElectrical amp Mechanical Services Department
7F 3 Kai Shing Street Kowloon Bay Hong Kong
Tel No (852) 2808 3465Fax No (852) 2890 6081
Homepage httpwwwemsdgovhkE-mail energydataemsdgovhk
Set of Hong Kong Energy End-use Data can be downloadedfrom EMSD website
httpswwwemsdgovhkenenergy_efficiencyenergy_end_use_data_and_consumption_indicatorshong_kong_energy_end_use_datadataindexhtml
有關本刊物的查詢請聯絡
機電工程署
香港九龍灣啟成街3號7樓
能源效益事務處 httpswwwemsdgovhktcenergy_efficiencyenergy_end_use_data_and_consumption_indicatorshong_kong_energy_end_use_datadataindexhtml
香港能源最終用途數據收錄之數據可在機電工程署網站下載
電話(852) 2808 3465圖文傳真(852) 2890 6081
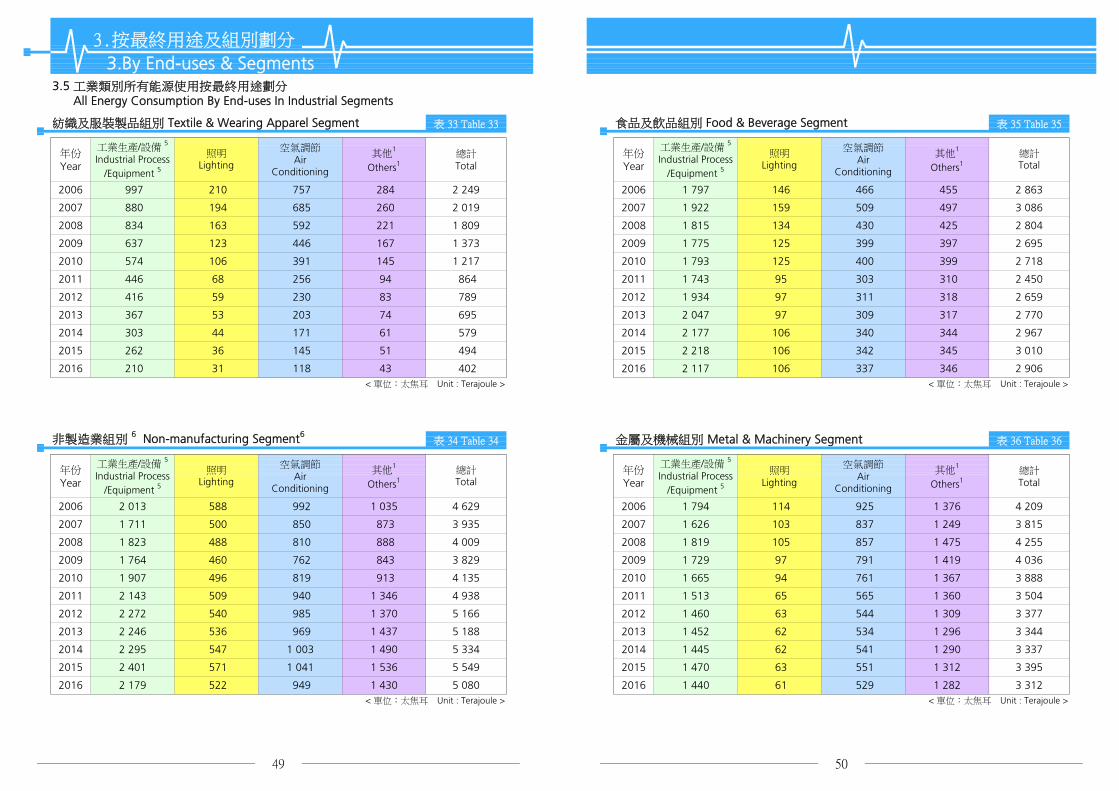
3按最終用途及組別劃分
3By End-uses amp Segments
紡織及服裝製品組別 Textile amp Wearing Apparel Segment
35 工業類別所有能源使用按最終用途劃分 All Energy Consumption By End-uses In Industrial Segments
食品及飲品組別 Food amp Beverage Segment表 33 Table 33 表 35 Table 35
年份Year
工業生產設備 5
Industrial ProcessEquipment 5
照明Lighting
空氣調節Air
Conditioning
其他1
Others1總計Total
年份Year
工業生產設備 5
Industrial ProcessEquipment 5
照明Lighting
空氣調節Air
Conditioning
其他1
Others1總計Total
466 455 2 863
2007 880 194 685 260 3 0862 019 2007 1 922 159 509 497
2006 997 210 757 284 2 249 2006 1 797 146
430 425 2 804
2009 637 123 446 167 1 373 2009 1 775 125 399 397 2 695
2008 834 163 592 221 1 809 2008 1 815 134
2010 574 106 391 145 2 718
2011 446 68 256 94 864 2011 1 743 95
1 217 2010 1 793 125 400 399
303 310 2 450
311 318 2 659
2013 367 53 203 74 2 770 695 2013 2 047 97 309 317
2012 416 59 230 83 789 2012 1 934 97
340 344 2 967
2015 262 36 145 51 494 2015 2 218 106 342 345 3 010
2014 303 44 171 61 579 2014 2 177 106
2016 210 31 118 43 2 906lt 單位太焦耳 Unit Terajoule gt lt 單位太焦耳 Unit Terajoule gt
非製造業組別 6 Non-manufacturing Segment6金屬及機械組別 Metal amp Machinery Segment表 34 Table 34 表 36 Table 36
402 2016 2 117 106 337 346
年份Year
工業生產設備 5
Industrial ProcessEquipment 5
照明Lighting
空氣調節Air
Conditioning
其他1
Others1總計Total
年份Year
工業生產設備 5
Industrial ProcessEquipment 5
照明Lighting
空氣調節Air
Conditioning
其他1
Others1總計Total
2006 1 794 114 925 1 376 4 2092006 2 013 588 992 1 035 4 629
2007 1 626 103 837 1 249 3 8152007 1 711 500 850 873 3 935
2008 1 819 105 857 1 475 4 2552008 1 823 488 810 888 4 009
2009 1 729 97 791 1 419 4 0362009 1 764 460 762 843 3 829
2010 1 665 94 761 1 367 3 8882010 1 907 496 819 913 4 135
2011 1 513 65 565 1 360 3 5042011 2 143 509 940 1 346 4 938
2012 1 460 63 544 1 309 3 3772012 2 272 540 985 1 370 5 166
2013 1 452 62 534 1 296 3 3442013 2 246 536 969 1 437 5 188
2014 1 445 62 541 1 290 3 3372014 2 295 547 1 003 1 490 5 334
2015 1 470 63 551 1 312 3 3952015 2 401 571 1 041 1 536 5 549
2016 1 440 61 529 1 282 3 3122016 2 179 522 949 1 430 5 080lt 單位太焦耳 Unit Terajoule gt lt 單位太焦耳 Unit Terajoule gt
49 50
2015 346 4 024 1 349 1 217 2 307 9 242
1 226 1 192 2 476 9 144
3 880 1 344 1 195 2 402 9 2302014 409
14 015
2007 1 682 3 032 2 012 1 882 4 496 13 104
1 232 1 208 2 616 9 356
12 182
1 200 1 255 2 844 9 5302011 619 3 613
2009 1 089 2 799 1 579 1 779 3 896 11 143
2010
2012 553 3 747
2013 489 3 761
951 3 023 1 585 1 714 3 808 11 082
2007 3 295 277 980 236 4 788
1 701 1 926 4 140
1 842 2 080 4 670
2008 1 443 2 971
2006 1 851 3 572
2008 3 051 257 915 231 4 454
35 工業類別所有能源使用按最終用途劃分 All Energy Consumption By End-uses In Industrial Segments
所有工業組別 All Industrial Segments
36 工業類別電力使用按最終用途劃分 Electricity Consumption By End-uses In Industrial Segments
3按最終用途及組別劃分
3By End-uses amp Segments
2006 3 415 290 1 029 251 4 985
圖 21 Graph 21
年份
Year
工業生產設備 5
Industrial ProcessEquipment 5
照明Lighting
空氣調節Air
Conditioning
其他1
Others1總計Total
太焦耳
Terajoule
表 37 Table 37其他工業組別 7 Other Industrial Segments 7
2010 2 800 237 844 213 4 095
2009 2 865 242 863 225 4 196
2012 1 872 166 568 125 2 732
2011 2 030 180 627 140 2 976
2014 1 711 154 520 116 2 501
2013 1 781 158 528 119 2 585
2016 1 568 144 471 110 2 292
2015 1 635 149 502 118 2 404
表 38 Table 38
年份Year
紡織及服裝製品Textile amp
Wearing Apparel
非製造業 6
Non-manufacturing 6
食品及飲品Food amp
Beverage
金屬及機械Metal amp
Machinery
其他工業 7
OtherIndustries 7
總計Total
lt 單位太焦耳 Unit Terajoule gt
2 206 8 709
51 52
lt 單位太焦耳 Unit Terajoule gt
2016 286 3 699 1 339 1 179
0
2 000
4 000
6 000
8 000
10 000
12 000
14 000
16 000
2006 2007 2008 2009 2010 2011 2012 2013 2014 2015 2016
紡織及服裝製品
Textile ampWearing Apparel
非製造業
Non‐manufacturing
食品及飲品
Food ampBeverage
金屬及機械
Metal ampMachinery
其他工業
OtherIndustries
圖 22 Graph 22 紡織及服裝製品組別 Textile amp Wearing Apparel Segment 表 39 Table 39
年份 Year 2016
所有工業能源最終用途 All Industrial Energy End-uses
36 工業類別電力使用按最終用途劃分 Electricity Consumption By End-uses In Industrial Segments
3按最終用途及組別劃分
3By End-uses amp Segments
年份 Year 2006
53
年份Year
工業生產設備 5
Industrial ProcessEquipment 5
照明Lighting
空氣調節Air
Conditioning
其他1
Others1總計Total
2006 604 210 757 279 1 851
2007 547 194 685 255 1 682
1 443
2009 356 123 446 164 1 089
2008 472 163 592 217
951
2011 203 68 256 92 619
2010 312 106 391 142
553
2013 162 53 203 72 489
2012 182 59 230 81
409
2015 114 36 145 50 346
2014 134 44 171 60
286lt 單位太焦耳 Unit Terajoule gt
非製造業組別 6 Non-manufacturing Segment 6 表 40 Table 40
年份Year
工業生產設備 5
Industrial ProcessEquipment 5
照明Lighting
空氣調節Air
Conditioning
其他1
Others1總計Total
2016 94 31 118 42
3 572
2007 893 500 850 788 3 032
2006 1 057 588 992 934
2 971
2009 836 460 762 742 2 799
2008 886 488 810 787
3 023
2011 949 509 940 1 215 3 613
2010 904 496 819 804
3 747
2013 962 536 969 1 295 3 761
2012 993 540 985 1 230
3 880
2015 1 028 571 1 041 1 384 4 024
2014 986 547 1 003 1 345
3 699lt 單位太焦耳 Unit Terajoule gt
54
2016 936 522 949 1 292
工業生產設備
Industrial ProcessEquipment
41 照明
Lighting10
空氣調節
Air Conditioning27
其他
Others22
工業生產設備
Industrial ProcessEquipment
46
照明
Lighting9
空氣調節
Air Conditioning30
其他
Others15
其他工業組別 7 Other Industrial Segments 7表 41 Table 41 表 43 Table 43
年份Year
工業生產設備 5
Industrial ProcessEquipment 5
照明Lighting
空氣調節Air
Conditioning
其他1
Others1總計Total
年份Year
工業生產設備 5
Industrial ProcessEquipment 5
照明Lighting
空氣調節Air
Conditioning
其他1
Others1總計Total
1 029 216 4 670
2007 883 159 509 462 4 4962 012 2007 3 030 277 980 208
2006 808 146 466 423 1 842 2006 3 135 290
915 191 4 140
2009 693 125 399 363 1 579 2009 2 610 242 863 181 3 896
2008 746 134 430 390 1 701 2008 2 777 257
2010 695 125 400 365 3 808
2011 526 95 303 277 1 200 2011 1 904 180
1 585 2010 2 548 237 844 178
627 133 2 844
568 123 2 616
2013 536 97 309 284 2 4761 226 2013 1 674 158 528 116
2012 540 97 311 284 1 232 2012
金屬及機械組別 Metal amp Machinery Segment 表 42 Table 42
1 339 2016 1 484 144 471 108
1 759 166
520 114
2015 592 106 342 309 1 349 2015 1 544 149 502 112
2014
2016 585 106 337 310
1 614 154
2 206lt 單位太焦耳 Unit Terajoule gt lt 單位太焦耳 Unit Terajoule gt
2 402
2 307
590 106 340 308 1 344 2014
2006 810 114 925 231 2 080
年份Year
工業生產設備 5
Industrial ProcessEquipment 5
照明Lighting
空氣調節Air
Conditioning
其他1
Others1總計Total
2008 751 105 857 214 1 926
2007 733 103 837 209 1 882
2010 668 94 761 190 1 714
2009 694 97 791 198 1 779
2012 466 63 544 136 1 208
2011 484 65 565 141 1 255
2014 459 62 541 134 1 195
2013 461 62 534 134 1 192
3按最終用途及組別劃分
3By End-uses amp Segments
食品及飲品組別 Food amp Beverage Segment
36 工業類別電力使用按最終用途劃分 Electricity Consumption By End-uses In Industrial Segments
55 56
lt 單位太焦耳 Unit Terajoule gt
2016 456 61 529 133 1 179
2015 467 63 551 136 1 217
表 45 Table 45
太焦耳Terajoule
年份Year
貨車Goods Vehicle
其他
Others 總計Total
貨運組別 Freight Segments圖 23 Graph 23
3按最終用途及組別劃分
3By End-uses amp Segments
所有運輸組別 All Transport Segments
37 運輸類別所有能源使用按最終用途劃分 All Energy Consumption By End-uses In Transport Segments
32 551 6 601 39 152 0
2007
2006
31 771 6 411 38 182 0
0
2009 28 501 5 424 33 925 0
2008 30 438 5 929 36 367
0
2011 28 010 4 134 32 144 0
2010 28 585 4 744 33 329
0
2013 25 534 3 305 28 839 0
2012 26 941 3 826 30 767
0
2015
0
lt 單位太焦耳 Unit Terajoule gt
2014 25 009 3 264 28 273
24 782 3 269 28 051 0
2016
總計Total
年份Year
貨運Freight
客運Passenger
總計Total
年份Year
巴士Bus
24 721 2 961 27 682
客運組別 Passenger Segments表 44 Table 44 表 46 Table 46
41 57 251 59 96 404
的士Taxi
汽車Car
電單車Motorcycle
鐵路Rail
其他
Others
14 102 17 118 463 2 495 3 973 57 983
4 017 57 251
2007 38 182 40 57 983 60 96 165 2007 19 832
2006 20 301 13 797 16 267 426 2 4442006 39 152
56 718
3 965 58 137
2009 33 925 37 56 718 63 90 643 2009 19 150
2008 18 971 15 142 17 059 480 2 5202008 36 367 38 58 137 62 94 504
37 57 560 63 90 889
13 131 17 449 465 2 523 4 000
13 593 18 879 424 2 609 4 213 58 630
4 124 57 560
2011 32 144 35 58 630 65 90 774 2011 18 911
2010 18 842 13 373 18 247 436 2 5402010 33 329
61 359
4 354 59 656
2013 28 839 32 61 359 68 90 198 2013 19 144
2012 19 128 13 469 19 561 423 2 7222012 30 767 34 59 656 66 90 423
31 61 725 69 89 999
13 319 21 158 406 2 796 4 536
13 039 21 764 448 2 972 4 631 61 195
4 547 61 725
2015 28 051 31 61 195 69 89 245 2015 18 341
2014 18 659 14 133 21 085 426 2 8752014 28 273
57 58
4 636 62 136lt 單位太焦耳 Unit Terajoule gt lt 單位太焦耳 Unit Terajoule gt
此項之最終用途包括船隻及香港內部的航空運輸能源的使用等 End-uses under this heading include marine and internal air transportation energy uses etc
2016 18 918 12 288 22 881 463 2 9512016 27 682 31 62 136 69 89 819
0
10 000
20 000
30 000
40 000
50 000
60 000
70 000
80 000
90 000
100 000
2006 2007 2008 2009 2010 2011 2012 2013 2014 2015 2016
貨運
Freight客運
Passenger
4按燃料及類別劃分
4By Fuels amp Sectors
41 所有能源使用按燃料劃分
All Energy Consumption By Fuels圖 24 Graph 24 圖 25 Graph 25
3按最終用途及組別劃分
3By End-uses amp Segments
所有運輸能源最終用途 All Transport Energy End-uses
37 運輸類別所有能源使用按最終用途劃分 All Energy Consumption By End-uses In Transport Segments
年份 Year 2016 太焦耳Terajoule
表 47 Table 47
年份 Year 2006 年份Year
煤氣及石油氣Town Gas amp
Liquefied Petroleum Gas
油及煤產品Oil amp CoalProducts
電力Electricity
總計Total
2006 48 482 17 87 518 31 145 204 52 281 204 100
2007 48 721 17 86 647 31 147 072 52 282 440 100
52 281 438 100
2009 47 239 17 82 194 29 149 366 54
2008 49 732 18 84 361 30 147 345
278 799 100
2010 49 084 17 81 786 29 150 859 54 281 729 100
2011 49 568 18 81 716 29 151 606 54 282 890 100
54 286 048 100
2013 49 723 17 81 306 29 153 362 54
2012 49 616 17 81 352 28 155 079
284 391 100
2014 50 844 18 80 347 28 158 147 55 289 338 100
2015 48 954 17 80 757 28 158 275 55 287 986 100
59 60
55 289 219 100
lt 單位太焦耳 Unit Terajoule gt
「總熱值」是使用於計算各種氣體燃料的熱含量 Gross caloricfic values are used in calculating the respective heat contents of the gaseous products
2016 49 374 17 81 184 28 158 662
巴士
Bus 21
的士
Taxi14
汽車及電單車
Car amp Motorcycle26
貨車
Goods Vehicle28
鐵路及其他
Rail amp Others12
巴士
Bus 21
的士
Taxi14
汽車及電單車
Car amp Motorcycle17
貨車
Goods Vehicle34
鐵路及其他
Rail amp Others14
0
50 000
100 000
150 000
200 000
250 000
300 000
2006 2007 2008 2009 2010 2011 2012 2013 2014 2015 2016
煤氣及石油氣Town Gas amp Liquefied Petroleum Gas
油及煤產品
Oil amp Coal Products 電力
Electricity
太焦耳Terajoule
太焦耳Terajoule
表 48 Table 48 表 49 Table 49
4按燃料及類別劃分
4By Fuels amp Sectors
43 商業類別按燃料劃分
Commercial Sector By Fuels42 住宅類別按燃料劃分
Residential Sector By Fuels 圖 26 Graph 26 圖 27 Graph 27
煤氣及石油氣Town Gas amp
Liquefied Petroleum Gas
油及煤產品Oil amp CoalProducts
電力Electricity
總計Total
2006 18 476 34 79 0 35 428
年份Year
煤氣及石油氣Town Gas amp
Liquefied Petroleum Gas
油及煤產品Oil amp CoalProducts
電力Electricity
總計Total
年份Year
4 936 4 93 317 83 111 884 10066 53 982 100 2006 13 631 12
83 113 914 10067 54 717 100 2007 13 888 12
2008 18 708 33 41 0 37 100
4 975 4 95 0512007 18 238 33 57 0 36 422
4 739 4 95 543 84 113 753 10066 55 849 100 2008 13 471 12
85 114 297 10068 57 731 100 2009 12 815 11
2010 19 038 33 13 0 39 344
4 753 4 96 7282009 18 736 32 23 0 38 972
4 526 4 97 894 84 116 391 10067 58 396 100 2010 13 971 12
84 118 558 10068 58 826 100 2011 14 161 12
2012 18 736 31 8 0 41 189
4 803 4 99 5942011 18 946 32 8 0 39 872
4 769 4 101 813 84 120 970 10069 59 932 100 2012 14 388 12
84 121 215 10068 58 394 100 2013 14 709 12
2014 18 487 30 8 0 43 415
5 026 4 101 4802013 18 446 32 8 0 39 941
5 156 4 102 627 84 122 711 10070 61 910 100 2014 14 928 12
84 123 674 10070 60 214 100 2015 14 795 12
2016 18 311 30 8 0 43 120
5 186 4 103 6932015 17 838 30 8 0 42 368
5 164 4 103 881 84 123 969 10070 61 439 100 2016 14 924 12lt 單位太焦耳 Unit Terajoule gt lt 單位太焦耳 Unit Terajoule gt
「總熱值」是使用於計算各種氣體燃料的熱含量 Gross caloricfic values are used in calculating the respective heat contents of the gaseous products
「總熱值」是使用於計算各種氣體燃料的熱含量 Gross caloricfic values are used in calculating the respective heat contents of the gaseous products
61 62
0
10 000
20 000
30 000
40 000
50 000
60 000
70 000
2006 2007 2008 2009 2010 2011 2012 2013 2014 2015 2016
煤氣及石油氣Town Gas amp Liquefied Petroleum Gas
油及煤產品
Oil amp Coal Products 電力
Electricity
0
20 000
40 000
60 000
80 000
100 000
120 000
140 000
2006 2007 2008 2009 2010 2011 2012 2013 2014 2015 2016煤氣及石油氣Town Gas amp Liquefied Petroleum Gas
油及煤產品
Oil amp Coal Products 電力
Electricity
太焦耳Terajoule
太焦耳Terajoule
表 50 Table 50 表 51 Table 51
4按燃料及類別劃分
4By Fuels amp Sectors
45 運輸類別按燃料劃分
Transport Sector By Fuels44 工業類別按燃料劃分
Industrial Sector By Fuels 圖 28 Graph 28 圖 29 Graph 29
煤氣及石油氣Town Gas amp
Liquefied Petroleum Gas
油及煤產品Oil amp CoalProducts
電力Electricity
總計Total
2006 926 5 3 994 21 14 015
年份Year
煤氣及石油氣Town Gas amp
Liquefied Petroleum Gas
油及煤產品Oil amp CoalProducts
電力Electricity
總計Total
年份Year
78 510 81 2 444 3 96 404 10074 18 934 100 2006 15 450 16
3 96 165 10074 17 645 100 2007 15 678 16
2008 927 5 4 223 24 12 182
77 992 81 2 4952007 917 5 3 623 21 13 104
75 358 80 2 520 3 94 504 10070 17 332 100 2008 16 627 18
3 90 643 10069 16 129 100 2009 14 765 16
2010 937 6 4 035 25 11 082
73 355 81 2 5232009 923 6 4 063 25 11 143
73 213 81 2 540 3 90 889 10069 16 053 100 2010 15 137 17
3 90 774 10065 14 732 100 2011 15 506 17
2012 1 108 8 4 259 29 9 356
72 659 80 2 6092011 956 6 4 246 29 9 530
72 317 80 2 722 3 90 423 10064 14 723 100 2012 15 384 17
3 90 198 10063 14 583 100 2013 15 348 17
2014 1 244 8 4 244 29 9 230
72 054 80 2 7962013 1 220 8 4 218 29 9 144
70 939 79 2 875 3 89 999 10063 14 718 100 2014 16 185 18
3 89 245 10062 14 853 100 2015 15 048 17
2016 1 171 8 4 112 29 8 709
71 225 80 2 9722015 1 272 9 4 339 29 9 242
71 900 80 2 951 3 89 819 10062 13 992 100 2016 14 967 17lt 單位太焦耳 Unit Terajoule gt lt 單位太焦耳 Unit Terajoule gt
「總熱值」是使用於計算各種氣體燃料的熱含量 Gross caloricfic values are used in calculating the respective heat contents of the gaseous products
「總熱值」是使用於計算各種氣體燃料的熱含量 Gross caloricfic values are used in calculating the respective heat contents of the gaseous products
63 64
0
2 000
4 000
6 000
8 000
10 000
12 000
14 000
16 000
18 000
20 000
2006 2007 2008 2009 2010 2011 2012 2013 2014 2015 2016煤氣及石油氣Town Gas amp Liquefied Petroleum Gas
油及煤產品
Oil amp Coal Products電力
Electricity
0
10 000
20 000
30 000
40 000
50 000
60 000
70 000
80 000
90 000
100 000
2006 2007 2008 2009 2010 2011 2012 2013 2014 2015 2016煤氣及石油氣Town Gas amp Liquefied Petroleum Gas
油及煤產品
Oil amp Coal Products電力
Electricity
47 890 281 204
2007
20 301 13 797 16 267 426
2 506 10 158 49 197 282 440 14 102
46 5022006
19 832
16 465
17 071
5按最終用途及燃料劃分
5By End-uses amp Fuels
51 所有能源使用按最終用途劃分
All Energy Consumption By End-uses
2 454 10 413
15 142 17 059 480
2 529 9 228
7 918 31 836 12 776 32 551 21 608
51 487 278 799 13 131
17 118 463
17 449 465
2008
8 672 52 019 281 729
19 150
2 527 9 680 50 117 281 438
2009
18 971
8 496
9 121
9 244 19 199
2011
18 842 13 373 18 247 436
2 609 8 245 56 161 282 890 13 593 18 879 31 989 14 187 28 010
2012
2013
19 128
2 542
2 722 8 077 58 650 286 048 13 469 19 561 423
424
2010
18 911
19 144
9 213
8 536
8 319
8 199
19 563
19 314
19 662
19 655 44 243 14 181
14 197
13 708
2 796 7 739 58 100 284 391 13 319 21 158 406
2 875 7 705 58 273 289 338
25 534
2015
18 659 14 133 21 085 426
2 972 7 792 58 218 287 986 13 039 21 764 448
2014 25 009
24 782
8 607
8 717
19 609
19 774
48 746
48 466 18 341
2 951 7 474 59 374 289 219
51 所有能源使用按最終用途劃分 All Energy Consumption By End-uses 圖 30 Graph 30
18 918 12 288 22 881 4632016lt 單位太焦耳 Unit Terajoule gt
14 227 24 721 8 562 17 798 47 938 31 785 19 839
年份 Year 2016 年份 Year 2006
65 66
31 989
31 837
31 402
17 734
17 173
17 413
17 117
17 352
17 927
18 177
18 565
14 111 26 941
45 298
43 392
44 117
45 511
44 914
45 861
20 372
18 965
32 885
34 023
33 302
33 379
13 172
13 788
13 824
13 936
31 771
30 438
28 501
28 585
31 772
表 52 Table 52
年份Year
空氣調節Air
Conditioning
工業生產設備5
IndustrialProcessEquipment5
照明Lighting
冷凍Refrigeration
巴士Bus
的士Taxi
汽車Car
電單車Motorcycle
鐵路Rail
船隻Marine
其他1
Others1總計Total
貨車GoodsVehicle
煮食Cooking
熱水Hot Water
空氣調節
AirConditioning
17
煮食
Cooking11
工業生產設備
Industrial ProcessEquipment
6照明
Lighting7
冷凍
Refrigeration3
熱水
Hot Water 5
貨車
GoodsVehicle
9
巴士
Bus 6
的士
Taxi4
汽車及電單車
Car amp Motorcycle8
鐵路
Rail1
船隻
Marine 3
其他
Others20
空氣調節
AirConditioning
17
煮食
Cooking11
工業生產設備
Industrial ProcessEquipment
6照明
Lighting8
冷凍
Refrigeration3
熱水
Hot Water 4貨車
GoodsVehicle12
巴士
Bus 7
的士
Taxi5
汽車及電單車
Car amp Motorcycle6
鐵路
Rail1
船隻
Marine 4
其他
Others17
2006 46 502 21 608 7 918
5按最終用途及燃料劃分
5By End-uses amp Fuels
52 電力使用按最終用途劃分
Electricity Consumption By End-uses 表 53 Table 53
4 191 11 105 2 444 33 317 145 204
年份Year
空氣調節Air Conditioning
照明Lighting
冷凍Refrigeration
熱水Hot Water
辦公室設備Office Equipment
鐵路Rail
工業生產設備5
IndustrialProcessEquipment5
其他1
Others1總計Total
煮食Cooking
2007 45 298 20 372 8 496
5 373 11 246 2 520 35 477 147 345
4 809 11 171 2 495 34 776 147 072
2010 45 511 19 563 9 213
2009 44 117 19 199 9 244
2008 43 392 18 965 9 121
11 0612012 45 861 19 662 8 319
2011 44 914 19 314 8 536 9 201
9 131
10 738
4 715 13 200 2 722 40 408 155 079
4 945 12 615 2 609 38 732 151 606
11 412
11 3312014 48 746 19 609 8 607
2013 44 243 19 655 8 199 9 280
9 415 4 854 13 344 2 875 39 367 158 147
4 904 13 407 2 796 39 466 153 362
2016 47 938 19 839 8 562
2015 48 466 19 774 8 717 11 344 9 553
13 513 2 951 40 363 158 662 11 528 9 044
4 624 13 212 2 972 39 615 158 275
35 815
67 68
150 859
36 644 149 366
9 048
9 722
10 320
9 926
lt 單位太焦耳 Unit Terajoule gt
52 電力使用按最終用途劃分 Electricity Consumption By End-uses 圖 31 Graph 31
年份 Year 2016 年份 Year 2006
4 923
10 016
9 073
9 934
10 929
10 959
11 430 5 015 11 758 2 540
5 274 11 480 2 523
空氣調節Air
Conditioning 30
照明Lighting
13
冷凍Refrigeration
5
工業生產設備Industrial Process
Equipment6
煮食Cooking
7
熱水Hot Water
3辦公室設備
Office Equipment9
鐵路Rail2
其他Others25
空氣調節Air
Conditioning 32
照明Lighting
15
冷凍Refrigeration
5
工業生產設備Industrial Process
Equipment6
煮食Cooking
6
熱水Hot Water
3辦公室設備
Office Equipment8
鐵路Rail2
其他Others23
年份Year
貨車Goods Vehicle
巴士Bus
的士Taxi
5按最終用途及燃料劃分
5By End-uses amp Fuels
53 油及煤產品使用按最終用途劃分
Oil amp Coal Products Consumption By End-uses 表 54 Table 54
汽車Car
電單車Motorcycle
工業生產設備5
Industrial ProcessEquipment5
船隻Marine
其他1
Others1總計Total
87 518
2007 31 770 18 254 2 17 117 463 6 448 10 158 2 434 86 647
2006 32 551 18 647 2 16 266 426 6 508 10 413 2 705
84 361
2009 28 501 17 514 2 17 448 465 6 341 9 228 2 695 82 194
2008 30 438 17 485 2 17 059 480 6 503 9 680 2 713
81 786
2011 28 010 16 997 1 18 879 424 6 926 8 245 2 234 81 716
2010 28 585 17 077 1 18 247 436 6 423 8 672 2 346
81 352
2013 25 534 17 114 1 21 158 406 7 386 7 739 1 969 81 306
2012 26 941 17 212 1 19 560 423 7 074 8 077 2 064
80 347
2015 24 782 16 331 1 21 764 448
7 553 7 474 1 854 81 184
2014 25 009 16 607 1 21 085 426 7 458 7 705 2 056
lt 單位太焦耳 Unit Terajoule gt
53 油及煤產品使用按最終用途劃分
Oil amp Coal Products Consumption By End-uses 圖 32 Graph 32
7 688 7 792 1 953 80 757
2016 24 721 16 239 lt1 22 881 463
年份 Year 2016 年份 Year 2006
69 70
貨車GoodsVehicle31
巴士及的士Bus amp Taxi
20
汽車及電單車Car amp Motorcycle
29
工業生產設備Industrial Process
Equipment9
船隻Marine
9其他
Others2
貨車GoodsVehicle37
巴士及的士Bus amp Taxi
21
汽車及電單車Car amp Motorcycle
19
工業生產設備Industrial Process
Equipment8
船隻Marine
12其他
Others3
年份Year
煮食Cooking
熱水Hot Water
運輸Transport
其他1
Others1總計Total
5按最終用途及燃料劃分
5By End-uses amp Fuels
54 煤氣及石油氣使用按最終用途劃分
Town Gas amp Liquefied Petroleum Gas Consumption By End-uses 表 55 Table 55
2007 22 021 8 363 15 678 2 659 48 721
2006 21 741 8 585 15 450 2 706 48 482
2009 21 390 8 550 14 765 2 534 47 239
2008 22 220 8 415 16 627 2 472 49 732
2011 20 749 9 242 15 506 4 072 49 568
2010 21 244 8 921 15 137 3 782 49 084
2013 20 222 9 277 15 348 4 876 49 723
2012 20 330 9 396 15 384 4 506 49 616
2015 19 767 9 085 15 048 5 054 48 954
2014 20 194 9 342 16 185 5 123 50 844
lt 單位太焦耳 Unit Terajoule gt
54 煤氣及石油氣使用按最終用途劃分 Town Gas amp Liquefied Petroleum Gas Consumption By End-uses 圖 33 Graph 33
年份 Year 2016 年份 Year 2006
2016 19 990 9 304 14 967 5 113 49 374
「總熱值」是使用於計算各種氣體燃料的熱含量 Gross caloricfic values are used in calculating the respective heat contents of the gaseous products
71 72
煮食Cooking
41
熱水Hot Water
19
運輸Transport
30
其他Others10
煮食Cooking
45
熱水Hot Water
18運輸
Transport32
其他Others
5
6 根據已更新的可再生能源數據相關的2010年至2011年能源最終用途數據已在
2013年版中作出修訂[2013年版修訂]The energy end-use data from 2010 to 2011 were revised in the 2013 Edition basedon the latest update of the renewable energy data (Revised in 2013 Edition)
3 根據運輸能源消耗調查所得的數據有關2008年至2012年的能源最終用途數據已
在2015年版中作出修訂[2015年版修訂]The energy end-use data from year 2008 to 2012 were revised in the 2015 Editionbased on the findings of energy consumption survey on the Transport Sector(Revised in 2015 Edition)
4 自2014年版起新的「住宿」「醫療」和「教育」組別已由「其他商業」組別
分拆出來「其他商業」組別因而相應地縮小[2014年版修訂]The Accommodation Human Health and Education Segments weresegregated from the Other Commercial Segment as new segments in the 2014Edition Hence the size of the Other Commercial Segment is accordingly reduced(Revised in 2014 Edition)
5 自2014年版起燃料的熱含量均以「總熱值」計算因而自2002年後的能源數據
均已採用「總熱值」作出計算[2014年版修訂]Since the 2014 Edition Gross Calorific Values are used for calculating the heatcontents of fuels Gross Calorific Values are hence used in computing energy datafrom 2002 onwards (Revised in 2014 Edition)
1 由於資料所限能源數據不能再分拆成其他最終用途數據「其他」的最終用途包
括沒有被列在表上的最終用途
2 自2013年後「空氣調節」「冷凍」「工業生產設備」及「熱水」的能源最終
用途數據已採用「氣溫因素」作出修訂[2017年版修訂]The energy end-use data of Air Conditioning Refrigeration IndustrialProcessEquipment and Hot Water are revised by Temperature Factor fromyear 2013 onwards (Revised in 2017 Edition)
Due to data limitations energy data could not further be broken down into other end-uses The ldquoOthersrdquo end-use includes the end-uses not elsewhere listed in the table
2 「房委會資助出售單位」組別前稱為「居屋計劃」組別
1 根據零售組別能源消耗調查所得的數據有關2011年至2014年的能源最終用途數
據已在2017年版中作出修訂[2017年版修訂]The energy end-use data from year 2011 to 2014 were revised in the 2017 Editionbased on the findings of energy consumption survey on the Retail Segment(Revised in 2017 Edition)
6Notes 7Chronology of Major Revisions7主要修訂年表6註釋
3 「其他房屋」組別包括別墅平房及類似屋宇
The ldquoOther Housingrdquo Segment includes villas bungalows and the like
4 「熱水及冷凍」的最終用途包括鍋爐器材及其他生產加熱和冷凍的設備
The ldquo Non-manufacturing rdquo Segment includes construction and other miscellaneousnon-manufacturing industrial activities
The ldquoHousing Authority Subsidized Sale Flatsrdquo Segment was previously called ldquoHomeOwnershiprdquo Segment
The ldquo Hot Water amp Refrigeration rdquo end-use includes boiling equipments and otherprocess heating and cooling facilities
「工業生產設備」的最終用途包括鍋爐設備及其他生產加熱和冷凍設備的使用
The ldquoOther Industrialrdquo Segment includes electronics paper printing plastic and othermiscellaneous industrial activities
73
The ldquo GDP in chained dollars rdquo were revised based on latest data published by theCensus and Statisics Department
8 ldquo本地生產總值環比物量計算rdquo己根據政府統計處最新數據作出修訂
74
7 「其他工業」組別包括電子紙張印刷塑膠及其他雜項工業活動
The ldquo Industrial ProcessEquipment rdquo end-use includes boiler plants and other processheating and cooling facilities
6 「非製造業」組別包括建造及其他非製造業之雜項工業活動
5
7主要修訂年表
13 自2010年起「電力」包括燃煤天然氣風能及太陽能所產生的電能[2012年版修訂]ldquoElectricityrdquoincludes the electricity generated from coal natural gas wind and solarpower since 2010 (Revised in 2012 Edition)
14 根據工業能源消耗調查所得的數據有關2000年至2010年的能源最終用途數據已
在2012年版中作出修訂[2012年版修訂]The energy end-use data from year 2000 to 2010 were revised in the 2012 Editionbased on the findings of energy consumption survey on the Industrial Sector(Revised in 2012 Edition)
自2013年版起「煮食」之能源最終用途除已包括煮食爐及飯煲外再加上在廚房
普遍用作製造及準備食物的器具例如煮食用水加熱設備電焗爐及微波爐等
自2001年後的「煮食」之能源最終用途數據均作出修訂[2013年版修訂]The ldquo Cooking rdquo energy end-use was revised in the 2013 Edition to include foodmaking and preparation appliances normally found in kitchens in addition to stovesand rice cookers Examples of the appliances are hot water for cooking purposeselectric ovens and microwave ovens etc The ldquoCookingrdquo energy end-use data since2001 were hence updated (Revised in 2013 Edition)
自2011年「商業」及「工業」類別的分類已經根據香港標準行業分類20版作出
修訂這修訂包括將個人服務活動(例如夜總會卡拉OK電腦及通訊設施維
修家居用品維修車輛維修服務藝術表演或創作活動及出版服務)由以往的
「食肆」「其他商業」組別或「工業」類別重置到現時的「零售」組別其同
時涵蓋零售及個人服務活動[2013年版修訂]The ldquoCommercialrdquo and ldquoIndustrialldquo Sectors were re-categorized in 2011 to alignwith the Hong Kong Standard Industrial Classification (HSIC) Version 20Examples of such changes are the relocations of personal service activities (such asnight clubs karaokes computer and communication repair household goodsrepair motor vehicle repair services art performance or creation activities andpublishing services etc) from the previous ldquo Restaurant ldquo Other CommercialSegments or the rdquoIndustrialrdquo Sector to the present ldquoRetailrdquo Segment which nowembraces both retail and personal service activities (Revised in 2013 Edition)
12 自2010年的能源最終用途數據包括可再生能源數據[2012年版修訂]The energy end-use data from 2010 includes renewable energy data(Revised in 2012 Edition)
11
75 76
7Chronology of Major Revisions
8 自2013年版起「空氣調節」之能源最終用途除已包括冷氣設備及暖氣機外再加
上風扇空氣清新或淨化器及抽濕機 自2001年後的「空氣調節」之能源最終用
途數據均作出修訂[2013年版修訂]The ldquoAir Conditioningrdquo energy end-use was revised in the 2013 Edition to includefans air cleanerpurifiers and dehumidifiers in addition to air conditioning unitsand heaters The ldquoAir Conditioningrdquo energy end-use data since 2001 were henceupdated (Revised in 2013 Edition)
9 自2013年版起「辦公室設備」之能源最終用途除已包括電腦及影印機外再加上
視聽器材碎紙機傳真及收銀機自2001年後的「辦公室設備」之能源最終用
途數據均作出修訂[2013年版修訂]The ldquoOffice Equipmentrdquo energy end-use was revised in the 2013 Edition to includeaudio visual equipments shredders fax and cashier machines etc in addition tocomputers and photocopiers The ldquoOffice Equipmentrdquo energy end-use data since2001 were hence updated (Revised in 2013 Edition)
10 根據住宅能源消耗調查所得的數據有關2009年至2011年的能源最終用途數據已
在2013年版中作出修訂[2013年版修訂]The energy end-use data from year 2009 to 2011 were revised in the 2013 Editionbased on the findings of energy consumption survey on the Residential Sector(Revised in 2013 Edition)
15 根據政府統計處公佈的人口及家庭住戶統計修訂數字有關2007至2010年的能源
最終用途數據己在2012年版中作出相應的修訂[2012年版修訂]The energy end-use data from years 2007 to 2010 were revised in the 2012 Editionbased on the revised population and domestic household data published by theCensus and Statistics Department (Revised in 2012 Edition)
7
17 根據政府統計處公佈的家庭住戶統計修訂數字有關2001至2006年的能源最終用
途數據己在2009年版中作出修訂[2009年版修訂]The energy end-use data from years 2001 to 2006 were revised in the 2009 Editionbased on the revised domestic household data published by the Census and StatisticsDepartment (Revised in 2009 Edition)
18 自2006年起「鐵路」之能源最終用途再不包括鐵路車站等建築物使用的電量
[2008年版修訂]The ldquoRailrdquo energy end-use do not include electricity consumption at railway stationsfrom 2006 onwards (Revised in 2008 Edition)
16 根據商業及運輸能源消耗調查所得的數據有關2003年至2007年的能源最終用途
數據已在2010年版中作出修訂[2010年版修訂]The energy end-use data from year 2003 to 2007 were revised in the 2010 Editionbased on the findings of energy consumption survey on the Commercial andTransport Sectors (Revised in 2010 Edition)
7Chronology of Major Revisions 8Units of Measurement7主要修訂年表 8計量單位
1 太焦耳 = 1012 焦耳 1 terajoule (TJ) = 1012 joules
1 千兆焦耳 = 109 焦耳 1 gigajoule (GJ) = 109 joules
1 百萬焦耳 = 106 焦耳 1 megajoule (MJ) = 106 joules
77 78
1 千兆瓦小時 = 36 x 1012 焦耳 1 gigawatt hour (GWh) = 36 x 1012 joules
1 兆瓦小時 = 36 x 109 焦耳 1 megawatt hour (MWh) = 36 x 109 joules
1 千瓦小時 = 36 x 106 焦耳 1 kilowatt hour (kWh) = 36 x 106 joules
網址 httpwwwemsdgovhk電郵 energydataemsdgovhk
79 80
Enquiries about this publication can be directed to
The Energy Efficiency OfficeElectrical amp Mechanical Services Department
7F 3 Kai Shing Street Kowloon Bay Hong Kong
Tel No (852) 2808 3465Fax No (852) 2890 6081
Homepage httpwwwemsdgovhkE-mail energydataemsdgovhk
Set of Hong Kong Energy End-use Data can be downloadedfrom EMSD website
httpswwwemsdgovhkenenergy_efficiencyenergy_end_use_data_and_consumption_indicatorshong_kong_energy_end_use_datadataindexhtml
有關本刊物的查詢請聯絡
機電工程署
香港九龍灣啟成街3號7樓
能源效益事務處 httpswwwemsdgovhktcenergy_efficiencyenergy_end_use_data_and_consumption_indicatorshong_kong_energy_end_use_datadataindexhtml
香港能源最終用途數據收錄之數據可在機電工程署網站下載
電話(852) 2808 3465圖文傳真(852) 2890 6081
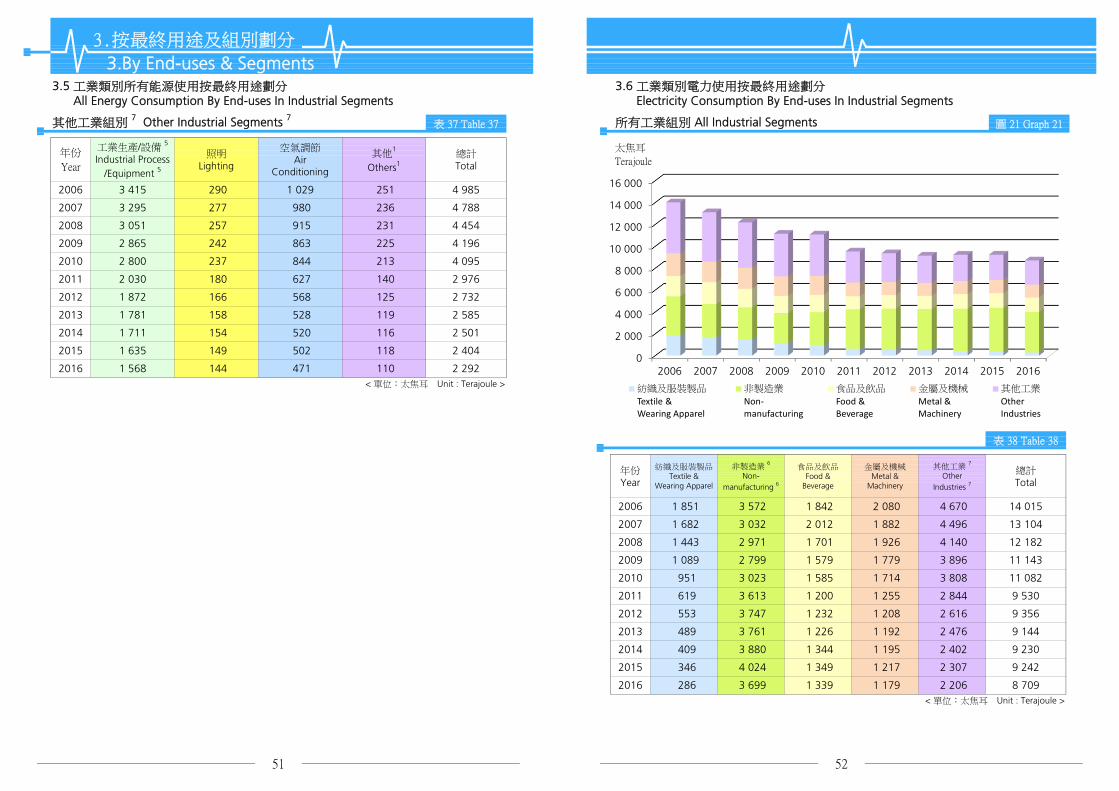
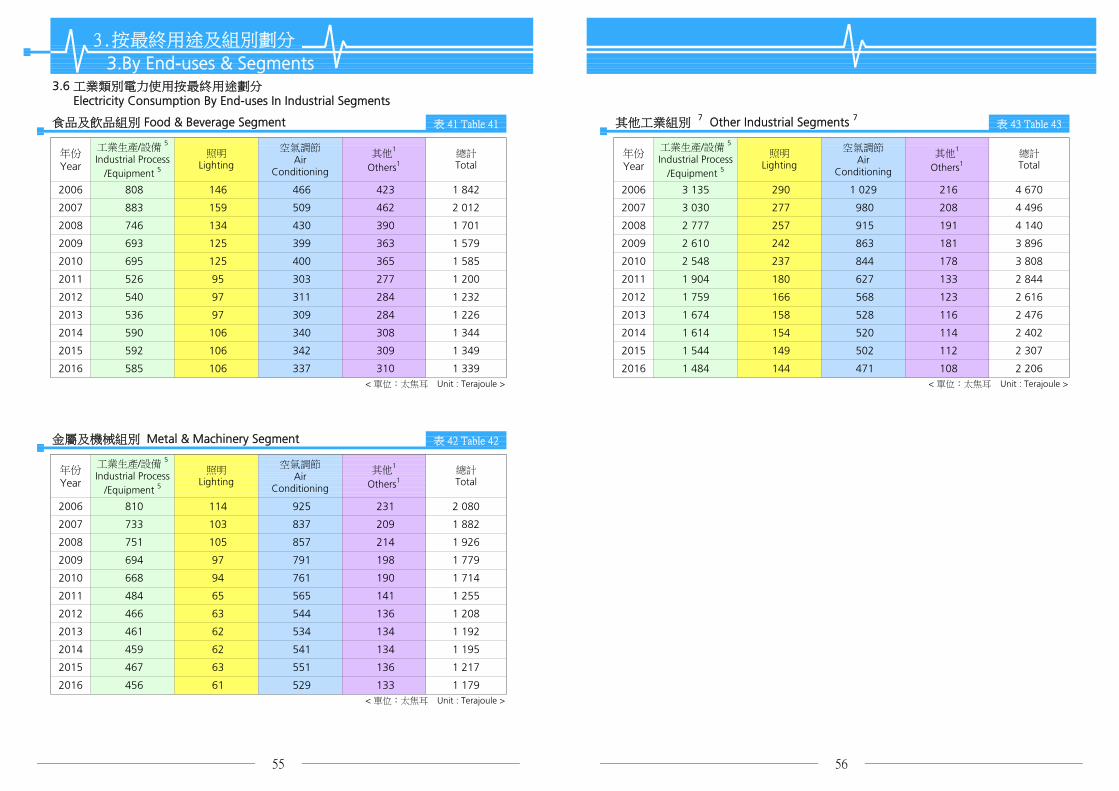
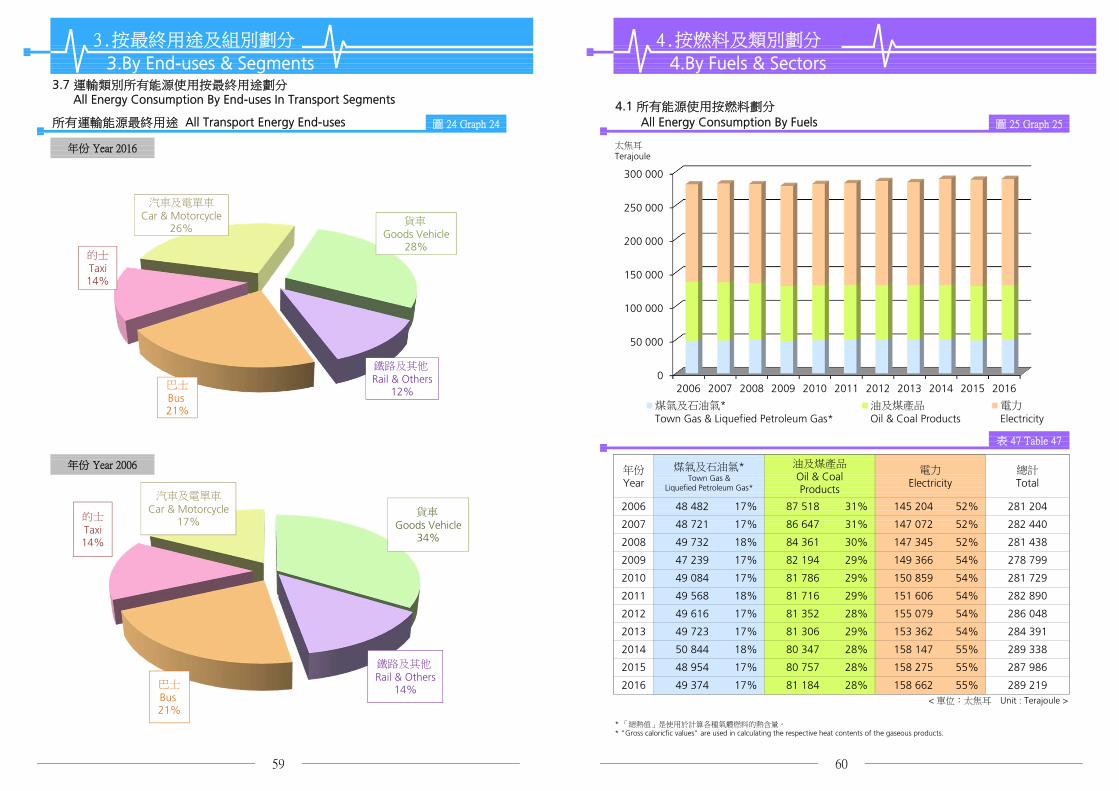
4按燃料及類別劃分
4By Fuels amp Sectors
41 所有能源使用按燃料劃分
All Energy Consumption By Fuels圖 24 Graph 24 圖 25 Graph 25
3按最終用途及組別劃分
3By End-uses amp Segments
所有運輸能源最終用途 All Transport Energy End-uses
37 運輸類別所有能源使用按最終用途劃分 All Energy Consumption By End-uses In Transport Segments
年份 Year 2016 太焦耳Terajoule
表 47 Table 47
年份 Year 2006 年份Year
煤氣及石油氣Town Gas amp
Liquefied Petroleum Gas
油及煤產品Oil amp CoalProducts
電力Electricity
總計Total
2006 48 482 17 87 518 31 145 204 52 281 204 100
2007 48 721 17 86 647 31 147 072 52 282 440 100
52 281 438 100
2009 47 239 17 82 194 29 149 366 54
2008 49 732 18 84 361 30 147 345
278 799 100
2010 49 084 17 81 786 29 150 859 54 281 729 100
2011 49 568 18 81 716 29 151 606 54 282 890 100
54 286 048 100
2013 49 723 17 81 306 29 153 362 54
2012 49 616 17 81 352 28 155 079
284 391 100
2014 50 844 18 80 347 28 158 147 55 289 338 100
2015 48 954 17 80 757 28 158 275 55 287 986 100
59 60
55 289 219 100
lt 單位太焦耳 Unit Terajoule gt
「總熱值」是使用於計算各種氣體燃料的熱含量 Gross caloricfic values are used in calculating the respective heat contents of the gaseous products
2016 49 374 17 81 184 28 158 662
巴士
Bus 21
的士
Taxi14
汽車及電單車
Car amp Motorcycle26
貨車
Goods Vehicle28
鐵路及其他
Rail amp Others12
巴士
Bus 21
的士
Taxi14
汽車及電單車
Car amp Motorcycle17
貨車
Goods Vehicle34
鐵路及其他
Rail amp Others14
0
50 000
100 000
150 000
200 000
250 000
300 000
2006 2007 2008 2009 2010 2011 2012 2013 2014 2015 2016
煤氣及石油氣Town Gas amp Liquefied Petroleum Gas
油及煤產品
Oil amp Coal Products 電力
Electricity
太焦耳Terajoule
太焦耳Terajoule
表 48 Table 48 表 49 Table 49
4按燃料及類別劃分
4By Fuels amp Sectors
43 商業類別按燃料劃分
Commercial Sector By Fuels42 住宅類別按燃料劃分
Residential Sector By Fuels 圖 26 Graph 26 圖 27 Graph 27
煤氣及石油氣Town Gas amp
Liquefied Petroleum Gas
油及煤產品Oil amp CoalProducts
電力Electricity
總計Total
2006 18 476 34 79 0 35 428
年份Year
煤氣及石油氣Town Gas amp
Liquefied Petroleum Gas
油及煤產品Oil amp CoalProducts
電力Electricity
總計Total
年份Year
4 936 4 93 317 83 111 884 10066 53 982 100 2006 13 631 12
83 113 914 10067 54 717 100 2007 13 888 12
2008 18 708 33 41 0 37 100
4 975 4 95 0512007 18 238 33 57 0 36 422
4 739 4 95 543 84 113 753 10066 55 849 100 2008 13 471 12
85 114 297 10068 57 731 100 2009 12 815 11
2010 19 038 33 13 0 39 344
4 753 4 96 7282009 18 736 32 23 0 38 972
4 526 4 97 894 84 116 391 10067 58 396 100 2010 13 971 12
84 118 558 10068 58 826 100 2011 14 161 12
2012 18 736 31 8 0 41 189
4 803 4 99 5942011 18 946 32 8 0 39 872
4 769 4 101 813 84 120 970 10069 59 932 100 2012 14 388 12
84 121 215 10068 58 394 100 2013 14 709 12
2014 18 487 30 8 0 43 415
5 026 4 101 4802013 18 446 32 8 0 39 941
5 156 4 102 627 84 122 711 10070 61 910 100 2014 14 928 12
84 123 674 10070 60 214 100 2015 14 795 12
2016 18 311 30 8 0 43 120
5 186 4 103 6932015 17 838 30 8 0 42 368
5 164 4 103 881 84 123 969 10070 61 439 100 2016 14 924 12lt 單位太焦耳 Unit Terajoule gt lt 單位太焦耳 Unit Terajoule gt
「總熱值」是使用於計算各種氣體燃料的熱含量 Gross caloricfic values are used in calculating the respective heat contents of the gaseous products
「總熱值」是使用於計算各種氣體燃料的熱含量 Gross caloricfic values are used in calculating the respective heat contents of the gaseous products
61 62
0
10 000
20 000
30 000
40 000
50 000
60 000
70 000
2006 2007 2008 2009 2010 2011 2012 2013 2014 2015 2016
煤氣及石油氣Town Gas amp Liquefied Petroleum Gas
油及煤產品
Oil amp Coal Products 電力
Electricity
0
20 000
40 000
60 000
80 000
100 000
120 000
140 000
2006 2007 2008 2009 2010 2011 2012 2013 2014 2015 2016煤氣及石油氣Town Gas amp Liquefied Petroleum Gas
油及煤產品
Oil amp Coal Products 電力
Electricity
太焦耳Terajoule
太焦耳Terajoule
表 50 Table 50 表 51 Table 51
4按燃料及類別劃分
4By Fuels amp Sectors
45 運輸類別按燃料劃分
Transport Sector By Fuels44 工業類別按燃料劃分
Industrial Sector By Fuels 圖 28 Graph 28 圖 29 Graph 29
煤氣及石油氣Town Gas amp
Liquefied Petroleum Gas
油及煤產品Oil amp CoalProducts
電力Electricity
總計Total
2006 926 5 3 994 21 14 015
年份Year
煤氣及石油氣Town Gas amp
Liquefied Petroleum Gas
油及煤產品Oil amp CoalProducts
電力Electricity
總計Total
年份Year
78 510 81 2 444 3 96 404 10074 18 934 100 2006 15 450 16
3 96 165 10074 17 645 100 2007 15 678 16
2008 927 5 4 223 24 12 182
77 992 81 2 4952007 917 5 3 623 21 13 104
75 358 80 2 520 3 94 504 10070 17 332 100 2008 16 627 18
3 90 643 10069 16 129 100 2009 14 765 16
2010 937 6 4 035 25 11 082
73 355 81 2 5232009 923 6 4 063 25 11 143
73 213 81 2 540 3 90 889 10069 16 053 100 2010 15 137 17
3 90 774 10065 14 732 100 2011 15 506 17
2012 1 108 8 4 259 29 9 356
72 659 80 2 6092011 956 6 4 246 29 9 530
72 317 80 2 722 3 90 423 10064 14 723 100 2012 15 384 17
3 90 198 10063 14 583 100 2013 15 348 17
2014 1 244 8 4 244 29 9 230
72 054 80 2 7962013 1 220 8 4 218 29 9 144
70 939 79 2 875 3 89 999 10063 14 718 100 2014 16 185 18
3 89 245 10062 14 853 100 2015 15 048 17
2016 1 171 8 4 112 29 8 709
71 225 80 2 9722015 1 272 9 4 339 29 9 242
71 900 80 2 951 3 89 819 10062 13 992 100 2016 14 967 17lt 單位太焦耳 Unit Terajoule gt lt 單位太焦耳 Unit Terajoule gt
「總熱值」是使用於計算各種氣體燃料的熱含量 Gross caloricfic values are used in calculating the respective heat contents of the gaseous products
「總熱值」是使用於計算各種氣體燃料的熱含量 Gross caloricfic values are used in calculating the respective heat contents of the gaseous products
63 64
0
2 000
4 000
6 000
8 000
10 000
12 000
14 000
16 000
18 000
20 000
2006 2007 2008 2009 2010 2011 2012 2013 2014 2015 2016煤氣及石油氣Town Gas amp Liquefied Petroleum Gas
油及煤產品
Oil amp Coal Products電力
Electricity
0
10 000
20 000
30 000
40 000
50 000
60 000
70 000
80 000
90 000
100 000
2006 2007 2008 2009 2010 2011 2012 2013 2014 2015 2016煤氣及石油氣Town Gas amp Liquefied Petroleum Gas
油及煤產品
Oil amp Coal Products電力
Electricity
47 890 281 204
2007
20 301 13 797 16 267 426
2 506 10 158 49 197 282 440 14 102
46 5022006
19 832
16 465
17 071
5按最終用途及燃料劃分
5By End-uses amp Fuels
51 所有能源使用按最終用途劃分
All Energy Consumption By End-uses
2 454 10 413
15 142 17 059 480
2 529 9 228
7 918 31 836 12 776 32 551 21 608
51 487 278 799 13 131
17 118 463
17 449 465
2008
8 672 52 019 281 729
19 150
2 527 9 680 50 117 281 438
2009
18 971
8 496
9 121
9 244 19 199
2011
18 842 13 373 18 247 436
2 609 8 245 56 161 282 890 13 593 18 879 31 989 14 187 28 010
2012
2013
19 128
2 542
2 722 8 077 58 650 286 048 13 469 19 561 423
424
2010
18 911
19 144
9 213
8 536
8 319
8 199
19 563
19 314
19 662
19 655 44 243 14 181
14 197
13 708
2 796 7 739 58 100 284 391 13 319 21 158 406
2 875 7 705 58 273 289 338
25 534
2015
18 659 14 133 21 085 426
2 972 7 792 58 218 287 986 13 039 21 764 448
2014 25 009
24 782
8 607
8 717
19 609
19 774
48 746
48 466 18 341
2 951 7 474 59 374 289 219
51 所有能源使用按最終用途劃分 All Energy Consumption By End-uses 圖 30 Graph 30
18 918 12 288 22 881 4632016lt 單位太焦耳 Unit Terajoule gt
14 227 24 721 8 562 17 798 47 938 31 785 19 839
年份 Year 2016 年份 Year 2006
65 66
31 989
31 837
31 402
17 734
17 173
17 413
17 117
17 352
17 927
18 177
18 565
14 111 26 941
45 298
43 392
44 117
45 511
44 914
45 861
20 372
18 965
32 885
34 023
33 302
33 379
13 172
13 788
13 824
13 936
31 771
30 438
28 501
28 585
31 772
表 52 Table 52
年份Year
空氣調節Air
Conditioning
工業生產設備5
IndustrialProcessEquipment5
照明Lighting
冷凍Refrigeration
巴士Bus
的士Taxi
汽車Car
電單車Motorcycle
鐵路Rail
船隻Marine
其他1
Others1總計Total
貨車GoodsVehicle
煮食Cooking
熱水Hot Water
空氣調節
AirConditioning
17
煮食
Cooking11
工業生產設備
Industrial ProcessEquipment
6照明
Lighting7
冷凍
Refrigeration3
熱水
Hot Water 5
貨車
GoodsVehicle
9
巴士
Bus 6
的士
Taxi4
汽車及電單車
Car amp Motorcycle8
鐵路
Rail1
船隻
Marine 3
其他
Others20
空氣調節
AirConditioning
17
煮食
Cooking11
工業生產設備
Industrial ProcessEquipment
6照明
Lighting8
冷凍
Refrigeration3
熱水
Hot Water 4貨車
GoodsVehicle12
巴士
Bus 7
的士
Taxi5
汽車及電單車
Car amp Motorcycle6
鐵路
Rail1
船隻
Marine 4
其他
Others17
2006 46 502 21 608 7 918
5按最終用途及燃料劃分
5By End-uses amp Fuels
52 電力使用按最終用途劃分
Electricity Consumption By End-uses 表 53 Table 53
4 191 11 105 2 444 33 317 145 204
年份Year
空氣調節Air Conditioning
照明Lighting
冷凍Refrigeration
熱水Hot Water
辦公室設備Office Equipment
鐵路Rail
工業生產設備5
IndustrialProcessEquipment5
其他1
Others1總計Total
煮食Cooking
2007 45 298 20 372 8 496
5 373 11 246 2 520 35 477 147 345
4 809 11 171 2 495 34 776 147 072
2010 45 511 19 563 9 213
2009 44 117 19 199 9 244
2008 43 392 18 965 9 121
11 0612012 45 861 19 662 8 319
2011 44 914 19 314 8 536 9 201
9 131
10 738
4 715 13 200 2 722 40 408 155 079
4 945 12 615 2 609 38 732 151 606
11 412
11 3312014 48 746 19 609 8 607
2013 44 243 19 655 8 199 9 280
9 415 4 854 13 344 2 875 39 367 158 147
4 904 13 407 2 796 39 466 153 362
2016 47 938 19 839 8 562
2015 48 466 19 774 8 717 11 344 9 553
13 513 2 951 40 363 158 662 11 528 9 044
4 624 13 212 2 972 39 615 158 275
35 815
67 68
150 859
36 644 149 366
9 048
9 722
10 320
9 926
lt 單位太焦耳 Unit Terajoule gt
52 電力使用按最終用途劃分 Electricity Consumption By End-uses 圖 31 Graph 31
年份 Year 2016 年份 Year 2006
4 923
10 016
9 073
9 934
10 929
10 959
11 430 5 015 11 758 2 540
5 274 11 480 2 523
空氣調節Air
Conditioning 30
照明Lighting
13
冷凍Refrigeration
5
工業生產設備Industrial Process
Equipment6
煮食Cooking
7
熱水Hot Water
3辦公室設備
Office Equipment9
鐵路Rail2
其他Others25
空氣調節Air
Conditioning 32
照明Lighting
15
冷凍Refrigeration
5
工業生產設備Industrial Process
Equipment6
煮食Cooking
6
熱水Hot Water
3辦公室設備
Office Equipment8
鐵路Rail2
其他Others23
年份Year
貨車Goods Vehicle
巴士Bus
的士Taxi
5按最終用途及燃料劃分
5By End-uses amp Fuels
53 油及煤產品使用按最終用途劃分
Oil amp Coal Products Consumption By End-uses 表 54 Table 54
汽車Car
電單車Motorcycle
工業生產設備5
Industrial ProcessEquipment5
船隻Marine
其他1
Others1總計Total
87 518
2007 31 770 18 254 2 17 117 463 6 448 10 158 2 434 86 647
2006 32 551 18 647 2 16 266 426 6 508 10 413 2 705
84 361
2009 28 501 17 514 2 17 448 465 6 341 9 228 2 695 82 194
2008 30 438 17 485 2 17 059 480 6 503 9 680 2 713
81 786
2011 28 010 16 997 1 18 879 424 6 926 8 245 2 234 81 716
2010 28 585 17 077 1 18 247 436 6 423 8 672 2 346
81 352
2013 25 534 17 114 1 21 158 406 7 386 7 739 1 969 81 306
2012 26 941 17 212 1 19 560 423 7 074 8 077 2 064
80 347
2015 24 782 16 331 1 21 764 448
7 553 7 474 1 854 81 184
2014 25 009 16 607 1 21 085 426 7 458 7 705 2 056
lt 單位太焦耳 Unit Terajoule gt
53 油及煤產品使用按最終用途劃分
Oil amp Coal Products Consumption By End-uses 圖 32 Graph 32
7 688 7 792 1 953 80 757
2016 24 721 16 239 lt1 22 881 463
年份 Year 2016 年份 Year 2006
69 70
貨車GoodsVehicle31
巴士及的士Bus amp Taxi
20
汽車及電單車Car amp Motorcycle
29
工業生產設備Industrial Process
Equipment9
船隻Marine
9其他
Others2
貨車GoodsVehicle37
巴士及的士Bus amp Taxi
21
汽車及電單車Car amp Motorcycle
19
工業生產設備Industrial Process
Equipment8
船隻Marine
12其他
Others3
年份Year
煮食Cooking
熱水Hot Water
運輸Transport
其他1
Others1總計Total
5按最終用途及燃料劃分
5By End-uses amp Fuels
54 煤氣及石油氣使用按最終用途劃分
Town Gas amp Liquefied Petroleum Gas Consumption By End-uses 表 55 Table 55
2007 22 021 8 363 15 678 2 659 48 721
2006 21 741 8 585 15 450 2 706 48 482
2009 21 390 8 550 14 765 2 534 47 239
2008 22 220 8 415 16 627 2 472 49 732
2011 20 749 9 242 15 506 4 072 49 568
2010 21 244 8 921 15 137 3 782 49 084
2013 20 222 9 277 15 348 4 876 49 723
2012 20 330 9 396 15 384 4 506 49 616
2015 19 767 9 085 15 048 5 054 48 954
2014 20 194 9 342 16 185 5 123 50 844
lt 單位太焦耳 Unit Terajoule gt
54 煤氣及石油氣使用按最終用途劃分 Town Gas amp Liquefied Petroleum Gas Consumption By End-uses 圖 33 Graph 33
年份 Year 2016 年份 Year 2006
2016 19 990 9 304 14 967 5 113 49 374
「總熱值」是使用於計算各種氣體燃料的熱含量 Gross caloricfic values are used in calculating the respective heat contents of the gaseous products
71 72
煮食Cooking
41
熱水Hot Water
19
運輸Transport
30
其他Others10
煮食Cooking
45
熱水Hot Water
18運輸
Transport32
其他Others
5
6 根據已更新的可再生能源數據相關的2010年至2011年能源最終用途數據已在
2013年版中作出修訂[2013年版修訂]The energy end-use data from 2010 to 2011 were revised in the 2013 Edition basedon the latest update of the renewable energy data (Revised in 2013 Edition)
3 根據運輸能源消耗調查所得的數據有關2008年至2012年的能源最終用途數據已
在2015年版中作出修訂[2015年版修訂]The energy end-use data from year 2008 to 2012 were revised in the 2015 Editionbased on the findings of energy consumption survey on the Transport Sector(Revised in 2015 Edition)
4 自2014年版起新的「住宿」「醫療」和「教育」組別已由「其他商業」組別
分拆出來「其他商業」組別因而相應地縮小[2014年版修訂]The Accommodation Human Health and Education Segments weresegregated from the Other Commercial Segment as new segments in the 2014Edition Hence the size of the Other Commercial Segment is accordingly reduced(Revised in 2014 Edition)
5 自2014年版起燃料的熱含量均以「總熱值」計算因而自2002年後的能源數據
均已採用「總熱值」作出計算[2014年版修訂]Since the 2014 Edition Gross Calorific Values are used for calculating the heatcontents of fuels Gross Calorific Values are hence used in computing energy datafrom 2002 onwards (Revised in 2014 Edition)
1 由於資料所限能源數據不能再分拆成其他最終用途數據「其他」的最終用途包
括沒有被列在表上的最終用途
2 自2013年後「空氣調節」「冷凍」「工業生產設備」及「熱水」的能源最終
用途數據已採用「氣溫因素」作出修訂[2017年版修訂]The energy end-use data of Air Conditioning Refrigeration IndustrialProcessEquipment and Hot Water are revised by Temperature Factor fromyear 2013 onwards (Revised in 2017 Edition)
Due to data limitations energy data could not further be broken down into other end-uses The ldquoOthersrdquo end-use includes the end-uses not elsewhere listed in the table
2 「房委會資助出售單位」組別前稱為「居屋計劃」組別
1 根據零售組別能源消耗調查所得的數據有關2011年至2014年的能源最終用途數
據已在2017年版中作出修訂[2017年版修訂]The energy end-use data from year 2011 to 2014 were revised in the 2017 Editionbased on the findings of energy consumption survey on the Retail Segment(Revised in 2017 Edition)
6Notes 7Chronology of Major Revisions7主要修訂年表6註釋
3 「其他房屋」組別包括別墅平房及類似屋宇
The ldquoOther Housingrdquo Segment includes villas bungalows and the like
4 「熱水及冷凍」的最終用途包括鍋爐器材及其他生產加熱和冷凍的設備
The ldquo Non-manufacturing rdquo Segment includes construction and other miscellaneousnon-manufacturing industrial activities
The ldquoHousing Authority Subsidized Sale Flatsrdquo Segment was previously called ldquoHomeOwnershiprdquo Segment
The ldquo Hot Water amp Refrigeration rdquo end-use includes boiling equipments and otherprocess heating and cooling facilities
「工業生產設備」的最終用途包括鍋爐設備及其他生產加熱和冷凍設備的使用
The ldquoOther Industrialrdquo Segment includes electronics paper printing plastic and othermiscellaneous industrial activities
73
The ldquo GDP in chained dollars rdquo were revised based on latest data published by theCensus and Statisics Department
8 ldquo本地生產總值環比物量計算rdquo己根據政府統計處最新數據作出修訂
74
7 「其他工業」組別包括電子紙張印刷塑膠及其他雜項工業活動
The ldquo Industrial ProcessEquipment rdquo end-use includes boiler plants and other processheating and cooling facilities
6 「非製造業」組別包括建造及其他非製造業之雜項工業活動
5
7主要修訂年表
13 自2010年起「電力」包括燃煤天然氣風能及太陽能所產生的電能[2012年版修訂]ldquoElectricityrdquoincludes the electricity generated from coal natural gas wind and solarpower since 2010 (Revised in 2012 Edition)
14 根據工業能源消耗調查所得的數據有關2000年至2010年的能源最終用途數據已
在2012年版中作出修訂[2012年版修訂]The energy end-use data from year 2000 to 2010 were revised in the 2012 Editionbased on the findings of energy consumption survey on the Industrial Sector(Revised in 2012 Edition)
自2013年版起「煮食」之能源最終用途除已包括煮食爐及飯煲外再加上在廚房
普遍用作製造及準備食物的器具例如煮食用水加熱設備電焗爐及微波爐等
自2001年後的「煮食」之能源最終用途數據均作出修訂[2013年版修訂]The ldquo Cooking rdquo energy end-use was revised in the 2013 Edition to include foodmaking and preparation appliances normally found in kitchens in addition to stovesand rice cookers Examples of the appliances are hot water for cooking purposeselectric ovens and microwave ovens etc The ldquoCookingrdquo energy end-use data since2001 were hence updated (Revised in 2013 Edition)
自2011年「商業」及「工業」類別的分類已經根據香港標準行業分類20版作出
修訂這修訂包括將個人服務活動(例如夜總會卡拉OK電腦及通訊設施維
修家居用品維修車輛維修服務藝術表演或創作活動及出版服務)由以往的
「食肆」「其他商業」組別或「工業」類別重置到現時的「零售」組別其同
時涵蓋零售及個人服務活動[2013年版修訂]The ldquoCommercialrdquo and ldquoIndustrialldquo Sectors were re-categorized in 2011 to alignwith the Hong Kong Standard Industrial Classification (HSIC) Version 20Examples of such changes are the relocations of personal service activities (such asnight clubs karaokes computer and communication repair household goodsrepair motor vehicle repair services art performance or creation activities andpublishing services etc) from the previous ldquo Restaurant ldquo Other CommercialSegments or the rdquoIndustrialrdquo Sector to the present ldquoRetailrdquo Segment which nowembraces both retail and personal service activities (Revised in 2013 Edition)
12 自2010年的能源最終用途數據包括可再生能源數據[2012年版修訂]The energy end-use data from 2010 includes renewable energy data(Revised in 2012 Edition)
11
75 76
7Chronology of Major Revisions
8 自2013年版起「空氣調節」之能源最終用途除已包括冷氣設備及暖氣機外再加
上風扇空氣清新或淨化器及抽濕機 自2001年後的「空氣調節」之能源最終用
途數據均作出修訂[2013年版修訂]The ldquoAir Conditioningrdquo energy end-use was revised in the 2013 Edition to includefans air cleanerpurifiers and dehumidifiers in addition to air conditioning unitsand heaters The ldquoAir Conditioningrdquo energy end-use data since 2001 were henceupdated (Revised in 2013 Edition)
9 自2013年版起「辦公室設備」之能源最終用途除已包括電腦及影印機外再加上
視聽器材碎紙機傳真及收銀機自2001年後的「辦公室設備」之能源最終用
途數據均作出修訂[2013年版修訂]The ldquoOffice Equipmentrdquo energy end-use was revised in the 2013 Edition to includeaudio visual equipments shredders fax and cashier machines etc in addition tocomputers and photocopiers The ldquoOffice Equipmentrdquo energy end-use data since2001 were hence updated (Revised in 2013 Edition)
10 根據住宅能源消耗調查所得的數據有關2009年至2011年的能源最終用途數據已
在2013年版中作出修訂[2013年版修訂]The energy end-use data from year 2009 to 2011 were revised in the 2013 Editionbased on the findings of energy consumption survey on the Residential Sector(Revised in 2013 Edition)
15 根據政府統計處公佈的人口及家庭住戶統計修訂數字有關2007至2010年的能源
最終用途數據己在2012年版中作出相應的修訂[2012年版修訂]The energy end-use data from years 2007 to 2010 were revised in the 2012 Editionbased on the revised population and domestic household data published by theCensus and Statistics Department (Revised in 2012 Edition)
7
17 根據政府統計處公佈的家庭住戶統計修訂數字有關2001至2006年的能源最終用
途數據己在2009年版中作出修訂[2009年版修訂]The energy end-use data from years 2001 to 2006 were revised in the 2009 Editionbased on the revised domestic household data published by the Census and StatisticsDepartment (Revised in 2009 Edition)
18 自2006年起「鐵路」之能源最終用途再不包括鐵路車站等建築物使用的電量
[2008年版修訂]The ldquoRailrdquo energy end-use do not include electricity consumption at railway stationsfrom 2006 onwards (Revised in 2008 Edition)
16 根據商業及運輸能源消耗調查所得的數據有關2003年至2007年的能源最終用途
數據已在2010年版中作出修訂[2010年版修訂]The energy end-use data from year 2003 to 2007 were revised in the 2010 Editionbased on the findings of energy consumption survey on the Commercial andTransport Sectors (Revised in 2010 Edition)
7Chronology of Major Revisions 8Units of Measurement7主要修訂年表 8計量單位
1 太焦耳 = 1012 焦耳 1 terajoule (TJ) = 1012 joules
1 千兆焦耳 = 109 焦耳 1 gigajoule (GJ) = 109 joules
1 百萬焦耳 = 106 焦耳 1 megajoule (MJ) = 106 joules
77 78
1 千兆瓦小時 = 36 x 1012 焦耳 1 gigawatt hour (GWh) = 36 x 1012 joules
1 兆瓦小時 = 36 x 109 焦耳 1 megawatt hour (MWh) = 36 x 109 joules
1 千瓦小時 = 36 x 106 焦耳 1 kilowatt hour (kWh) = 36 x 106 joules
網址 httpwwwemsdgovhk電郵 energydataemsdgovhk
79 80
Enquiries about this publication can be directed to
The Energy Efficiency OfficeElectrical amp Mechanical Services Department
7F 3 Kai Shing Street Kowloon Bay Hong Kong
Tel No (852) 2808 3465Fax No (852) 2890 6081
Homepage httpwwwemsdgovhkE-mail energydataemsdgovhk
Set of Hong Kong Energy End-use Data can be downloadedfrom EMSD website
httpswwwemsdgovhkenenergy_efficiencyenergy_end_use_data_and_consumption_indicatorshong_kong_energy_end_use_datadataindexhtml
有關本刊物的查詢請聯絡
機電工程署
香港九龍灣啟成街3號7樓
能源效益事務處 httpswwwemsdgovhktcenergy_efficiencyenergy_end_use_data_and_consumption_indicatorshong_kong_energy_end_use_datadataindexhtml
香港能源最終用途數據收錄之數據可在機電工程署網站下載
電話(852) 2808 3465圖文傳真(852) 2890 6081
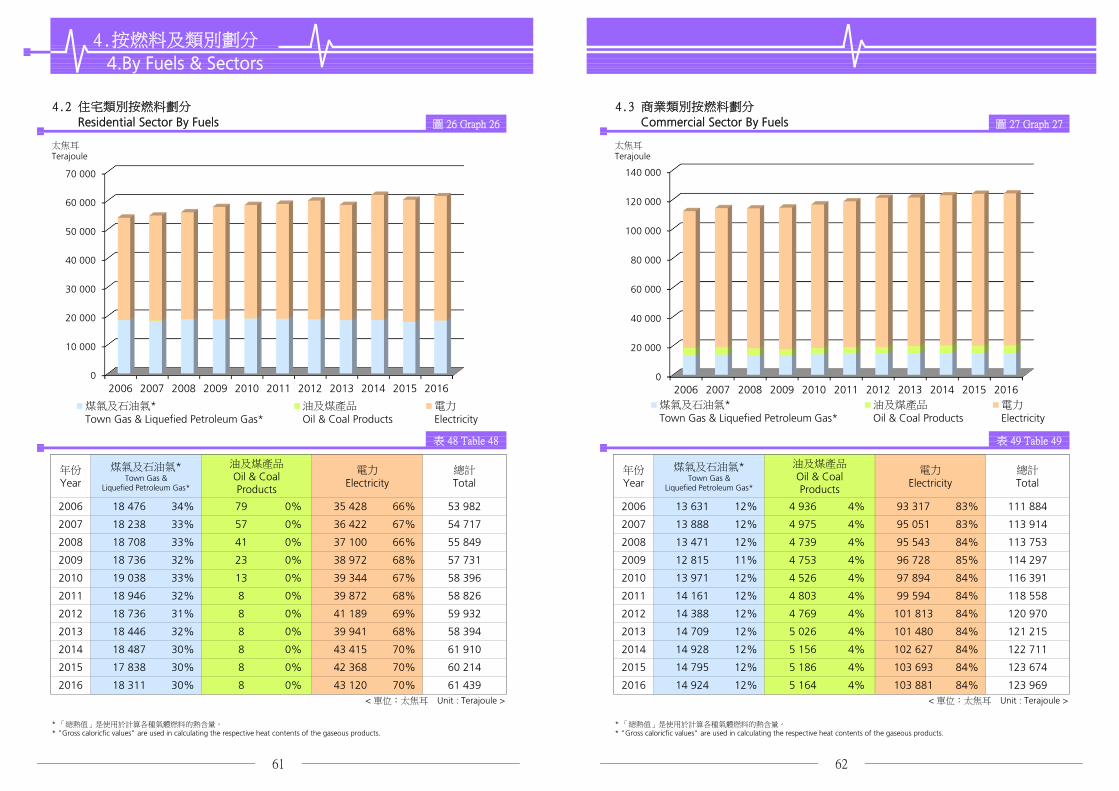
太焦耳Terajoule
太焦耳Terajoule
表 48 Table 48 表 49 Table 49
4按燃料及類別劃分
4By Fuels amp Sectors
43 商業類別按燃料劃分
Commercial Sector By Fuels42 住宅類別按燃料劃分
Residential Sector By Fuels 圖 26 Graph 26 圖 27 Graph 27
煤氣及石油氣Town Gas amp
Liquefied Petroleum Gas
油及煤產品Oil amp CoalProducts
電力Electricity
總計Total
2006 18 476 34 79 0 35 428
年份Year
煤氣及石油氣Town Gas amp
Liquefied Petroleum Gas
油及煤產品Oil amp CoalProducts
電力Electricity
總計Total
年份Year
4 936 4 93 317 83 111 884 10066 53 982 100 2006 13 631 12
83 113 914 10067 54 717 100 2007 13 888 12
2008 18 708 33 41 0 37 100
4 975 4 95 0512007 18 238 33 57 0 36 422
4 739 4 95 543 84 113 753 10066 55 849 100 2008 13 471 12
85 114 297 10068 57 731 100 2009 12 815 11
2010 19 038 33 13 0 39 344
4 753 4 96 7282009 18 736 32 23 0 38 972
4 526 4 97 894 84 116 391 10067 58 396 100 2010 13 971 12
84 118 558 10068 58 826 100 2011 14 161 12
2012 18 736 31 8 0 41 189
4 803 4 99 5942011 18 946 32 8 0 39 872
4 769 4 101 813 84 120 970 10069 59 932 100 2012 14 388 12
84 121 215 10068 58 394 100 2013 14 709 12
2014 18 487 30 8 0 43 415
5 026 4 101 4802013 18 446 32 8 0 39 941
5 156 4 102 627 84 122 711 10070 61 910 100 2014 14 928 12
84 123 674 10070 60 214 100 2015 14 795 12
2016 18 311 30 8 0 43 120
5 186 4 103 6932015 17 838 30 8 0 42 368
5 164 4 103 881 84 123 969 10070 61 439 100 2016 14 924 12lt 單位太焦耳 Unit Terajoule gt lt 單位太焦耳 Unit Terajoule gt
「總熱值」是使用於計算各種氣體燃料的熱含量 Gross caloricfic values are used in calculating the respective heat contents of the gaseous products
「總熱值」是使用於計算各種氣體燃料的熱含量 Gross caloricfic values are used in calculating the respective heat contents of the gaseous products
61 62
0
10 000
20 000
30 000
40 000
50 000
60 000
70 000
2006 2007 2008 2009 2010 2011 2012 2013 2014 2015 2016
煤氣及石油氣Town Gas amp Liquefied Petroleum Gas
油及煤產品
Oil amp Coal Products 電力
Electricity
0
20 000
40 000
60 000
80 000
100 000
120 000
140 000
2006 2007 2008 2009 2010 2011 2012 2013 2014 2015 2016煤氣及石油氣Town Gas amp Liquefied Petroleum Gas
油及煤產品
Oil amp Coal Products 電力
Electricity
太焦耳Terajoule
太焦耳Terajoule
表 50 Table 50 表 51 Table 51
4按燃料及類別劃分
4By Fuels amp Sectors
45 運輸類別按燃料劃分
Transport Sector By Fuels44 工業類別按燃料劃分
Industrial Sector By Fuels 圖 28 Graph 28 圖 29 Graph 29
煤氣及石油氣Town Gas amp
Liquefied Petroleum Gas
油及煤產品Oil amp CoalProducts
電力Electricity
總計Total
2006 926 5 3 994 21 14 015
年份Year
煤氣及石油氣Town Gas amp
Liquefied Petroleum Gas
油及煤產品Oil amp CoalProducts
電力Electricity
總計Total
年份Year
78 510 81 2 444 3 96 404 10074 18 934 100 2006 15 450 16
3 96 165 10074 17 645 100 2007 15 678 16
2008 927 5 4 223 24 12 182
77 992 81 2 4952007 917 5 3 623 21 13 104
75 358 80 2 520 3 94 504 10070 17 332 100 2008 16 627 18
3 90 643 10069 16 129 100 2009 14 765 16
2010 937 6 4 035 25 11 082
73 355 81 2 5232009 923 6 4 063 25 11 143
73 213 81 2 540 3 90 889 10069 16 053 100 2010 15 137 17
3 90 774 10065 14 732 100 2011 15 506 17
2012 1 108 8 4 259 29 9 356
72 659 80 2 6092011 956 6 4 246 29 9 530
72 317 80 2 722 3 90 423 10064 14 723 100 2012 15 384 17
3 90 198 10063 14 583 100 2013 15 348 17
2014 1 244 8 4 244 29 9 230
72 054 80 2 7962013 1 220 8 4 218 29 9 144
70 939 79 2 875 3 89 999 10063 14 718 100 2014 16 185 18
3 89 245 10062 14 853 100 2015 15 048 17
2016 1 171 8 4 112 29 8 709
71 225 80 2 9722015 1 272 9 4 339 29 9 242
71 900 80 2 951 3 89 819 10062 13 992 100 2016 14 967 17lt 單位太焦耳 Unit Terajoule gt lt 單位太焦耳 Unit Terajoule gt
「總熱值」是使用於計算各種氣體燃料的熱含量 Gross caloricfic values are used in calculating the respective heat contents of the gaseous products
「總熱值」是使用於計算各種氣體燃料的熱含量 Gross caloricfic values are used in calculating the respective heat contents of the gaseous products
63 64
0
2 000
4 000
6 000
8 000
10 000
12 000
14 000
16 000
18 000
20 000
2006 2007 2008 2009 2010 2011 2012 2013 2014 2015 2016煤氣及石油氣Town Gas amp Liquefied Petroleum Gas
油及煤產品
Oil amp Coal Products電力
Electricity
0
10 000
20 000
30 000
40 000
50 000
60 000
70 000
80 000
90 000
100 000
2006 2007 2008 2009 2010 2011 2012 2013 2014 2015 2016煤氣及石油氣Town Gas amp Liquefied Petroleum Gas
油及煤產品
Oil amp Coal Products電力
Electricity
47 890 281 204
2007
20 301 13 797 16 267 426
2 506 10 158 49 197 282 440 14 102
46 5022006
19 832
16 465
17 071
5按最終用途及燃料劃分
5By End-uses amp Fuels
51 所有能源使用按最終用途劃分
All Energy Consumption By End-uses
2 454 10 413
15 142 17 059 480
2 529 9 228
7 918 31 836 12 776 32 551 21 608
51 487 278 799 13 131
17 118 463
17 449 465
2008
8 672 52 019 281 729
19 150
2 527 9 680 50 117 281 438
2009
18 971
8 496
9 121
9 244 19 199
2011
18 842 13 373 18 247 436
2 609 8 245 56 161 282 890 13 593 18 879 31 989 14 187 28 010
2012
2013
19 128
2 542
2 722 8 077 58 650 286 048 13 469 19 561 423
424
2010
18 911
19 144
9 213
8 536
8 319
8 199
19 563
19 314
19 662
19 655 44 243 14 181
14 197
13 708
2 796 7 739 58 100 284 391 13 319 21 158 406
2 875 7 705 58 273 289 338
25 534
2015
18 659 14 133 21 085 426
2 972 7 792 58 218 287 986 13 039 21 764 448
2014 25 009
24 782
8 607
8 717
19 609
19 774
48 746
48 466 18 341
2 951 7 474 59 374 289 219
51 所有能源使用按最終用途劃分 All Energy Consumption By End-uses 圖 30 Graph 30
18 918 12 288 22 881 4632016lt 單位太焦耳 Unit Terajoule gt
14 227 24 721 8 562 17 798 47 938 31 785 19 839
年份 Year 2016 年份 Year 2006
65 66
31 989
31 837
31 402
17 734
17 173
17 413
17 117
17 352
17 927
18 177
18 565
14 111 26 941
45 298
43 392
44 117
45 511
44 914
45 861
20 372
18 965
32 885
34 023
33 302
33 379
13 172
13 788
13 824
13 936
31 771
30 438
28 501
28 585
31 772
表 52 Table 52
年份Year
空氣調節Air
Conditioning
工業生產設備5
IndustrialProcessEquipment5
照明Lighting
冷凍Refrigeration
巴士Bus
的士Taxi
汽車Car
電單車Motorcycle
鐵路Rail
船隻Marine
其他1
Others1總計Total
貨車GoodsVehicle
煮食Cooking
熱水Hot Water
空氣調節
AirConditioning
17
煮食
Cooking11
工業生產設備
Industrial ProcessEquipment
6照明
Lighting7
冷凍
Refrigeration3
熱水
Hot Water 5
貨車
GoodsVehicle
9
巴士
Bus 6
的士
Taxi4
汽車及電單車
Car amp Motorcycle8
鐵路
Rail1
船隻
Marine 3
其他
Others20
空氣調節
AirConditioning
17
煮食
Cooking11
工業生產設備
Industrial ProcessEquipment
6照明
Lighting8
冷凍
Refrigeration3
熱水
Hot Water 4貨車
GoodsVehicle12
巴士
Bus 7
的士
Taxi5
汽車及電單車
Car amp Motorcycle6
鐵路
Rail1
船隻
Marine 4
其他
Others17
2006 46 502 21 608 7 918
5按最終用途及燃料劃分
5By End-uses amp Fuels
52 電力使用按最終用途劃分
Electricity Consumption By End-uses 表 53 Table 53
4 191 11 105 2 444 33 317 145 204
年份Year
空氣調節Air Conditioning
照明Lighting
冷凍Refrigeration
熱水Hot Water
辦公室設備Office Equipment
鐵路Rail
工業生產設備5
IndustrialProcessEquipment5
其他1
Others1總計Total
煮食Cooking
2007 45 298 20 372 8 496
5 373 11 246 2 520 35 477 147 345
4 809 11 171 2 495 34 776 147 072
2010 45 511 19 563 9 213
2009 44 117 19 199 9 244
2008 43 392 18 965 9 121
11 0612012 45 861 19 662 8 319
2011 44 914 19 314 8 536 9 201
9 131
10 738
4 715 13 200 2 722 40 408 155 079
4 945 12 615 2 609 38 732 151 606
11 412
11 3312014 48 746 19 609 8 607
2013 44 243 19 655 8 199 9 280
9 415 4 854 13 344 2 875 39 367 158 147
4 904 13 407 2 796 39 466 153 362
2016 47 938 19 839 8 562
2015 48 466 19 774 8 717 11 344 9 553
13 513 2 951 40 363 158 662 11 528 9 044
4 624 13 212 2 972 39 615 158 275
35 815
67 68
150 859
36 644 149 366
9 048
9 722
10 320
9 926
lt 單位太焦耳 Unit Terajoule gt
52 電力使用按最終用途劃分 Electricity Consumption By End-uses 圖 31 Graph 31
年份 Year 2016 年份 Year 2006
4 923
10 016
9 073
9 934
10 929
10 959
11 430 5 015 11 758 2 540
5 274 11 480 2 523
空氣調節Air
Conditioning 30
照明Lighting
13
冷凍Refrigeration
5
工業生產設備Industrial Process
Equipment6
煮食Cooking
7
熱水Hot Water
3辦公室設備
Office Equipment9
鐵路Rail2
其他Others25
空氣調節Air
Conditioning 32
照明Lighting
15
冷凍Refrigeration
5
工業生產設備Industrial Process
Equipment6
煮食Cooking
6
熱水Hot Water
3辦公室設備
Office Equipment8
鐵路Rail2
其他Others23
年份Year
貨車Goods Vehicle
巴士Bus
的士Taxi
5按最終用途及燃料劃分
5By End-uses amp Fuels
53 油及煤產品使用按最終用途劃分
Oil amp Coal Products Consumption By End-uses 表 54 Table 54
汽車Car
電單車Motorcycle
工業生產設備5
Industrial ProcessEquipment5
船隻Marine
其他1
Others1總計Total
87 518
2007 31 770 18 254 2 17 117 463 6 448 10 158 2 434 86 647
2006 32 551 18 647 2 16 266 426 6 508 10 413 2 705
84 361
2009 28 501 17 514 2 17 448 465 6 341 9 228 2 695 82 194
2008 30 438 17 485 2 17 059 480 6 503 9 680 2 713
81 786
2011 28 010 16 997 1 18 879 424 6 926 8 245 2 234 81 716
2010 28 585 17 077 1 18 247 436 6 423 8 672 2 346
81 352
2013 25 534 17 114 1 21 158 406 7 386 7 739 1 969 81 306
2012 26 941 17 212 1 19 560 423 7 074 8 077 2 064
80 347
2015 24 782 16 331 1 21 764 448
7 553 7 474 1 854 81 184
2014 25 009 16 607 1 21 085 426 7 458 7 705 2 056
lt 單位太焦耳 Unit Terajoule gt
53 油及煤產品使用按最終用途劃分
Oil amp Coal Products Consumption By End-uses 圖 32 Graph 32
7 688 7 792 1 953 80 757
2016 24 721 16 239 lt1 22 881 463
年份 Year 2016 年份 Year 2006
69 70
貨車GoodsVehicle31
巴士及的士Bus amp Taxi
20
汽車及電單車Car amp Motorcycle
29
工業生產設備Industrial Process
Equipment9
船隻Marine
9其他
Others2
貨車GoodsVehicle37
巴士及的士Bus amp Taxi
21
汽車及電單車Car amp Motorcycle
19
工業生產設備Industrial Process
Equipment8
船隻Marine
12其他
Others3
年份Year
煮食Cooking
熱水Hot Water
運輸Transport
其他1
Others1總計Total
5按最終用途及燃料劃分
5By End-uses amp Fuels
54 煤氣及石油氣使用按最終用途劃分
Town Gas amp Liquefied Petroleum Gas Consumption By End-uses 表 55 Table 55
2007 22 021 8 363 15 678 2 659 48 721
2006 21 741 8 585 15 450 2 706 48 482
2009 21 390 8 550 14 765 2 534 47 239
2008 22 220 8 415 16 627 2 472 49 732
2011 20 749 9 242 15 506 4 072 49 568
2010 21 244 8 921 15 137 3 782 49 084
2013 20 222 9 277 15 348 4 876 49 723
2012 20 330 9 396 15 384 4 506 49 616
2015 19 767 9 085 15 048 5 054 48 954
2014 20 194 9 342 16 185 5 123 50 844
lt 單位太焦耳 Unit Terajoule gt
54 煤氣及石油氣使用按最終用途劃分 Town Gas amp Liquefied Petroleum Gas Consumption By End-uses 圖 33 Graph 33
年份 Year 2016 年份 Year 2006
2016 19 990 9 304 14 967 5 113 49 374
「總熱值」是使用於計算各種氣體燃料的熱含量 Gross caloricfic values are used in calculating the respective heat contents of the gaseous products
71 72
煮食Cooking
41
熱水Hot Water
19
運輸Transport
30
其他Others10
煮食Cooking
45
熱水Hot Water
18運輸
Transport32
其他Others
5
6 根據已更新的可再生能源數據相關的2010年至2011年能源最終用途數據已在
2013年版中作出修訂[2013年版修訂]The energy end-use data from 2010 to 2011 were revised in the 2013 Edition basedon the latest update of the renewable energy data (Revised in 2013 Edition)
3 根據運輸能源消耗調查所得的數據有關2008年至2012年的能源最終用途數據已
在2015年版中作出修訂[2015年版修訂]The energy end-use data from year 2008 to 2012 were revised in the 2015 Editionbased on the findings of energy consumption survey on the Transport Sector(Revised in 2015 Edition)
4 自2014年版起新的「住宿」「醫療」和「教育」組別已由「其他商業」組別
分拆出來「其他商業」組別因而相應地縮小[2014年版修訂]The Accommodation Human Health and Education Segments weresegregated from the Other Commercial Segment as new segments in the 2014Edition Hence the size of the Other Commercial Segment is accordingly reduced(Revised in 2014 Edition)
5 自2014年版起燃料的熱含量均以「總熱值」計算因而自2002年後的能源數據
均已採用「總熱值」作出計算[2014年版修訂]Since the 2014 Edition Gross Calorific Values are used for calculating the heatcontents of fuels Gross Calorific Values are hence used in computing energy datafrom 2002 onwards (Revised in 2014 Edition)
1 由於資料所限能源數據不能再分拆成其他最終用途數據「其他」的最終用途包
括沒有被列在表上的最終用途
2 自2013年後「空氣調節」「冷凍」「工業生產設備」及「熱水」的能源最終
用途數據已採用「氣溫因素」作出修訂[2017年版修訂]The energy end-use data of Air Conditioning Refrigeration IndustrialProcessEquipment and Hot Water are revised by Temperature Factor fromyear 2013 onwards (Revised in 2017 Edition)
Due to data limitations energy data could not further be broken down into other end-uses The ldquoOthersrdquo end-use includes the end-uses not elsewhere listed in the table
2 「房委會資助出售單位」組別前稱為「居屋計劃」組別
1 根據零售組別能源消耗調查所得的數據有關2011年至2014年的能源最終用途數
據已在2017年版中作出修訂[2017年版修訂]The energy end-use data from year 2011 to 2014 were revised in the 2017 Editionbased on the findings of energy consumption survey on the Retail Segment(Revised in 2017 Edition)
6Notes 7Chronology of Major Revisions7主要修訂年表6註釋
3 「其他房屋」組別包括別墅平房及類似屋宇
The ldquoOther Housingrdquo Segment includes villas bungalows and the like
4 「熱水及冷凍」的最終用途包括鍋爐器材及其他生產加熱和冷凍的設備
The ldquo Non-manufacturing rdquo Segment includes construction and other miscellaneousnon-manufacturing industrial activities
The ldquoHousing Authority Subsidized Sale Flatsrdquo Segment was previously called ldquoHomeOwnershiprdquo Segment
The ldquo Hot Water amp Refrigeration rdquo end-use includes boiling equipments and otherprocess heating and cooling facilities
「工業生產設備」的最終用途包括鍋爐設備及其他生產加熱和冷凍設備的使用
The ldquoOther Industrialrdquo Segment includes electronics paper printing plastic and othermiscellaneous industrial activities
73
The ldquo GDP in chained dollars rdquo were revised based on latest data published by theCensus and Statisics Department
8 ldquo本地生產總值環比物量計算rdquo己根據政府統計處最新數據作出修訂
74
7 「其他工業」組別包括電子紙張印刷塑膠及其他雜項工業活動
The ldquo Industrial ProcessEquipment rdquo end-use includes boiler plants and other processheating and cooling facilities
6 「非製造業」組別包括建造及其他非製造業之雜項工業活動
5
7主要修訂年表
13 自2010年起「電力」包括燃煤天然氣風能及太陽能所產生的電能[2012年版修訂]ldquoElectricityrdquoincludes the electricity generated from coal natural gas wind and solarpower since 2010 (Revised in 2012 Edition)
14 根據工業能源消耗調查所得的數據有關2000年至2010年的能源最終用途數據已
在2012年版中作出修訂[2012年版修訂]The energy end-use data from year 2000 to 2010 were revised in the 2012 Editionbased on the findings of energy consumption survey on the Industrial Sector(Revised in 2012 Edition)
自2013年版起「煮食」之能源最終用途除已包括煮食爐及飯煲外再加上在廚房
普遍用作製造及準備食物的器具例如煮食用水加熱設備電焗爐及微波爐等
自2001年後的「煮食」之能源最終用途數據均作出修訂[2013年版修訂]The ldquo Cooking rdquo energy end-use was revised in the 2013 Edition to include foodmaking and preparation appliances normally found in kitchens in addition to stovesand rice cookers Examples of the appliances are hot water for cooking purposeselectric ovens and microwave ovens etc The ldquoCookingrdquo energy end-use data since2001 were hence updated (Revised in 2013 Edition)
自2011年「商業」及「工業」類別的分類已經根據香港標準行業分類20版作出
修訂這修訂包括將個人服務活動(例如夜總會卡拉OK電腦及通訊設施維
修家居用品維修車輛維修服務藝術表演或創作活動及出版服務)由以往的
「食肆」「其他商業」組別或「工業」類別重置到現時的「零售」組別其同
時涵蓋零售及個人服務活動[2013年版修訂]The ldquoCommercialrdquo and ldquoIndustrialldquo Sectors were re-categorized in 2011 to alignwith the Hong Kong Standard Industrial Classification (HSIC) Version 20Examples of such changes are the relocations of personal service activities (such asnight clubs karaokes computer and communication repair household goodsrepair motor vehicle repair services art performance or creation activities andpublishing services etc) from the previous ldquo Restaurant ldquo Other CommercialSegments or the rdquoIndustrialrdquo Sector to the present ldquoRetailrdquo Segment which nowembraces both retail and personal service activities (Revised in 2013 Edition)
12 自2010年的能源最終用途數據包括可再生能源數據[2012年版修訂]The energy end-use data from 2010 includes renewable energy data(Revised in 2012 Edition)
11
75 76
7Chronology of Major Revisions
8 自2013年版起「空氣調節」之能源最終用途除已包括冷氣設備及暖氣機外再加
上風扇空氣清新或淨化器及抽濕機 自2001年後的「空氣調節」之能源最終用
途數據均作出修訂[2013年版修訂]The ldquoAir Conditioningrdquo energy end-use was revised in the 2013 Edition to includefans air cleanerpurifiers and dehumidifiers in addition to air conditioning unitsand heaters The ldquoAir Conditioningrdquo energy end-use data since 2001 were henceupdated (Revised in 2013 Edition)
9 自2013年版起「辦公室設備」之能源最終用途除已包括電腦及影印機外再加上
視聽器材碎紙機傳真及收銀機自2001年後的「辦公室設備」之能源最終用
途數據均作出修訂[2013年版修訂]The ldquoOffice Equipmentrdquo energy end-use was revised in the 2013 Edition to includeaudio visual equipments shredders fax and cashier machines etc in addition tocomputers and photocopiers The ldquoOffice Equipmentrdquo energy end-use data since2001 were hence updated (Revised in 2013 Edition)
10 根據住宅能源消耗調查所得的數據有關2009年至2011年的能源最終用途數據已
在2013年版中作出修訂[2013年版修訂]The energy end-use data from year 2009 to 2011 were revised in the 2013 Editionbased on the findings of energy consumption survey on the Residential Sector(Revised in 2013 Edition)
15 根據政府統計處公佈的人口及家庭住戶統計修訂數字有關2007至2010年的能源
最終用途數據己在2012年版中作出相應的修訂[2012年版修訂]The energy end-use data from years 2007 to 2010 were revised in the 2012 Editionbased on the revised population and domestic household data published by theCensus and Statistics Department (Revised in 2012 Edition)
7
17 根據政府統計處公佈的家庭住戶統計修訂數字有關2001至2006年的能源最終用
途數據己在2009年版中作出修訂[2009年版修訂]The energy end-use data from years 2001 to 2006 were revised in the 2009 Editionbased on the revised domestic household data published by the Census and StatisticsDepartment (Revised in 2009 Edition)
18 自2006年起「鐵路」之能源最終用途再不包括鐵路車站等建築物使用的電量
[2008年版修訂]The ldquoRailrdquo energy end-use do not include electricity consumption at railway stationsfrom 2006 onwards (Revised in 2008 Edition)
16 根據商業及運輸能源消耗調查所得的數據有關2003年至2007年的能源最終用途
數據已在2010年版中作出修訂[2010年版修訂]The energy end-use data from year 2003 to 2007 were revised in the 2010 Editionbased on the findings of energy consumption survey on the Commercial andTransport Sectors (Revised in 2010 Edition)
7Chronology of Major Revisions 8Units of Measurement7主要修訂年表 8計量單位
1 太焦耳 = 1012 焦耳 1 terajoule (TJ) = 1012 joules
1 千兆焦耳 = 109 焦耳 1 gigajoule (GJ) = 109 joules
1 百萬焦耳 = 106 焦耳 1 megajoule (MJ) = 106 joules
77 78
1 千兆瓦小時 = 36 x 1012 焦耳 1 gigawatt hour (GWh) = 36 x 1012 joules
1 兆瓦小時 = 36 x 109 焦耳 1 megawatt hour (MWh) = 36 x 109 joules
1 千瓦小時 = 36 x 106 焦耳 1 kilowatt hour (kWh) = 36 x 106 joules
網址 httpwwwemsdgovhk電郵 energydataemsdgovhk
79 80
Enquiries about this publication can be directed to
The Energy Efficiency OfficeElectrical amp Mechanical Services Department
7F 3 Kai Shing Street Kowloon Bay Hong Kong
Tel No (852) 2808 3465Fax No (852) 2890 6081
Homepage httpwwwemsdgovhkE-mail energydataemsdgovhk
Set of Hong Kong Energy End-use Data can be downloadedfrom EMSD website
httpswwwemsdgovhkenenergy_efficiencyenergy_end_use_data_and_consumption_indicatorshong_kong_energy_end_use_datadataindexhtml
有關本刊物的查詢請聯絡
機電工程署
香港九龍灣啟成街3號7樓
能源效益事務處 httpswwwemsdgovhktcenergy_efficiencyenergy_end_use_data_and_consumption_indicatorshong_kong_energy_end_use_datadataindexhtml
香港能源最終用途數據收錄之數據可在機電工程署網站下載
電話(852) 2808 3465圖文傳真(852) 2890 6081
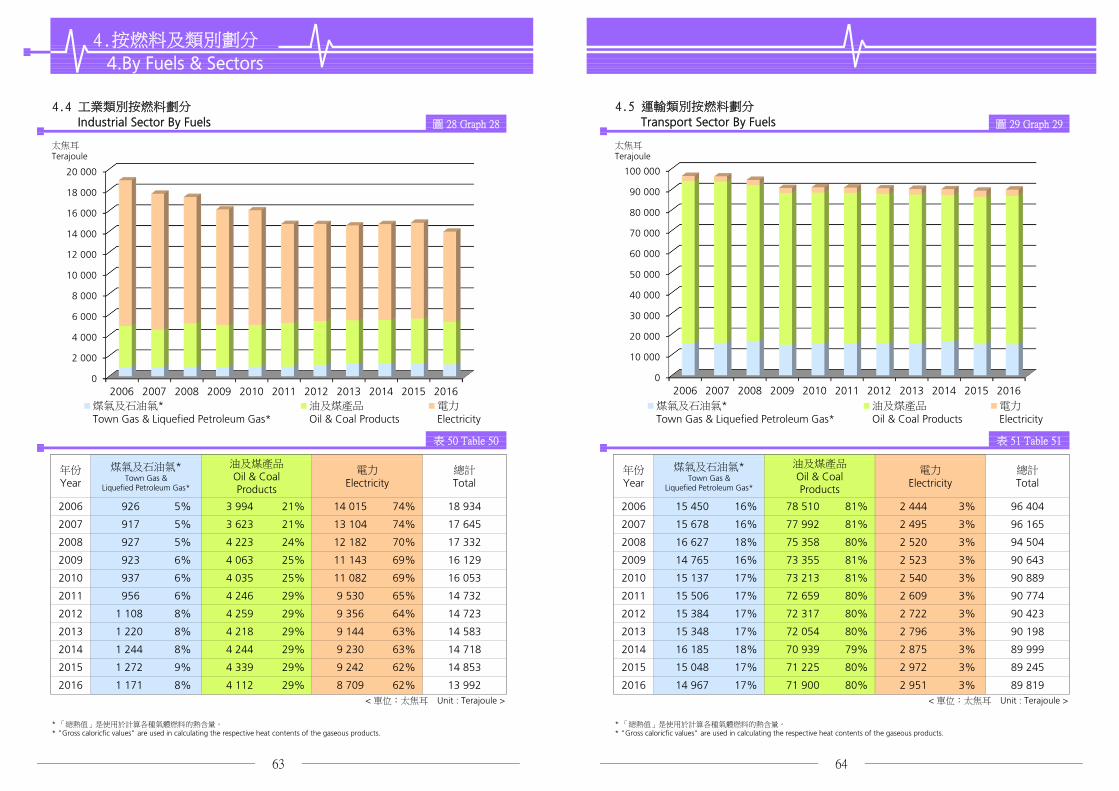
太焦耳Terajoule
太焦耳Terajoule
表 50 Table 50 表 51 Table 51
4按燃料及類別劃分
4By Fuels amp Sectors
45 運輸類別按燃料劃分
Transport Sector By Fuels44 工業類別按燃料劃分
Industrial Sector By Fuels 圖 28 Graph 28 圖 29 Graph 29
煤氣及石油氣Town Gas amp
Liquefied Petroleum Gas
油及煤產品Oil amp CoalProducts
電力Electricity
總計Total
2006 926 5 3 994 21 14 015
年份Year
煤氣及石油氣Town Gas amp
Liquefied Petroleum Gas
油及煤產品Oil amp CoalProducts
電力Electricity
總計Total
年份Year
78 510 81 2 444 3 96 404 10074 18 934 100 2006 15 450 16
3 96 165 10074 17 645 100 2007 15 678 16
2008 927 5 4 223 24 12 182
77 992 81 2 4952007 917 5 3 623 21 13 104
75 358 80 2 520 3 94 504 10070 17 332 100 2008 16 627 18
3 90 643 10069 16 129 100 2009 14 765 16
2010 937 6 4 035 25 11 082
73 355 81 2 5232009 923 6 4 063 25 11 143
73 213 81 2 540 3 90 889 10069 16 053 100 2010 15 137 17
3 90 774 10065 14 732 100 2011 15 506 17
2012 1 108 8 4 259 29 9 356
72 659 80 2 6092011 956 6 4 246 29 9 530
72 317 80 2 722 3 90 423 10064 14 723 100 2012 15 384 17
3 90 198 10063 14 583 100 2013 15 348 17
2014 1 244 8 4 244 29 9 230
72 054 80 2 7962013 1 220 8 4 218 29 9 144
70 939 79 2 875 3 89 999 10063 14 718 100 2014 16 185 18
3 89 245 10062 14 853 100 2015 15 048 17
2016 1 171 8 4 112 29 8 709
71 225 80 2 9722015 1 272 9 4 339 29 9 242
71 900 80 2 951 3 89 819 10062 13 992 100 2016 14 967 17lt 單位太焦耳 Unit Terajoule gt lt 單位太焦耳 Unit Terajoule gt
「總熱值」是使用於計算各種氣體燃料的熱含量 Gross caloricfic values are used in calculating the respective heat contents of the gaseous products
「總熱值」是使用於計算各種氣體燃料的熱含量 Gross caloricfic values are used in calculating the respective heat contents of the gaseous products
63 64
0
2 000
4 000
6 000
8 000
10 000
12 000
14 000
16 000
18 000
20 000
2006 2007 2008 2009 2010 2011 2012 2013 2014 2015 2016煤氣及石油氣Town Gas amp Liquefied Petroleum Gas
油及煤產品
Oil amp Coal Products電力
Electricity
0
10 000
20 000
30 000
40 000
50 000
60 000
70 000
80 000
90 000
100 000
2006 2007 2008 2009 2010 2011 2012 2013 2014 2015 2016煤氣及石油氣Town Gas amp Liquefied Petroleum Gas
油及煤產品
Oil amp Coal Products電力
Electricity
47 890 281 204
2007
20 301 13 797 16 267 426
2 506 10 158 49 197 282 440 14 102
46 5022006
19 832
16 465
17 071
5按最終用途及燃料劃分
5By End-uses amp Fuels
51 所有能源使用按最終用途劃分
All Energy Consumption By End-uses
2 454 10 413
15 142 17 059 480
2 529 9 228
7 918 31 836 12 776 32 551 21 608
51 487 278 799 13 131
17 118 463
17 449 465
2008
8 672 52 019 281 729
19 150
2 527 9 680 50 117 281 438
2009
18 971
8 496
9 121
9 244 19 199
2011
18 842 13 373 18 247 436
2 609 8 245 56 161 282 890 13 593 18 879 31 989 14 187 28 010
2012
2013
19 128
2 542
2 722 8 077 58 650 286 048 13 469 19 561 423
424
2010
18 911
19 144
9 213
8 536
8 319
8 199
19 563
19 314
19 662
19 655 44 243 14 181
14 197
13 708
2 796 7 739 58 100 284 391 13 319 21 158 406
2 875 7 705 58 273 289 338
25 534
2015
18 659 14 133 21 085 426
2 972 7 792 58 218 287 986 13 039 21 764 448
2014 25 009
24 782
8 607
8 717
19 609
19 774
48 746
48 466 18 341
2 951 7 474 59 374 289 219
51 所有能源使用按最終用途劃分 All Energy Consumption By End-uses 圖 30 Graph 30
18 918 12 288 22 881 4632016lt 單位太焦耳 Unit Terajoule gt
14 227 24 721 8 562 17 798 47 938 31 785 19 839
年份 Year 2016 年份 Year 2006
65 66
31 989
31 837
31 402
17 734
17 173
17 413
17 117
17 352
17 927
18 177
18 565
14 111 26 941
45 298
43 392
44 117
45 511
44 914
45 861
20 372
18 965
32 885
34 023
33 302
33 379
13 172
13 788
13 824
13 936
31 771
30 438
28 501
28 585
31 772
表 52 Table 52
年份Year
空氣調節Air
Conditioning
工業生產設備5
IndustrialProcessEquipment5
照明Lighting
冷凍Refrigeration
巴士Bus
的士Taxi
汽車Car
電單車Motorcycle
鐵路Rail
船隻Marine
其他1
Others1總計Total
貨車GoodsVehicle
煮食Cooking
熱水Hot Water
空氣調節
AirConditioning
17
煮食
Cooking11
工業生產設備
Industrial ProcessEquipment
6照明
Lighting7
冷凍
Refrigeration3
熱水
Hot Water 5
貨車
GoodsVehicle
9
巴士
Bus 6
的士
Taxi4
汽車及電單車
Car amp Motorcycle8
鐵路
Rail1
船隻
Marine 3
其他
Others20
空氣調節
AirConditioning
17
煮食
Cooking11
工業生產設備
Industrial ProcessEquipment
6照明
Lighting8
冷凍
Refrigeration3
熱水
Hot Water 4貨車
GoodsVehicle12
巴士
Bus 7
的士
Taxi5
汽車及電單車
Car amp Motorcycle6
鐵路
Rail1
船隻
Marine 4
其他
Others17
2006 46 502 21 608 7 918
5按最終用途及燃料劃分
5By End-uses amp Fuels
52 電力使用按最終用途劃分
Electricity Consumption By End-uses 表 53 Table 53
4 191 11 105 2 444 33 317 145 204
年份Year
空氣調節Air Conditioning
照明Lighting
冷凍Refrigeration
熱水Hot Water
辦公室設備Office Equipment
鐵路Rail
工業生產設備5
IndustrialProcessEquipment5
其他1
Others1總計Total
煮食Cooking
2007 45 298 20 372 8 496
5 373 11 246 2 520 35 477 147 345
4 809 11 171 2 495 34 776 147 072
2010 45 511 19 563 9 213
2009 44 117 19 199 9 244
2008 43 392 18 965 9 121
11 0612012 45 861 19 662 8 319
2011 44 914 19 314 8 536 9 201
9 131
10 738
4 715 13 200 2 722 40 408 155 079
4 945 12 615 2 609 38 732 151 606
11 412
11 3312014 48 746 19 609 8 607
2013 44 243 19 655 8 199 9 280
9 415 4 854 13 344 2 875 39 367 158 147
4 904 13 407 2 796 39 466 153 362
2016 47 938 19 839 8 562
2015 48 466 19 774 8 717 11 344 9 553
13 513 2 951 40 363 158 662 11 528 9 044
4 624 13 212 2 972 39 615 158 275
35 815
67 68
150 859
36 644 149 366
9 048
9 722
10 320
9 926
lt 單位太焦耳 Unit Terajoule gt
52 電力使用按最終用途劃分 Electricity Consumption By End-uses 圖 31 Graph 31
年份 Year 2016 年份 Year 2006
4 923
10 016
9 073
9 934
10 929
10 959
11 430 5 015 11 758 2 540
5 274 11 480 2 523
空氣調節Air
Conditioning 30
照明Lighting
13
冷凍Refrigeration
5
工業生產設備Industrial Process
Equipment6
煮食Cooking
7
熱水Hot Water
3辦公室設備
Office Equipment9
鐵路Rail2
其他Others25
空氣調節Air
Conditioning 32
照明Lighting
15
冷凍Refrigeration
5
工業生產設備Industrial Process
Equipment6
煮食Cooking
6
熱水Hot Water
3辦公室設備
Office Equipment8
鐵路Rail2
其他Others23
年份Year
貨車Goods Vehicle
巴士Bus
的士Taxi
5按最終用途及燃料劃分
5By End-uses amp Fuels
53 油及煤產品使用按最終用途劃分
Oil amp Coal Products Consumption By End-uses 表 54 Table 54
汽車Car
電單車Motorcycle
工業生產設備5
Industrial ProcessEquipment5
船隻Marine
其他1
Others1總計Total
87 518
2007 31 770 18 254 2 17 117 463 6 448 10 158 2 434 86 647
2006 32 551 18 647 2 16 266 426 6 508 10 413 2 705
84 361
2009 28 501 17 514 2 17 448 465 6 341 9 228 2 695 82 194
2008 30 438 17 485 2 17 059 480 6 503 9 680 2 713
81 786
2011 28 010 16 997 1 18 879 424 6 926 8 245 2 234 81 716
2010 28 585 17 077 1 18 247 436 6 423 8 672 2 346
81 352
2013 25 534 17 114 1 21 158 406 7 386 7 739 1 969 81 306
2012 26 941 17 212 1 19 560 423 7 074 8 077 2 064
80 347
2015 24 782 16 331 1 21 764 448
7 553 7 474 1 854 81 184
2014 25 009 16 607 1 21 085 426 7 458 7 705 2 056
lt 單位太焦耳 Unit Terajoule gt
53 油及煤產品使用按最終用途劃分
Oil amp Coal Products Consumption By End-uses 圖 32 Graph 32
7 688 7 792 1 953 80 757
2016 24 721 16 239 lt1 22 881 463
年份 Year 2016 年份 Year 2006
69 70
貨車GoodsVehicle31
巴士及的士Bus amp Taxi
20
汽車及電單車Car amp Motorcycle
29
工業生產設備Industrial Process
Equipment9
船隻Marine
9其他
Others2
貨車GoodsVehicle37
巴士及的士Bus amp Taxi
21
汽車及電單車Car amp Motorcycle
19
工業生產設備Industrial Process
Equipment8
船隻Marine
12其他
Others3
年份Year
煮食Cooking
熱水Hot Water
運輸Transport
其他1
Others1總計Total
5按最終用途及燃料劃分
5By End-uses amp Fuels
54 煤氣及石油氣使用按最終用途劃分
Town Gas amp Liquefied Petroleum Gas Consumption By End-uses 表 55 Table 55
2007 22 021 8 363 15 678 2 659 48 721
2006 21 741 8 585 15 450 2 706 48 482
2009 21 390 8 550 14 765 2 534 47 239
2008 22 220 8 415 16 627 2 472 49 732
2011 20 749 9 242 15 506 4 072 49 568
2010 21 244 8 921 15 137 3 782 49 084
2013 20 222 9 277 15 348 4 876 49 723
2012 20 330 9 396 15 384 4 506 49 616
2015 19 767 9 085 15 048 5 054 48 954
2014 20 194 9 342 16 185 5 123 50 844
lt 單位太焦耳 Unit Terajoule gt
54 煤氣及石油氣使用按最終用途劃分 Town Gas amp Liquefied Petroleum Gas Consumption By End-uses 圖 33 Graph 33
年份 Year 2016 年份 Year 2006
2016 19 990 9 304 14 967 5 113 49 374
「總熱值」是使用於計算各種氣體燃料的熱含量 Gross caloricfic values are used in calculating the respective heat contents of the gaseous products
71 72
煮食Cooking
41
熱水Hot Water
19
運輸Transport
30
其他Others10
煮食Cooking
45
熱水Hot Water
18運輸
Transport32
其他Others
5
6 根據已更新的可再生能源數據相關的2010年至2011年能源最終用途數據已在
2013年版中作出修訂[2013年版修訂]The energy end-use data from 2010 to 2011 were revised in the 2013 Edition basedon the latest update of the renewable energy data (Revised in 2013 Edition)
3 根據運輸能源消耗調查所得的數據有關2008年至2012年的能源最終用途數據已
在2015年版中作出修訂[2015年版修訂]The energy end-use data from year 2008 to 2012 were revised in the 2015 Editionbased on the findings of energy consumption survey on the Transport Sector(Revised in 2015 Edition)
4 自2014年版起新的「住宿」「醫療」和「教育」組別已由「其他商業」組別
分拆出來「其他商業」組別因而相應地縮小[2014年版修訂]The Accommodation Human Health and Education Segments weresegregated from the Other Commercial Segment as new segments in the 2014Edition Hence the size of the Other Commercial Segment is accordingly reduced(Revised in 2014 Edition)
5 自2014年版起燃料的熱含量均以「總熱值」計算因而自2002年後的能源數據
均已採用「總熱值」作出計算[2014年版修訂]Since the 2014 Edition Gross Calorific Values are used for calculating the heatcontents of fuels Gross Calorific Values are hence used in computing energy datafrom 2002 onwards (Revised in 2014 Edition)
1 由於資料所限能源數據不能再分拆成其他最終用途數據「其他」的最終用途包
括沒有被列在表上的最終用途
2 自2013年後「空氣調節」「冷凍」「工業生產設備」及「熱水」的能源最終
用途數據已採用「氣溫因素」作出修訂[2017年版修訂]The energy end-use data of Air Conditioning Refrigeration IndustrialProcessEquipment and Hot Water are revised by Temperature Factor fromyear 2013 onwards (Revised in 2017 Edition)
Due to data limitations energy data could not further be broken down into other end-uses The ldquoOthersrdquo end-use includes the end-uses not elsewhere listed in the table
2 「房委會資助出售單位」組別前稱為「居屋計劃」組別
1 根據零售組別能源消耗調查所得的數據有關2011年至2014年的能源最終用途數
據已在2017年版中作出修訂[2017年版修訂]The energy end-use data from year 2011 to 2014 were revised in the 2017 Editionbased on the findings of energy consumption survey on the Retail Segment(Revised in 2017 Edition)
6Notes 7Chronology of Major Revisions7主要修訂年表6註釋
3 「其他房屋」組別包括別墅平房及類似屋宇
The ldquoOther Housingrdquo Segment includes villas bungalows and the like
4 「熱水及冷凍」的最終用途包括鍋爐器材及其他生產加熱和冷凍的設備
The ldquo Non-manufacturing rdquo Segment includes construction and other miscellaneousnon-manufacturing industrial activities
The ldquoHousing Authority Subsidized Sale Flatsrdquo Segment was previously called ldquoHomeOwnershiprdquo Segment
The ldquo Hot Water amp Refrigeration rdquo end-use includes boiling equipments and otherprocess heating and cooling facilities
「工業生產設備」的最終用途包括鍋爐設備及其他生產加熱和冷凍設備的使用
The ldquoOther Industrialrdquo Segment includes electronics paper printing plastic and othermiscellaneous industrial activities
73
The ldquo GDP in chained dollars rdquo were revised based on latest data published by theCensus and Statisics Department
8 ldquo本地生產總值環比物量計算rdquo己根據政府統計處最新數據作出修訂
74
7 「其他工業」組別包括電子紙張印刷塑膠及其他雜項工業活動
The ldquo Industrial ProcessEquipment rdquo end-use includes boiler plants and other processheating and cooling facilities
6 「非製造業」組別包括建造及其他非製造業之雜項工業活動
5
7主要修訂年表
13 自2010年起「電力」包括燃煤天然氣風能及太陽能所產生的電能[2012年版修訂]ldquoElectricityrdquoincludes the electricity generated from coal natural gas wind and solarpower since 2010 (Revised in 2012 Edition)
14 根據工業能源消耗調查所得的數據有關2000年至2010年的能源最終用途數據已
在2012年版中作出修訂[2012年版修訂]The energy end-use data from year 2000 to 2010 were revised in the 2012 Editionbased on the findings of energy consumption survey on the Industrial Sector(Revised in 2012 Edition)
自2013年版起「煮食」之能源最終用途除已包括煮食爐及飯煲外再加上在廚房
普遍用作製造及準備食物的器具例如煮食用水加熱設備電焗爐及微波爐等
自2001年後的「煮食」之能源最終用途數據均作出修訂[2013年版修訂]The ldquo Cooking rdquo energy end-use was revised in the 2013 Edition to include foodmaking and preparation appliances normally found in kitchens in addition to stovesand rice cookers Examples of the appliances are hot water for cooking purposeselectric ovens and microwave ovens etc The ldquoCookingrdquo energy end-use data since2001 were hence updated (Revised in 2013 Edition)
自2011年「商業」及「工業」類別的分類已經根據香港標準行業分類20版作出
修訂這修訂包括將個人服務活動(例如夜總會卡拉OK電腦及通訊設施維
修家居用品維修車輛維修服務藝術表演或創作活動及出版服務)由以往的
「食肆」「其他商業」組別或「工業」類別重置到現時的「零售」組別其同
時涵蓋零售及個人服務活動[2013年版修訂]The ldquoCommercialrdquo and ldquoIndustrialldquo Sectors were re-categorized in 2011 to alignwith the Hong Kong Standard Industrial Classification (HSIC) Version 20Examples of such changes are the relocations of personal service activities (such asnight clubs karaokes computer and communication repair household goodsrepair motor vehicle repair services art performance or creation activities andpublishing services etc) from the previous ldquo Restaurant ldquo Other CommercialSegments or the rdquoIndustrialrdquo Sector to the present ldquoRetailrdquo Segment which nowembraces both retail and personal service activities (Revised in 2013 Edition)
12 自2010年的能源最終用途數據包括可再生能源數據[2012年版修訂]The energy end-use data from 2010 includes renewable energy data(Revised in 2012 Edition)
11
75 76
7Chronology of Major Revisions
8 自2013年版起「空氣調節」之能源最終用途除已包括冷氣設備及暖氣機外再加
上風扇空氣清新或淨化器及抽濕機 自2001年後的「空氣調節」之能源最終用
途數據均作出修訂[2013年版修訂]The ldquoAir Conditioningrdquo energy end-use was revised in the 2013 Edition to includefans air cleanerpurifiers and dehumidifiers in addition to air conditioning unitsand heaters The ldquoAir Conditioningrdquo energy end-use data since 2001 were henceupdated (Revised in 2013 Edition)
9 自2013年版起「辦公室設備」之能源最終用途除已包括電腦及影印機外再加上
視聽器材碎紙機傳真及收銀機自2001年後的「辦公室設備」之能源最終用
途數據均作出修訂[2013年版修訂]The ldquoOffice Equipmentrdquo energy end-use was revised in the 2013 Edition to includeaudio visual equipments shredders fax and cashier machines etc in addition tocomputers and photocopiers The ldquoOffice Equipmentrdquo energy end-use data since2001 were hence updated (Revised in 2013 Edition)
10 根據住宅能源消耗調查所得的數據有關2009年至2011年的能源最終用途數據已
在2013年版中作出修訂[2013年版修訂]The energy end-use data from year 2009 to 2011 were revised in the 2013 Editionbased on the findings of energy consumption survey on the Residential Sector(Revised in 2013 Edition)
15 根據政府統計處公佈的人口及家庭住戶統計修訂數字有關2007至2010年的能源
最終用途數據己在2012年版中作出相應的修訂[2012年版修訂]The energy end-use data from years 2007 to 2010 were revised in the 2012 Editionbased on the revised population and domestic household data published by theCensus and Statistics Department (Revised in 2012 Edition)
7
17 根據政府統計處公佈的家庭住戶統計修訂數字有關2001至2006年的能源最終用
途數據己在2009年版中作出修訂[2009年版修訂]The energy end-use data from years 2001 to 2006 were revised in the 2009 Editionbased on the revised domestic household data published by the Census and StatisticsDepartment (Revised in 2009 Edition)
18 自2006年起「鐵路」之能源最終用途再不包括鐵路車站等建築物使用的電量
[2008年版修訂]The ldquoRailrdquo energy end-use do not include electricity consumption at railway stationsfrom 2006 onwards (Revised in 2008 Edition)
16 根據商業及運輸能源消耗調查所得的數據有關2003年至2007年的能源最終用途
數據已在2010年版中作出修訂[2010年版修訂]The energy end-use data from year 2003 to 2007 were revised in the 2010 Editionbased on the findings of energy consumption survey on the Commercial andTransport Sectors (Revised in 2010 Edition)
7Chronology of Major Revisions 8Units of Measurement7主要修訂年表 8計量單位
1 太焦耳 = 1012 焦耳 1 terajoule (TJ) = 1012 joules
1 千兆焦耳 = 109 焦耳 1 gigajoule (GJ) = 109 joules
1 百萬焦耳 = 106 焦耳 1 megajoule (MJ) = 106 joules
77 78
1 千兆瓦小時 = 36 x 1012 焦耳 1 gigawatt hour (GWh) = 36 x 1012 joules
1 兆瓦小時 = 36 x 109 焦耳 1 megawatt hour (MWh) = 36 x 109 joules
1 千瓦小時 = 36 x 106 焦耳 1 kilowatt hour (kWh) = 36 x 106 joules
網址 httpwwwemsdgovhk電郵 energydataemsdgovhk
79 80
Enquiries about this publication can be directed to
The Energy Efficiency OfficeElectrical amp Mechanical Services Department
7F 3 Kai Shing Street Kowloon Bay Hong Kong
Tel No (852) 2808 3465Fax No (852) 2890 6081
Homepage httpwwwemsdgovhkE-mail energydataemsdgovhk
Set of Hong Kong Energy End-use Data can be downloadedfrom EMSD website
httpswwwemsdgovhkenenergy_efficiencyenergy_end_use_data_and_consumption_indicatorshong_kong_energy_end_use_datadataindexhtml
有關本刊物的查詢請聯絡
機電工程署
香港九龍灣啟成街3號7樓
能源效益事務處 httpswwwemsdgovhktcenergy_efficiencyenergy_end_use_data_and_consumption_indicatorshong_kong_energy_end_use_datadataindexhtml
香港能源最終用途數據收錄之數據可在機電工程署網站下載
電話(852) 2808 3465圖文傳真(852) 2890 6081
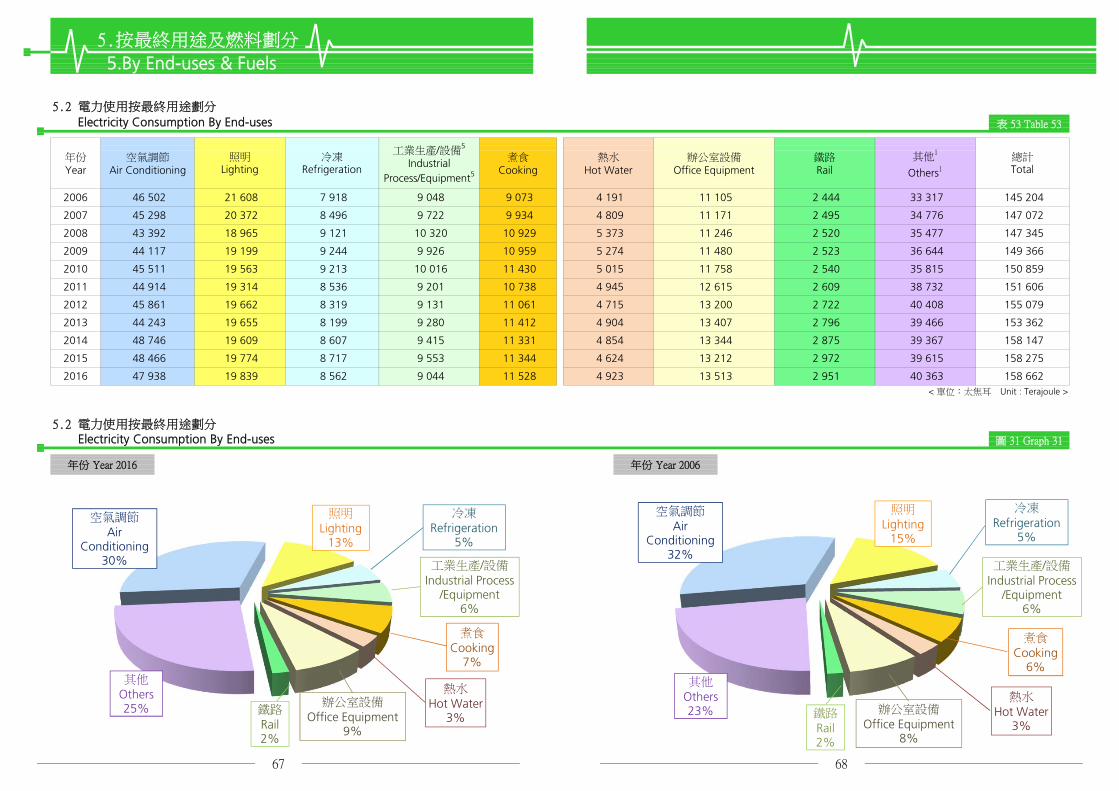

年份Year
煮食Cooking
熱水Hot Water
運輸Transport
其他1
Others1總計Total
5按最終用途及燃料劃分
5By End-uses amp Fuels
54 煤氣及石油氣使用按最終用途劃分
Town Gas amp Liquefied Petroleum Gas Consumption By End-uses 表 55 Table 55
2007 22 021 8 363 15 678 2 659 48 721
2006 21 741 8 585 15 450 2 706 48 482
2009 21 390 8 550 14 765 2 534 47 239
2008 22 220 8 415 16 627 2 472 49 732
2011 20 749 9 242 15 506 4 072 49 568
2010 21 244 8 921 15 137 3 782 49 084
2013 20 222 9 277 15 348 4 876 49 723
2012 20 330 9 396 15 384 4 506 49 616
2015 19 767 9 085 15 048 5 054 48 954
2014 20 194 9 342 16 185 5 123 50 844
lt 單位太焦耳 Unit Terajoule gt
54 煤氣及石油氣使用按最終用途劃分 Town Gas amp Liquefied Petroleum Gas Consumption By End-uses 圖 33 Graph 33
年份 Year 2016 年份 Year 2006
2016 19 990 9 304 14 967 5 113 49 374
「總熱值」是使用於計算各種氣體燃料的熱含量 Gross caloricfic values are used in calculating the respective heat contents of the gaseous products
71 72
煮食Cooking
41
熱水Hot Water
19
運輸Transport
30
其他Others10
煮食Cooking
45
熱水Hot Water
18運輸
Transport32
其他Others
5
6 根據已更新的可再生能源數據相關的2010年至2011年能源最終用途數據已在
2013年版中作出修訂[2013年版修訂]The energy end-use data from 2010 to 2011 were revised in the 2013 Edition basedon the latest update of the renewable energy data (Revised in 2013 Edition)
3 根據運輸能源消耗調查所得的數據有關2008年至2012年的能源最終用途數據已
在2015年版中作出修訂[2015年版修訂]The energy end-use data from year 2008 to 2012 were revised in the 2015 Editionbased on the findings of energy consumption survey on the Transport Sector(Revised in 2015 Edition)
4 自2014年版起新的「住宿」「醫療」和「教育」組別已由「其他商業」組別
分拆出來「其他商業」組別因而相應地縮小[2014年版修訂]The Accommodation Human Health and Education Segments weresegregated from the Other Commercial Segment as new segments in the 2014Edition Hence the size of the Other Commercial Segment is accordingly reduced(Revised in 2014 Edition)
5 自2014年版起燃料的熱含量均以「總熱值」計算因而自2002年後的能源數據
均已採用「總熱值」作出計算[2014年版修訂]Since the 2014 Edition Gross Calorific Values are used for calculating the heatcontents of fuels Gross Calorific Values are hence used in computing energy datafrom 2002 onwards (Revised in 2014 Edition)
1 由於資料所限能源數據不能再分拆成其他最終用途數據「其他」的最終用途包
括沒有被列在表上的最終用途
2 自2013年後「空氣調節」「冷凍」「工業生產設備」及「熱水」的能源最終
用途數據已採用「氣溫因素」作出修訂[2017年版修訂]The energy end-use data of Air Conditioning Refrigeration IndustrialProcessEquipment and Hot Water are revised by Temperature Factor fromyear 2013 onwards (Revised in 2017 Edition)
Due to data limitations energy data could not further be broken down into other end-uses The ldquoOthersrdquo end-use includes the end-uses not elsewhere listed in the table
2 「房委會資助出售單位」組別前稱為「居屋計劃」組別
1 根據零售組別能源消耗調查所得的數據有關2011年至2014年的能源最終用途數
據已在2017年版中作出修訂[2017年版修訂]The energy end-use data from year 2011 to 2014 were revised in the 2017 Editionbased on the findings of energy consumption survey on the Retail Segment(Revised in 2017 Edition)
6Notes 7Chronology of Major Revisions7主要修訂年表6註釋
3 「其他房屋」組別包括別墅平房及類似屋宇
The ldquoOther Housingrdquo Segment includes villas bungalows and the like
4 「熱水及冷凍」的最終用途包括鍋爐器材及其他生產加熱和冷凍的設備
The ldquo Non-manufacturing rdquo Segment includes construction and other miscellaneousnon-manufacturing industrial activities
The ldquoHousing Authority Subsidized Sale Flatsrdquo Segment was previously called ldquoHomeOwnershiprdquo Segment
The ldquo Hot Water amp Refrigeration rdquo end-use includes boiling equipments and otherprocess heating and cooling facilities
「工業生產設備」的最終用途包括鍋爐設備及其他生產加熱和冷凍設備的使用
The ldquoOther Industrialrdquo Segment includes electronics paper printing plastic and othermiscellaneous industrial activities
73
The ldquo GDP in chained dollars rdquo were revised based on latest data published by theCensus and Statisics Department
8 ldquo本地生產總值環比物量計算rdquo己根據政府統計處最新數據作出修訂
74
7 「其他工業」組別包括電子紙張印刷塑膠及其他雜項工業活動
The ldquo Industrial ProcessEquipment rdquo end-use includes boiler plants and other processheating and cooling facilities
6 「非製造業」組別包括建造及其他非製造業之雜項工業活動
5
7主要修訂年表
13 自2010年起「電力」包括燃煤天然氣風能及太陽能所產生的電能[2012年版修訂]ldquoElectricityrdquoincludes the electricity generated from coal natural gas wind and solarpower since 2010 (Revised in 2012 Edition)
14 根據工業能源消耗調查所得的數據有關2000年至2010年的能源最終用途數據已
在2012年版中作出修訂[2012年版修訂]The energy end-use data from year 2000 to 2010 were revised in the 2012 Editionbased on the findings of energy consumption survey on the Industrial Sector(Revised in 2012 Edition)
自2013年版起「煮食」之能源最終用途除已包括煮食爐及飯煲外再加上在廚房
普遍用作製造及準備食物的器具例如煮食用水加熱設備電焗爐及微波爐等
自2001年後的「煮食」之能源最終用途數據均作出修訂[2013年版修訂]The ldquo Cooking rdquo energy end-use was revised in the 2013 Edition to include foodmaking and preparation appliances normally found in kitchens in addition to stovesand rice cookers Examples of the appliances are hot water for cooking purposeselectric ovens and microwave ovens etc The ldquoCookingrdquo energy end-use data since2001 were hence updated (Revised in 2013 Edition)
自2011年「商業」及「工業」類別的分類已經根據香港標準行業分類20版作出
修訂這修訂包括將個人服務活動(例如夜總會卡拉OK電腦及通訊設施維
修家居用品維修車輛維修服務藝術表演或創作活動及出版服務)由以往的
「食肆」「其他商業」組別或「工業」類別重置到現時的「零售」組別其同
時涵蓋零售及個人服務活動[2013年版修訂]The ldquoCommercialrdquo and ldquoIndustrialldquo Sectors were re-categorized in 2011 to alignwith the Hong Kong Standard Industrial Classification (HSIC) Version 20Examples of such changes are the relocations of personal service activities (such asnight clubs karaokes computer and communication repair household goodsrepair motor vehicle repair services art performance or creation activities andpublishing services etc) from the previous ldquo Restaurant ldquo Other CommercialSegments or the rdquoIndustrialrdquo Sector to the present ldquoRetailrdquo Segment which nowembraces both retail and personal service activities (Revised in 2013 Edition)
12 自2010年的能源最終用途數據包括可再生能源數據[2012年版修訂]The energy end-use data from 2010 includes renewable energy data(Revised in 2012 Edition)
11
75 76
7Chronology of Major Revisions
8 自2013年版起「空氣調節」之能源最終用途除已包括冷氣設備及暖氣機外再加
上風扇空氣清新或淨化器及抽濕機 自2001年後的「空氣調節」之能源最終用
途數據均作出修訂[2013年版修訂]The ldquoAir Conditioningrdquo energy end-use was revised in the 2013 Edition to includefans air cleanerpurifiers and dehumidifiers in addition to air conditioning unitsand heaters The ldquoAir Conditioningrdquo energy end-use data since 2001 were henceupdated (Revised in 2013 Edition)
9 自2013年版起「辦公室設備」之能源最終用途除已包括電腦及影印機外再加上
視聽器材碎紙機傳真及收銀機自2001年後的「辦公室設備」之能源最終用
途數據均作出修訂[2013年版修訂]The ldquoOffice Equipmentrdquo energy end-use was revised in the 2013 Edition to includeaudio visual equipments shredders fax and cashier machines etc in addition tocomputers and photocopiers The ldquoOffice Equipmentrdquo energy end-use data since2001 were hence updated (Revised in 2013 Edition)
10 根據住宅能源消耗調查所得的數據有關2009年至2011年的能源最終用途數據已
在2013年版中作出修訂[2013年版修訂]The energy end-use data from year 2009 to 2011 were revised in the 2013 Editionbased on the findings of energy consumption survey on the Residential Sector(Revised in 2013 Edition)
15 根據政府統計處公佈的人口及家庭住戶統計修訂數字有關2007至2010年的能源
最終用途數據己在2012年版中作出相應的修訂[2012年版修訂]The energy end-use data from years 2007 to 2010 were revised in the 2012 Editionbased on the revised population and domestic household data published by theCensus and Statistics Department (Revised in 2012 Edition)
7
17 根據政府統計處公佈的家庭住戶統計修訂數字有關2001至2006年的能源最終用
途數據己在2009年版中作出修訂[2009年版修訂]The energy end-use data from years 2001 to 2006 were revised in the 2009 Editionbased on the revised domestic household data published by the Census and StatisticsDepartment (Revised in 2009 Edition)
18 自2006年起「鐵路」之能源最終用途再不包括鐵路車站等建築物使用的電量
[2008年版修訂]The ldquoRailrdquo energy end-use do not include electricity consumption at railway stationsfrom 2006 onwards (Revised in 2008 Edition)
16 根據商業及運輸能源消耗調查所得的數據有關2003年至2007年的能源最終用途
數據已在2010年版中作出修訂[2010年版修訂]The energy end-use data from year 2003 to 2007 were revised in the 2010 Editionbased on the findings of energy consumption survey on the Commercial andTransport Sectors (Revised in 2010 Edition)
7Chronology of Major Revisions 8Units of Measurement7主要修訂年表 8計量單位
1 太焦耳 = 1012 焦耳 1 terajoule (TJ) = 1012 joules
1 千兆焦耳 = 109 焦耳 1 gigajoule (GJ) = 109 joules
1 百萬焦耳 = 106 焦耳 1 megajoule (MJ) = 106 joules
77 78
1 千兆瓦小時 = 36 x 1012 焦耳 1 gigawatt hour (GWh) = 36 x 1012 joules
1 兆瓦小時 = 36 x 109 焦耳 1 megawatt hour (MWh) = 36 x 109 joules
1 千瓦小時 = 36 x 106 焦耳 1 kilowatt hour (kWh) = 36 x 106 joules
網址 httpwwwemsdgovhk電郵 energydataemsdgovhk
79 80
Enquiries about this publication can be directed to
The Energy Efficiency OfficeElectrical amp Mechanical Services Department
7F 3 Kai Shing Street Kowloon Bay Hong Kong
Tel No (852) 2808 3465Fax No (852) 2890 6081
Homepage httpwwwemsdgovhkE-mail energydataemsdgovhk
Set of Hong Kong Energy End-use Data can be downloadedfrom EMSD website
httpswwwemsdgovhkenenergy_efficiencyenergy_end_use_data_and_consumption_indicatorshong_kong_energy_end_use_datadataindexhtml
有關本刊物的查詢請聯絡
機電工程署
香港九龍灣啟成街3號7樓
能源效益事務處 httpswwwemsdgovhktcenergy_efficiencyenergy_end_use_data_and_consumption_indicatorshong_kong_energy_end_use_datadataindexhtml
香港能源最終用途數據收錄之數據可在機電工程署網站下載
電話(852) 2808 3465圖文傳真(852) 2890 6081
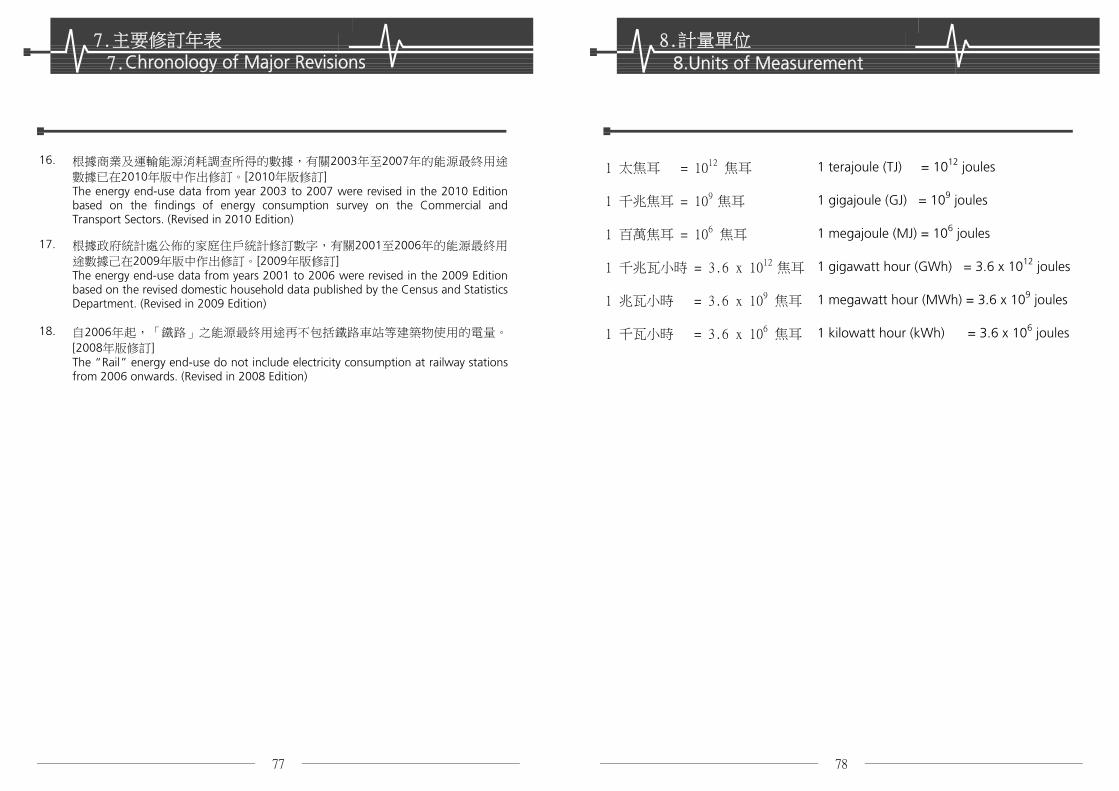